Introduction
Many biological responses are regulated at the
transcriptional level by interaction of transcription factors with
transcriptional coactivators. For example, the peroxisome
proliferator-activated receptor γ (PPARγ) coactivator-1α (PGC-1α)
is a strong coactivator for PPARγ, which is expressed in human
heart, kidney, liver, and skeletal muscle, with only very low
levels in white adipose tissue and small and large intestine
(1). The PGC-1 family is integral
to the coordinated activation of transcription complexes (2,3) that
regulate global responses such as mitochondrial biogenesis
(1,4) and tissue-specific responses such as
adaptive thermogenesis (1), fatty
acid oxidation (5,6), hepatic gluconeogenesis (7,8),
fiber type switching in skeletal muscle (9), reactive oxygen species (ROS)
metabolism (10), and clock gene
expression (11). It also
interacts with a number of other nuclear receptors such as
glucocorticoid receptor (12),
nuclear respiratory factor-1 (4),
hepatocyte nuclear factor 4α (13), estrogen receptor α (8), PPARα (5), retinoid X receptor (14), and estrogen-related receptor α
(15). PGC-1α contains a powerful
autonomous transactivation domain at its N-terminus (aa 1–200) that
binds two other coactivators with acetyltransferase activity,
steroid receptor coactivator-1 (SRC-1) and CBP/p300 (11). PGC-1α lacks acetyltransferase
activity, thus requiring interaction with coactivators such as
SRC-1 for regulation of target genes.
Recent studies have focused on the role of several
coactivators in cancer. In particular, a role of PGC-1α in cancer
has been controversial. Some studies have shown that the expression
level of PGC-1α decreases in certain cancer tissues such as breast
(16,17) and colon cancers (18), but another study demonstrated that
PGC-1α overexpression induces apoptosis in ovarian cancer cells
(19). In contrast, PGC-1α is a
suppressor of ROS (10),
protecting cells from apoptosis in neuroblastoma cells (20) and promoting cell growth in prostate
cancer cells (21), which suggests
that PGC-1α may be involved in cancer pathogenesis. Thus, to date,
the effect of PGC-1α in cell proliferation and tumorigenesis has
not been completely clarified. In this study, therefore, the role
of PGC-1α in cell proliferation and tumorigenesis and the possible
molecular mechanisms for its effect were evaluated using a stable
human embryonic kidney (HEK)293 cell line expressing PGC-1α and the
GeneFishing DEG (differentially expressed genes) screening system
(Seegene, Seoul, Korea).
Materials and methods
Cell preparations
The HEK293, human colon cancer HT-29 and SNU-C4, and
mouse colon cancer CT-26 cells were obtained from the Korean Cell
Line Bank (Seoul National University, Seoul, Korea) and cultured in
Dulbecco’s modified Eagle’s medium (DMEM) supplemented with 10%
fetal bovine serum (FBS), 100 U/ml penicillin, and 100 μg/ml
streptomycin (Gibco, Carlsbad, CA, USA). Cultures were maintained
in a humidified atmosphere of 95% air/5% CO2 at
37°C.
Materials
2′, 7′-dichlorofluorescein diacetate (DCFDA) and
carboxyfluorescein succinimidyl ester (CFSE) were obtained from
Molecular Probes (Carlsbad, CA, USA). The Annexin V-FITC apoptosis
detection kit was obtained from BD Biosciences (San Jose, CA, USA).
Anti-PGC-1α (sc-13067), anti-ACBP (sc-30190), anti-superoxide
dismutase (SOD)-2 (sc-30080), anti-specificity protein 1 (Sp1)
(sc-59), anti-rabbit IgG-FITC (sc-2012), anti-rabbit IgG-PE
(sc-3739), and anti-mouse IgG-FITC (sc-2010) antibodies were
purchased from Santa Cruz Biotechnology (Santa Cruz, CA, USA).
Anti-catalase antibody (ab1877) was purchased from Abcam
(Cambridge, UK). The anti-FLAG® (F7425), anti-β-actin
(A1978), anti-rabbit IgG (A0545), and anti-mouse IgG secondary
antibodies (A9044) were purchased from Sigma-Aldrich (St. Louis,
MO, USA). Unless stated otherwise, all other chemicals were
purchased from Sigma.
Transfection and establishment of stable
cell lines expressing the PGC-1α vector
HEK293 and CT-26 cells (1×10⁶) were
transfected with 4 μg of pcDNA3.1-FLAG-PGC-1α expression vector
from Spiegelman or empty vector (pcDNA 3.1) using Lipofectamine
2000 (Invitrogen, Carlsbad, CA, USA) following the manufacturer’s
recommended procedure. After transfection, stable cell lines were
established after G418 selection (800 μg/ml) for 14 days. Stable
cell lines were cultured in DMEM supplemented with 10% FBS, 800
μg/ml G418, 100 U/ml penicillin and 100 μg/ml streptomycin (Gibco).
Cultures were maintained in a humidified atmosphere of 95% air/5%
CO2 at 37°C.
Real-time RT-PCR analysis
Total RNA was extracted using RNAeasy mini kits
(Qiagen, Valencia, CA, USA). Reverse transcription was performed
using the RevertAid First Strand cDNA synthesis kit with a random
hexamer as the primer (Thermo Scientific, Chicago, IL, USA).
Real-time reverse transcriptase PCR (RT-PCR) was carried out on
total RNA from HEK293 and HEK293-PGC-1α #1 cells transfected with
PGC-1α and ACBP-specific or non-specific control small-interfering
(si) RNA after 48 h on an ABI PRISM 7500 Sequence Detection System
instrument (Applied Biosystems, Foster City, CA, USA). Each
real-time RT-PCR was done in triplicate according to the
manufacturer’s instructions. TaqMan™ Gene expression assays
[diazepam binding inhibitor (DBI)/ACBP (Hs01554584_m1)] were from
Applied Biosystems. Quantification was based on a comparative ΔCt
method using glyceraldehyde-3-phosphate dehydrogenase (GAPDH;
Hs03929097_g1) as endogenous control.
Western blot analysis
Cells were harvested, washed with phosphate-buffered
saline (PBS), and treated with lysis buffer containing 20 mmol/l
Tris (pH 8.0), 137 mmol/l NaCl, 10% glycerol, 1% Nonidet P-40, 10
mmol/l EDTA, 100 mmol/l NaF, 1 mmol/l phenylmethylsulfonyl fluoride
and 10 mg/ml leupeptin. The lysates were centrifuged at 13,000 rpm
for 15 min and the concentration of protein in each lysate
determined using Bio-Rad protein assay reagent (Bio-Rad, Richmond,
CA, USA) following the manufacturer’s suggested procedure. Then, 8,
10 or 12% SDS-PAGE was used to separate 30 μg protein samples.
Following electrophoresis, proteins were transferred to
nitrocellulose membranes (Amersham Life Science, Inc., Arlington
Heights, IL, USA). Blots were blocked overnight in 5% skim milk in
PBS at 4°C and subsequently probed with primary antibody overnight.
The blots were also probed with a monoclonal anti-β-actin antibody
(Sigma) to be quantified as a relative loading control. Detection
of specific proteins was carried out with enhanced
chemiluminescence detection reagents (Amersham Life Science, Inc.)
following the manufacturer’s instructions. Bands were quantified
using Image Studio Lite Ver 3.1. (LI-COR, Inc., Lincoln, NE,
USA)
Cell counting
HEK293, PGC-1α-HEK293, CT-26, and PGC-1α-CT-26 cells
were seeded at a density of 1×10⁵/well in a 6-well
plate. PGC-1α-HEK293 and SNU-C4 cells transfected with siRNAs for
PGC-1α, ACBP, Sp1, or non-specific control siRNA were seeded at a
density of 1×10⁵/well in a 6-well plate. After a 24-,
48- or 72-h culture, the cells were harvested by trypsinization
using trypsin/EDTA and stained with trypan blue. The vital cells
(those not stained with trypan blue) were counted under the
microscope (Nikon Eclipse TS100; Nikon, Tokyo, Japan). Three
independent experiments were carried out.
Cell proliferation assay
Cell proliferation was measured using the CFSE
labeling assay as previously described (22). CFSE, which is used to fluorescently
label live cells, is equally partitioned to daughter cells during
division and can be used to measure cell proliferation. Briefly,
cells were washed three times with PBS and incubated with 1 μM CFSE
dye (Molecular Probes) for 15 min. The cells were then washed
again, incubated with fresh medium containing 10% FBS, and seeded
in 6-well plates at a density of 1×10⁵ cells/well. Cells
were analyzed by flow cytometry (FACSCalibur; BD Biosciences) after
culture for 24, 48 or 72 h. Each condition was performed in
triplicate.
First-strand cDNA synthesis
Total RNA extracted from HEK293 cells and stable
HEK293 cells expressing PGC-1α was used for the synthesis of
first-strand cDNA by reverse transcriptase. Reverse transcription
was performed for 1.5 h at 42°C in a final reaction volume of 20 μl
containing 3 μg of the purified total RNA, 4 μl of 5X reaction
buffer (Promega, Madison, WI, USA), 5 μl of dNTPs (each 2 mM), 2 μl
of 10 μM dT-ACP1(5′-CTGTGAATGCTGCGACTACGATIIIIIT(18)-3′), 0.5 μl of RNasin RNase Inhibitor
(40 U/μl; Promega), and 1 μl of Moloney murine leukemia virus
reverse transcriptase (200 U/μl; Promega). First-strand cDNAs were
diluted by the addition of 80 μl of ultra-purified water for the
GeneFishing™ PCR and stored at −20°C until use.
Annealing control primer (ACP)-based
GeneFishing PCR
Differentially expressed genes were screened using
the ACP-based PCR method (23)
with the GeneFishing DEG kits (Seegene). Briefly, second-strand
cDNA synthesis was conducted at 50°C during one cycle of
first-stage PCR in a final reaction volume of 20 μl containing 3–5
μl (~50 ng) of diluted first-strand cDNA, 1 μl of dT-ACP2 (10 μM),
1 μl of 10 μM arbitrary ACP and 10 μl of 2X Master Mix (Seegene).
The PCR protocol for second-strand synthesis was one cycle at 94°C
for 1 min, followed by 50°C for 3 min and 72°C for 1 min. After
second-strand DNA synthesis was completed, the second-stage PCR
amplification protocol was 40 cycles of 94°C for 40 sec, followed
by 65°C for 40 sec and 72°C for 40 sec and a 5-min final extension
at 72°C. The amplified PCR products were separated on a 2% agarose
gel stained with ethidium bromide. The amplified cDNA fragments
with >2-fold differential band intensities were re-amplified and
extracted from the gel by using the GeneClean II kit (Qbiogene,
Solon, OH, USA), and directly sequenced with an ABI PRISM 310
Genetic Analyzer (Applied Biosystems).
Annexin V-PI staining assay
The extent of apoptosis was evaluated by Annexin
V-FITC and flow cytometry as previously described (24). The Annexin V assay was used, in
which Annexin was conjugated with FITC. Propidium iodide (PI) was
used as counterstain. Briefly, cells were treated with 0.5, 1 or 2
mM H2O2 for 24 h. After incubation, cells
were harvested, washed with PBS (pH 7.4), centrifuged, and stained
with Annexin V-FITC (BD Pharmingen, San Diego, CA, USA) and 2 μg/ml
PI in binding buffer (10 mM HEPES, pH 7.4/140 mM NaCl/2.5 mM
CaCl2) for 15 min at 37°C in the dark. The samples were
analyzed by flow cytometry using a FACScan flow cytometer. Data
analysis was performed using CellQuest software (Becton-Dickinson,
San Jose, CA, USA).
Soft-agar colony formation assay
(25)
HEK293 cells (2.0×10⁴) overexpressing
PGC-1α or empty vector were suspended in 1 ml of 0.3% agarose
(Sigma) and then added to 1- of a 6-well plate with a foundation
layer of 0.5% agarose in triplicate. Approximately 24 h later, the
cells received an additional 1 ml of growth medium before
incubation for a further 14 days. Colonies were stained with 0.01%
crystal violet and counted under the microscope (Nikon) in 20
fields of ×10 magnification. Light microscopy images were captured
under ×100 magnification.
Effect of PGC-1α on the tumor
formation
All animal procedures and care were approved by the
Institutional Animal Care and Usage Committee of Dong-A University.
To determine the effect of PGC-1α on tumor formation, viable HEK293
cells (2×10⁷ cells/100 μl) overexpressing PGC-1α or
empty vector were subcutaneously injected into the bilateral flanks
of 6- to 7-week-old female nu/nu immunodeficient BALB/c mice,
respectively (Orient Bio Inc., Seongnam, Korea). Tumor size was
measured daily with a caliper (calculated volume = shortest
diameter2 × longest diameter/2). The mice were followed
for tumor size and sacrificed on the 45th day. Tumors were
resected, weighed, and frozen or fixed in formalin and
paraffin-embedded for immunofluorescence staining.
Immunofluorescence staining
Cells were cultured on a Lab-Tek® Chamber
Slide™ (Nalgen Nunc Inc., Rochester, NY, USA) and then fixed with
3% formaldehyde and permeabilized using 0.01% Triton X-100. After
being blocked with 3% FBS for 30 min, cells were incubated in
primary antibody for 1 h followed by a fluorescence-labeled
secondary antibody (Sigma) for 30 min. Cells were then washed,
mounted using glycerol, and analyzed by confocal microscope (Zeiss
LSM 510 confocal microscope; Carl Zeiss Co., Ltd., Jena, Germany)
using a 40× C-Apochromat objective. Negative control staining was
performed with secondary antibodies alone.
Assessment of ROS production
ROS production was monitored by flow cytometry using
carboxy-H2DCFDA (Molecular Probes). PGC-1α-HEK293 and
SNU-C4 cells transfected with siRNAs for PGC-1α, ACBP, or Sp1, or
with non-specific control siRNA were washed twice with PBS to
remove the extracellular compounds. H2DCFDA (100 μmol/l)
was added for an additional hour. Green fluorescence was excited
using an argon laser and detected using a 525-nm band-pass filter
by flow cytometric analysis.
siRNA transfection
The siRNA sequence used for the targeted silencing
of PGC-1α, ACBP, or Sp1 was designed by Qiagen (GS10891),
Dhamacon(L-006488-00-0005, ThermoScientific, Chicago, IL, USA), or
Santa Cruz (sc-29487), respectively. For transfection, cells were
resuspended at 1.3×10⁷/0.5 ml in PBS and mixed with 4 nM
siRNA for PGC-1α, 4 nM siRNA for ACBP, or 4 nM siRNA for Sp1, or
with 4 nM non-silencing siRNA using Lipofectamine 2000 (Invitrogen)
following the manufacturer’s procedure. After transfection, cells
were cultured in 10% FBS-supplemented DMEM for 48 h. These cells
were then used for cell proliferation, Annexin V-PI staining,
assessment of ROS production, immunofluorescence staining,
real-time RT-PCR and western blot analysis.
Immunoprecipitation
PGC-1α-HEK293 #1 cells were washed in PBS and
centrifuged at 1,000 rpm for 5 min to harvest the cells. Ice-cold
modified RIPA buffer (50 mM Tris-HCl, pH 7.4, 1% NP-40, 0.25%
Na-deoxycholate, 150 mM NaCl, 1 mM EDTA, 1 mM PMSF, 1 μg/ml each of
aprotinin, leupeptin, and pepstatin, 1 mM
Na3VO4, 1 mM NaF) was added to the cells,
which were gently rocked on a rocker at 4°C for 15 min for cell
lysis. The lysate was centrifuged at 14,000 rpm for 15 min at 4°C
and pre-cleared by addition of 100 μl of 50% Protein G sepharose
bead slurry per 1 ml of cell lysate. The supernatant was incubated
with specific antibody overnight at 4°C with gentle rocking. The
immune complex was captured by the addition of 100 μl Protein G
sepharose (Invitrogen). The sepharose beads were washed three times
with 800 μl ice-cold RIPA buffer and resuspended in 60 μl 2X sample
buffer, followed by elution through boiling. The immune complexes
were fractionated on 10% SDS-PAGE followed by western blotting with
appropriate antibodies.
Statistical analyses
Statistical analyses were done with the SPSS 21.0
statistical package for Windows (SPSS, Chicago, IL, USA). Data are
expressed as mean values ± standard deviation (SD). One-way ANOVA
was used to determine whether there were significant differences in
cell viability between PGC-1α-HEK293 #1 cells, PGC-1α-HEK293 #3
cells and HEK293 wild-type cells. Differences in tumor volumes
between control HEK293 cell-injected and PGC-1α-HEK293
cell-injected groups were evaluated using the unpaired Student’s
t-test. Statistical significance was defined as P<0.05.
Results
PGC-1α accelerates proliferation of
HEK293 and CT-26 cells
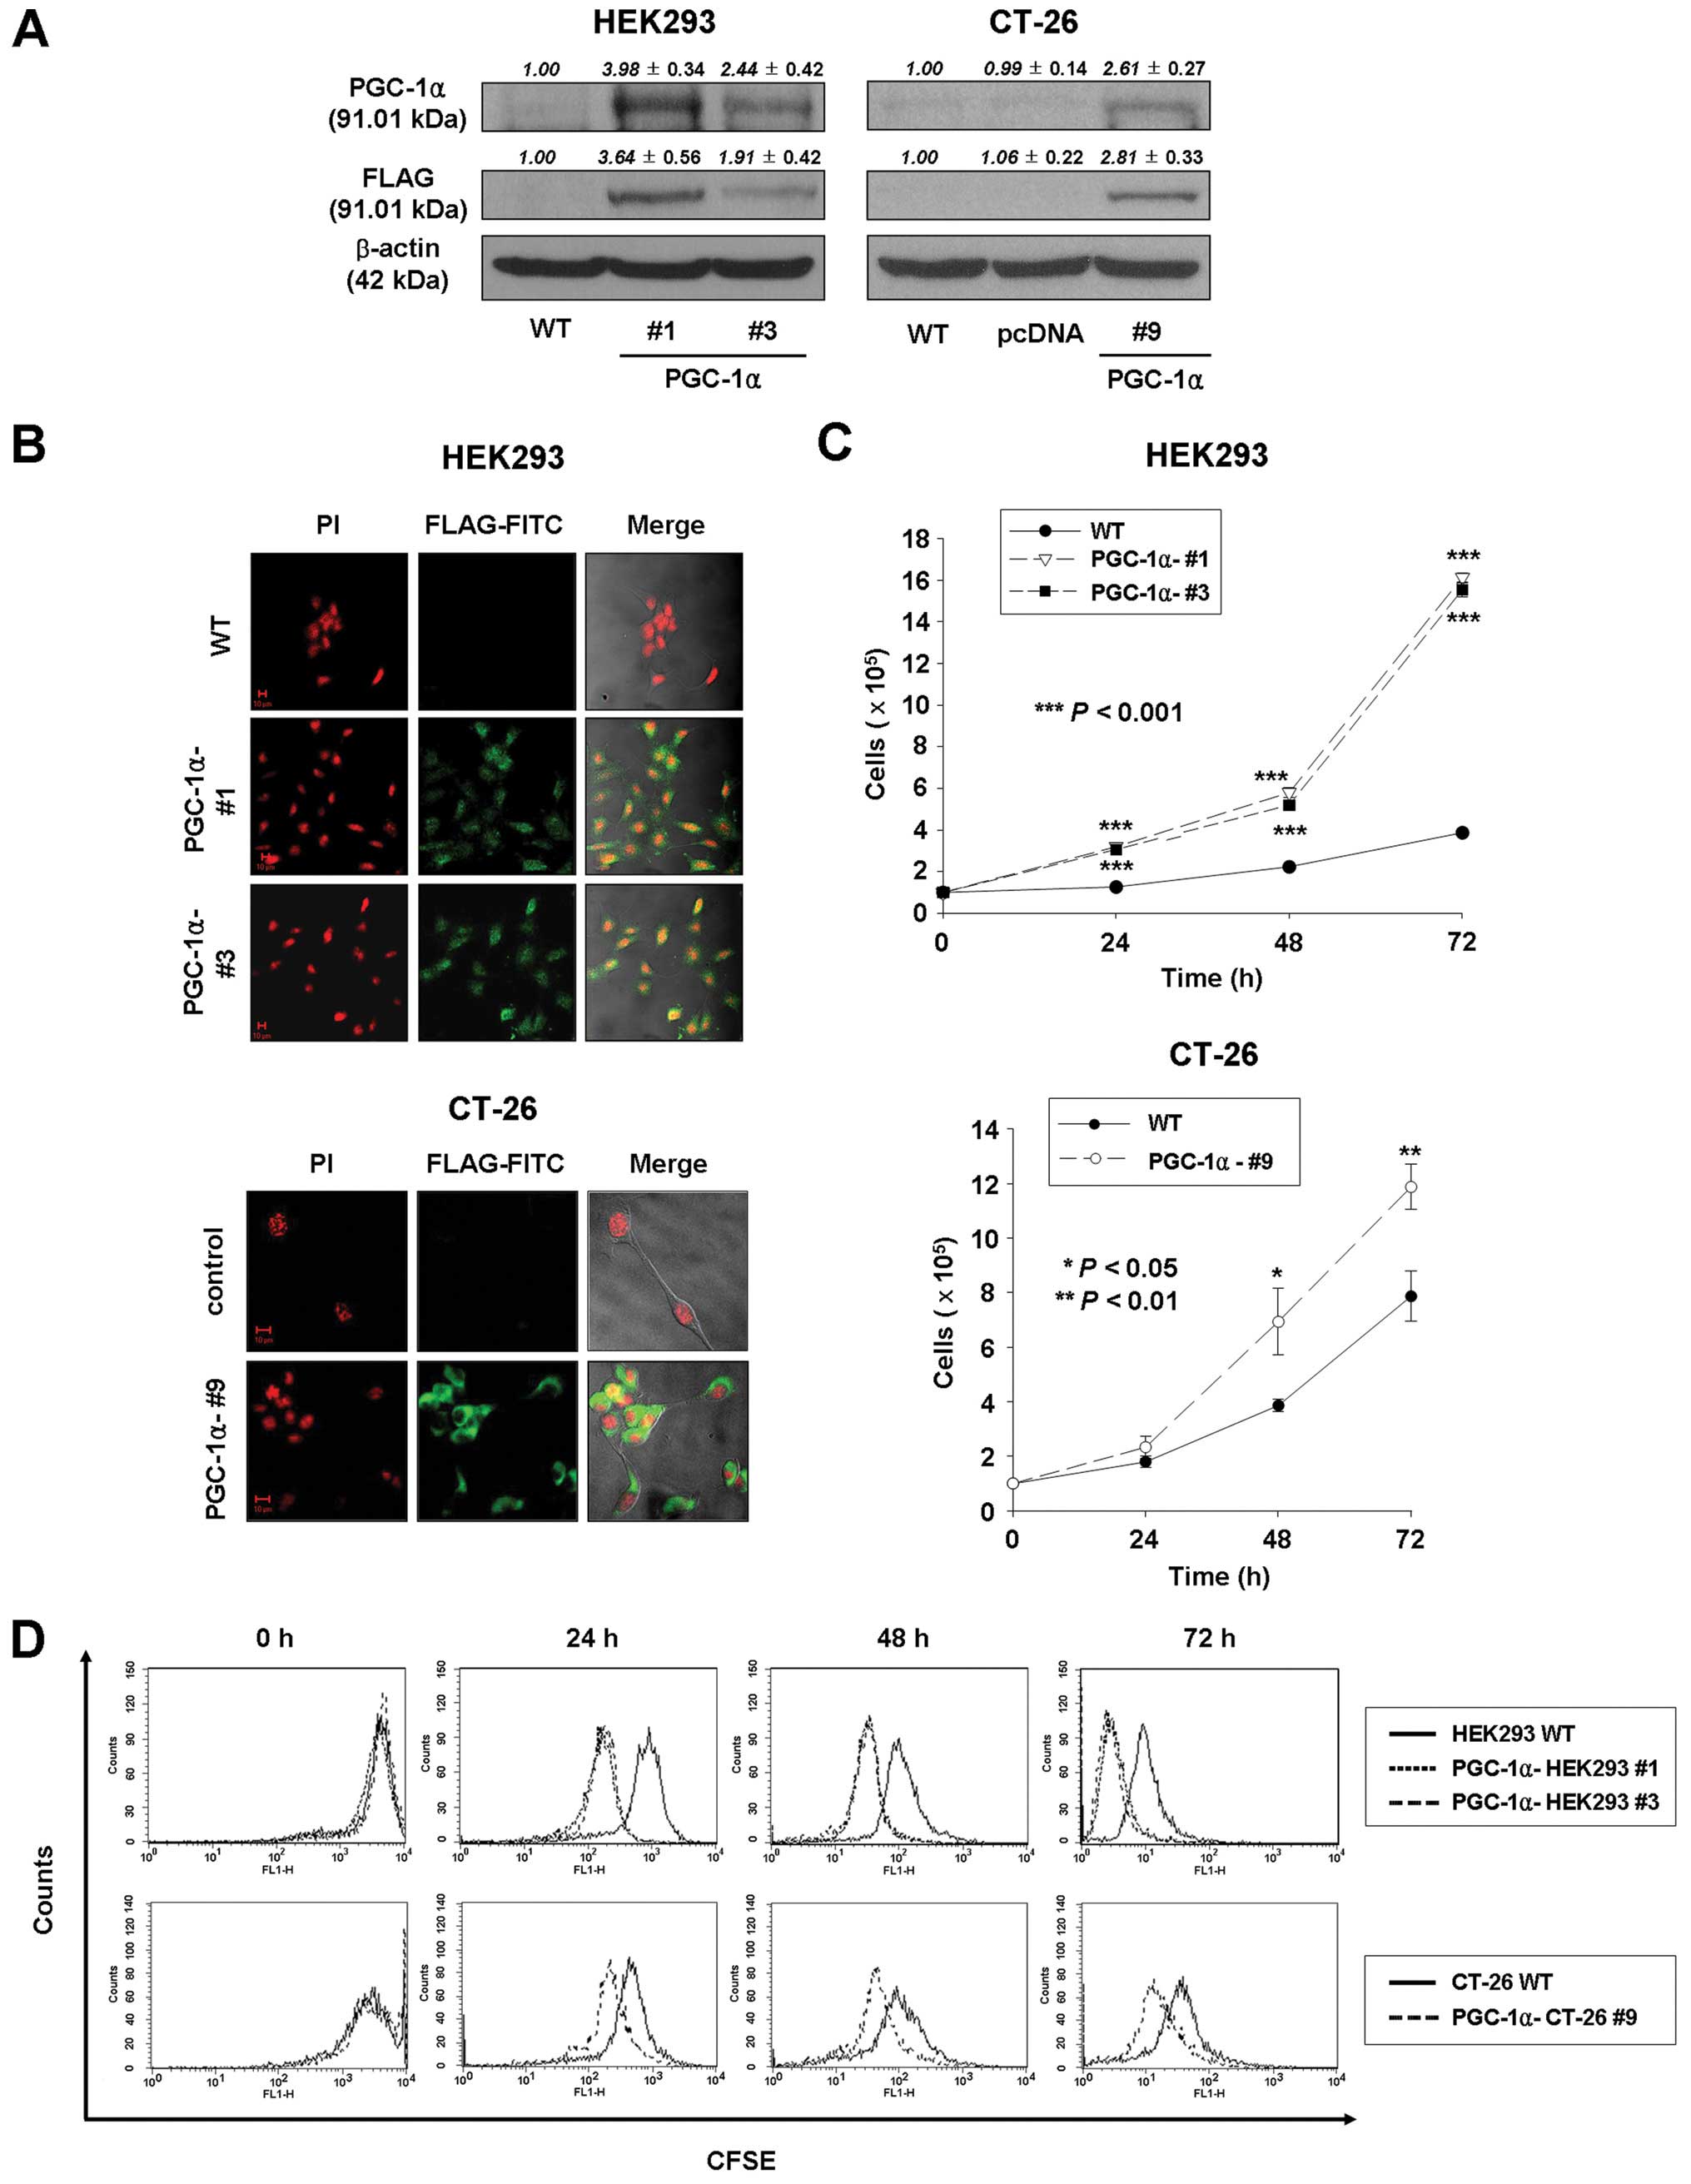
As a first step toward assessing the functional
significance of PGC-1α overexpression for growth of cells, HEK293
and CT-26 cells were transiently transfected with a FLAG-tagged
PGC-1α expression vector or with the parental vector (pcDNA 3.1)
and cultured with G418 (800 μg/ml) for 14 days. After that, several
colonies were picked and amplified. Exogenously expressed PGC-1α
was detected by western blotting and immunofluorescence staining
with antibodies against PGC-1α and FLAG. As shown in Fig. 1A, the protein of PGC-1α in
PGC-1α-HEK293 #1, PGC-1α-HEK293 #3, and PGC-1α-CT-26 #9 cells was
increased compared to wild-type or pcDNA-transfected HEK293 and
CT-26 cells. In addition, the exogenously expressed FLAG-tagged
PGC-1α (FLAG-PGC-1α) was detected in PGC-1α-transfected HEK293
(PGC-1α-HEK293 #1 and #3) and PGC-1α-transfected CT-26
(PGC-1α-CT-26 #9) cells (Fig.
1B).
To investigate the effect of PGC-1α overexpression
on growth of HEK293 and CT-26 cells, cell viability and
proliferation were determined by cell counting and CFSE labeling
assays. As shown in Fig. 1C, the
average number of cells in PGC-1α-transfected HEK293 and CT-26
cells (PGC-1α-HEK293 #1 and #3; 16.1×10⁵ and
15.5×10⁵ at 72 h, respectively; PGC-1α-CT-26 #9;
11.9×10⁵ at 72 h) was significantly higher than in
wild-type HEK293 and CT-26 cells (3.9×10⁵ at 72 h;
7.9×10⁵ at 72 h, respectively). In addition, as
expected, the number of cells with high fluorescence decreased with
days in culture, so that the peak signals for PGC-1α-transfected
cells (PGC-1α-HEK293 #1, #3 and PGC-1α-CT-26 cells) were shifted to
the left compared to control cells (Fig. 1D). Thus, CFSE labeling analysis
confirmed that PGC-1α overexpression enhances cell proliferation of
HEK293 and CT-26 cells.
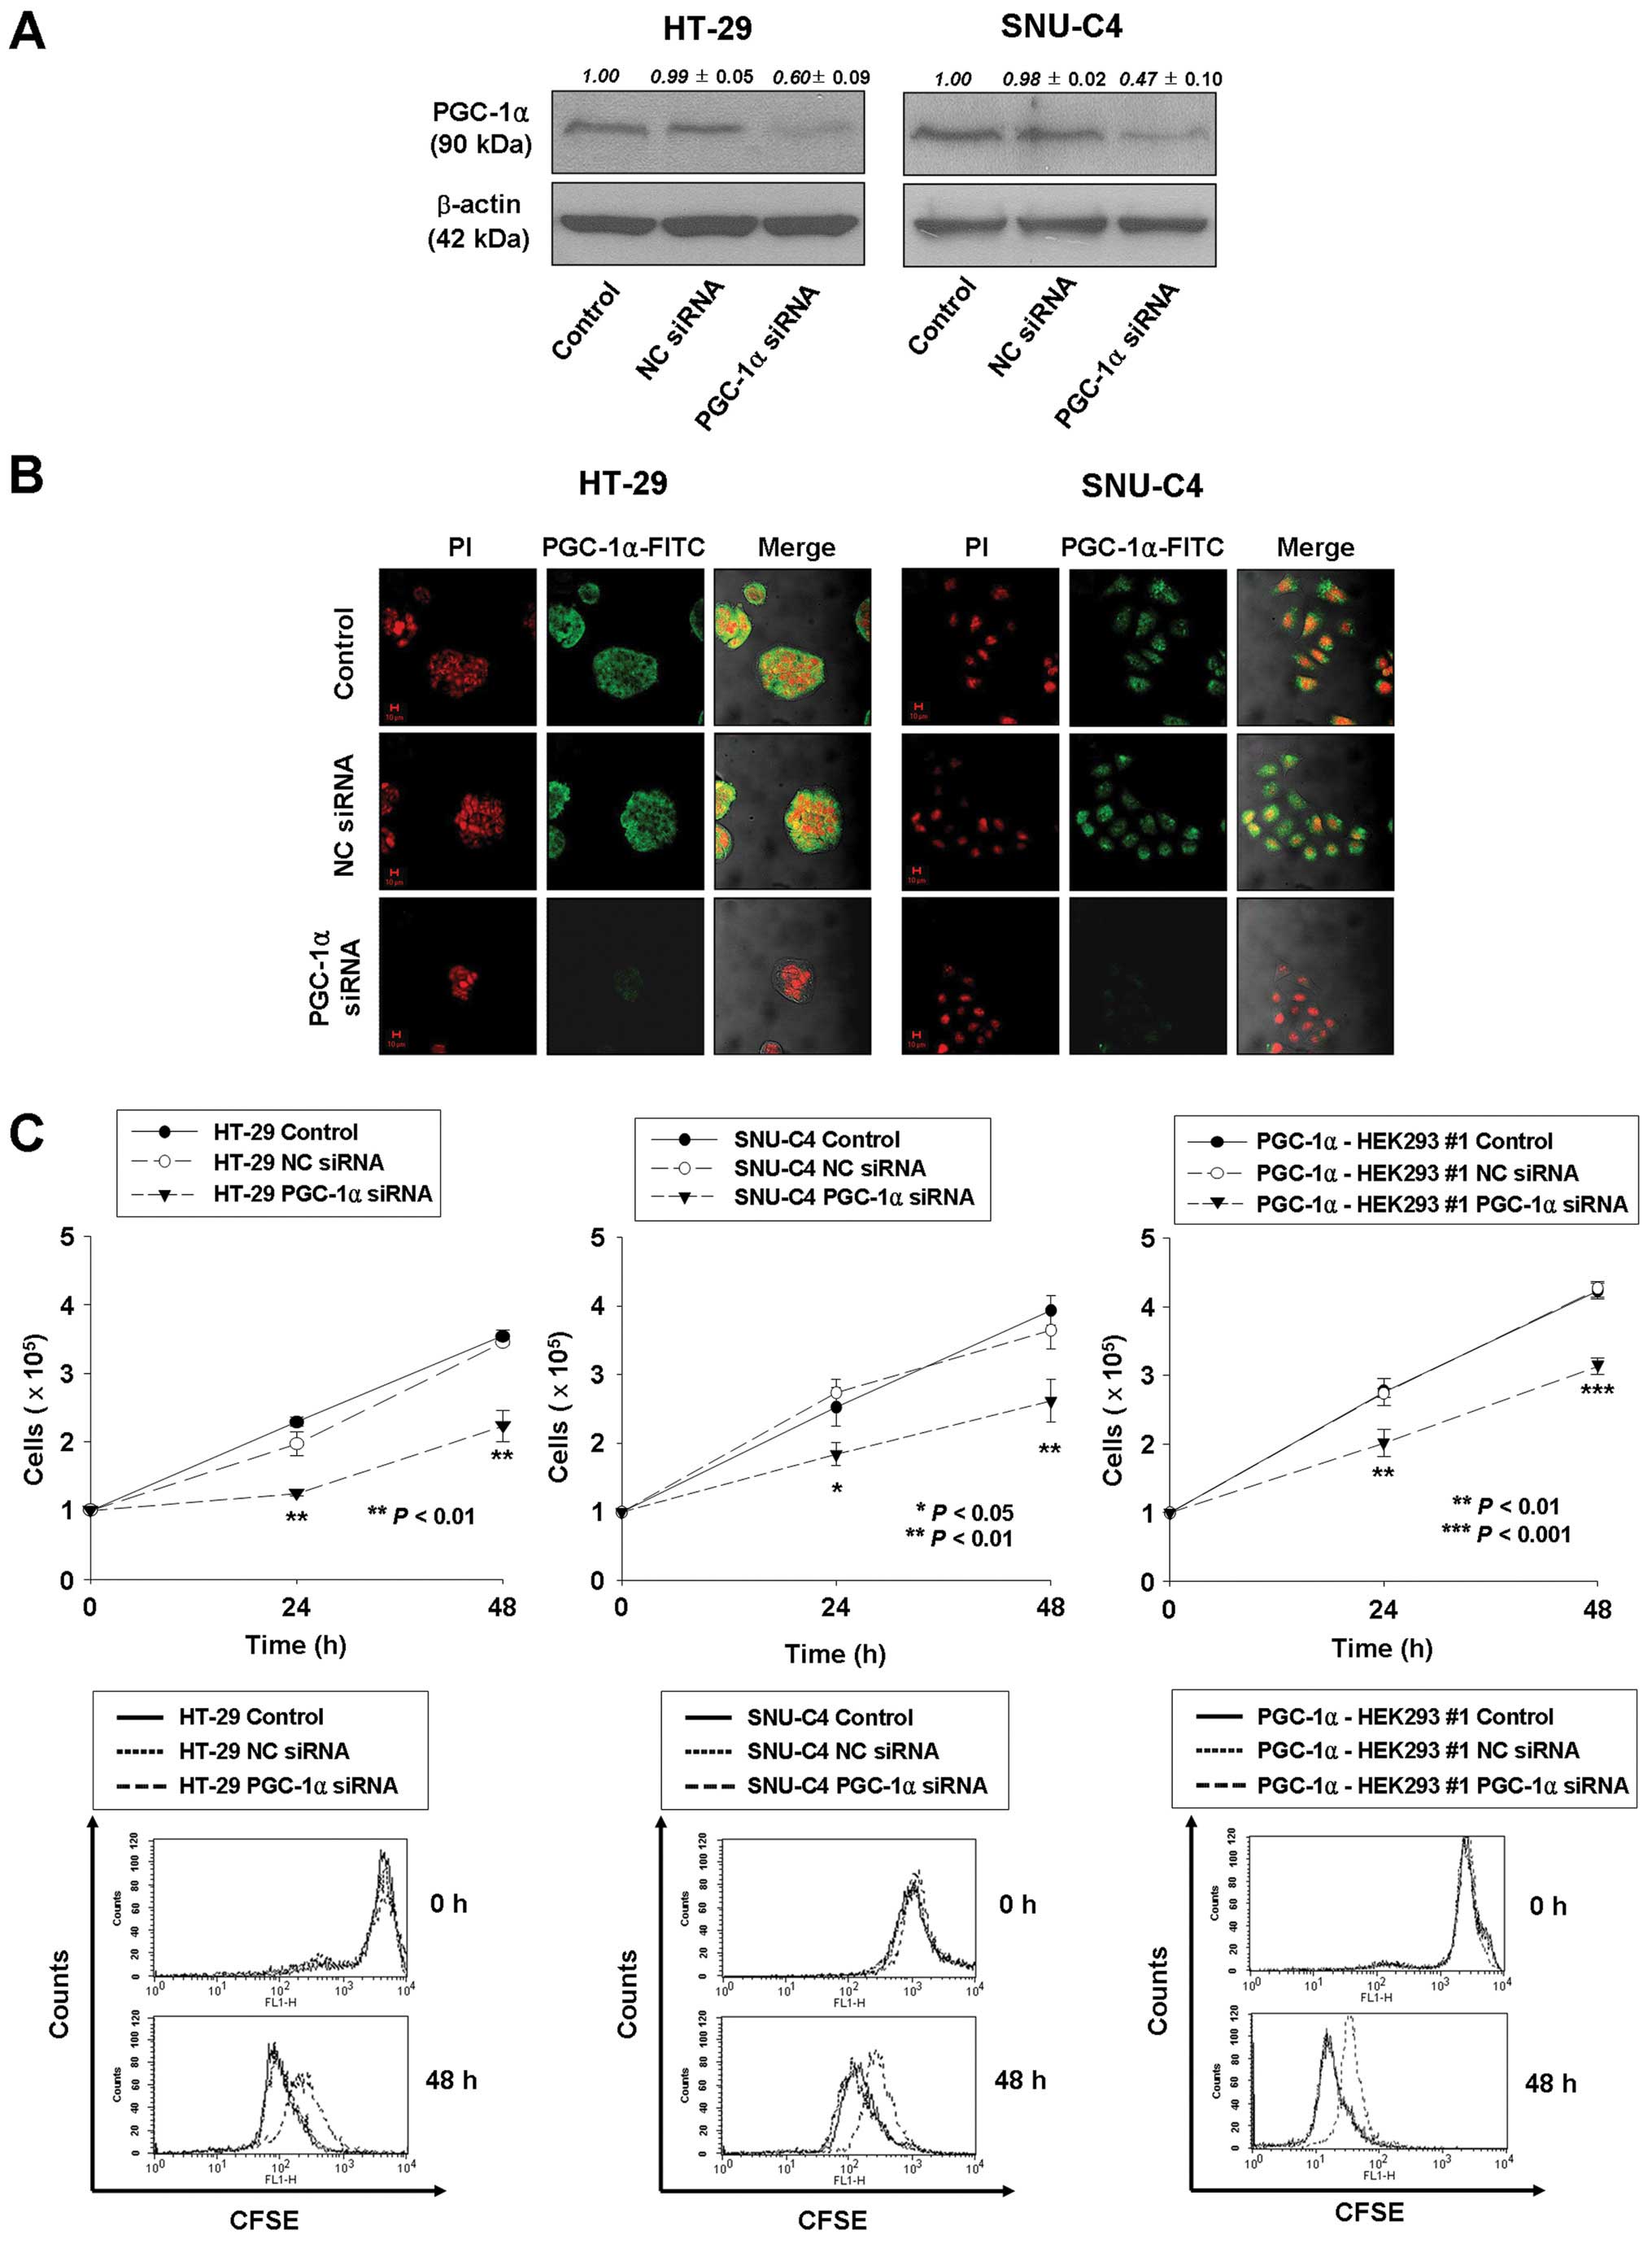
Knockdown of PGC-1α expression results in
decreased cell proliferation of human colorectal cancer cells
The effect of PGC-1α on cell proliferation was
further investigated using siRNA transfection to knock down
endogenous PGC-1α expression in human colorectal cancer HT-29 and
SNU-C4 cells. At 72 h after transfection, PGC-1α expression was 40
and 53% lower than in wild-type or non-specific control
siRNA-transfected HT-29 and SNU-C4 cells, respectively (Fig. 2A and B). Concurrently,
proliferation of PGC-1α siRNA-transfected HT-29 and SNU-C4 cells at
48 h post-transfection was significantly suppressed in comparison
with that of untreated or non-silencing siRNA-transfected cells
(37.2 and 33.5% reduction, respectively; P<0.01) by cell
counting and CFSE labeling (Fig.
2C). In addition, PGC-1α siRNA transfection repressed cell
proliferation by 26% at 48 h post-transfection in PGC-1α-HEK293 #1
cells (Fig. 2C). Taken together,
these results support an important role of PGC-1α in the regulation
of cell proliferation.
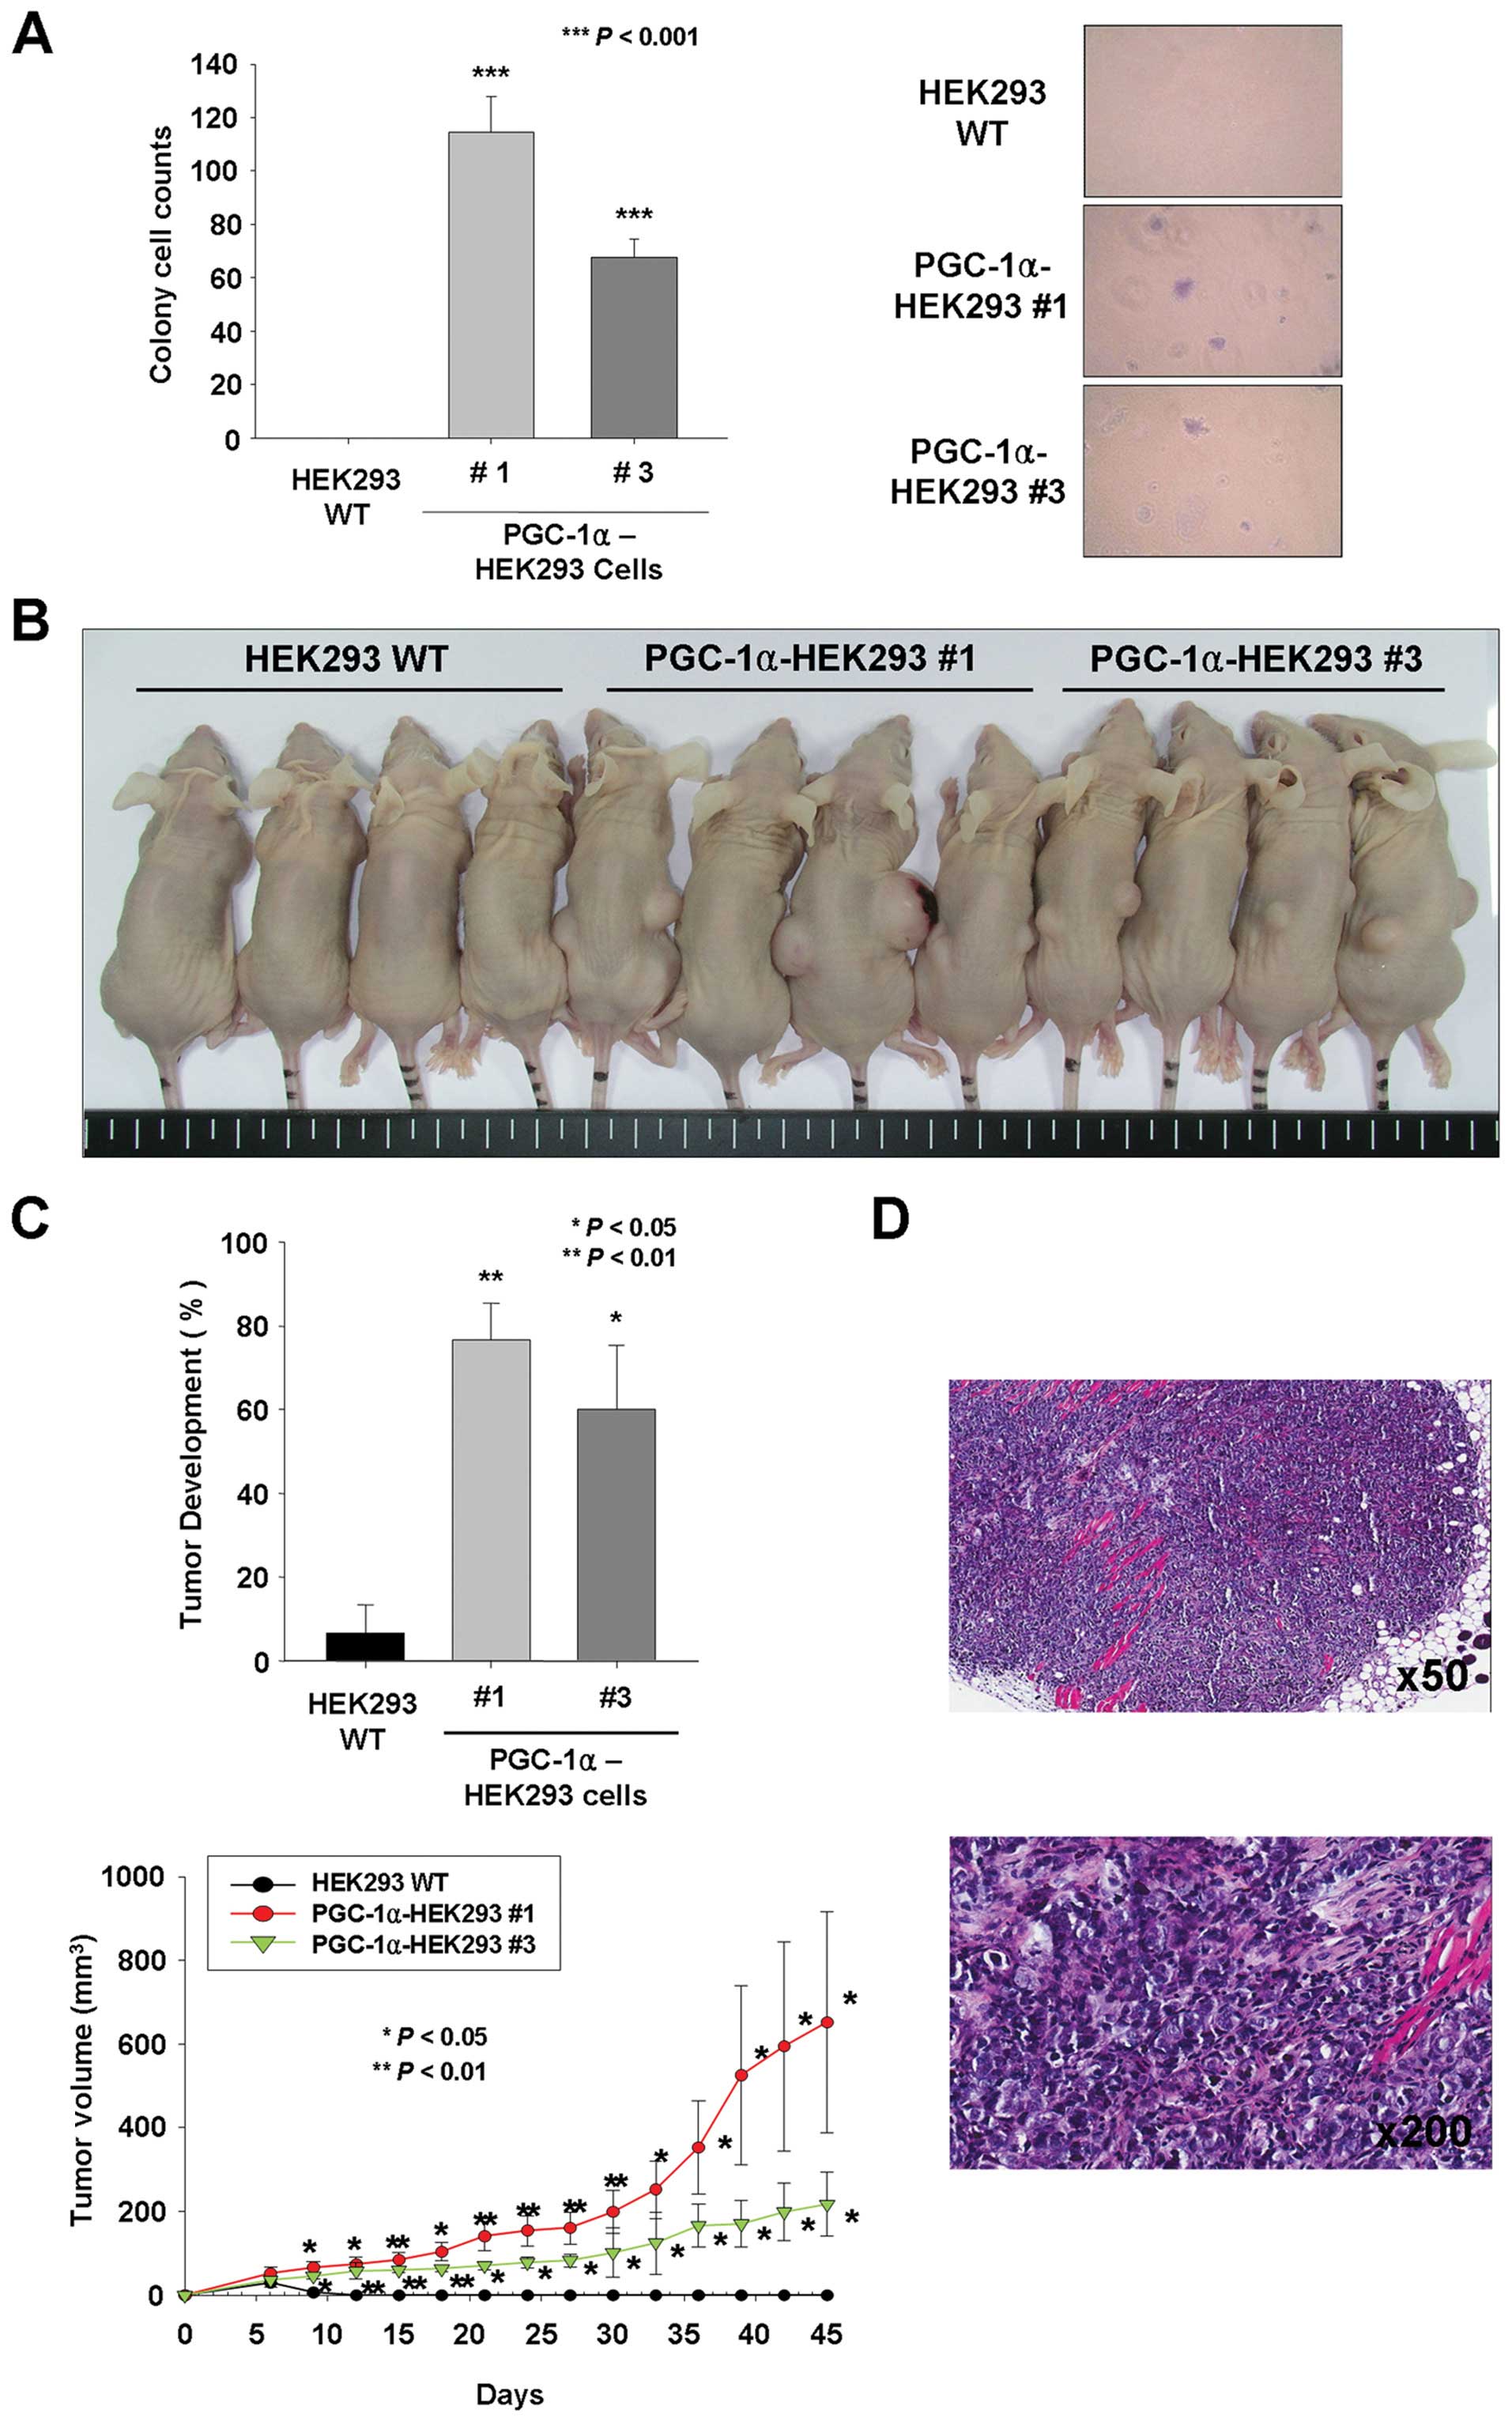
PGC-1α promotes the oncogenic potential
of HEK293 cells
Because anchorage-independent growth is considered
to be an in vitro test for tumorigenesis, we assayed the
effects of overexpression of PGC-1α on the ability of HEK293 cells
to form colonies in soft agar. As shown in Fig. 3A, overexpression of PGC-1α in
HEK293 cells resulted in a higher incidence of colony formation
than observed following transfection with the empty vector (114.
4±13.6 and 67.8±6.6, P<0.001, respectively). The cells
transfected with empty vector formed no colonies during 14 days of
culture whereas both cell lines expressing PGC-1α formed a
significantly high number of colonies of a large size (Fig. 3A). In addition, to confirm the
impact of PGC-1α overexpression on tumorigenesis, wild-type HEK293
cells or PGC-1α-overexpressing HEK293 cells were injected
subcutaneously into bilateral flanks of immunodeficient Balb/c
mice, and tumor development and size were examined. Wild-type
HEK293 cells formed tumors at a low percentage (6.67±6.67%) whereas
the matched PGC-1α-HEK293 cells (PGC-1α-HEK293 #1 and PGC-1α-HEK293
#3) formed tumors in 76.67±8.82 and 60.00±15.30% of mice,
respectively (Fig. 3B and C). In
addition, the average tumor size in mice with PGC-1α-HEK293 #1
(652.1±263.5 mm3) was larger than in mice with
PGC-1α-HEK293 #3 (217.3±75.9 mm3), suggesting that the
expression level of PGC-1α is related to tumor growth. Furthermore,
the presence of tumor cells was confirmed by hematoxylin and eosin
staining (Fig. 3D). Thus, these
data suggest that PGC-1α overexpression dramatically enhances the
tumorigenic capacity of HEK293 cells in Balb/c nude mice.
Decreased sensitivity to oxidative stress
in PGC-1α-overexpressing HEK293 cells
Previous studies have demonstrated that PGC-1α
expression leads to expression of antioxidants such as SOD and
catalase (10,26) and provided evidence that PGC-1α can
protect neuroblastoma cells from
H2O2-mediated cell death (10). In this study, to evaluate the role
of PGC-1α in providing a defense against oxidative stress,
wild-type HEK293 and PGC-1α-overexpressing HEK293 cells were
treated with various concentrations of H2O2
for 24 h; the extent of apoptosis was determined using Annexin V-PI
staining. Approximately 72.7% of the empty vector-expressing HEK293
cells died after exposure to 1 mM H2O2, but
only 28.7 and 29.4% of the PGC-1α-transfected HEK293 cells
(PGC-1α-HEK293 #1 and PGC-1α-HEK293 #3) died, respectively
(Fig. 4A). Consistent with these
changes, wild-type HEK293 cells had significantly higher
intracellular levels of ROS than PGC-1α-transfected HEK293 cells
did (5.64±0.55-vs. 1.91±0.22- and 2.38±0.30-fold, P<0.01 and
P<0.05, respectively), as indicated by increased fluorescence in
the presence of the compound DCF-DA (Fig. 4B).
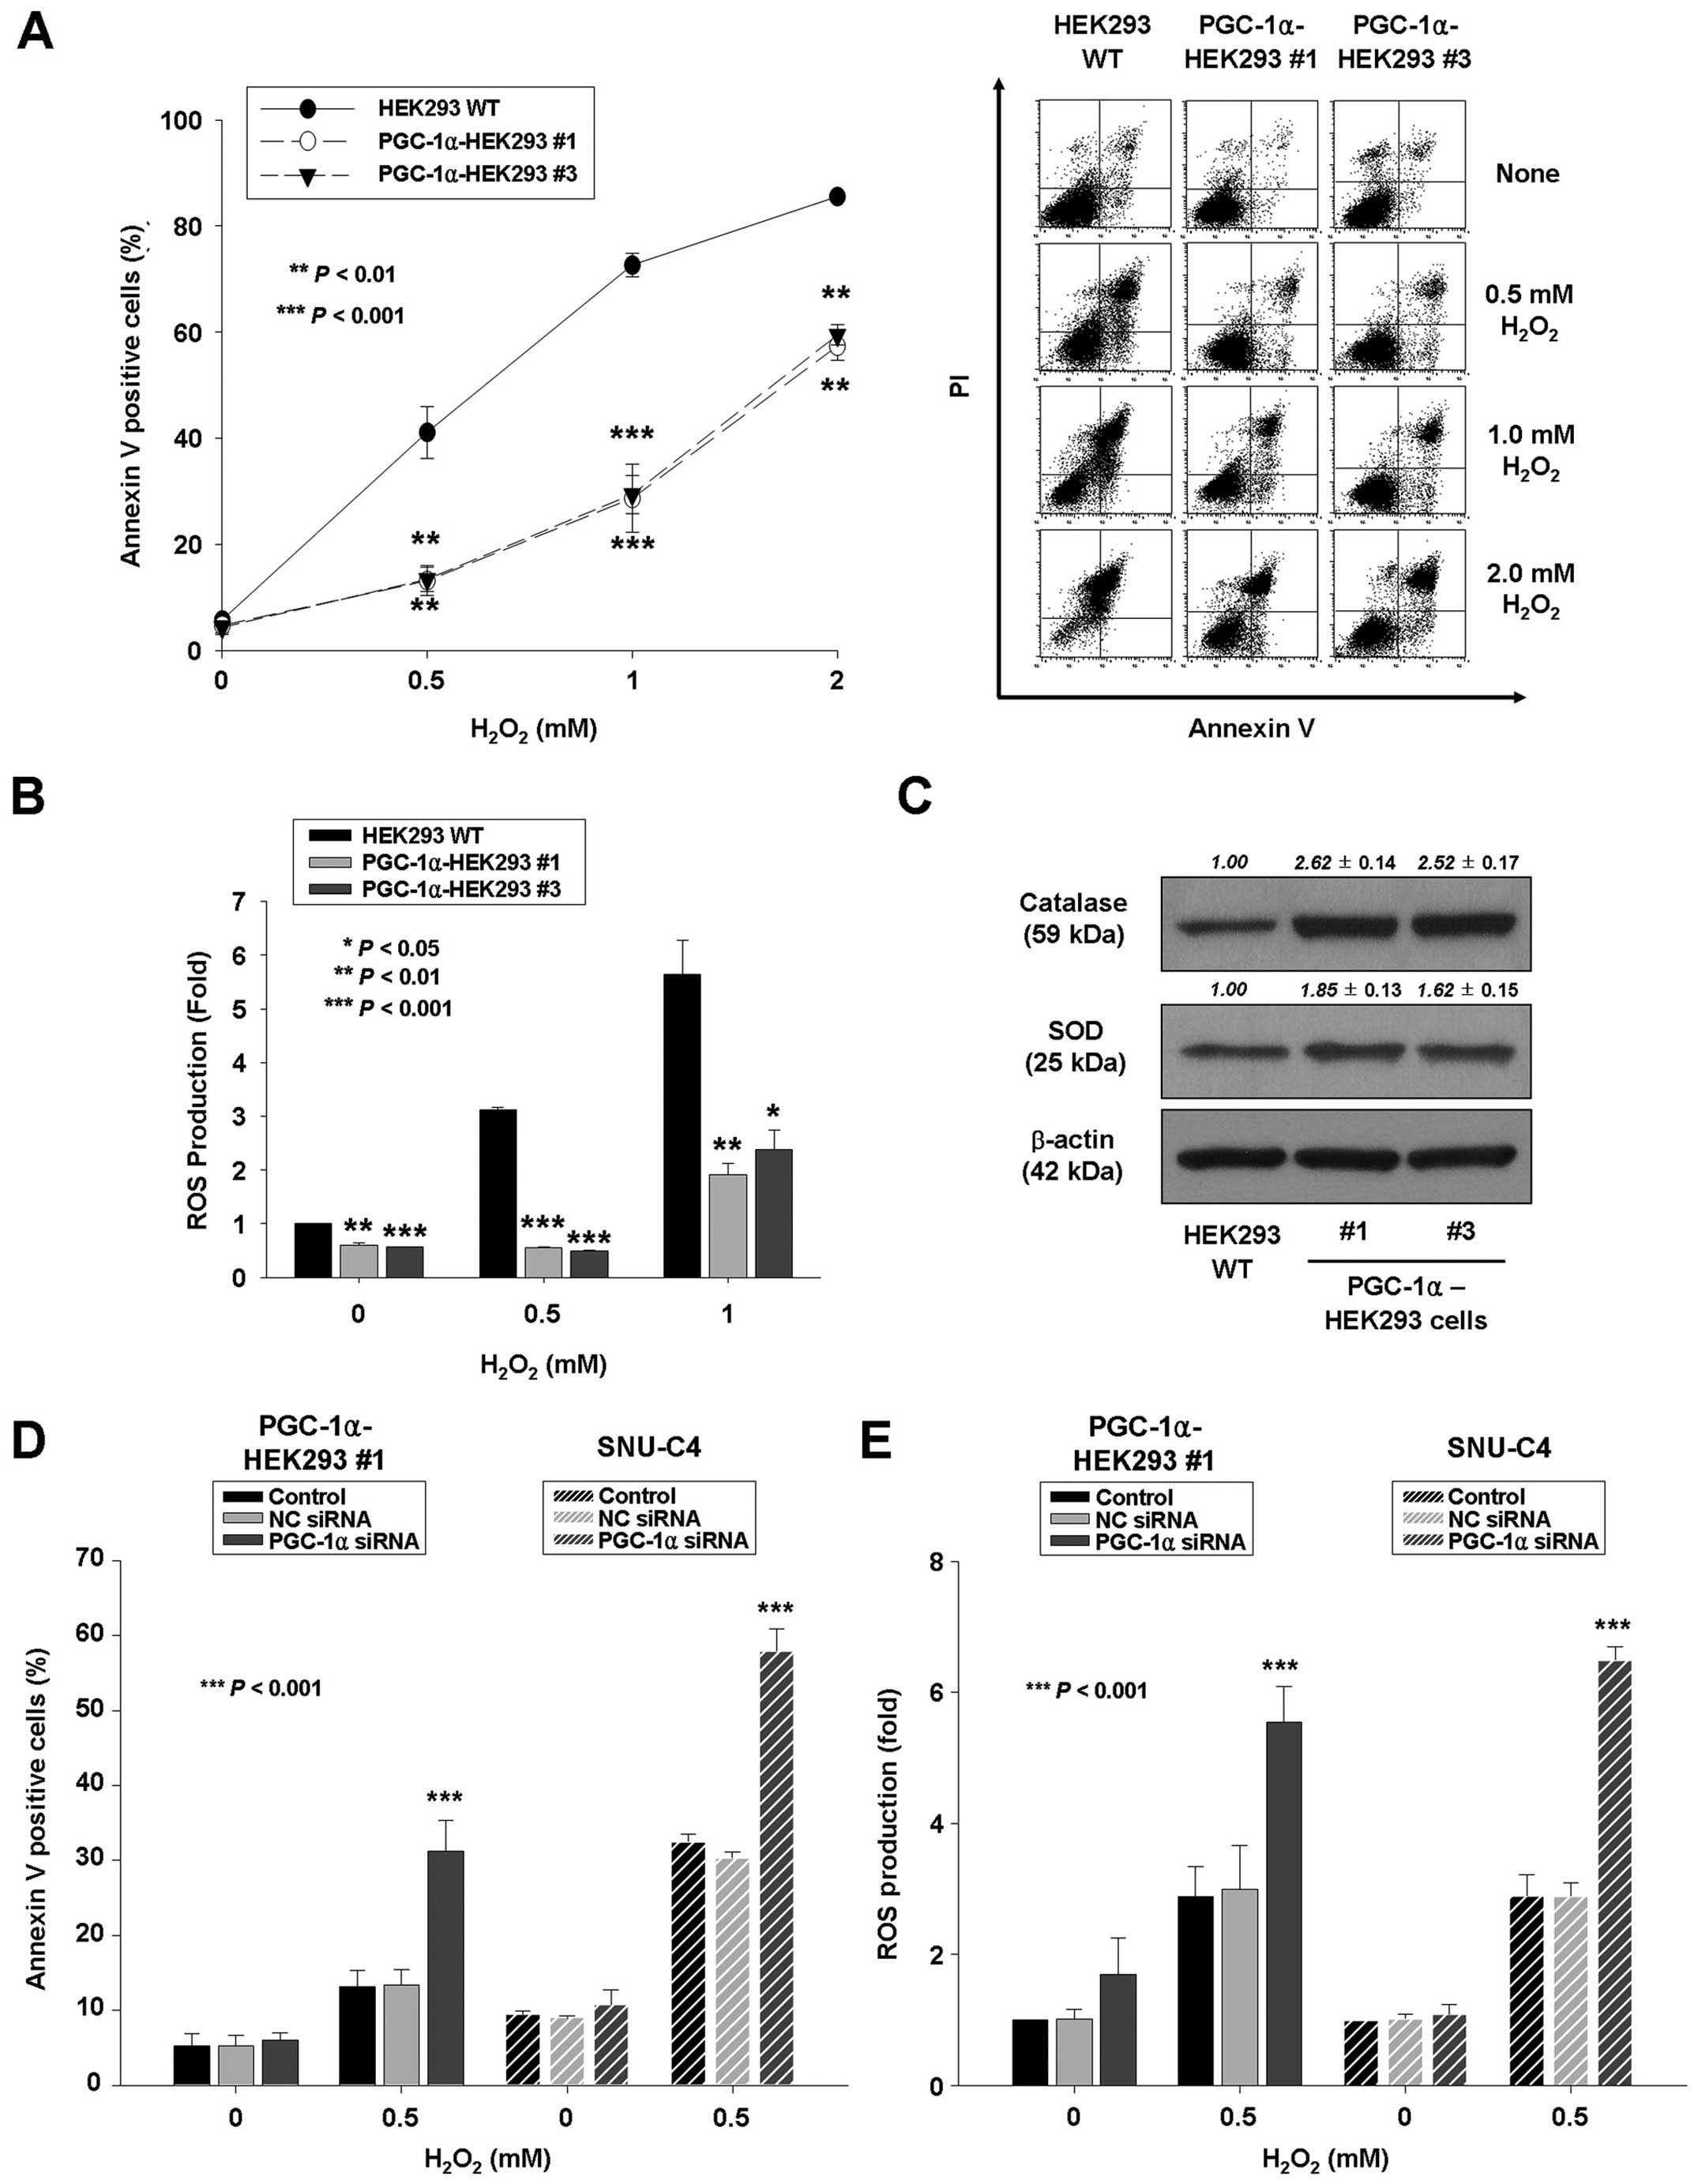 | Figure 4PGC-1α protects HEK293 cells against
oxidative stress. (A and B) Stable HEK293 cell lines expressing
empty vector or PGC-1α were seeded 24 h before treatment with
various concentrations of H2O2 (0, 0.5, 1 or
2 mmol/l) for 24 h. (A) Left panel, the percentage of apoptotic
cells was determined by Annexin V-FITC/PI staining as described in
Materials and methods. The data represent the mean ± SD of three
independent experiments. **P<0.01,
***P<0.001, vs. wild-type HEK293 cells. Right panel,
representative flow cytometric data. (B) After treatment, cells
were labeled with an oxidative-sensitive dye
(carboxy-H2DCFDA) and ROS levels were quantified by flow
cytometry. ROS production was expressed as fold compared with
wild-type HEK293 cells. The data represent the mean ± SD of three
independent experiments. *P<0.05,
**P<0.01, ***P<0.001, vs. wild-type
HEK293 cells. (C) Western blotting of catalase and SOD in HEK293,
PGC-1α-HEK293 #1, and #3 cells. Densitometry results are expressed
as mean ± SD above the bands. (D and E) PGC-1α-HEK293 #1 and SNU-C4
cells were transiently transfected by Lipofectamine with no siRNA,
non-specific control (NC) siRNA or PGC-1α siRNA. (D) After
transfection, cells were treated with 0.5 mM
H2O2 for 24 h. The percentage of apoptotic
cells was determined by Annexin V-FITC/PI staining as described in
Materials and methods. (E) In separate experiments, cells were
treated with 0.5 mM H2O2 for 24 h, after
which they were labeled with an oxidative-sensitive dye
(carboxy-H2DCFDA), and ROS levels were quantified by
flow cytometry. The data represent the mean ± SD of three
independent experiments. ***P<0.001, vs. control or
NC siRNA cells. |
In addition, the basal level of ROS was determined
in wild-type, PGC-1α-HEK293 #1 and PGC-1α-HEK293 #3 cells. The
basal level of ROS was reduced in PGC-1α-transfected cells compared
with wild-type HEK293 cells (0.60±0.03- and 0.57±0.01-fold vs. 1,
respectively) (Fig. 4B). The
reduced basal ROS of PGC-1α-HEK293 cells may be related to the
increased expression of antioxidants. The expression of catalase
was significantly 2.62- and 2.52-fold increased in
PGC-1α-transfected HEK293 (PGC-1α-HEK293 #1 and #3) cells,
respectively (Fig. 4C). The
expression of SOD was significantly 1.85- and 1.62-fold increased
in PGC-1α-transfected HEK293 (PGC-1α-HEK293 #1 and #3) cells,
respectively (Fig. 4C). To confirm
these results, the extent of H2O2-induced
apoptosis and ROS level were measured in PGC-1α-siRNA- or
non-specific control siRNA-transfected PGC-1α-HEK293 #1 and SNU-C4
cells. The extent of H2O2-induced apoptosis
and ROS level were significantly increased in
PGC-1α-siRNA-transfected PGC-1α-HEK293 #1 and SNU-C4 cells
(Fig. 4D and E). The increased
basal ROS of PGC-1α-siRNA-transfected PGC-1α-HEK293 #1 and SNU-C4
cells may be caused by the decreased expression of antioxidants.
Expression of SOD and catalase was decreased in
PGC-1α-siRNA-transfected PGC-1α-HEK293 #1 and SNU-C4 cells
(Fig. 6A). These results indicate
that PGC-1α can protect HEK293 cells from oxidative stress such as
that caused by H2O2. Decreased susceptibility
to ROS-induced apoptosis may contribute to increased cell
proliferation in PGC-1α-HEK293 cells.
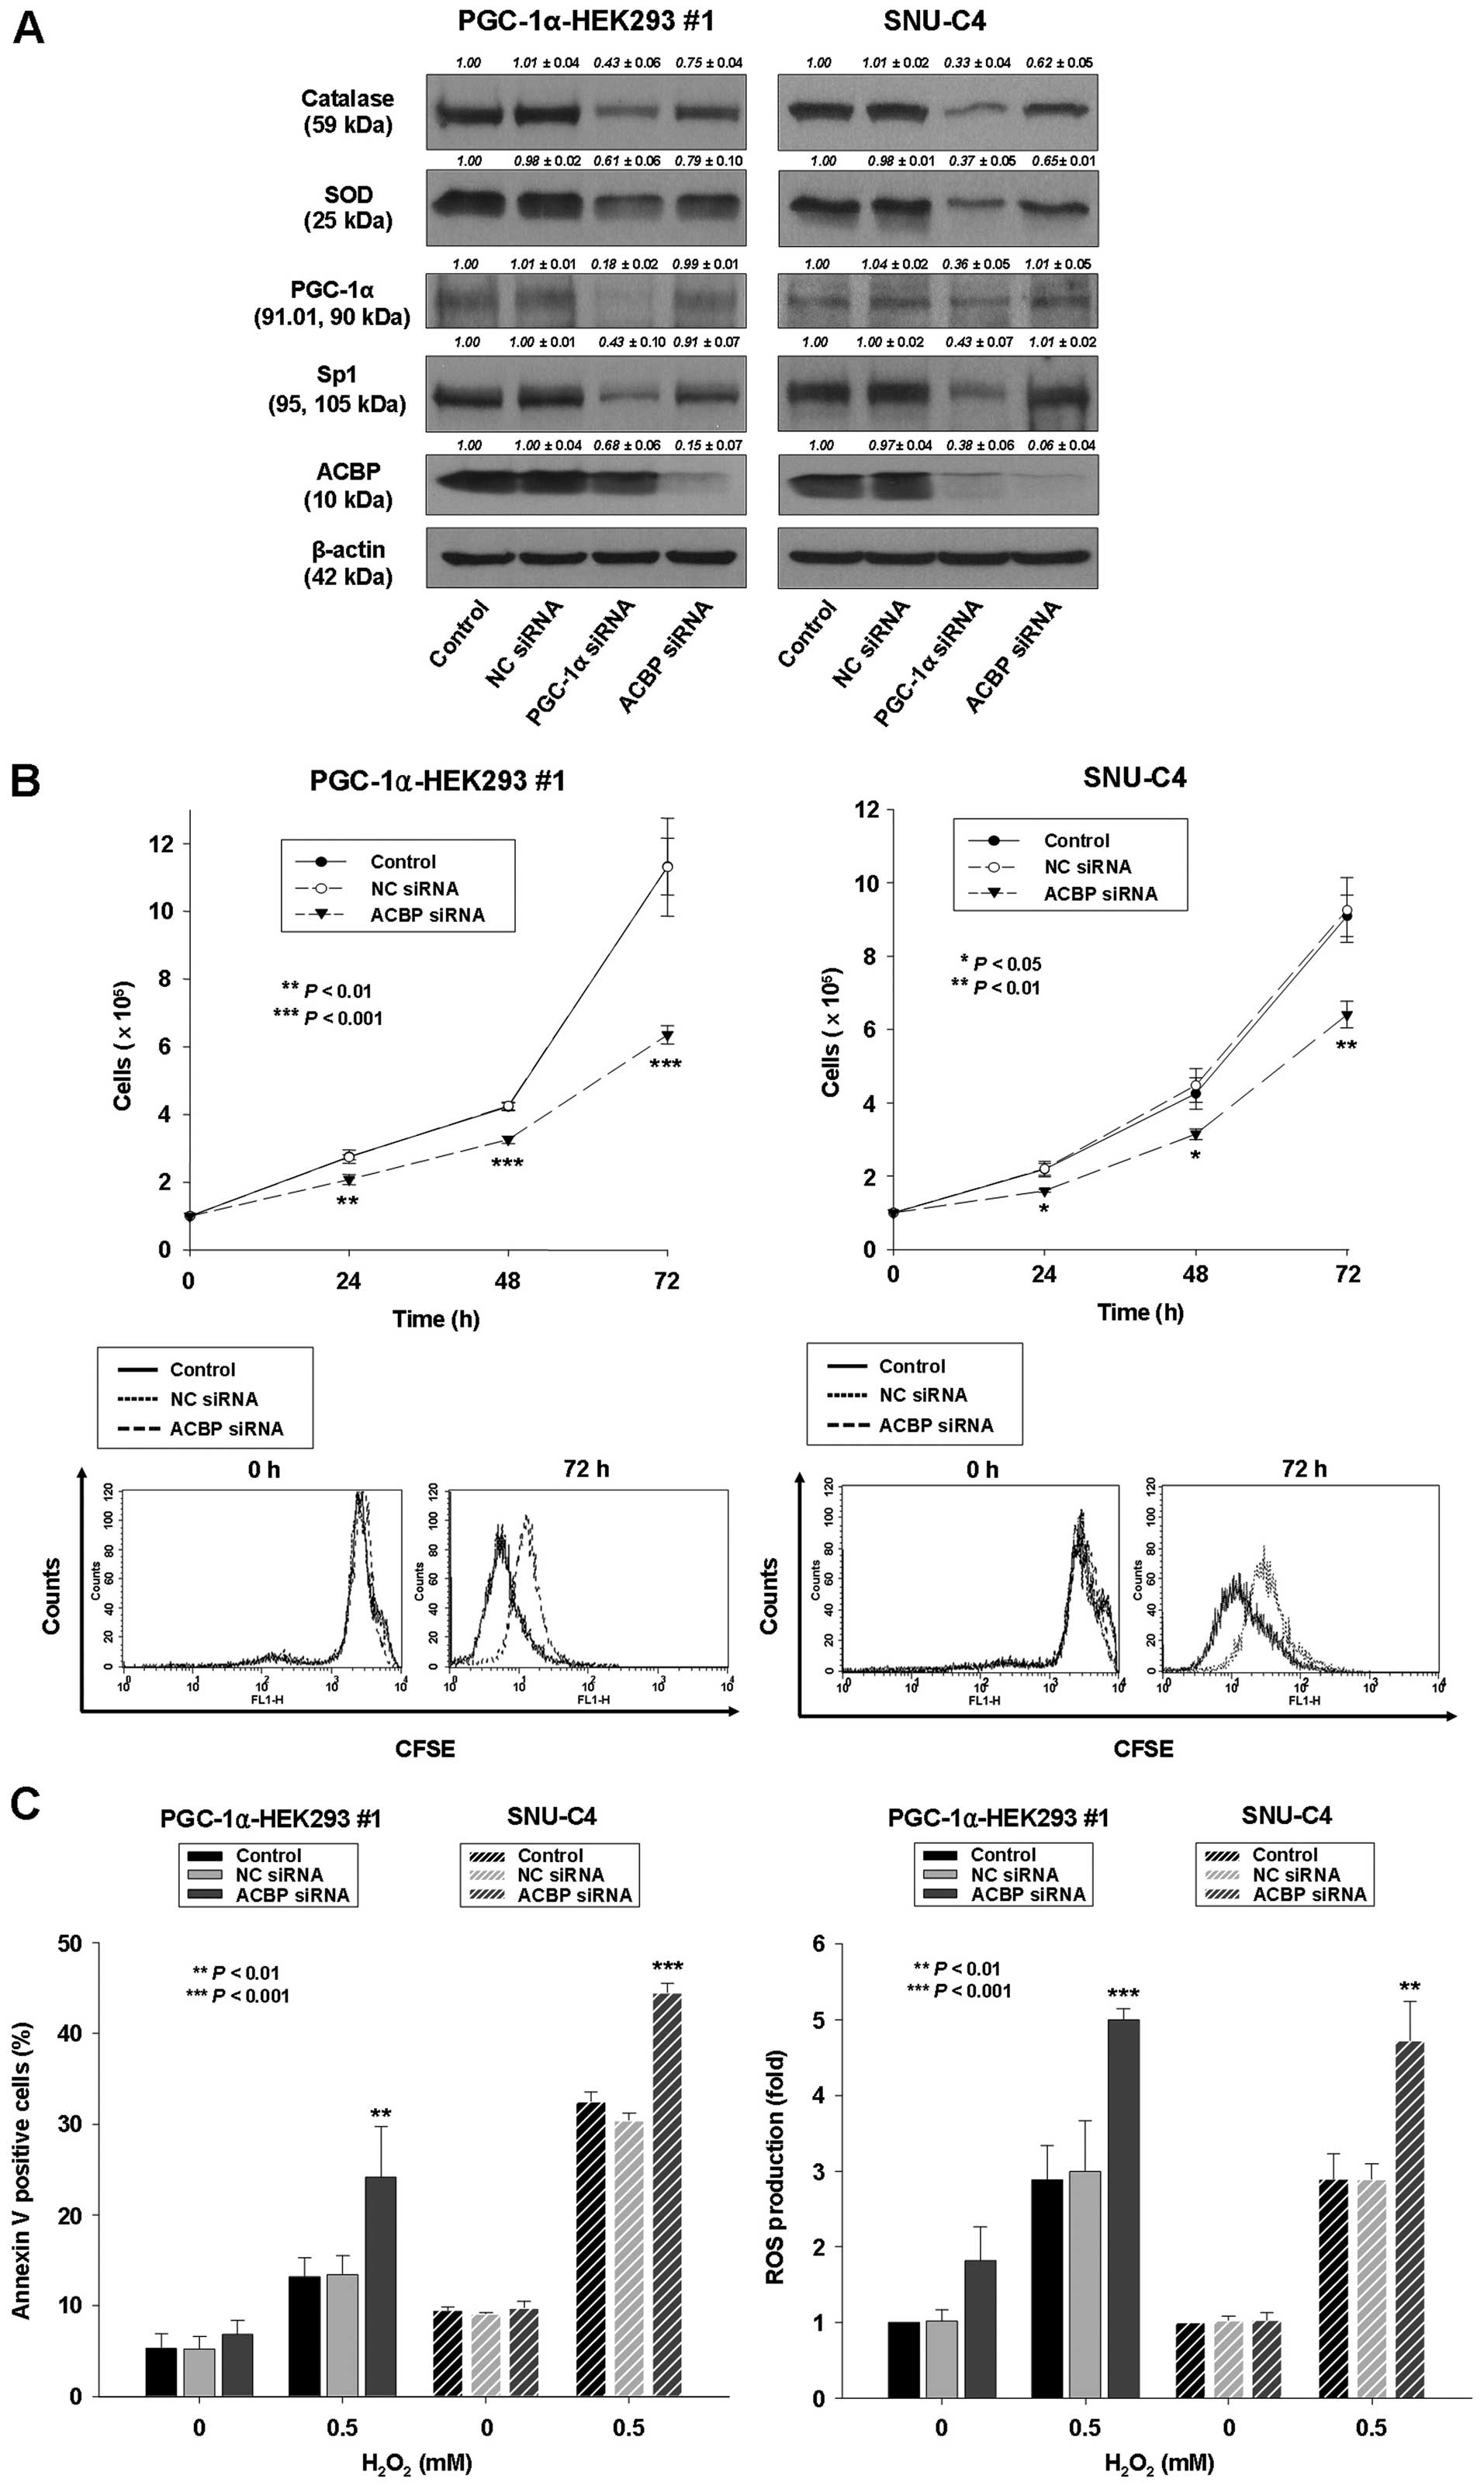 | Figure 6Downregulation of ACBP leads to
decreased cell proliferation, decreased expression of catalase and
SOD, and increased sensitivity to
H2O2-induced apoptosis. PGC-1α-HEK293 #1 and
SNU-C4 cells were transiently transfected by Lipofectamine with no
siRNA (control), non-specific control (NC) siRNA, siRNA for PGC-1α
or siRNA for ACBP. (A) Protein lysates were prepared and subjected
to western blot analysis as described in Materials and methods
using corresponding antibodies. Equal protein loading was ensured
by demonstrating uniform β-actin expression. The blot is
representative of 3 separate experiments. Densitometry results are
expressed as mean ± SD above the bands. (B) Upper panel, the
transfected cells were seeded and cultured for indicated times.
After that, cell proliferation was determined by cell counting. The
data represent the mean ± SD of 3 independent experiments.
*P<0.05, **P<0.01,
***P<0.001, vs. control or NC siRNA-transfected
cells. Lower panel, CFSE analysis. (C) Left panel, after
transfection, cells were treated with 0.5 mM
H2O2 for 24 h. The percentage of apoptotic
cells was determined by Annexin V-FITC/PI staining as described in
Materials and methods. Right panel, in separate experiments, cells
were treated with 0.5 mM H2O2 for 24 h, after
which they were labeled with a carboxy-H2DCFDA and ROS
levels were quantified by flow cytometry. The data represent the
mean ± SD of three independent experiments. *P<0.05,
**P<0.01, ***P<0.001, vs. control or NC
siRNA-transfected cells. |
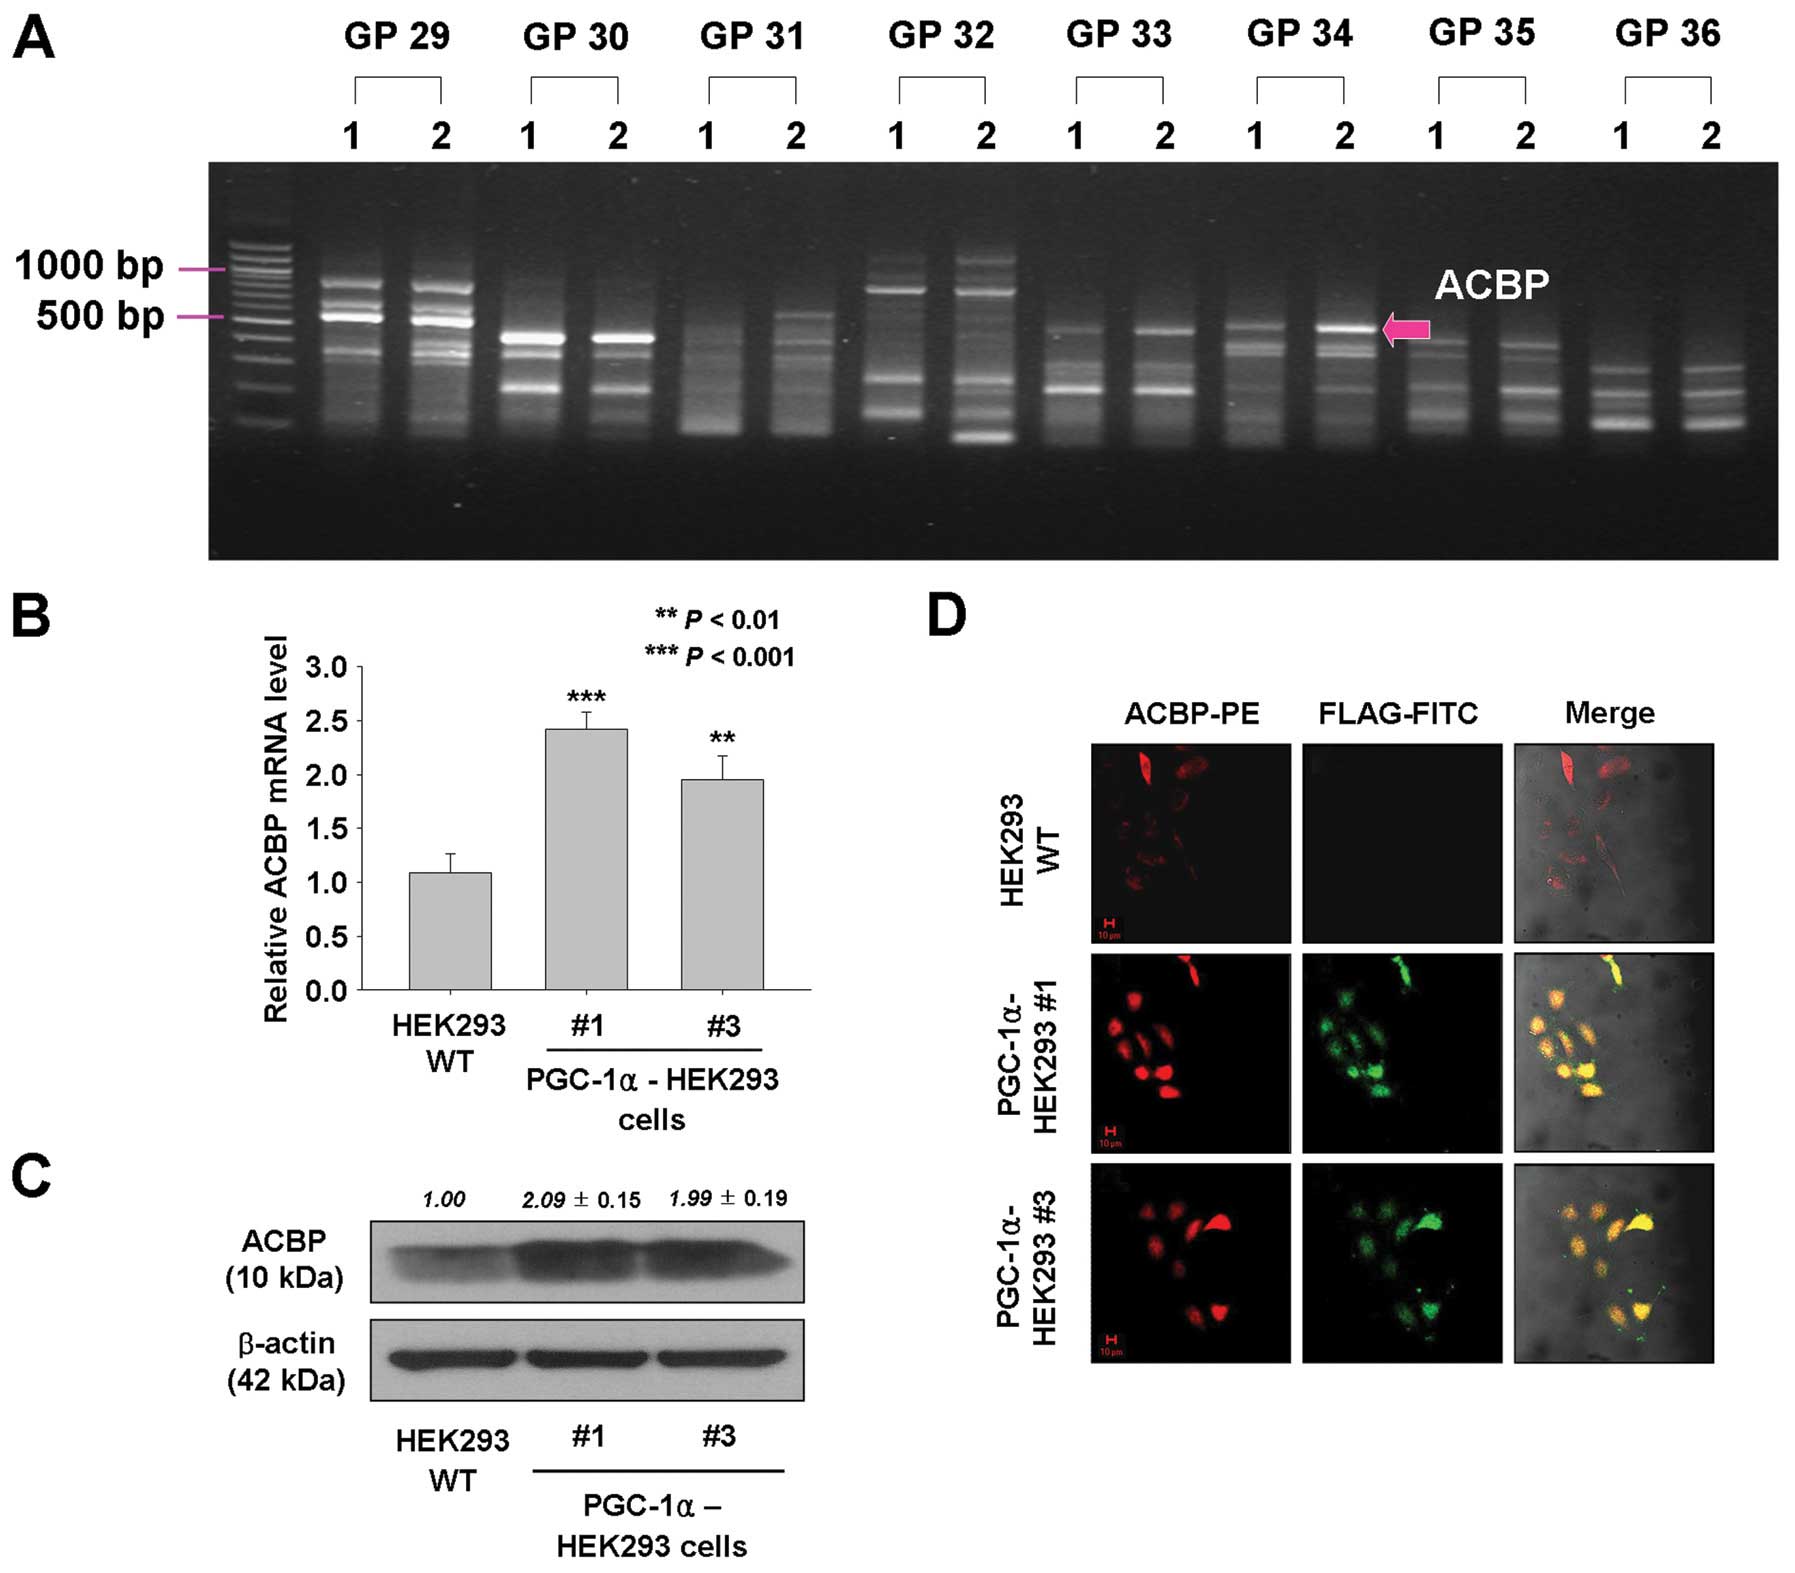
Overexpression of PGC-1α may lead to
upregulation of acyl-CoA binding protein (ACBP) in HEK293
cells
To investigate genes that contribute to
PGC-1α-induced cell proliferation and tumorigenesis, ACP-based
GeneFishing PCR was performed, and the band intensities between
PGC-1α-transfected HEK293 cells and empty vector-expressing HEK293
cells were compared. By densitometric analysis of amplified cDNA
fragments, one fragment showing >2-fold different intensities
between two cell lines was observed (Fig. 5A). The amplicon band was eluted
from agarose gel, re-amplified, and sequenced, and the sequences
were used in a BLAST search to identify their gene annotations.
BLAST analysis identified the ACBP.
To confirm the upregulated expression of ACBP in
PGC-1α-overexpressing HEK293 cells, real-time RT-PCR, immunoblot
analysis, and immunofluorescence staining were performed. As shown
in Fig. 5B and C, mRNA and protein
levels of ACBP were approximately 2.4- and 2-fold (mRNA) and 2.09-
and 1.99-fold (protein) higher in PGC-1α-HEK293 #1 and #3 cells,
respectively, than in wild-type HEK293 cells. In addition,
immunofluorescence staining showed that expression levels of ACBP
were increased in PGC-1α-overexpressing HEK293 cells and that most
of the ACBP was co-localized with PGC-1α (Fig. 5D). Furthermore, the expression of
ACBP was decreased in PGC-1α siRNA-transfected PGC-1α-HEK293 #1
cells based on western blot results (Fig. 6A). However, the expression of
PGC-1α was not affected by ACBP siRNA knockdown (Fig. 6A). Thus, these data indicate that
the expression of ACBP may be regulated by the activity of
PGC-1α.
Downregulation of ACBP leads to decreased
cell proliferation and increased sensitivity to
H2O2-induced apoptosis
The above-described findings indicated that ACBP
expression was regulated by PGC-1α. To examine the involvement of
ACBP in regulating cell proliferation by PGC-1α expression, ACBP
was downregulated in an ACBP siRNA knockdown experiment in
PGC-1α-transfected HEK293 cells and SNU-C4 cells. In
PGC-1α-transfected HEK293 and SNU-C4 cells, the endogenous
expression of ACBP was substantially reduced following transfection
with siRNA for ACBP (Fig. 6A);
whereas, the proliferation of ACBP siRNA-transfected PGC-1α-HEK293
#1 and SNU-C4 cells were significantly inhibited compared to
control PGC-1α-HEK293 #1 and SNU-C4 cells (Fig. 6B; 44 and 30% reductions,
respectively). However, protein levels of PGC-1α were not
downregulated in ACBP siRNA-transfected PGC-1α-HEK293 #1 and SNU-C4
cells (Fig. 6A).
In addition, to evaluate the role of ACBP in the
regulation of sensitivity to H2O2-induced
apoptosis, the extent of H2O2-induced
apoptosis and ROS level were measured in ACBP siRNA-transfected or
non-silencing siRNA-transfected PGC-1α-HEK293 #1 and SNU-C4 cells.
The extent of H2O2-induced apoptosis and ROS
level were significantly increased in ACBP siRNA-transfected
PGC-1α-HEK293 #1 and SNU-C4 cells compared to control PGC-1α-HEK293
#1 and SNU-C4 cells (Fig. 6C).
Expression of SOD and catalase was decreased by ACBP siRNA
knockdown in PGC-1α-HEK293 and SNU-C4 cells (Fig. 6A). These results indicate that ACBP
can protect PGC-1α-HEK293 #1 and SNU-C4 cells from oxidative stress
such as that mediated by H2O2. Increased
susceptibility to ROS-induced apoptosis may contribute to decreased
cell proliferation by ACBP siRNA knockdown in PGC-1α-HEK293 #1 and
SNU-C4 cells. The decreased cell proliferation and increased
sensitivity to H2O2-induced apoptosis by ACBP
knockdown is similar to that observed in PGC-1α siRNA-transfected
PGC-1α-HEK293 #1 and SNU-C4 cells. Thus, these results suggest that
PGC-1α knockdown downregulates cell proliferation and increases
H2O2-induced apoptosis of HEK293 and SNU-C4
cells through downregulation of ACBP.
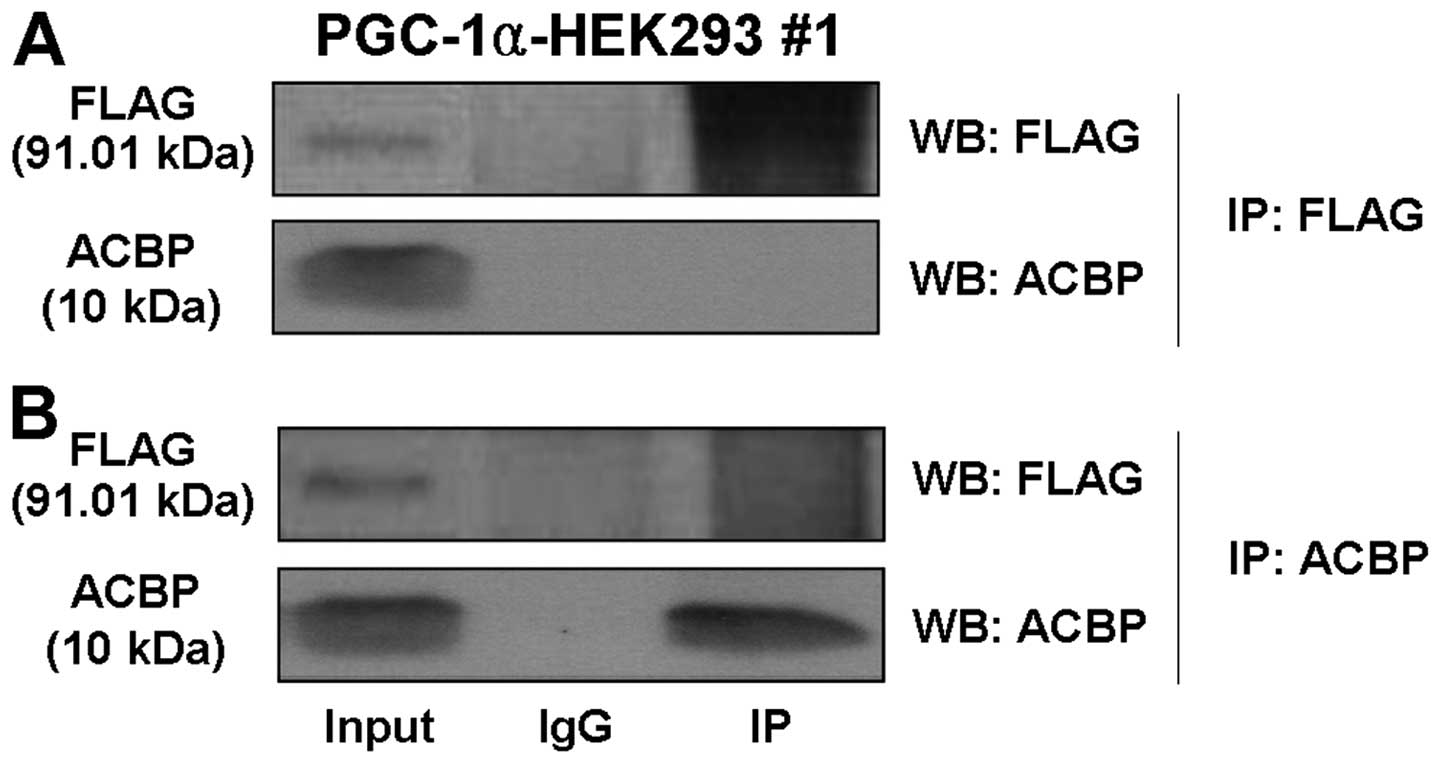
PGC-1α does not physically interact with
ACBP
The above results suggested that PGC-1α expression
influences ACBP expression, but interactions between PGC-1α and
ACBP have not previously been described. Thus, we tested the
possibility that PGC-1α can interact with ACBP. Using antibodies
against FLAG, we found that FLAG antibody did not immunoprecipitate
ACBP (Fig. 7A). Consistent with
this outcome, ACBP antibodies did not immunoprecipitate FLAG-PGC-1α
(Fig. 7B). These results indicate
that PGC-1α did not directly interact with ACBP.
Increased Sp1 expression may contribute
to increased ACBP expression by PGC-1α
The results described above showed that ACBP is a
target of PGC-1α; however, the mechanisms for its regulation by
PGC-1α are not clear. A previous report suggests that the promoter
of ACBP has an Sp1 binding site (27). Thus, we investigated whether PGC-1α
expression can influence the expression of Sp1. The results
indicated that the expression of Sp1 was significantly 3-fold
increased in PGC-1α-HEK293 #1 and #3 cells compared to wild-type
HEK293 cells (Fig. 8A). In
addition, PGC-1α siRNA transfection led to reduced expression of
Sp1 in PGC-1α-HEK293 #1 and SNU-C4 cells (Fig. 6A).
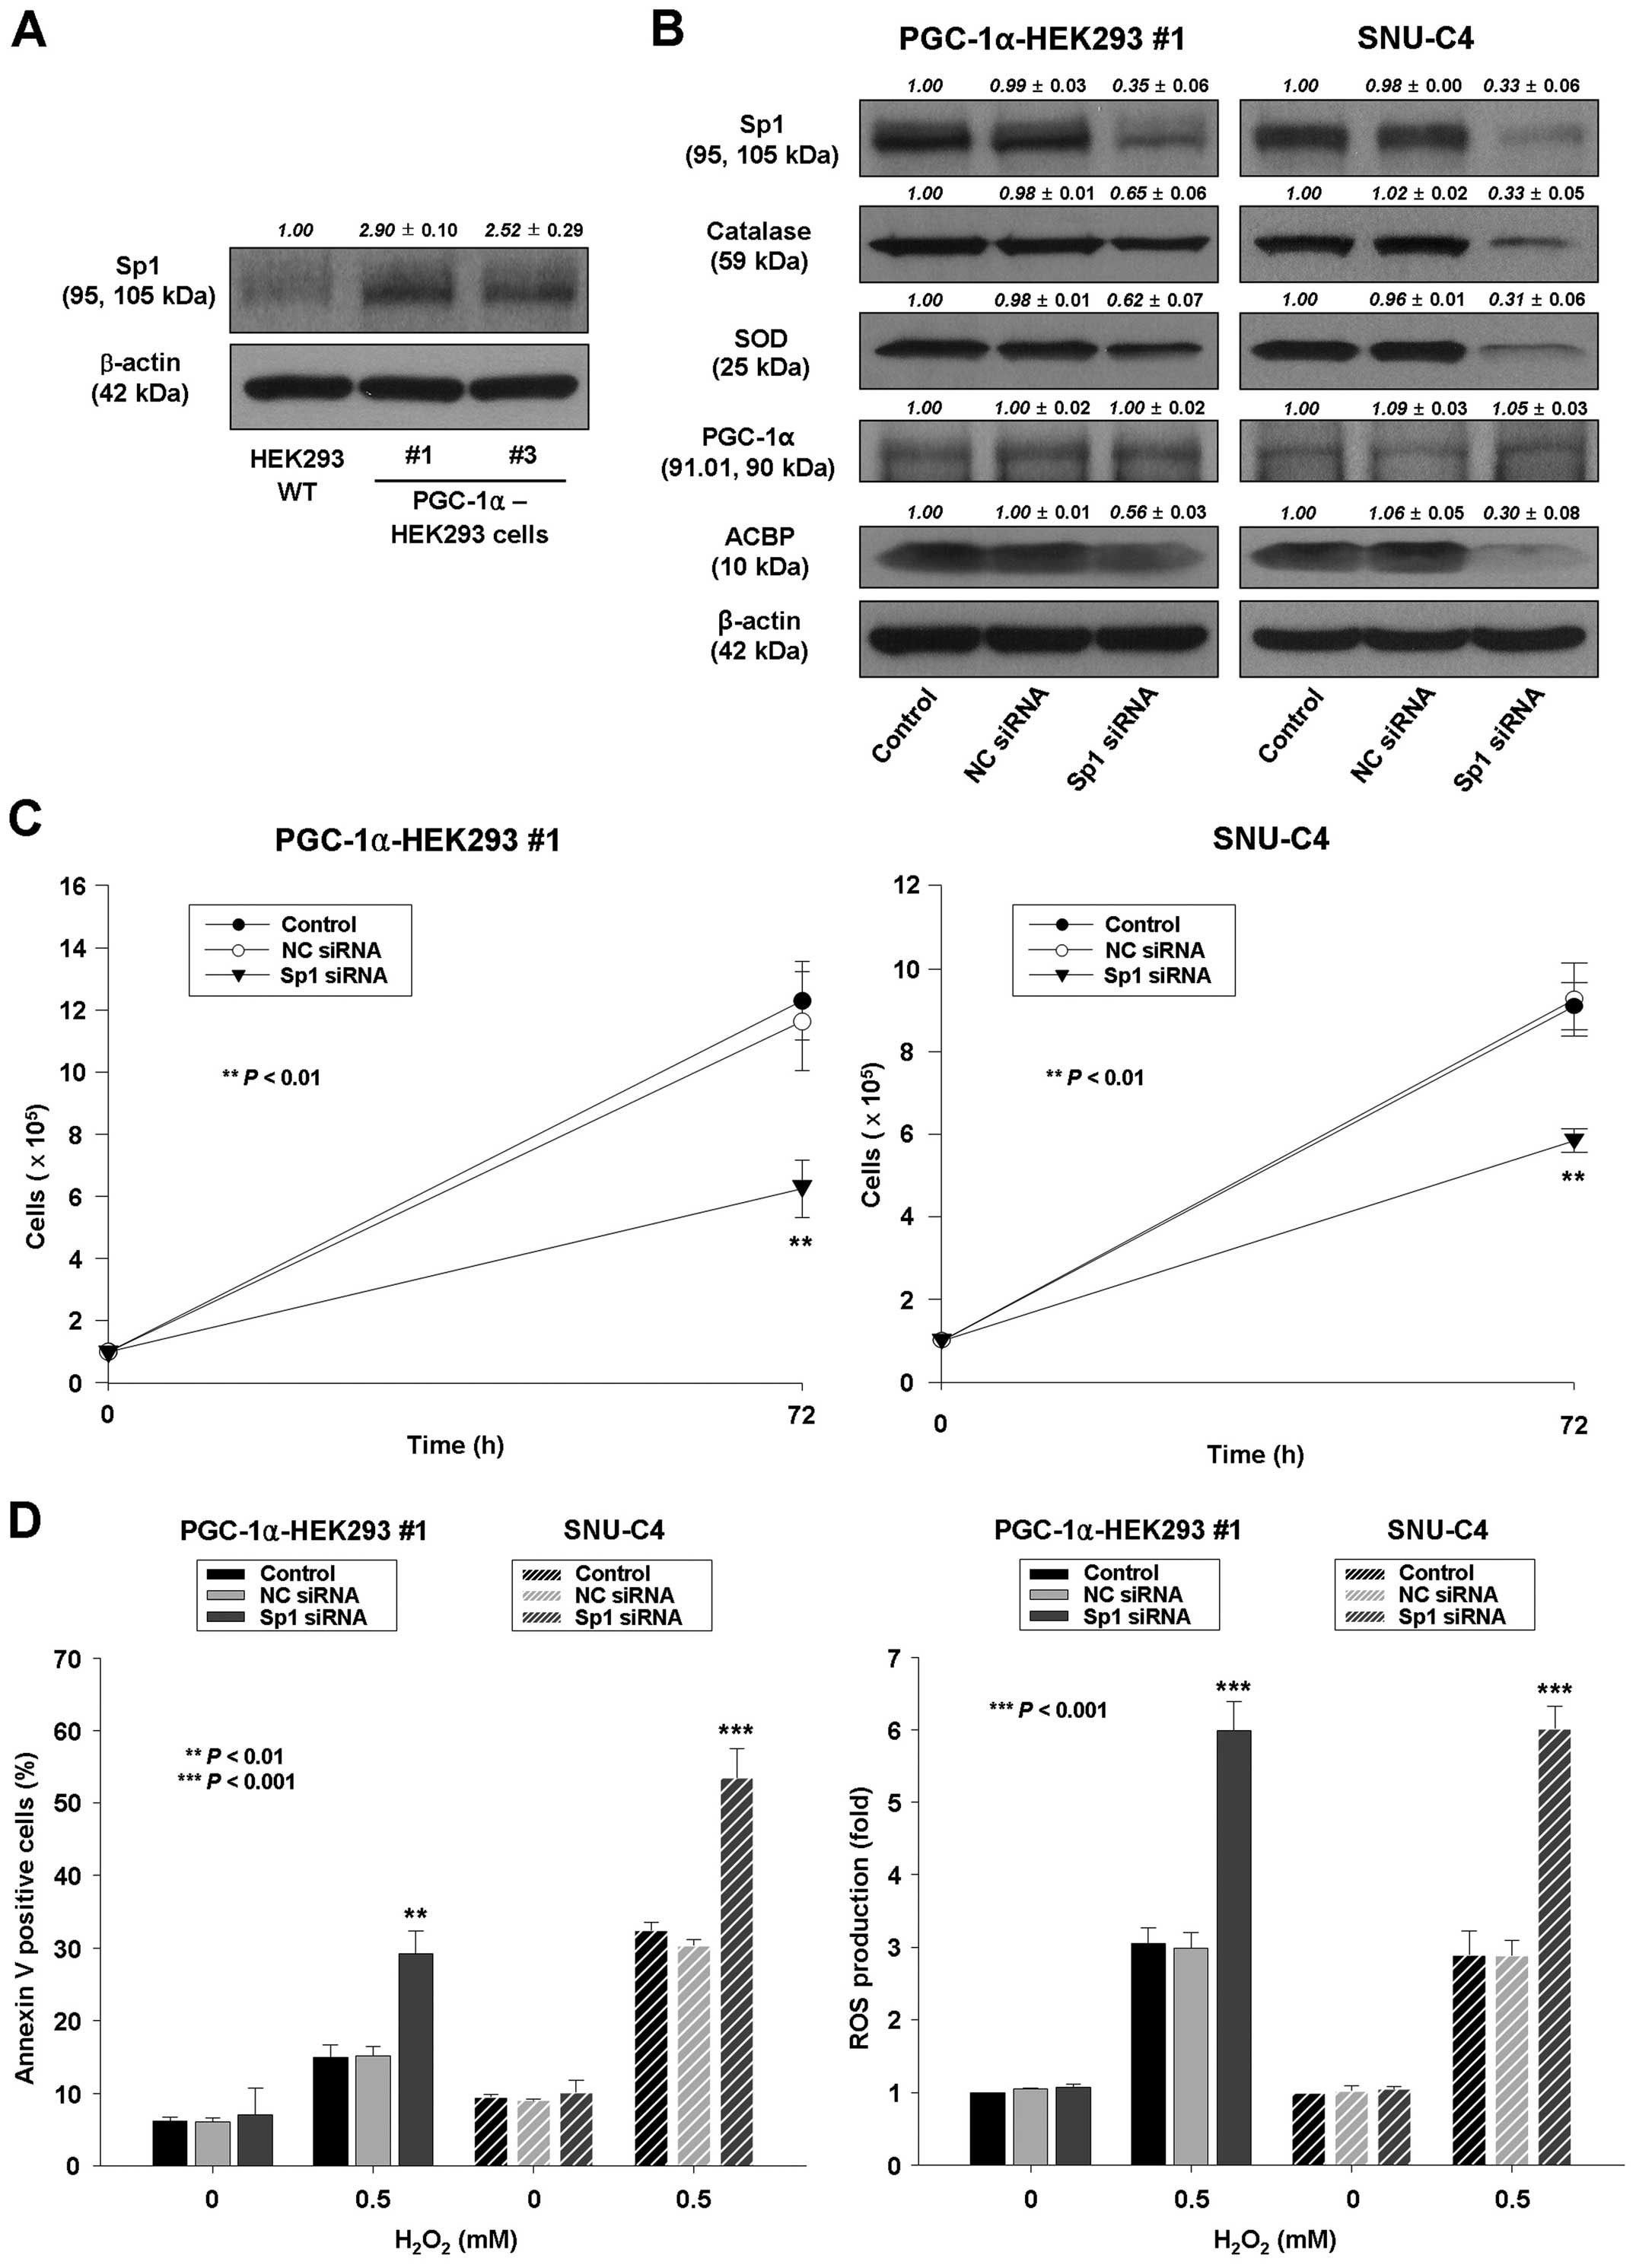 | Figure 8Increased Sp1 expression may
contribute to increased ACBP expression by PGC-1α. (A) Protein
levels of Sp1 in wild-type HEK293 and PGC-1α-HEK293 cells
(PGC-1α-HEK293 #1 and PGC-1α-HEK293 #3). β-actin was probed for
equal protein loading. Densitometry results are expressed as mean ±
SD above the bands. (B) PGC-1α-HEK293 #1 and SNU-C4 cells were
transiently transfected by Lipofectamine with no siRNA (control),
NC siRNA, or Sp1 siRNA. Protein lysates were prepared and subjected
to western blot analysis as described in Materials and methods
using corresponding antibodies. Equal protein loading was ensured
by demonstrating uniform β-actin expression. The blot is
representative of 3 separate experiments. Densitometry results are
expressed as mean ± SD above the bands. (C and D) PGC-1α-HEK293 #1
and SNU-C4 cells were transiently transfected by Lipofectamine with
no siRNA (control), NC siRNA, or Sp1 siRNA. (C) The transfected
cells were seeded and cultured for 72 h. The cell proliferation was
determined by cell counting. The data represent the mean ± SD of 3
independent experiments. **P<0.01, vs. control or NC
siRNA-transfected cells. (D) Left panel, after transfection, cells
were treated with 0.5 mM H2O2 for 24 h. The
percentage of apoptotic cells was determined by Annexin V-FITC/PI
staining as described in Materials and methods. Right panel, in
separate experiments, cells were treated with 0.5 mM
H2O2 for 24 h, after which they were labeled
with a carboxy-H2DCFDA, and ROS levels were quantified
by flow cytometry. The data represent the mean ± SD of three
independent experiments. **P<0.01,
***P<0.001, vs. control or NC siRNA-transfected
cells. |
The knockdown of Sp1 in PGC-1α-HEK293 #1 and SNU-C4
was confirmed by western blot analysis. The expression of Sp1 was
decreased in PGC-1α-HEK293 #1 and SNU-C4 cells (Fig. 8B). Knockdown of Sp1 resulted in
decreased cell proliferation, decreased expression of ACBP,
decreased expression of catalase and SOD, increased ROS production,
and increased H2O2-induced apoptosis in
PGC-1α-HEK293 #1 and SNU-C4 cells (Fig. 8B–D), which is similar to those
observed in PGC-1α siRNA-transfected PGC-1α-HEK293 #1 cells. Taken
together, these data suggest that the increased ACBP expression by
PGC-1α may be caused by increased Sp1 expression.
Discussion
In the present study, PGC-1α-overexpressing HEK293
and CT-26 cells were established, and PGC-1α expression was
confirmed by western blotting and immunofluorescence staining.
Overexpression of PGC-1α increased cell proliferation and greatly
enhanced tumorigenesis in a colony-forming assay and a Balb/c
immunodeficient mouse model, suggesting that PGC-1α may be involved
in the control of cell proliferation and tumorigenesis. In
addition, downregulation of PGC-1α led to decreased cell
proliferation in HT-29, SNU-C4, and PGC-1α-HEK293 cells. However,
the detailed molecular mechanisms for increased cell proliferation
and tumorigenesis by PGC-1α overexpression remain to be clarified,
and the role of PGC-1α in cancer has been controversial. Several
studies support that PGC-1α has antitumor activity because
decreased PGC-1α expression is related to cancer progression and
poor prognosis in breast cancer (16–18).
In addition, PGC-1α over-expression induces apoptosis of ovarian
cancer cells through the coordinated regulation of Bcl-2 and Bax
expression (19). In contrast,
several studies support that PGC-1α has tumor-promoting activity.
For example, PGC-1α protects cells from apoptosis in neuroblastoma
cells (20) and promotes cell
growth in prostate cancer cells (21). Increased cell proliferation and
tumorigenesis by PGC-1α overexpression observed in this study is
consistent with the findings that PGC-1α promotes cell growth in
prostate cancer cells and tumor growth (21,28).
Previous studies have suggested that ROS have dual
roles in cancer promotion (29) or
cancer suppression (30,31) in tumorigenesis. ROS generation is a
necessary step during apoptosis because ROS scavengers block or
delay apoptosis. PGC-1α induces antioxidant enzymes such as SOD and
catalase, resulting in reduced ROS levels in
H2O2-treated neuronal cells (10,20).
In this study, to confirm whether the increased expression of
PGC-1α can protect cells from ROS-induced cell death, the levels of
ROS and the extent of apoptosis during H2O2
treatment were assessed. We found that
H2O2-induced ROS production and apoptosis
were attenuated by PGC-1α expression. In addition, the extent of
H2O2-induced apoptosis and ROS level were
increased in PGC-1α siRNA-transfected PGC-1α-HEK293 and SNU-C4
cells. These results are similar to those showing that PGC-1α can
protect neuroblastoma cells from
H2O2-mediated cell death (20). Thus, the current findings suggest
that the decreased ROS-induced apoptosis might contribute to
enhanced cell proliferation by PGC-1α.
To identify the molecular targets for PGC-1α, DEGs
in control and PGC-1α-HEK293 cells were examined using the
GeneFishing DEG screening system. ACBP was found to be upregulated
in PGC-1α-overexpressing HEK293 cells. Furthermore, upregulated
ACBP expression was confirmed by real-time RT-PCR, western blotting
and immunofluorescence staining. In addition, PGC-1α siRNA
transfection led to downregulation of ACBP expression in
PGC-1α-HEK293 and SNU-C4 cells. However, the expression of PGC-1α
was not downregulated by ACBP siRNA transfection. These data
suggest that ACBP is a target of PGC-1α. This relationship between
PGC-1α and ACBP had not been reported previously. To confirm
whether PGC-1α enhances cell proliferation and tumorigenesis
through upregulation of ACBP, we performed ACBP siRNA knockdown
experiments in PGC-1α-HEK293 and SNU-C4 cells. ACBP knockdown
resulted in decreased cell proliferation, increased
H2O2-induced ROS production and apoptosis,
and reduced expression of catalase and SOD, which is similar to
outcomes for PGC-1α siRNA-transfected PGC-1α-HEK293 and SNU-C4
cells. Taken together, these data provide direct evidence that
PGC-1α enhances cell proliferation and tumorigenesis through
upregulation of ACBP.
ACBP is reported to play a role in a number of
important physiological and biochemical functions, such as
regulation of glucose-induced insulin secretion from pancreatic
β-cells (32,33), stimulation of steroidogenesis
through peripheral-type benzodiazepine receptor (PBR) (34–36),
and modulation of cell proliferation (37). ACBP/DBI, originally described as a
cytosolic protein and identified as stimulating the synthesis of
pregnenolone in mitochondrial fractions, enhances steroidogenesis
via PBRs. ACBP/DBI does so by promoting cholesterol delivery to the
inner mitochondrial membrane (38), which represents the
rate-determining step of steroid biosynthesis (39). Several lines of evidence indicate
that this ligand, which binds at PBRs, may be involved in the
regulation of cell growth and differentiation (40). In addition, serum cholesterol
levels and ACBP/DBI are significantly increased in patients with
hepatocellular carcinoma (41).
ACBP is localized throughout the cytosol and at organelles such as
the Golgi apparatus and endoplasmic reticulum (42) and the nucleus and the perinuclear
area (43). This study showed that
most of the ACBP was co-localized with PGC-1α. Thus, we also
examined whether PGC-1α directly interacts with ACBP by
co-immunoprecipitation; however, PGC-1α did not do so. We sought to
identify the molecular mechanism for increased expression of ACBP
by PGC-1α. Because a previous study suggested that the ACBP
promoter has an Sp1 binding site (27), we focused on the role of Sp1 in the
PGC-1α-ACBP axis, which may be involved in the regulation of cell
proliferation, using Sp1 siRNA transfection. Increased expression
of Sp1 might contribute to increased expression of ACBP by PGC-1α;
however, we did not examine the effect of Sp1 on the promoter
activity of ACBP in this study. We cannot exclude some role for
SREBP-1c, PPARα, or PPARγ in regulating cell proliferation by
PGC-1α because we did not examine their expression, which has been
reported to be involved in the regulation of ACBP. Further
investigations to clarify the detailed mechanisms for Sp1-induced
ACBP expression and increased Sp1 expression by PGC-1α are
needed.
Several groups have reported that Sp1 is
overexpressed in a variety of cancers and is highly correlated with
stage and poor prognosis of the cancers (44–46).
In the present study, we observed an increased expression of Sp1 in
PGC-1α-HEK293 #1 and #3 cells. In addition, Sp1 siRNA transfection
resulted in decreased cell proliferation, decreased ACBP
expression, decreased expression of catalase and SOD, and increased
H2O2-induced apoptosis, which are similar to
those of PGC-1α siRNA transfection in PGC-1α-HEK293 and SNU-C4
cells. Our data are consistent with previous reports that
inhibiting or knocking down Sp1 to normal cellular levels usually
decreases tumor formation, growth, and metastasis (47–49).
Previous studies also suggest that catalase and SOD gene
transcriptional regulation is highly dependent on Sp1 (50,51).
Even though we did not examine the promoter activity of catalase
and SOD by Sp1, our data support that the decreased expression of
Sp1 may contribute to reduced expression of catalase and SOD,
increased H2O2-induced ROS production, and
apoptosis. Taken together, we suggest hypothetical molecular
mechanisms for increased cell proliferation and tumorigenesis by
PGC-1α. In brief, the increased cell proliferation and
tumorigenesis by PGC-1α expression may be related to the
upregulation of ACBP through increased Sp1 expression; the
decreased cell proliferation by Sp1 or ACBP knockdown is similar to
that achieved by PGC-1α downregulation, and Sp1 or ACBP expression
is downregulated in the PGC-1α siRNA knockdown experiment.
In conclusion, the results of this study suggest
that PGC-1α overexpression upregulates proliferation of HEK293
cells through upregulation of ACBP by increased Sp1 expression.
Moreover, PGC-1α expression correlates with enhanced
tumor-igenesis. Further studies to clarify the molecular
interactions between PGC-1α and Sp1 are needed. The current
findings also suggest that PGC-1α may be a good candidate molecular
target for cancer therapeutics because PGC-1α expression is related
to enhanced cell proliferation and tumorigenesis.
Acknowledgements
This study was supported by the National Research
Foundation of Korea (NRF) Grant funded by the Korean Government
(Ministry of Education, Science and Technology)
(R13-2002-044-05002-0) and by the Basic Science Research Program
through the NRF funded by the Ministry of Education, Science and
Technology (NRF-2011-355-E00017).
References
|
1
|
Puigserver P, Wu ZD, Park CW, Graves R,
Wright M and Spiegelman BM: A cold-inducible coactivator of nuclear
receptors linked to adaptive thermogenesis. Cell. 92:829–839. 1998.
View Article : Google Scholar : PubMed/NCBI
|
|
2
|
Finck BN and Kelly DP: PGC-1 coactivators:
inducible regulators of energy metabolism in health and disease. J
Clin Invest. 116:615–622. 2006. View
Article : Google Scholar : PubMed/NCBI
|
|
3
|
Handschin C and Spiegelman BM: Peroxisome
proliferator-activated receptor γ coactivator 1 coactivators,
energy homeostasis, and metabolism. Endocr Rev. 27:728–735. 2006.
View Article : Google Scholar : PubMed/NCBI
|
|
4
|
Wu Z, Puigserver P, Andersson U, Zhang C,
Adelmant G, Mootha V, Troy A, Cinti S, Lowell B, Scarpulla RC and
Spiegelman BM: Mechanisms controlling mitochondrial biogenesis and
respiration through the thermogenic coactivator PGC-1. Cell.
98:115–124. 1999. View Article : Google Scholar : PubMed/NCBI
|
|
5
|
Vega RB, Huss JM and Kelly DP: The
coactivator PGC-1 cooperates with peroxisome proliferator-activated
receptor α in transcriptional control of nuclear genes encoding
mitochondrial fatty acid oxidation enzymes. Mol Cell Biol.
20:1868–1876. 2000. View Article : Google Scholar : PubMed/NCBI
|
|
6
|
Wang YX, Lee CH, Tiep S, Yu RT, Ham J,
Kang H and Evans RM: Peroxisome-proliferator-activated receptor δ
activates fat metabolism to prevent obesity. Cell. 113:159–170.
2003. View Article : Google Scholar : PubMed/NCBI
|
|
7
|
Herzig S, Long F, Jhala US, Hedrick S,
Quinn R, Bauer A, Rudolph D, Schutz G, Yoon C, Puigserver P,
Spiegelman B and Montminy M: CREB regulates hepatic gluconeogenesis
through the coactivator PGC-1. Nature. 413:179–183. 2001.
View Article : Google Scholar : PubMed/NCBI
|
|
8
|
Yoon JC, Puigserver P, Chen GX, Donovan J,
Wu ZD, Rhee J, Adelmant G, Stafford J, Kahn CR, Granner DK, Newgard
CB and Spiegelman BM: Control of hepatic gluconeogenesis through
the transcriptional coactivator PGC-1. Nature. 413:131–138. 2001.
View Article : Google Scholar : PubMed/NCBI
|
|
9
|
Lin J, Wu H, Tarr PT, Zhang CY, Wu Z, Boss
O, Michael LF, Puigserver P, Isotani E, Olson EN, Lowell BB,
Bassel-Duby R and Spiegelman BM: Transcriptional co-activator
PGC-1α drives the formation of slow-twitch muscle fibres. Nature.
418:797–801. 2002. View Article : Google Scholar : PubMed/NCBI
|
|
10
|
St-Pierre J, Drori S, Uldry M, Silvaggi
JM, Rhee J, Jäger S, Handschin C, Zheng K, Lin J, Yang W, Simon DK,
Bachoo R and Spiegelman BM: Suppression of reactive oxygen species
and neurodegeneration by the PGC-1 transcriptional coactivators.
Cell. 127:397–408. 2006. View Article : Google Scholar : PubMed/NCBI
|
|
11
|
Liu C, Li S, Liu T, Borjigin J and Lin JD:
Transcriptional coactivator PGC-1α integrates the mammalian clock
and energy metabolism. Nature. 447:477–481. 2007. View Article : Google Scholar : PubMed/NCBI
|
|
12
|
Knutti D, Kaul A and Kralli A: A
tissue-specific coactivator of steroid receptors, identified in a
functional genetic screen. Mol Cell Biol. 20:2411–2422. 2000.
View Article : Google Scholar : PubMed/NCBI
|
|
13
|
Tcherepanova I, Puigserver P, Norris JD,
Spiegelman BM and McDonnell DP: Modulation of estrogen receptor-α
transcriptional activity by the coactivator PGC-1. J Biol Chem.
275:16302–16308. 2000. View Article : Google Scholar : PubMed/NCBI
|
|
14
|
Delerive P, Wu YF, Burris TP, Chin WW and
Suen CS: PGC-1 functions as a transcriptional coactivator for the
retinoid X receptors. J Biol Chem. 277:3913–3917. 2002. View Article : Google Scholar
|
|
15
|
Schreiber SN, Knutti D, Brogli K, Uhlmann
T and Kralli A: The transcriptional coactivator PGC-1 regulates the
expression and activity of the orphan nuclear receptor
estrogen-related receptor α (ERRα). J Biol Chem. 278:9013–9018.
2003. View Article : Google Scholar : PubMed/NCBI
|
|
16
|
Jiang WG, Douglas-Jones A and Mansel RE:
Expression of peroxisome-proliferator activated receptor-γ (PPAR-γ)
and the PPARγ co-activator, PGC-1, in human breast cancer
correlates with clinical outcomes. Int J Cancer. 106:752–757. 2003.
View Article : Google Scholar : PubMed/NCBI
|
|
17
|
Watkins G, Douglas-Jones A, Mansel RE and
Jiang WG: The localisation and reduction of nuclear staining of
PPARγ and PGC-1 in human breast cancer. Oncol Rep. 12:483–488.
2004.PubMed/NCBI
|
|
18
|
Feilchenfeldt J, Bründler MA, Soravia C,
Tötsch M and Meier CA: Peroxisome proliferator-activated receptors
(PPARs) and associated transcription factors in colon cancer:
reduced expression of PPARγ-coactivator 1 (PGC-1). Cancer Lett.
203:25–33. 2004. View Article : Google Scholar
|
|
19
|
Zhang Y, Ba Y, Liu C, Sun G, Ding L, Gao
S, Hao J, Yu Z, Zhang J, Zen K, Tong Z, Xiang Y and Zhang CY:
PGC-1α induces apoptosis in human epithelial ovarian cancer cells
through a PPARγ-dependent pathway. Cell Res. 17:363–373. 2007.
View Article : Google Scholar : PubMed/NCBI
|
|
20
|
Cowell RM, Talati P, Blake KR,
Meador-Woodruff JH and Russell JW: Identification of novel targets
for PGC-1α and histone deacetylase inhibitors in neuroblastoma
cells. Biochem Biophys Res Commun. 379:578–582. 2009. View Article : Google Scholar : PubMed/NCBI
|
|
21
|
Shiota M, Yokomizo A, Tada Y, Inokuchi J,
Tatsugami K, Kuroiwa K, Uchiumi T, Fujimoto N, Seki N and Naito S:
Peroxisome proliferator-activated receptor γ coactivator-1α
interacts with the androgen receptor (AR) and promotes prostate
cancer cell growth by activating the AR. Mol Endocrinol.
24:114–127. 2010. View Article : Google Scholar
|
|
22
|
Kang W, Nielsen O, Fenger C, Leslie G,
Holmskov U and Reid KB: Induction of DMBT1 expression by reduced
ERK activity during a gastric mucosa differentiation-like process
and its association with human gastric cancer. Carcinogenesis.
26:1129–1137. 2005. View Article : Google Scholar : PubMed/NCBI
|
|
23
|
Kim YJ, Kwak CI, Gu YY, Hwang IT and Chun
JY: Annealing control primer system for identification of
differentially expressed genes on agarose gels. Biotechniques.
36:424–430. 2004.PubMed/NCBI
|
|
24
|
Shin SW, Seo CY, Han H, Han JY, Jeong JS,
Kwak JY and Park JI: 15d-PGJ2 induces apoptosis by
reactive oxygen species-mediated inactivation of Akt in leukemia
and colorectal cancer cells and shows in vivo antitumor activity.
Clin Cancer Res. 15:5414–5425. 2009. View Article : Google Scholar : PubMed/NCBI
|
|
25
|
Radkov SA, Kellam P and Boshoff C: The
latent nuclear antigen of Kaposi sarcoma-associated herpesvirus
targets the retinoblastoma-E2F pathway and with the oncogene H-ras
transforms primary rat cells. Nat Med. 6:1121–1127. 2000.
View Article : Google Scholar : PubMed/NCBI
|
|
26
|
Valle I, Alvarez-Barrientos A, Arza E,
Lamas S and Monsalve M: PGC-1α regulates the mitochondrial
antioxidant defense system in vascular endothelial cells.
Cardiovasc Res. 66:562–573. 2005. View Article : Google Scholar : PubMed/NCBI
|
|
27
|
Sandberg MB, Bloksgaard M, Duran-Sandoval
D, Duval C, Staels B and Mendrup S: The gene encoding
acyl-CoA-binding protein is subject to metabolic regulation by both
sterol regulatory element-binding protein and peroxisome
proliferator-activated receptor α in hepatocytes. J Biol Chem.
280:5258–5266. 2005. View Article : Google Scholar
|
|
28
|
Bhalla K, Hwang BJ, Dewi RE, Qu L, Twaddel
W, Fang H, Vafai SB, Vazquez F, Puigserver P, Boros L and Girrun
GD: PGC-1α promotes tumor growth by inducing gene expression
programs supporting lipogenesis. Cancer Res. 71:6888–6898. 2011.
View Article : Google Scholar : PubMed/NCBI
|
|
29
|
Diplock AT, Rice-Evans CA and Burdon RH:
Is there a significant role for lipid peroxidation in the causation
of malignancy and for antioxidants in cancer prevention? Cancer
Res. 54:1952–1965. 1994.
|
|
30
|
Lee JM: Inhibition of p53-dependent
apoptosis by the KIT tyrosine kinase: regulation of mitochondrial
permeability transition and reactive oxygen species generation.
Oncogene. 17:1653–1662. 1998. View Article : Google Scholar : PubMed/NCBI
|
|
31
|
Guha M, Bai W, Nadler JL and Natarajan R:
Molecular mechanisms of tumor necrosis factor gene expression in
monocytic cells via hyperglycemia-induced oxidant stress-dependent
and -independent pathways. J Biol Chem. 275:17728–17739. 2000.
View Article : Google Scholar : PubMed/NCBI
|
|
32
|
Borboni P, Condorelli L, De Stefanis P,
Sesti G and Lauro R: Modulation of insulin secretion by diazepam
binding inhibitor and its processing products. Neuropharmacology.
30:1399–1403. 1991. View Article : Google Scholar : PubMed/NCBI
|
|
33
|
Chen ZW, Agerberth B, Gell K, Andersson M,
Mutt V, Ostenson CG, Efendić S, Barros-Söderling J, Persson B and
Jörnvall H: Isolation and characterization of porcine
diazepam-binding inhibitor, a polypeptide not only of cerebral
occurrence but also common in intestinal tissues and with effects
on regulation of insulin release. Eur J Biochem. 174:239–245. 1998.
View Article : Google Scholar
|
|
34
|
Besman MJ, Yanagibashi K, Lee TD, Kawamura
M, Hall PF and Shively JE: Identification of
des-(Gly-Ile)-endozepine as an effector of corticotropin-dependent
adrenal steroidogenesis: stimulation of cholesterol delivery is
mediated by the peripheral benzodiazepine receptor. Proc Natl Acad
Sci USA. 86:4897–4901. 1989. View Article : Google Scholar : PubMed/NCBI
|
|
35
|
Boujrad N, Hudson JR Jr and Papadopoulos
V: Inhibition of hormone-stimulated steroidogenesis in cultured
Leydig tumor cells by a cholesterol-linked phosphorothioate
oligodeoxynucleotide antisense to diazepam-binding inhibitor. Proc
Natl Acad Sci USA. 90:5728–5731. 1993. View Article : Google Scholar : PubMed/NCBI
|
|
36
|
Papadopoulos V and Brown AS: Role of the
peripheral-type benzodiazepine receptor and the polypeptide
diazepam binding inhibitor in steroidogenesis. J Steroid Biochem
Mol Biol. 53:103–110. 1995. View Article : Google Scholar : PubMed/NCBI
|
|
37
|
Garnier M, Boujrad N, Oke BO, Brown AS,
Riond J, Ferrara P, Shoyab M, Suarez-Quian CA and Papadopoulos V:
Diazepam binding inhibitor is a paracrine/autocrine regulator of
Leydig cell proliferation and steroidogenesis: action via
peripheral-type benzodiazepine receptor and independent mechanisms.
Endocrinology. 132:444–458. 1993.PubMed/NCBI
|
|
38
|
Mukhin AG, Papadopoulos V, Costa E and
Krueger KE: Mitochondrial benzodiazepine receptors regulate steroid
biosynthesis. Proc Natl Acad Sci USA. 86:9813–9816. 1989.
View Article : Google Scholar : PubMed/NCBI
|
|
39
|
Papadopoulos V, Nowzari FB and Krueger KE:
Hormone-stimulated steroidogenesis is coupled to mitochondrial
benzodiazepine receptors. Tropic hormone action on steroid
biosynthesis is inhibited by flunitrazepam. J Biol Chem.
266:3682–3687. 1991.PubMed/NCBI
|
|
40
|
Alho H, Varga V and Krueger KE: Expression
of mitochondrial benzodiazepine receptor and its putative
endogenous ligand diazepam binding inhibitor in cultured primary
astrocytes and C-6 cells: relation to cell growth. Cell Growth
Differ. 5:1005–1014. 1994.PubMed/NCBI
|
|
41
|
Venturini I, Zeneroli ML, Corsi L, Baraldi
C, Ferrarese C, Pecora N, Frigo M, Alho H, Farina F and Baraldi M:
Diazepam binding inhibitor and total cholesterol plasma levels in
cirrhosis and hepatocellular carcinoma. Regul Pept. 74:31–34. 1998.
View Article : Google Scholar : PubMed/NCBI
|
|
42
|
Hansen JS, Faergeman NJ, Kragelund BB and
Knudsen J: Acyl-CoA-binding protein (ACBP) localizes to the
endoplasmic reticulum and Golgi in a ligand-dependent manner in
mammalian cells. Biochem J. 410:463–472. 2008. View Article : Google Scholar
|
|
43
|
Petrescu AD, Payne HR, Boedecker A, Chao
H, Hertz R, Bar-Tana J, Schroeder F and Kier AB: Physical and
functional interaction of Acyl-CoA-binding protein with hepatocyte
nuclear factor-4α. J Biol Chem. 278:1813–1824. 2003. View Article : Google Scholar
|
|
44
|
Wang L, Wei D, Huang S, Peng Z, Le X, Wu
TT, Yao J, Ajani J and Xie K: Transcription factor Sp1 expression
is a significant predictor of survival in human gastric cancer.
Clin Cancer Res. 9:6371–6380. 2003.PubMed/NCBI
|
|
45
|
Safe S and Abdelrahim M: Sp transcription
factor family and its role in cancer. Eur J Cancer. 41:2438–2448.
2005. View Article : Google Scholar : PubMed/NCBI
|
|
46
|
Yao JC, Wang L, Wei D, Gong W, Hassan M,
Wu TT, Mansfield P, Ajani J and Xie K: Association between
expression of transcription factor Sp1 and increased vascular
endothelial growth factor expression, advanced stage, and poor
survival in patients with resected gastric cancer. Clin Cancer Res.
10:4109–4117. 2003. View Article : Google Scholar
|
|
47
|
Yuan P, Wang L, Wei D, Zhang J, Jia Z, Li
Q, Le X, Wang H, Yao J and Xie K: Therapeutic inhibition of Sp1
expression in growing tumors by mithramycin A correlates directly
with potent antiangiogenic effects on human pancreatic cancer.
Cancer. 110:2682–2690. 2007. View Article : Google Scholar : PubMed/NCBI
|
|
48
|
Jiang Y, Wang L, Gong W, Wei D, Le X, Yao
J, Ajani J, Abbruzzese JL, Huang S and Xie K: A high expression
level of insulin-like growth factor 1 receptor is associated with
increased expression of transcription factor Sp1 and regional lymph
node metastasis of human gastric cancer. Clin Exp Metastasis.
21:755–764. 2004. View Article : Google Scholar
|
|
49
|
Lou Z, O’Reilly S, Liang H, Maher VM,
Sleight SD and McCormick JJ: Down-regulation of overexpressed sp1
protein in human fibrosarcoma cell lines inhibits tumor formation.
Cancer Res. 65:1007–1017. 2005.PubMed/NCBI
|
|
50
|
Nenoi M, Ichimura S, Mita K, Yukawa O and
Cartwright IL: Regulation of the catalase gene promoter by Sp1,
CCAAT-recognizing factors, and a WT1/Egr-related factor in hydrogen
peroxide-resistant HP 100 cells. Cancer Res. 61:5885–5894.
2001.PubMed/NCBI
|
|
51
|
Dhar SK, Xu Y, Chen Y and St Clair DK:
Specificity protein 1-dependent p53-mediated suppression of human
manganese superoxide dismutase gene expression. J Biol Chem.
281:21698–21709. 2006. View Article : Google Scholar : PubMed/NCBI
|