Introduction
Osteosarcoma (OS) is the most common primary sarcoma
of bone and the leading cause of cancer death among adolescents and
young adults (1). Most variants of
OS are extremely aggressive, and are characterized by their rapid
growth and early development of distant metastasis, mostly to the
lungs and bones. The 5-year survival rate of OS patients has
significantly improved over the past decades to ~60–70% since the
introduction of combinatorial chemotherapy (2). Despite attempts to further improve
the disease-free survival rates for patients responding poorly to
therapy by administering more intensive therapies, it has been
estimated that 30% of children diagnosed with OS do not survive
beyond 5 years and <50% live more than 10 years (3,4).
MicroRNAs (miRNAs) are evolutionarily conserved,
small, non-coding RNA molecules of ~22-nucleotides in length that
can specifically interact with the 3′-untranslated region (3′UTR)
of targeted messenger RNA (mRNA), inhibit mRNA translation, and
lead to mRNA cleavage and degradation. miRNAs have the potential to
regulate various critical biological processes (5). Several reports have suggested that
the deregulation of miRNA is a hallmark of cancer (6,7),
probably because miRNAs act as either tumor suppressors or
oncogenes that regulate tumor development, proliferation, invasion
and metastasis (8–11). Let-7 was first described in
Caenorhabditis elegans as a heterochronic switch gene
(12). The let-7 expression levels
were found to be lower in the lung cancer tissues than in the
normal lung tissues, and let-7 can prevent the cellular
proliferation via downregulation of oncogenes such as RAS,
HMGA2, MYC, DICER and LIN28 (13–16).
However, the role of let-7 in the proliferation of OS cells remains
unclear.
The E2F family of transcription factors is the
downstream effector of the retinoblastoma (Rb) protein pathway.
Eight E2F family members have been identified and divided into two
groups in cell cycle control: E2F1–3 function mainly as activators,
while E2F4 and E2F5 primarily act as repressors (17,18).
In addition, E2Fs modulate diverse cellular functions such as DNA
repair, differentiation and development (19,20).
E2F2 plays a central role in the regulation of G1/S transition and
cell cycle progression through the S phase, subsequently promoting
the cellular transformation (21).
Although several miRNAs have been found to target E2F2, including
let-7a, miR-17–92 cluster (22)
and miR-24 (23), the correlation
of E2F2 expression and miRNA in OS cells is completely unknown.
In the present study, we used a genome-wide
expression array to analyze both miRNAs and mRNAs in five human OS
cell lines and human mesenchymal stem cells (hMSCs). The expression
of let-7a was decreased, whereas that of E2F2 was increased in all
five OS cell lines compared with the hMSCs. Based on the inverse
correlation between let-7a and E2F2 expression, we hypothesize that
the effect of E2F2 in OS cells may be mediated, at least in part,
through let-7a expression. We aimed to assess whether the
expression of E2F2 is regulated by let-7a, and whether the pathway
plays a role in the tumorigenesis of OS cells.
Materials and methods
Cell lines
The human OS cell lines, HOS, SaOS and MG-63, were
obtained from RIKEN Cell Bank (Tsukuba, Japan), and NY and Hu09
were obtained from the Japanese Collection of Research Bioresources
Cell Bank (JCRB, Osaka, Japan). hMSCs were purchased from Takara
Biotechnology (Otsu, Japan). The genotype and phenotype of each
cell line was authenticated by the respective source company. HOS
cells were grown in minimal essential medium (MEM) supplemented
with 10% fetal bovine serum (FBS; Invitrogen, Grand Island, NY,
USA) and 0.1 mmol/l non-essential amino acids (NEAA). SaOS, MG-63
and NY cells were cultured in a high-glucose medium, Dulbecco’s
modified Eagle’s medium (DMEM; Invitrogen) supplemented with 10%
FBS and 1% penicillin and streptomycin. The Hu cells were cultured
in Roswell Park Memorial Institute medium (RPMI)-1640 (Invitrogen)
supplemented with 10% FBS. hMSCs were cultured with the Chemically
Defined Mesenchymal Stem Cell Basal Medium (MSCBM-CD) with MSCGM-CD
SingleQuots (Takara Biotechnology). The cells were maintained at
37°C under 5% CO2, and passaged every 2–3 days.
RNA isolation
mRNAs were prepared from the triplicated cell
cultures by using the RNeasy kit (Qiagen, Valencia, CA, USA)
according to the manufacturer’s instruction. The RNA quality was
assessed, before labeling, by using the RNA 6000 Nano kit and
Bioanalyzer 2100 (Agilent Technologies Inc., Santa Clara, CA,
USA).
Genome-wide miRNA expression
microarray
The GeneChip miRNA 3.0 array (Affymetrix, Santa
Clara, CA, USA) was used for miRNA expression profiling of five OS
cell lines and hMSCs. Small RNA (1 μg) including miRNA from each
sample was labeled with biotin using the FlashTag Biotin HSR kit
(Genisphere LLC, Hatfield, PA, USA). Array hybridization, washing,
and scanning of the slides were performed in accordance with the
manufacturer’s instructions. The data were extracted from the
images, quantile-normalized, summarized (median polish), and
log2-transformed with miRNA QC software (Affymetrix).
The GeneSpring GX 11.0 (Agilent Technologies) was used to analyze
the array results. Analysis of variance (ANOVA) was used to
determine the significant difference in the probe sets between the
two groups. The gene list was filtered with a fold-change cut-off
of 2, resulting in the output of list with genes that have
significant differential expression at ≥2-fold differences. Pathway
analysis was performed using the KEGG pathway database (http://www.genome.jp/kegg/pathway.html).
Analysis of mRNA expression by cDNA
arrays
The GeneChip Genome Human Genome U133 Plus 2.0 array
(Affymetrix) was used for mRNA expression profiling of five OS cell
lines and hMSCs. Biotinylated cRNA was synthesized from total RNA
by using the 3′ IVT Express kit (Affymetrix) according to the
manufacturer’s instructions. Briefly, double-stranded cDNA was
generated by reverse transcription from 1 ng of total RNA using an
oligo(dT) primer bearing a T7 promoter. The double-strand cDNA was
used as a template for in vitro transcription to generate
biotin-labeled cRNA. After fragmentation, 12.5 μg of cRNA were
hybridized to the GeneChip array for 16 h. The arrays were washed
and stained using the GeneChip Fluidics Station 450 (Affymetrix)
and then scanned with the GeneChip Scanner 3000 (Affymetrix). The
entire experiment was performed twice. Array hybridization,
washing, and scanning of the slides were performed according to the
manufacturer’s instructions. The microarray numerical values were
analyzed using the GeneSpring GX 11.0 software according to the
RAM16 Algorithm (12925520): quantile normalization, filter by flags
(detected), and filter by expression on the normalized data
(20.0–100.0th percentile). ANOVA was used to determine the
significant difference between the two groups. The gene list was
filtered to include genes showing at least a 2-fold change in
expression.
Target prediction of miRNAs
Basic Local Alignment Search Tool (BLAST) and
TargetScan 6.0 (microRNA.org) were used to search for
the predicted target genes of miRNAs.
Mature miRNA transfection
One day prior to transfection, the cells were seeded
onto 6-well plates (5×10⁴ cells/well) and incubated with
the complete medium without antibiotics (2 ml/well). The
transfection of let-7a-2-3p mimic or negative control (NC) miRNA
(Invitrogen) was performed using Lipofectamine 2000 (Invitrogen) in
antibiotic-free OptiMEM (Invitrogen) according to the
manufacturer’s instructions. After 48-h of incubation following
transfection, the cells were harvested and processed for further
analysis. The experiment were repeated three times.
Knockdown of E2F2 expression using
siRNA
siRNA oligo-nucleotides targeting E2F2 mRNA was
purchased from Ambion (Tokyo, Japan) and the Mission siRNA
Universal Negative Control was purchased from Sigma-Aldrich (Osaka,
Japan). siRNAs were transfected into MG63 and SaOS cells using
Lipofectamine 2000 according to the manufacturer’s instructions.
The cells were harvested 48 h after transfection and then subjected
to various analyses. The experiment was repeated three times.
Cell proliferation assay
The cells were plated into 6-well plates
(5×10⁴ cells/well) and transfected with or without
let-7a-2-3p mimic, NC miRNA or E2F2 siRNA. Next, the cells were
incubated in antibiotic-free Opti-MEM. After 48-h cultivation, the
cells were counted by using the TC10 Automated Cell Counter
(Bio-Rad Laboratories).
Western blot analysis
Total cellular protein (15 μg) was resolved on a
precast 10% Tris-HCl Criterion 10-well gel (Bio-Rad Laboratories)
at 200 V (300 mA) for 30 min. The gel was wet-transferred onto a
polyvinylidene difluoride (PVDF) membrane for 1 h and blocked with
phosphate-buffered saline (PBS) solution containing Tween-20 (PBST)
and 5% instant dry non-fat milk for 30 min at room temperature.
Polyclonal rabbit anti-human antibodies against E2F2 (ab65222) and
β-actin (ab16039) proteins were obtained from Abcam (Cambridge,
UK). The immunocomplexes were visualized using horseradish
peroxidase-conjugated anti-rabbit immunoglobulin G antibodies (GE
Healthcare, Tokyo, Japan) and the blots were developed by using the
ECL Plus system (GE Healthcare) attached with a ChemiDoc camera
(ImageQuant LAS 4000 mini; GE Healthcare). The quantification of
western blot signals was performed by the densitometry using
ImageQuant TL software (GE Healthcare). All experiments were
repeated at least three times.
Cell cycle analysis
For cell cycle analysis, the cells were stained with
propidium iodide using the Cycletest Plus DNA reagent kit (BD
Biosciences) according to the manufacturer’s instructions, and the
cell cycle distribution was analyzed by the FACSVerse flow
cytometer (BD Biosciences). The percentages of cells in the G0/G1,
S and G2/M phases were counted and compared. All experiments were
performed in triplicates.
Apoptosis assay
The changes in the expression of apoptotic proteins
were determined by western blot analysis using polyclonal rabbit
anti-human antibodies against PAR/poly (ADP-ribose) polymerase
(PARP) (#9542) and cleaved PARP (#9541) (Cell Signaling Technology,
Tokyo, Japan) as an index of apoptosis. The quantification of cell
death was determined by fluorescence-activated cell sorting (FACS)
using the Annexin V-FITC Apoptosis Detection kit (BD Biosciences)
according to the manufacturer’s instructions. Briefly,
1×10⁶ MG63 cells were seeded and incubated for 24 h,
then let-7a-2-3p mimic or siRNA for E2F2 was added to the cells and
incubated for 48 h. The cells were washed with PBS, suspended in
Annexin V binding buffer, added to an Annexin V-FITC/PI solution,
and incubated for 20 min at room temperature. The samples were
analyzed by the FACSVerse flow cytometer using FACSuite Analysis
software (BD Biosciences). The MG63 cells treated with doxorubicin
at 40 mg/ml for 20 h were used as a positive control for
apoptosis.
In vivo tumor-bearing nude mouse
model
The experimental metastasis model was established by
injecting 1×10⁶ cells transfected with let-7a miRNA
suspended in 100 ml of normal saline in the gluteal region of nude
mice. The mice were divided into three groups: i) untreated control
(n=7); ii) transfected with NC-miRNA (n=7); and ii) transfected
with let-7a miRNA mimic (n=7). All mice were fed with the standard
diet and their weight was monitored; the mice were sacrificed 6
weeks after cell inoculation. Tumor size in mice was measured in
two perpendicular dimensions parallel with the surface and the
depth of the tumor using a caliper. The tumor volume of the lung
nodule was estimated using the formula: π × long axis × short axis
× short axis)/6. All experiments were performed under the
guidelines for animal experiments as stipulated by the Oita
University Graduate School of Medical Science.
Statistical analysis
Statistical analysis was performed using SPSS 18.0
(SPSS Japan Inc., Tokyo, Japan). Two-tailed Student’s t-test was
used for the analysis of continuous variables. We determined the
differences among the three groups by using a non-repeated measures
ANOVA and Scheffe’s test. The results were expressed as the mean ±
standard deviation, and P<0.01 was considered statistically
significant.
Results
Downregulation of let-7a expression in
the OS cell lines
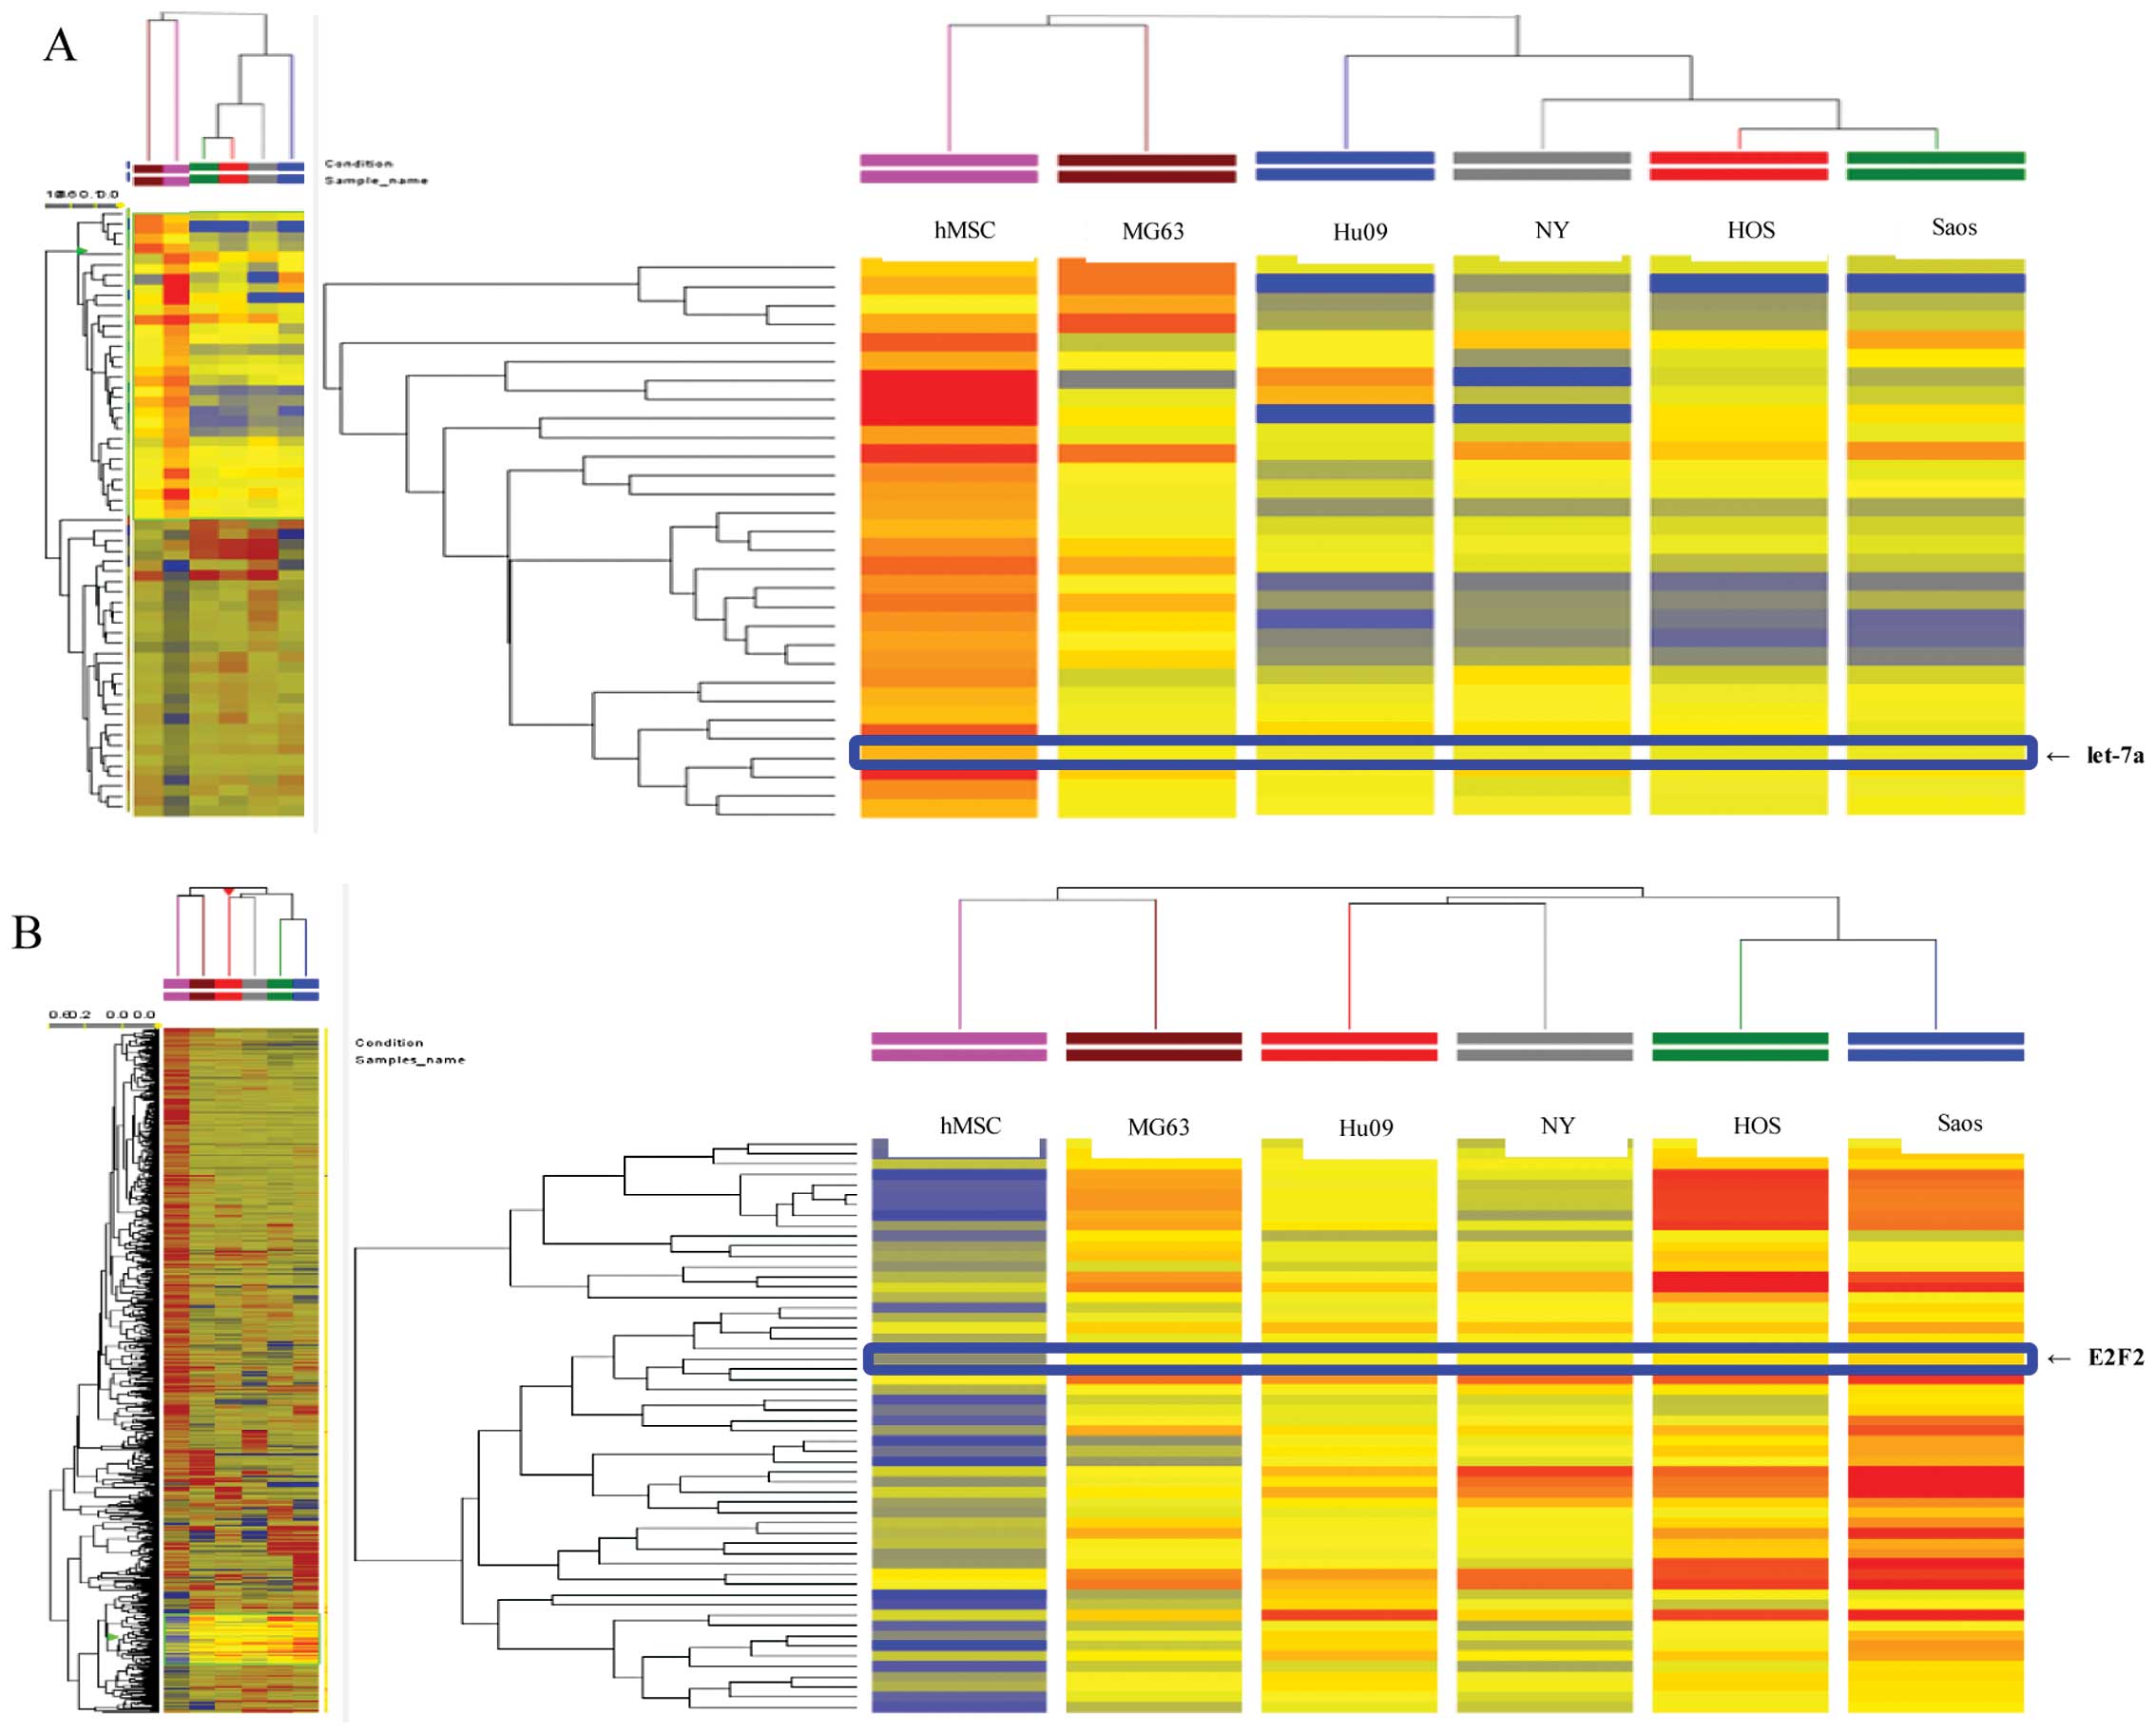
The genome-wide miRNA expression profiling of five
OS cell lines was performed to identify miRNAs specifically
expressed in the OS cells. The array analysis revealed that 435
miRNAs in the OS cells showed a >2.0-fold change in expression
compared with hMSCs (Fig. 1A).
Among 435 miRNAs, 186 were significantly upregulated, whereas 170
were significantly downregulated in all tested OS cells compared
with hMSCs. The remaining 79 miRNAs were upregulated or
downregulated among the five OS cell lines. The expression of
let-7a decreased by 11.25–21.68-fold in the OS cell lines compared
with hMSCs.
Upregulation of E2F2 expression in OS
cell lines
The cDNA array analysis demonstrated that the
expressions of 761 mRNAs were significantly changed between the
five OS cell lines and hMSCs (Fig.
1B). We found that 123 genes were significantly upregulated,
562 genes were significantly downregulated, and the remaining 194
genes were upregulated or downregulated in the five OS cell lines
compared with hMSCs. Furthermore, the expression of E2F2 was
increased by 2.36–4.27-fold in all five OS cell lines compared with
the hMSCs.
Let-7a has several predictive binding
sites in the 3′UTR of E2F2
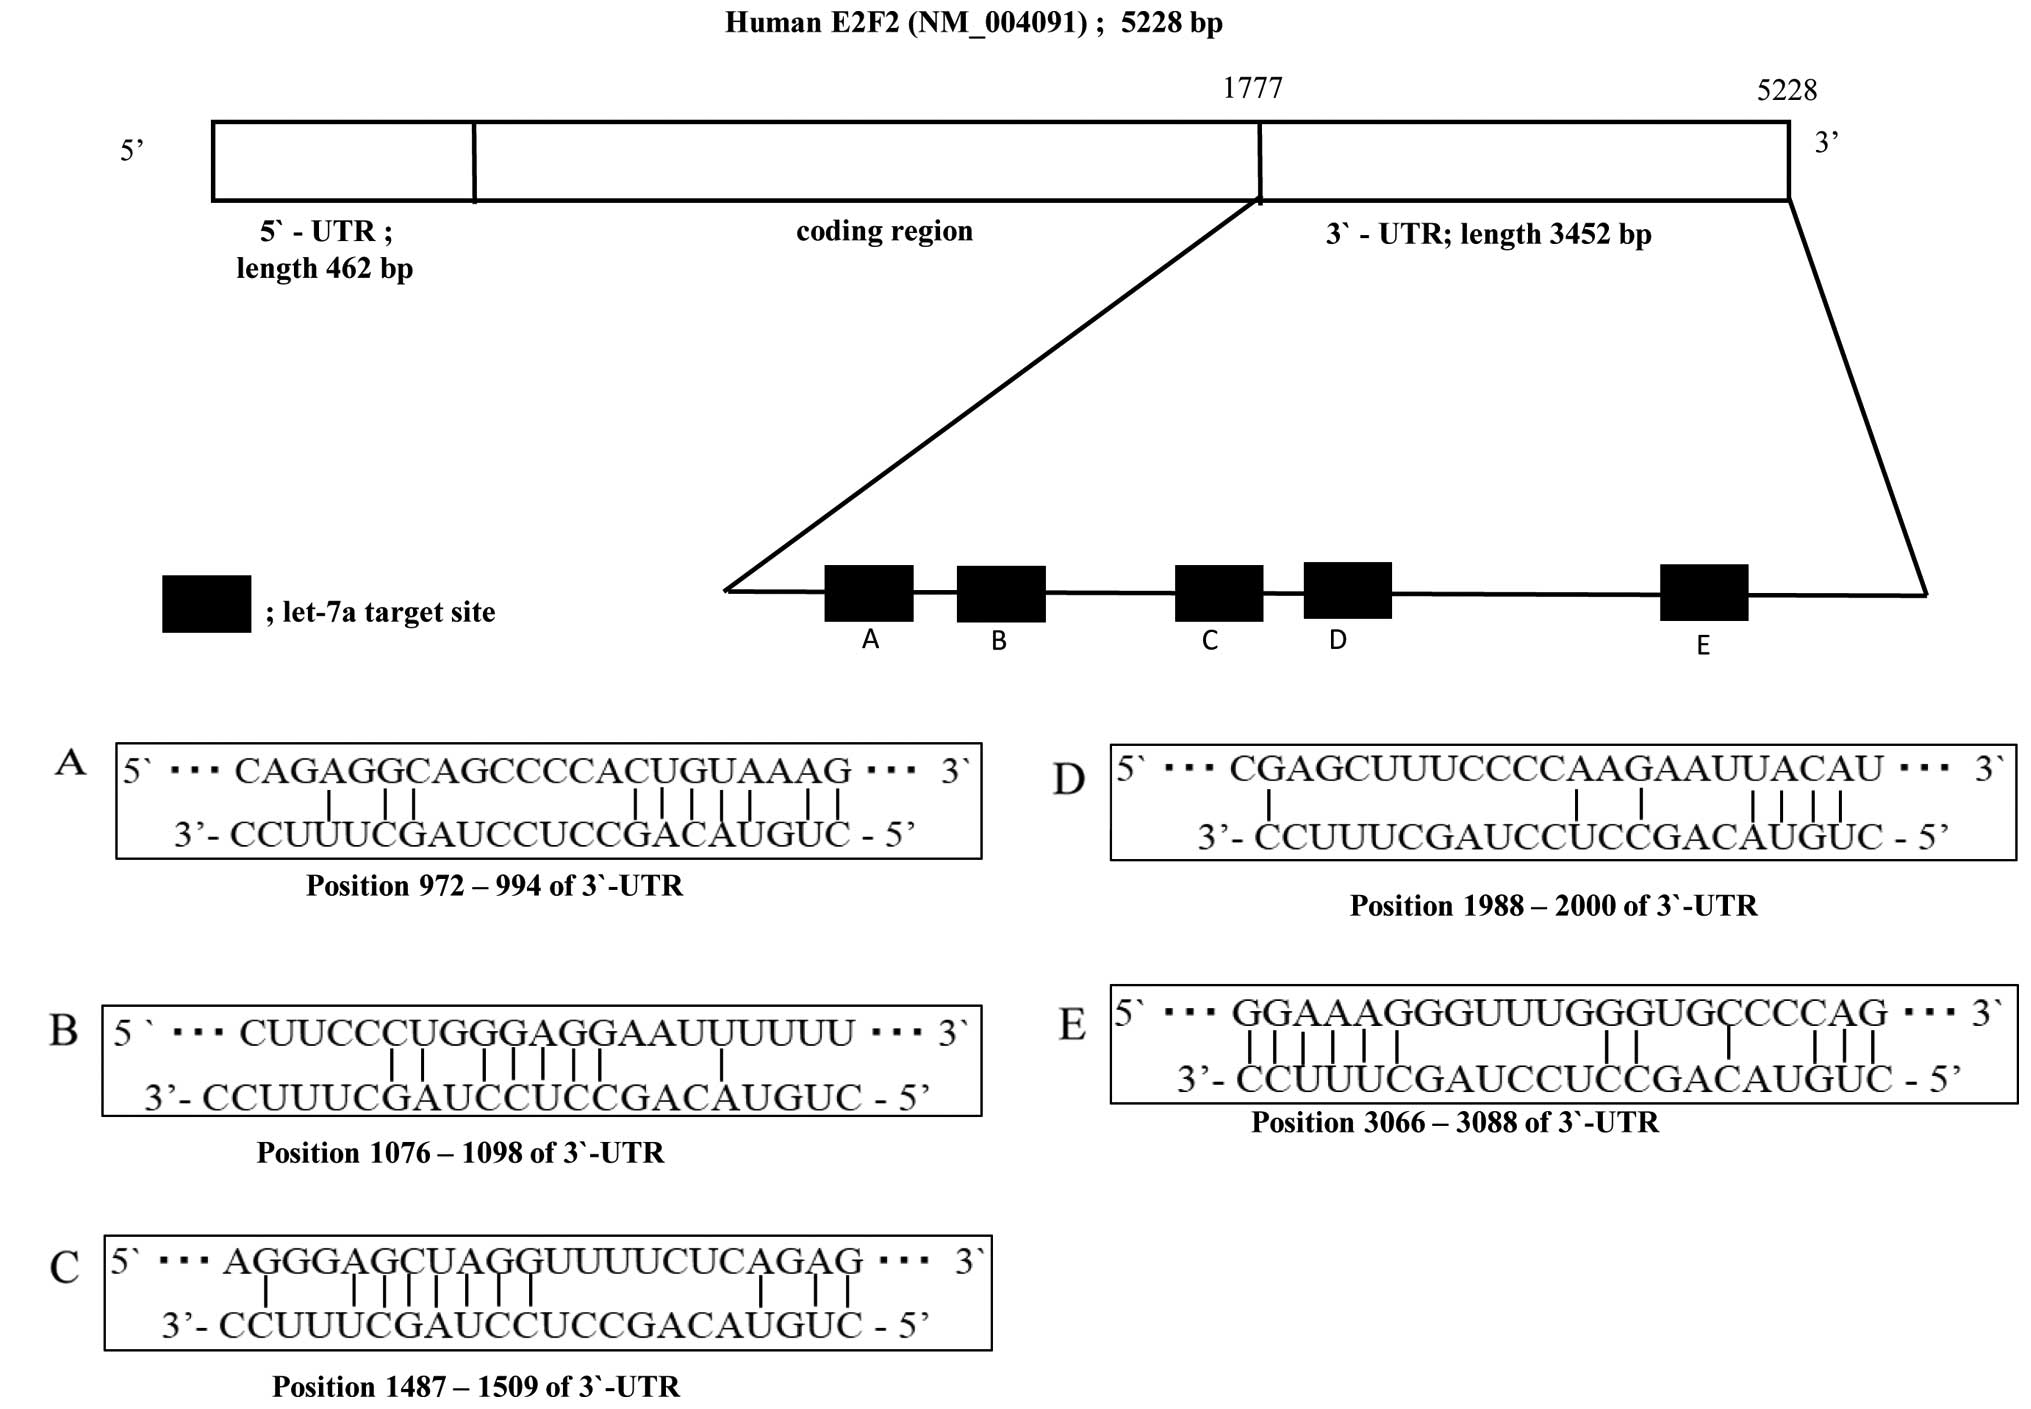
A considerable complementarity between sequences
within the seed regions of let-7a-2-star and sequences in the 3′UTR
of E2F2 was identified, using the algorithms in BLAST and
TargetScan. The results suggested that let-7a might affect the
expression of E2F2 genes by binding to 3′UTRs of E2F2. The analysis
predicted that the targeting region of E2F2 3′UTR binding
hsa-let-7a-2-star is at position 972–994 (Fig. 2A), 1076–1098 (Fig. 2B), 1487–1509 (Fig. 2C), 1988–2000 (Fig. 2D) and 3066–3088 (Fig. 2E).
Inhibition of E2F2 expression by let-7a
miRNA and E2F2 siRNA
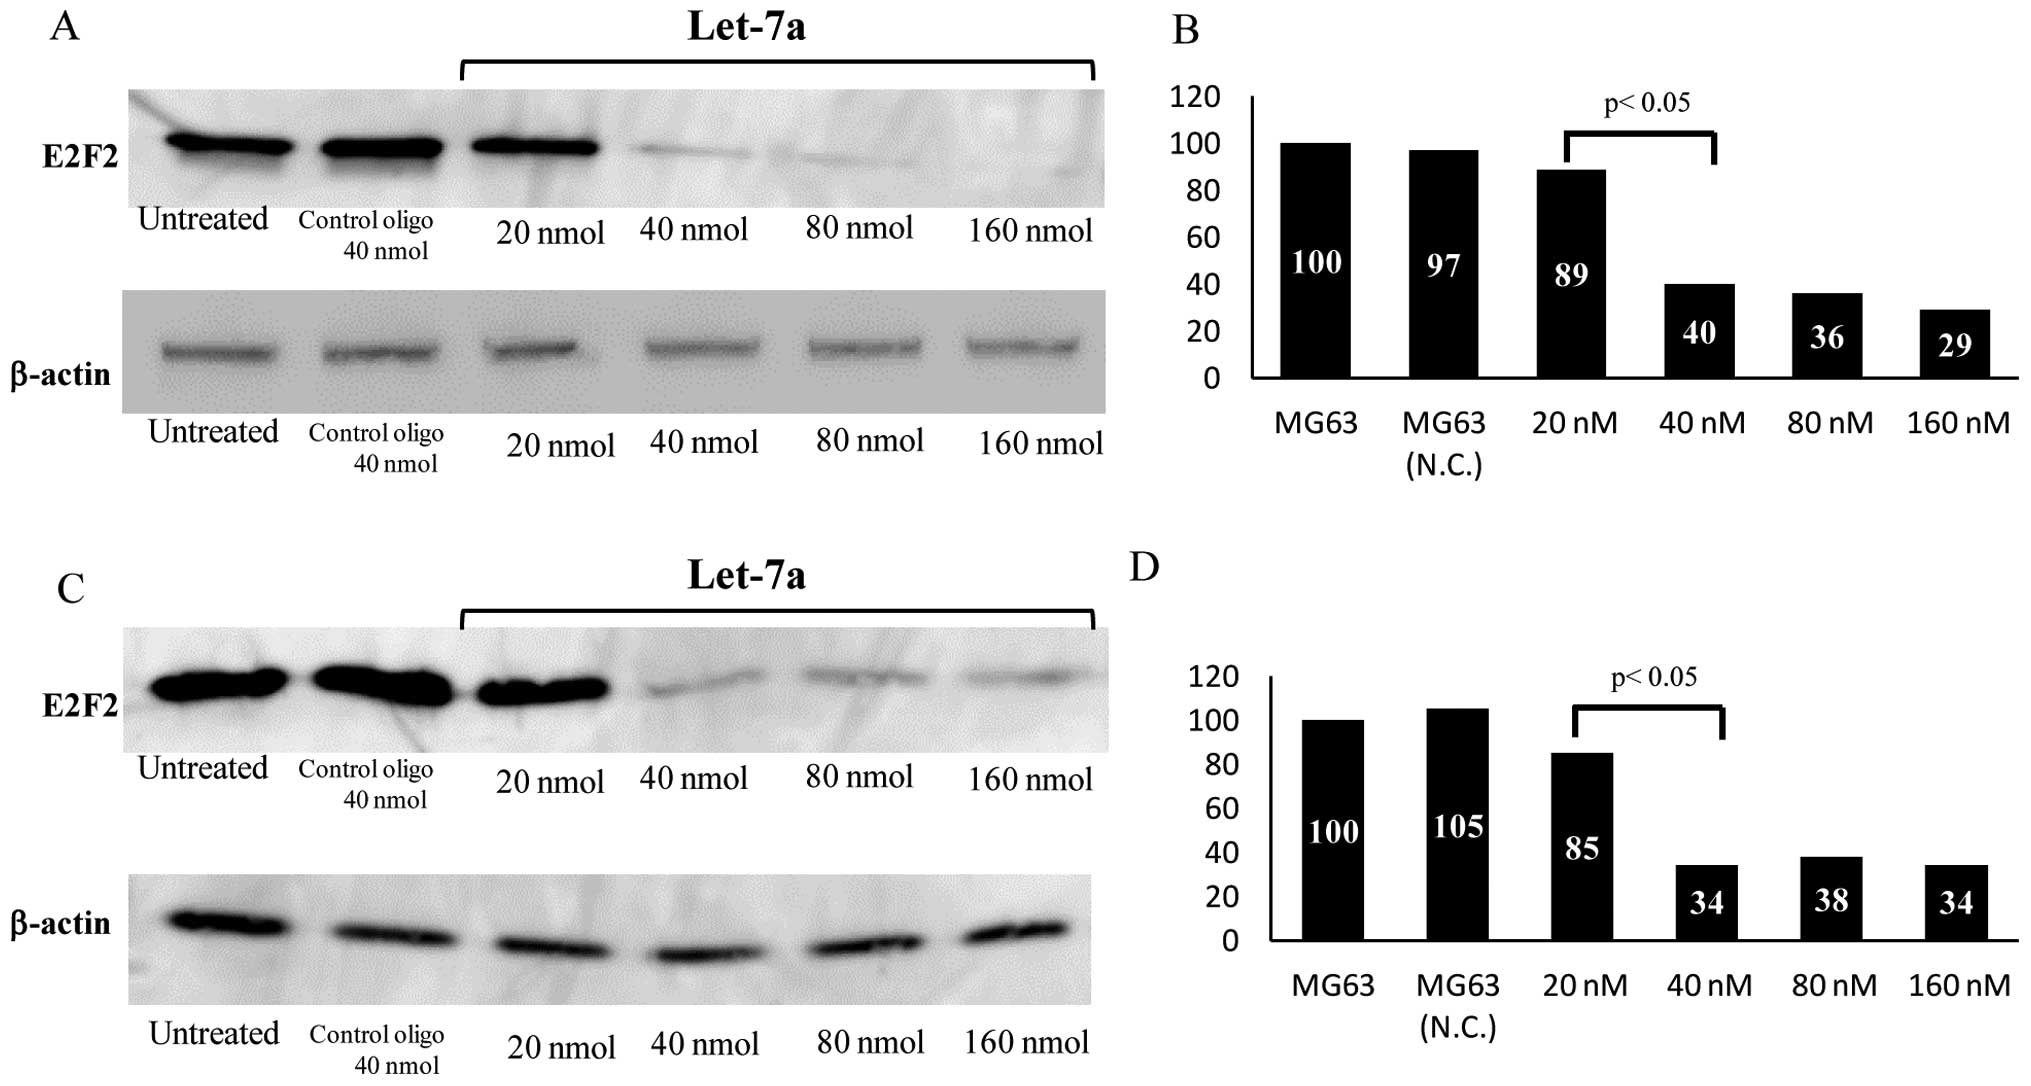
To examine the correlation between let-7a and E2F2
in the OS cells, let-7a miRNA was transfected into the MG63 cells.
Western blot analysis revealed that the expression levels of E2F2
dramatically decreased in the let-7a-transfected cells compared
with untreated or NC oligo-transfected cells (Fig. 3A). The protein expression levels of
E2F2 in the let-7a-transfected (40 nM) cells were reduced to 40% of
that in the control cells (P<0.01) (Fig. 3B). To further confirm the effects
of E2F2 on the growth of OS cells, transfection with siRNA
targeting E2F2 was performed. Although the expression level of E2F2
protein in the cells transfected with NC siRNA was not
significantly affected, the level in the cells transfected with
E2F2 siRNA was significantly reduced, as determined by western
blotting (Fig. 3C). Compared to
the control cells (100%), E2F2 siRNA (40 nM)-transfected cells
exhibited 34% lower E2F2 expression level (P<0.01) (Fig. 3D).
Suppression of OS cell growth by
transfection of let-7a miRNA and E2F2 siRNA
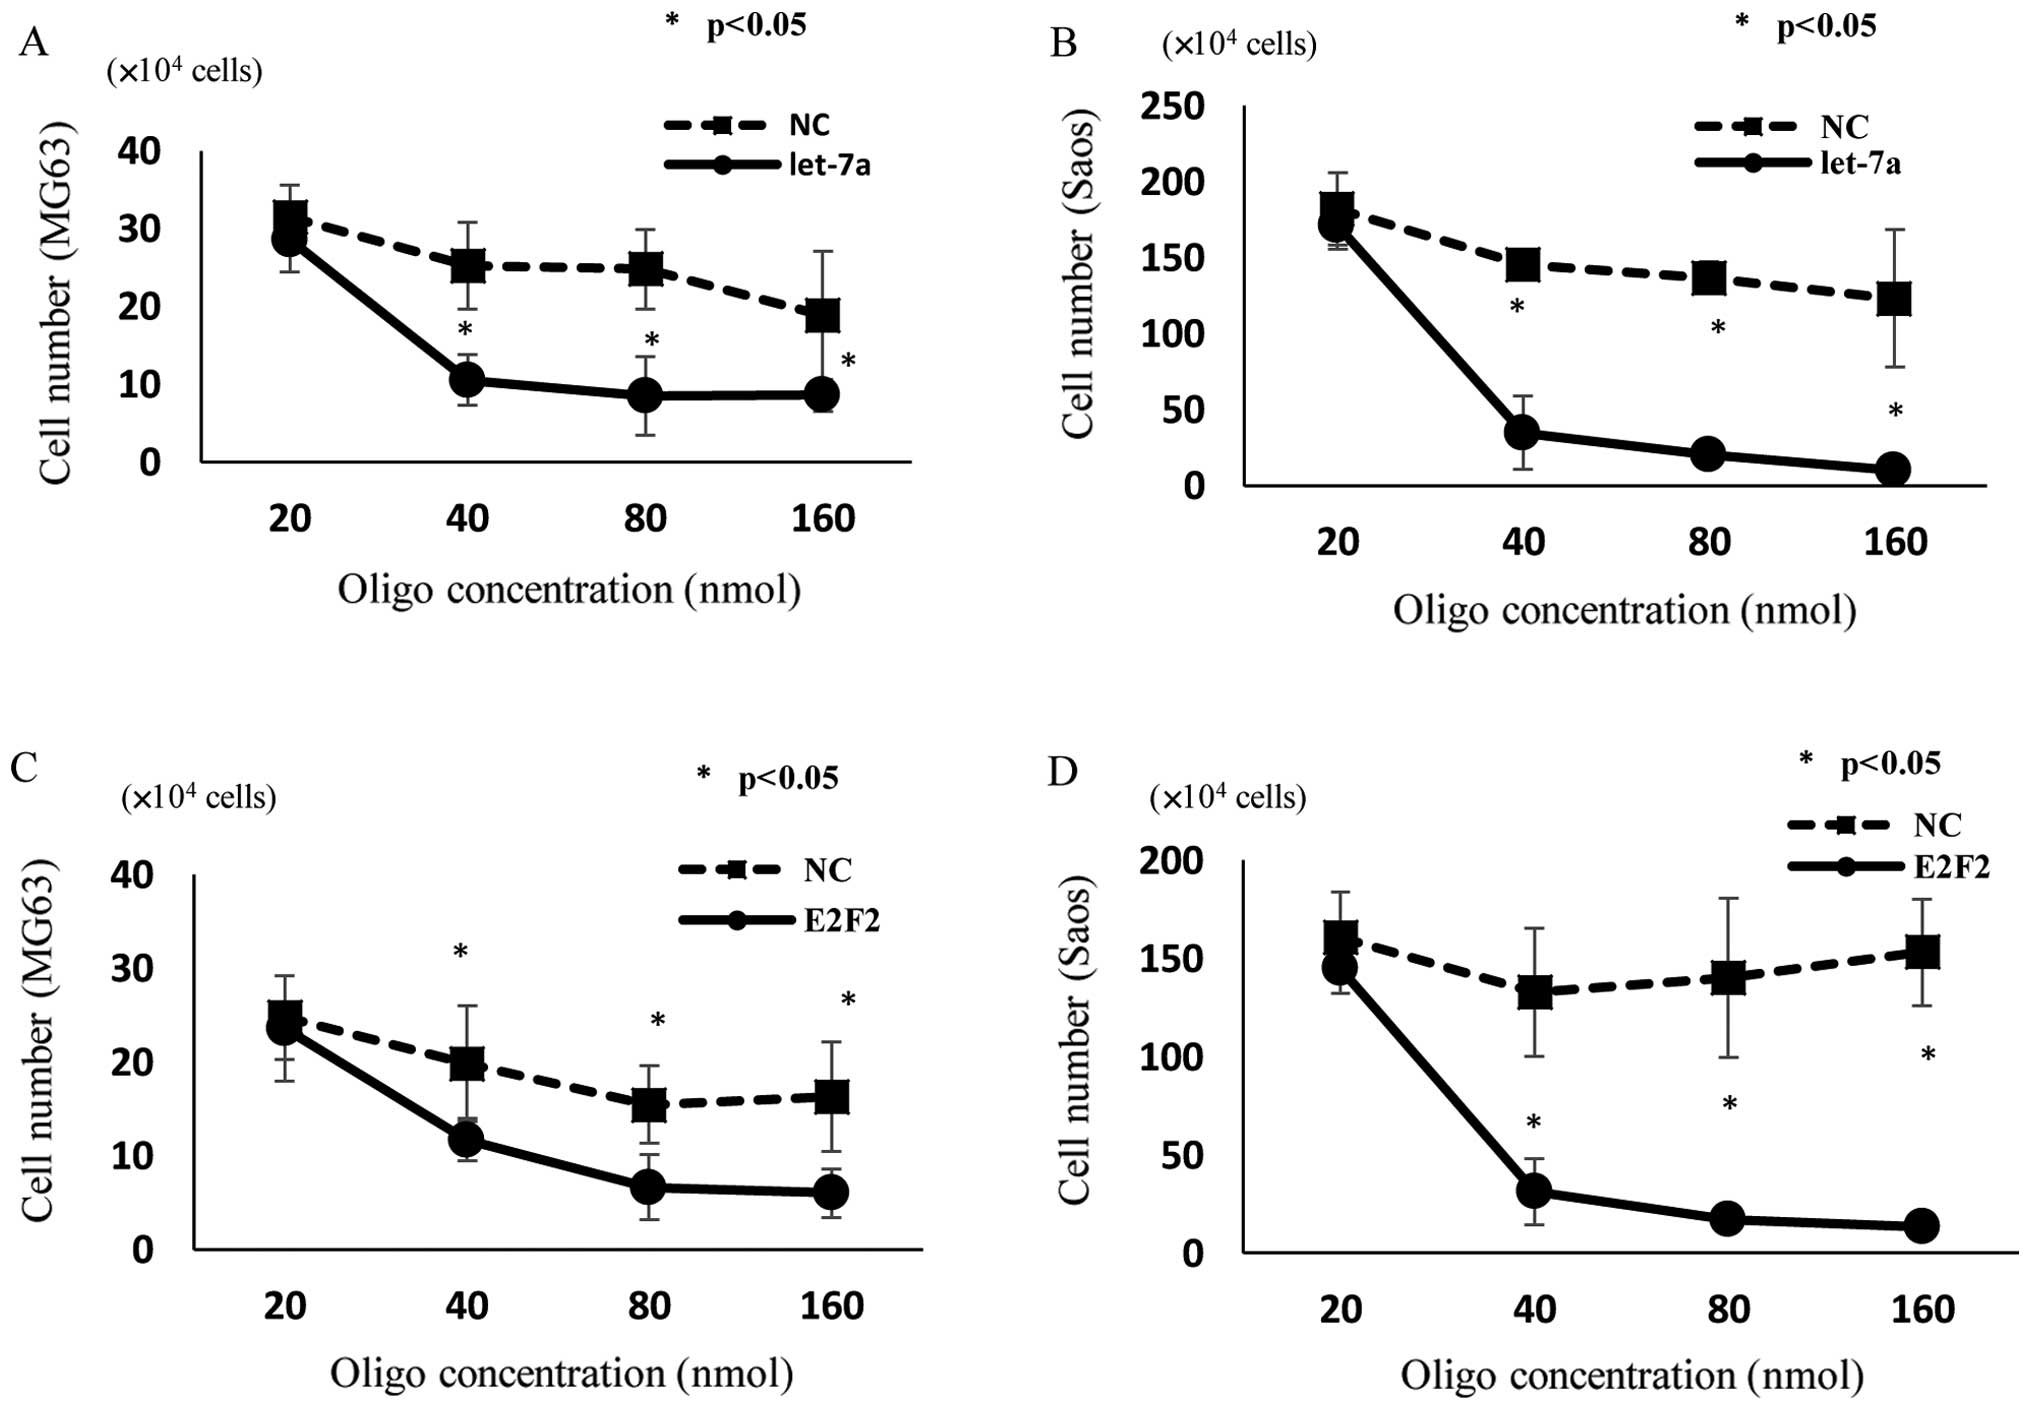
E2F2 is known to play important roles in the
regulation of cell proliferation. Since the transfection of let-7a
resulted in the reduction of E2F2 expression, we next examined the
effects of let-7a on the proliferation of OS cells. The cell growth
of MG63 (Fig. 4A) and Saos
(Fig. 4B) was inhibited by
transfection of let-7a, as determined by cell counting in
comparison with untreated and NC-miRNA-transfected cells 48 h after
transfection. Like let-7a miRNA-transfected cells, E2F2
siRNA-transfected MG63 (Fig. 4C)
and Saos (Fig. 4D) cells showed
significant inhibition of cell proliferation compared with
untreated and NC siRNA-transfected cells.
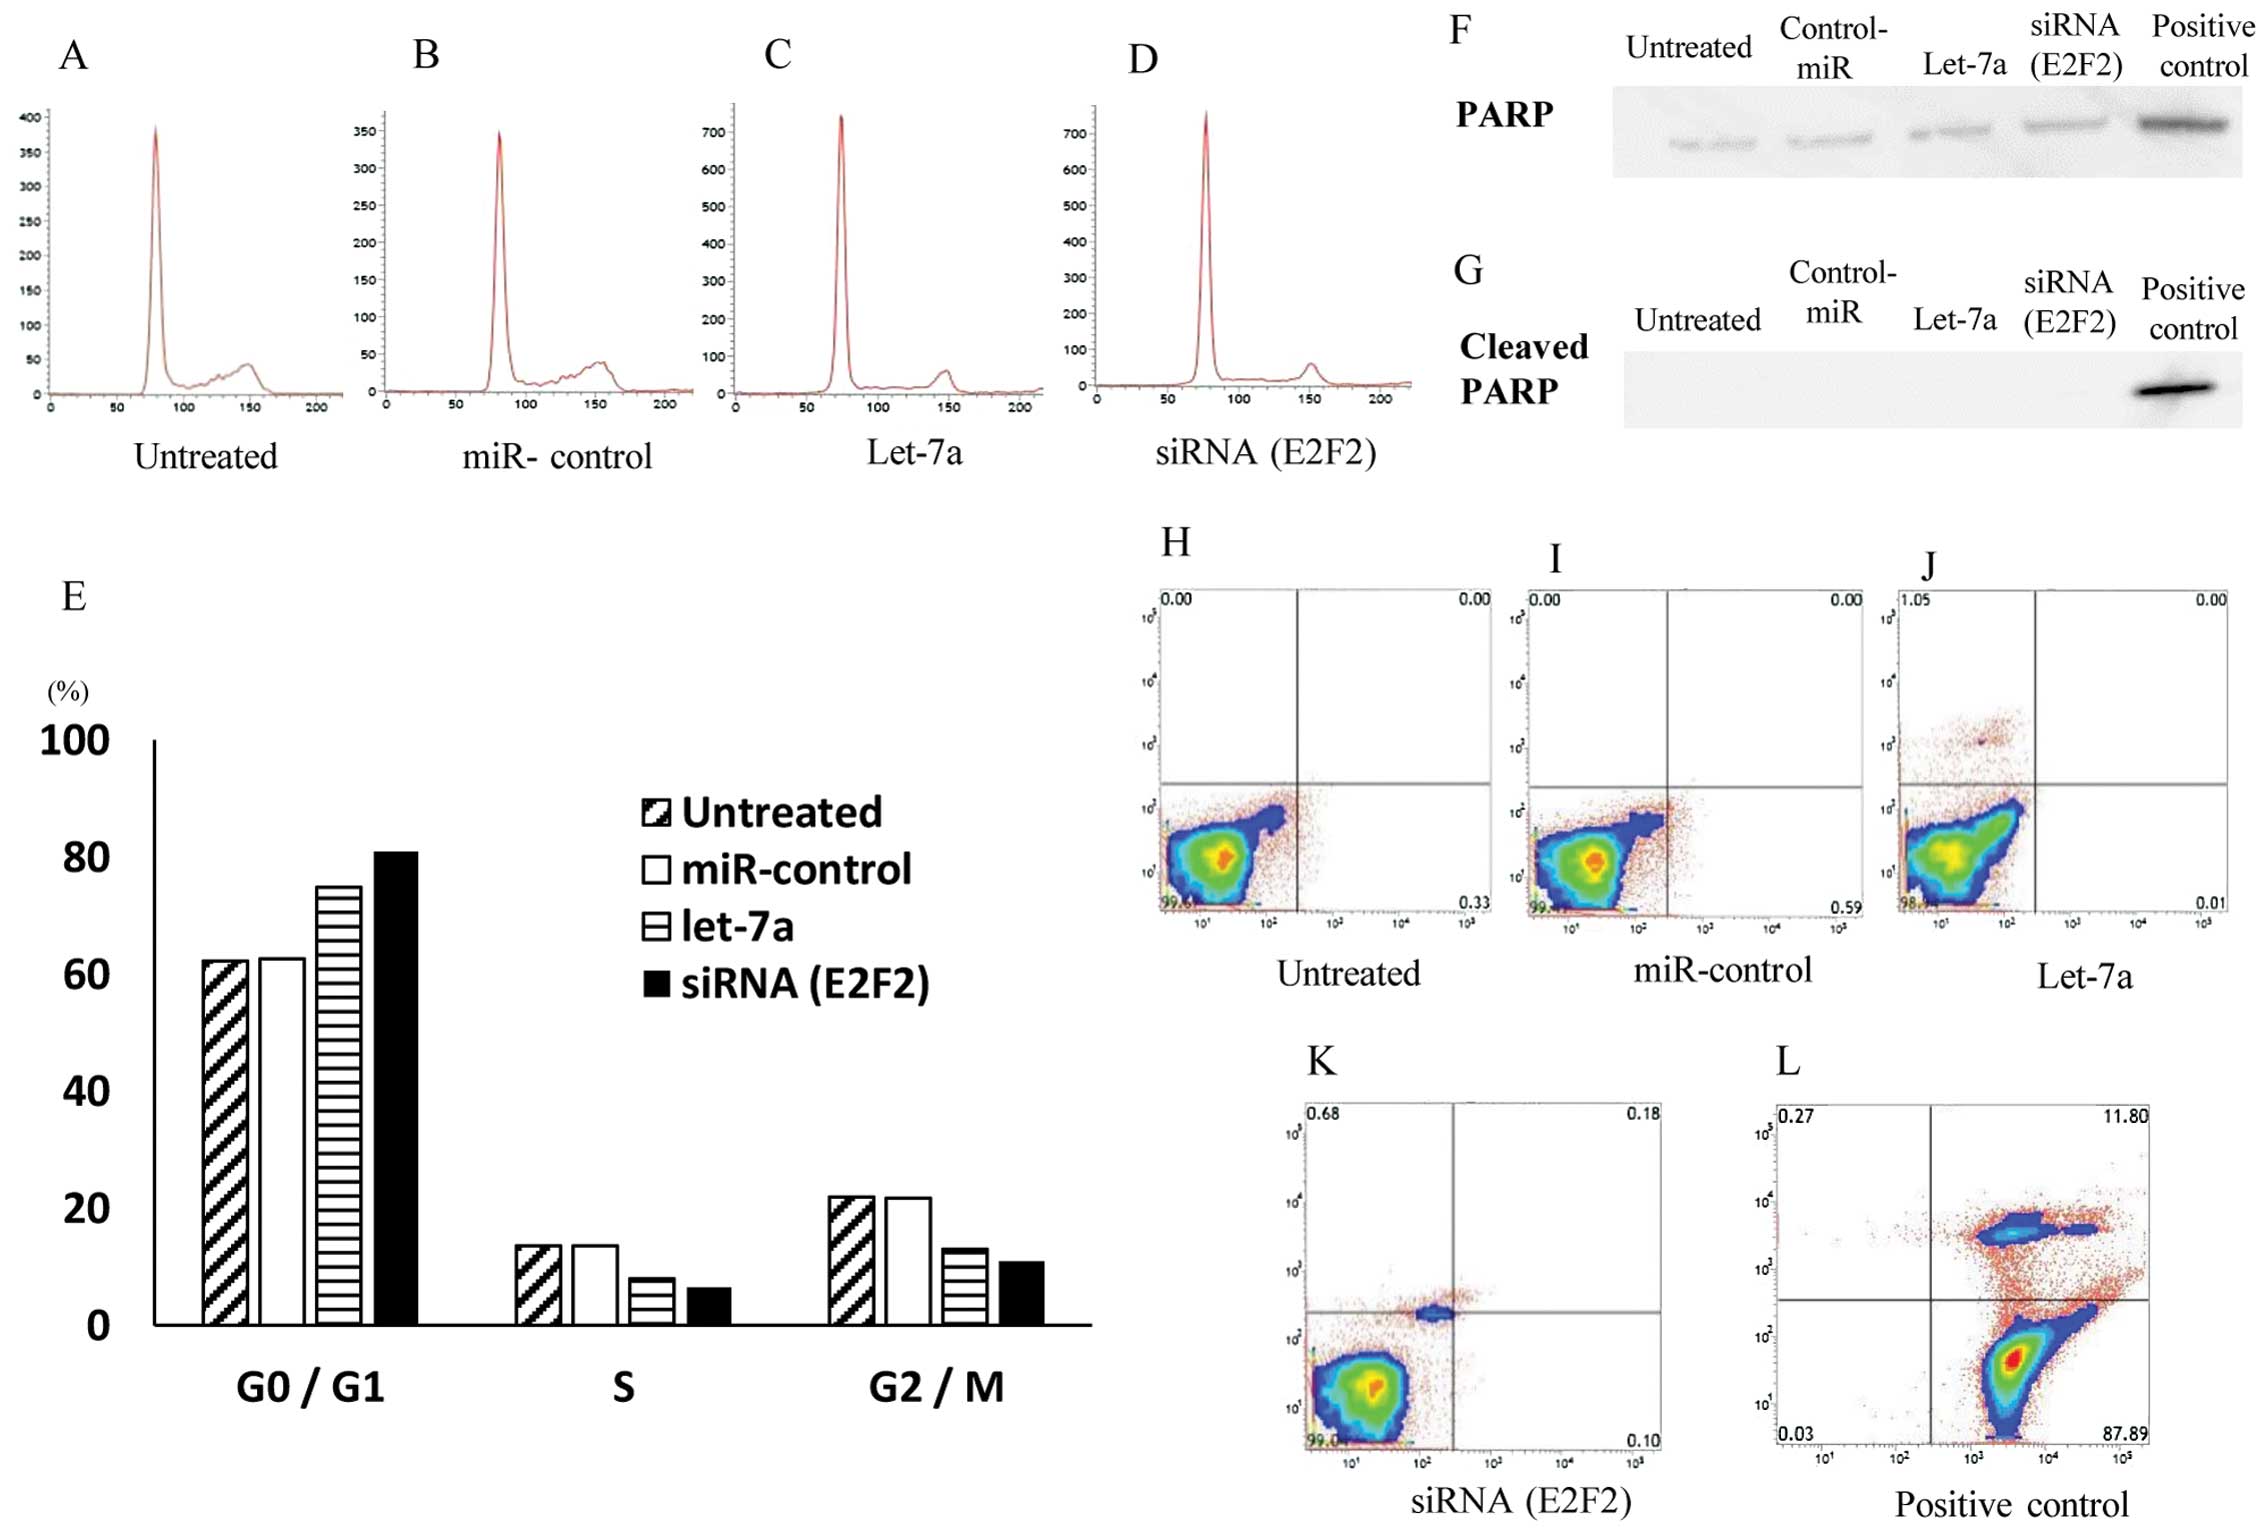
InductionofcellcyclearrestattheG0/G1phasebylet-7a
Since the introduction of let-7a significantly
inhibited cell proliferation of OS cell lines, we hypothesized that
let-7a might induce the cell cycle arrest and/or apoptosis of the
cells. To monitor the cell cycle distributions, FACS analyses were
performed by using let-7a miRNA- and E2F2 siRNA-transfected cells
(Fig. 5A–D). Both in let-7a- and
E2F2 siRNA-transfected cell lines, the number of the cells in the
G2/M and G0/G1 phase was significantly lower and higher than that
in the untreated or control oligo-transfected cells, respectively
(Fig. 5E). The data suggested that
the restoration of let-7a and the knockdown of E2F2 leads to G0/G1
arrest in the OS cells.
Subsequently, the cellular expression of PARP and
its cleaved product was assayed by immunoblotting in MG63 cells and
their transfectants (Fig. 5F). The
cleavage of PARP protein, a marker of caspase-mediated apoptosis,
was not observed in either let-7a miRNA or E2F2-siRNA transfectants
or in untreated and NC transfectants, in marked contrast to that
observed in ADM-treated (positive control) cells (Fig. 5G).
Furthermore, the flow cytometric analysis with
Annexin V-FITC/PI double staining revealed no significant
differences in the distribution patterns between untreated
(Fig. 5H), NC miRNA- (Fig. 5I), let-7a (Fig. 5J) and E2F2 siRNA-transfected cells
(Fig. 5K) compared to the positive
control cells exhibiting apoptosis (Fig. 5L). The programmed cell death was
not induced by let-7a miRNA or E2F2-siRNA in the MG63 OS cells.
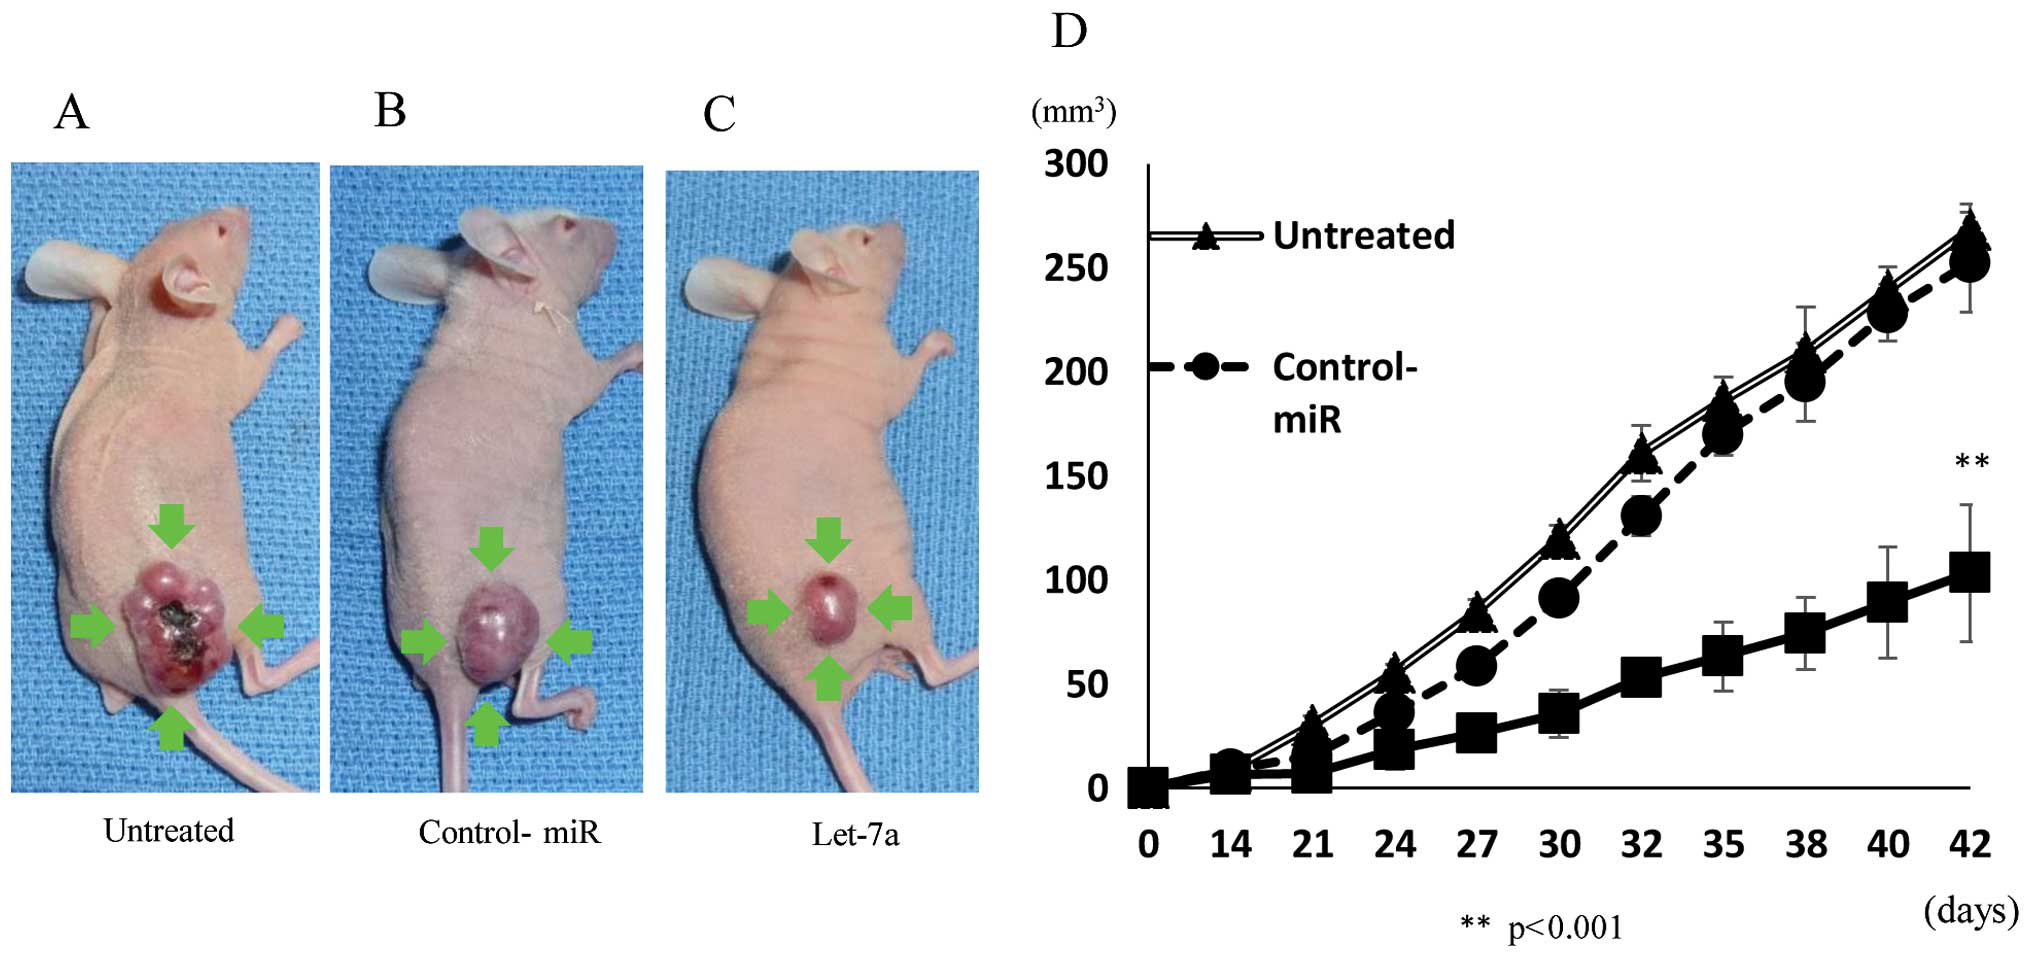
Inhibition of tumor growth in the nude
mouse xenograft model by let-7a
We next investigated the efficacy of let-7a against
tumor growth in vivo. The introduction of let-7a miRNA into
MG-63 cells resulted in decreased growth of subcutaneous
xenografted tumors in nude mice (Fig.
6A–C). MG-63 cells transfected with let-7a showed statistically
smaller tumors in mice than untreated and NC miRNA-transfected
cells (Fig. 6D), indicating that
let-7a also inhibits the growth of OS cells in vivo.
Discussion
It has been well established that the aberrant
expression of miRNAs contributes to the proliferation, invasion or
metastatic behavior of human cancer (24). One miRNA is capable of targeting
multiple genes and thereby globally regulating several biological
processes. Moreover, the aberrant expression of miRNAs in human
cancer cells causes destruction of miRNA-mediated mRNA networks.
Abnormalities in these streams could influence the expression of
tumorigenic proteins. To identify important miRNA-mRNA relationship
in the OS cells, we performed genome-wide miRNA expression array as
well as cDNA array in the same OS cells.
In the present study, the miRNA array results
demonstrated that the expression of let-7a was downregulated in all
five OS cell lines. Several studies have shown that the
downregulation of let-7a is closely related to the abnormal
potential in malignant tumors (13,25,26).
However, the biological roles of let-7a in OS cells have not yet
been clarified. Our results indicated that the expression of let-7a
was coordinately upregulated in the OS cell lines, which led to us
to performing genome-wide mRNA profiling by cDNA array to detect
the possible targets of let-7a in the OS cells.
The data from cDNA array analyses showed that the
E2F2 mRNA expression was increased in the five OS cell lines
compared with hMSCs. Furthermore, the sequence analysis suggested
possible association of let-7a with 3′UTR of E2F2. E2F2 is a member
of E2F family of transcription factors and has been well studied as
an important regulator of the cell cycle (19). E2F2 has a strong ability to promote
cell cycle progression (27), and
aberrant expression of E2F2 can lead to abnormal cellular
proliferation. Upregulation of E2F2 has been reported in prostate
(28), breast cancer (29) and astrocytoma (30). Our data on OS cells are consistent
with those from previous studies reporting that the upregulation of
E2F2 may contribute to cell malignancy.
Although let-7a probably influences the expression
of several genes, we focused on E2F2 as the target of let-7a in OS
cells. Several target genes of let-7a have been reported, such as
RAS, HMGA2, MYC, DICER and LIN28
(13–16). Our cDNA array analysis demonstrated
that E2F2 was the only let-7a target gene whose expression was
uniformly upregulated in all five OS cell lines, whereas the
expression of other candidate genes differed among the OS cell
lines. The analysis using several algorithms such as BLAST and
TargetScan further suggested that E2F2 was the putative target of
let-7a. Thus, we analyzed the possibility that let-7a may
contribute to anti-cancer activities by targeting E2F2 in the OS
cells.
We next examined the functions of let-7a in the
regulation of its possible target gene, E2F2, and the changes in
the biological characteristics in the OS cell lines. The forced
elevation of let-7a levels resulted in the reduction of the
expression of E2F2 protein, indicating that let-7a might function
as a tumor suppressor gene in the OS cells. Dong et al
(31) reported that E2F2, a cell
cycle progression and cell proliferation regulator, is the direct
target of let-7a in prostate cancer. Our results suggested that the
same regulatory mechanism of E2F2 expression via let-7a exists in
the OS cells.
Our data regarding the cell cycle showed that let-7a
inhibited the proliferation of OS cells via induction of the cell
cycle arrest at the G1/G0 phase. These observations are consistent
with those in previous studies that demonstrated the necessity of
E2F2 to bypass the normal G1/S checkpoint (32). It has been reported that E2F2 plays
a central role in the regulation of G1/S transition and cellular
transformation and that the inhibition of E2F2 expression results
in cell cycle arrest in the G1 phase (21). Thus, we can assume that the
upregulation of let-7a might affect the cell cycle progression of
OS cells via let-7a-mediated control of the E2F2 expression.
Notably, the downregulation of E2F2 by challenge of let-7a miRNA or
siRNA against E2F2 did not induce apoptosis of OS cells, indicating
that the repression of OS cell growth was acquired by cell cycle
retardants.
Furthermore, the overexpression of let-7a in the OS
cells resulted in the inhibition of OS tumor growth in vivo.
In concordance with the data of in vitro experiments, the
xenograft model of OS suggested that let-7a induction could inhibit
OS cell development in vivo by targeting E2F2
expression.
In summary, the present study suggested, for the
first time, the correlation of let-7a and E2F2 in OS cells. Our
results provided evidence that the expression levels of let-7a in
OS cells were significantly reduced and inversely correlated with
the E2F2 expression levels and that let-7a plays an important role
in OS cell proliferation and tumorigenesis by targeting E2F2 both
in vitro and in vivo. Deregulated E2F2 activity is
found in several human cancers in which E2F2 overexpression
potently promotes cell growth and proliferation (31,33).
Our data suggest that E2F2 is one of the crucial factors that
enhances tumor proliferation in OS, as other malignant tumors.
Although the data presented in the present study needs to be
confirmed by using clinical OS samples, information regarding the
association between let-7a and E2F2 in OS cells would be beneficial
for determining the underlying mechanisms of OS and may facilitate
the development of novel therapeutic strategies for clinical
application.
Acknowledgements
We thank Katsuhiro Hanada and Takashi Kobayashi for
their helpful discussions during the present study. This study was
supported in part by National Cancer Center Research and
Development Fund (26-A-4), the Health and Labour Sciences Research
Expenses (H26-084) from the Ministry of Health, Labour and Welfare,
and the Grants-in-Aid for Scientific Research (no. 24592250) from
Japan Society for the Promotion of Science.
References
|
1
|
Ottaviani G and Jaffe N: The epidemiology
of osteosarcoma. Cancer Treat Res. 152:3–13. 2009. View Article : Google Scholar
|
|
2
|
Bielack SS, Kempf-Bielack B, Delling G,
Exner GU, et al: Prognostic factors in high-grade osteosarcoma of
the extremities or trunk: an analysis of 1,702 patients treated on
neoadjuvant cooperative osteosarcoma study group protocols. J Clin
Oncol. 20:776–790. 2002. View Article : Google Scholar : PubMed/NCBI
|
|
3
|
Kansara M and Thomas DM: Molecular
pathogenesis of osteosarcoma. DNA Cell Biol. 26:1–18. 2007.
View Article : Google Scholar : PubMed/NCBI
|
|
4
|
Marulanda GA, Henderson ER, Johnson DA,
Letson GD and Cheong D: Orthopedic surgery options for the
treatment of primary osteosarcoma. Cancer Control. 15:13–20.
2008.
|
|
5
|
Bartel DP: MicroRNAs: genomics,
biogenesis, mechanism, and function. Cell. 116:281–297. 2004.
View Article : Google Scholar : PubMed/NCBI
|
|
6
|
Calin GA, Dumitru CD, Shimizu M, et al:
Frequent deletions and down-regulation of micro- RNA genes miR15
and miR16 at 13q14 in chronic lymphocytic leukemia. Proc Natl Acad
Sci USA. 99:15524–15529. 2002. View Article : Google Scholar : PubMed/NCBI
|
|
7
|
Ruvkun G: Clarifications on miRNA and
cancer. Science. 311:36–37. 2006. View Article : Google Scholar : PubMed/NCBI
|
|
8
|
Calin GA and Croce CM: MicroRNA signatures
in human cancers. Nat Rev Cancer. 6:857–866. 2006. View Article : Google Scholar : PubMed/NCBI
|
|
9
|
Garofalo M, Di Leva G, Romano G, et al:
miR-221&222 regulate TRAIL resistance and enhance
tumorigenicity through PTEN and TIMP3 downregulation. Cancer Cell.
16:498–509. 2009. View Article : Google Scholar : PubMed/NCBI
|
|
10
|
Acunzo M, Visone R, Romano G, et al:
miR-130a targets MET and induces TRAIL-sensitivity in NSCLC by
downregulating miR-221 and 222. Oncogene. 31:634–642. 2012.
|
|
11
|
Garofalo M, Romano G, Di Leva G, et al:
EGFR and MET receptor tyrosine kinase-altered microRNA expression
induces tumorigenesis and gefitinib resistance in lung cancers. Nat
Med. 18:74–82. 2011.PubMed/NCBI
|
|
12
|
Reinhart BJ, Slack FJ, Basson M,
Pasquinelli AE, Bettinger JC, Rougvie AE, Horvitz HR and Ruvkun G:
The 21-nucleotide let-7 RNA regulates developmental timing in
Caenorhabditis elegans. Nature. 403:901–906. 2000. View Article : Google Scholar : PubMed/NCBI
|
|
13
|
Takamizawa J, Konishi H, Yanagisawa K, et
al: Reduced expression of the let-7 microRNAs in human lung cancers
in association with shortened postoperative survival. Cancer Res.
64:3753–3756. 2004. View Article : Google Scholar : PubMed/NCBI
|
|
14
|
Johnson SM, Grosshans H, Shingara J, et
al: RAS is regulated by the let-7 microRNA family. Cell.
120:635–647. 2005. View Article : Google Scholar : PubMed/NCBI
|
|
15
|
Lee YS and Dutta A: The tumor suppressor
microRNA let-7 represses the HMGA2 oncogene. Genes Dev.
21:1025–1030. 2007. View Article : Google Scholar : PubMed/NCBI
|
|
16
|
Akao Y, Nakagawa Y and Naoe T: let-7
microRNA functions as a potential growth suppressor in human colon
cancer cells. Biol Pharm Bull. 29:903–906. 2006. View Article : Google Scholar : PubMed/NCBI
|
|
17
|
Attwooll C, Lazzerini Denchi E and Helin
K: The E2F family: specific functions and overlapping interests.
EMBO J. 23:4709–4716. 2004. View Article : Google Scholar : PubMed/NCBI
|
|
18
|
Trimarchi JM and Lees JA: Sibling rivalry
in the E2F family. Nat Rev Mol Cell Biol. 3:11–20. 2002. View Article : Google Scholar : PubMed/NCBI
|
|
19
|
Dimova DK and Dyson NJ: The E2F
transcriptional network: old acquaintances with new faces.
Oncogene. 24:2810–2826. 2005. View Article : Google Scholar : PubMed/NCBI
|
|
20
|
Wong JV, Dong P, Nevins JR, Mathey-Prevot
B and You L: Network calisthenics: control of E2F dynamics in cell
cycle entry. Cell Cycle. 10:3086–3094. 2011. View Article : Google Scholar : PubMed/NCBI
|
|
21
|
Helin K: Regulation of cell proliferation
by the E2F transcription factors. Curr Opin Genet Dev. 8:28–35.
1998. View Article : Google Scholar : PubMed/NCBI
|
|
22
|
Aguda BD, Kim Y, Piper-Hunter MG, Friedman
A and Marsh CB: MicroRNA regulation of a cancer network:
consequences of the feedback loops involving miR-17–92, E2F, and
Myc. Proc Natl Acad Sci USA. 105:19678–19683. 2008. View Article : Google Scholar
|
|
23
|
Lal A, Navarro F, Maher CA, et al: miR-24
Inhibits cell proliferation by targeting E2F2, MYC, and other
cell-cycle genes via binding to ‘seedless’ 3′UTR microRNA
recognition elements. Mol Cell. 35:610–625. 2009. View Article : Google Scholar : PubMed/NCBI
|
|
24
|
Nelson KM and Weiss GJ: MicroRNAs and
cancer: past, present, and potential future. Mol Cancer Ther.
7:3655–3660. 2008. View Article : Google Scholar : PubMed/NCBI
|
|
25
|
Hu X, Guo J, Zheng L, et al: The
heterochronic microRNA let-7 inhibits cell motility by regulating
the genes in the actin cytoskeleton pathway in breast cancer. Mol
Cancer Res. 11:240–250. 2013. View Article : Google Scholar : PubMed/NCBI
|
|
26
|
Yang Q, Jie Z, Cao H, Greenlee AR, Yang C,
Zou F and Jiang Y: Low-level expression of let-7a in gastric cancer
and its involvement in tumorigenesis by targeting RAB40C.
Carcinogenesis. 32:713–722. 2011. View Article : Google Scholar : PubMed/NCBI
|
|
27
|
Chen C and Wells AD: Comparative analysis
of E2F family member oncogenic activity. PLoS One. 2:e9122007.
View Article : Google Scholar : PubMed/NCBI
|
|
28
|
Lin PC, Chiu YL, Banerjee S, et al:
Epigenetic repression of miR-31 disrupts androgen receptor
homeostasis and contributes to prostate cancer progression. Cancer
Res. 73:1232–1244. 2013. View Article : Google Scholar :
|
|
29
|
Fujiwara K, Yuwanita I, Hollern DP and
Andrechek ER: Prediction and genetic demonstration of a role for
activator E2Fs in Myc-induced tumors. Cancer Res. 71:1924–1932.
2011. View Article : Google Scholar : PubMed/NCBI
|
|
30
|
Okamoto OK, Oba-Shinjo SM, Lopes L and
Nagahashi Marie SK: Expression of HOXC9 and E2F2 are up-regulated
in CD133+ cells isolated from human astrocytomas and
associate with transformation of human astrocytes. Biochim Biophys
Acta. 1769:437–442. 2007. View Article : Google Scholar : PubMed/NCBI
|
|
31
|
Dong Q, Meng P, Wang T, et al: MicroRNA
let-7a inhibits proliferation of human prostate cancer cells in
vitro and in vivo by targeting E2F2 and CCND2. PLoS One.
5:e101472010. View Article : Google Scholar : PubMed/NCBI
|
|
32
|
Sharma N, Timmers C, Trikha P, Saavedra
HI, Obery A and Leone G: Control of the p53-p21CIP1 Axis by E2f1,
E2f2, and E2f3 is essential for G1/S progression and cellular
transformation. J Biol Chem. 281:36124–36131. 2006. View Article : Google Scholar : PubMed/NCBI
|
|
33
|
Nguyen-Vu T, Vedin LL, Liu K, et al: Liver
x receptor ligands disrupt breast cancer cell proliferation through
an E2F-mediated mechanism. Breast Cancer Res. 15:R512013.
View Article : Google Scholar
|