Introduction
Dichloroacetate (DCA) is a metabolic modulator that
has been used in humans for decades for the treatment of lactic
acidosis and inherited mitochondrial diseases (1). DCA is a pyruvate dehydrogenase kinase
(PDK) inhibitor, which activates pyruvate dehydrogenase (PDH),
increasing glucose oxidation by promoting an influx of pyruvate
into the tricarboxylic acid cycle (2).
DCA affects multiple pathways of intermediary
metabolism. It stimulates peripheral glucose utilization and
inhibits gluconeogenesis, thereby reducing hyperglycemia in animals
and humans with diabetes mellitus. It inhibits lipogenesis and
cholesterolgenesis, thereby decreasing circulating lipid and
lipoprotein levels in short-term studies of patients with acquired
or hereditary disorders of lipoprotein metabolism. By stimulating
the activity of pyruvate dehydrogenase, DCA facilitates oxidation
of lactate and decreases morbidity in acquired and congenital forms
of lactic acidosis (3). It has
been shown that DCA reverses the metabolic-electrical remodeling in
several cancer lines, increases ROS production, produces
hyperpolarized mitochondria, activates NFAT1, induces apoptosis and
decreases tumor growth (1). DCA
has been found to have antitumor properties in pulmonary epithelial
cells (1), breast tumor cells
(4), colorectal cancer cells
(5) and prostate tumors (6) without affecting normal cells. It has
also been shown that DCA has an increased effect when combined with
other drugs, such as with arsenic trioxide in breast cancer
(7), sulindac in lung cancer
(8), bortezomib in multiple
myeloma (9) or in combination with
radiation in prostate cancer (6).
Currently, clinical trials are being conducted with DCA to prove
its effectiveness (http://clinicaltrial.gov/show/NCT01111097).
All organisms need energy not only to survive but
also to prosper and proliferate. Accordingly, properly functioning
mitochondria are essential to any cell, including cancer cells
(10–12). Metabolic activities of normal cells
rely predominately on mitochondrial oxidative phosphorylation
(OXPHOS) for energy generation in the form of ATP. On the contrary,
cancer cells predominately rely on glycolysis rather than on
oxidative phosphorylation (13).
There is growing evidence linking cancer with diseases or mutations
affecting mitochondrial function and their metabolic pathways
(14). Although mitochondrial
function and intact mtDNA are essential for cancer cell growth and
tumorigenesis, mtDNA mutations and/or reductions in mtDNA copy
number that alter the OXPHOS physiology are common features of
cancer (15). When mtDNA has a
high mutation rate, de novo mtDNA mutations create a mixture
of mutant and normal mtDNAs in cells, a state known as
heteroplasmy. As the proportion of mutant mtDNAs increases, the
energy output capacity of the cell declines until there is
insufficient energy to sustain cellular function, termed the
bioenergetic threshold. Mitochondria form a reticular network that
is constantly undergoing fusion and fission, which is necessary for
the maintenance of organelle fidelity (16).
The quality of a mitochondrial population is
maintained through mitophagy, a form of specific autophagy in which
defective mitochondria are selectively degraded (17). Some antitumor therapies, such as
PI3K/mTOR inhibitors, are known to induce autophagy in cancer cells
(18). To evaluate autophagy, LC3b
is a commonly used marker because it is an essential component of
autophagosomes. The level of the
phosphatidylethanolamine-conjugated LC3b (LC3b-II) inserted into
the autophagosome membrane and the ratio of LC3b-II/LC3b-I
determine the rate of autophagy. However, autophagy itself is a
very fast process leading to an immediate fusion of autophagosomes
with lysosomes and subsequent degradation of LC3b-II. Blocking the
autophagy process in a late phase just prior to lysosome
degradation is needed to observe the LC3b-II/LC3b-I ratio. For this
reason, NH4Cl and chloroquine (CHLQ) have been used to
block the completion of autophagy (19).
Due to the importance of mitophagy in mitochondrial
quality control and because of the known changes that DCA produces
in energy metabolism, we hypothesized that DCA could cause a
decrease in mitochondrial density in SH-SY5Y neuroblastoma cells
through the activation of mitophagy. As a model, we chose SH-SY5Y
cells, originally derived from the SK-N-SH cell line (20), for our study because they are well
known and frequently studied. Moreover, neuroblastoma is the most
common type of extracranial childhood solid tumor, accounting for
15% of pediatric cancer-related deaths (21). We used undifferentiated SH-SY5Y
cells in this study.
We demonstrate that treatment with DCA ≤60 mM
stimulates the reorganization of the mitochondrial network in
SH-SY5Y cells, leading to shorter and more fragmented mitochondrial
filaments. This change in the mitochondrial network was related to
an imbalance in the expression of proteins related to mitochondrial
dynamics (FIS1), mitochondrial protein degradation (PINK1, Parkin)
and autophagy (LC3b). Surprisingly, we did not observe a decrease
in mtDNA copy number with DCA treatment. Thus, we provide new
insights into the DCA-induced restructuring of the mitochondrial
network through mitochondrial dynamics and mitophagy that preserves
the nucleoids.
Materials and methods
Cell culture and experimental design
Neuroblastoma SH-SY5Y cells (ATCC, Manassas, VA,
USA) were grown in DMEM (Dulbecco’s modified Eagle’s medium,
Gibco-BRL, Gaithersburg, MD, USA) supplemented with 100 U/ml
penicillin (Sigma-Aldrich, St. Louis, MO, USA), 100 μg/ml
streptomycin (Sigma-Aldrich), 5 mM glucose (Sigma-Aldrich), 2 mM
L-glutamine (Gibco) and 10% fetal bovine serum (Gibco) in an
atmosphere of 95% air and 5% CO2 at 37°C. The growth
medium was replenished every 2 or 3 days. We distributed the
SH-SY5Y cells into 3 groups: control, NH4Cl and
chloroquine (CHLQ). NH4Cl and CHLQ were added to the
experimental design to inhibit mitophagy at different stages, and
compared to the control group. The NH4Cl group was
supplemented with a final concentration of 10 mM NH4Cl
in the medium. The CHLQ group was supplemented with a final
concentration of 50 μM CHLQ in the medium. Each group was treated
with DCA at 0, 5, 30 and 60 mM for 16 h. Both NH4Cl and
CHLQ were added at the same time as DCA. All experiments were
performed with viable cells after treatment. Therefore, cells in
suspension were withdrawn before any analysis.
Number of viable cells
The quantification of viable SH-SY5Y cells was
performed as follows: we seeded the cells at a concentration of
150,000 cells/well in three 6-well plates (n=3 for each treatment).
After 24 h, we performed a 16-h treatment with DCA. After that, the
cells were washed with PBS, trypsinized and quantified with a
Countless Automated (Invitrogen, Carlsbad, CA, USA) cell counter
using trypan blue.
Mitochondrial copy number
The number of mtDNA copies was assessed via qPCR-RT
as described by Alán et al (22). Briefly, total DNA was isolated by
phenol-chloroform extraction. We used qPCR and SYBR Green primers
recognizing the UCP2 nuclear gene and ND5 mtDNA gene to calculate
the corresponding ratio between them, which determines the number
of mtDNA copies.
Immunoblotting
All the relative protein quantifications were
measured using a protein lysate of SH-SY5Y cells in RIPA buffer
(23) supplemented with a protease
inhibitor (P8340, Sigma-Aldrich). The total protein concentration
of each sample was measured by a BCA (B9643, Sigma-Aldrich) assay
(24).
The samples (30 μg of total protein) were separated
by SDS-PAGE (12% polyacrylamide gel) and detected by
immunoblotting, as described by Paulson and Laemmli (25). After electrophoresis, the samples
were transferred to a PVDF (Bio-Rad, Richmond, CA, USA) membrane
for 1 h. Subsequently, blocking was performed using 5% BSA in
TBS-0.05% Tween-20 on a shaker at room temperature. After blocking,
incubation was performed with LC3b (NB100-2220, Novus Biologicals,
Littleton, CO, USA), FIS1 (ALX-210-1037-0100, Enzo Life Science,
Farmingdale, NY, USA), OPA1 (612606, BD Biosciences, San José, CA,
USA), Tim23 (611222, BD Biosciences), TFAM (ab119684), PARKIN
(ab15954) and PINK1 (ab23707) (Abcam, Cambridge, MA, USA)
antibodies in blocking buffer with shaking overnight at 4°C. Actin
was used as the loading control. The actin primary antibody
(ab3280, Abcam) was diluted 1:1,000 in blocking buffer and also
incubated as above. In all cases, appropriate secondary
peroxidase-conjugated antibodies, anti-mouse or anti-rabbit, were
applied at a concentration of 1:5,000 in TBS-T for 1 h with shaking
at room temperature. ImageJ software was used to perform
densitometry and relative quantification (26).
Confocal microscopy
SH-SY5Y cells were cultured for 2 days on glass
cover slips coated with poly-L-lysine. DCA was administered in the
culture medium for 16 h. The mitochondria specific fluorescent dye
tetramethylrhodamine ethyl ester (TMRE) was used to investigate
mitochondrial structure. TMRE is a lipophilic, cell permeable,
cationic, non-toxic, fluorescent dye that specifically stains live
mitochondria. TMRE accumulated specifically in the mitochondria in
proportion to the mitochondria membrane potential (27). We incubated TMRE at a final
concentration of 50 μM in the cell culture medium for 1 min and
then exchanged the medium for fresh culture medium. Cells were then
placed on a microscope slide, which was imaged with an inverted
confocal fluorescent Leica TCS SP2 AOBS microscope with a PL APO
100x/1.40–0.70 oil immersion objective (a pinhole of 1 AU). TMRE
was excited at 543 nm with a 1.2-mW HeNe laser. All images of
living cells were taken in 95% air and 5% CO2 at 37°C in
a microscope incubation chamber.
Statistical analysis
The results are reported as the mean ± SEM. The
means were compared with one-way or two-way ANOVA (P≤0.05) using
SPSS for Windows v. 19.0 software (SPSS Inc., Chicago, IL,
USA).
Results
DCA decreases the number of viable
cells
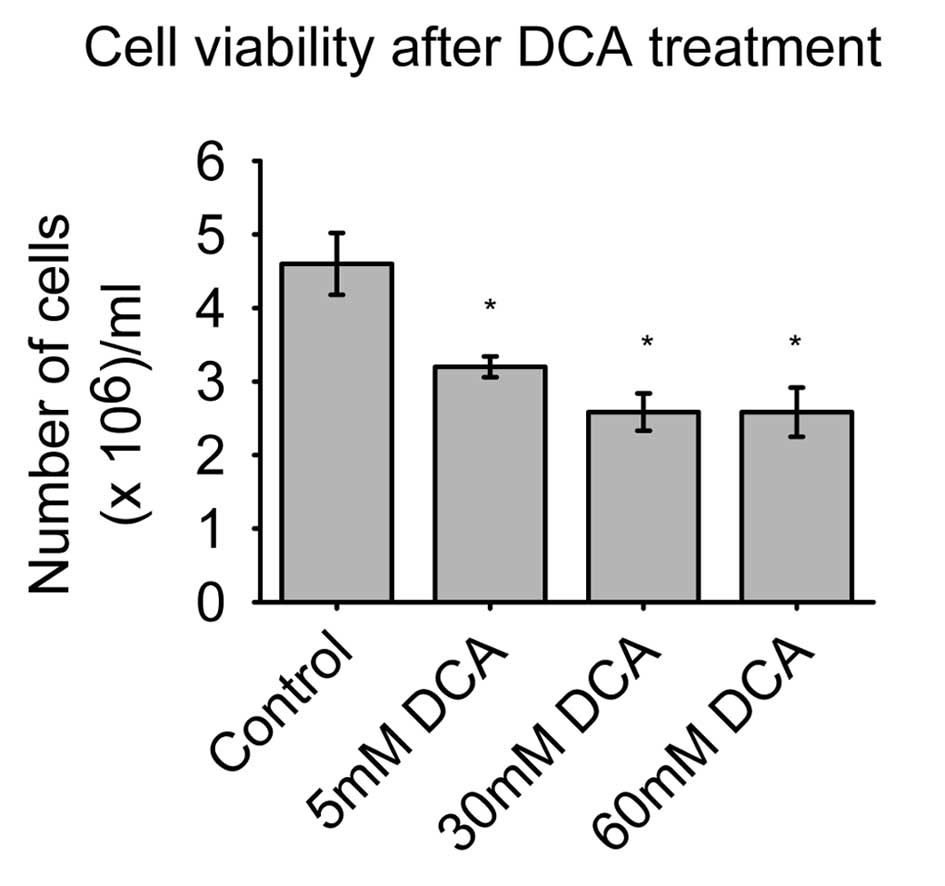
The SH-SY5Y cell viability is illustrated in
Fig. 1. The control group had a
maximum of 4.6×10⁵ viable cells/well, while the 5 mM DCA
dose had 3.2×10⁵ cells/well, and two doses of 30 and 60
mM DCA both had an average of 2.6×10⁵ cells/well.
Treatment with the lowest concentration of DCA (5 mM) significantly
decreased the number of viable cells (P<0.05), as did the other
two higher doses of DCA, where the differences were even higher
than in the 5 mM DCA group.
The concentration of 30 and 60 mM DCA had a similar
effect on the number of viable cells. It is noteworthy that these
differences in the number of viable cells were easily observable
under a microscope. We observed cells in suspension after DCA
treatment, which is indicative of cell death or apoptosis. This
phenomenon was observed in all series of wells that were treated
with DCA.
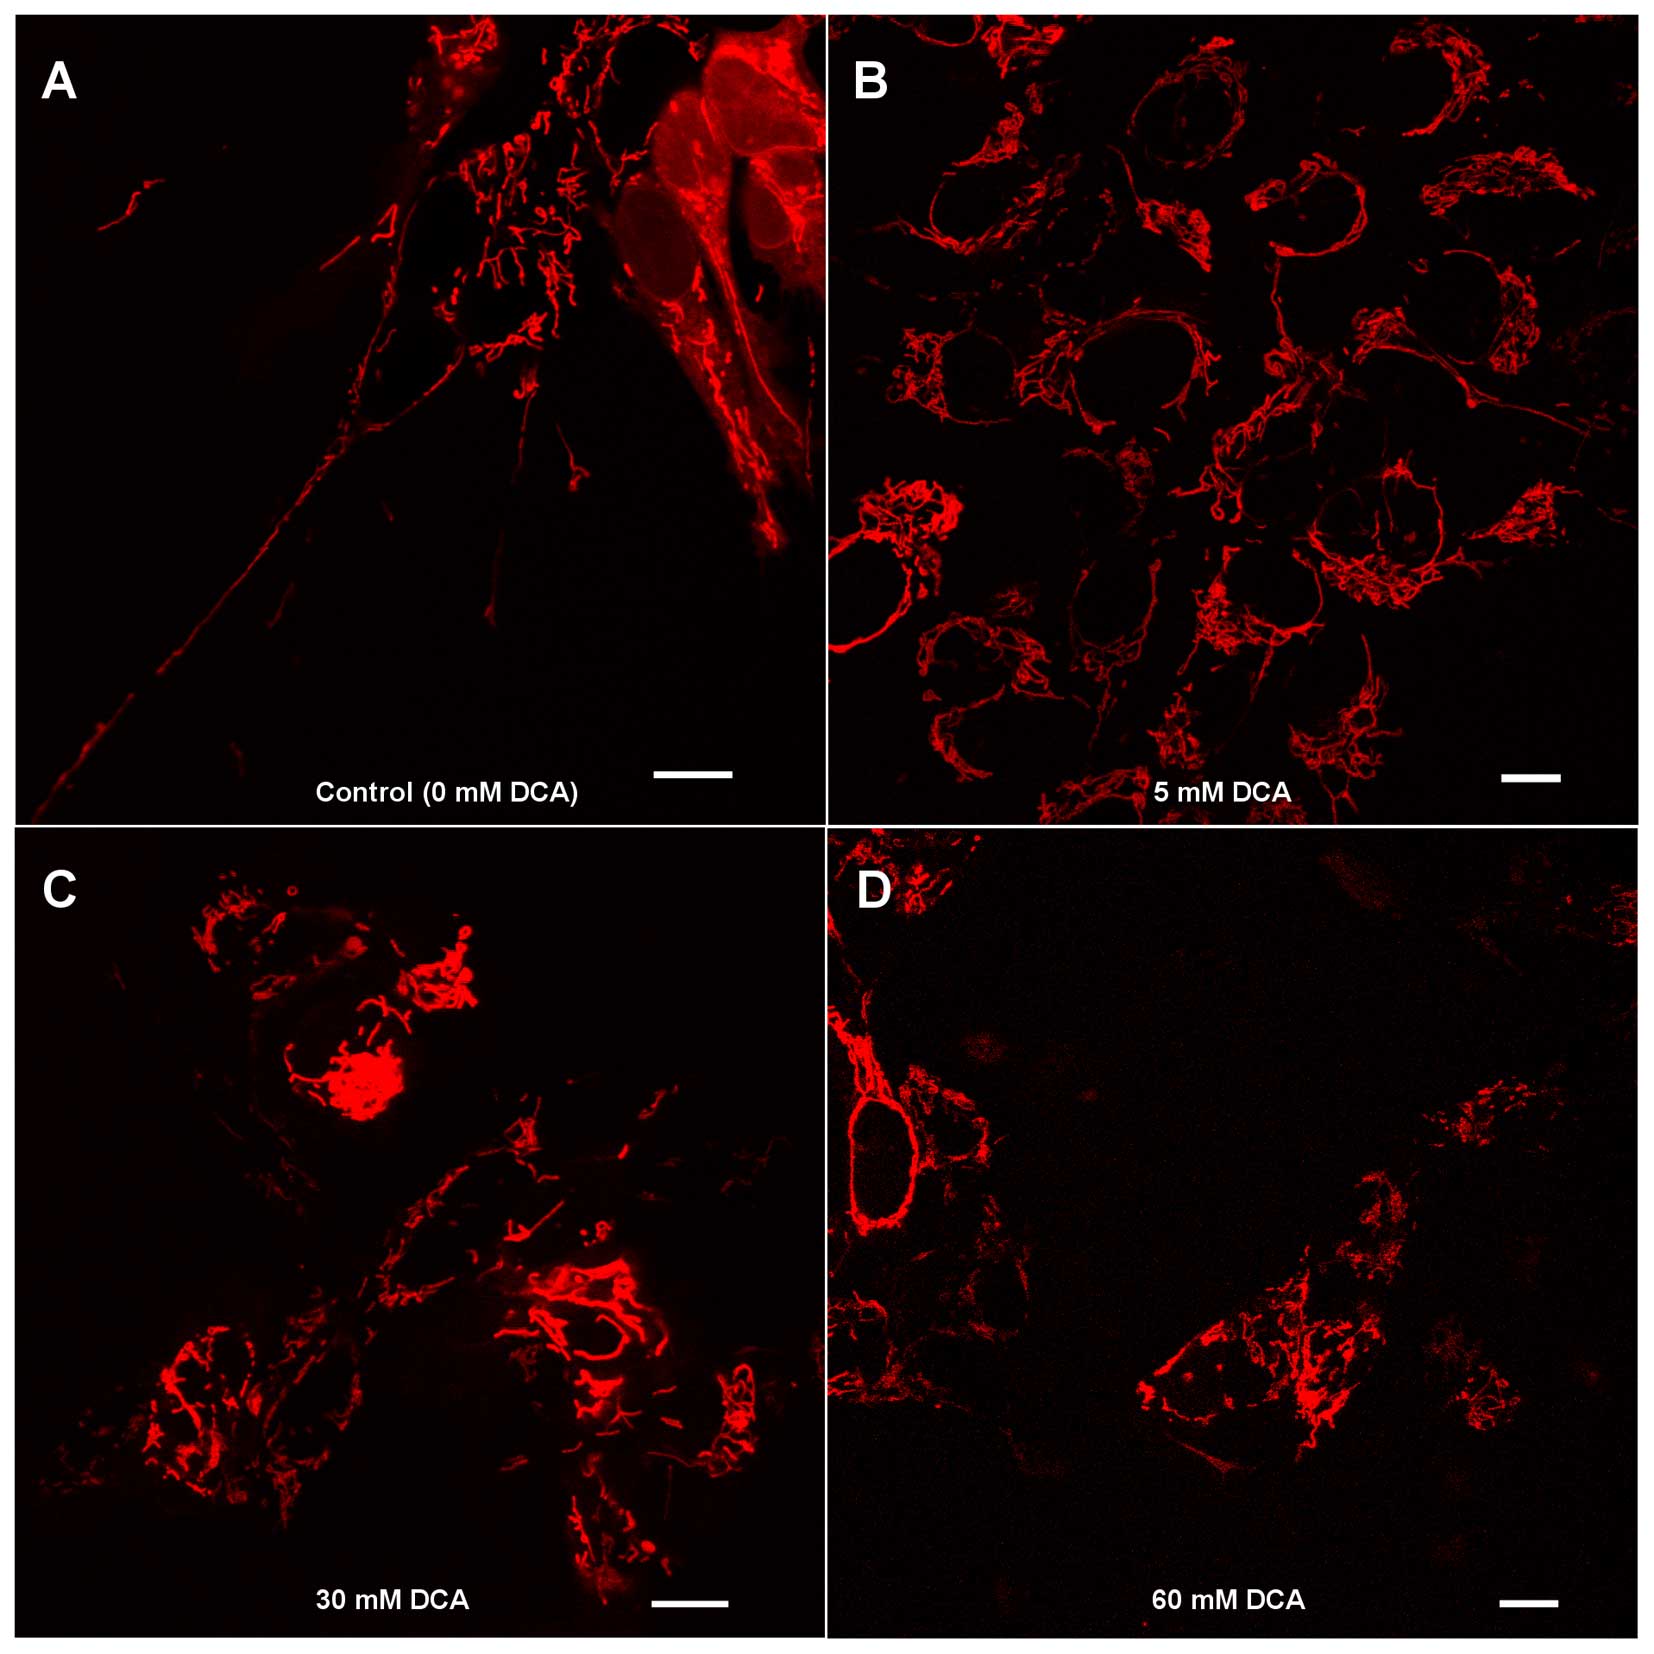
DCA induces morphology changes in the
mitochondrial network
Confocal microscopy showed that no significant
change in the cell size was observed in the DCA-treated groups
compared with controls. The control group tended to have a
mitochondrial structure that was long and contained interconnected
filaments. As the DCA concentration increased, the mitochondrial
network contained shorter and more fragmented filaments. At higher
DCA concentrations, there were clustered mitochondria filaments
more frequently present, causing the filaments of the mitochondrial
network not to be distributed homogeneously within the cell cytosol
(Fig. 2).
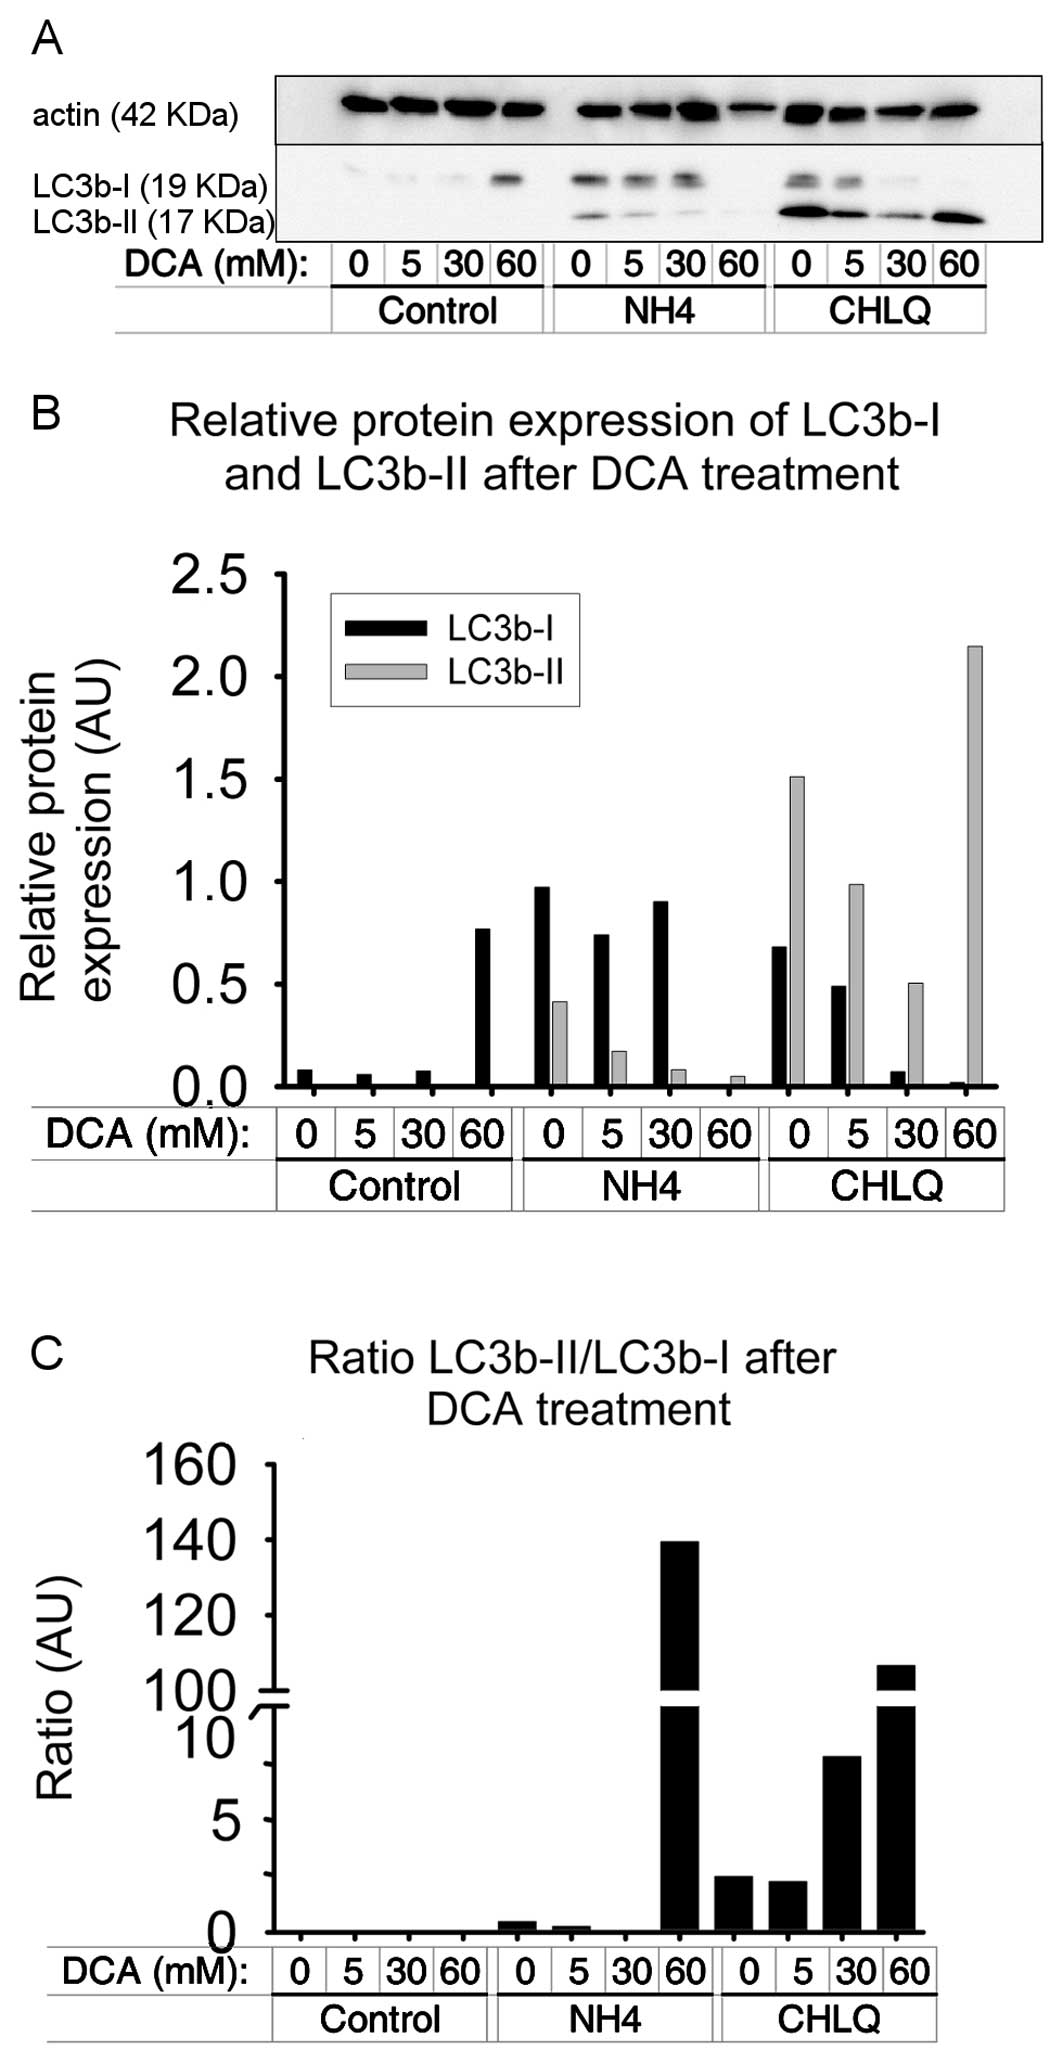
DCA at high doses increases the LC3b
ratio
LC3b-I and LC3b-II were detected in SH-SY5Y cells.
In the control group, we found that the concentration of LC3b-I
increases with increasing DCA concentrations. As expected, we did
not detect LC3b-II in this group at any DCA concentration. In the
NH4Cl treatment, the LC3b-I levels were similar and
LC3b-II levels were decreased, as compared to the control sample.
The CHLQ group exhibited a decrease in LC3b-I levels and an
increase in LC3b-II levels with increasing DCA concentrations
(Fig. 3A and B).
In addition, we calculated the LC3b-II/LC3b-I ratio,
which indicates how much LC3B-I was transformed to LC3B-II during
autophagy and gives an approximation of the level of autophagy
induced by the treatment. The LC3B-II/LC3B-I ratio was very small
and no significant changes were found in the control group.
However, in the NH4Cl or CHLQ treatments, increasing
ratios were obtained with increasing DCA concentrations, especially
using CHLQ as autophagy blocker (Fig.
3C).
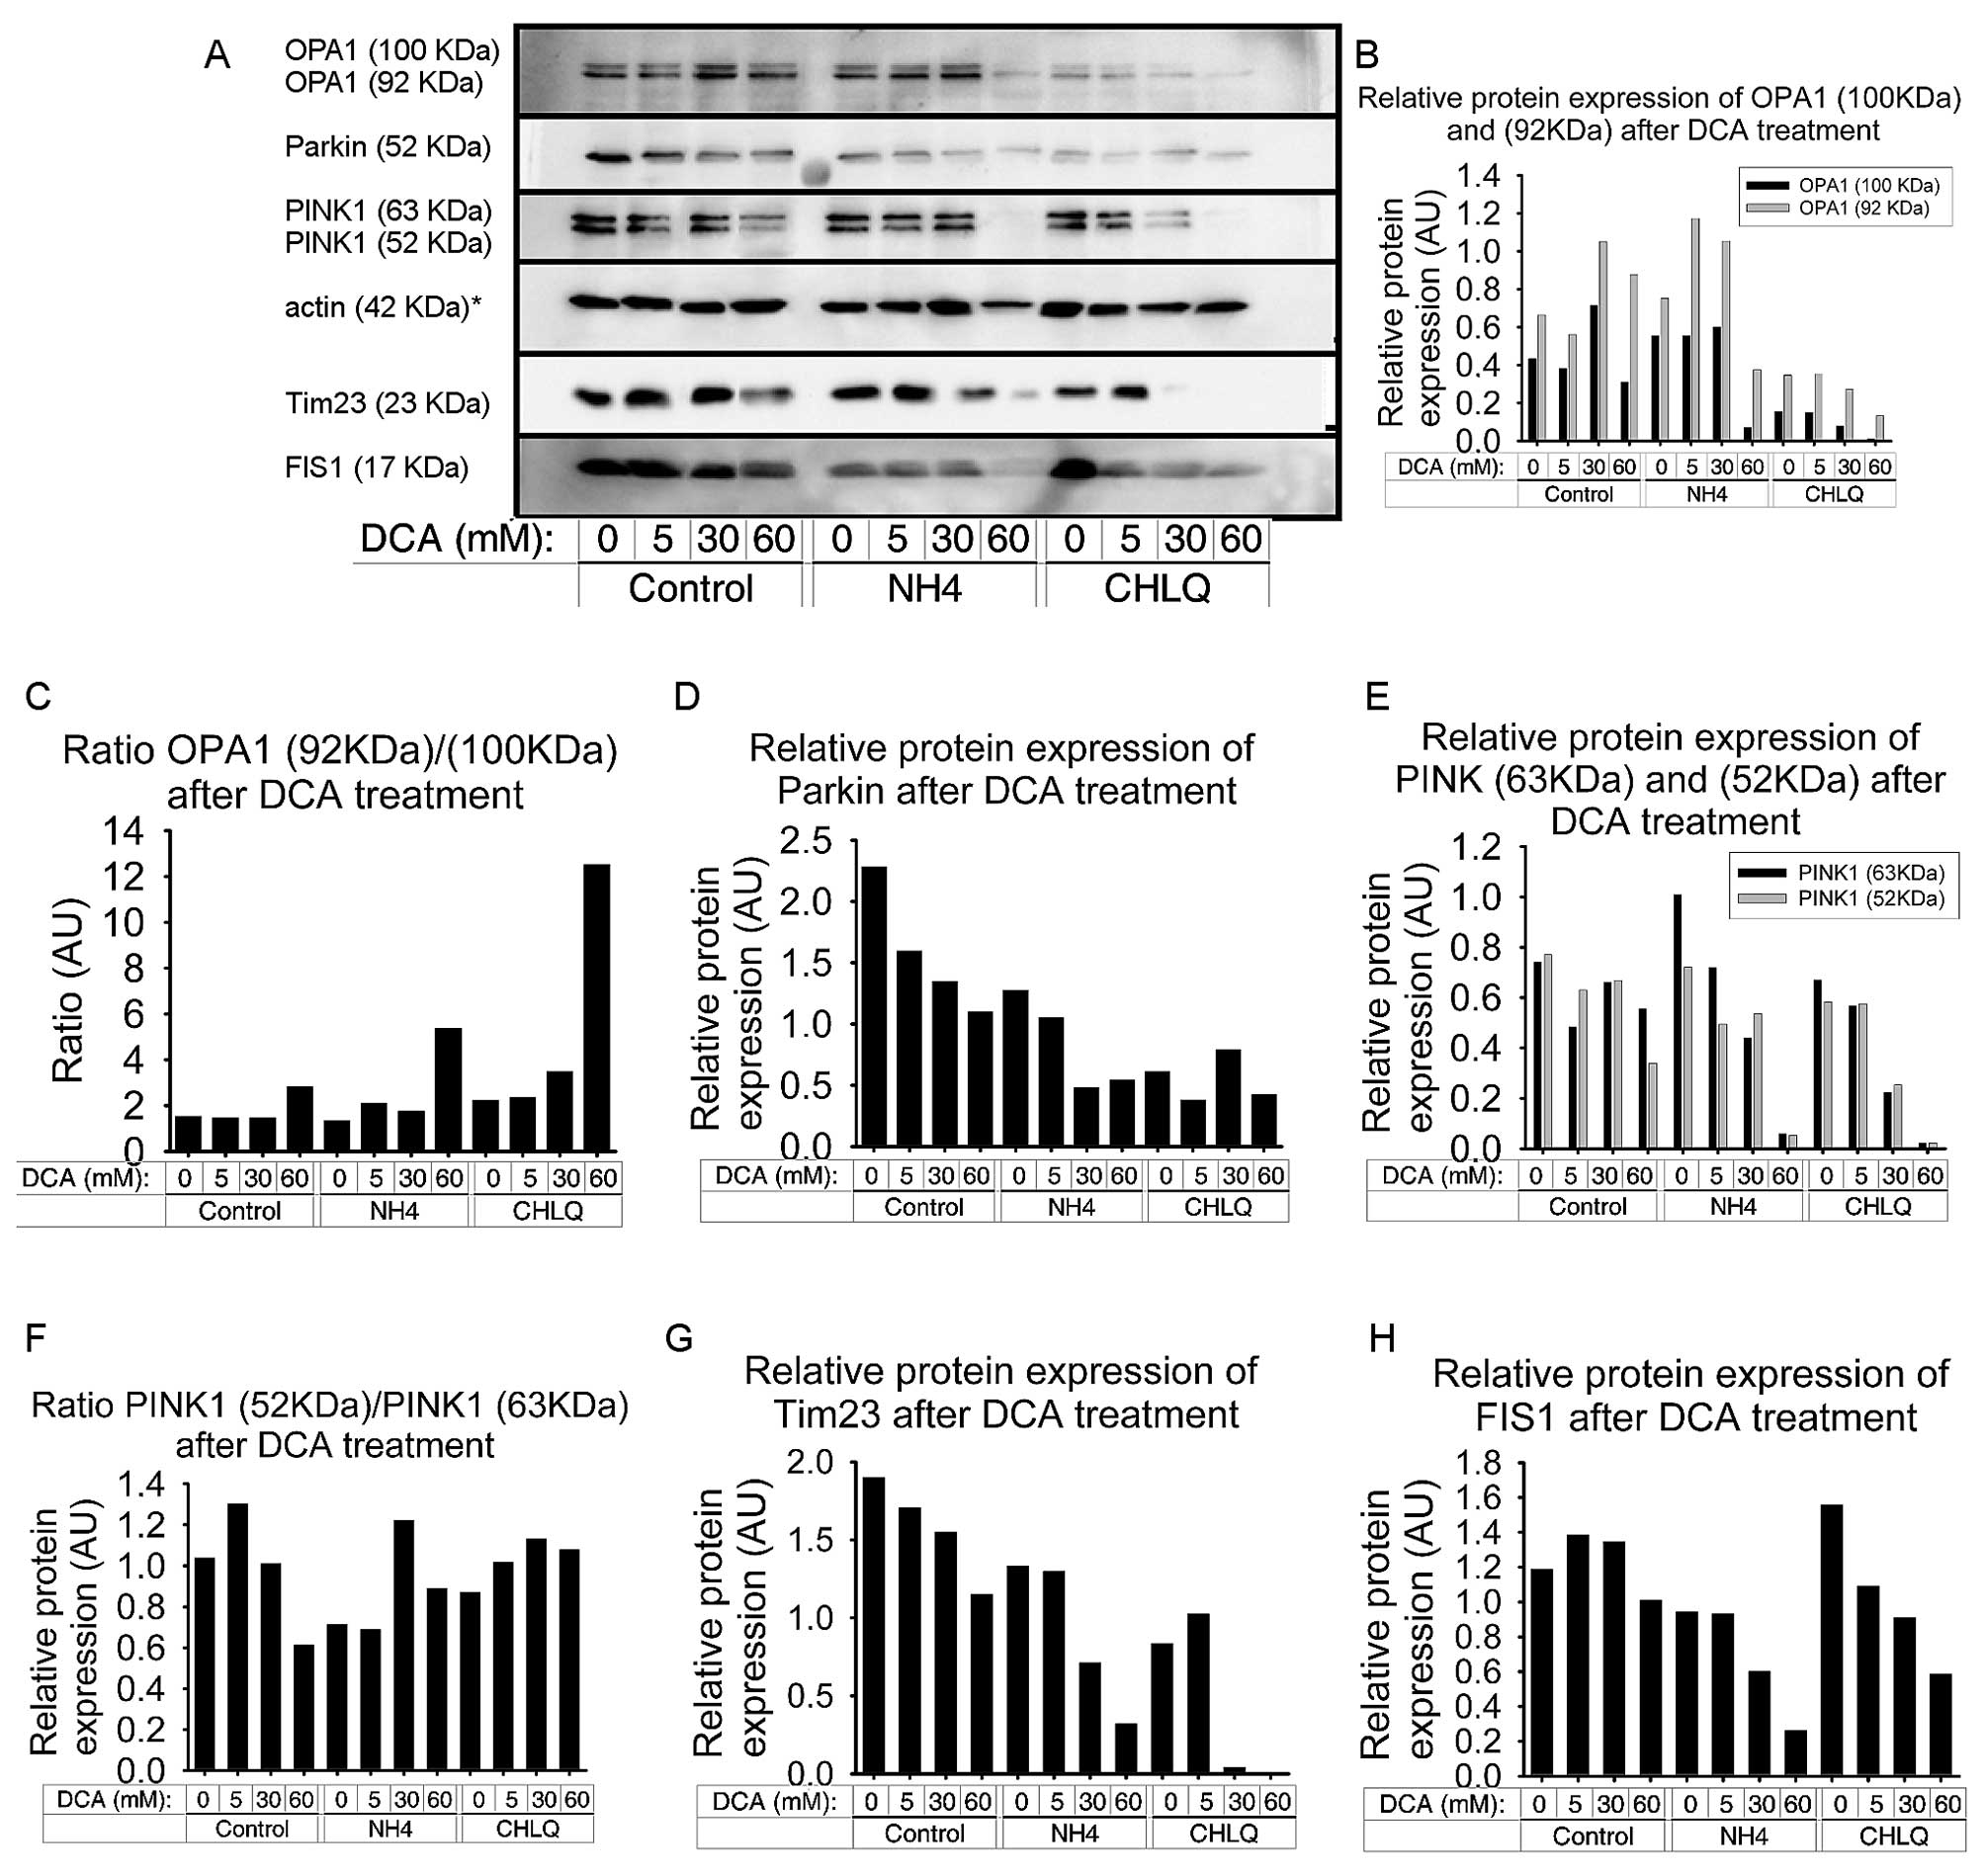
DCA produces an imbalance of OPA1
isoforms and reduces FIS1 and Tim23 protein levels
We detected a redistribution of both OPA1 isoforms.
The two bands of OPA1, corresponding to OPA1 c, d and e isoforms
(92 kDa) and OPA1 a and b isoforms (100 kDa), were examined
(27). Treatment with 5 mM DCA did
not have an effect on the OPA1 bands. However, treatment with 30 mM
DCA resulted in an increase in both OPA1 bands, while treatment
with 60 mM DCA increased only the 92-kDa OPA1 isoform, compared to
the control group (Fig. 4A and
B).
NH4Cl treatment produced a slight
increase in both bands of OPA1. The co-treatment of
NH4Cl with ≤30 mM DCA caused a slight increase in the
92-kDa OPA1 isoform. In contrast, co-treatment of NH4Cl
with 60 mM DCA resulted in a significant decrease in the two OPA1
bands, especially in the higher one. In fact, this combination
proved to be toxic to the cells by causing apoptosis, as indicated
by the actin band (Fig. 4A and
B).
CHLQ treatment caused a reduction in the two OPA1
bands, which was more pronounced for the higher band. The
co-treatment of CHLQ with 5 mM DCA did not affect OPA1 expression;
however, at higher DCA concentrations (30 and 60 mM), there was a
slight decrease in both OPA1 bands. At 60 mM DCA, the 100-kDa
isoform was non-existent (Fig.
4B).
We calculated the OPA1 isoform ratio [OPA1 (92
kDa)/OPA1 (100 kDa)] and found that it increased after the 60-mM
DCA treatment. Likewise, the co-treatment with NH4Cl or
CHLQ amplified this effect (Fig.
4C).
FIS1 protein levels were decreased by DCA treatment
in SH-SY5Y cells in all groups. FIS1 protein levels tended to
slightly increase with 5 and 30 mM DCA treatment in the control
group, despite FIS1 protein levels decreasing slightly at higher
DCA concentrations (60 mM) in the control group. In the two groups
that were co-treated with mitophagy blocking agents, FIS1 protein
levels exhibited a similar profile. FIS1 protein levels decreased
with increasing DCA concentrations in a dose-dependent manner. The
NH4Cl treatment showed slightly lower FIS1 protein
levels, down to 24% (Fig. 4A and
H).
Tim23 decreased with increasing DCA concentrations
in a dose-dependent manner in all the groups. This effect was
moderate in the control group and more pronounced in the
NH4Cl and CHLQ groups. Thus, the co-treatment of DCA
with autophagy blockers led to a further decrease in Tim23 levels,
especially with CHLQ treatment (Fig.
4A and G).
DCA decreases the PINK1 and Parkin
protein levels
The results obtained by immunoblotting showed that
DCA treatment caused a decrease in the protein levels of PINK1 and
Parkin in SH-SY5Y cells. These decreases were observed in the
control group and both the NH4Cl and CHLQ groups, in
which the mitophagy event is blocked by different mechanisms at a
late phase (Fig. 4A).
The protein levels of the two PINK1 isoforms were
decreased at the highest dose of DCA (60 mM). When DCA treatment
was applied in combination with mitophagy blockers
(NH4Cl and CHLQ), we observed a decrease in the two
PINK1 isoforms in a dose-dependent manner (Fig. 4E). In these two groups, the
expression of PINK1 with the 60 mM DCA treatment was almost
non-existent. In the combined treatment of 60 mM DCA and
NH4Cl, there was a high percentage of cells undergoing
apoptosis, which can be seen in the lower density of the actin band
(Fig. 4A). We calculated the
ratios between the two PINK1 isoforms, PINK1 (53 kDa)/PINK1 (63
kDa), to determine if they correlated to drug concentration. The
PINK1 isoform ratios showed two trends. The first trend was found
in the control group, where an increasing DCA concentration reduced
the ratios between the two PINK1 isoforms. The second trend was
that the NH4Cl and CHLQ treatment groups exhibited a
slight increase in the PINK1 (53 kDa)/PINK1 (63 kDa) ratio with
increasing DCA concentrations (Fig.
4F).
The Parkin protein levels decreased with increasing
DCA concentrations in a dose-dependent manner for the control
group. Treatment with autophagy-blocking agents (NH4Cl
or CHLQ) without DCA produced a significant decrease in Parkin
protein levels, decreasing by half and two-thirds, respectively.
The co-treatment of NH4Cl or CHLQ with DCA caused
downregulation of the Parkin protein compared to controls for their
respective treatment groups (Fig.
4D).
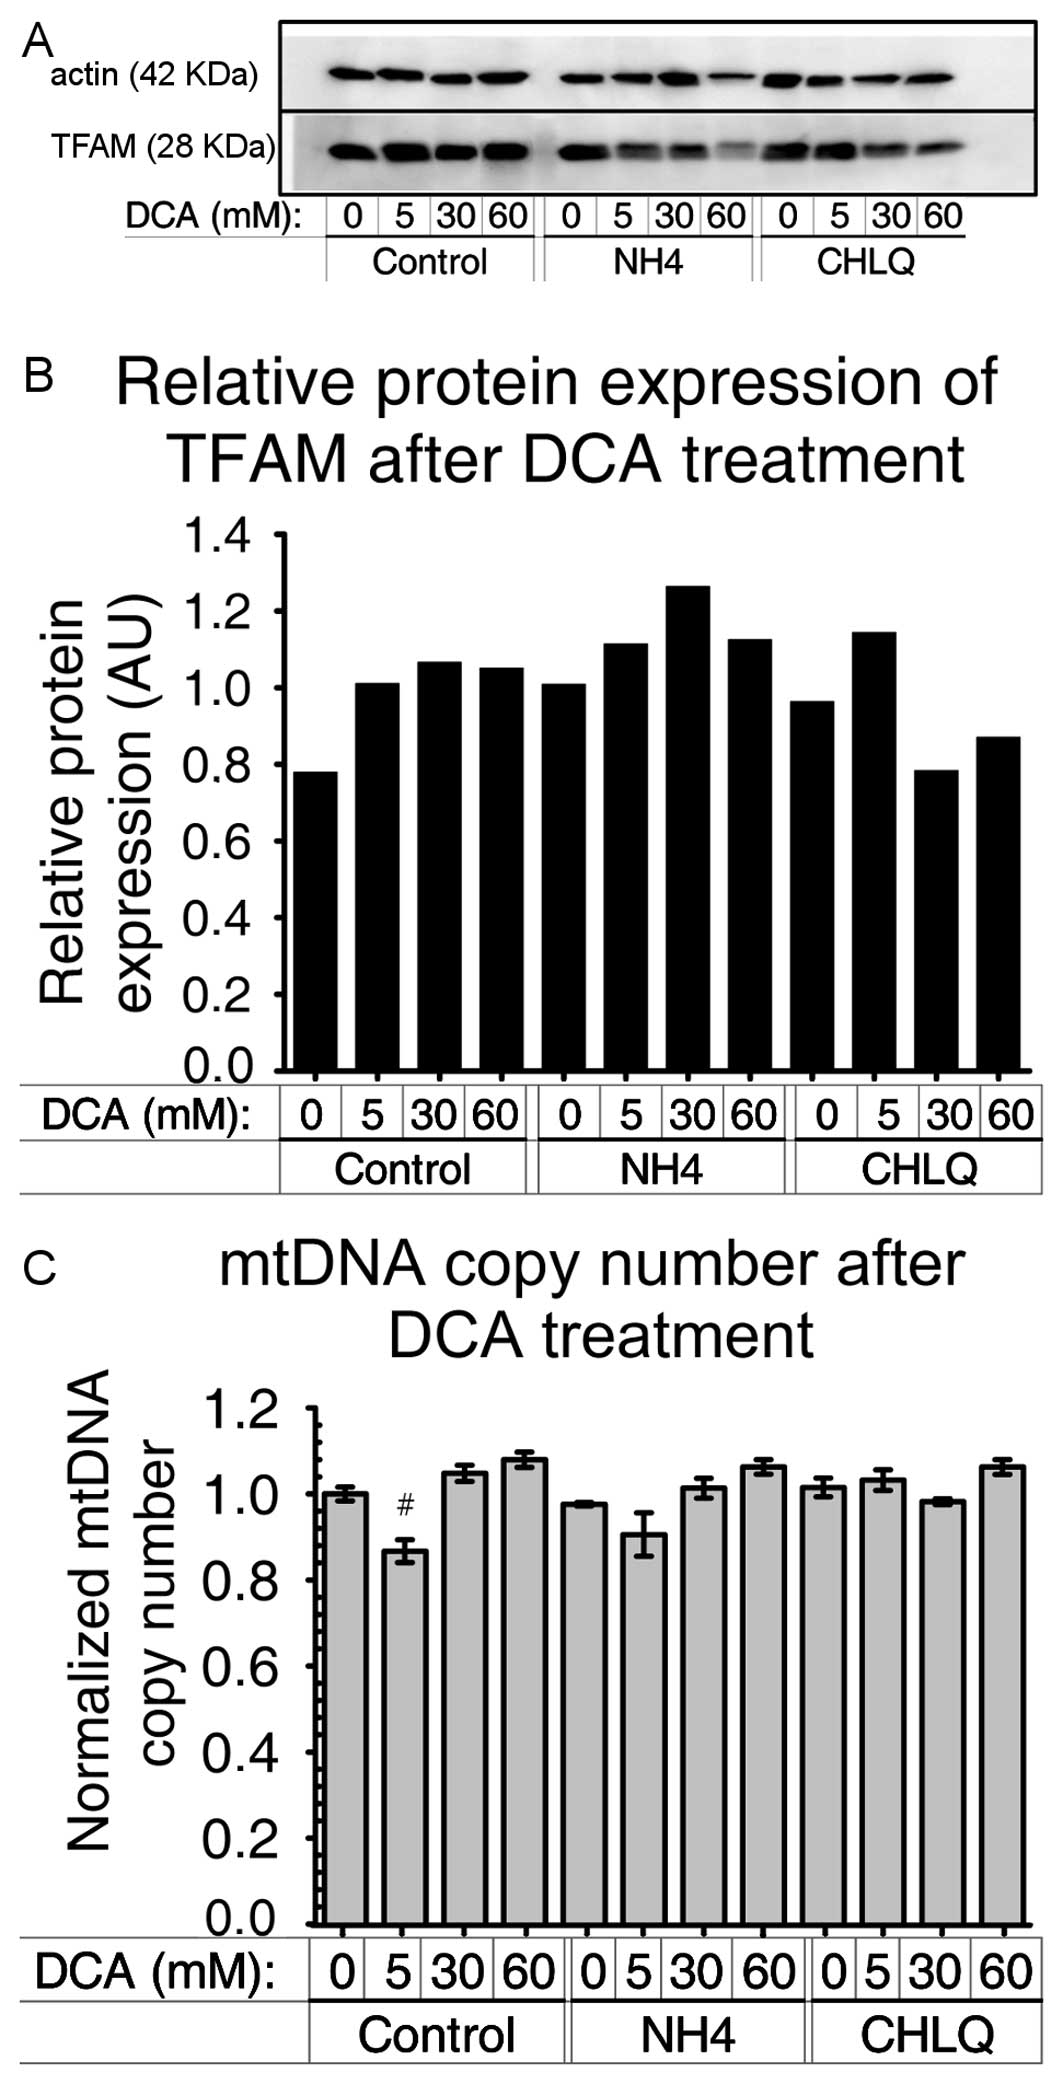
DCA does not alter mitochondrial DNA
density in SH-SY5Y cells
We used TFAM as a marker of mtDNA density. The
results obtained by immunoblotting did not show a significant
difference in TFAM protein levels due to DCA treatment or the
co-treatment with NH4Cl or CHLQ (Fig. 5A and B).
To verify these results, we also analyzed the number
of mitochondrial DNA copies by real-time PCR. Fig. 5C shows the mitochondrial DNA copy
number. No significant differences were found. Only a small
difference was obtained between the control group treated with 5 mM
DCA and the untreated control, with a P-value of 0.07 using two-way
ANOVA (Fig. 5C).
Discussion
We treated neuroblastoma SH-S5YS cells with DCA. The
concentration of 60 mM was chosen as the maximum dose because
previous studies reported that DCA is relatively inactive in
different cells lines when used at low doses (5,28),
despite the fact that such a concentration is unlikely to be
achieved in vivo. To perform an accurate analysis, we also
studied two additional groups that were co-treated with DCA and the
mitophagy-blocking compounds NH4Cl or CHLQ. The purpose
was to observe the accumulation of mitophagy marker proteins and
analyze the changes in these proteins after the DCA treatment.
NH4Cl inhibits lysosomal proteolysis and is independent
of the type autophagy that delivers substrates to lysosomes
(29). CHLQ is a well-known
inhibitor of the final step in the autophagy pathway (30). However, both NH4Cl and
CHLQ may have other side effects. For example, CHLQ has been shown
to reduce tumor growth, hypoxia, cancer cell invasion, and
metastasis but facilitate chemotherapy delivery and the tumor
milieu by improving tumor perfusion and oxygenation (31).
Dose-dependent decreases in membrane proteins such
as Tim23, PINK1, Parkin and FIS1 suggest that autophagy is involved
in the degradation of mitochondrial membrane components, a process
known as mitophagy. This is most visible for Parkin and Tim23 in
the control groups without autophagy blockers. In our experiments,
the two autophagy blockers did not have identical effects, although
both had similar effects.
DCA has high bioavailability, as it can easily pass
through the plasma and mitochondrial membranes via the
monocarboxylate and pyruvate transporter systems, respectively. It
also easily crosses the blood-brain barrier and may concentrate in
the mitochondria (32,33).
Recently, it has been demonstrated that DCA induces
autophagosome formation and autophagy due to ROS accumulation in
LoVo cells. Although, four additional colorectal cancer cell lines,
which are similar to LoVo cells, proved to be less sensitive to DCA
treatment (34). Moreover, it has
been reported that inhibitors of autophagy were able to promote
apoptosis induced by anticancer drugs, which suggested that
autophagy could have a protective role in cancer cells (34,35).
In this report, we studied how sensitive DCA
treatment is in neuroblastoma SH-SY5Y cells. Initially, we assessed
the sensitivity of SH-SY5Y cells to DCA by a cell viability
experiment. As expected, we found that DCA led to a decrease in
viable cells. Surprisingly, this decrease was equal to the decrease
seen with two higher DCA doses. Thus, the 60 mM dose of DCA
produced the same effects as the 30 mM DCA dose. It is noteworthy
that even the lowest DCA dose (5 mM) caused a significant decrease
in the number of viable cells. The difference in the number of
viable cells compared to the control group is represented by the
cells that have died or are undergoing apoptosis. Cells were
frequently detached and found in suspension, indicating that a
percentage of cells were undergoing apoptosis. This was a feature
that we observed only in cells treated with DCA, not in control
cells. Nevertheless, all experiments were performed with the viable
cells after treatment. Thus, the cells in suspension were not used
in any analysis.
Our results confirmed previous reports on the
pro-apoptotic and anti-proliferative effects of DCA in human
non-small cell lung cancer (A549), glioblastoma (MO59K), breast
cancer (MFC-7) (1) and endometrial
cancer cells (36). Moreover, the
use of autophagy inhibitors such as 3-methyladenine (3-MA) or, in
our case, NH4Cl or CHLQ in combination with DCA has been
reported to significantly enhance DCA-induced apoptosis (34). Contrary to our observations, a
recent study of DCA effects in colorectal and prostate cancer cell
lines reported a minimal effect of DCA on apoptosis. Even so, the
authors noted that despite not observing apoptosis, they observed
an increase in LC3b-II expression (2). This dual behavior of DCA, stimulating
apoptosis in some cases and not in others, could be cell
type-dependent and due to differences in the expression of PDK
isozymes of the examined cancer cells (37).
Our data suggest that a certain percentage of
apoptosis is induced by DCA treatment, but the percentage of
apoptosis is not increased in a dose-dependent response as we
initially thought. A possible explanation to why some cells undergo
apoptosis and others do not when treated with the same
concentration of DCA could be the conclusion arrived to by Vella
et al (37), reporting that
the effects of DCAs are restricted to undifferentiated, malignant,
fully cycling neuroblastoma cells, whereas DCA does not affect the
proliferation rate of more differentiated, poorly malignant
neuroblastoma cells (37).
We further related the effects of DCA treatment to
mitophagy by evaluating a set of proteins involved in mitochondrial
network dynamics and protein degradation. We analyzed the copy
number of mitochondrial DNA and the mitochondrial network
morphology.
It has been reported that DCA treatment reduced the
mitochondrial membrane potential in a dose-dependent manner
(1). We found that there was a
slight decrease in the intensity emitted by TMRE in cells that were
treated with the highest dose of DCA. In all cases, it was
sufficient to evaluate the mitochondrial network. One of our
findings was that increasing DCA doses led to the mitochondrial
network becoming more condensed. The long filaments of the
mitochondrial network were a feature unique to the control group
(Fig. 2).
The LC3b proteins are involved in phagophore
formation and are commonly used markers for examining autophagy. A
high ratio of LC3b-I to LC3b-II is a typical finding in cells of
neuronal origin (38). For
instance, SH-SY5Y neuroblastoma cell lines display only a slight
increase in LC3b-II after nutrient deprivation, whereas LC3b-I is
clearly reduced. This is likely related to a high basal autophagic
flux, as suggested by the higher increase in LC3b-II when cells are
treated with NH4Cl (39,40),
although cell-specific differences in transcriptional regulation of
LC3b may also play a role. The pattern of LC3b-I to LC3b-II
conversion seems to be not only cell-specific but also related to
certain cellular stresses. SH-SY5Y cells displayed a strong
increase in LC3b-II when treated with CHLQ. The ratio
LC3b-II/LC3b-I was very low and unchanged in the control group
because the high turnover of LC3b in these cells. This ratio was
unchanged at low doses but increased at 30 mM DCA and increased
drastically at 60 mM DCA during the co-treatment with mitophagy
blockers (Fig. 3). These results
suggest that a high DCA concentration stimulates phagophore
formation, leading to autophagy after 16 h of treatment in SH-SY5Y
neuroblastoma cells. Therefore, we suggest that the loss of cell
viability due to the DCA treatment at low concentrations observed
after 16 h is not caused by mitophagy in SH-SY5Y cells.
Recent in vitro studies suggested that PINK1
and Parkin cooperate in a pathway to regulate mitochondrial quality
via degradation of dysfunctional mitochondria by mitophagy
(41). For mitochondrial
degradation, PINK1 reportedly recruits Parkin from the cytoplasm to
damaged mitochondria in a manner that is dependent on the
mitochondria membrane potential (42). Moreover, PINK1 and Parkin initiate
the removal of mitochondrial proteins via the ubiquitin-proteasome
system (43). It has been reported
that deficits in PINK1 and Parkin alter the balance between
mitochondrial fission and fusion (43). Our results show that a higher DCA
concentration reduced the presence of both PINK1 isoforms (Fig. 4A, E and F). Moreover, Parkin was
decreased in a dose-response manner with increasing DCA
concentrations (Fig. 4A and D).
This result confirmed previous studies in which knockdown of PINK1
in HeLa cells and human neuronal SH-SY5Y cells caused mitochondrial
fragmentation, an effect that was reversed by overexpression of
Parkin (44,45). Thus, our data indicate that lower
protein expression of PINK1 and Parkin due to DCA treatment induced
further fragmentation of the mitochondrial network in SH-SY5Y
cells, as observed in the microscopy images (Fig. 2).
Mitochondrial fission is essential for autophagy. We
have shown that the FIS1 levels decreased in a dose-dependent
manner after the DCA treatment. This decrease in FIS1 was most
evident in the groups in which the process of autophagy was blocked
with NH4Cl or CHLQ (Fig. 4A
and H). It has been previously reported that silencing FIS1
with RNAi is associated with an inhibition of mitochondrial
autophagy and the accumulation of damaged mitochondrial material,
leading to a decrease in metabolic function and insulin secretion.
Furthermore, this same study showed that silencing FIS1 had mild
changes in mitochondrial structure (46). Contrary to our initial hypothesis,
DCA decreases FIS1 and, therefore, mitochondrial fission in SH-SY5Y
cells and presumably protects against mitophagy.
When comparing (0 mM) DCA controls among all three
groups (control, NH4Cl, CHLQ), blocking terminal phases
of autophagy itself decreases the relative protein expression of
Parkin and Tim23. However, a much more significant shift was
observed when comparing the control, NH4Cl and CHLQ
group cells treated by the most toxic dose of DCA (60 mM). Thus,
blocking autophagy leads to a much stronger decrease in PINK1,
Parkin, FIS1, OPA1 and Tim23.
OPA1 is a dynamin-related GTPase protein involved in
inner mitochondrial membrane fusion, which maintains the connected
mitochondrial network and correct cristae morphology (47). OPA1 expression increases during
mitochondrial elongation (48,49).
Though OPA1 protein levels decreased with higher DCA
concentrations, especially in combination with mitophagy blockers,
the levels of both OPA1 isoforms remained unchanged with other DCA
treatments, leading us to conclude that DCA produces a minimal
effect on OPA1 protein expression. Only the higher DCA dose induced
mitochondrial fragmentation, which is partly due to the decrease in
the smaller OPA1 isoform. This is similar to a report in which
OPA1-depleted neuronal cells exhibited impaired mitochondrial
hyperfilamentation and synaptic number (50).
The short and long isoforms of OPA1 arise from
proteolytic cleavage, and their ratio may serve as a stress
indicator (51). The OPA1 ratio of
short to long isoforms was increased with a higher concentration of
DCA. Interestingly, OPA1 short/long isoform ratios were unaltered
from 0 to 30 mM DCA. This result indicated that the higher dose of
DCA was a unique dose that produced stress in the cells.
We found that neither the mitochondrial DNA copy
number (Fig. 5C) nor TFAM protein
levels (Fig. 5A and B) were
modified by the DCA treatment. TFAM protein levels are generally
used as a mitochondrial density marker because TFAM is part of
mitochondrial DNA-containing structures called nucleoids (52). Thus, we confirmed a previous study
reporting that the treatment of C. elegans with DCA did not
affect the mitochondrial DNA copy number as examined by real-time
PCR (53). This is in contrast to
previous reports that DCA treatment stimulates the removal of
mitochondria, resulting in the mitophagy in cancer cells, such as
LoVo cells (34) or colorectal
cells (2). We have two possible
explanations for these results. One is that the effects produced by
DCA did not affect mitochondrial density and thus did not induce
mitophagy, but DCA does affect the removal of other organelles of
the cell in the form of autophagy. The other explanation is that
DCA reduced the number of mitochondria maintaining the mtDNA
density. In other words, DCA induced partial mitophagy in which the
nucleoids are preserved.
We also analyzed Tim23 protein levels. Tim23 is a
component of the TIM23 complex, which is present in the inner
mitochondrial membrane. Because of its localization, we used Tim23
as a marker of the mitochondrial inner membrane (54). Tim23 protein levels decreased with
increasing DCA doses. Co-treatment with autophagy blockers
increased this effect. These results indicate that DCA decreased
mitochondria numbers leading to mitophagy, which was also indicated
by the LC3b ratio.
We suggest that DCA induces partial mitophagy
preserving nucleoids. It is for this reason we could not detect a
decrease in the number of mtDNA copies nor TFAM protein levels.
In conclusion, in this study, we show that DCA
causes cell death in SH-SY5Y neuroblastoma cells. The surviving
cells after DCA treatment exhibit an altered mitochondrial network
morphology that was made up of shorter and more fragmented
filaments. We related this mitochondrial network restructuring to
changes in FIS1, PINK1, Parkin and LC3b protein levels. Although
DCA treatment did not change the number of mtDNA copies and TFAM
levels, we suggest that DCA causes partial mitophagy preserving the
nucleoids.
Additionally, our data show that autophagy in
general is a key mechanism to maintain proper mitochondrial content
by balancing fission and fusion processes. Fission and fusion are
regulated by mitophagy proteins (PINK1 and Parkin) and FIS1, and
the mitochondrial density can be monitored by internal membrane
components such as Tim23. Disturbances caused by blocking terminal
phases of autophagy with NH4Cl and CHLQ decreases the
levels of these proteins. These protein levels are further
decreased when co-treated with NH4Cl or CHLQ and DCA in
comparison to negative controls, suggesting that autophagy plays a
protective role against the toxic effects of DCA.
Acknowledgements
This study was supported within the project The
Centre of Biomedical Research (CZ.1.07/2.3.00/30.0025). This study
was also co-funded by the European Social Fund and the state budget
of the Czech Republic.
Abbreviations:
|
3-MA
|
3-methyladenine
|
|
ATP
|
adenosine triphosphate
|
|
AU
|
arbitrary units
|
|
BCA
|
bicinchoninic acid solution
|
|
BSA
|
bovine serum albumin
|
|
CHLQ
|
chloroquine
|
|
DCA
|
dichloroacetate
|
|
DMEM
|
Dulbecco’s modified Eagle’s medium
|
|
DRP1
|
dynamin related protein 1
|
|
FIS1
|
mitochondrial fission protein 1
|
|
LC3b
|
MAP1LC3B, microtubule-associated
protein 1 light chain 3β
|
|
mtDNA
|
mitochondrial DNA
|
|
OPA1
|
optic atrophy 1
|
|
OXPHOS
|
oxidative phosphorylation
|
|
PAGE
|
polyacrylamide gel electrophoresis
|
|
Parkin
|
E3 ubiquitin-protein ligase parkin
|
|
PBS
|
phosphate-buffered saline
|
|
PINK1
|
PTEN-induced kinase 1
|
|
PVDF
|
polyvinylidene difluoride
|
|
RIPA
|
radioimmunoprecipitation assay
buffer
|
|
SDS
|
sodium dodecyl sulfate
|
|
TBS
|
Tris-buffered saline
|
|
TBS-T
|
Tris-buffered saline-Tween
|
|
TFAM
|
transcription factor A,
mitochondrial
|
|
Tim23
|
mitochondrial import inner membrane
translocase subunit Tim23
|
|
TMRE
|
tetramethylrhodamine ethyl ester
|
References
|
1
|
Bonnet S, Archer SL, Allalunis-Turner J,
Haromy A, Beaulieu C, Thompson R, Lee CT, Lopaschuk GD, Puttagunta
L, Bonnet S, et al: A mitochondria-K+ channel axis is
suppressed in cancer and its normalization promotes apoptosis and
inhibits cancer growth. Cancer Cell. 11:37–51. 2007. View Article : Google Scholar : PubMed/NCBI
|
|
2
|
Lin G, Hill DK, Andrejeva G, Boult JK,
Troy H, Fong AC, Orton MR, Panek R, Parkes HG, Jafar M, et al:
Dichloroacetate induces autophagy in colorectal cancer cells and
tumours. Br J Cancer. 111:375–385. 2014. View Article : Google Scholar : PubMed/NCBI
|
|
3
|
Stacpoole PW: The pharmacology of
dichloroacetate. Metabolism. 38:1124–1144. 1989. View Article : Google Scholar : PubMed/NCBI
|
|
4
|
Sun RC, Fadia M, Dahlstrom JE, Parish CR,
Board PG and Blackburn AC: Reversal of the glycolytic phenotype by
dichloroacetate inhibits metastatic breast cancer cell growth in
vitro and in vivo. Breast Cancer Res Treat. 120:253–260. 2010.
View Article : Google Scholar
|
|
5
|
Madhok BM, Yeluri S, Perry SL, Hughes TA
and Jayne DG: Dichloroacetate induces apoptosis and cell-cycle
arrest in colorectal cancer cells. Br J Cancer. 102:1746–1752.
2010. View Article : Google Scholar : PubMed/NCBI
|
|
6
|
Cao W, Yacoub S, Shiverick KT, Namiki K,
Sakai Y, Porvasnik S, Urbanek C and Rosser CJ: Dichloroacetate
(DCA) sensitizes both wild-type and over expressing Bcl-2 prostate
cancer cells in vitro to radiation. Prostate. 68:1223–1231. 2008.
View Article : Google Scholar : PubMed/NCBI
|
|
7
|
Sun RC, Board PG and Blackburn AC:
Targeting metabolism with arsenic trioxide and dichloroacetate in
breast cancer cells. Mol Cancer. 10:1422011. View Article : Google Scholar : PubMed/NCBI
|
|
8
|
Ayyanathan K, Kesaraju S, Dawson-Scully K
and Weissbach H: Combination of sulindac and dichloroacetate kills
cancer cells via oxidative damage. PLoS One. 7:e399492012.
View Article : Google Scholar : PubMed/NCBI
|
|
9
|
Sanchez WY, McGee SL, Connor T, Mottram B,
Wilkinson A, Whitehead JP, Vuckovic S and Catley L: Dichloroacetate
inhibits aerobic glycolysis in multiple myeloma cells and increases
sensitivity to bortezomib. Br J Cancer. 108:1624–1633. 2013.
View Article : Google Scholar : PubMed/NCBI
|
|
10
|
Fantin VR, St-Pierre J and Leder P:
Attenuation of LDH-A expression uncovers a link between glycolysis,
mitochondrial physiology, and tumor maintenance. Cancer Cell.
9:425–434. 2006. View Article : Google Scholar : PubMed/NCBI
|
|
11
|
Gaude E and Frezza C: Defects in
mitochondrial metabolism and cancer. Cancer Metab. 2:102014.
View Article : Google Scholar : PubMed/NCBI
|
|
12
|
Weinberg F, Hamanaka R, Wheaton WW,
Weinberg S, Joseph J, Lopez M, Kalyanaraman B, Mutlu GM, Budinger
GR and Chandel NS: Mitochondrial metabolism and ROS generation are
essential for Kras-mediated tumorigenicity. Proc Natl Acad Sci USA.
107:8788–8793. 2010. View Article : Google Scholar : PubMed/NCBI
|
|
13
|
Singleterry J, Sreedhar A and Zhao Y:
Components of cancer metabolism and therapeutic interventions.
Mitochondrion. 17:50–55. 2014. View Article : Google Scholar : PubMed/NCBI
|
|
14
|
Astuti D, Hart-Holden N, Latif F, Lalloo
F, Black GC, Lim C, Moran A, Grossman AB, Hodgson SV, Freemont A,
et al: Genetic analysis of mitochondrial complex II subunits SDHD,
SDHB and SDHC in paraganglioma and phaeochromocytoma
susceptibility. Clin Endocrinol (Oxf). 59:728–733. 2003. View Article : Google Scholar
|
|
15
|
Wallace DC: Mitochondria and cancer. Nat
Rev Cancer. 12:685–698. 2012. View Article : Google Scholar : PubMed/NCBI
|
|
16
|
Youle RJ and Karbowski M: Mitochondrial
fission in apoptosis. Nat Rev Mol Cell Biol. 6:657–663. 2005.
View Article : Google Scholar : PubMed/NCBI
|
|
17
|
Chen H and Chan DC: Mitochondrial dynamics
- fusion, fission, movement, and mitophagy - in neurodegenerative
diseases. Hum Mol Genet. 18(R2): R169–R176. 2009. View Article : Google Scholar : PubMed/NCBI
|
|
18
|
Raynaud FI, Eccles S, Clarke PA, Hayes A,
Nutley B, Alix S, Henley A, Di-Stefano F, Ahmad Z, Guillard S, et
al: Pharmacologic characterization of a potent inhibitor of class I
phosphatidylinositide 3-kinases. Cancer Res. 67:5840–5850. 2007.
View Article : Google Scholar : PubMed/NCBI
|
|
19
|
Klionsky DJ, Abdalla FC, Abeliovich H,
Abraham RT, Acevedo-Arozena A, Adeli K, Agholme L, Agnello M,
Agostinis P, Aguirre-Ghiso JA, et al: Guidelines for the use and
interpretation of assays for monitoring autophagy. Autophagy.
8:445–544. 2012. View Article : Google Scholar : PubMed/NCBI
|
|
20
|
Biedler JL, Roffler-Tarlov S, Schachner M
and Freedman LS: Multiple neurotransmitter synthesis by human
neuroblastoma cell lines and clones. Cancer Res. 38:3751–3757.
1978.PubMed/NCBI
|
|
21
|
Matthay KK: Neuroblastoma: biology and
therapy. Oncology (Williston Park). 11:1857–66; discussion 1869–72,
1875. 1997.
|
|
22
|
Alán L, Špaček T, Zelenka J, Tauber J,
Berková Z, Zacharovová K, Saudek F and Ježek P: Assessment of
mitochondrial DNA as an indicator of islet quality: An example in
Goto Kakizaki rats. Transplant Proc. 43:3281–3284. 2011. View Article : Google Scholar : PubMed/NCBI
|
|
23
|
Karess RE, Hayward WS and Hanafusa H:
Cellular information in the genome of recovered avian sarcoma virus
directs the synthesis of transforming protein. Proc Natl Acad Sci
USA. 76:3154–3158. 1979. View Article : Google Scholar : PubMed/NCBI
|
|
24
|
Morton RE and Evans TA: Modification of
the bicinchoninic acid protein assay to eliminate lipid
interference in determining lipoprotein protein content. Anal
Biochem. 204:332–334. 1992. View Article : Google Scholar : PubMed/NCBI
|
|
25
|
Paulson JR and Laemmli UK: The structure
of histone-depleted metaphase chromosomes. Cell. 12:817–828. 1977.
View Article : Google Scholar : PubMed/NCBI
|
|
26
|
Schneider CA, Rasband WS and Eliceiri KW:
NIH Image to ImageJ: 25 years of image analysis. Nat Methods.
9:671–675. 2012. View Article : Google Scholar : PubMed/NCBI
|
|
27
|
Scaduto RC Jr and Grotyohann LW:
Measurement of mitochondrial membrane potential using fluorescent
rhodamine derivatives. Biophys J. 76:469–477. 1999. View Article : Google Scholar : PubMed/NCBI
|
|
28
|
Stockwin LH, Yu SX, Borgel S, Hancock C,
Wolfe TL, Phillips LR, Hollingshead MG and Newton DL: Sodium
dichloroacetate selectively targets cells with defects in the
mitochondrial ETC. Int J Cancer. 127:2510–2519. 2010. View Article : Google Scholar : PubMed/NCBI
|
|
29
|
Cuervo AM, Stefanis L, Fredenburg R,
Lansbury PT and Sulzer D: Impaired degradation of mutant
alpha-synuclein by chaperone-mediated autophagy. Science.
305:1292–1295. 2004. View Article : Google Scholar : PubMed/NCBI
|
|
30
|
Maclean KH, Dorsey FC, Cleveland JL and
Kastan MB: Targeting lysosomal degradation induces p53-dependent
cell death and prevents cancer in mouse models of lymphomagenesis.
J Clin Invest. 118:79–88. 2008. View Article : Google Scholar
|
|
31
|
Maes H, Kuchnio A, Peric A, Moens S, Nys
K, De Bock K, Quaegebeur A, Schoors S, Georgiadou M, Wouters J, et
al: Tumor vessel normalization by chloroquine independent of
autophagy. Cancer Cell. 26:190–206. 2014. View Article : Google Scholar : PubMed/NCBI
|
|
32
|
Stacpoole PW: The dichloroacetate dilemma:
Environmental hazard versus therapeutic goldmine - both or neither?
Environ Health Perspect. 119:155–158. 2011. View Article : Google Scholar :
|
|
33
|
Kankotia S and Stacpoole PW:
Dichloroacetate and cancer: New home for an orphan drug? Biochim
Biophys Acta. 1846:617–629. 2014.PubMed/NCBI
|
|
34
|
Gong F, Peng X, Sang Y, Qiu M, Luo C, He
Z, Zhao X and Tong A: Dichloroacetate induces protective autophagy
in LoVo cells: Involvement of cathepsin D/thioredoxin-like protein
1 and Akt-mTOR-mediated signaling. Cell Death Dis. 4:e9132013.
View Article : Google Scholar : PubMed/NCBI
|
|
35
|
Cheng P, Ni Z, Dai X, Wang B, Ding W, Rae
Smith A, Xu L, Wu D, He F and Lian J: The novel BH-3 mimetic
apogossypolone induces Beclin-1- and ROS-mediated autophagy in
human hepatocellular carcinoma cells. [corrected]. Cell Death Dis.
4:e4892013. View Article : Google Scholar
|
|
36
|
Wong JYY, Huggins GS, Debidda M, Munshi NC
and De Vivo I: Dichloroacetate induces apoptosis in endometrial
cancer cells. Gynecol Oncol. 109:394–402. 2008. View Article : Google Scholar : PubMed/NCBI
|
|
37
|
Vella S, Conti M, Tasso R, Cancedda R and
Pagano A: Dichloroacetate inhibits neuroblastoma growth by
specifically acting against malignant undifferentiated cells. Int J
Cancer. 130:1484–1493. 2012. View Article : Google Scholar
|
|
38
|
Cai Q, Lu L, Tian J-H, Zhu Y-B, Qiao H and
Sheng Z-H: Snapin-regulated late endosomal transport is critical
for efficient autophagy-lysosomal function in neurons. Neuron.
68:73–86. 2010. View Article : Google Scholar : PubMed/NCBI
|
|
39
|
Castino R, Fiorentino I, Cagnin M, Giovia
A and Isidoro C: Chelation of lysosomal iron protects dopaminergic
SH-SY5Y neuroblastoma cells from hydrogen peroxide toxicity by
precluding autophagy and Akt dephosphorylation. Toxicol Sci.
123:523–541. 2011. View Article : Google Scholar : PubMed/NCBI
|
|
40
|
Michiorri S, Gelmetti V, Giarda E,
Lombardi F, Romano F, Marongiu R, Nerini-Molteni S, Sale P, Vago R,
Arena G, et al: The Parkinson-associated protein PINK1 interacts
with Beclin1 and promotes autophagy. Cell Death Differ. 17:962–974.
2010. View Article : Google Scholar : PubMed/NCBI
|
|
41
|
Youle RJ and Narendra DP: Mechanisms of
mitophagy. Nat Rev Mol Cell Biol. 12:9–14. 2011. View Article : Google Scholar
|
|
42
|
Nakahara K, Ueda M, Yamada K, Koide T,
Yoshimochi G, Funayama M, Kim JH, Yamakawa S, Mori A, Misumi Y, et
al: Juvenile-onset Parkinsonism with digenic parkin and PINK1
mutations treated with subthalamic nucleus stimulation at 45 years
after disease onset. J Neurol Sci. 345:276–277. 2014. View Article : Google Scholar : PubMed/NCBI
|
|
43
|
Scarffe LA, Stevens DA, Dawson VL and
Dawson TM: Parkin and PINK1: Much more than mitophagy. Trends
Neurosci. 37:315–324. 2014. View Article : Google Scholar : PubMed/NCBI
|
|
44
|
Exner N, Treske B, Paquet D, Holmström K,
Schiesling C, Gispert S, Carballo-Carbajal I, Berg D, Hoepken HH,
Gasser T, et al: Loss-of-function of human PINK1 results in
mitochondrial pathology and can be rescued by parkin. J Neurosci.
27:12413–12418. 2007. View Article : Google Scholar : PubMed/NCBI
|
|
45
|
Dagda RK, Cherra SJ III, Kulich SM, Tandon
A, Park D and Chu CT: Loss of PINK1 function promotes mitophagy
through effects on oxidative stress and mitochondrial fission. J
Biol Chem. 284:13843–13855. 2009. View Article : Google Scholar : PubMed/NCBI
|
|
46
|
Twig G, Elorza A, Molina AJ, Mohamed H,
Wikstrom JD, Walzer G, Stiles L, Haigh SE, Katz S, Las G, et al:
Fission and selective fusion govern mitochondrial segregation and
elimination by autophagy. EMBO J. 27:433–446. 2008. View Article : Google Scholar : PubMed/NCBI
|
|
47
|
Santin G, Piccolini VM, Barni S, Veneroni
P, Giansanti V, Dal Bo V, Bernocchi G and Bottone MG: Mitochondrial
fusion: A mechanism of cisplatin-induced resistance in
neuroblastoma cells? Neurotoxicology. 34:51–60. 2013. View Article : Google Scholar
|
|
48
|
Cipolat S, Martins de Brito O, Dal Zilio B
and Scorrano L: OPA1 requires mitofusin 1 to promote mitochondrial
fusion. Proc Natl Acad Sci USA. 101:15927–15932. 2004. View Article : Google Scholar : PubMed/NCBI
|
|
49
|
Zorzano A, Liesa M, Sebastián D, Segalés J
and Palacín M: Mitochondrial fusion proteins: Dual regulators of
morphology and metabolism. Semin Cell Dev Biol. 21:566–574. 2010.
View Article : Google Scholar : PubMed/NCBI
|
|
50
|
Bertholet AM, Millet AME, Guillermin O,
Daloyau M, Davezac N, Miquel M-C and Belenguer P: OPA1 loss of
function affects in vitro neuronal maturation. Brain.
136:1518–1533. 2013. View Article : Google Scholar : PubMed/NCBI
|
|
51
|
Duvezin-Caubet S, Jagasia R, Wagener J,
Hofmann S, Trifunovic A, Hansson A, Chomyn A, Bauer MF, Attardi G,
Larsson NG, et al: Proteolytic processing of OPA1 links
mitochondrial dysfunction to alterations in mitochondrial
morphology. J Biol Chem. 281:37972–37979. 2006. View Article : Google Scholar : PubMed/NCBI
|
|
52
|
Kopek BG, Shtengel G, Grimm JB, Clayton DA
and Hess HF: Correlative photoactivated localization and scanning
electron microscopy. PLoS One. 8:e772092013. View Article : Google Scholar : PubMed/NCBI
|
|
53
|
Schaffer S, Gruber J, Ng LF, Fong S, Wong
YT, Tang SY and Halliwell B: The effect of dichloroacetate on
health- and lifespan in C. elegans. Biogerontology. 12:195–209.
2011. View Article : Google Scholar
|
|
54
|
Gandhi S, Muqit MMK, Stanyer L, Healy DG,
Abou-Sleiman PM, Hargreaves I, Heales S, Ganguly M, Parsons L, Lees
AJ, et al: PINK1 protein in normal human brain and Parkinson’s
disease. Brain. 129:1720–1731. 2006. View Article : Google Scholar : PubMed/NCBI
|