Introduction
Colon cancer (~95% cases are adenocarcinoma cancer)
is a sub-site cancer of colorectal cancer, but it is different from
rectal cancer not only in the location but also in the treatments
postoperatively, hence we could have unique considerations in the
patient with colon cancer (1).
Over all, it is one of the most common cancers in the developed
countries.
Cancer arises as a consequence of the accumulation
of epigenetic alterations and genetic alterations (2). Most investigators divide colon cancer
biologically into those with microsatellite instability (MSI) and
those that are microsatellite stable but chromosomally unstable
(CIN) in the genomic level (3). At
expression level, many investigators with different purposes have
identified many marker genes associated with prognosis and
different stages (4). Wang et
al utilized 74 colon cancer samples (31 relapsed in 3 years and
43 disease-free more than 3 years) with Dukes' B stage to reveal
the 23-gene signature that predicted recurrence in Dukes' B
patients (5). In 2006, Barrier
et al investigated 50 patients with stage II colon cancer to
identify 30 prognosis genes (6).
Oh et al applied unsupervised hierarchical clustering
analysis to gene expression data from 177 patients with colorectal
cancer to determine a prognostic gene expression signature
(7). They also found that two
independent groups associated with overall survival and
disease-free survival. Notably, Slattery et al used microRNA
microarray data from 100 patients and discovered relationship
between tumor location and MSI/CIMP subtypes (8). A TCGA group study indicated that
colorectal tumors have three subtypes in gene expression level,
MSI/CIMP, CIN and Invasive (3).
The concept ‘CpG island methylator phenotype’ (CIMP)
was first proposed in 1999 by Toyota et al (9). It was characterized by CpG island
methylation in multiple regions (2). Weisenberger et al reported
four epigenetic subtypes and a list of related marker genes
(10,11). TCGA group also described four
epigenetic subtypes, namely CIMP-H, CIMP-L, cluster 3 and cluster
4, where the union of cluster 3 and cluster 4 was named as Non-CIMP
(3). In other studies, Shen et
al (12) and Yagi et al
(2) identified three epigenetic
subtypes and some hyper-methylation genes as markers.
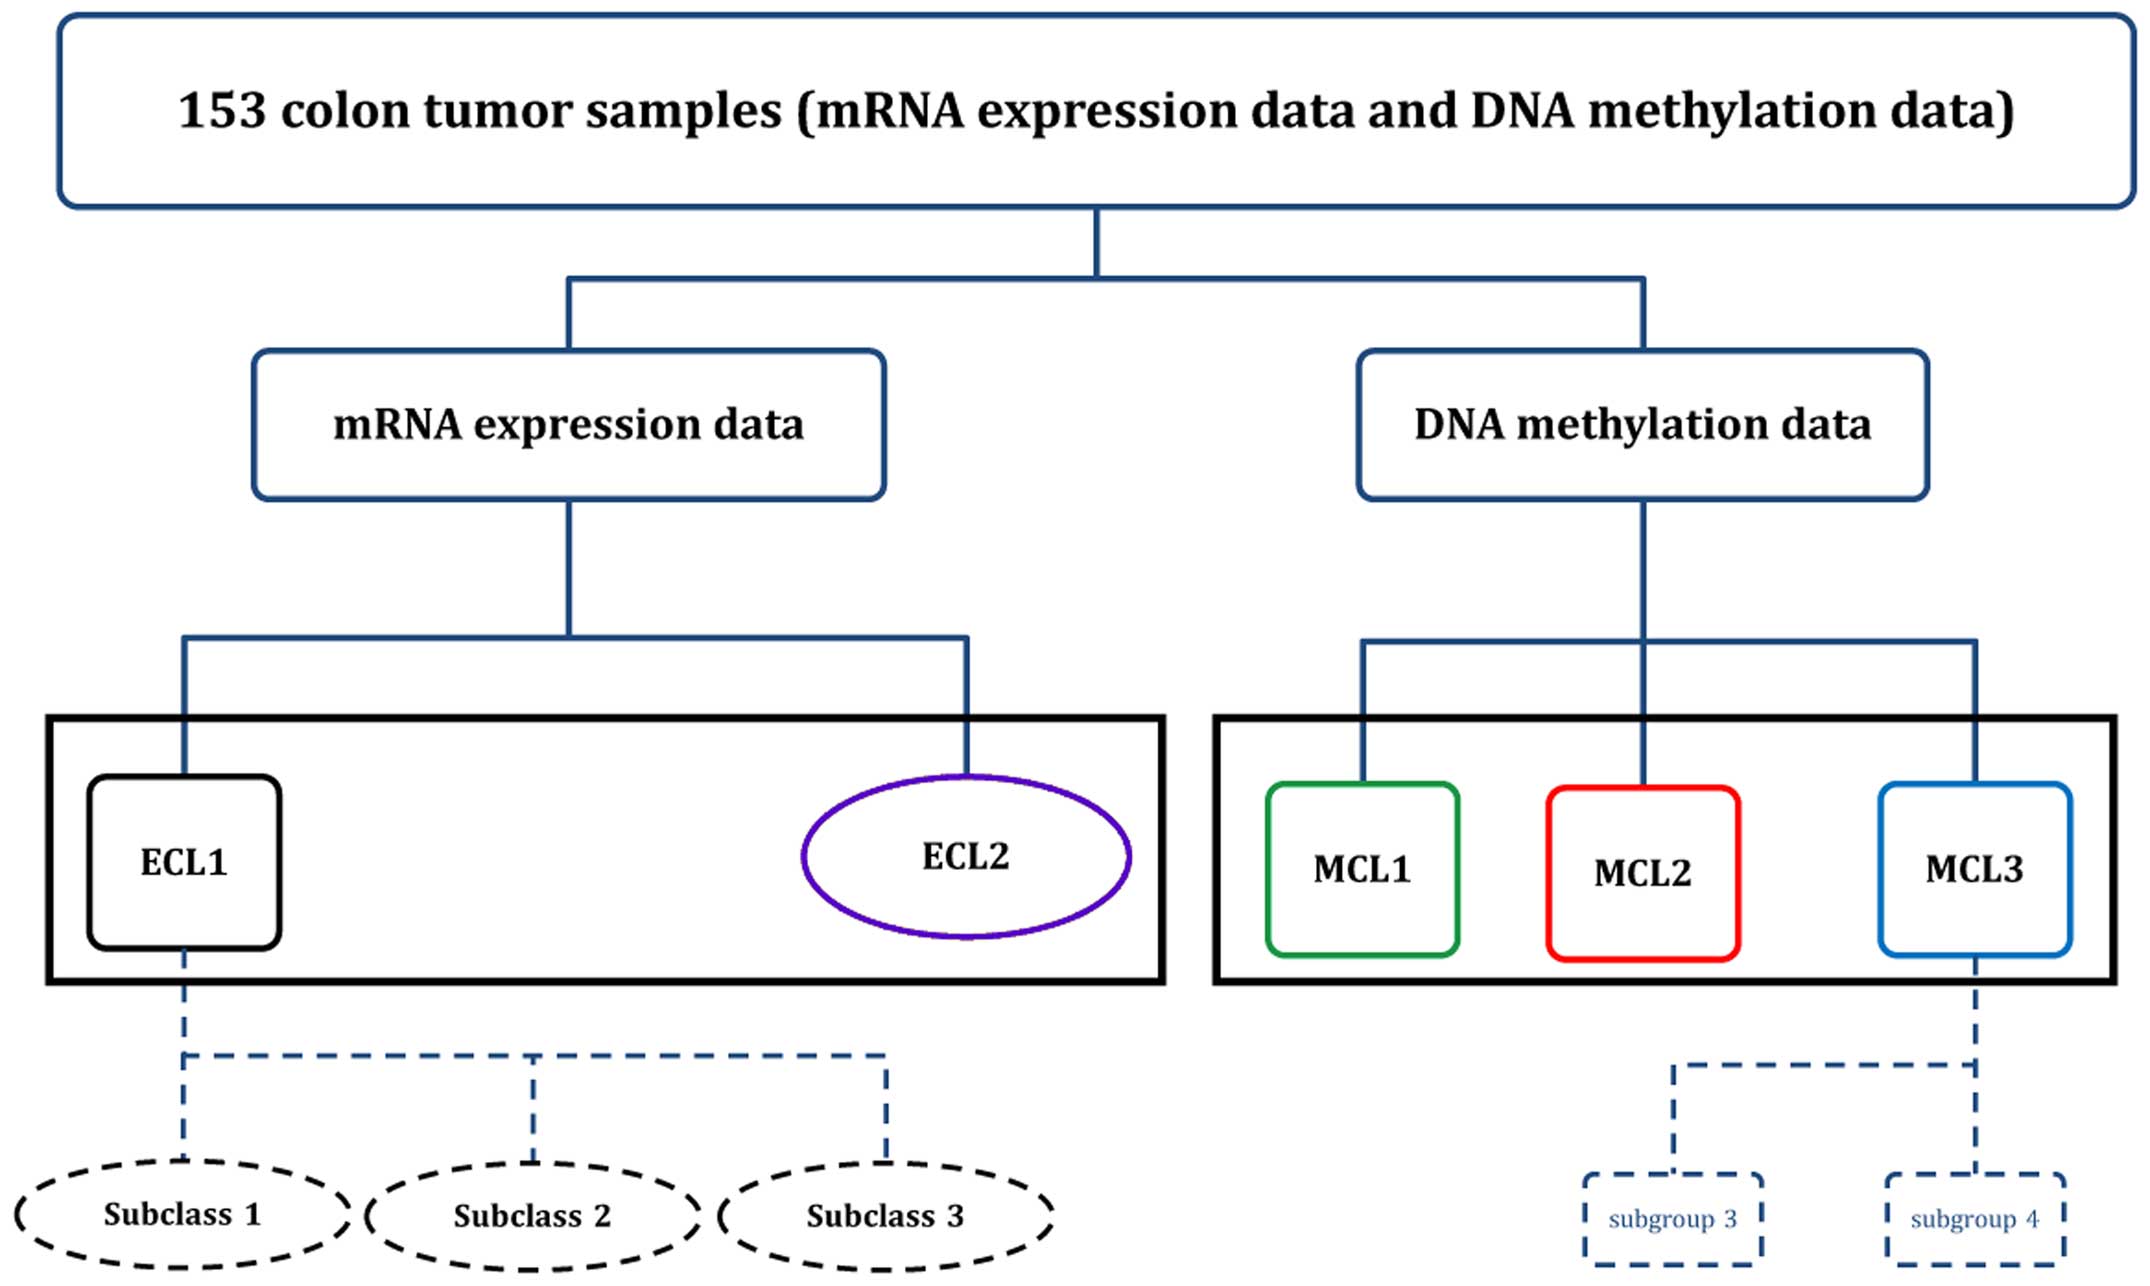
Using the unsupervised clustering approach to 153
colon cancer samples, we reached interesting and different results
compared to the early reports. We identified two subgroups in gene
expression level and three subgroups in DNA methylation level,
respectively. Due to the heterogeneity of samples, we further
identified nested subgroups in ECL1 and MCL3, and by examining the
difference between these nested subgroups we ended up with our
classification of colon cancer molecular subtypes. Our data
suggested that the HOTAIR upregulated samples in CIN have higher
metastasis rate and death rate.
Materials and methods
Patients and microarray data
All clinical information and microarray data in the
two molecular levels were downloaded from TCGA Data Portal
(https://tcga-data.nci.nih.gov/tcga/tcgaHome2.jsp).
A total of 153 colon Adenocarcinoma cancer samples with gene
expression microarray data and DNA methylation microarray data had
subtype labels from previous study (3). The platforms of gene expression and
DNA methylation microarray are Custom Agilent 244K Gene Expression
Microarray (AMDID019760) and Illumina Infinium DNA methylation
(HumanMethylation27 BeadChip), respectively. The data level 3 in
the data portal was used in this study, which means that the gene
expression data was Lowess normalized and the ratio of the Cy5
channel and Cy3 channel were log2 transformed to create gene
expression values for 23199 probe-sets, resulting in 17814 genes
available for further analysis, and the DNA methylation data
contain beta-value calculations, HUGO gene symbol, chromosome
number and genomic coordinate for each targeted CpG site on the
array. Approximately 27578 CpG sites were located in proximity to
the transcription start sites of 14475 consensus coding
sequences.
Gene expression microarray analysis
We combined gene expression data of 153 samples into
one file, and imputed the missing value using KNN Imputed (13). The informative genes for clustering
analysis were selected using a threshold standard deviation SD>1
across all samples, and this resulted in 1393 genes. To perform
consensus clustering (14) we used
K-mean approach with average linkage to detect robust clusters,
where the metric was 1 minus the Pearson's correlation coefficient.
The procedure was run over 2000 iterations and with a sub-sampling
ratio of 0.8. To evaluate the heterogeneity of the subtypes we
applied silhouette width values to identify the most ‘core’ members
of each subtype (15–17), and samples with Silhouette
Score>0.5 were considered as core samples. Significance analysis
of microarrays (18) (SAM) was
applied to identify differentially expressed genes between
subgroups, and the Prediction analysis of microarrays (19) (PAM) was used to obtain marker genes
and establish classifiers. The training set for PAM is 70% of 153
samples selected randomly and the testing set is the other 30% of
the samples. The Gene Ontology analysis was performed for each
subtype using the Database for Annotation, Visualization, and
Integrated Discovery (DAVID) (20,21),
and GeneMANIA (22) was applied to
find the co-expressed network of marker genes.
DNA methylation microarray analysis
After combining data into one file, we removed the
probes containing any ‘NA’ marked data points and the probes that
were designed for the sequences on the X and Y chromosomes. We then
conducted a filtering process to reach a final data matrix with
1491 probes, which exhibited sufficient variable methylation levels
with a threshold standard deviation value (SD>0.2) across all
samples. The DNA methylation microarray data were β-value,
following β-distribution. To use the consensus clustering method, a
data set must be transformed so that it follows a normal
distribution. We used the Transfer Function (23,24)
to transform the β-value into M-value which is normally
distributed, which was similar with RPMM (25) used in β-value in Hinoue et
al (11). Since some subtyping
systems were reported in early studies on DNA methylation of colon
cancer, we only performed the PAM on all samples and did not build
testing sets. DAVID and GeneMANIA were also used on DNA methylation
data.
Statistical analysis of clinical
parameters
All data analyses were done in R platform (Windows
version 2.15.2) (26,27). For the categorical variables in
clinical information table such as gender, tumor subtype (previous
studies), oncogene mutation (Yes or No), the Fisher's exact test
was used to assess the significance of their association to the
subtype derived in this study. For age levels, we used ANOVA to
assess differences among subtypes. The package
ConsensusClusterPlus was used to perform unsupervised
clustering analysis. Package SAMr and PAMr were
applied to identify the differentially expressed genes, to build
the classifier and to determine the marker genes, respectively.
Results
Patient and tumor characteristics
Clinical and pathologic features of the patients and
their tumors were summarized for further analysis. All 153 patients
had information on age, gender, AJCC stage, vital status, tumor
location and subtypes from earlier studies (Table I).
 | Table IClinical data and subtypes identified
by previous studies for 153 colon cancer samples. |
Table I
Clinical data and subtypes identified
by previous studies for 153 colon cancer samples.
|
Characteristics | n (%) |
|---|
| Gender |
| Male | 78 (51.0) |
| Female | 75 (49.0) |
| Age |
| Mean ± SD | 75±11.7 |
| Tumor sub-site |
| Left | 72 (47.1) |
| Right | 80 (52.3) |
| Unknown | 1 (0.6) |
| MSI-status |
| MSI-H | 28 (18.3) |
| MSI-L | 33 (21.6) |
| MSS | 92 (60.1) |
| Expression
subtypes |
| CIN | 57 (37.3) |
| Invasive | 37 (24.2) |
| MSI/CIMP | 58 (37.9) |
| Unknown | 1 (0.6) |
| Methylation
subtypes |
| CIMP-H | 29 (18.9) |
| CIMP-L | 35 (22.9) |
| Cluster 3 | 44 (28.8) |
| Cluster 4 | 45 (29.4) |
| Tumor stage |
| I | 28 (18.3) |
| II | 61 (39.9) |
| III | 39 (25.5) |
| IV | 23 (15.0) |
| Unknown | 2 (1.3) |
| Vital status |
| Living | 138 (90.2) |
| Deceased | 15 (9.8) |
Subgroups identified by gene expression
data
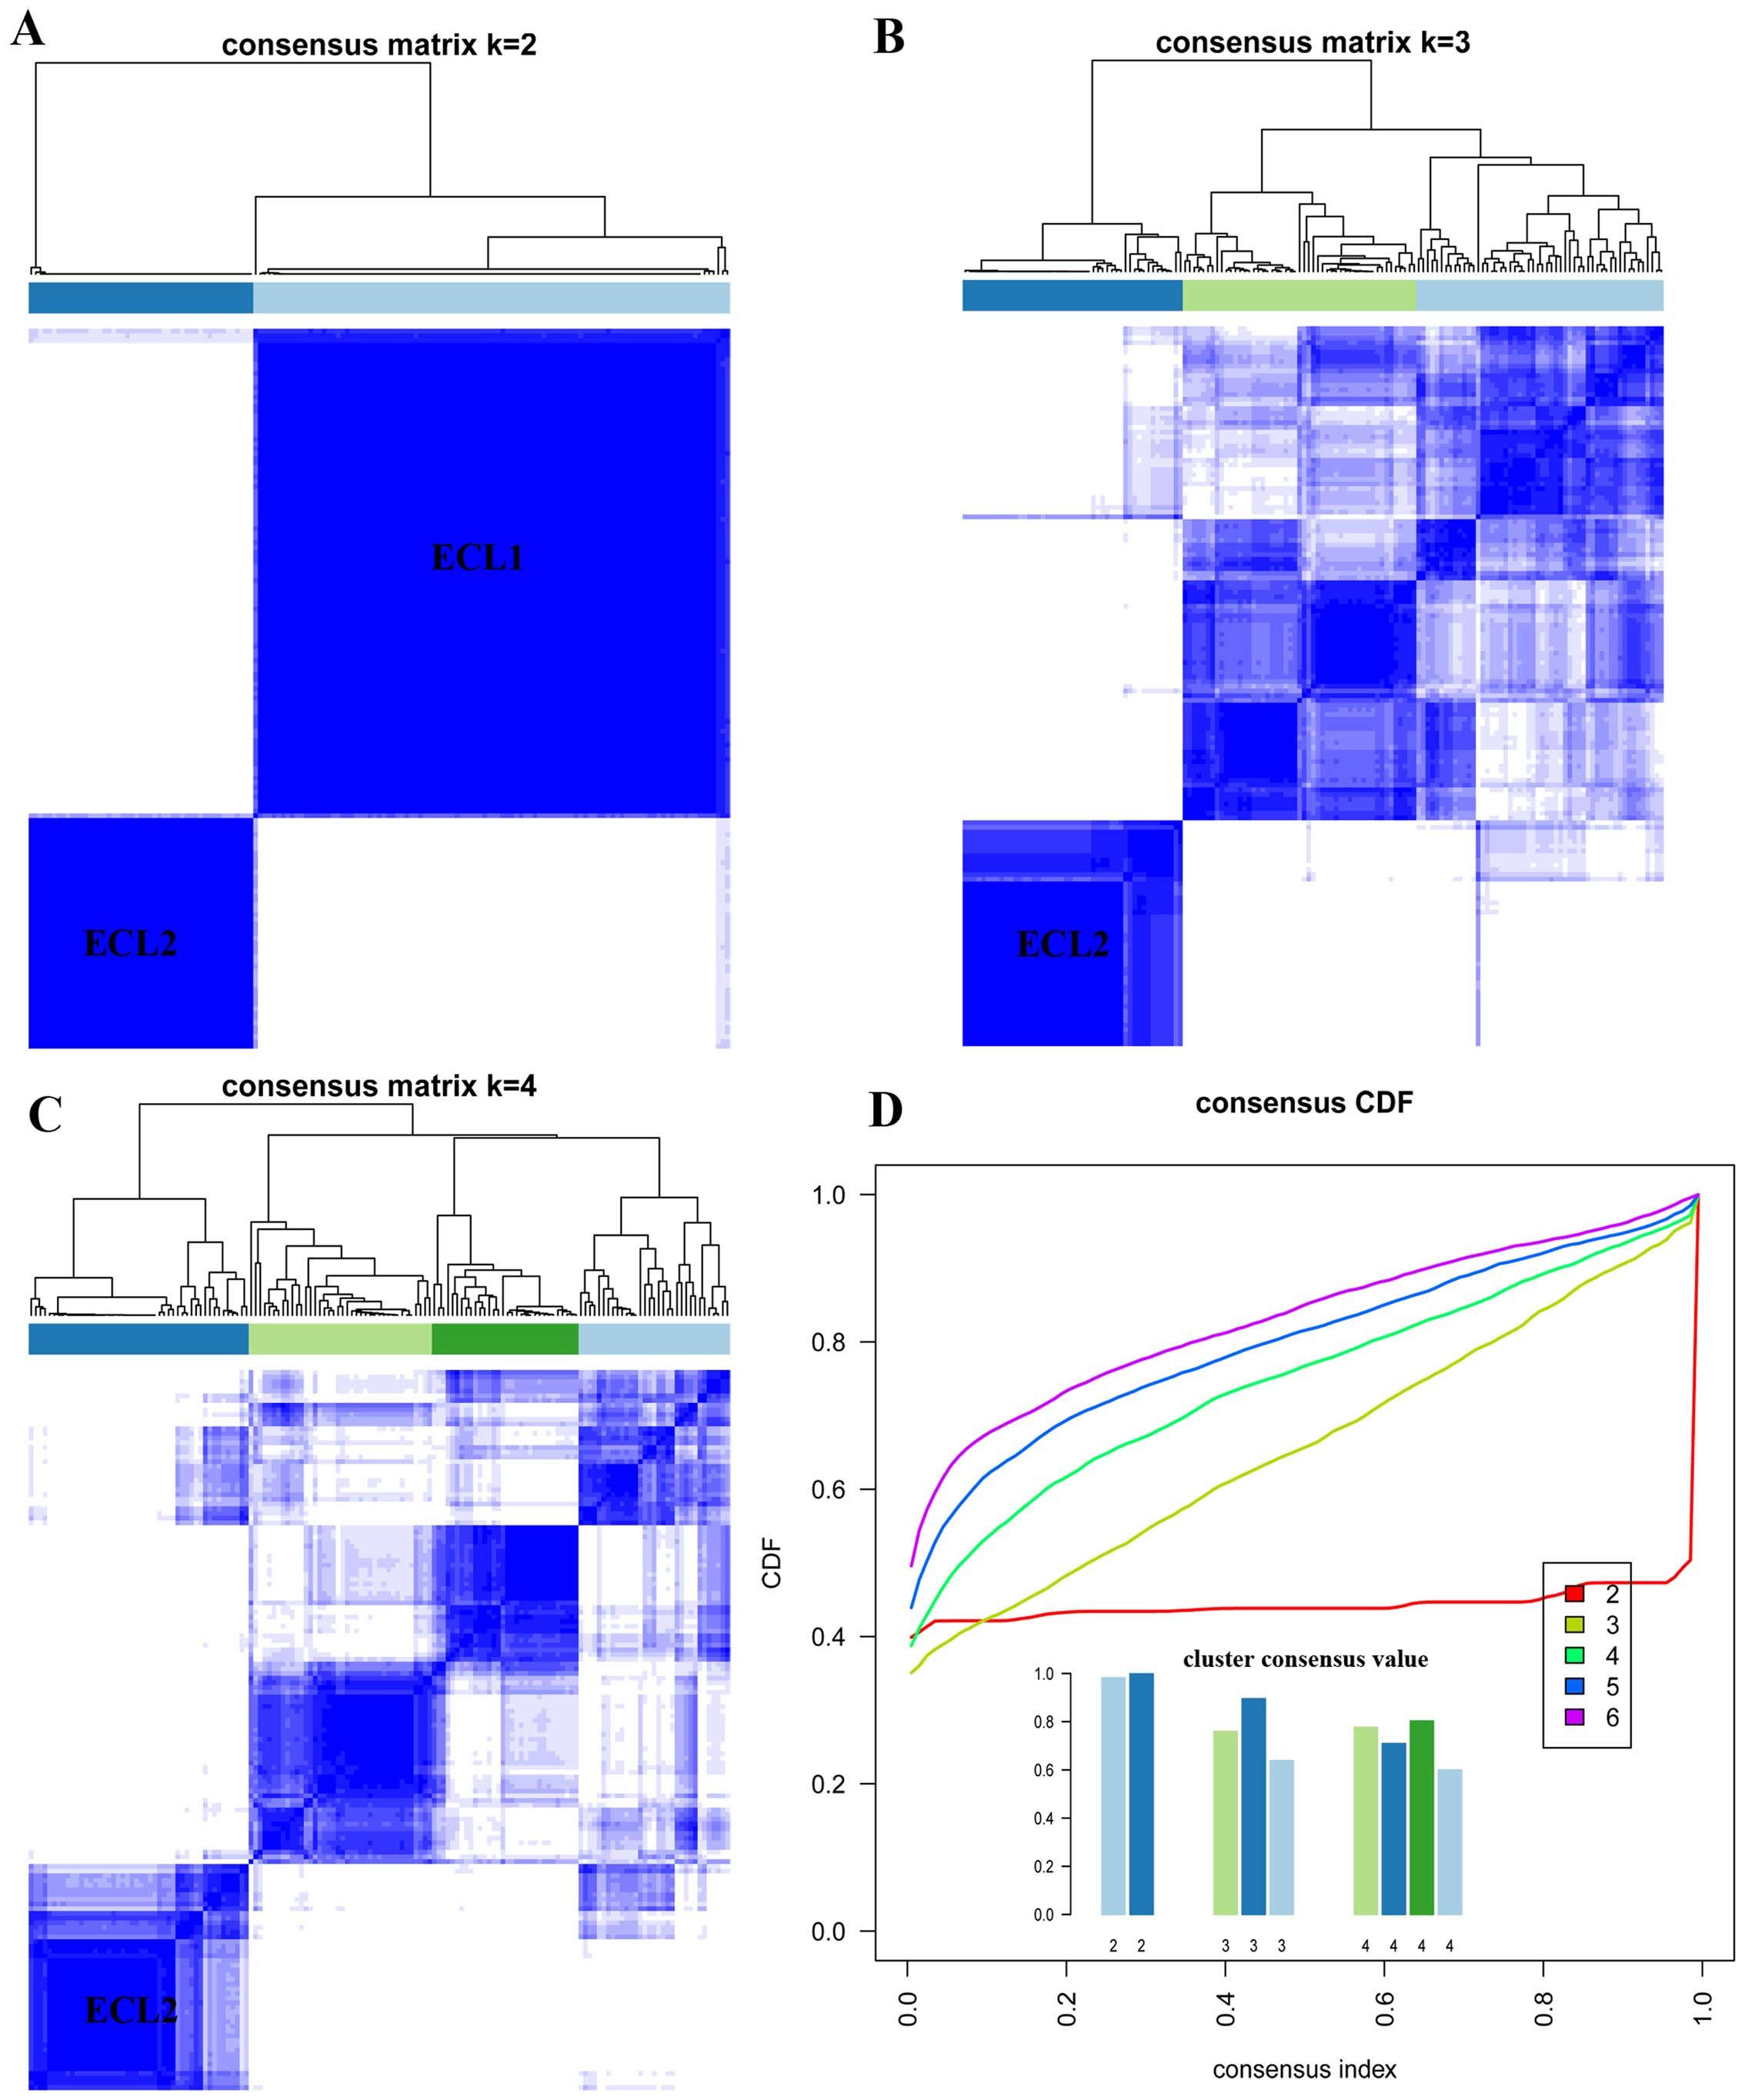
Unsupervised K-mean consensus clustering was
used to uncover potential subgroups of colon cancer on the basis of
the similarities of their gene expression values of 1393
informative genes. We let K=2 to 6 in core K-mean
clustering, two subgroups could be identified when K=2 and
the cluster consensus are 0.98 and 0.99 for each subgroup (Fig. 1A and D), thus the first subgroup
was named as ECL1 with 104 samples (68%) and the second subgroup
was named as ECL2 with 49 samples (32%). When K=2 to 4, the
ECL2 subgroup showed steady and consistency (Fig. 1A–C). The relationship between two
subgroups and their clinical characteristics were listed in
Table II.
| Table IICorrelation between the clinical data
and the subgroups identified in the gene expression data of the
colon cancer samples. |
Table II
Correlation between the clinical data
and the subgroups identified in the gene expression data of the
colon cancer samples.
| Subgroups (%) | |
|---|
|
| |
|---|
|
Characteristics | ECL1 | ECL2 | P-value |
|---|
| Total sample
no. | 104 (68.0) | 49 (32.0) | |
| Gender |
| Male | 59 (75.6) | 19 (24.4) | 0.06 |
| Female | 45 (60.0) | 30 (40.0) | |
| Age (yrs.) |
| Mean ± SD | 69.4±11.7 | 73.3±11.4 | 0.049 |
| Tumor location |
| Ascending | 11 (39.3) | 17 (60.7) | 3.6e-06 |
| Cecum | 17 (58.6) | 12 (41.4) | |
| Transverse | 13 (52.0) | 12 (48) | |
| Descending | 6 (100) | 0 (0) | |
| Sigmoid | 56 (87.5) | 8 (12.5) | |
| Unknown | 1 (100) | 0 (0) | |
| Sub-site |
| Left | 64 (88.9) | 8 (11.1) | 9.4e-08 |
| Right | 39 (48.8) | 41 (51.2) | |
| Unknown | 1 (100) | 0 (0) | |
| AJCC stage |
| I | 19 (67.9) | 9 (32.1) | 0.68 |
| II | 39 (63.9) | 22 (36.1) | |
| III | 28 (71.8) | 11 (28.2) | |
| IV | 17 (77.3) | 5 (22.7) | |
| Unknown | 1 (50.0) | 1 (50.0) | |
| MSI status |
| MSS | 78 (84.8) | 14 (15.2) | 2.2e-16 |
| MSI-H | 0 (0) | 28 (100) | |
| MSI-L | 26 (78.8) | 7 (21.2) | |
| Expression
subtype |
| CIN | 57 (100) | 0 (0) | 2.2e-16 |
| Invasive | 35 (94.6) | 2 (5.4) | |
| MSI/CIMP | 11 (19.9) | 47 (81.0) | |
| Unknown | 1 (100) | 0 (0) | |
In ECL2, the age of onset (73.3±11.47) is
significantly higher than ECL1 (P<0.049, ANOVA). We found that
the majority samples of ELC2 are right sided tumors. All the MSI-H
samples were found in the ECL2, and all the CIN samples in the
ECL1. Furthermore, these two subgroups showed no significant
difference in AJCC stage and history of polyps. Mutations of
KRAS, BRAF and TP53 were investigated in many
studies, we found that all samples with BRAF mutation were
in ECL2 and most of samples with TP53 mutation were in ECL1
(Table III).
| Table IIICorrelation between the gene mutation
and the subgroups identified in the gene expression data of the
colon cancer samples. |
Table III
Correlation between the gene mutation
and the subgroups identified in the gene expression data of the
colon cancer samples.
| Subgroups (%) | |
|---|
|
| |
|---|
| Mutation genes | ECL1 | ECL2 | P-value |
|---|
| Total sample
no. | 104 (68.0) | 49 (32.0) | |
| BRAF
mutation |
| Yes | 0 (0) | 17 (100) | 1.8e-10 |
| No | 92 (78.6) | 25 (21.4) | |
| Unknown | 12 (63.2) | 7 (36.8) | |
| KRAS
mutation |
| Yes | 31 (66.0) | 16 (34.0) | 0.69 |
| No | 61 (70.1) | 26 (29.9) | |
| Unknown | 12 (63.2) | 7 (36.8) | |
| TP53
mutation |
| Yes | 52 (81.2) | 12 (18.8) | 2.9e-03 |
| No | 40 (57.1) | 30 (42.9) | |
| Unknown | 12 (63.2) | 7 (36.8) | |
| SOX9
mutation |
| Yes | 7 (87.5) | 1 (12.5) | 0.43 |
| No | 85 (67.5) | 41 (32.5) | |
| Unknown | 12 (63.2) | 7 (36.8) | |
Nearly 62% of the samples in ECL1 were left sided
tumors. Most of ECL1 samples were MSS status and the majority
samples of Invasive subtype (3)
were in ECL1. Compared with those reported in previous studies, we
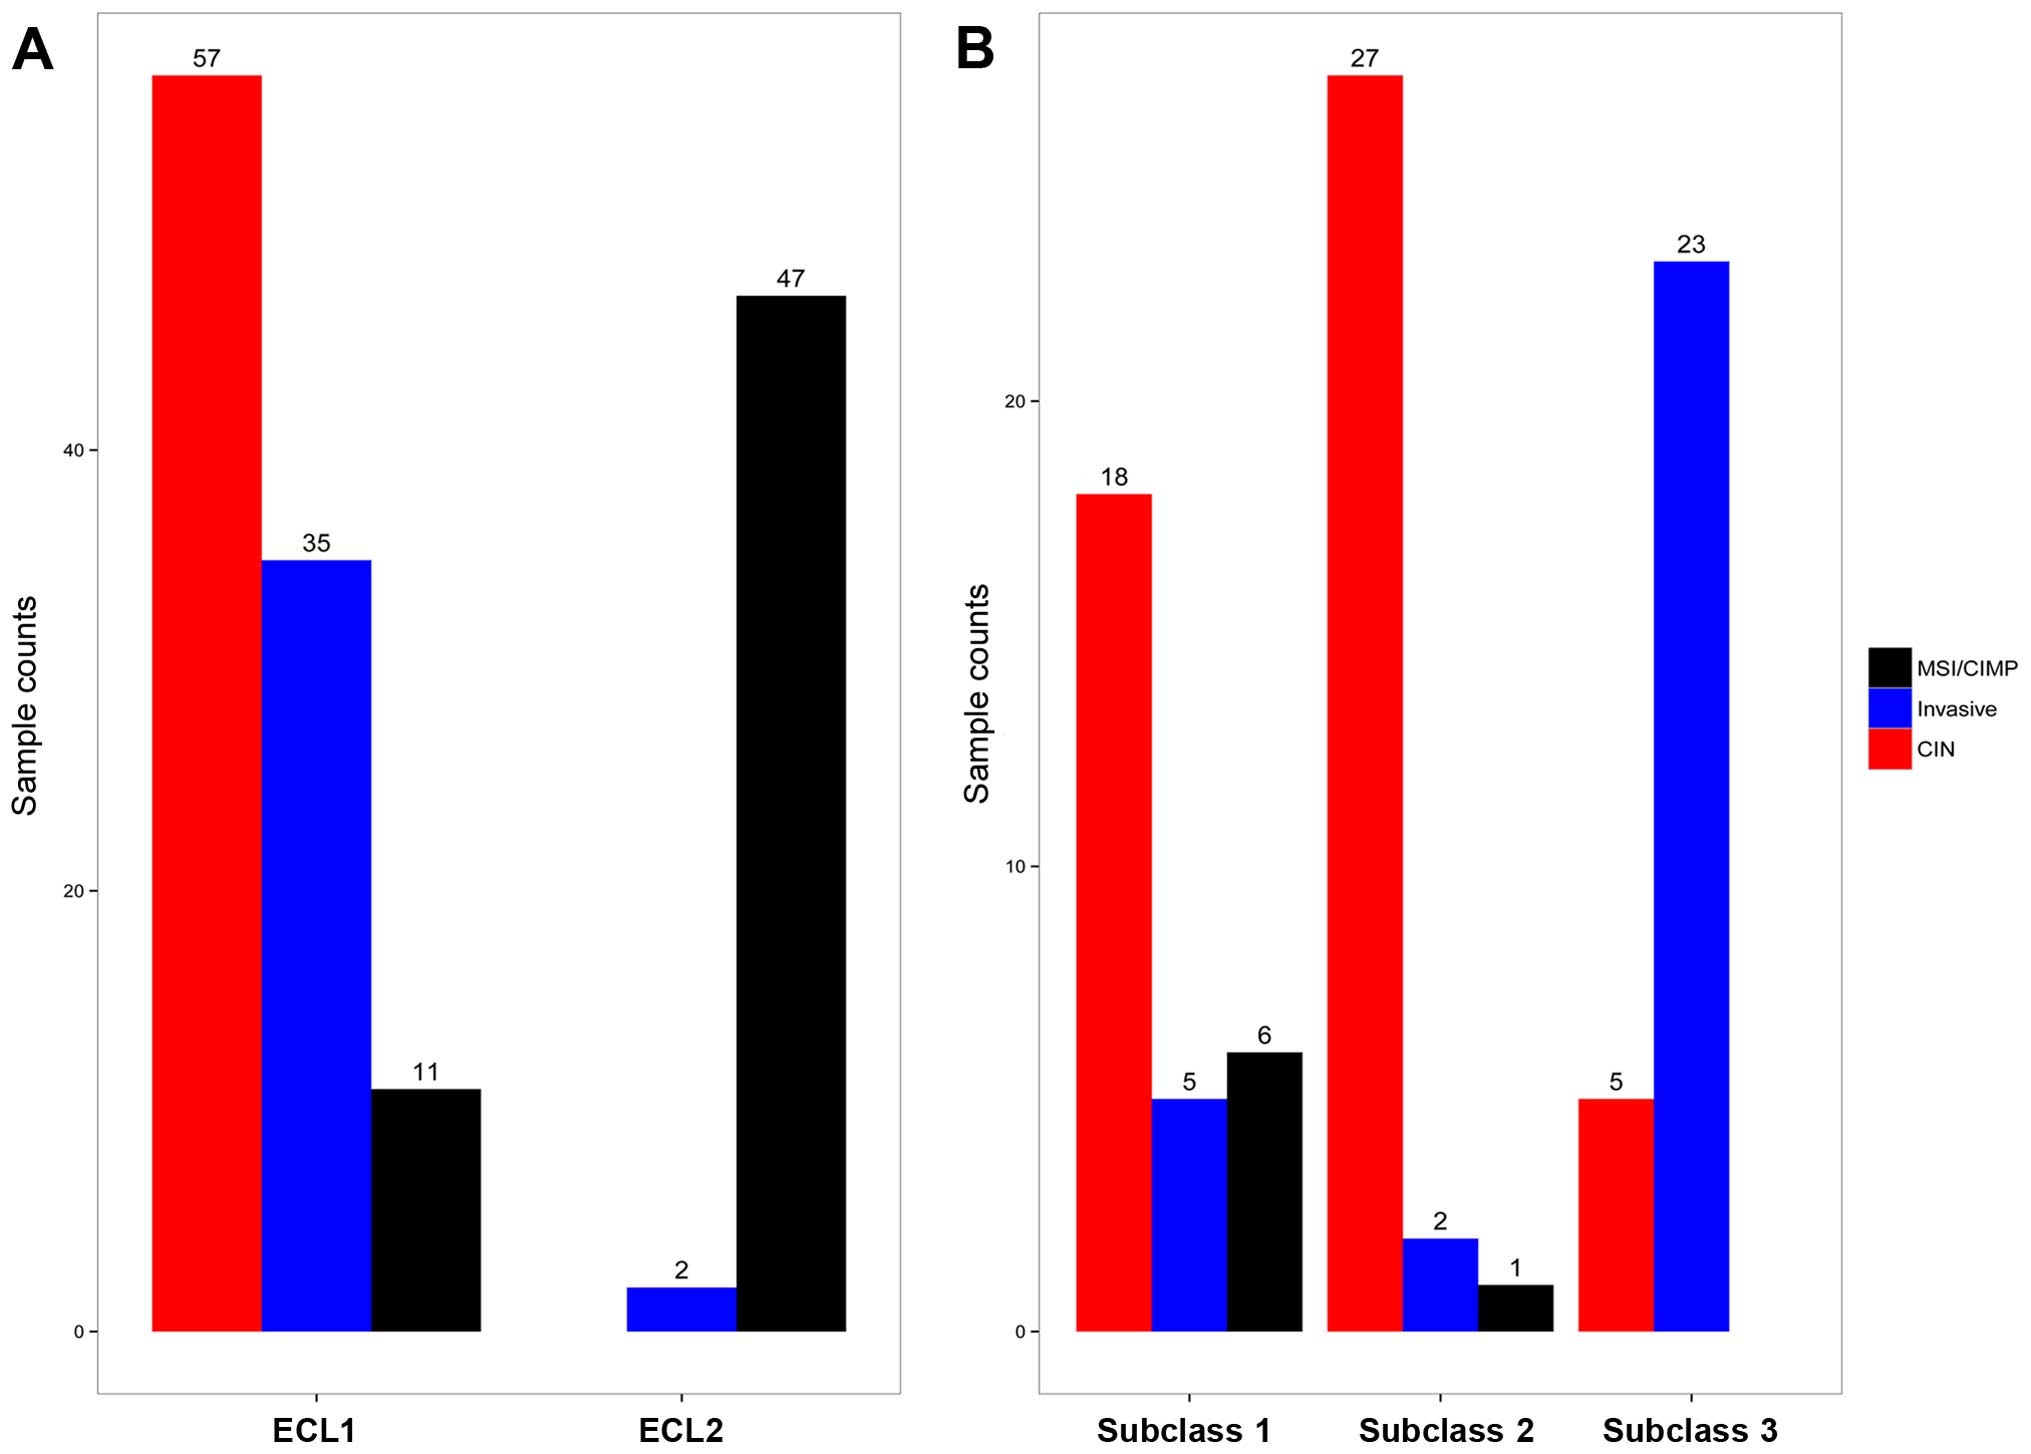
found that ECL1 contained both CIN and Invasive subtypes (3), and therefore we examined the
heterogeneity of this subgroup (Fig.
2A).
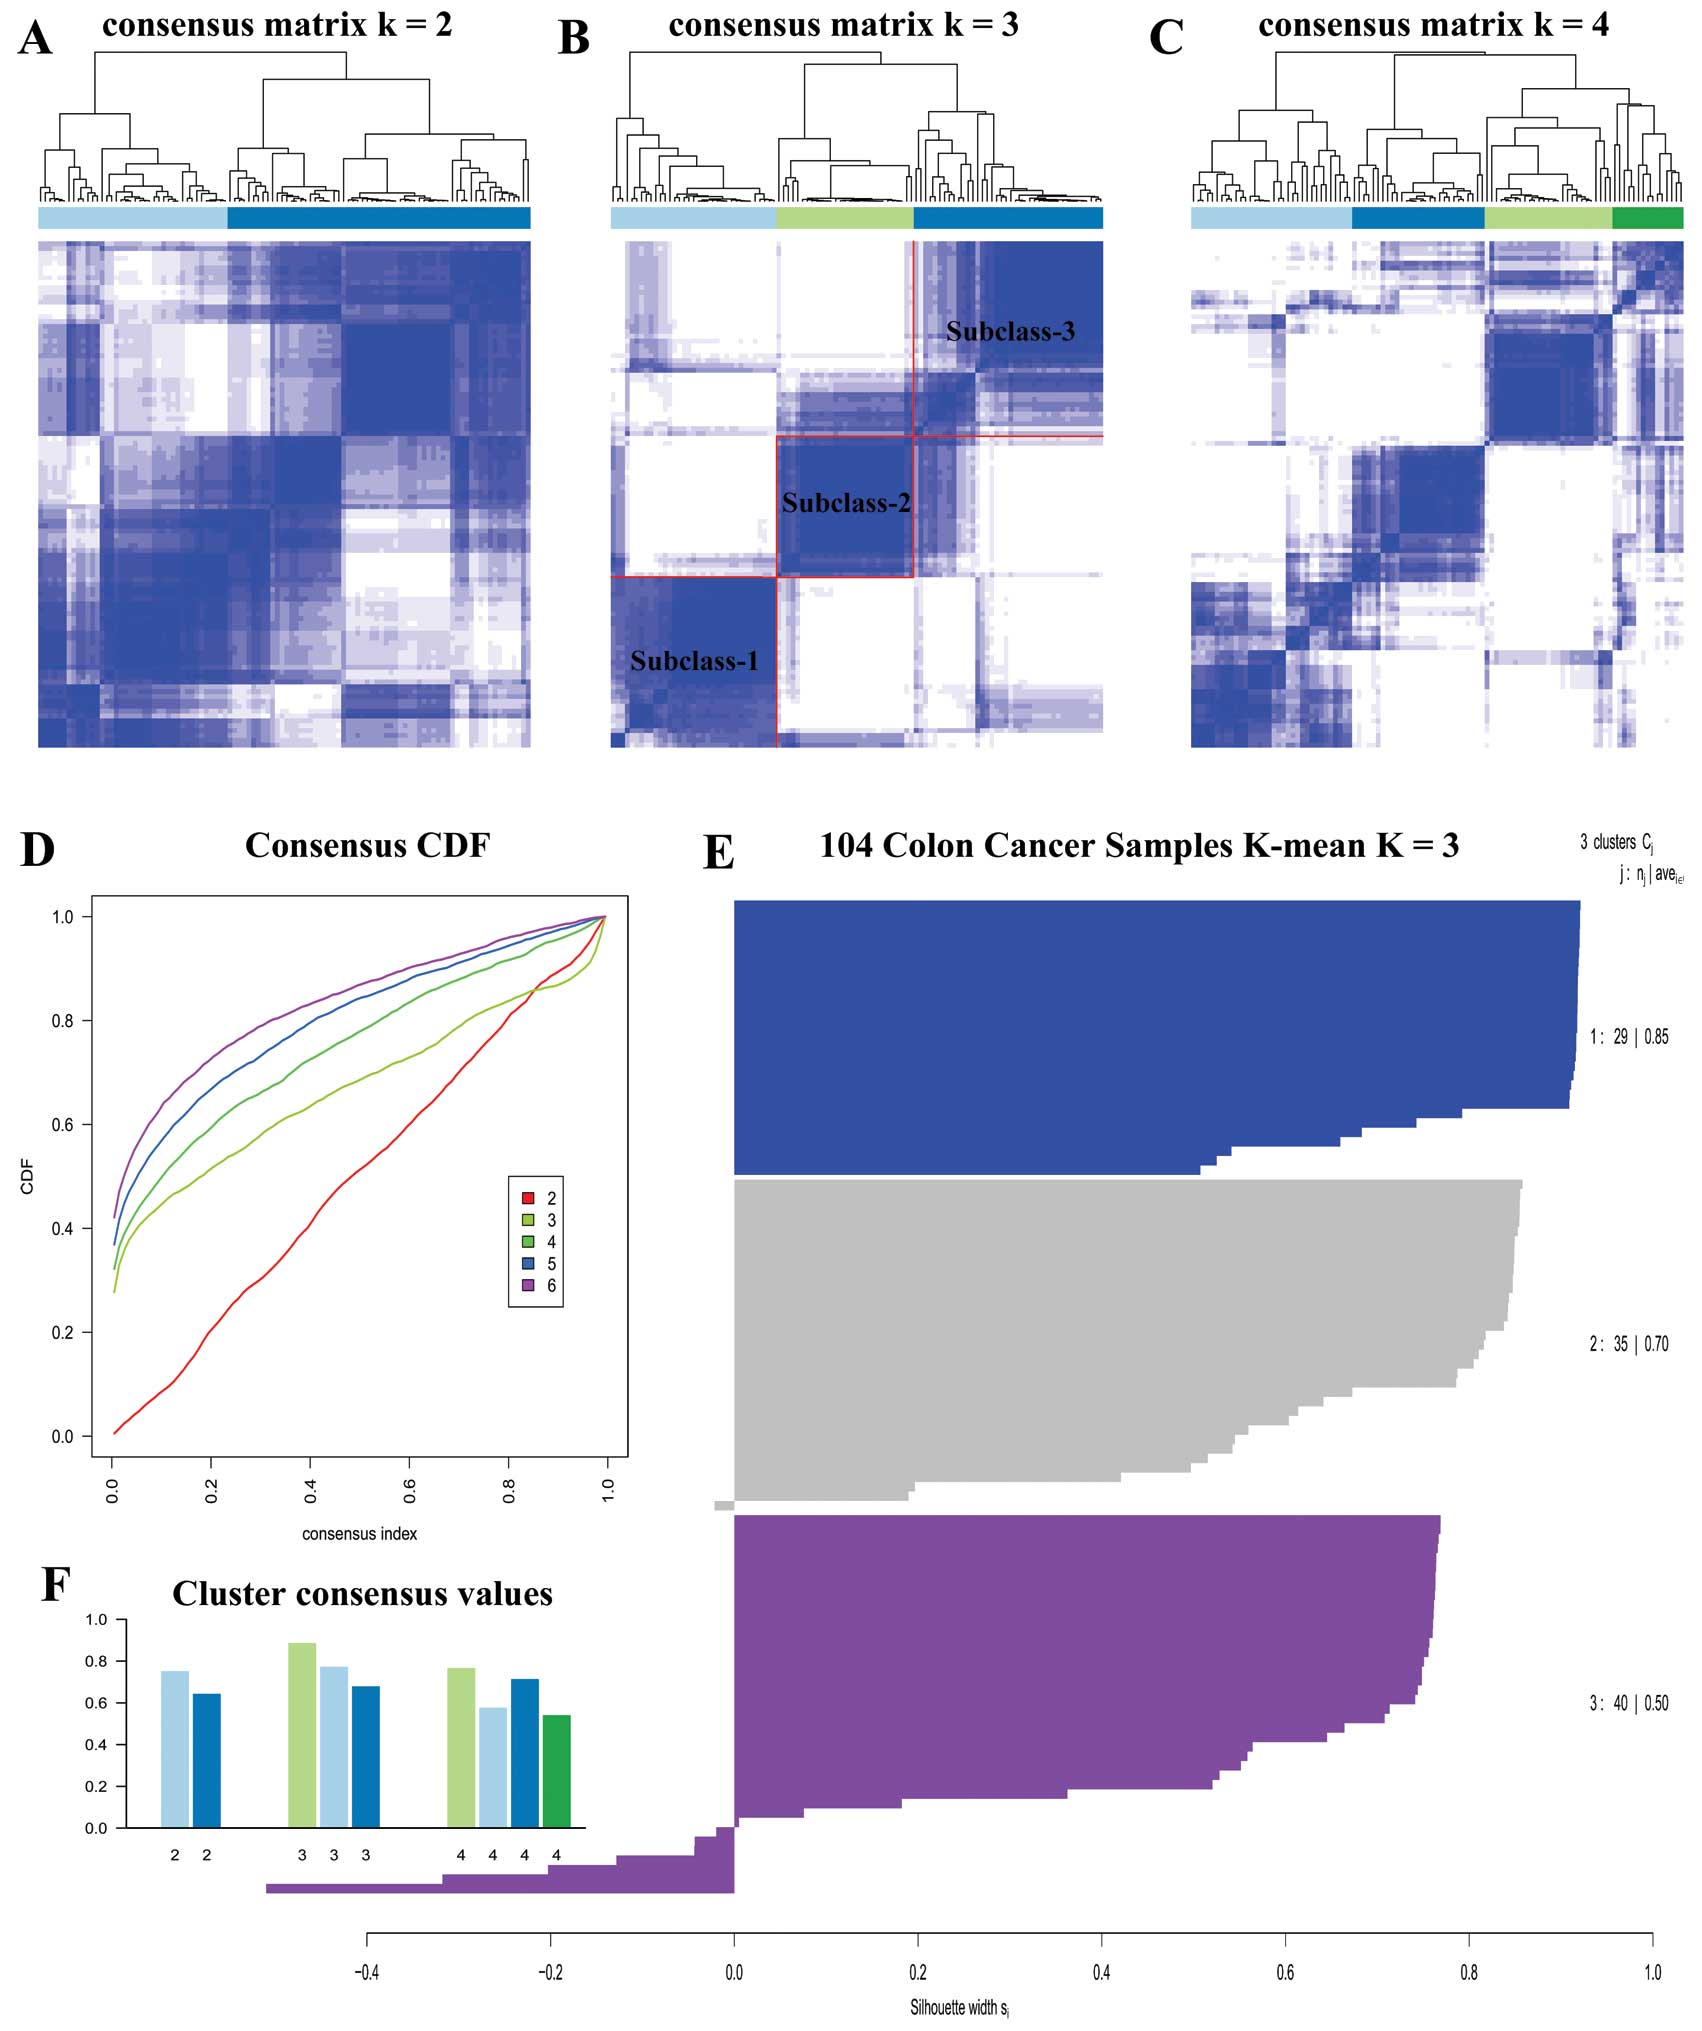
We carried out unsupervised clustering analysis only
on ECL1 samples with K=2 to 6. When K=3, we
discovered three distinct subclasses with very clear boundaries
(Fig. 3B). There are 87 samples
with Silhouette Score >0.5 considered as core samples and
retained, with 29 samples in subclass 1, 30 samples in subclass 2
and 28 samples in subclass 3. There are 18 CIN samples in subclass
1, 27 CIN samples in subclass 2, and 23 Invasive samples in
subclass 3, and Fig. 2B
demonstrates the relationship between subtypes reported earlier
(3) and the subclasses derived
from ECL1 (P<1.065e-10, Fisher's exact test).
There were two subclasses correlated to the CIN
subtype, and due to the heterogeneity of ECL1 subgroup we
investigated the difference of these two CIN groups. CIN samples
extracted from two subclasses were compared using SAM with Wilcoxon
rank sum test. There were 250 differentially expressed genes found
with 2-fold change, and only 6 genes were upregulated in subclass
2, namely, SLC25A21, POPDC3, GREG2, HOTAIR, GYPB and
SLC35F4. The proportion of either the metastatic samples or
the death samples in subclass 2 was roughly two-fold of that in
subclass 1 (Table IV).
| Table IVMetastatic and death counts in two
nested subclasses related to CIN. |
Table IV
Metastatic and death counts in two
nested subclasses related to CIN.
| Subclass | CIN | Metastatic count
(%) | Death count
(%) |
|---|
| Subclass 1 | 18 | 3 (16.7) | 1 (5.6) |
| Subclass 2 | 27 | 8 (29.6) | 4 (14.8) |
On the top level we identified two subgroups in
colon cancer, ECL1 had relatively high heterogeneity and it was
associated with CIN and Invasive subtype derived from earlier
studies, whereas ECL2 showed high homogeneity. On the secondary
level, three subclasses were derived from ECL1, where the subclass
1 and 2 were associated with CIN subtype and the subclass 3 was
associated with Invasive subtype.
Marker genes and their biological
characteristics
PAM analysis was carried out to identify marker
genes that could discriminate the two subgroups on the top level.
When Δ =4.16 (overall error rate 0.019 at minimum), 256 genes were
selected from the 107 training samples. The testing set was used
for independent validation, and only 2 samples were classified into
wrong groups with an overall error rate of 0.043.
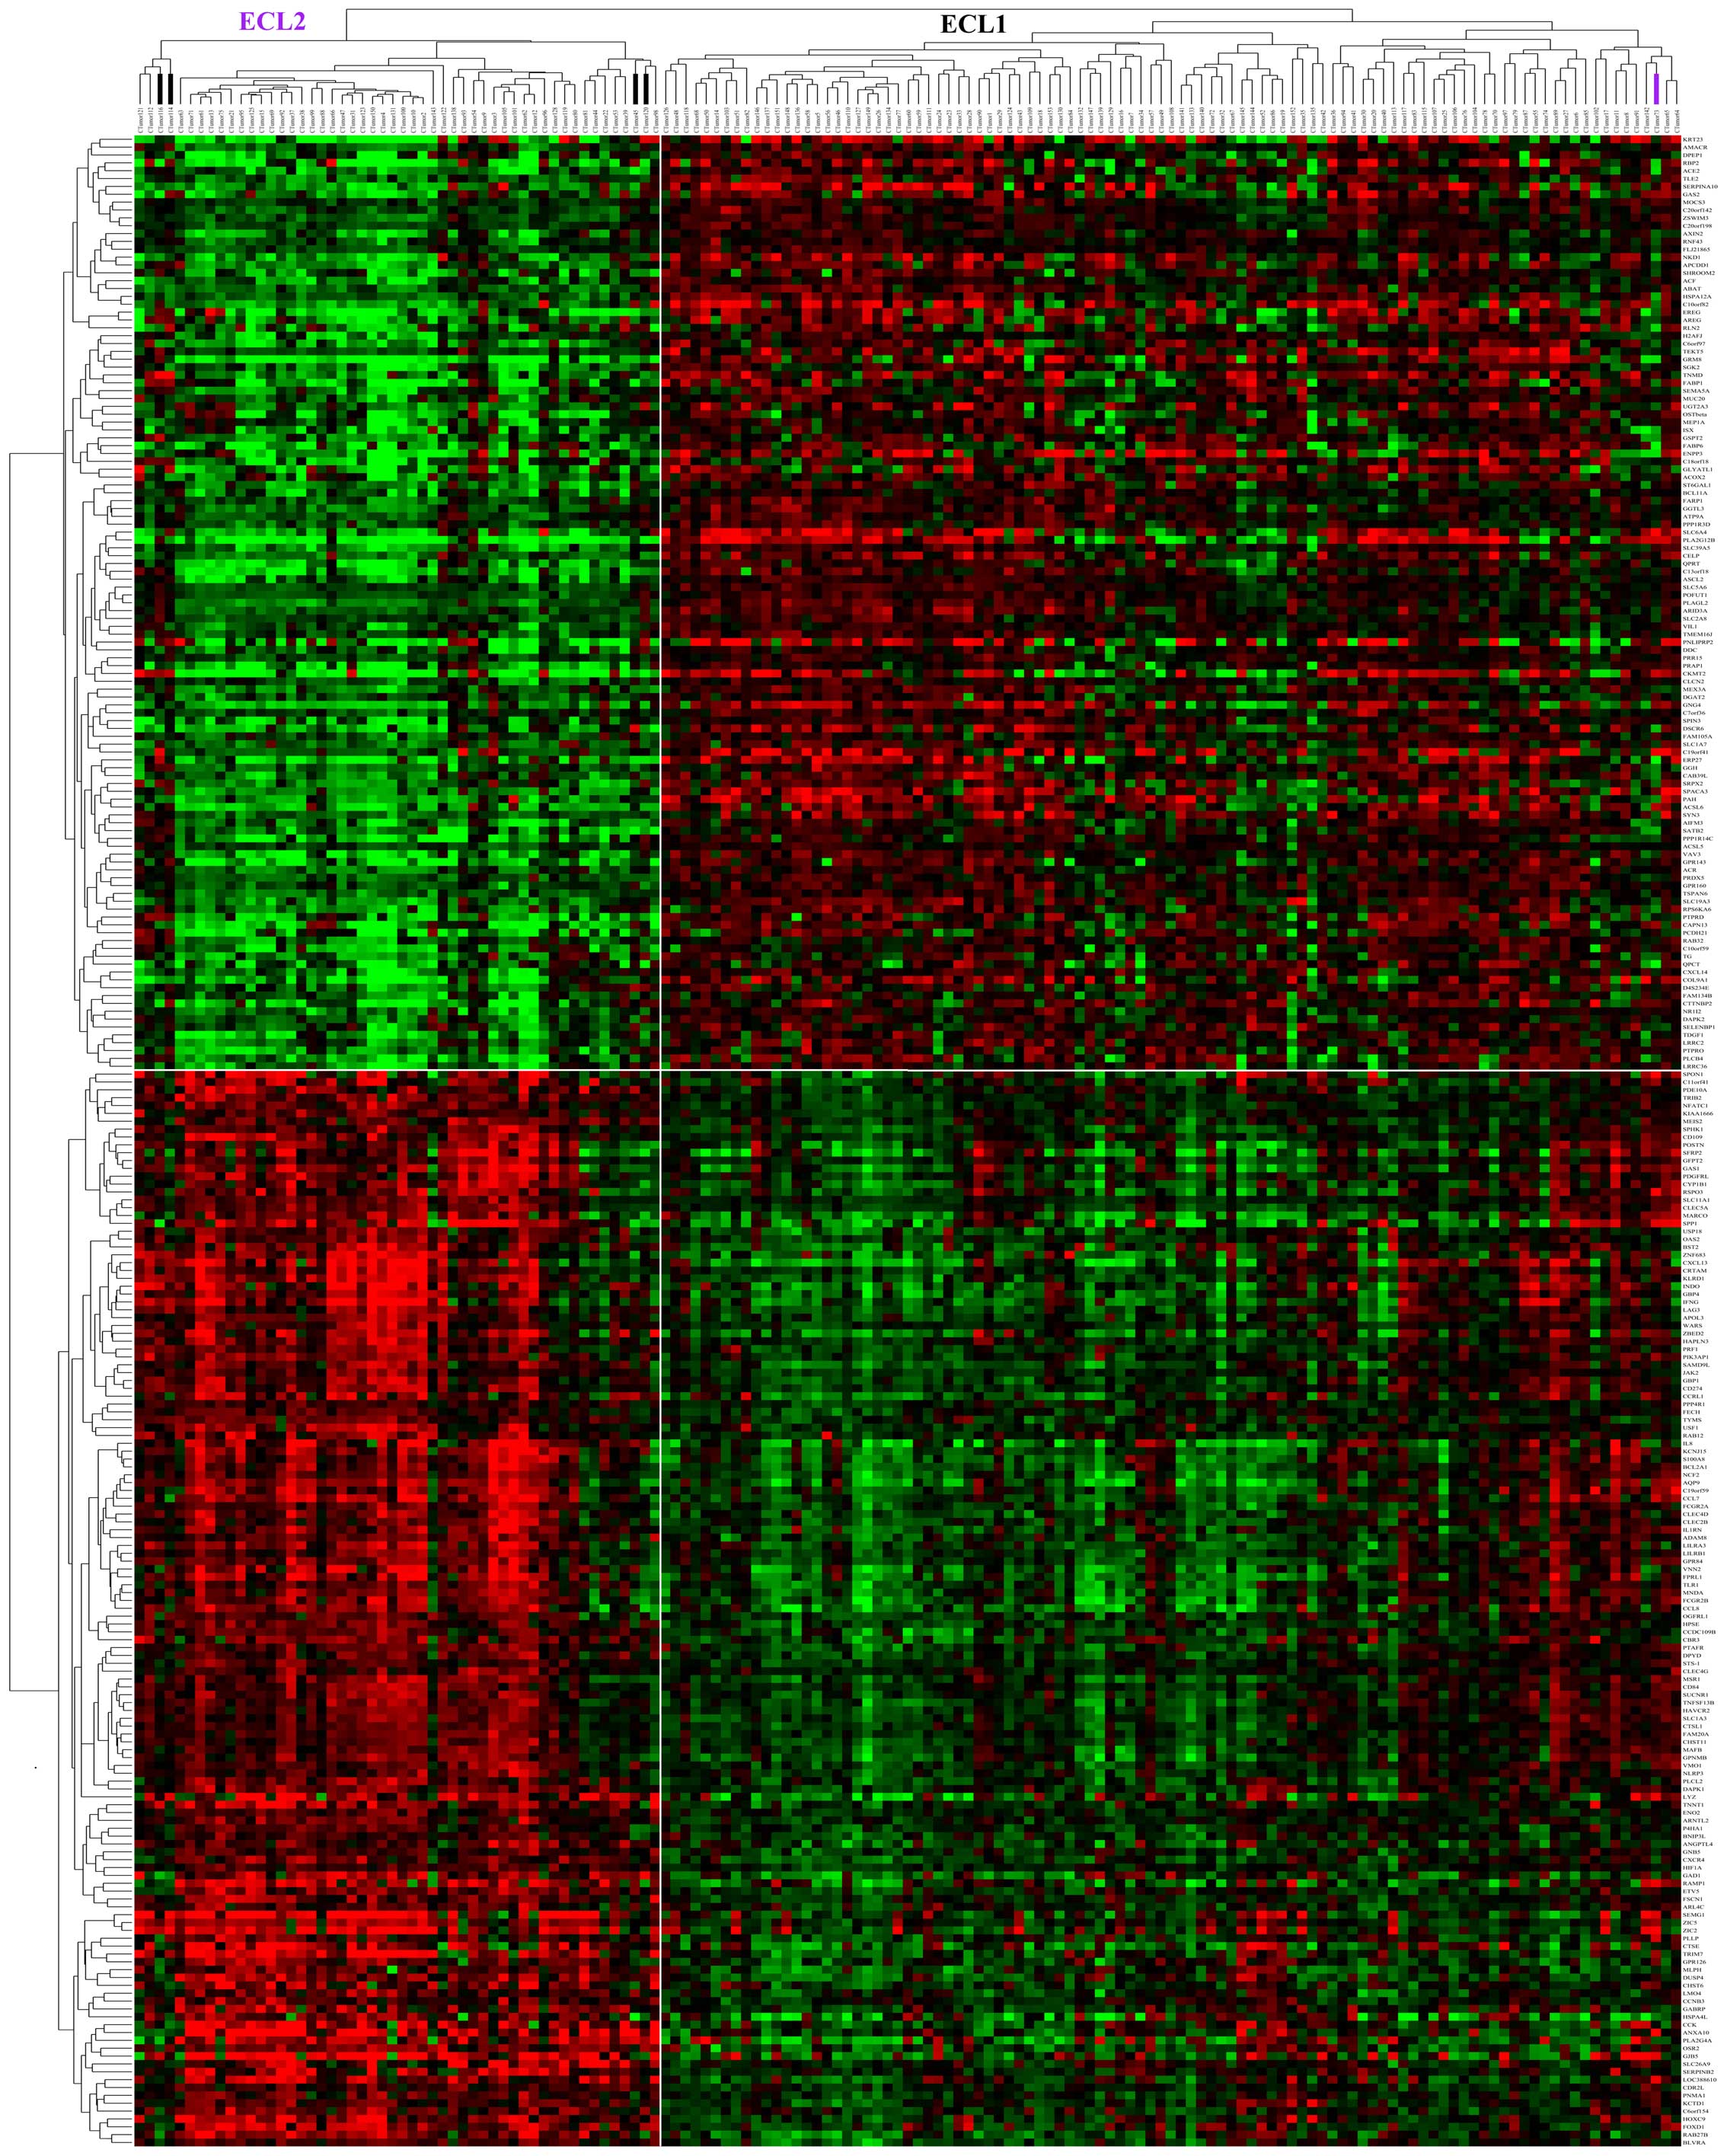
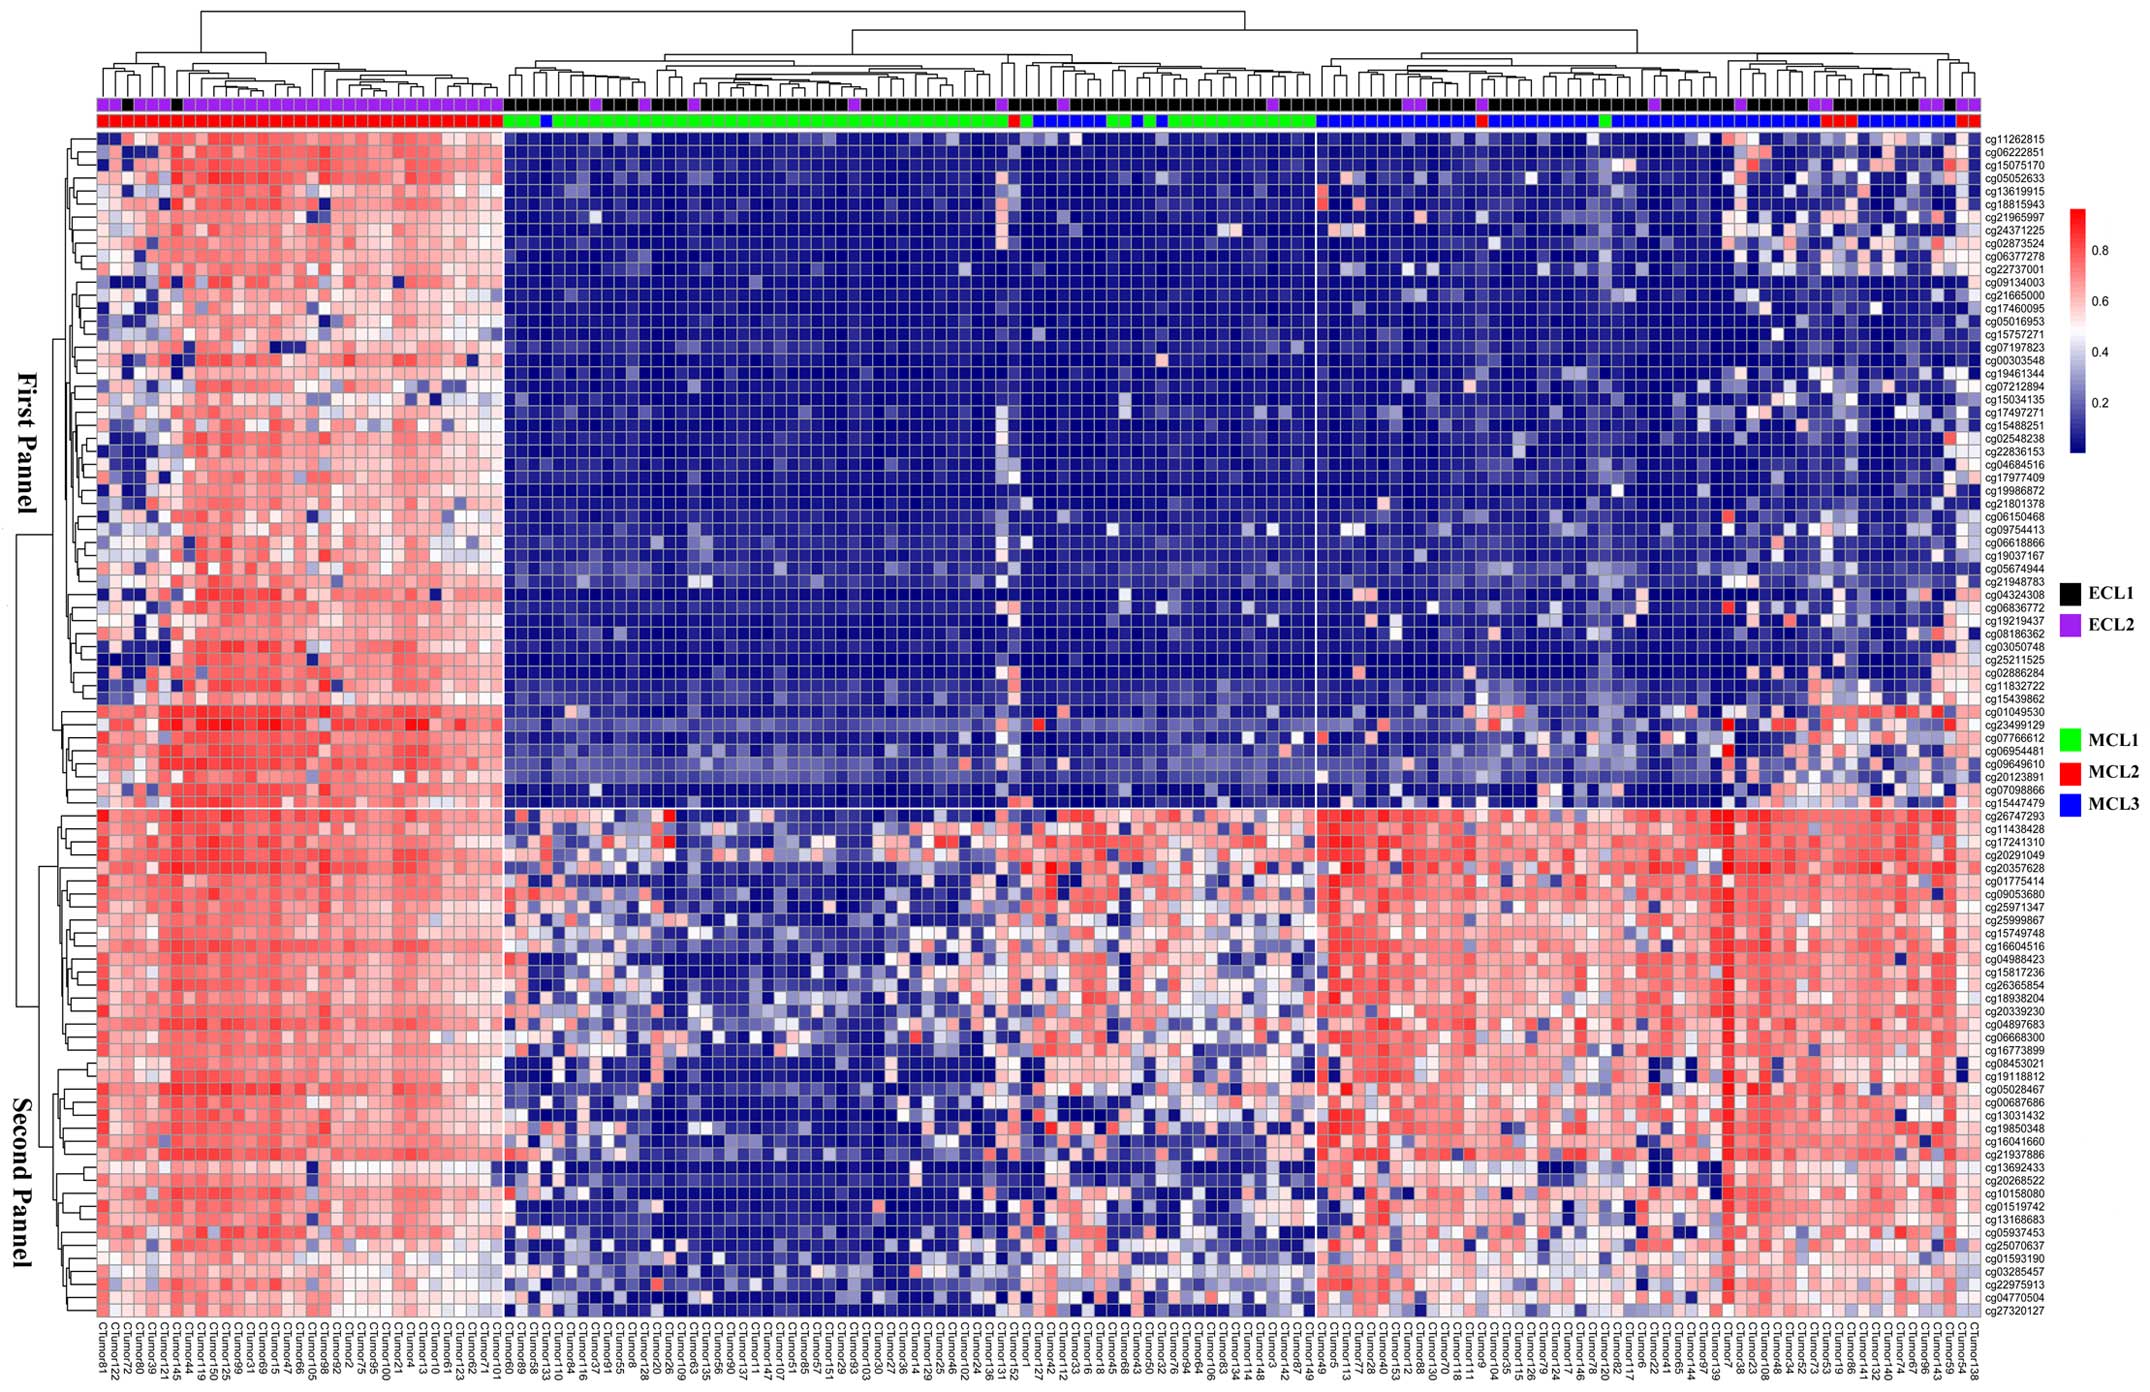
There were 137 genes out of the 256 marker genes
that were upregulated in ECL2, among them SPP1 and
POSTN were associated with metastasis and poor prognosis in
colorectal cancer, which were reported in earlier studies. DAVID
analysis showed that these 137 genes were enriched in immune
response, defense response, response to wounding, inflammatory
response and carbohydrate binding GO terms. Furthermore, the GSEA
(28) analysis of these genes
showed that they were upregulated in advanced gastric cancer and
basal subtype of breast cancer. There were 119 genes upregulated in
ECL1, and they were enriched in ERBB receptor signaling
network, and β-oxidation of pristanoyl-CoA pathways. Finally, we
plotted a heating map with the 256 marker genes for all 153 cancer
samples (Fig. 4) with sample
resorted hierarchical clustering and only 5 samples were classified
into incorrect groups. This suggested that these genes could serve
as feature genes for the subtype classification.
Subgroups identified by DNA methylation
data
To investigate the subtypes using DNA methylation
data, we applied the same method to the transformed methylation
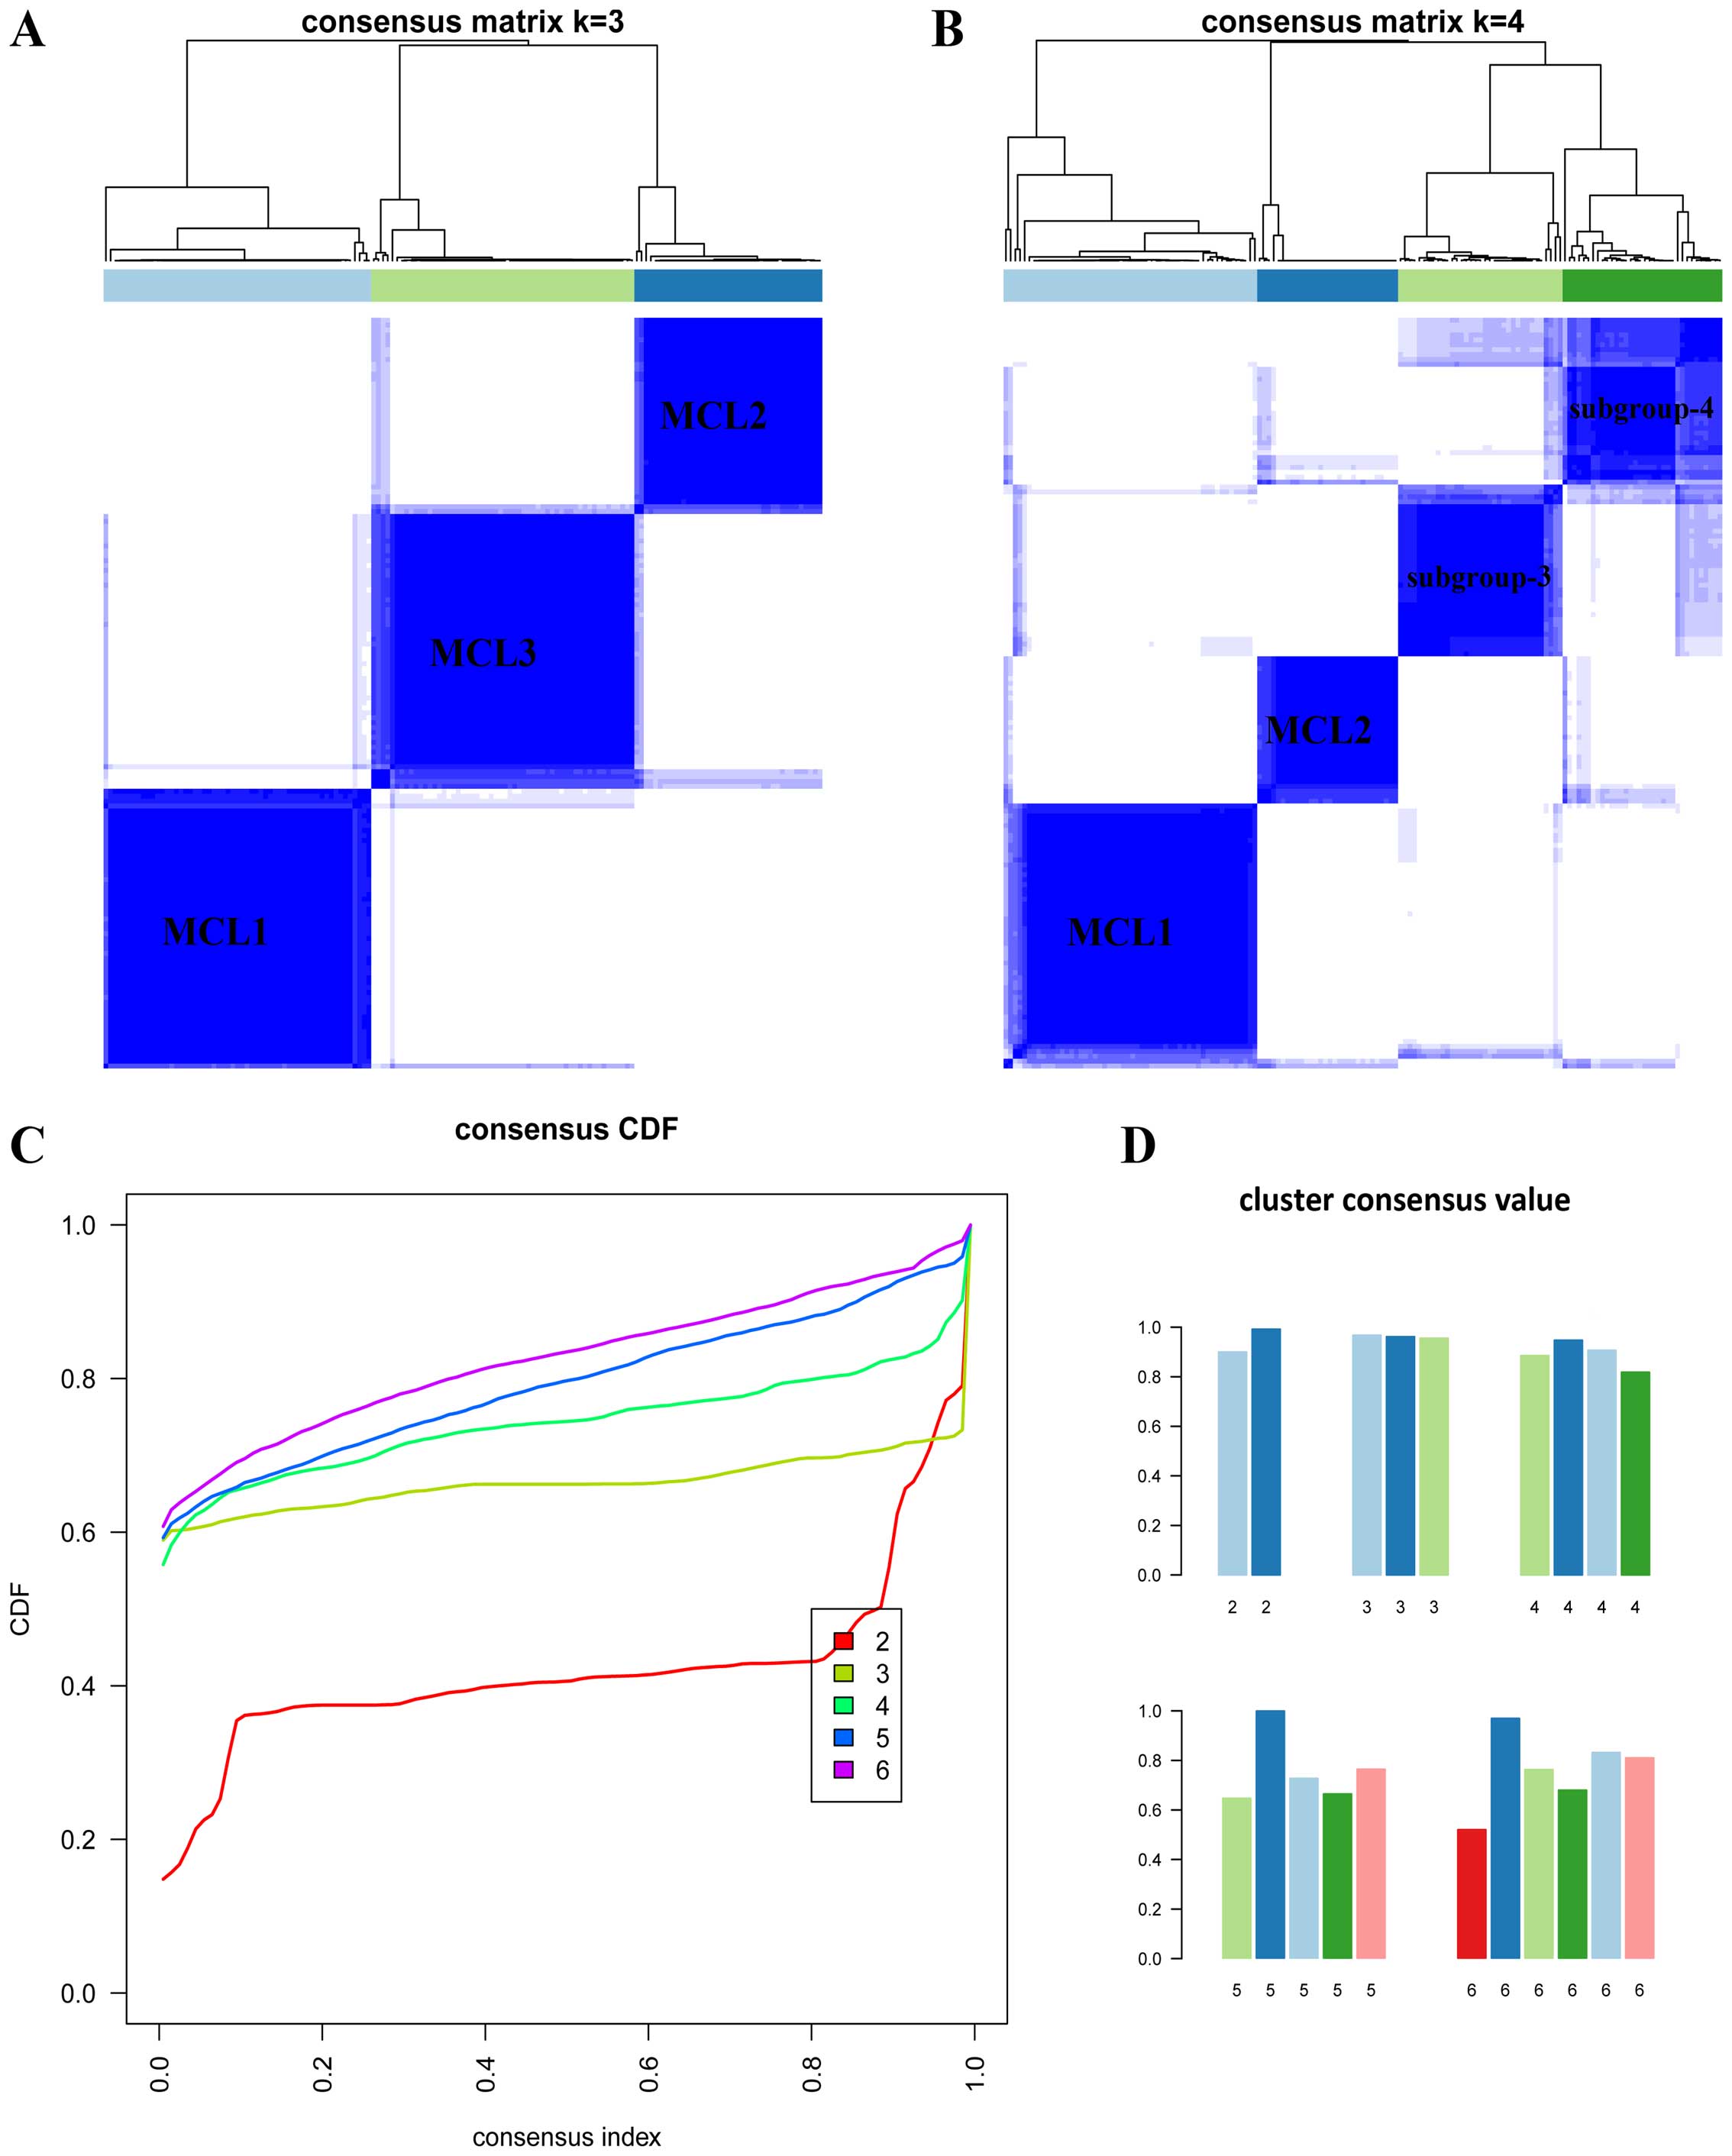
array data. When K=3 or 4 (Fig.
5A and B), the clustering reached the highest consensus. When
K=3, we named these subgroups as MCL1 with 57 samples (37%),
MCL2 with 40 samples (26%) and MCL3 with 56 samples (37%). We found
that the gender proportion among the three subgroups showed
significant difference (P<0.029, Fisher's exact test). The age
distribution among three subgroups also showed significant
difference (P<2.24e-3, ANOVA, Table
V).
| Table VCorrelation between the clinical data
and the subgroups identified in the DNA methylation data of the
colon cancer samples. |
Table V
Correlation between the clinical data
and the subgroups identified in the DNA methylation data of the
colon cancer samples.
| Subgroups (%) | |
|---|
|
| |
|---|
|
Characteristics | MCL1 | MCL2 | MCL3 | P-value |
|---|
| Total sample
no. | 57 (37.3) | 40 (26.1) | 56 (36.6) | |
| Gender |
| Male | 27 (37.5) | 25 (34.7) | 20 (7.8) | 0.029 |
| Female | 30 (37.0) | 15 (18.5) | 36 (44.5) | |
| Age (yrs.) |
| Mean ± SD | 66.8±12.7 | 74.9±10.1 | 71.6±10.7 | 2.24e-3 |
| Tumor location |
| Ascending | 3 (10.7) | 14 (50.0) | 11 (39.3) | 4.1e-8 |
| Cecum | 6 (20.7) | 12 (41.4) | 11 (37.9) | |
| Transverse | 5 (20.0) | 11 (44.0) | 9 (36.0) | |
| Descending | 4 (66.7) | 0 (0) | 2 (33.3) | |
| Sigmoid | 39 (60.9) | 3 (4.7) | 22 (34.4) | |
| Unknown | 0 (0) | 0 (0) | 1 (100) | |
| Sub-site |
| Left | 45 (62.5) | 3 (4.2) | 24 (33.3) | 2.2e-12 |
| Right | 12 (15) | 37 (46.3) | 31 (38.7) | |
| Unknown | 0 (0) | 0 (0) | 1 (100) | |
| AJCC stage |
| I | 12 (42.9) | 6 (21.4) | 10 (35.7) | 0.348 |
| II | 19 (31.2) | 21 (34.4) | 21 (34.4) | |
| III | 13 (33.3) | 10 (25.6) | 16 (41.1) | |
| IV | 13 (56.5) | 3 (13.1) | 7 (30.4) | |
| Unknown | 0 (0) | 0 (0) | 2 (100) | |
| MSI status |
| MSS | 39 (42.4) | 11 (11.9) | 42 (45.7) | 1.5e-10 |
| MSI-H | 3 (10.7) | 23 (82.1) | 2 (7.2) | |
| MSI-L | 15 (45.5) | 6 (18.2) | 12 (36.3) | |
| Expression
subtype |
| CIN | 32 (56.1) | 2 (3.5) | 23 (40.4) | 6.9e-12 |
| Invasive | 9 (24.3) | 5 (13.5) | 23 (62.2) | |
| MSI/CIMP | 16 (27.6) | 33 (56.9) | 9 (15.5) | |
| Unknown | 0 (0) | 0 (0) | 1 (100) | |
Majority of the samples in MCL1 were left tumors
(~79%), of the minimum mean age, MSS status and no
BRAF mutation. More than 50% of the samples in MCL1 had
TP53 mutation and a few samples had KRAS mutation.
Almost all samples in MCL2 were male, right tumors (~93%), of the
maximum mean age and more than 50% of the samples were MSI-H
status; all samples with BRAF mutation were in MCL2 and a few
samples in this subgroup had KRAS mutation and TP53
mutation. More than 50% of the samples in MCL3 were female, right
tumors, MSS status, and there were no BRAF mutation and
nearly 50% of the samples had KRAS mutation and TP53
mutation (Table VI).
| Table VICorrelation between the gene mutation
and the subgroups identified in the DNA methylation data of the
colon cancer samples. |
Table VI
Correlation between the gene mutation
and the subgroups identified in the DNA methylation data of the
colon cancer samples.
| Subgroups (%) | |
|---|
|
| |
|---|
| Mutation genes | MCL1 | MCL2 | MCL3 | P-value |
|---|
| Total sample
no. | 57 (37.3) | 40 (26.1) | 56 (36.6) | |
| BRAF
mutation |
| Yes | 0 (0) | 17 (100) | 0 (0) | 8.3e-13 |
| No | 50 (42.7) | 16 (13.7) | 51 (43.6) | |
| Unknown | 7 (36.8) | 7 (36.8) | 5 (26.4) | |
| KRAS
mutation |
| Yes | 7 (14.9) | 13 (27.7) | 27 (57.4) | 1.3e-4 |
| No | 43 (49.4) | 20 (23.0) | 24 (27.6) | |
| Unknown | 7 (36.8) | 7 (36.8) | 5 (26.4) | |
| TP53
mutation |
| Yes | 29 (45.3) | 8 (12.5) | 27 (42.2) | 6.5e-3 |
| No | 21 (30.0) | 25 (35.7) | 24 (34.3) | |
| Unknown | 7 (36.8) | 7 (36.8) | 5 (26.4) | |
| SOX9
mutation |
| Yes | 2 (25.0) | 1 (12.5) | 5 (62.5) | 0.46 |
| No | 48 (38.1) | 32 (25.4) | 46 (36.5) | |
| Unknown | 7 (36.8) | 7 (36.8) | 5 (26.4) | |
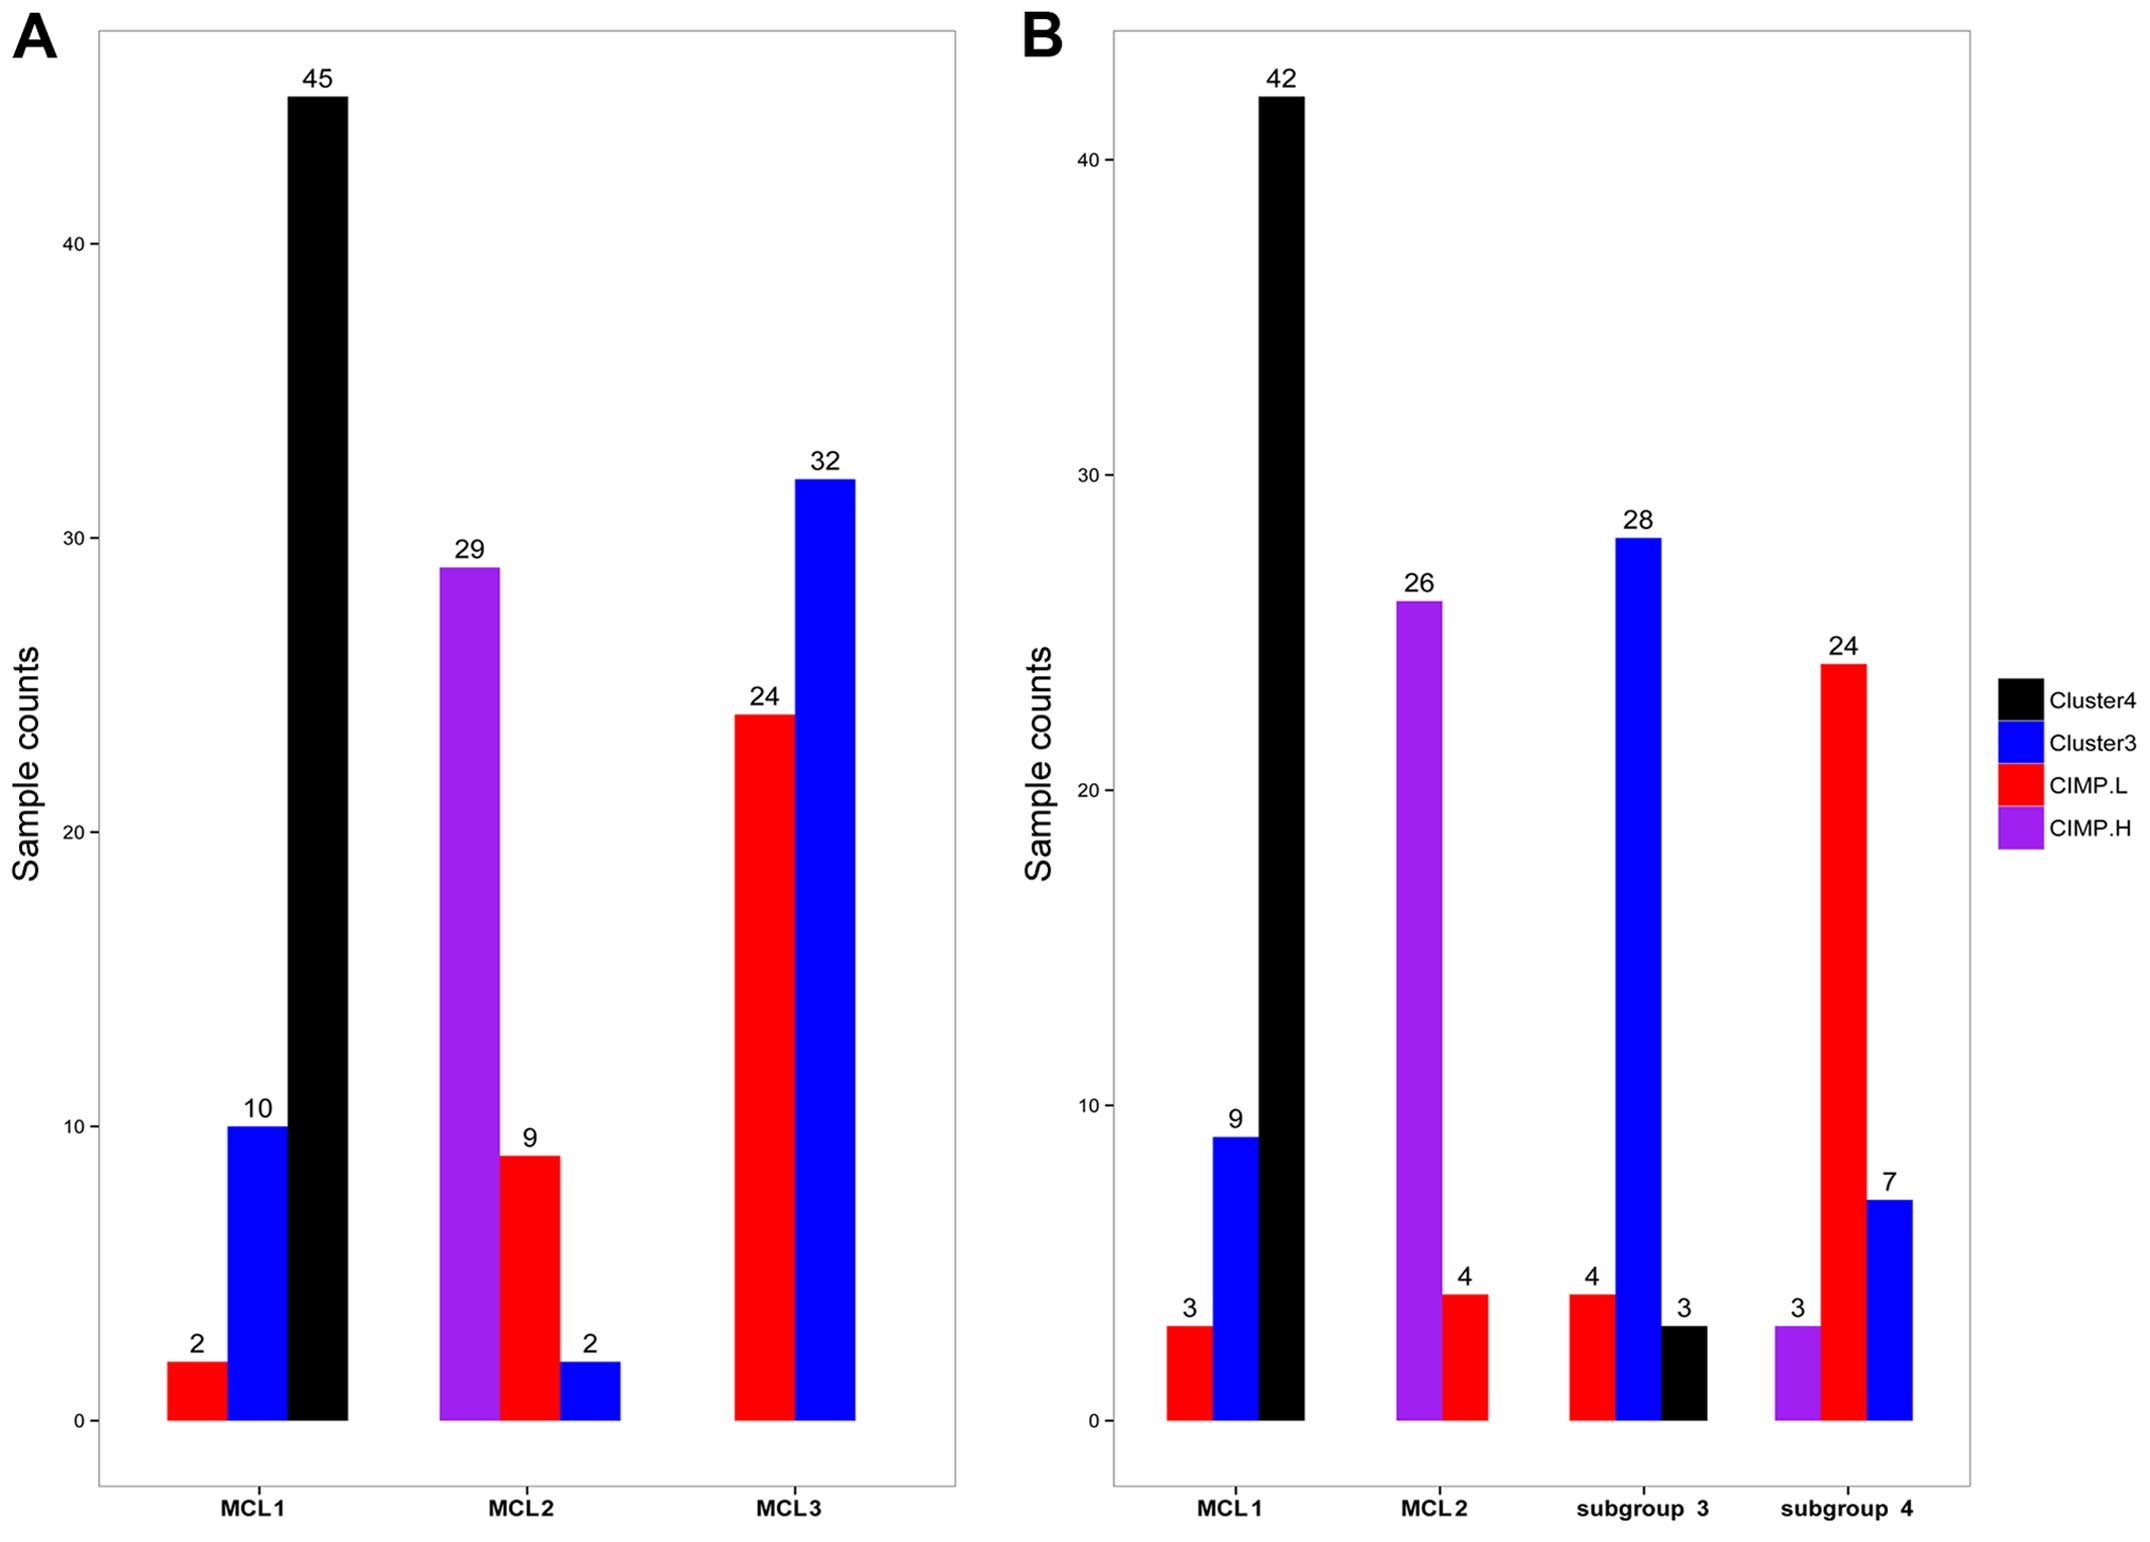
Compared with the results of TCGA and Hinoue et
al (3,11) (Fig.
6A), most samples in cluster 4 fell into MCL1, and all of
CIMP-H samples were in MCL2; majority of the samples in CIMP-L and
cluster 3 fell into MCL3 (P<2.2e-16, Fisher's exact test).
Characteristics of MCL3 were quite similar with
CIMP2. The CIMP2 showed more heterogeneity than the other two
(12), hence we further examined
the subdivision of MCL3. When K=4, the four subgroups
generated were largely overlapped with the previous classification
(Fig. 6B), but the cluster
consensus were lower than that when K=3 (Fig. 5D). To judge whether the CIMP-L and
cluster 3 were distinct subtypes of colon cancer, we examined the
data in Table I of Hinoue et
al (11), and we found that
tumor location and the frequence of TP53 mutation exhibited
significant difference between the two clusters.
DNA methylation gene marker panels and
their biological characteristics
PAM analysis was applied in these three subgroups to
identify DNA methylation gene maker panels which could discriminate
the subgroups. Firstly, MCL2 (CIMP-H) was compared with the
combination of the MCL1 and MCL3 (Non-CIMP-H), when Δ=11.4, 52
probes corresponding to 47 genes were selected as the first panel,
and the overall error rate was 0.052. DSC3, LOX, RUNX3,
SLC30A2 and TLR2 harbored two hypermethylation sites in
the samples from MCL2 subgroup. Secondly, regardless of MCL2, MCL1
(cluster 4) was compared with MCL3, when Δ =6.99 and overall error
rate was 0.079, 39 probes corresponding to 33 genes were selected
as the second panel. ELMO1, JAKMIP1, NCAM1, NDRG4 harbored
two hypermethylation sites in the samples from MCL3.
Combining two marker panels, there were 80
methylation genes. DAVID analysis on these genes showed that they
were enriched in cell fate commitment, neuron differentiation,
extracellular matrix, and sequence-specific DNA binding GO terms.
We also used GeneMANIA to build the co-expression network of these
80 genes, and it turned out that the Wnt receptor signaling pathway
and the digestive system development pathway were involved in the
network.
Overlapping of subgroups derived from two
molecular levels
We performed hierarchical clustering on all 153
samples with the genes in the two panels and were able to find
three subtypes in DNA methylation data. Labels of ECL1 and ECL2 in
each sample were also listed. Almost all samples in MCL2 were
overlapped with those in ECL2; moreover, the ECL1 comprised MCL1
and MCL3 (Fig. 7).
Discussion
Two main subtypes were identified in gene expression
level and three main subtypes were found in gene methylation level
(Fig. 8). For subtypes found in
gene expression data, ECL2 was associated with MSI-H status,
BRAF mutation, higher age and right tumor location; the
samples from this subtype showed higher homogeneity than the
samples in ECL1. Noteworthy, ECL1 could be further divided into
three subclasses, both subclass 1 and 2 were related to CIN; and
subclass 3 was related to Invasive type. We found that 6 genes,
including HOTAIR, were upregulated in subclass 2.
HOTAIR is an lncRNA that plays a key role in the initiation
and progression of different types of cancer (29). Patients with high HOTAIR
expression had higher recurrence rates and reduced metastasis-free
and overall survival than patients with low HOTAIR
expression (30). Hence,
HOTAIR might be one of the most important marker genes
contributing to the difference of metastasis rate and death rate
between two CIN status-related subclass, and this supports the
finding of Kogo et al (31). In addition, these results also
suggested that samples with CIN status might be refined into two
different subclasses.
A list of genes for discriminating two subtypes
(ECL1 and ECL2) was also determined, and these genes were involved
in some important pathway of colon cancer pathogenesis, such as the
chemokine receptor binding chemokine pathway and ERBB
receptor signaling network. The chemokine receptor binding
chemokine pathway is an upstream pathway of MAPK signaling
pathway and JAK-STAT signaling pathway. Generally speaking,
the alteration of genes influenced the changes of these pathways,
finally resulting in different subtypes in colon cancer.
For subtypes found in DNA methylation level, MCL1
was association with cluster 4 which contained mostly sigmoid colon
samples (68%). The tumors in cluster 4 were significantly enriched
in the rectum compared with the other groups (11), whereas all of the samples we used
were colon samples. This might be due to the fact that sigmoid and
rectum are the closest in anatomy. The characteristics of the
samples that belong to MCL1 are similar with LME subtype derived
from Yagi et al (2) and
CIMP-negative from Shen et al (12), although the frequency of MSI
status, TP53 and KRAS mutation was lower than that
reported in previous studies, this subgroup could still be taken as
a specific subtype of colon cancer. MCL2 contained all samples in
CIMP-H status and with BRAF mutation, right tumor and the highest
mean age, and more than 50% of the samples in MSI-H status. This
was quite similar with previous reported subtypes such as CIMP1
(12), HME (2) and CIMP-H (11). Of note, the frequency of male in
MCL2 was higher than that of female patients (62.5%), and in MCL3
the frequency of female patients was higher than that of male
patients (64.3%). This suggested that colon cancer was to some
extent related to the gender (P<0.029, Fisher's exact test). We
also found that samples in MCL2 exhibited high homogeneity.
MCL3 was comprised of CIMP-L and cluster 3 (11). The MCL3, which was the most
heterogeneous subgroup, was similar with CIMP2 (12) and IME (2), although the frequence of KRAS
mutation was lower than that in CIMP2 (92%), but this coincided
with CIMP-L. We attempted to subdivide MCL3 and could not find
sufficient evidence to support cluster 3 as a specific epigenetic
subtype of colon cancer, except that the tumor location and the
frequence of TP53 mutation exhibited significant difference
between the two clusters. More experiments and analyses should be
carried out to resolve this.
The genes in first marker gene panel were
hypermethylation in MCL2, and the genes in second panel were
hypermethylation in MCL3. Almost all of the classic markers
(32), such as RUNX3, LOX,
CACNA1G and MYOCD were involved in the first panel, and
SLC30A2, NEUROG2 were also found in this panel. NEUROG1,
PRICKLE1 and SOX5 were found in the second panel.
Furthermore, our data suggested that MCL2 were overlapped with
ECL2, and the ECL1 comprised MCL1 and MCL3.
In this study, we only focused on the number of
subtypes in different molecular levels of colon cancer, and did not
explain molecular mechanisms forming these subtypes. Our findings
might be helpful in understanding the subtypes of colon cancer in
different molecular levels and provide a useful resource with
clinical implications for further studies.
Acknowledgements
This study is supported by National Natural Science
Foundation of China (grant no. 31371290), and a Start-up Grant from
Guangdong Province (YCJ-2011-430) and Southern Medical University
and Guangdong Province.
References
|
1
|
Minsky BD: Unique considerations in the
patient with rectal cancer. Semin Oncol. 38:542–551. 2011.
View Article : Google Scholar : PubMed/NCBI
|
|
2
|
Yagi K, Akagi K, Hayashi H, Nagae G, Tsuji
S, Isagawa T, Midorikawa Y, Nishimura Y, Sakamoto H, Seto Y, et al:
Three DNA methylation epigenotypes in human colorectal cancer. Clin
Cancer Res. 16:21–33. 2010. View Article : Google Scholar
|
|
3
|
Cancer Genome Atlas Network. Comprehensive
molecular characterization of human colon and rectal cancer.
Nature. 487:330–337. 2012. View Article : Google Scholar : PubMed/NCBI
|
|
4
|
Walther A, Johnstone E, Swanton C, Midgley
R, Tomlinson I and Kerr D: Genetic prognostic and predictive
markers in colorectal cancer. Nat Rev Cancer. 9:489–499. 2009.
View Article : Google Scholar : PubMed/NCBI
|
|
5
|
Wang Y, Jatkoe T, Zhang Y, Mutch MG,
Talantov D, Jiang J, McLeod HL and Atkins D: Gene expression
profiles and molecular markers to predict recurrence of Dukes' B
colon cancer. J Clin Oncol. 22:1564–1571. 2004. View Article : Google Scholar : PubMed/NCBI
|
|
6
|
Barrier A, Boelle PY, Roser F, Gregg J,
Tse C, Brault D, Lacaine F, Houry S, Huguier M, Franc B, et al:
Stage II colon cancer prognosis prediction by tumor gene expression
profiling. J Clin Oncol. 24:4685–4691. 2006. View Article : Google Scholar : PubMed/NCBI
|
|
7
|
Oh SC, Park YY, Park ES, Lim JY, Kim SM,
Kim SB, Kim J, Kim SC, Chu IS, Smith JJ, et al: Prognostic gene
expression signature associated with two molecularly distinct
subtypes of colorectal cancer. Gut. 61:1291–1298. 2012. View Article : Google Scholar :
|
|
8
|
Slattery ML, Wolff E, Hoffman MD, Pellatt
DF, Milash B and Wolff RK: MicroRNAs and colon and rectal cancer:
differential expression by tumor location and subtype. Genes
Chromosomes Cancer. 50:196–206. 2011. View Article : Google Scholar : PubMed/NCBI
|
|
9
|
Toyota M, Ahuja N, Ohe-Toyota M, Herman
JG, Baylin SB and Issa JP: CpG island methylator phenotype in
colorectal cancer. Proc Natl Acad Sci USA. 96:8681–8686. 1999.
View Article : Google Scholar : PubMed/NCBI
|
|
10
|
Weisenberger DJ, Siegmund KD, Campan M,
Young J, Long TI, Faasse MA, Kang GH, Widschwendter M, Weener D,
Buchanan D, et al: CpG island methylator phenotype underlies
sporadic microsatellite instability and is tightly associated with
BRAF mutation in colorectal cancer. Nat Genet. 38:787–793. 2006.
View Article : Google Scholar : PubMed/NCBI
|
|
11
|
Hinoue T, Weisenberger DJ, Lange CP, Shen
H, Byun HM, Van De Berg D, Malik S, Pan F, Noushmehr H, van Dijk
CM, et al: Genome-scale analysis of aberrant DNA methylation in
colorectal cancer. Genome Res. 22:271–282. 2012. View Article : Google Scholar :
|
|
12
|
Shen L, Toyota M, Kondo Y, Lin E, Zhang L,
Guo Y, Hernandez NS, Chen X, Ahmed S, Konishi K, et al: Integrated
genetic and epigenetic analysis identifies three different
subclasses of colon cancer. Proc Natl Acad Sci USA.
104:18654–18659. 2007. View Article : Google Scholar : PubMed/NCBI
|
|
13
|
Troyanskaya O, Cantor M, Sherlock G, Brown
P, Hastie T, Tibshirani R, Botstein D and Altman RB: Missing value
estimation methods for DNA microarrays. Bioinformatics. 17:520–525.
2001. View Article : Google Scholar : PubMed/NCBI
|
|
14
|
Monti S, Tamayo P, Mesirov J and Golub T:
Consensus Clustering: A resampling-based method for class discovery
and visualization of gene expression microarray data. Mach Learn.
52:91–118. 2003. View Article : Google Scholar
|
|
15
|
Rousseeuw P: Silhouettes: A graphical aid
to the interpretation and validation of cluster analysis. J Comput
Appl Math. 20:53–65. 1987. View Article : Google Scholar
|
|
16
|
Verhaak RG, Hoadley KA, Purdom E, Wang V,
Qi Y, Wilkerson MD, Miller CR, Ding L, Golub T, Mesirov JP, et al:
Integrated genomic analysis identifies clinically relevant subtypes
of glioblastoma characterized by abnormalities in PDGFRA, IDH1,
EGFR, and NF1. Cancer Cell. 17:98–110. 2010. View Article : Google Scholar : PubMed/NCBI
|
|
17
|
Lovmar L, Ahlford A, Jonsson M and Syvänen
AC: Silhouette scores for assessment of SNP genotype clusters. BMC
Genomics. 6:352005. View Article : Google Scholar : PubMed/NCBI
|
|
18
|
Tusher VG, Tibshirani R and Chu G:
Significance analysis of microarrays applied to the ionizing
radiation response. Proc Natl Acad Sci USA. 98:5116–5121. 2001.
View Article : Google Scholar : PubMed/NCBI
|
|
19
|
Tibshirani R, Hastie T, Narasimhan B and
Chu G: Diagnosis of multiple cancer types by shrunken centroids of
gene expression. Proc Natl Acad Sci USA. 99:6567–6572. 2002.
View Article : Google Scholar : PubMed/NCBI
|
|
20
|
Dennis G Jr, Sherman BT, Hosack DA, Yang
J, Gao W, Lane HC and Lempicki RA: DAVID: Database for Annotation,
Visualization, and Integrated Discovery. Genome Biol. 4:32003.
View Article : Google Scholar
|
|
21
|
Huang da W, Sherman BT and Lempicki RA:
Bioinformatics enrichment tools: paths toward the comprehensive
functional analysis of large gene lists. Nucleic Acids Res.
37:1–13. 2009. View Article : Google Scholar :
|
|
22
|
Warde-Farley D, Donaldson SL, Comes O,
Zuberi K, Badrawi R, Chao P, Franz M, Grouios C, Kazi F, Lopes CT,
et al: The GeneMANIA prediction server: biological network
integration for gene prioritization and predicting gene function.
Nucleic Acids Res. 38(Web Server issue): W214–W220. 2010.
View Article : Google Scholar : PubMed/NCBI
|
|
23
|
Siegmund KD: Statistical approaches for
the analysis of DNA methylation microarray data. Hum Genet.
129:585–595. 2011. View Article : Google Scholar : PubMed/NCBI
|
|
24
|
Du P, Zhang X, Huang CC, Jafari N, Kibbe
WA, Hou L and Lin SM: Comparison of Beta-value and M-value methods
for quantifying methylation levels by microarray analysis. BMC
Bioinformatics. 11:5872010. View Article : Google Scholar : PubMed/NCBI
|
|
25
|
Houseman EA, Christensen BC, Yeh RF,
Marsit CJ, Karagas MR, Wrensch M, Nelson HH, Wiemels J, Zheng S,
Wiencke JK, et al: Model-based clustering of DNA methylation array
data: a recursive-partitioning algorithm for high-dimensional data
arising as a mixture of beta distributions. BMC Bioinformatics.
9:3652008. View Article : Google Scholar : PubMed/NCBI
|
|
26
|
Gentleman RC, Carey VJ, Bates DM, Bolstad
B, Dettling M, Dudoit S, Ellis B, Gautier L, Ge Y, Gentry J, et al:
Bioconductor: open software development for computational biology
and bioinformatics. Genome Biol. 5:R802004. View Article : Google Scholar : PubMed/NCBI
|
|
27
|
R Development Core Team. 2011, R: A
Language and Environment for Statistical Computing. Vienna,
Austria: the R Foundation for Statistical Computing; ISBN:
3-900051-07-0Available online at http://www.R-project.org/.
|
|
28
|
Subramanian A, Tamayo P, Mootha VK,
Mukherjee S, Ebert BL, Gillette MA, Paulovich A, Pomeroy SL, Golub
TR, Lander ES, et al: Gene set enrichment analysis: a
knowledge-based approach for interpreting genome-wide expression
profiles. Proc Natl Acad Sci USA. 102:15545–15550. 2005. View Article : Google Scholar : PubMed/NCBI
|
|
29
|
Hajjari M and Salavaty A: HOTAIR: an
oncogenic long non-coding RNA in different cancers. Cancer Biol
Med. 12:1–9. 2015.PubMed/NCBI
|
|
30
|
Wu ZH, Wang XL, Tang HM, Jiang T, Chen J,
Lu S, Qiu GQ, Peng ZH and Yan DW: Long non-coding RNA HOTAIR is a
powerful predictor of metastasis and poor prognosis and is
associated with epithelial-mesenchymal transition in colon cancer.
Oncol Rep. 32:395–402. 2014.PubMed/NCBI
|
|
31
|
Kogo R, Shimamura T, Mimori K, Kawahara K,
Imoto S, Sudo T, Tanaka F, Shibata K, Suzuki A, Komune S, et al:
Long noncoding RNA HOTAIR regulates polycomb-dependent chromatin
modification and is associated with poor prognosis in colorectal
cancers. Cancer Res. 71:6320–6326. 2011. View Article : Google Scholar : PubMed/NCBI
|
|
32
|
Kim MS, Lee J and Sidransky D: DNA
methylation markers in colorectal cancer. Cancer Metastasis Rev.
29:181–206. 2010. View Article : Google Scholar : PubMed/NCBI
|