Introduction
Reactive oxygen species (ROS) such as hydrogen
peroxide (H2O2), superoxide anion
(O2•−) and hydroxyl radical (•OH)
are involved in diverse cellular proceedings of differentiation,
cell proliferation and cell death. Redox status changes in tissues
and cells influence the production and metabolism of ROS. ROS are
primarily generated during the mitochondrial respiration and are
specifically made by various oxidases (1). Superoxide dismutases (SODs)
[cytoplasmic (SOD1), mitochondrial (SOD2) or extracellular (SOD3)
isoforms] metabolize O2•− to
H2O2 (2).
Further metabolism of H2O2 by catalase (CAT)
or glutathione (GSH) peroxidase (GPX) yields O2 and
H2O (3). Particularly,
thioredoxin (TXN) system consisting of TXN, TXN reductase (TXNR)
and NADPH critically regulates cellular redox homeostasis (4). TXN as a thiol reductase acts as a
potent anti-oxidant as well as a scavenger against ROS (4). Oxidative stress due to either
overproduction of ROS or accumulation of them can initiate events
that lead to cell death.
Antimycin A (AMA) derived from Streptomyces
kitazawensis inhibits succinate and NADH oxidases and this
agent also impedes mitochondrial electron transport via its binding
to complex III (5). The inhibition
of electron transport triggers a failure of the proton gradient
across the mitochondrial inner membrane, thereby collapsing
mitochondrial membrane potential (MMP; ΔΨm) (6,7).
This inhibition can lead to the overproduction of ROS (7,8).
Accordingly, oxidative stress and the collapse of MMP
(ΔΨm) by AMA unlock the mitochondrial permeability
transition pore (PTP), which is accompanied by the release of
cytochrome c into the cytoplasm to induce apoptosis
(9,10). In fact, AMA-induced apoptosis has
been reported in a variety of cells including HeLa cervical cancer
cells (11), As4.1 juxtaglomerular
cells (12), HL60 leukemia cells
(13) and Hep3B hepatoma cells
(14) and normal endothelial cells
(15).
Previously we reported that AMA reduces the growth
of Calu-6 and A549 lung cancer cells via apoptosis and cell cycle
arrest (16,17). AMA also increases ROS levels in
A549 cells (17) and induces GSH
depletion in Calu-6 cells (18).
However, little is known about the cellular effects of PG on normal
primary lung cells. Thus, we examined the effects of AMA on cell
growth and death in human pulmonary fibroblast (HPF) cells in
relation to ROS and GSH levels. In addition, we investigated the
effects of N-acetylcysteine (NAC) and vitamin C (well known
antioxidants) or L-buthionine sulfoximine (BSO; an inhibitor of GSH
synthesis) on AMA-induced HPF cell death.
Materials and methods
Cell culture
HPF cells purchased from PromoCell GmbH (Heidelberg,
Germany) were cultured in RPMI-1640 supplemented with 10% fetal
bovine serum (FBS) and 1% penicillin-streptomycin (Gibco BRL, Grand
Island, NY, USA). HPF cells were used for experiments between
passages four and eight.
Reagents
AMA purchased from Sigma-Aldrich Chemical Co. was
dissolved in ethanol at 20 mM. Pan-caspase inhibitor (Z-VAD-FMK)
was obtained from R&D Systems, Inc. (Minneapolis, MN, USA) and
was dissolved in dimethyl sulfoxide (Sigma-Aldrich Chemical Co.).
NAC and BSO were obtained from Sigma-Aldrich Chemical Co. NAC was
dissolved in the buffer [20 mM HEPES (pH 7.0)]. BSO was dissolved
in water. Vitamin C purchased from Riedel-de Haen (Hannover,
Germany) was also dissolved in water. Based on the previous studies
(19,20), cells were pretreated with or
without 15 μM Z-VAD, 2 mM NAC, 10 μM BSO or 1 mM vitamin C for one
hour prior to AMA treatment.
Cell growth inhibition assays
Cell growth changes were determined by measuring the
3-(4,5-dimethylthiazol-2-yl)-2,5-diphenyltetrazolium bromide (MTT,
Sigma-Aldrich Chemical Co.) dye absorbance as previously described
(21). Cells were exposed to the
indicated amounts of AMA (2–200 μM) with or without Z-VAD, NAC,
vitamin C or BSO for 24 h.
Cell cycle and sub-G1 analysis
Cellcycleandsub-G1cellswere determined by propidium
iodide (PI, Ex/Em=488 nm/617 nm; Sigma-Aldrich) staining as
previously described (22). Cells
were incubated with the indicated amounts of AMA (2–200 μM) for 24
h. Cellular DNA content was measured using a FACStar flow cytometer
(Becton-Dickinson, Franklin Lakes, NJ, USA).
Annexin V/PI staining for cell death
detection
Apoptosis was determined by staining cells with
Annexin V-fluorescein isothiocyanate (FITC, Ex/Em=488 nm/519 nm;
Invitrogen Molecular Probes, Eugene, OR, USA) and propidium iodide
(PI, Ex/Em=488 nm/617 nm; Sigma-Aldrich), as previously described
(22). Cells were incubated with
the indicated amounts of AMA (2–200 μM) in the presence or absence
of Z-VAD, NAC, vitamin C or BSO for 24 h. Annexin V/PI staining was
analyzed with a FACStar flow cytometer (Becton-Dickinson).
Western blot analysis
The changes of proteins related to apoptosis and
antioxidant system were determined by western blotting as
previously described (22). Cells
were incubated with 150 μM AMA for 24 h. Samples containing 10 μg
total protein were resolved by 12.5% SDS-PAGE gels, transferred to
Immobilon-P PVDF membranes (Millipore, Billerica, MA, USA) by
electroblotting and then probed with anti-PARP, anti-SOD1,
anti-SOD2, anti-procaspase-3, anti-TXN, anti-TXNR1, anti-TXNR2 and
anti-β-actin antibodies (Santa Cruz Biotechnology, Santa Cruz, CA,
USA).
Measurement of MMP (ΔΨm)
MMP (ΔΨm) levels were measured using a
rhodamine 123 fluorescent dye (Sigma-Aldrich; Ex/Em=485 nm/535 nm)
as previously described (21,22).
Cells were incubated with the indicated amounts of AMA (2–200 μM)
in the presence or absence of Z-VAD, NAC, vitamin C or BSO for 24
h. The absence of rhodamine 123 from cells indicated the loss of
MMP (ΔΨm) in HPF cells. The MMP (ΔΨm) levels
in the cells excluding MMP (ΔΨm) loss cells were
expressed as mean fluorescence intensity (MFI), which was
calculated by CellQuest software (Becton-Dickinson).
Detection of intracellular ROS
levels
Intracellular ROS were detected by a fluorescent
probe dye, 2′,7′-dichlorodihydrofluorescein diacetate
(H2DCFDA, Ex/Em=495 nm/529 nm; Invitrogen Molecular
Probes) as previously described (22). Dihydroethidium (DHE, Ex/Em=518
nm/605 nm; Invitrogen Molecular Probes) is a fluorogenic probe that
is highly selective for O2•− among ROS. Cells
were incubated with the indicated doses of AMA (2–200 μM) in the
presence or absence of Z-VAD, NAC, BSO or vitamin C for the
indicated times. The fluorescence of DCF and DHE was detected using
a FACStar flow cytometer (Becton-Dickinson). ROS levels were
expressed as MFI.
Detection of the intracellular GSH
Cellular GSH levels were analyzed using a
5-chloromethylfluorescein diacetate dye (CMFDA, Ex/Em=522 nm/595
nm; Invitrogen Molecular Probes) as previously described (21,22).
Cells were incubated with the indicated doses of AMA (2–200 μM) in
the presence or absence of Z-VAD, NAC, BSO or vitamin C for the
indicated times. CMF fluorescence intensity was determined using a
FACStar flow cytometer (Becton-Dickinson). Negative CMF staining
(GSH depleted) cells were expressed as the percent of (−) CMF
cells.
Statistical analysis
The results correspond to the mean of three
independent experiments (mean ± SD). The data were analyzed using
Instat software (GraphPad Prism4, San Diego, CA, USA). The
Student's t-test or one-way analysis of variance (ANOVA) with post
hoc analysis using Tukey's multiple comparison test was used for
parametric data. Statistical significance was defined as
p<0.05.
Results
Effects of AMA on cell growth and cell
cycle distribution in HPF cells
Firstly, we investigated the effect of AMA on the
growth of HPF cells at 24 h. Based on MTT assays, AMA decreased HPF
cell growth with an IC50 of ~150 μM in a dose-dependent
manner (Fig. 1A). When cell cycle
distributions was examined in AMA-treated HPF cells, AMA induced a
G1 phase arrest of the cell cycle as compared with control cells
(Fig. 1B). Furthermore, 200 μM AMA
clearly increased the number of sub-G1 DNA content cells by ~10% as
compared with that of control HPF cells (Fig. 1B). However, other doses of AMA did
not increase the number of sub-G1 DNA content cells (Fig. 1B).
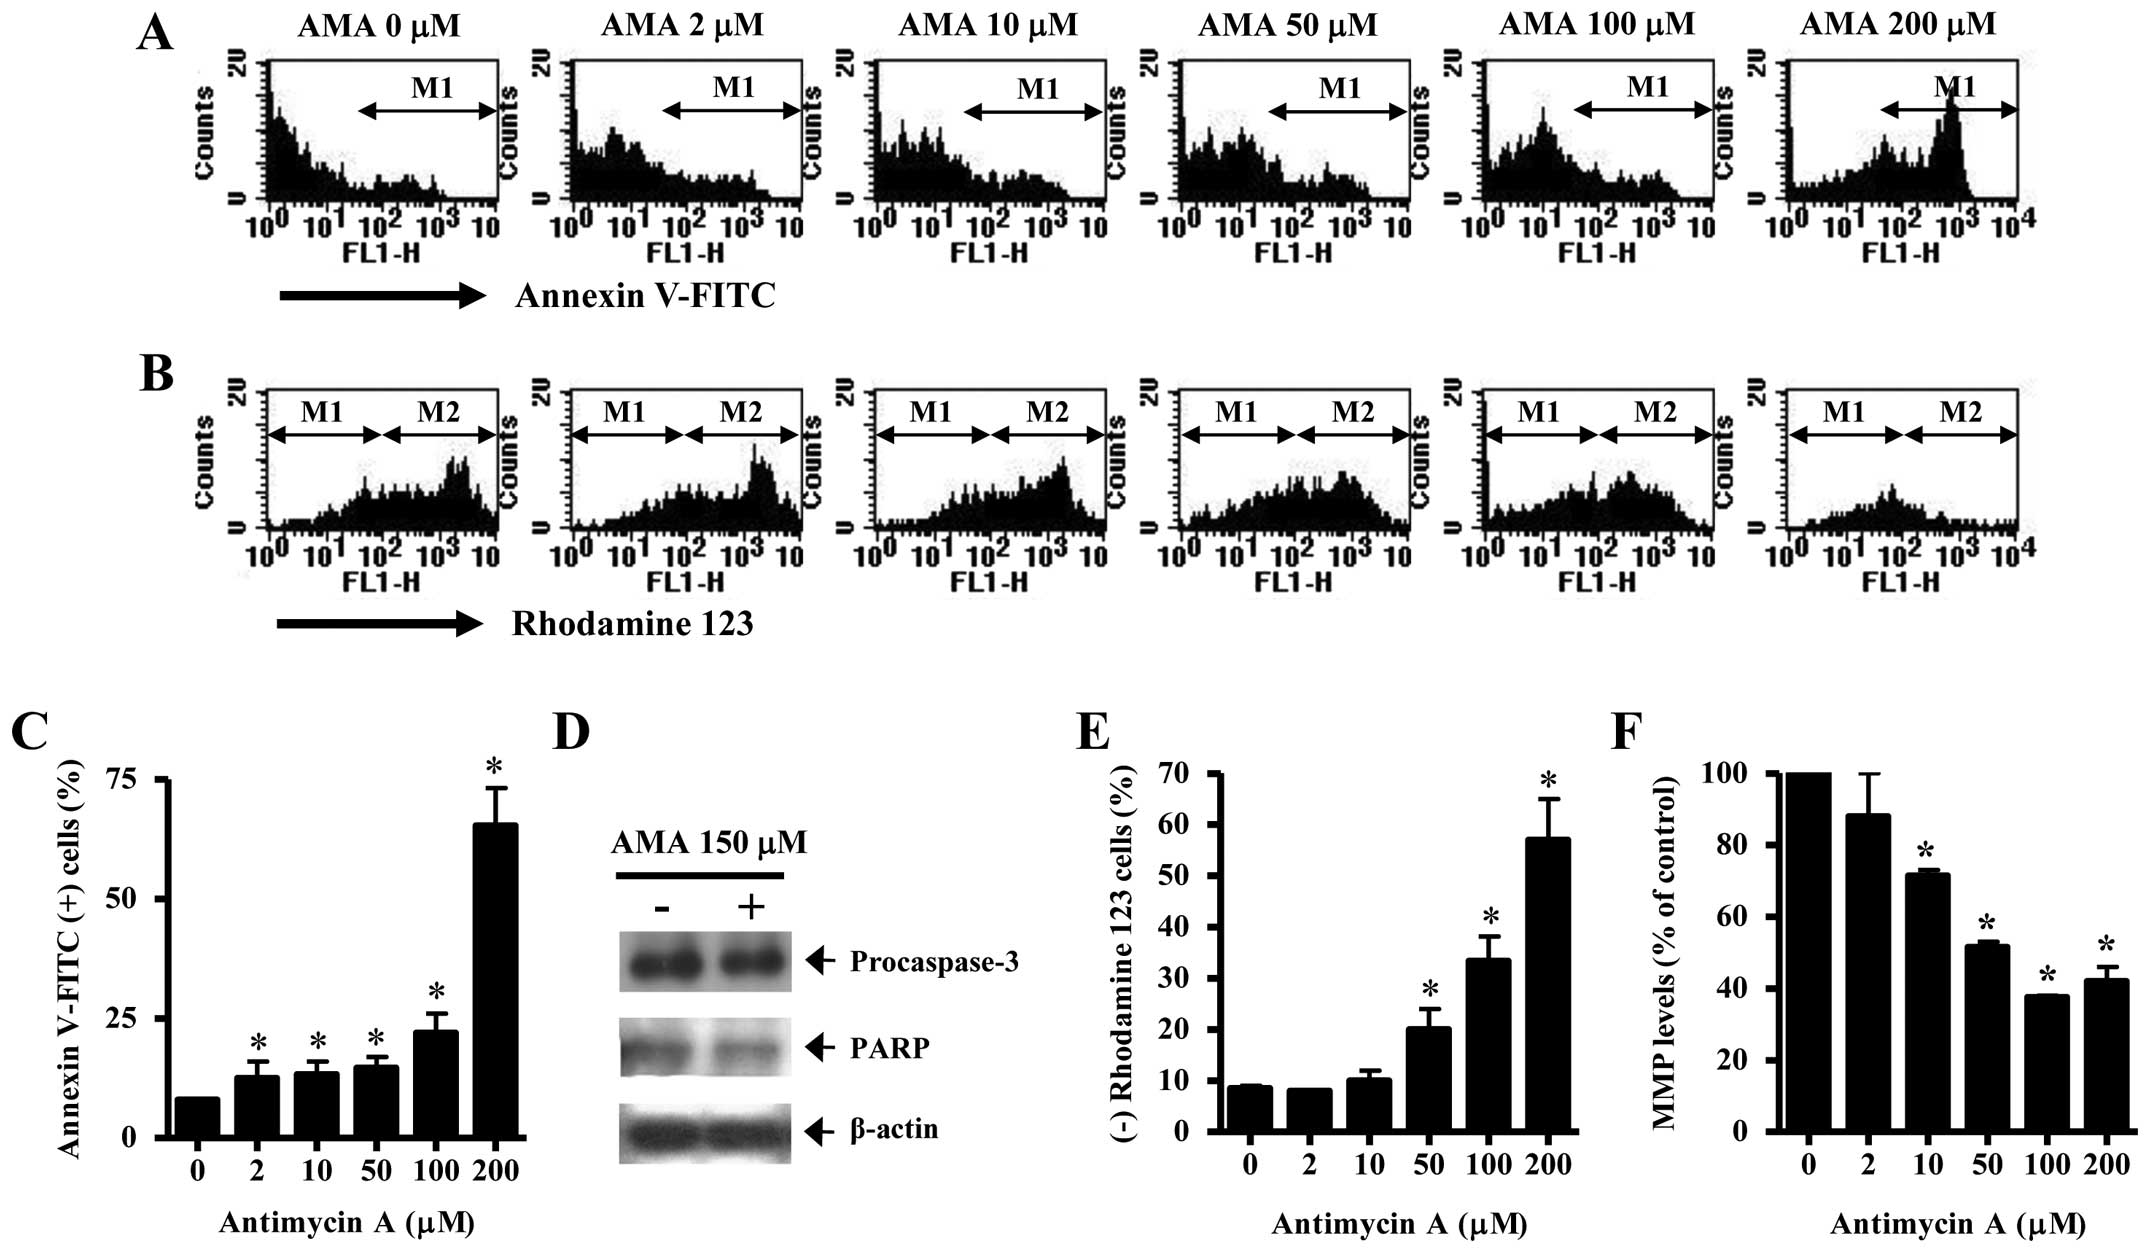
Effects of AMA on cell death,
apoptosis-related proteins and MMP (ΔΨm) in HPF
cells
It was determined whether AMA induces HPF cell death
via apoptosis. As shown in Fig. 2A and
C, AMA increased the numbers of Annexin V-FITC-positive cells
in a dose-dependent manner. The elevated change was observed
between 100 and 200 μM AMA treatment (Fig. 2A and C). Western blotting showed
that a 32-kDa precursor (procaspase-3) slightly disappeared in
AMA-treated HPF cells, implying that caspase-3 was activated in
these cells (Fig. 2D). The intact
116 kDa moiety of poly(ADP-ribose) polymerase (PARP) was decreased
by AMA (Fig. 2D). Apoptosis is
closely related to the collapse of MMP (ΔΨm).
Correspondingly, 50–200 μM AMA significantly induced the loss of
MMP (ΔΨm) in HPF cells (Fig. 2B and E). The percentage of MMP
(ΔΨm) loss in 50 or 100 μM AMA-treated HPF cells was
higher than those of Annexin V-FITC-positive cells in these cells
(Fig. 2A–C and E). The levels of
MMP (ΔΨm) in HPF cells excluding MMP (ΔΨm)
loss cells were decreased by AMA in a dose-dependent manner
(Fig. 2F).
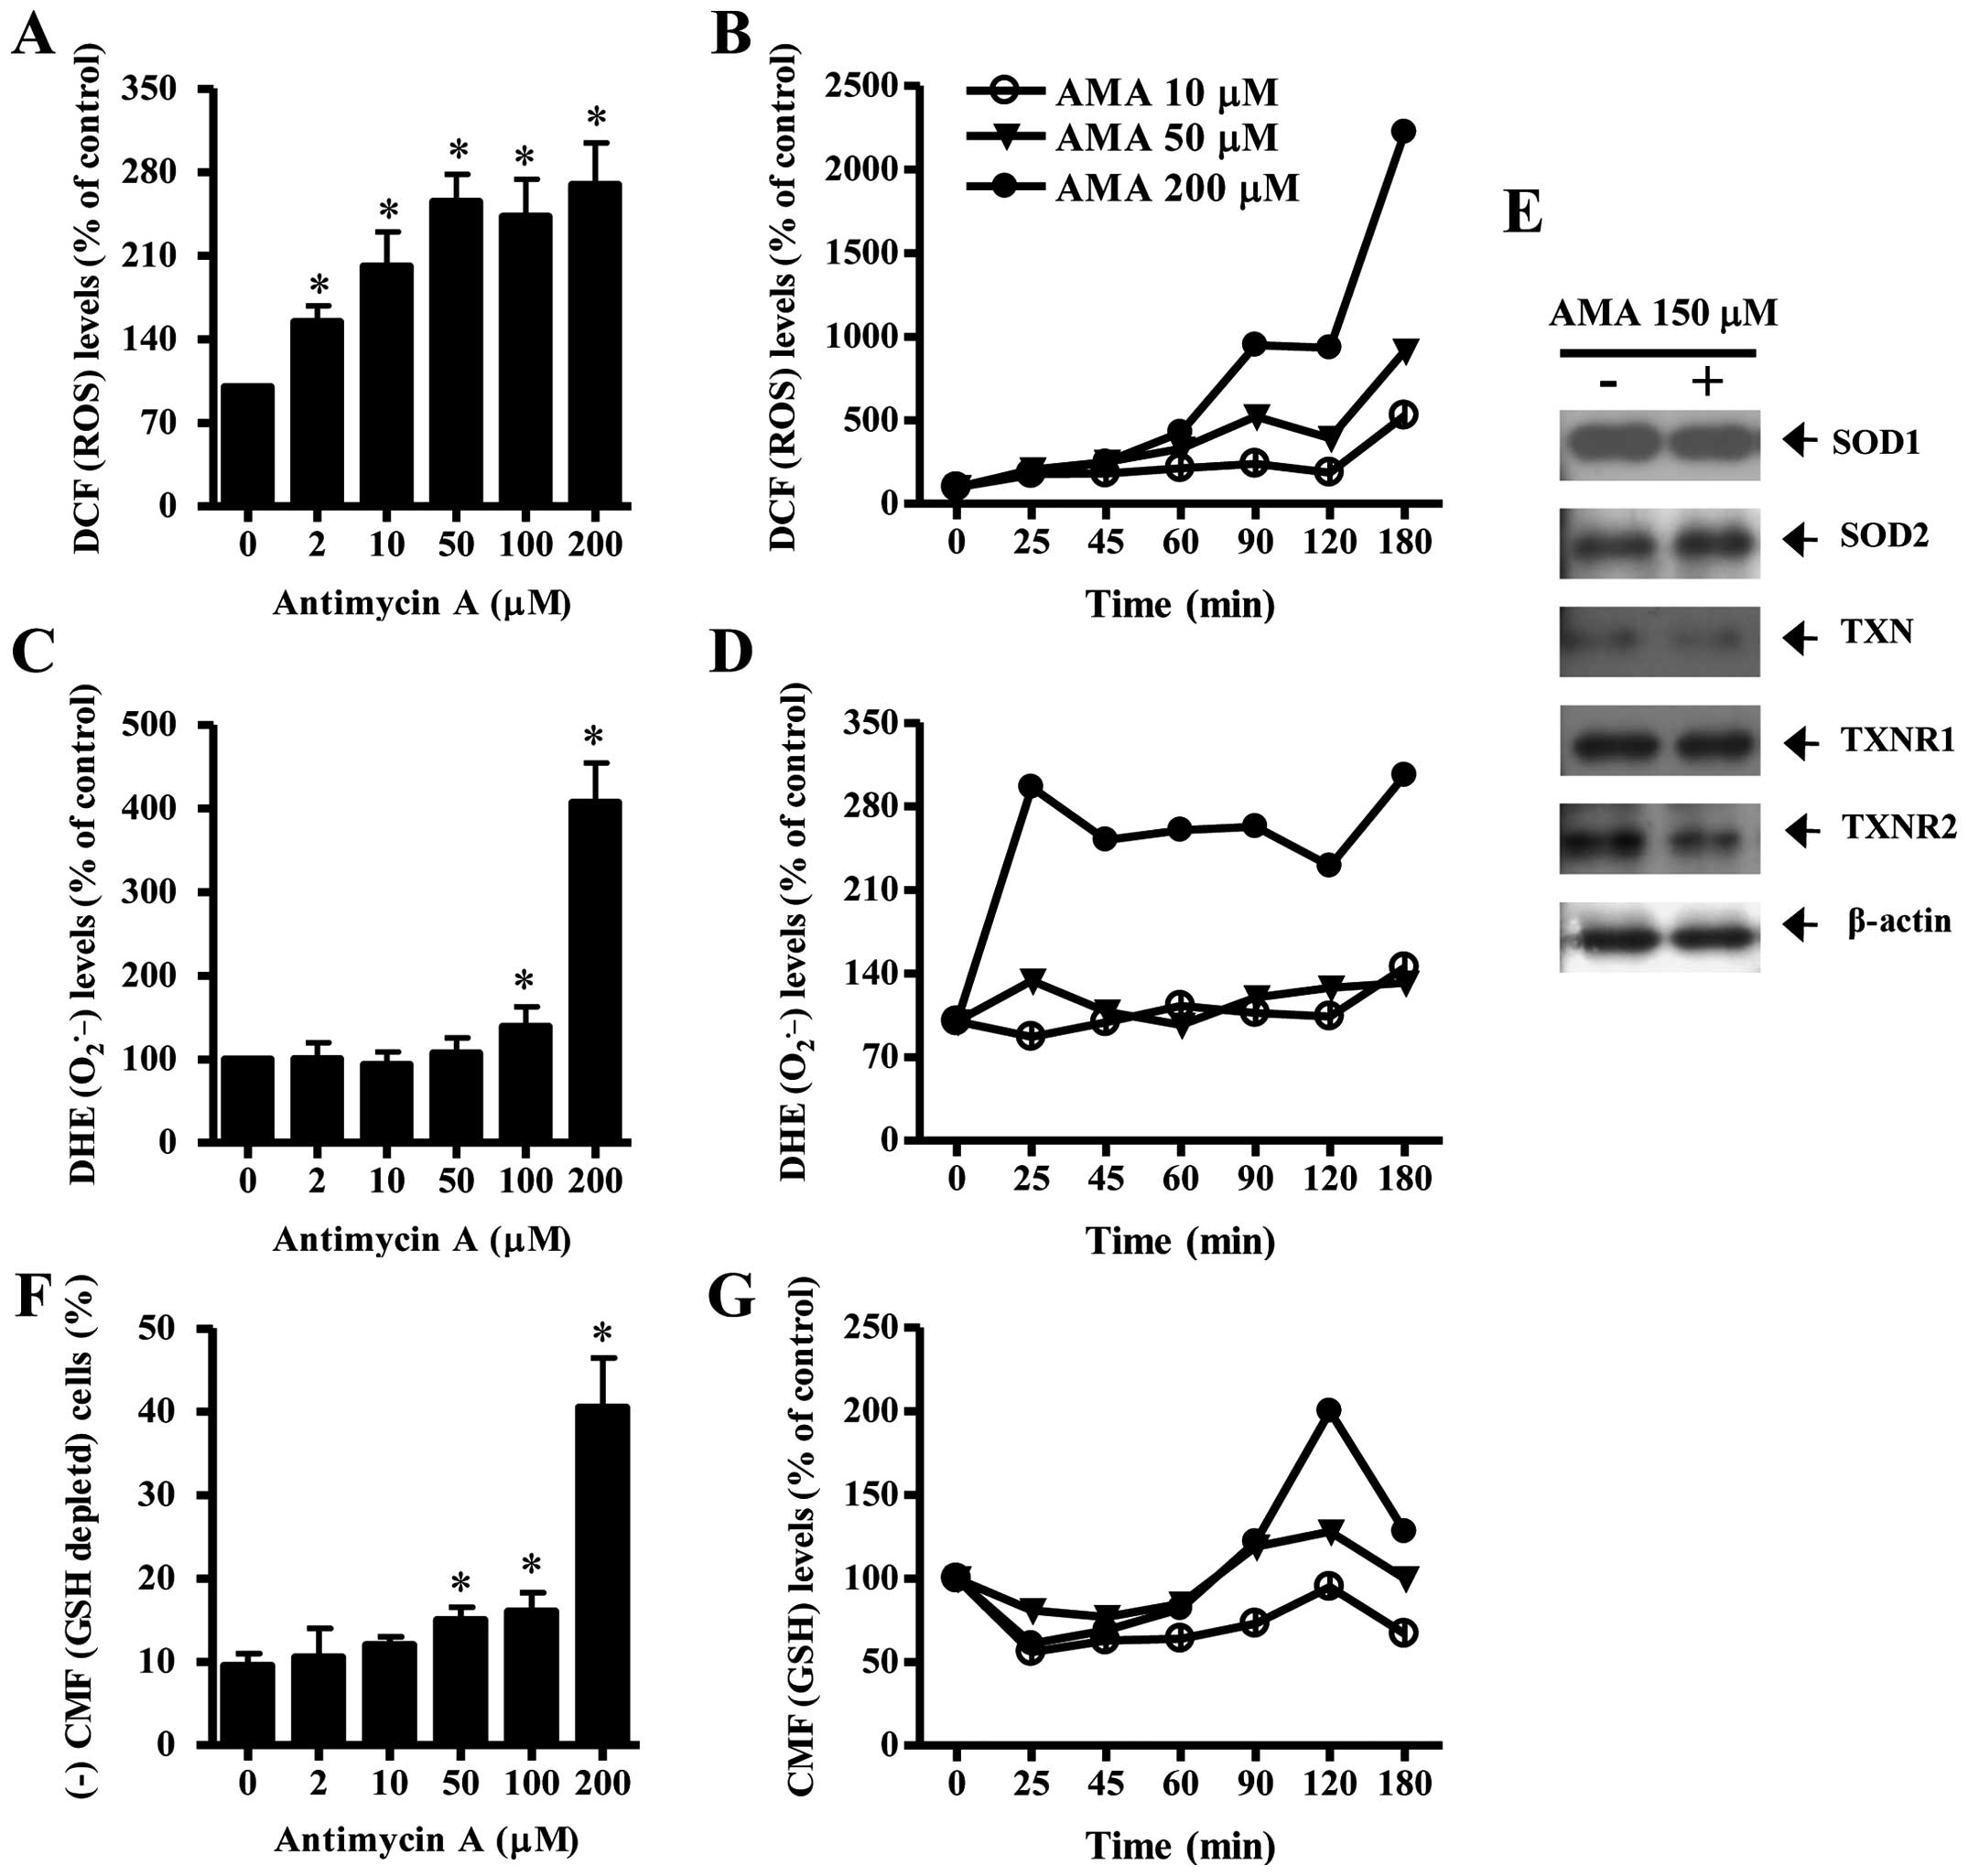
Effects of AMA on ROS, GSH and
antioxidant-protein levels in HPF cells
To assess intracellular ROS and GSH levels in
AMA-treated HPF cells, we used H2DCFDA, DHE and CMF
dyes. As shown in Fig. 3A, all the
tested doses of AMA significantly increased ROS (DCF) levels in HPF
cells at 24 h. Moreover, 10–200 μM AMA gradually increased ROS
(DCF) levels from 25 min to 180 min although there was a transient
decrease in ROS level at 120 min (Fig.
3B). At 180 min, 200 μM AMA tremendously augmented ROS (DCF)
level in HPF cells. Intracellular O2•− (DHE)
level was significantly increased in 100 or 200 μM AMA-treated HPF
cells at 24 h whereas the level was not clearly changed at the
treatment of 2, 10 or 50 μM AMA (Fig.
3C). Treatment with 50 and 200 μM AMA transiently increased
O2•− level in HPF cells at 25 min whereas 10
μM AMA decreased the level at this time (Fig. 3D). At 180 min, all the tested doses
of AMA increased O2•− levels in HPF cells and
200 μM AMA showed a strong effect (Fig. 3D). There was also a transient
decrease in O2•− level in 200 μM AMA-treated
HPF cells at 120 min (Fig. 3D).
When antioxidant-protein levels were assessed in 150 μM AMA-treated
HPF cells, the expression of SOD1 was not changed by AMA and SOD2
was slightly increased (Fig. 3E).
In addition, AMA downregulated the expression of TXN and TXNR2 in
HPF cells and it did not change that of TXNR1 (Fig. 3E).
Treatment with 50, 100 or 200 μM AMA significantly
increased GSH depleted cell number in HPF cells (Fig. 3F). However, the lower doses of 2 or
10 μM AMA did not induce GSH depletion in HPF cells as compared
with control HPF cells (Fig. 3F).
At the early time-points of 25–90 min, all the doses of AMA reduced
GSH content level in HPF cells (Fig.
3G). There were increases in GSH levels in AMA-treated HPF
cells at 120 min and the increases were attenuated at 180 min
(Fig. 3G).
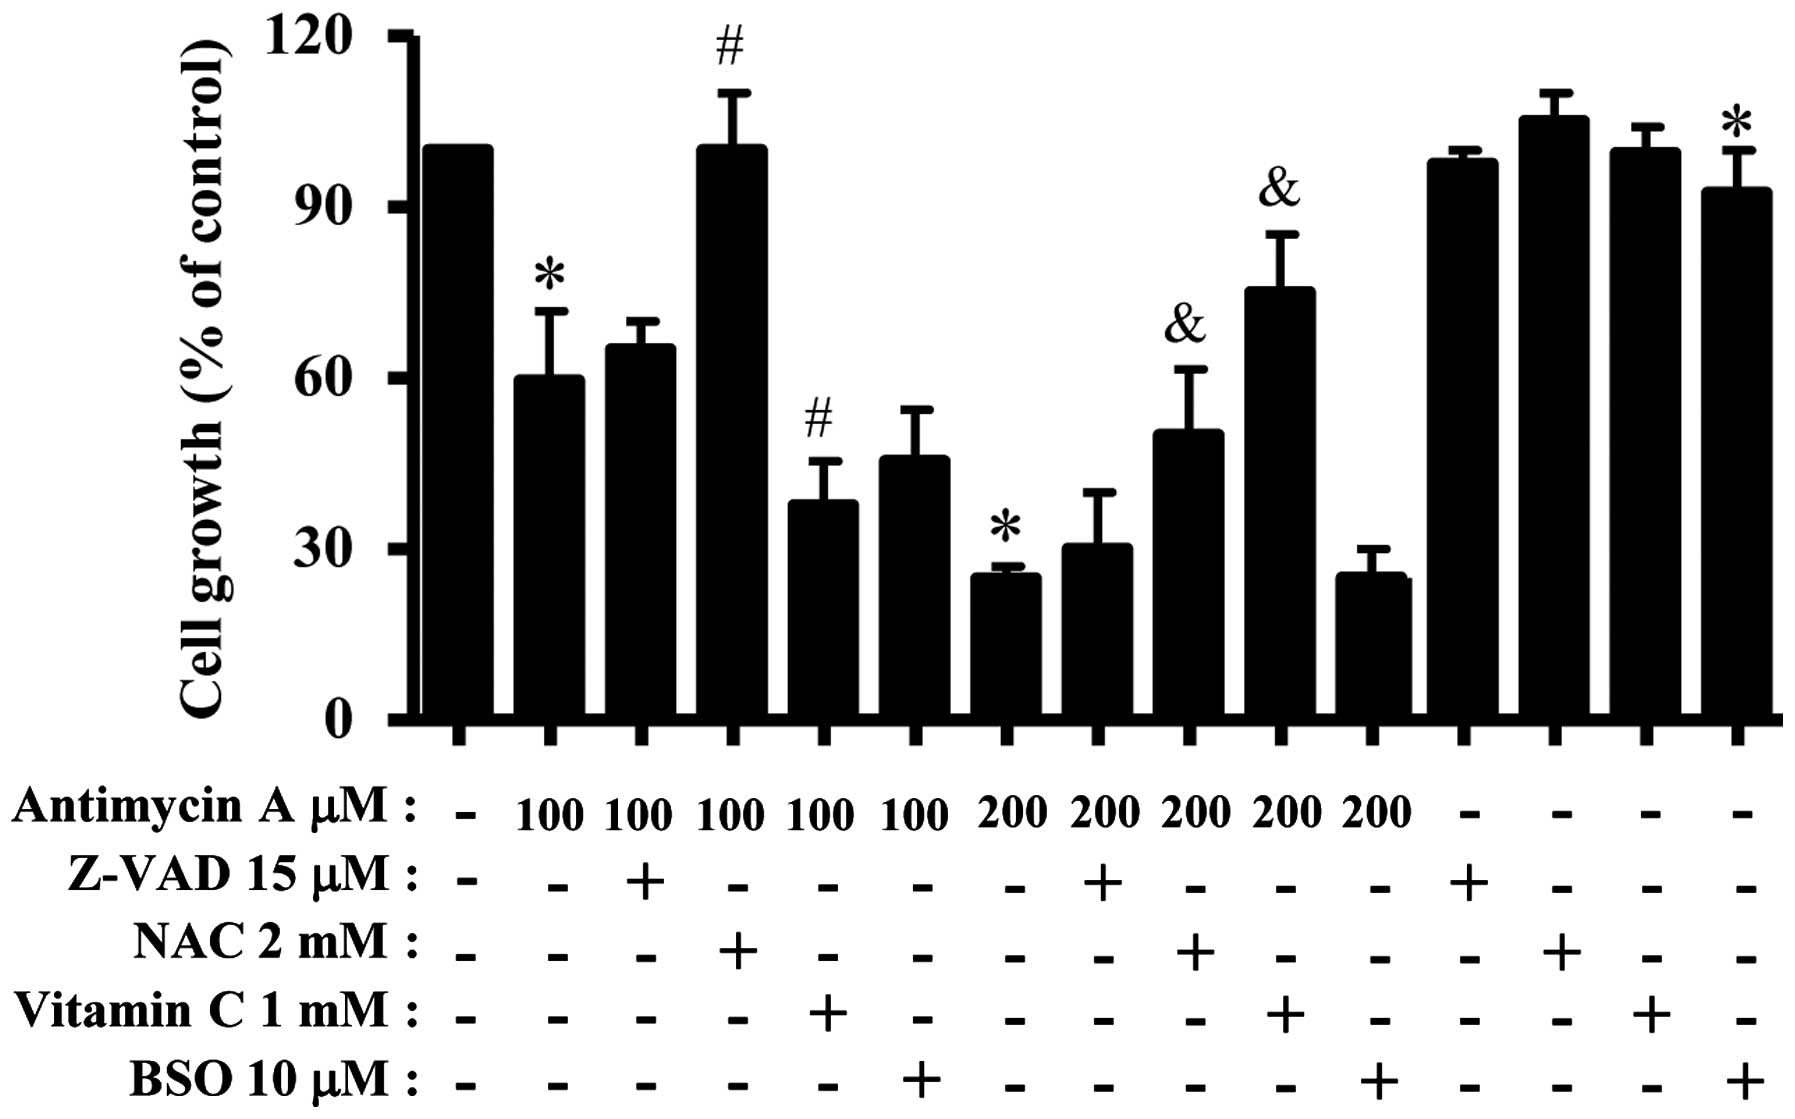
Effects of Z-VAD, NAC, vitamin C or BSO
on cell growth, cell death and MMP (ΔΨm) in AMA-treated
HPF cells
We examined the effect of Z-VAD, NAC, vitamin C and
BSO on the growth and death of AMA-treated HPF cells. For this
experiment, 100 or 200 μM AMA was used as a suitable dose to
differentiate the levels of cell growth inhibition and death.
Treatment with 15 μM Z-VAD slightly attenuated growth inhibition in
AMA-treated HPF cells (Fig. 4).
NAC strongly attenuated HPF cell growth inhibition by 100 or 200 μM
AMA (Fig. 4). Vitamin C
significantly enhanced cell growth inhibition in 100 μM AMA-treated
HPF cells but this agent strongly prevented that in 200 μM
AMA-treated HPF cells (Fig. 4).
BSO slightly increased HPF cell growth inhibition by 100 μM AMA but
it did not affect that in 200 μM AMA-treated HPF cells (Fig. 4). BSO alone slightly inhibited HPF
control cell growth (Fig. 4).
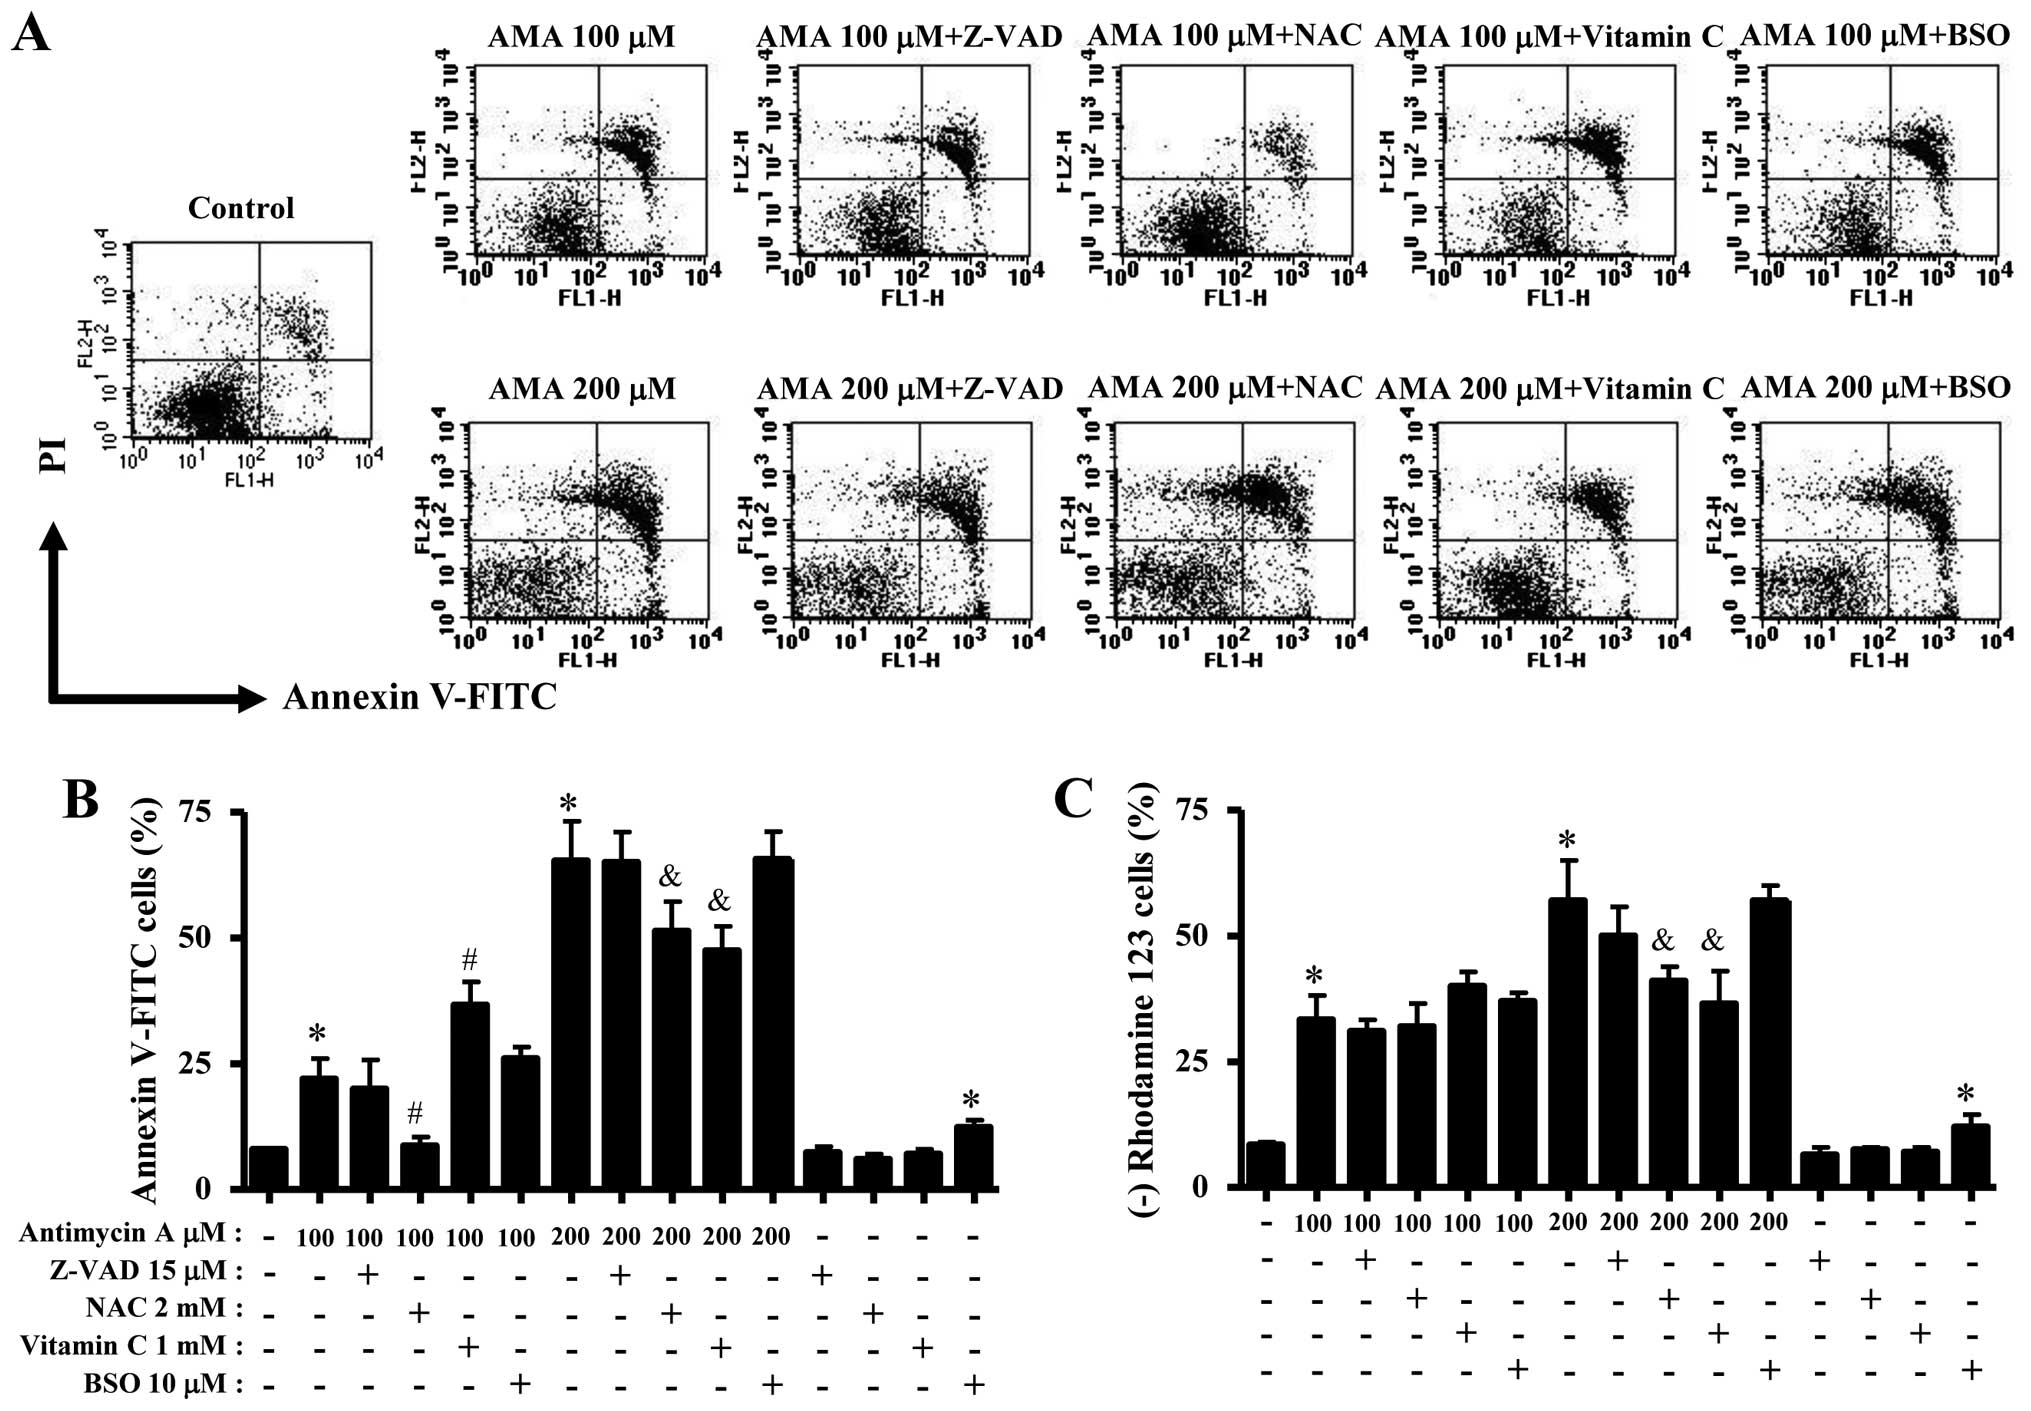
In relation to cell death and the loss of MMP
(ΔΨm), Z-VAD did not significantly influence HPF cell
death by 100 or 200 μM AMA (Fig. 5A
and B). NAC significantly attenuated apoptosis in 100 or 200 μM
AMA-treated HPF cells (Fig. 5A and
B). However, NAC did not increase the number of viable (Annexin
V-negative and PI-negative) cells in 200 μM AMA-treated HPF cells
but it increased that of necrotic (Annexin V-negative and
PI-positive) cells in these cells (Fig. 5A). While vitamin C enhanced
apoptosis in 100 μM AMA-treated HPF cells, this agent significantly
prevented that by 200 μM AMA (Fig. 5A
and B). BSO mildly enhanced HPF cell death by 100 μM AMA, but
not 200 μM AMA (Fig. 5A and B).
BSO alone induced HPF control cell death (Fig. 5B). Moreover, Z-VAD and NAC did not
change the loss of MMP (ΔΨm) in 100 μM AMA-treated HPF
cells whereas vitamin C and BSO seemed to increase the loss in
these cells (Fig. 5C). In 200 μM
AMA-treated HPF cells, Z-VAD, NAC and vitamin C decreased the loss
of MMP (ΔΨm) (Fig. 5C).
BSO did not affect the loss of MMP (ΔΨm) in these cells
and it alone induced the loss in HPF control cells (Fig. 5C).
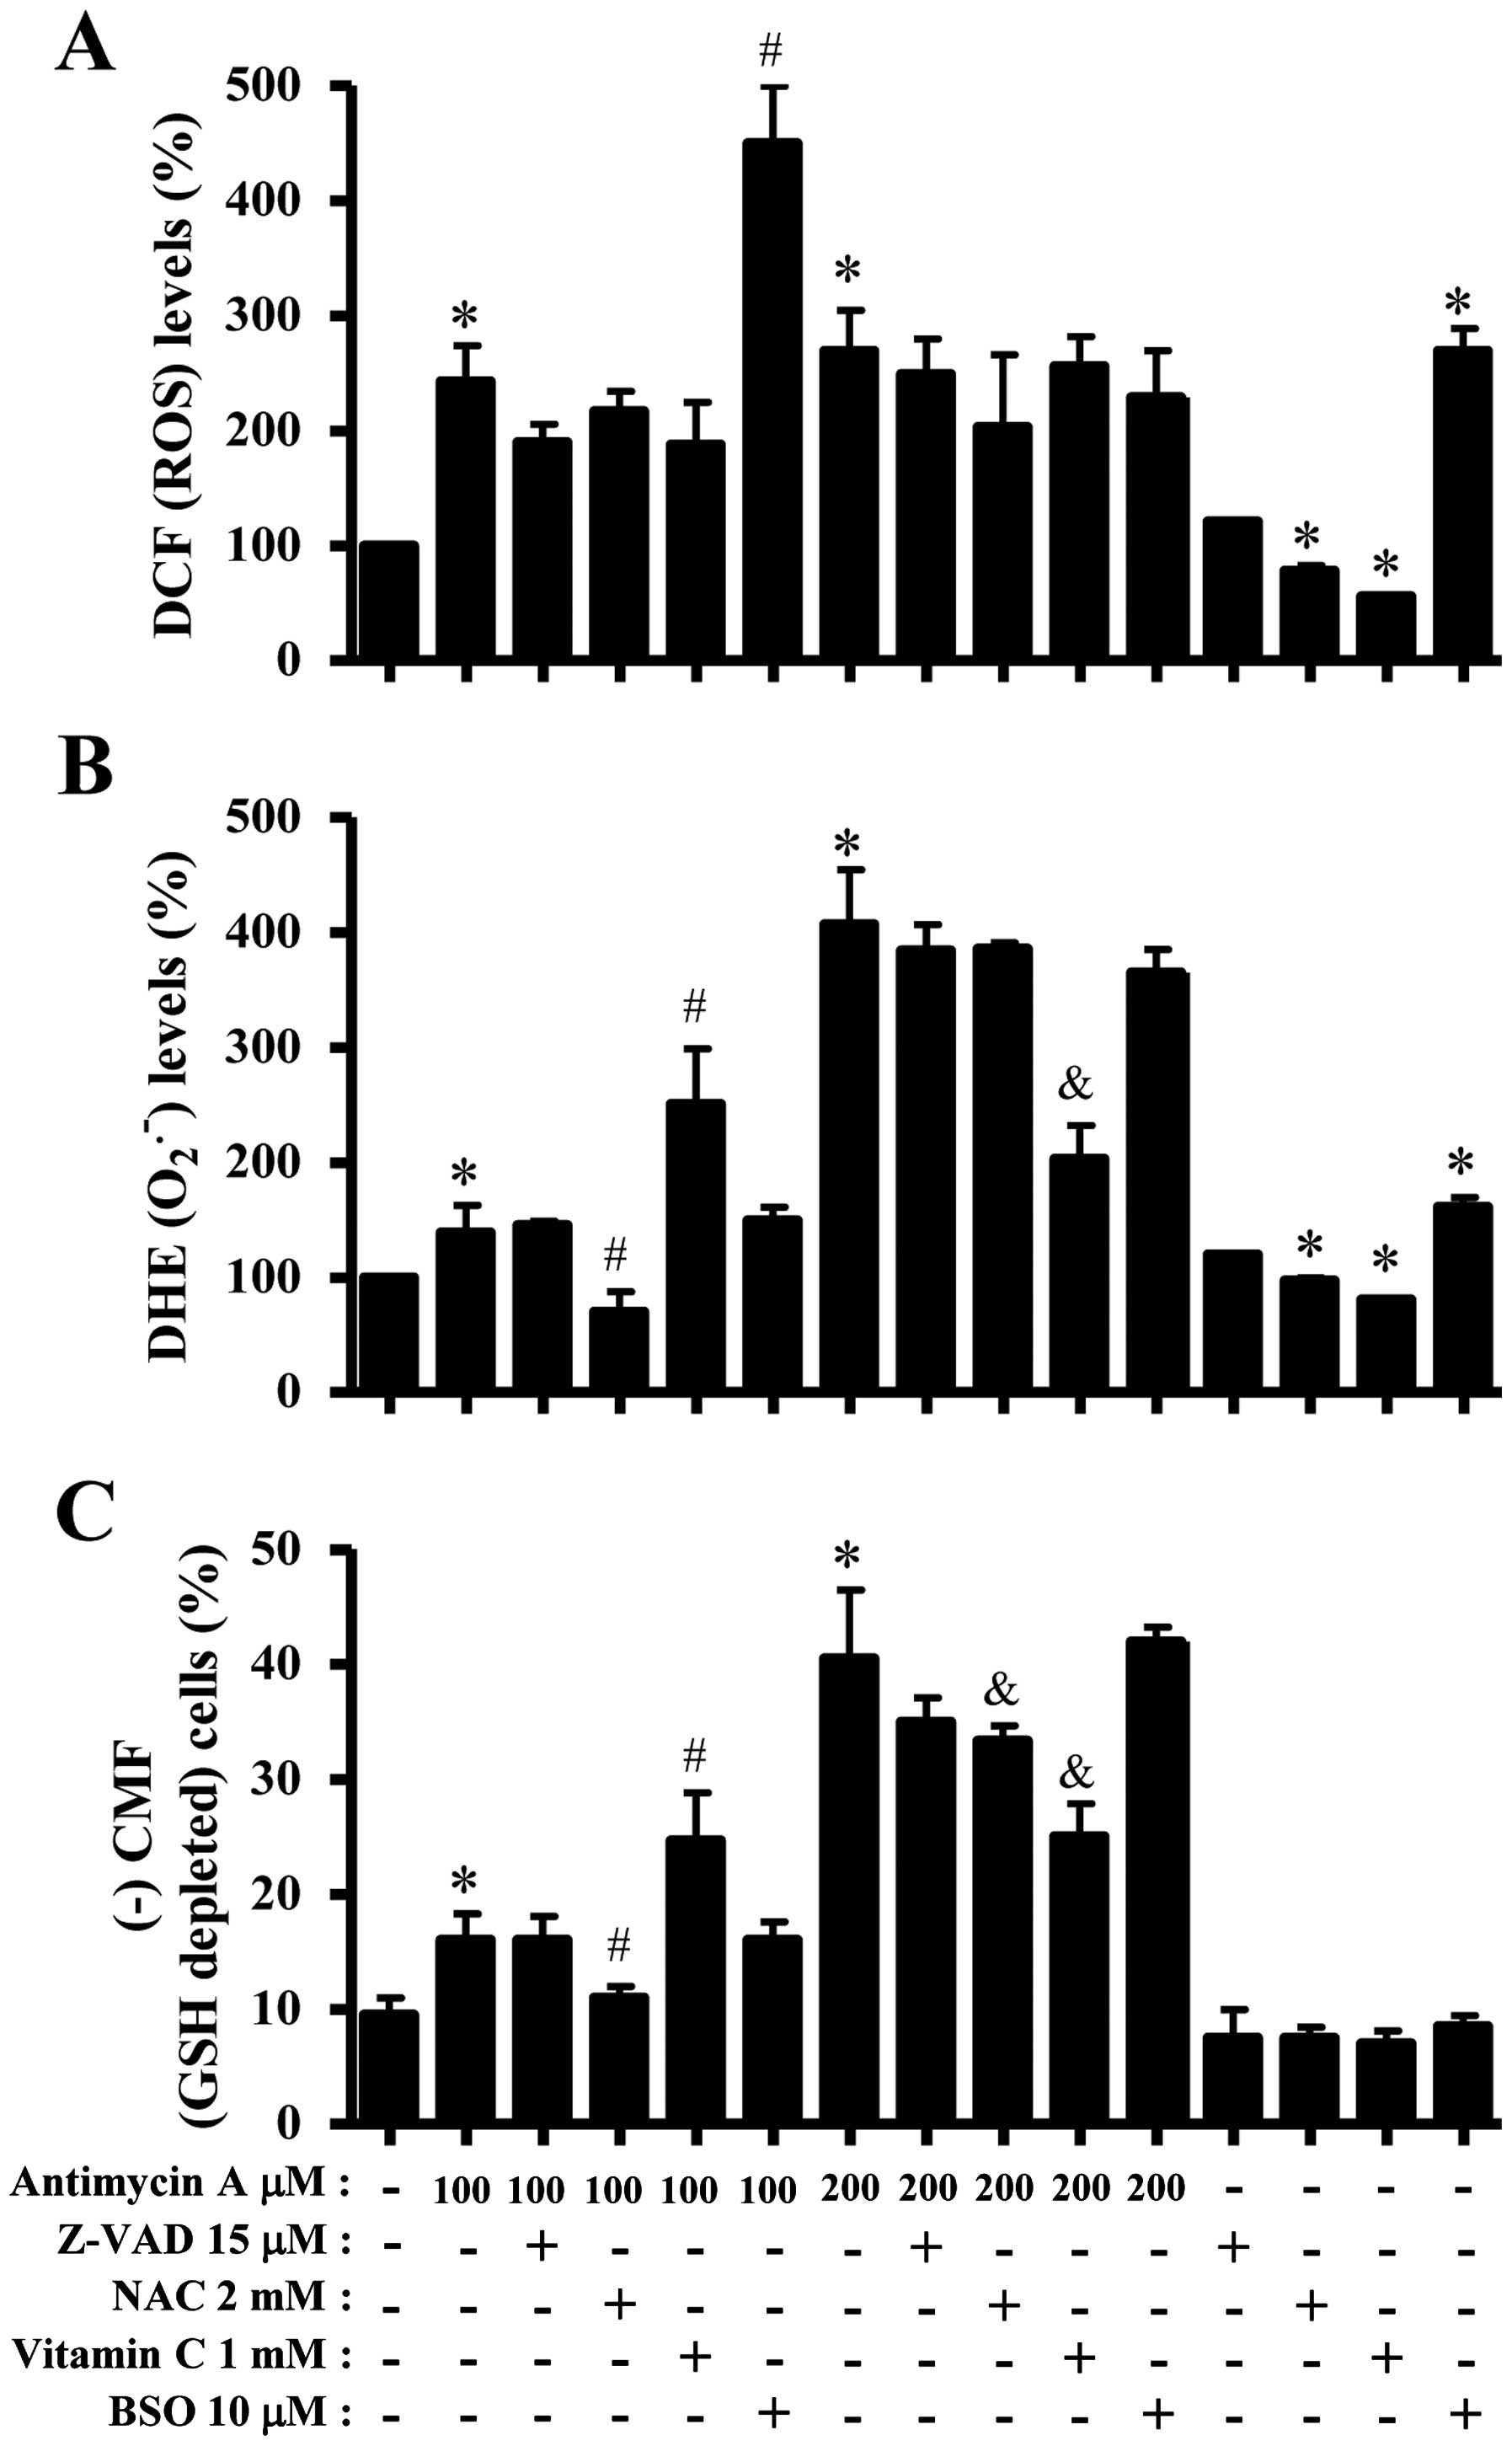
Effects of Z-VAD, NAC, vitamin C or BSO
on ROS and GSH levels in AMA-treated HPF cells
Next, ROS and GSH levels in 100 or 200 μM
AMA-treated HPF cells were assessed in the presence or absence of
Z-VAD, NAC, vitamin C or BSO. As shown in Fig. 6A, Z-VAD, NAC or vitamin C seemed to
decrease ROS (DCF) levels in 100 or 200 μM AMA-treated or
-untreated HPF cells. BSO strongly enhanced the levels in 100 μM
AMA-treated or -untreated HPF cells but it decreased those in 200
μM AMA-treated HPF cells (Fig.
6A). Z-VAD did not significantly affect
O2•− level in 100 μM AMA-treated HPF cells
whereas NAC strongly decreased O2•− level in
these cells (Fig. 6B). Vitamin C
increased O2•− level in 100 μM AMA-treated
HPF cells, but BSO did not change the level in these cells
(Fig. 6B). In 200 μM AMA-treated
HPF cells, Z-VAD, NAC, vitamin C and BSO decreased
O2•− levels and vitamin C-treated group had a
significant effect (Fig. 6B). NAC
and vitamin C reduced basal O2•− level in HPF
control cells whereas BSO increased the level (Fig. 6B). In relation to GSH levels, NAC
significantly decreased GSH depleted cell number in 100 μM
AMA-treated HPF cells whereas vitamin C increased the number in
these cells (Fig. 6C). Z-VAD and
BSO did not affect the cell number (Fig. 6C). In 200 μM AMA-treated HPF cells,
Z-VAD, NAC, vitamin C and BSO decrease GSH depleted cell number and
NAC or vitamin C-treated groups showed significant effects
(Fig. 6C).
Discussion
We demonstrated the molecular mechanism of AMA on
HPF cell growth inhibition and death in relation to ROS and GSH
levels. AMA dose-dependently decreased HPF cell growth with an
IC50 of ~150 μM. According to our previous reports
(16,17), the IC50s of AMA in A549
and Calu-6 lung cancer cells were ~2 and 100 μM at 24 h,
respectively. Therefore, HPF cells seemed to be more resistant to
AMA than the lung cancer cells of A549 and Calu-6. In addition,
calf normal pulmonary artery endothelial cells were more resistant
to AMA than Calu-6 cells (16).
Since the activity of mitochondria is associated with a
susceptibility to apoptosis (23),
the difference of susceptibility to AMA among various different
cancer and normal cell lines probably is due to the different basal
activities of antioxidant enzymes and mitochondria each cell
possesses. Furthermore, we observed that AMA altered the levels of
SOD2 and TXNR2, which are specifically expressed in mitochondria to
eliminate ROS.
Suppression of cell growth due to AMA can be
explained in part by its capacity to affect the arrest during the
cell cycle. For instances, 100 μM AMA inhibited HPF cell growth by
>40% whereas this concentration increased the percentage of
Annexin V staining cells by ≤10% as compared with the control
cells. Therefore, G1 phase arrest of the cell cycle in AMA-treated
HPF cells was considered as a pathway to suppress their growth.
Similarly, AMA induces a G1 phase arrest in A549 and Calu-6 cells
(16,17). On the other hand, AMA induces the S
phase arrest in HeLa cells (24)
and non-specifically induces the arrest in all the phases in As4.1
juxta-glomerular cells (25).
These results suggest that the inhibition of mitochondrial electron
transport by AMA can alter the cell cycle progression and the
specificity of cell cycle arrest depends on differences in cell
types. In addition, 2–100 μM AMA showing HPF cell growth inhibition
did not increase the portion of sub-G1 DNA content cells but these
doses increased The Annexin V staining cell number. These results
supported the notion that Annexin V staining cells are a marker to
detect early apoptotic cells ahead of observing the sub-G1
cells.
AMA induces the collapse of MMP (ΔΨm)
during apoptosis in various cells including cancer cells (11,12,15–17).
Likewise, AMA induced the loss of MMP (ΔΨm) in HPF cells
and decreased its level in the viable HPF cells. Particularly, the
percentage of MMP (ΔΨm) loss by 50 or 100 μM AMA was
higher than those of Annexin V-FITC-positive cells, implying that
AMA primarily damages the mitochondria function in HPF cells,
resulting in the loss of MMP (ΔΨm) and consequently
induction of apoptosis. The activation of caspase-3 and the
cleavage of PARP protein are known to be essential in AMA-induced
cell death (16). According to our
results, AMA increased caspase-3 activity and decreased PARP
protein in HPF cells. Z-VAD slightly attenuated growth inhibition
and MMP (ΔΨm) loss in 100 μM AMA-treated HPF cells.
However, Z-VAD did not prevent HPF cell death from AMA insult.
Therefore, caspase activation was not tightly related to
AMA-induced HPF apoptosis but its activation partially affected
cell growth and mitochondria. Our previous report demonstrated that
15 μM Z-VAD including other caspase inhibitors significantly
prevented apoptosis in AMA-treated Calu-6 cells (16). It is possible that the dose of 15
μM Z-VAD was not enough to prevent AMA-induced HPF cell death
because the mechanism of cell death can be different between cancer
and normal cells.
AMA can disturb the natural oxidation/reduction
equilibrium in various cells via causing a breakdown in MMP
(ΔΨm). AMA increases ROS levels in HeLa cells (11), endothelial cells (15), As4.1 juxtaglomerular cells
(25) and A549 cells (8,17).
Likewise, ROS levels (as determined by DCF) were dose-dependently
increased in AMA-treated HPF cells at 24 h and ROS levels were also
strongly increased at the earlier time-point of 25 min. In
addition, O2•− level (as determined by DHE)
was increased in AMA-treated HPF cells. Especially, 200 μM AMA
strongly augmented O2•− level in HPF cells as
compared with 100 μM AMA-treated cells. In addition, 200 μM AMA
transiently increased O2•− level at 25 min.
All the tested doses of AMA increased O2•−
levels at 180 min. The increased O2•− levels
in AMA-treated HPF cells probably resulted from the enhanced
production of O2•− itself rather than the
reduction of SOD activity because MMP (ΔΨm) loss was
dose-dependently observed in these cells and the expression of SOD1
and SOD2 were not downregulated by AMA. Moreover, it is likely that
200 μM AMA directly damaged mitochondria and increased the
generation of O2•− at 25 min, consequently
resulting in an increase in ROS (DCF) levels at the early time
phases of 25–180 min. TXN and TXNRs can stimulate cell
proliferation and confer resistance to anticancer drugs (26,27).
Our results showed that AMA downregulated TXN and TXNR2 levels.
Therefore, the downregulation of TXN and TXNR2 due to treatment
with AMA might make HPF cells more sensitive to this agent. In
addition, it seems that AMA altered the levels of SOD2 and TXNR2 in
the mitochondria of HPF cells since these antioxidant enzymes
specifically maintain the redox state in mitochondria.
NAC generally attenuated ROS levels in AMA-treated
or -untreated HPF cells. It also prevented cell growth inhibition,
apoptosis and MMP (ΔΨm) loss in 100 or 200 μM
AMA-treated HPF cells. Interestingly, NAC induced necrotic cell
death in 200 μM AMA-treated HPF cells. In addition, 5 mM NAC
strongly induced necrotic cell death in 200 μM AMA-treated HPF
cells, and it decreased ROS (DCF) levels, but strongly increased
O2•− level in these cells (data not shown).
Treatment with 2 or 5 mM NAC was likely to change cell death
pathway (switching apoptotic cell death to necrotic cell death) in
200 μM AMA-treated HPF cells via affecting different ROS levels
(DCF or DHE levels). In addition, the other antioxidant vitamin C
slightly attenuated ROS (DCF) level in 100 or 200 μM AMA-treated
HPF cells. Interestingly, vitamin C enhanced cell growth
inhibition, apoptosis and MMP (ΔΨm) loss in 100 μM
AMA-treated HPF cells and increased O2•−
level in these cells. However, vitamin C strongly attenuated
O2•− level in 200 μM AMA-treated HPF cells
and this agent reduced growth inhibition, apoptosis and MMP
(ΔΨm) loss in these cells. The change of
O2•− level rather than ROS (DCF) level due to
vitamin C seemed to be more closely related to AMA-induced HPF cell
death. These results implied that vitamin C can be an oxidant or an
antioxidant in HPF cells depending on the doses of AMA. Although
vitamin C possesses strong antioxidant properties, the mechanism
underlying these properties is still unclear in vivo and
in vitro (28,29). Z-VAD did not significantly change
ROS and cell death levels in AMA-treated HPF cells. BSO showing a
slight increase in HPF cell death by 100 μM AMA increased strongly
ROS (DCF) level, but this agent did not affect ROS level and cell
death in 200 μM AMA-treated HPF cells. Collectively, AMA-induced
HPF cell death is tightly correlated with the generation of ROS.
BSO alone induced cell death in HPF control cells which was
accompanied by the production ROS including
O2•−. Therefore, ROS increased by BSO might
be related to HPF cell death (30,31).
AMA increased the number of GSH-depleted cells in
HPF cells. As expected, NAC showing an anti-apoptotic effect on
AMA-treated HPF cells significantly prevented GSH depletion in
these cells. In addition, vitamin C augmented GSH depletion in 100
μM AMA-treated HPF cells and this agent attenuated the depletion
induced by treatment with 200 μM AMA. BSO showing non-effects on
AMA-induced HPF cell death did not change GSH depleted cell number
in these cells. These results suggest that the intracellular GSH
content has a decisive role on AMA-induced HPF cell death. It is of
note that BSO did not significantly affect GSH contents in
AMA-treated or -untreated HPF cells. However, our previous reports
demonstrate that BSO enhanced GSH depletion as well as cell death
in AMA-treated Calu-6 cells (32)
and gallic acid-treated HPF cells (33). These data imply that BSO
differently influences GSH content levels depending on cell types.
The decreased GSH levels in AMA-treated HPF cells at the early time
phases (25–90 min) probably resulted from its consumption against
increased ROS levels by AMA. On the whole, GSH and ROS levels were
inversely related in AMA-treated HPF cells, implying that GSH and
ROS in these cells influence each other in the early
time-points.
In conclusion, AMA inhibited the growth of HPF cells
via apoptosis as well as a G1 phase arrest of the cell cycle.
AMA-induced HPF cell death was related to increases in ROS level
and GSH depletion. Our current results provide practical
information to appreciate the cellular effect of AMA on normal lung
cells in relation to ROS and GSH.
Acknowledgements
This study was supported by a grant from the
National Research Foundation of Korea (NRF) funded by the Korean
government (MSIP; no. 2008 0062279) and supported by the Basic
Science Research Program through the NRF funded by the Ministry of
Education (no. 2013006279).
Abbreviations:
|
HPF
|
human pulmonary fibroblast
|
|
AMA
|
anti-mycin A
|
|
ROS
|
reactive oxygen species
|
|
MMP (ΔΨm)
|
mitochondrial membrane potential
|
|
SOD
|
superoxide dismutase
|
|
CAT
|
catalase
|
|
GSH
|
glutathione
|
|
GPX
|
GSH peroxidase
|
|
TXN
|
thioredoxin
|
|
TXNR
|
TXN reductase
|
|
H2DCFDA
|
2′,7′-dichlorodihydrofluorescein
diacetate
|
|
DHE
|
dihydroethidium
|
|
CMFDA
|
5-chloromethylfluorescein
diacetate
|
|
NAC
|
N-acetylcysteine
|
|
BSO
|
L-buthionine sulfoximine
|
References
|
1
|
Zorov DB, Juhaszova M and Sollott SJ:
Mitochondrial ROS-induced ROS release: An update and review.
Biochim Biophys Acta. 1757:509–517. 2006. View Article : Google Scholar : PubMed/NCBI
|
|
2
|
Zelko IN, Mariani TJ and Folz RJ:
Superoxide dismutase multigene family: A comparison of the CuZn-SOD
(SOD1), Mn-SOD (SOD2), and EC-SOD (SOD3) gene structures,
evolution, and expression. Free Radic Biol Med. 33:337–349. 2002.
View Article : Google Scholar : PubMed/NCBI
|
|
3
|
Wilcox CS: Reactive oxygen species: Roles
in blood pressure and kidney function. Curr Hypertens Rep.
4:160–166. 2002. View Article : Google Scholar : PubMed/NCBI
|
|
4
|
Marks PA: Thioredoxin in cancer - role of
histone deacetylase inhibitors. Semin Cancer Biol. 16:436–443.
2006. View Article : Google Scholar : PubMed/NCBI
|
|
5
|
Alexandre A and Lehninger AL: Bypasses of
the antimycin a block of mitochondrial electron transport in
relation to ubisemiquinone function. Biochim Biophys Acta.
767:120–129. 1984. View Article : Google Scholar : PubMed/NCBI
|
|
6
|
Campo ML, Kinnally KW and Tedeschi H: The
effect of antimycin A on mouse liver inner mitochondrial membrane
channel activity. J Biol Chem. 267:8123–8127. 1992.PubMed/NCBI
|
|
7
|
Balaban RS, Nemoto S and Finkel T:
Mitochondria, oxidants, and aging. Cell. 120:483–495. 2005.
View Article : Google Scholar : PubMed/NCBI
|
|
8
|
Panduri V, Weitzman SA, Chandel NS and
Kamp DW: Mitochondrial-derived free radicals mediate
asbestos-induced alveolar epithelial cell apoptosis. Am J Physiol
Lung Cell Mol Physiol. 286:L1220–L1227. 2004. View Article : Google Scholar : PubMed/NCBI
|
|
9
|
Petronilli V, Penzo D, Scorrano L,
Bernardi P and Di Lisa F: The mitochondrial permeability
transition, release of cytochrome c and cell death. Correlation
with the duration of pore openings in situ. J Biol Chem.
276:12030–12034. 2001. View Article : Google Scholar : PubMed/NCBI
|
|
10
|
Pastorino JG, Tafani M, Rothman RJ,
Marcinkeviciute A, Hoek JB and Farber JL: Functional consequences
of the sustained or transient activation by Bax of the
mitochondrial permeability transition pore. J Biol Chem.
274:31734–31739. 1999. View Article : Google Scholar : PubMed/NCBI
|
|
11
|
Park WH, Han YW, Kim SH and Kim SZ: An ROS
generator, antimycin A, inhibits the growth of HeLa cells via
apoptosis. J Cell Biochem. 102:98–109. 2007. View Article : Google Scholar : PubMed/NCBI
|
|
12
|
Park WH, Han YW, Kim SW, Kim SH, Cho KW
and Kim SZ: Antimycin A induces apoptosis in As4.1 juxtaglomerular
cells. Cancer Lett. 251:68–77. 2007. View Article : Google Scholar
|
|
13
|
King MA: Antimycin A-induced killing of
HL-60 cells: Apoptosis initiated from within mitochondria does not
necessarily proceed via caspase 9. Cytometry A. 63:69–76. 2005.
View Article : Google Scholar : PubMed/NCBI
|
|
14
|
Guha G, Mandal T, Rajkumar V and Ashok
Kumar R: Antimycin A-induced mitochondrial apoptotic cascade is
mitigated by phenolic constituents of Phyllanthus amarus aqueous
extract in Hep3B cells. Food Chem Toxicol. 48:3449–3457. 2010.
View Article : Google Scholar : PubMed/NCBI
|
|
15
|
You BR and Park WH: The effects of
antimycin A on endothelial cells in cell death, reactive oxygen
species and GSH levels. Toxicol In Vitro. 24:1111–1118. 2010.
View Article : Google Scholar : PubMed/NCBI
|
|
16
|
Han YH and Park WH: Growth inhibition in
antimycin A treated-lung cancer Calu-6 cells via inducing a G1
phase arrest and apoptosis. Lung Cancer. 65:150–160. 2009.
View Article : Google Scholar
|
|
17
|
Han YH, Kim SH, Kim SZ and Park WH:
Antimycin A as a mitochondrial electron transport inhibitor
prevents the growth of human lung cancer A549 cells. Oncol Rep.
20:689–693. 2008.PubMed/NCBI
|
|
18
|
Han YH and Park WH: Tiron, a ROS
scavenger, protects human lung cancer Calu-6 cells against
antimycin A-induced cell death. Oncol Rep. 21:253–261. 2009.
|
|
19
|
Han YH, Kim SZ, Kim SH and Park WH:
Pyrogallol inhibits the growth of lung cancer Calu-6 cells via
caspase-dependent apoptosis. Chem Biol Interact. 177:107–114. 2009.
View Article : Google Scholar
|
|
20
|
You BR and Park WH: Gallic acid-induced
lung cancer cell death is related to glutathione depletion as well
as reactive oxygen species increase. Toxicol In Vitro.
24:1356–1362. 2010. View Article : Google Scholar : PubMed/NCBI
|
|
21
|
You BR, Kim SH and Park WH: Reactive
oxygen species, glutathione, and thioredoxin influence suberoyl
bishydroxamic acid-induced apoptosis in A549 lung cancer cells.
Tumour Biol. 36:3429–3439. 2015. View Article : Google Scholar
|
|
22
|
You BR, Shin HR, Han BR and Park WH: PX-12
induces apoptosis in Calu-6 cells in an oxidative stress-dependent
manner. Tumour Biol. 36:2087–2095. 2015. View Article : Google Scholar
|
|
23
|
Jia L, Allen PD, Macey MG, Grahn MF,
Newland AC and Kelsey SM: Mitochondrial electron transport chain
activity, but not ATP synthesis, is required for drug-induced
apoptosis in human leukaemic cells: A possible novel mechanism of
regulating drug resistance. Br J Haematol. 98:686–698. 1997.
View Article : Google Scholar : PubMed/NCBI
|
|
24
|
Han YH, Kim SH, Kim SZ and Park WH:
Antimycin A as a mitochondria damage agent induces an S phase
arrest of the cell cycle in HeLa cells. Life Sci. 83:346–355. 2008.
View Article : Google Scholar : PubMed/NCBI
|
|
25
|
Han YW, Kim SZ, Kim SH and Park WH: The
changes of intra-cellular H2O2 are an
important factor maintaining mitochondria membrane potential of
antimycin A-treated As4.1 juxtaglomerular cells. Biochem Pharmacol.
73:863–872. 2007. View Article : Google Scholar
|
|
26
|
Gallegos A, Gasdaska JR, Taylor CW,
Paine-Murrieta GD, Goodman D, Gasdaska PY, Berggren M, Briehl MM
and Powis G: Transfection with human thioredoxin increases cell
proliferation and a dominant-negative mutant thioredoxin reverses
the transformed phenotype of human breast cancer cells. Cancer Res.
56:5765–5770. 1996.PubMed/NCBI
|
|
27
|
Kim SJ, Miyoshi Y, Taguchi T, Tamaki Y,
Nakamura H, Yodoi J, Kato K and Noguchi S: High thioredoxin
expression is associated with resistance to docetaxel in primary
breast cancer. Clin Cancer Res. 11:8425–8430. 2005. View Article : Google Scholar : PubMed/NCBI
|
|
28
|
Poljsak B and Raspor P: The antioxidant
and pro-oxidant activity of vitamin C and trolox in vitro: A
comparative study. J Appl Toxicol. 28:183–188. 2008. View Article : Google Scholar
|
|
29
|
Halliwell B: Vitamin C: Antioxidant or
pro-oxidant in vivo? Free Radic Res. 25:439–454. 1996. View Article : Google Scholar : PubMed/NCBI
|
|
30
|
Estrela JM, Ortega A and Obrador E:
Glutathione in cancer biology and therapy. Crit Rev Clin Lab Sci.
43:143–181. 2006. View Article : Google Scholar : PubMed/NCBI
|
|
31
|
Higuchi Y: Glutathione depletion-induced
chromosomal DNA fragmentation associated with apoptosis and
necrosis. J Cell Mol Med. 8:455–464. 2004. View Article : Google Scholar : PubMed/NCBI
|
|
32
|
Han YH and Park WH: The effects of
N-acetyl cysteine, buthionine sulfoximine, diethyldithiocarbamate
or 3-amino-1,2,4-triazole on antimycin A-treated Calu-6 lung cells
in relation to cell growth, reactive oxygen species and
glutathione. Oncol Rep. 22:385–391. 2009.PubMed/NCBI
|
|
33
|
Park WH and You BR: Enhancement of gallic
acid-induced human pulmonary fibroblast cell death by N-acetyl
cysteine and L-buthionine sulfoximine. Hum Exp Toxicol. 30:992–999.
2011. View Article : Google Scholar
|