Introduction
Hepatocellular carcinoma (HCC) is the most common
primary liver cancer (85–90%). Age-adjusted HCC incidence rates
have doubled over the past two decades. It is estimated that
8,000–11,000 new cases of HCC occur annually in the United States
and this number is increasing every year. HCC is responsible for
half million deaths annually (7.9% of all cancers) and is the third
leading cause of cancer-related mortality worldwide (1–3).
Currently, the effective treatments of HCC are liver
transplantation (LTX), surgical resection or loco regional ablative
therapy (4–6). While surgical treatments also remove
some of the cirrhotic tissue surrounding the tumor, the other
ablative therapies focus on the destruction of cancerous tissue
alone. The current clinical practice requires obtaining at least 1
cm margin from peri-neoplastic cirrhotic tissue to avoid missing
tumor cells or satellite micro-foci in order to obtain a radical
oncologic extirpation. Despite the 5-year disease-free survival
rates of ~70%, up to 78% of local recurrence rate has been reported
(5,6).
Overall, the prognosis for the majority of patients
with HCC remains poor due to the limited number of patients that
are candidates for surgical intervention or LTX. Poor prognosis is
also associated to a high level of tumor invasiveness, frequent
intra-hepatic spread, extra hepatic metastasis, and resistance to
chemotherapy (2,3). The 1- and 3-year ‘intention-to-treat’
survival rates are 85 and 62%, for resection, and 84 and 69% for
LTX, respectively (5). However,
for loco-regional therapy with ablation, the corresponding
recurrence-free survival rates reported are 68.7 and 59.2%,
respectively (7). These variations
could be secondary to removal vs. ablation of neoplastic tissue and
consequent different micro-environment modifications of the
residual liver tissue. Alternatively, this could result from the
removal of larger portions or the entire peri-neoplastic cirrhotic
tissue potentially more prone to future cancer modification.
At the present time, no scientific data exist on the
characteristics of the liver tissue surrounding HCC lesions. In the
current clinical practice, the resection margin is evaluated with
standard histology to rule out the presence of neoplastic cells.
However, liver cells adjacent to the neoplastic lesion could be in
a pre-cancerous state even if morphologically non-neoplastic and
could be dispersed for an unidentified distance.
Since the recurrence of HCC occurs typically in the
area of resection or peri-ablative area, we hypothesize that, in
the cirrhotic liver, HCC develops in a specific location where
there are optimal micro-environmental conditions. To test this
hypothesis, we studied liver samples from seven patients with
cirrhosis secondary to viral hepatitis and undergoing liver
resection for HCC. Namely, samples were obtained from: HCC lesions
and from locations proximal (1–3 cm) and distal (>5 cm or
contra-lateral lobe) to the margin of the HCC lesion. From these
samples, cell outgrowths were obtained and primary cultures were
developed and followed for 16 weeks to evaluate morphological and
phenotypic characteristics.
Most data available from the literature describe
characteristics of HCC cells obtained from immortalized cell lines
and do not offer insights on the dynamic evolution of HCC primary
cell cultures (8). To the best of
our knowledge, no studies are available at this time describing the
characteristics and temporal dynamic transformation in HCC of
non-neoplastic hepatocytes obtained from cirrhotic livers at
incremental distance from tumor lesions.
Materials and methods
Patients and sample collection
Patients were enrolled following Institutional
Review Board approval and informed consent in accordance with the
UTMB institutional policies. Samples were obtained from patients
with liver cirrhosis and HCC undergoing liver resection.
Characteristics of the patients recruited are summarized in
Table I. Liver samples were also
obtained from three patients without cirrhosis or HCC and used as
normal liver (NL) control. Fresh tissue samples were obtained at
the time of surgery, immediately placed in cold (4°C) sterile
saline solution and transported to the cell isolation laboratory.
Histopathological evaluation of the tissue samples was performed
using standard hematoxylin and eosin (H&E) staining. Sections
were examined by a pathologist to confirm diagnosis of HCC and to
rule out neoplastic contamination in cirrhotic liver samples
utilized as cirrhotic proximal (CP) and cirrhotic distal (CD) for
the present study. Additional samples from HCC, NL and cirrhotic
liver tissues (CP and CD) were individually placed in RNAlater
Stabilization reagent (Qiagen) and immediately cryopreserved at
−160°C.
 | Table IDemographic and pathological
characteristics of HCC patients (N=7). |
Table I
Demographic and pathological
characteristics of HCC patients (N=7).
|
Characteristics | Data |
|---|
| Mean age (year
range) | 57 (48–68) |
| Gender |
| Male | 6 |
| Female | 1 |
| Ethnicity |
| Black | 2 |
| Hispanic | 3 |
|
Caucasian/White | 2 |
| HCV positivity | 7 |
| Mean tumor size
(range in cm) | 1.55 (1–2.5) |
Immunohistochemistry analysis
Specimens were fixed in 10% neutral formalin and
embedded in paraffin. Tissue sections were cut at 3–5 μm and
mounted on positively charged slides. Sections were treated with
antigen retrieval to facilitate antibody binding to antigen and
incubated in the Black and Decker vegetable steamer for 20 min in
target retrieval solution (Dako Corp., Carpinteria, CA, USA; cat.
#S1699) preheated to 99°C. When removed and cooled down, the slides
were then rinsed three times with distilled water and placed into a
container of Tris-buffered saline with Tween-20 (Signet Pathology
Systems, Inc., Dedham, MA, USA; cat. #2380). Both avidin and biotin
(blocking kit; Vector Laboratories Inc., Burlingame, CA, USA; cat.
#SP2001) were diluted in Antibody Diluent (Dako) at a ratio of 1 ml
avidin or biotin to 5 ml diluent. Diluted avidin was applied to
sections and incubated for 7 min. The primary antibody was diluted
to specific concentrations in the biotin solution and applied for
the specific amount of time recommended by the company. Sections
were then incubated in LSAB2, universal secondary antibody (Dako)
for 15 min, followed by Chromagen liquid DAB (Dako) application for
5 min. Slides were taken off the Autostainer and rinsed in
distilled water, manually counter-stained with Harris's
haematoxylin (Thermo Fisher Scientific) for 1 min, rinsed in
distilled water followed by 0.25% ammonia water and rinsed in
distilled water again. Following dehydration through graded series
of alcohols, they were cleared in four changes of xylene and
coverslipped with cover glass. Glypican-3 (GPC3), Heppar1 and
Arginase1 were analyzed by immunohistochemistry (9,10).
The antibodies and concentrations used were GPC3 (1:400; Abcam
Inc., Cambridge, MA, USA; #ab129381), Heppar1 (1:50; Dako Clone
OCH1E5 #M7158) and Arginase1 (1:400; Abcam; #ab117989) for HCC
cells detection.
Isolation and in vitro culture of primary
HCC, CP, CD and NL cells
Tissue specimens obtained as described above, were
washed in PBS and processed within 2 h from surgical resection.
Samples were washed with physiologic solution, minced with fine
sterile scissors and scalpel into fragments of ~1 mm3.
Cells were immediately isolated from the HCC lesion, and from
cirrhotic tissue proximal (CP, 1–3 cm) and distal (CD, >5 cm or
contra-lateral lobe) to the HCC. The cell isolation procedure was
performed with modifications from methods described by Tomuleasa
et al (11). Briefly, the 1
mm3 fragments of tissue were incubated for 3 h with
fetal bovine serum (FBS) HyClone (Thermo Fisher Scientific). FBS
was then replaced by complete RPMI-1640 medium with 10% FBS, 1% of
antibiotics (Corning-Cellgro, Manassas, VA, USA) and amino acids
[Sigma-Aldrich; MEM Non-essential amino acid solution (x100)
#M7145] and incubated for 24 h. Every 48 h cells were then washed
with 2 ml of RPMI-1640 complete medium. After 3 weeks a monolayer
of primary cells around the explants was observed. Cells were
detached using 1X trypsin/EDTA (Corning-Cellgro), re-plated and
maintained in culture at 37°C and 5% CO2.
CP and CD hepatocytes growth
Hepatocytes isolated from CP and CD tissue (CP-Hep
and CD-Hep) were incubated from time zero to sixteen weeks and
their growth was compared. To conduct this experiment, four series
of multiwells (I, II, III and IV), each containing 2×10⁵
cells of either CP-Hep or CD-Hep, were prepared (time zero), with
each series performed in triplicate. Samples were incubated in the
culture conditions previously described for up to sixteen weeks.
Starting from week ten, cells from the four series of the two cell
types were detached at 2 weeks intervals with 1X Trypsin EDTA and
counted. Namely, for each cell type, the series corresponded to: I,
from time zero to week ten; II, from time zero to week twelve; III,
from time zero to week fourteen and IV, from time zero to week
sixteen. The number of cells obtained for each time-point was
employed to produce a graph describing the growth of CP-Hep and
CD-Hep, as reported in the results. Moreover, when at the indicated
time-points, cells were detached and counted. Aliquots of
2×10⁵ cells from each series were reseeded in new
multiwells, cultured in RPMI-1640 10% FBS for the following 2 weeks
and then detached and counted. Results obtained were used to
produce a histogram describing the growth rate of CP-Hep and CD-Hep
from the tenth to the sixteenth week.
Immunofluorescence staining
Cells were fixed with 3.7% formaldehyde
(Sigma-Aldrich) for 10 min at room temperature (RT) and
permeabilized with 0.1% Triton X-100 (Sigma-Aldrich) in PBS for 5
min. Cells were then rinsed and covered with PBS blocking buffer
(1% BSA in PBS) for 30 min at 37°C to minimize non-specific
adsorption of the antibodies to the coverslips. After washing with
PBS, cells were incubated with the primary antibodies (anti-GPC3
and anti-α-SMA; Abcam; diluted in PBS + 1% BSA + 0.05%
NaN3) at 4°C, overnight. Preparations were washed three
time with PBS and incubated for 1 h at room temperature with
secondary antibodies, either Alexa Fluor 488 (Abcam; #150113) or
Alexa Fluor 596 (Abcam; #150080) diluted 1:1,000 in 1% BSA + 0.05%
NaN3. Nuclei were counter-stained with 2.5 μg/ml Hoechst
33342 (Life Technologies NucBlue® Live
ReadyProbes® reagent; Life Technologies, Grand Island,
NY, USA; 14072, #37605) for 15–20 min. Following three washes with
PBS, cells were examined on Olympus BX51 optic microscope equipped
with fluorescence and suitable filters for Alexa Fluor 488, Alexa
Fluor 596 and DAPI detection; images were captured and photographed
using a computer-imaging system (PictureFrame™). Primary antibodies
used for immunofluorescence staining included: Albumin [1:500;
Santa Cruz Biotechnology, Santa Cruz, CA, USA; (F-10) sc-271605],
cytokeratin 18 (CK18, 1:100; Abcam; ab9217), Heppar1 (1:100; Dako;
M7158), CD68 (1:500; Santa Cruz Biotechnology; sc-393951), CD31
(1:500; Santa Cruz Biotechnology; sc-376764) and β-catenin (1:250;
Abcam; ab32572).
Red-oil staining
Red-oil stain was used to identify quiescent hepatic
stellate cells (HSCs) (26). Cells
were plated in 35-mm wells. After 48 h, culture medium was removed
and cells were washed with 2 ml of PBS. Pelleted cells were fixed
in 2 ml of 10% formalin and incubated at RT for 1 h. Formalin was
removed and cells were washed with 2 ml of ddH2O twice
and incubated in 2 ml of 60% isopropanol for 5 min at RT. Cells
were let dry completely at RT and 1 ml of undiluted Red-oil working
solution was added followed by incubation at RT for 10 min. Red-oil
solution was removed and the sample was washed with
ddH2O. Images were acquired using optic microscopy.
Protein extraction and western blot
analysis
Western blotting was performed on whole cell lysates
to detect GPC3, CD44, CD44v6, α-SMA, PCNA and cyclin D1 (CycD1)
expression. Cells were cultured and harvested before confluence.
Cells (1×10⁷) were lysed using a modified RIPA buffer
[150 mM NaCl, 25 mM Tris (pH 7.4), 1 mM EDTA, 1 mM EGTA, 2 mM
Na3VO4, 10 mM NaF, 1% NP40, 10% glycerol,
aprotinin (10 mg/ml) and leupeptin (10 mg/ml)]. Supernatant was
collected and quantified by a BCA protein assay (Pierce, Rockford,
IL, USA). Equal amounts of proteins were separated by SDS-PAGE and
transferred to nitrocellulose membrane (LI-COR Biosciences;
#926-31090), which was blocked using 5% non-fat dry milk in
Tris-buffered saline with Tween-20 (Blocking buffer; LI-COR
Biosciences, Lincoln, NE, USA; #927-40040). The membrane was
incubated overnight at 4°C with the primary antibodies listed
above. After incubation, the membrane was washed 3 times with PBST
and then rinsed and incubated for 1 h at RT in appropriate
anti-mouse or anti-rabbit IRDye 680–800 secondary antibodies
(LI-COR Biosciences). The membrane was rinsed, developed with
Odyssey Imaging Systems LI-COR and specific protein bands were
detected with Image Studio software (version 4.0.21; Li-COR
Biosciences). Actin and GAPDH served as loading controls.
Flow cytometric analysis
CP-Hep and CD-Hep from the fourth and the sixteenth
week of incubation were detached using Accutase
(StemPro® Accutase® Cell Dissociation
reagent; Life Technologies; #A11105-01) in PBS, counted and washed
in PBS at 4°C. At least 5×10⁵ cells (in 500 μl PBS) were
incubated with primary monoclonal antibodies (4°C for 30 min in the
dark). The primary antibodies used were: mouse anti-human GPC3 9C2
non-conjugated (1/200; Abcam), rabbit anti-human CD44-EPR1013Y
non-conjugated (1/30; Abcam). Following subsequent washing in PBS
for indirect labelling, cells were incubated with a compatible
secondary antibody (Alexa Fluor 488 or 594; 1:2,000; Abcam). After
PBS wash, the labelled cells were analyzed by flow cytometer using
BD LSRFortessa cell analyzer (BD Biosciences) and BD FACSDiva
software. At least of 5×10⁵ cells/sample were analyzed,
and data were stored in list mode file. The expression of cell
markers was determined by comparison with control cells labeled
only with secondary antibodies.
Transwell migration/invasion assay
The Transwell 24-well filters (Corning-Cellgro) with
8.0 μm pores were used for the migration or invasion assay
according to the manufacturer's protocol. Briefly, Transwell
membranes were coated with 80 μl of ECM (Sigma-Aldrich) at a final
concentration of 0.1 mg/ml and dried. Cells (5×10⁴) were
placed in 100 μl with serum-free RPMI-1640 medium
(Corning-Cellgro), added to the upper chamber triplicate wells and
allowed to migrate through ECM overnight at 37°C with 5%
CO2 in a humidified incubator. The lower compartment of
the Transwell chamber was filled with 600 μl of RPMI-1640
containing 10% of FBS. After incubation for 24 h the medium was
changed in both upper and lower compartments and at 48, 72 and 96 h
cells were removed from the upper surface of the filter using a
cotton swab. Cells were fixed with 95% ethanol and stained using
Giemsa (1:50 for 15 min at RT). The migrated cells present on the
lower surface of the filter were analyzed, photographed with an
optic microscope (Nikon Eclipse TS100) and counted. The experiment
was repeated three times per sample.
Organoids generation and culture
CP and CD tissues were washed three times with PBS.
Using sterile scalpel samples were dissociated into
1-mm3 fragments and suspended in 0.5 ml RPMI-1640
medium. Cells were washed twice, seeded in Matrigel (BD
Biosciences) in a 1:2 ratio and 100 μl of the solution was placed
on coverslips. The gel solidified at 37°C for 30 min and was
overlaid with RPMI-1640 medium with 10% of FBS. Organoids were
evidenced with Giemsa staining. Their images were acquired at 48,
72 and 96 h after plating using optic microscope Nikon Eclipse
TS100.
Statistical analysis
All the presented results were obtained from
experiments repeated in triplicate for each sample obtained from
each patient. Samples from seven different patients were used in
each experiment. All group data are presented as mean ± standard
deviation of the mean (SD) and statistical analyses were calculated
using IBM, SPSS v.20 software. Parametric 2-tail Student's t-test
for statistical validation was used. P-value was considered
statistically significant when <0.05.
Results
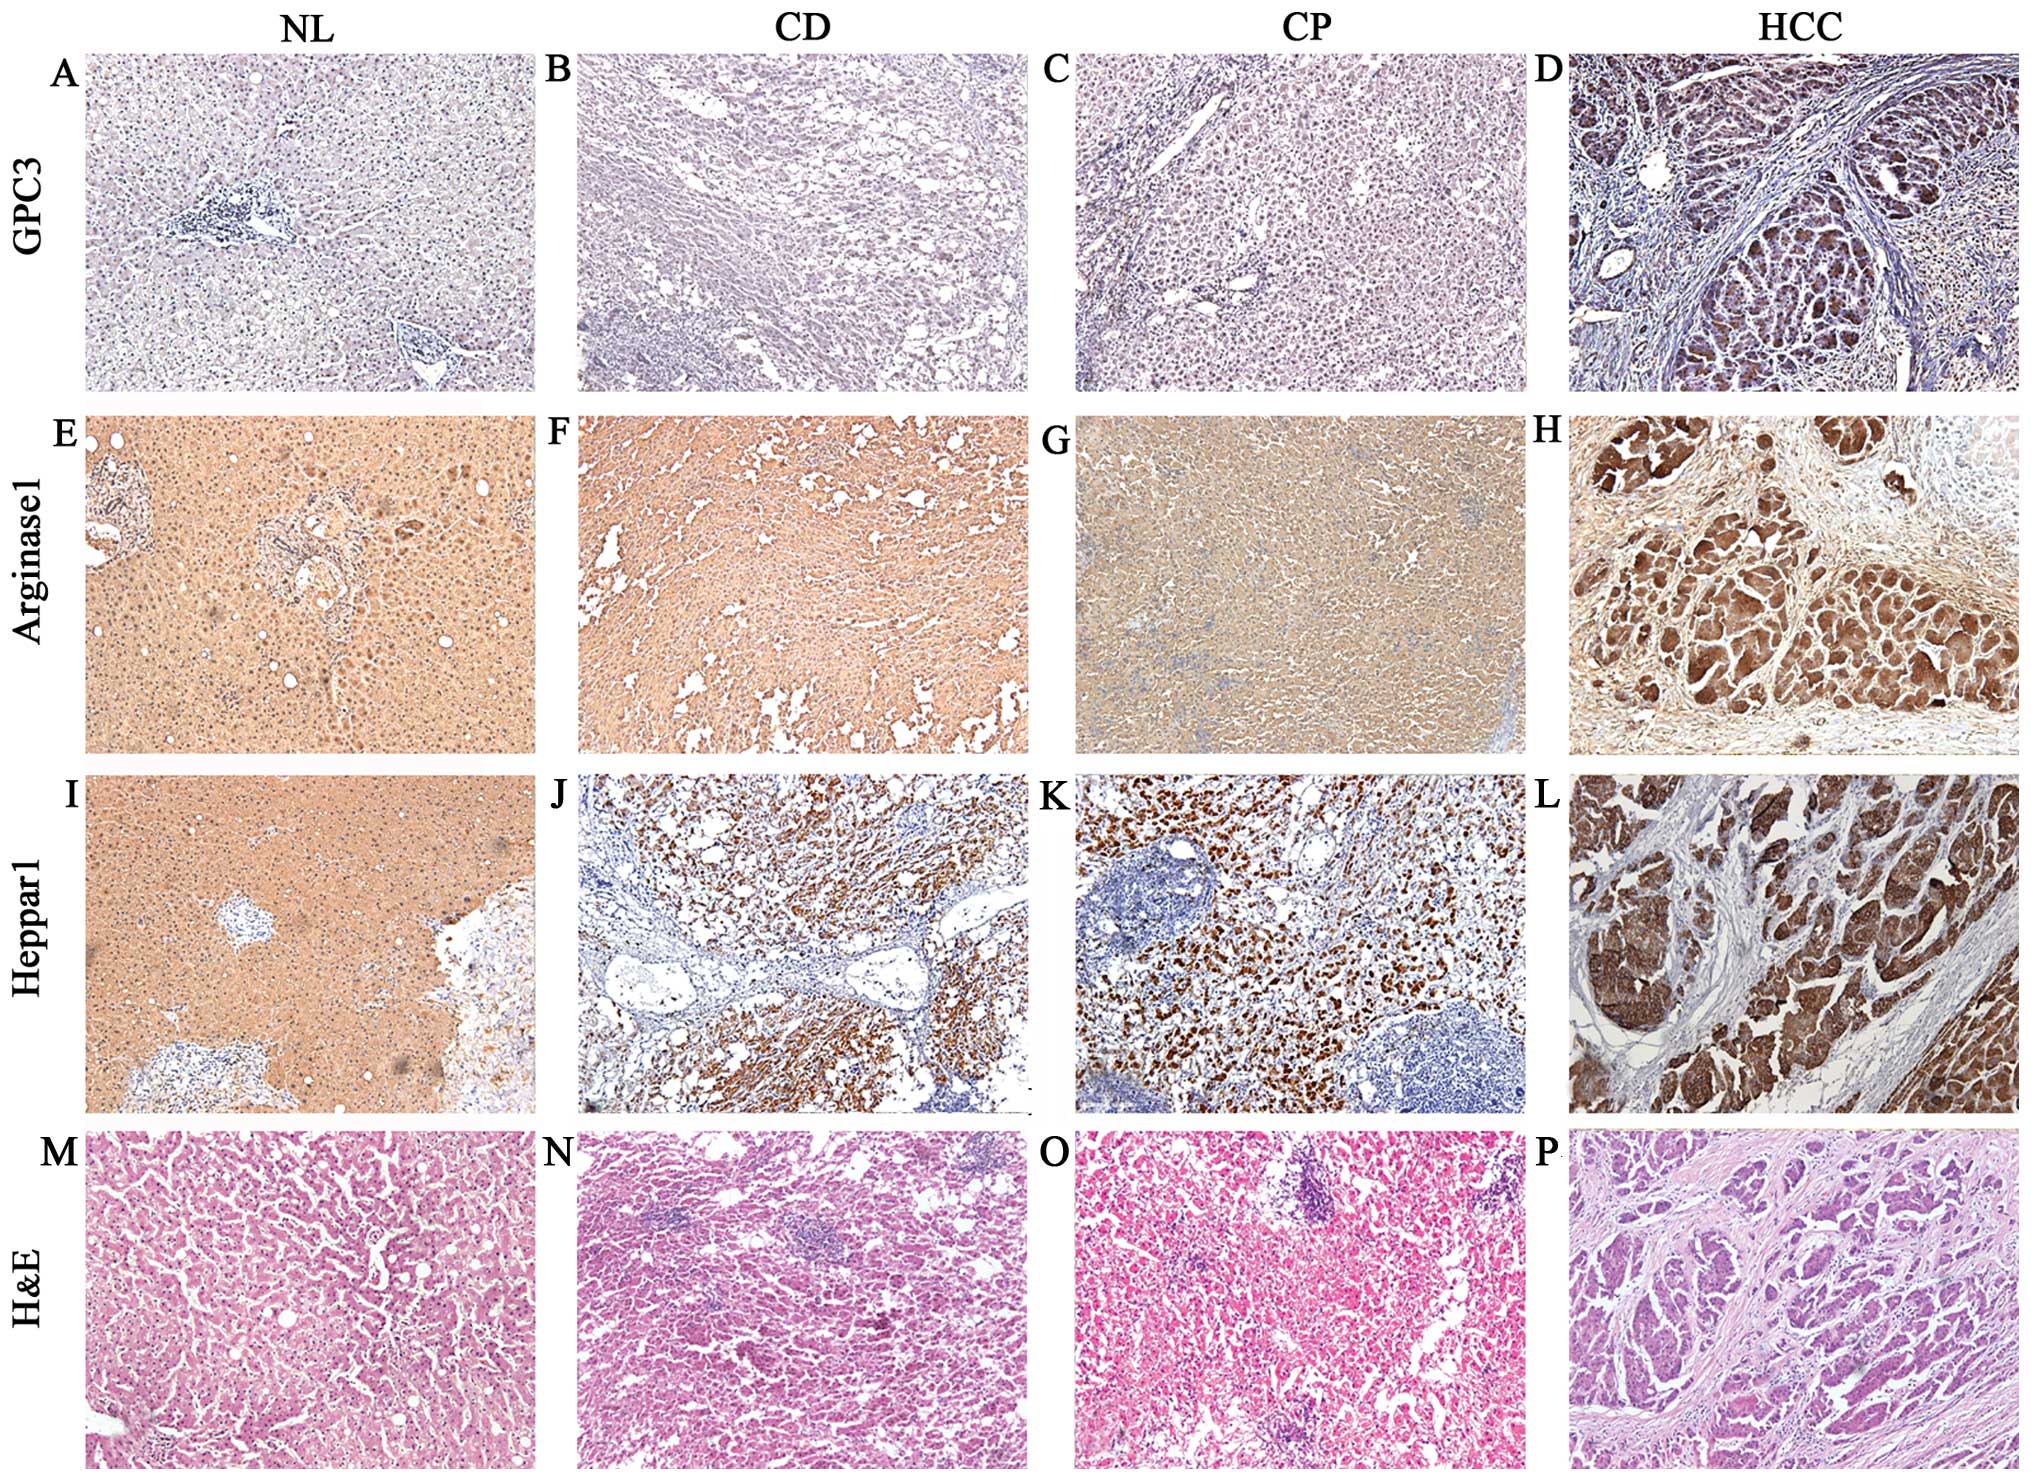
Expression of HCC markers: GPC3,
Arginase1 and Heppar1
Initially, each specimen (NL, CD, CP and HCC) used
to obtain primary cultures was evaluated for GPC3, Arginase1, and
Heppar1 expression. Immunohistochemistry confirmed, as expected
(12,13) expression of GPC3 and overexpression
of Arginase1 and Happar1 in HCC (Fig.
1D, H and L), whereas it showed a very low background
expression for GPC3 and Arginase1 in NL tissue (Fig. 1A, E and I) and in cirrhotic tissues
(CD and CP) (Fig. 1B, C, F and G).
Happar1 showed a very low background expression in NL tissue
(Fig. 1I), whereas in cirrhotic
tissues (CD and CP) its background expression was more evident,
although significantly lower than in HCC (Fig. 1J and K). In Fig. 1M–P, H&E staining confirmed the
neoplastic nature of HCC samples and the absence of cancer cells in
NL, CD and CP specimens. Histologic examination of the specimens by
a pathologist (blinded to the diagnosis) supported the absence of
HCC in cirrhotic specimens (CP, CD and NL) utilized to obtain the
primary hepatocytes cultures performed.
Morphological observations
Primary cultures of cells obtained from CP and CD
evidenced typical histologic features of cirrhotic tissue with
canonic cubic shaped hepatocytes and non-parenchymal cells (NPC)
(Fig. 2A). At 24 h after plating
cirrhotic specimens, adherent cells were observed (data not shown).
The number of cells adherent to the wells increased progressively
and, at 4 week, it was possible to distinguish specific cell types.
At 4 weeks (5 passages) cells manifested a change in morphological
characteristics: CP-Hep and CD-Hep lost their classic cubical shape
and acquired fibroblastic/mesenchymal-like phenotype, increased
their number with CP-Hep reaching an overall appearance similar to
that of HCC. Instead, CD-Hep markedly increased their size with
only a minor increase in their number. Furthermore, at 10 weeks,
CP-Hep started to aggregate in clusters resembling those observed
in HCC. In CD-Hep these aggregates were not visible. All these
modifications, illustrated in Fig.
2A, were maintained over time (16 weeks).
 | Figure 2Morphological features of cultured
cells obtained from CP, CD and HCC. (A) Cells in primary culture at
3, 4, 10 and 16 weeks. Morphological modifications are evident and
maintained over time (16 weeks). CP cells became spindle like,
started to aggregate in clusters and increased their proliferation
similarly to HCC. CD cells increased in sizes and diminished their
proliferation (image magnification, ×100; white bar, 200 μm). (B)
Immunofluorescence of hepatocytes markers: Albumin, Heppar1, CK18
in CD-Hep, CP-Hep and HCC, no immunoreactivity for CD68 (macrophage
marker) and CD31 (liver endothelial cells), β-catenin
immunofluorescence was positive in all cell cultures that was
stronger in HCC compared to CP- and CD-Hep. White bar, 100 μm. |
Characterization of PHH cultures
For the identification of primary human hepatocytes
(PHH) as well as the different non-parenchymal cells (NPC) and for
determination of their purity, the cells isolated were investigated
for cell type-specific markers by immunofluorescence staining.
Positively stained cells were counted in relation to the total cell
number of cells positive for Hoechst 33342. PHH were identified by
their cubical shape and the presence of multi-nucleated cells (bi-
and tri-nucleated cells) (Fig. 2A and
B). Those cells stained positive for the hepatocytes markers:
Albumin, Heppar1 and CK18 (14)
(Fig. 2B) at 16 weeks and showed a
purity of 93.5±2.4, 94.0±3.5 and 92.4±2.1%, respectively. To
exclude the presence of Kupffer cells (KC) and liver endothelial
cells (LEC) in hepatocytes cultures, immunofluorescent staining
were performed and no immunoreactivity was observed with
macrophage-specific surface protein and LEC markers, respectively
CD68 and CD31 (Fig. 2B). In
addition, classic fenestrations of LEC in cultures were not
observed. While β-catenin is normally not expressed in liver NPC or
fibroblasts and is present in hepatocytes (15), in our culture it was expressed in
96±2.0% of cells confirming that the majority in the culture were
hepatocytes. This expression was more evident in HCC (16) compared to CP-Hep and CD-Hep
(Fig. 2B). Table II summarizes the antibodies
characteristics used to detect hepatocyte specific antigens by
immunofluorescence.
| Table IIPrimary antibodies for
immunofluorescence staining of human hepatocytes. |
Table II
Primary antibodies for
immunofluorescence staining of human hepatocytes.
| Antibody | Type | Species | Reactivity | Manufacturer | Dilution | Marker |
|---|
| Albumin | Monoclonal | Mouse | Human | Santa Cruz
Biotechnology | 1:500 | PHH |
| CK18 | Monoclonal | Mouse | Human | Abcam | 1:100 | PHH |
| Heppar1 | Monoclonal | Mouse | Human | Dako | 1:100 | PHH |
| CD68 | Monoclonal | Mouse | Human | Santa Cruz
Biotechnology | 1:500 | KC |
| CD31 | Monoclonal | Mouse | Human | Santa Cruz
Biotechnology | 1:500 | LEC |
| β-catenin | Monoclonal | Rabbit | Human | Abcam | 1:250 | PHH |
Comparative analysis of cell growth
curves between CP-Hep and CD-Hep
As described in Materials and methods, cell growth
was evaluated by plating 2.5×10⁵ cells of CP- and CD-Hep
in culture medium (time zero). Cells were allowed to grow for
established time periods (12, 14 and 16 weeks) at which cultures
were stopped and cells counted. Fig.
3A (left panel) shows a progressive increase with sharp rise of
growth for CP-Hep, whereas CD-Hep growth rate was gradually
reduced, so that at sixteen weeks CD-Hep was 74% of CP-Hep (at 16
weeks, CP-Hep 8.3×10⁶±0.7×10⁶ and CD-Hep
4.4×10⁶±0.4×10⁶). This confirms the
microscopic evidence of the lower cellularity of CD-Hep compared to
CP-Hep at 16 weeks as shown in Fig.
2A. Fig. 3A (right panel) also
shows a different growth rate for the two cell types (CP-Hep and
CD-Hep), acquired over time. Results demonstrate that CP-Hep grew
at a progressively higher rate as compared to CD-Hep. To confirm
cell growth pattern, we evaluated protein levels of PCNA (at 0, 4
and 16 weeks) and CycD1 (at 4 and 16 weeks), markers of DNA
replication and cell cycle progression, respectively. Fig. 3B shows that both proteins increase
in expression in CP-Hep earlier and more markedly than in CD-Hep
confirming the higher proliferation activity of CP-Hep.
Expression of GPC3, CD44 and CD44v6
Fig. 3C illustrates
western blot analyses of specific markers of HCC, namely GPC3, CD44
and CD44v6. GPC3, a specific HCC proliferation marker (17,18)
is highly expressed in HCC cells, while it is absent in NL cells.
In HCC, GPC3 appears as a broad smeared band. This could represent
a different degree of glycosylation of GPC3 with a consequent wider
range of molecular weight, as described in literature (19–21).
Fig. 3 also shows that at time
zero CP-Hep and CD-Hep express a low-density smeared band of GPC3.
However, at sixteen weeks, this band became more prominent and
compact, with levels that were much higher in CP-Hep than in
CD-Hep. High expression of CD44 and its isoform CD44v6, both
specific markers of liver cancer cells (22–25),
were confirmed in HCC, while they were absent in NL samples. In CP
and CD samples the CD44 and its isoform CD44v6 showed very low
levels at time zero with a small increment at 16 weeks.
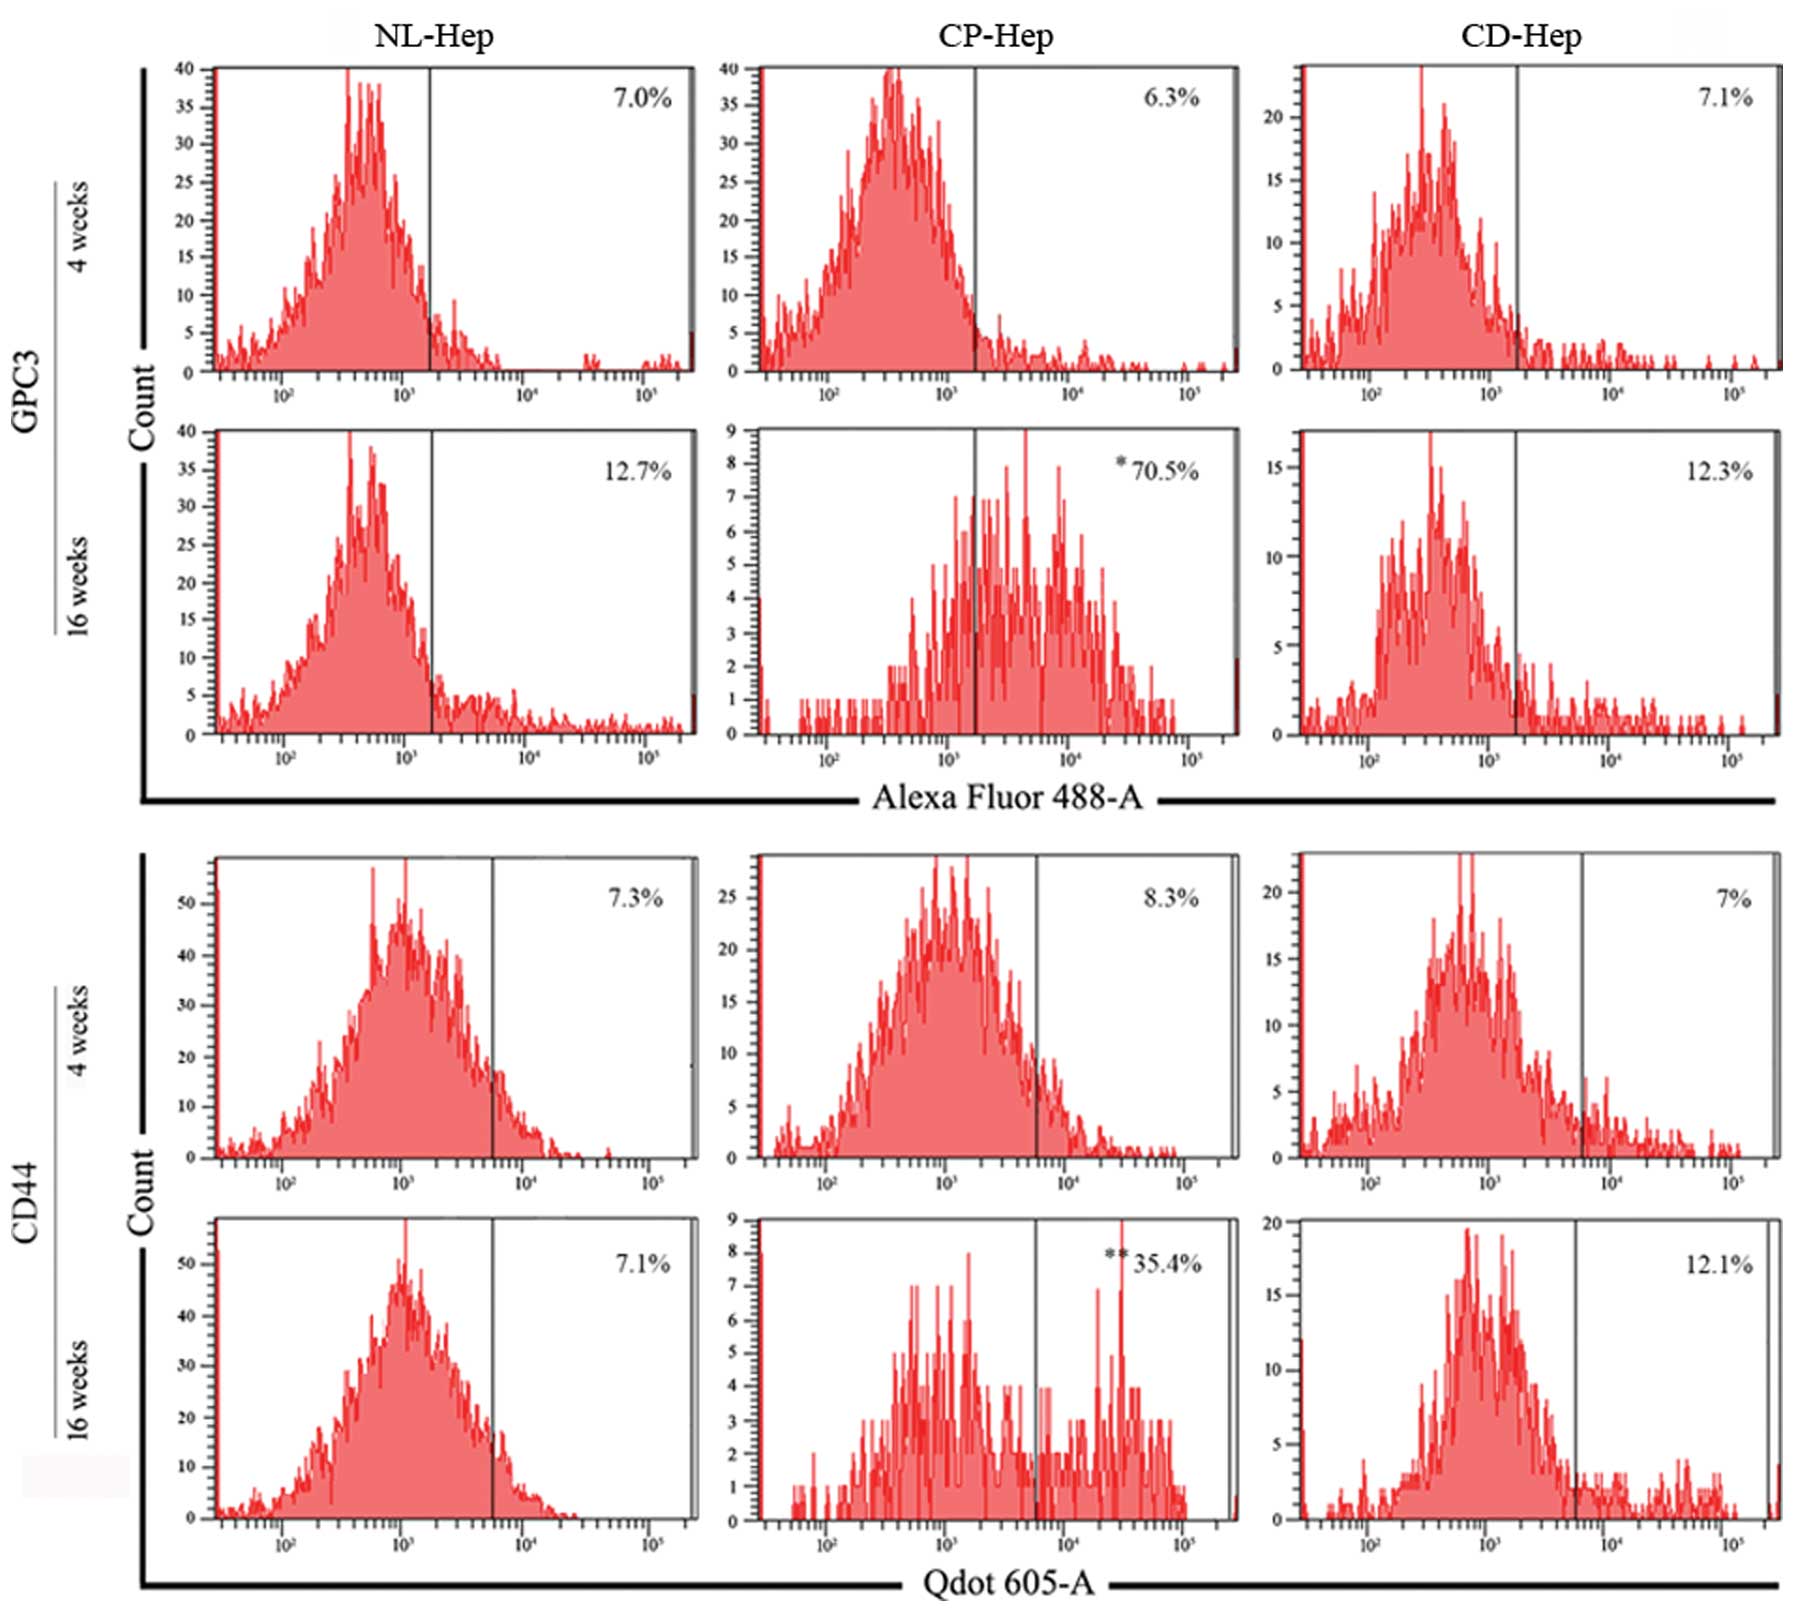
Flow cytometry evaluation of GPC3 and
CD44 markers in CP-Hep and CD-Hep
GPC3 and CD44 levels were evaluated by
cytofluorometry at early and advanced stages of culture (4 and 16
weeks), in NL-, CP- and CD-Hep. At 4 weeks the percentage of cells
expressing these markers was very similar in the three cell types
(GPC3, NL-Hep 7.0%, CP-Hep 6.3%, CD-Hep 7.1%; CD44, NL-Hep 7.3%,
CP-Hep 8.3%, and CD-Hep 7%). However, when measured at 16 weeks,
the number of cells expressing GPC3 and CD44 appeared markedly
increased in CP hepatocytes with 11.1-fold increase for GPC3 and
4.2-fold increase for CD44, while it remained almost unchanged in
CD and NL-Hep (GPC3, NL-Hep 12.7%, CP-Hep 70.5% and CD-Hep 12.3%;
CD44, NL-Hep 7.1%, CP-Hep 35.4% and CD-Hep 12.1%). These results,
summarized in Fig. 4, suggest that
a higher percentage of hepatocytes from CP developed HCC-like
features progressively in the primary culture. When the cellular
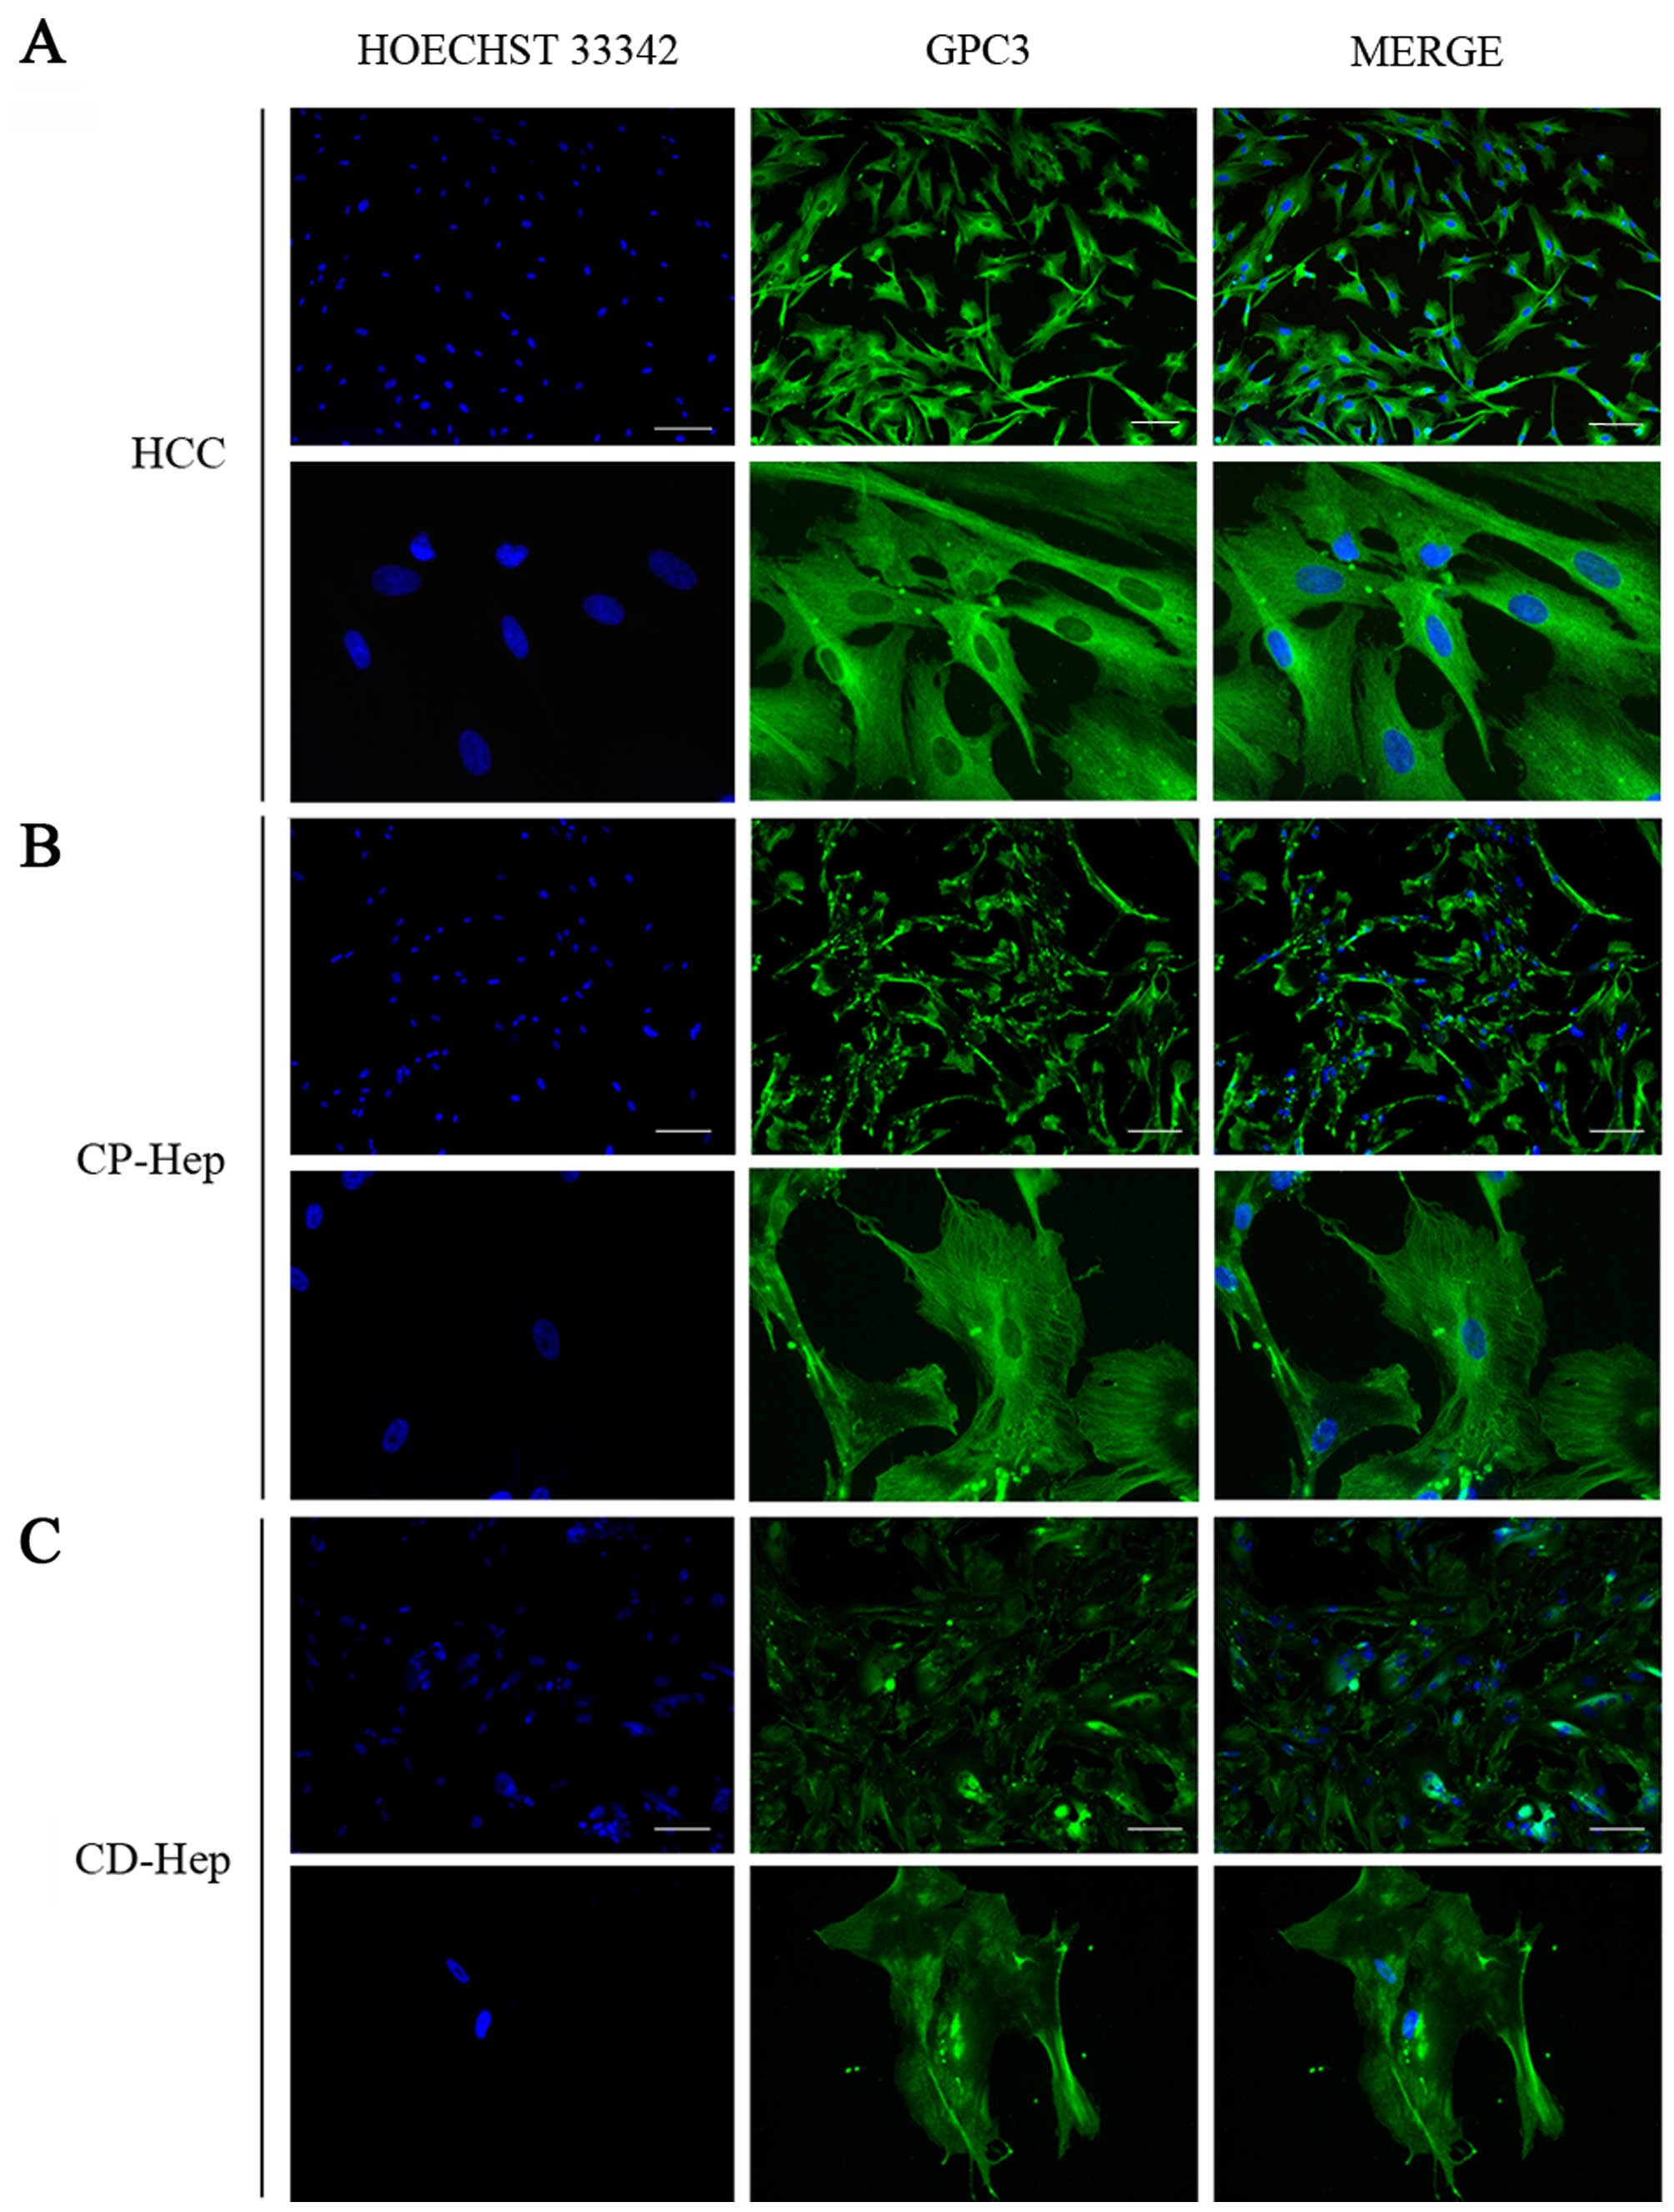
localization of these markers was investigated by
immunohistochemistry, we observed that GPC3 was broadly distributed
in the cytoplasm and membrane of HCC cells with a higher intensity
than CP-Hep and CD-Hep (Fig. 5A).
Furthermore, we observed that the expression of GPC3 was widely
distributed in the cytoplasm of numerous hepatocytes in both CP and
CD. However, a higher number of cells presented positivity for GPC3
in CP-Hep when compared to CD-Hep. The staining was more robust and
presented a prominent filament-like cytoplasmic distribution that
was strongly expressed in cellular estroflexions as compared to the
less intense and dishomogeneous distribution observed in CD-Hep
(Fig. 5).
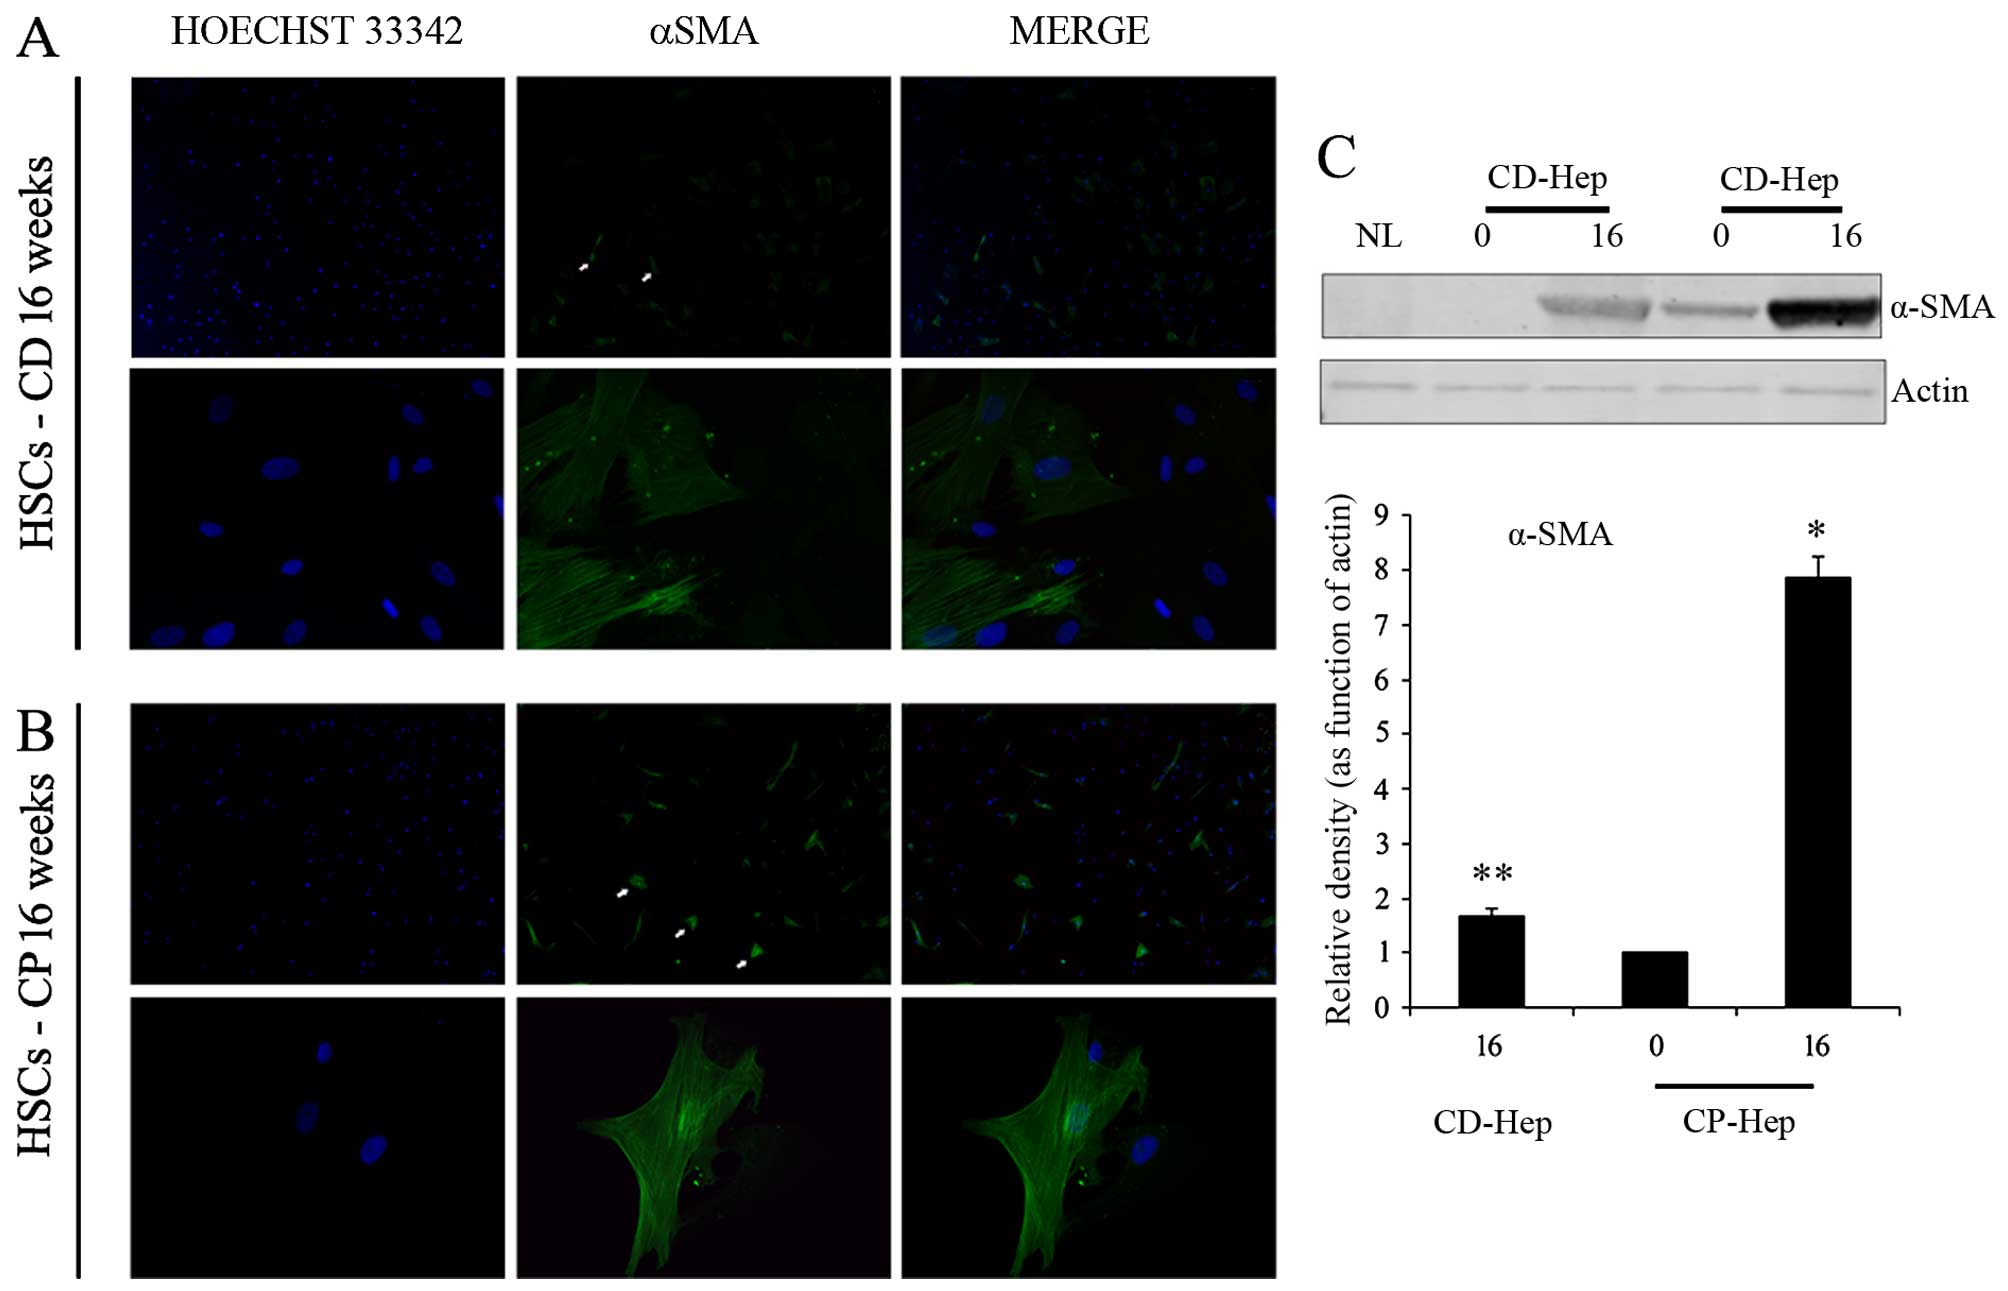
Activated HSCs in cellular cultures
It has been shown that HSC activation plays a
crucial role in supporting inflammation and growth of early tumor
cells in HCC (26–29). Morphological evaluation of cultured
cells supported the presence of HSCs. Presence of activated HSCs in
CD and CP cultures was confirmed by α-smooth muscle actin (α-SMA)
immunofluorescence at 16 weeks of culture (Fig. 6A and B). To exclude the presence of
quiescent HSCs we performed Red-oil staining used to identify
quiescent hepatic stellate cells (HSCs) detecting retinoic acid
inclusions, typical of quiescent stellate cells (26). Using this technique, we confirmed
the absence of cytoplasmic retinoic acid inclusions (data not
shown). Western blot analysis demonstrated the expression of α-SMA
(activated HSCs) at time zero in CP, with a significant increase in
its expression at 16 weeks, while in CD α-SMA was not present at
time zero and only appeared at 16 weeks (Fig. 6C). However, at 16 weeks its
expression was markedly higher in CP compared to CD. Overall, these
results suggest that the intensity of α-SMA positive cells
significantly increases in culture, over time, in particular in
CP-Hep.
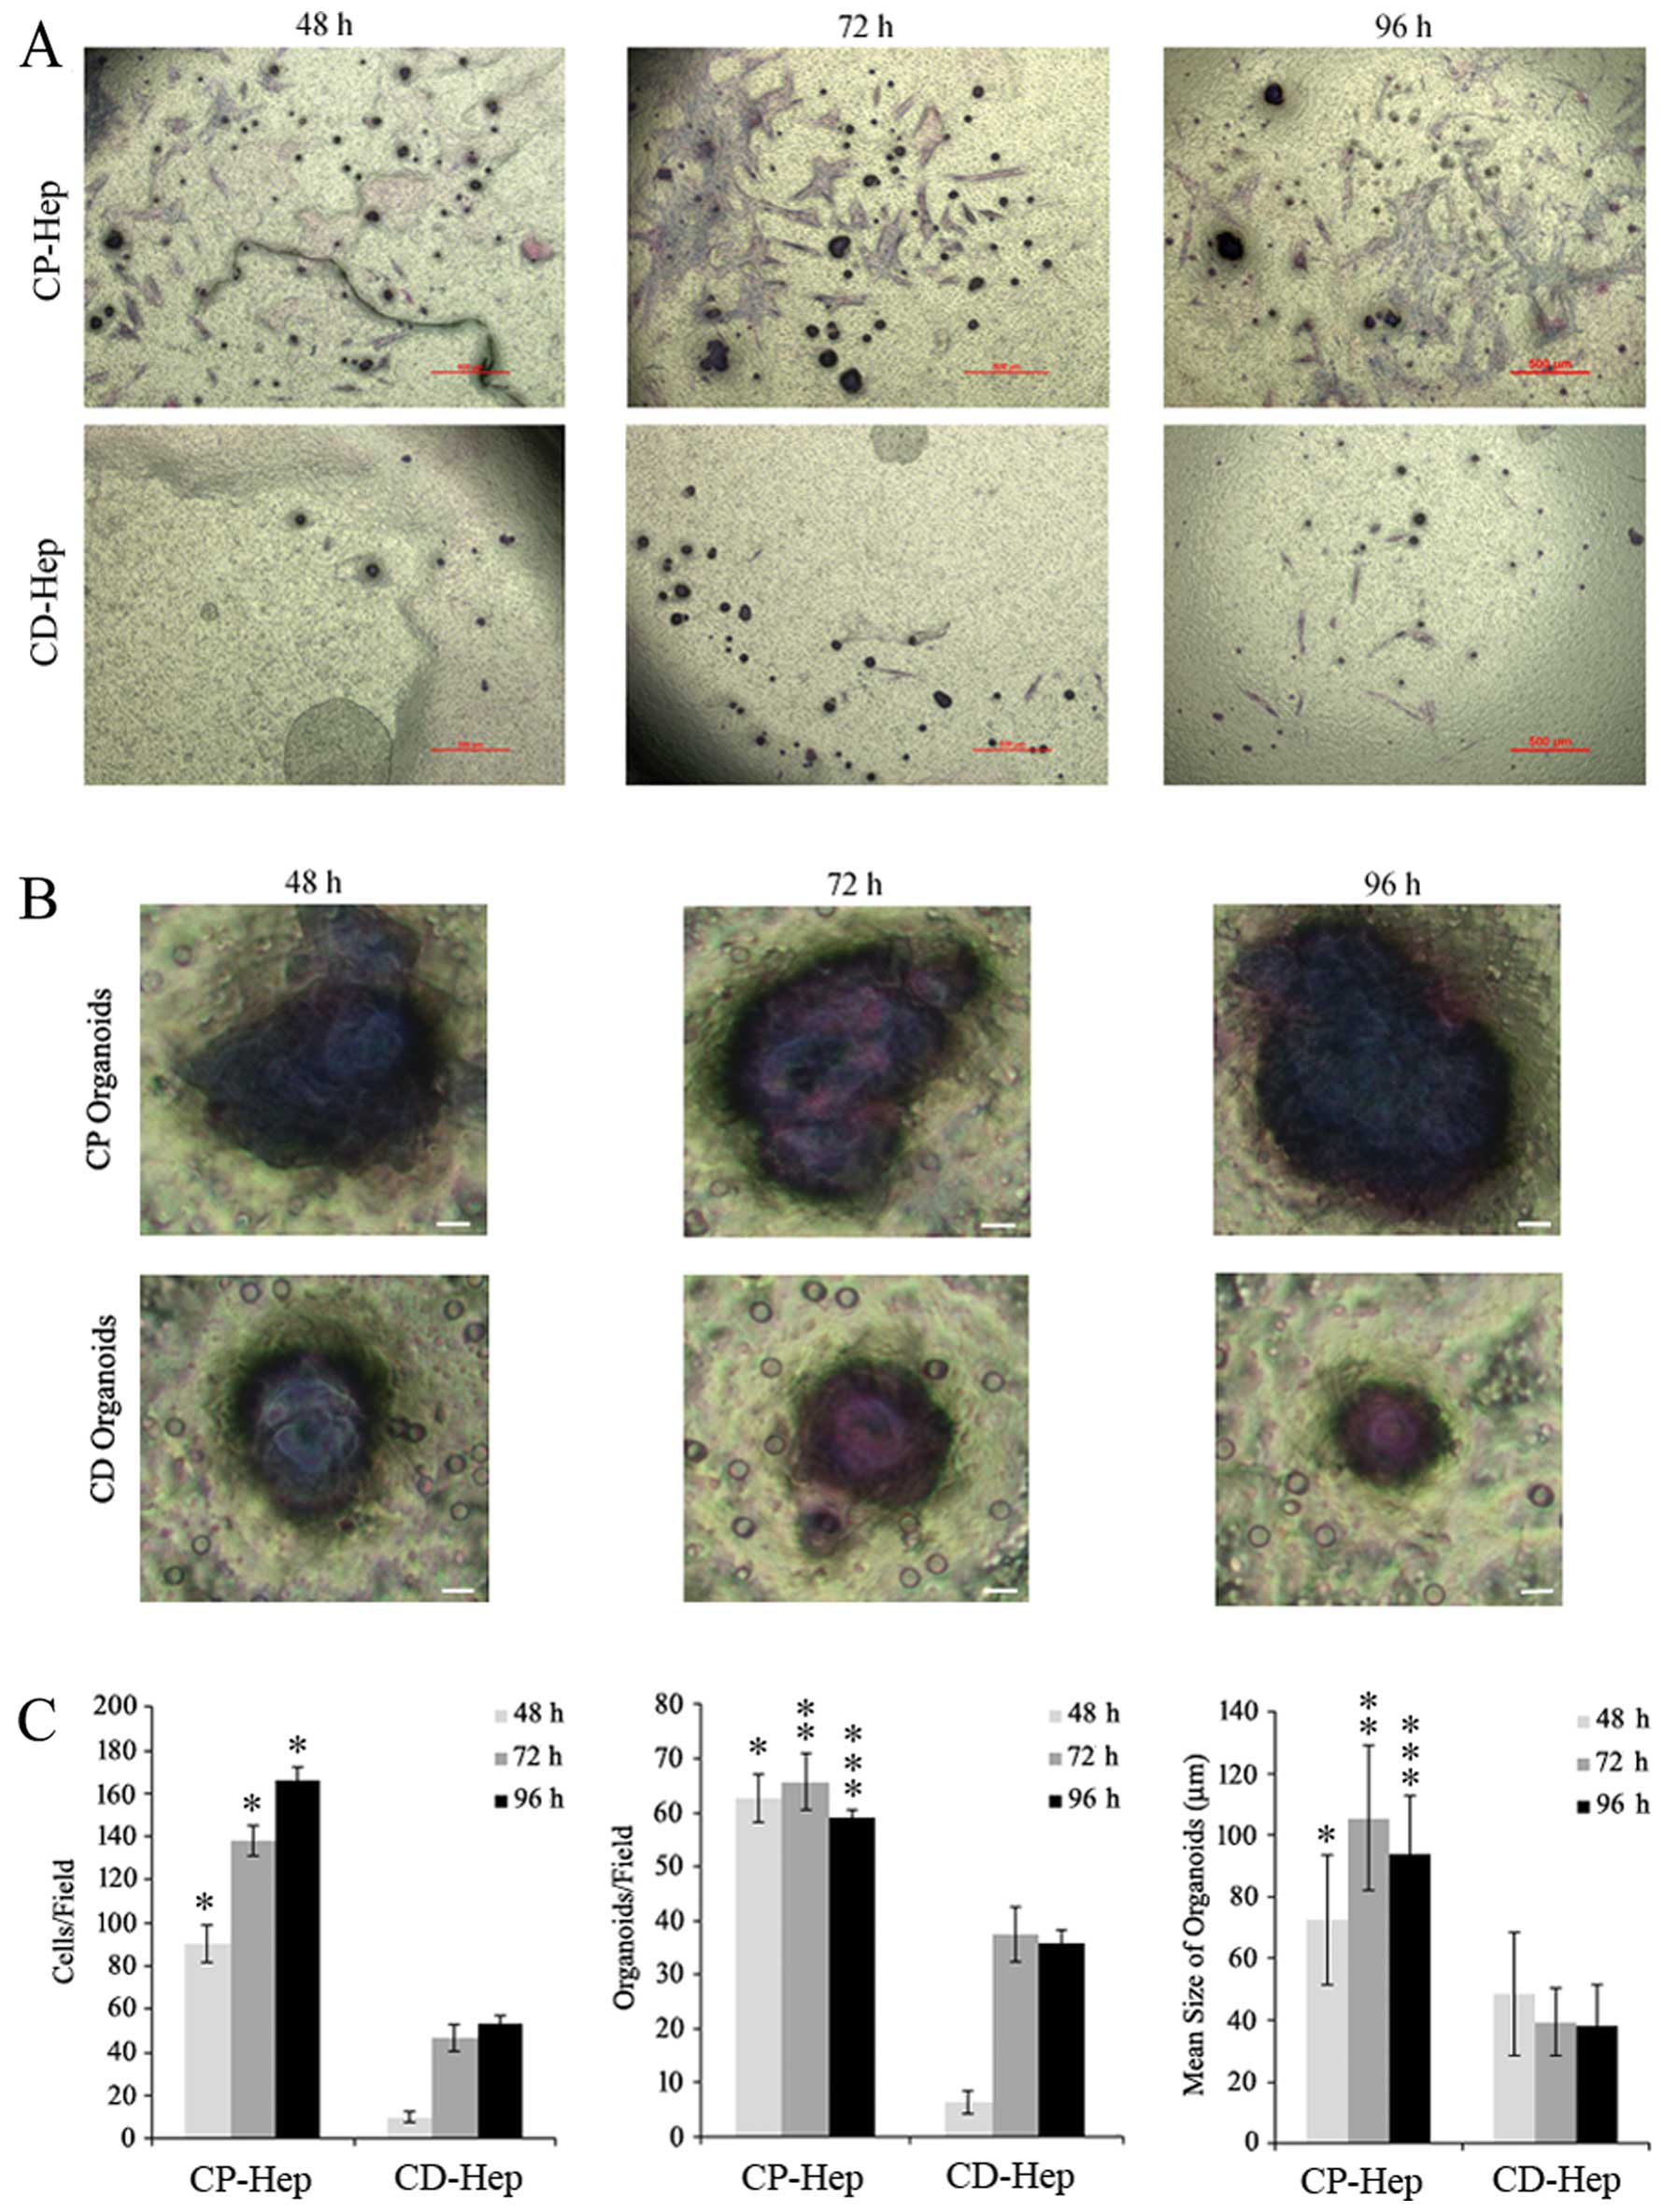
Migration and invasion abilities of CP
and CD cells
To evaluate the ability of CP and CD cells to
penetrate the surrounding tissue, we analyzed their capacity to
migrate/invade the extracellular matrix. We evidenced that cells
from CP express an ability to migrate to the extracellular matrix
at a higher rate than CD-Hep at each time-point tested (mean ± SD
in CP vs. CD, respectively: 90±8.7 vs. 9.6±2.5 at 48 h, 148±10 vs.
46±7.5 at 72 h and 166±6 vs. 53.3±3.5 at 96 h from plating;
Fig. 7A and C, left panel).
Furthermore, cells showing migrating capacity in Transwell
migration/invasion assay, formed conglomerates that have been
previously described in various cancer types as organoids (30). The organoids observed in these
experiments were more numerous and larger in CP than in CD samples
(mean number of organoids/field±SD in CP vs. CD respectively:
62.6±4.5 vs. 6.3±2 at 48 h, 65.6±5.1 vs. 37.3±5 at 72 h and
59.6±1.5 vs. 35.6±2.5 at 96 h from plating) (Fig. 7B and C).
Discussion
With the present study we demonstrated for the first
time that hepatocytes obtained from proximal areas to HCC present
morphologic and neoplastic transformation when cultured in
vitro. We observed that while cells from HCC maintained their
morphology and unmodified neoplastic characteristics in culture,
hepatocytes from CP showed a progressive morphologic transformation
in HCC-like cells, accompanied by expression of specific HCC
markers expression and characteristics of invasiveness compared to
CD-Hep obtained from the same patients. Thus, increased proximity
to HCC seems to be associated with a higher percentage of cells
that appear committed to transform in neoplastic cells.
Overall, these data suggest that hepatocytes
proximal to HCC are influenced by a pro-neoplastic microenvironment
that determines their morphological and biological transformation
in cancer cells. Diverse microenvironments with unique
characteristics appear to coexist in the liver influencing
hepatocytes differently. We have previously shown that in patients
with liver cirrhosis secondary to HCV infection, only a percentage
of the entire hepatocyte population (7–20%) is infected and that
these cells are distributed in clusters. In the same study we also
demonstrated that HCV foci of infected cells are proximally related
to HCC (31). The heterogeneous
distribution of the infected areas of the liver during HCV
infection and their relation with HCC further supports this
hypothesis.
The pro-neoplastic transformation observed in the
present study was evident starting approximately at ten weeks after
initial isolation. The CP cells appeared to modify their structure
from cuboid hepatocytes to an HCC-like morphology. Hence, this
modification was associated with a robust increase in the
proliferation rate starting at fourteen weeks from isolation. These
changes were accompanied by invasive capacity in addition to
formation of larger and more numerous organoids, both
characteristic of tumorigenicity (32). On the contrary, CD-Hep showed fewer
and different morphological changes, reduced proliferation rate and
less signs/markers of invasiveness at the same time-points.
The available data in this field are mostly obtained
from studies conducted on HCC cell lines (33–35).
Immortalized cell lines are able to proliferate but usually do not
show modifications of their characteristics over time. We believe
that introducing the temporal dynamic component obtained from fresh
isolated cells, provides more information on neoplastic
transformation as it mimics what occurs in vivo. To confirm
that these findings are not secondary to contamination of
neoplastic cells or satellite lesions in the liver proximal to HCC,
immunohistochemistry, morphologic evaluation and western blot
analysis of the cirrhotic tissue used for the cell outgrowth were
performed. These confirmed the absence of cancer cells by lack of
expression of GPC3 (specific HCC marker) or low expression of
Arginase1 and Heppar1 (hepatocyte markers) that are overexpressed
in the primary neoplastic lesion of the same patients, comparable
to NL.
It has been shown that HSC activation plays a
crucial role in supporting inflammation and probably the growth of
early tumor cells, contributing to the chemo-resistance of HCC
(26–29). In the present study, we observed
the presence of α-SMA positive cells in CP and CD cultures
suggesting activation of HSCs. Their activity level progressively
increased with time as demonstrated by the significant increase of
α-SMA expression at 16 weeks of incubation.
It is known, that in cancer cell lines, GPC3 is
involved in the activation of Wnt/β-catenin pathway and promotes
cell proliferation of HCC by stimulating the canonical Wnt
signaling pathway (19,20). The results here reported show that
initially GPC3 was not expressed by isolated CP-Hep. Then, its
presence progressively increased during culture in these cells,
suggesting that they were undergoing neoplastic transformation. In
fact, only the cells obtained from CP, showed a robust increase in
protein expression and a striking increase in the percentage of
cells expressing GPC3 (from 6.3% at 4 weeks to 70.5% at 16 weeks of
culture). The emerging role of this glycoprotein, not only as HCC
marker but also as molecular target for gene therapy, is arising
(21). It has been suggested that
the inhibition of translational and post-translational events of
GPC3 could impair the growth and proliferation of HCC (33–35).
Moreover, recent research on HCC cell line showed that silencing of
GPC3 induces apoptosis of these cancer cells (36).
Expression of CD44 and its isoform CD44v6 are
considered markers of liver cancer stem cells (22,24).
In the present study, western blot and immunohistochemistry
analyses of cultures at time zero revealed very low CD44v6 levels
that significantly increased during the dynamic transformation of
CP- and CD-Hep. Moreover, flow cytometry revealed that in CP-Hep a
progressively larger number of cells express CD44 in culture (from
8.3% at time zero to 35.4% at 16 weeks) further strengthening the
evidence of neoplastic transformation of these cells.
Clinical observations support that recurrence of HCC
is frequent in the proximity of the primary lesion and is observed
usually only a few months after resection or loco-regional
treatment (6–8). CP-Hep showed a similar behavior
increasing their proliferation rate and expressing HCC
characteristics after approximately three months in culture. It is
conceivable that these characteristics are secondary to isolation
and culture. However, we did not observe these variations in CD-Hep
obtained from the same patient and NL-Hep confirming that the
different behavior of these cell populations is not related to
their culture and manipulation conditions.
Moreover, cells underwent multiple washes and
re-plating and culture media was non-inducing without addition of
growth factors to reduce differentiation of mesenchymal cells
(37). To rule out that the cells
obtained at 16 weeks of culture were fibroblast-like mesenchymal
cells, a phenotype analysis was performed with specific antibodies
confirming that 96% of these were hepatocytes.
Consequently, we suggest that our findings on CP-
and CD-Hep could mimic the neoplastic transformation that these
cells would have in vivo in relation to their proximity to a
pro-neoplastic microenvironment in the cirrhotic tissue.
Furthermore, since we observed similar changes in all patients
studied, this phenomenon appears to be consistent.
With the present study, we are first to describe the
differences in neoplastic transformation of these cells, creating a
new model to investigate tumorigenesis of human hepatocytes
obtained from cirrhotic patients. In our opinion this model can be
used to investigate molecular mechanisms, identify new markers and
evaluate therapeutic interventions for HCC. This new model could
provide an important tool for prevention and early intervention,
since it can be used to target cells that are not yet cancerous but
are in their early phase of transformation in HCC.
Abbreviations:
|
HCC
|
hepatocellular carcinoma
|
|
LTX
|
liver transplantation
|
|
GPC3
|
Glypican-3
|
|
FBS
|
fetal bovine serum
|
|
CP
|
cirrhotic proximal
|
|
CD
|
cirrhotic distal
|
|
NL
|
normal liver
|
|
PHH
|
primary human hepatocytes
|
|
KC
|
kupffer cells
|
|
LEC
|
liver endothelial cells
|
|
CP-Hep
|
hepatocytes isolated from cirrhotic
proximal tissue
|
|
CD-Hep
|
hepatocytes isolated from cirrhotic
distal tissue
|
|
αSMA
|
α-smooth muscle actin
|
|
BSA
|
bovine serum albumin
|
|
HSC
|
hepatic stellate cell
|
|
CK18
|
cytokeratin 18
|
|
CD31
|
cluster of differentiation 31
|
|
CD44
|
cluster of differentiation 44
|
|
CD68
|
cluster of differentiation 68
|
|
CycD1
|
cyclin D1
|
|
PCNA
|
proliferating cell nuclear antigen
|
|
NPC
|
non-parenchymal cells
|
|
Heppar1
|
hepatocytes paraffin1
|
References
|
1
|
El-Serag HB: Hepatocellular carcinoma:
Recent trends in the United States. Gastroenterology. 127(Suppl 1):
S27–S34. 2004. View Article : Google Scholar : PubMed/NCBI
|
|
2
|
El-Serag HB: Epidemiology of viral
hepatitis and hepatocellular carcinoma. Gastroenterology.
142:1264–1273.e1. 2012. View Article : Google Scholar : PubMed/NCBI
|
|
3
|
Mittal S and El-Serag HB: Epidemiology of
hepatocellular carcinoma: Consider the population. J Clin
Gastroenterol. 47(Suppl): S2–S6. 2013. View Article : Google Scholar : PubMed/NCBI
|
|
4
|
Poon RT, Ng IO, Fan ST, Lai EC, Lo CM, Liu
CL and Wong J: Clinicopathologic features of long-term survivors
and disease-free survivors after resection of hepatocellular
carcinoma: A study of a prospective cohort. J Clin Oncol.
19:3037–3044. 2001.PubMed/NCBI
|
|
5
|
Roayaie S, Obeidat K, Sposito C, Mariani
L, Bhoori S, Pellegrinelli A, Labow D, Llovet JM, Schwartz M and
Mazzaferro V: Resection of hepatocellular cancer ≤2 cm: Results
from two Western centers. Hepatology. 57:1426–1435. 2013.
View Article : Google Scholar
|
|
6
|
Earl TM and Chapman WC: Hepatocellular
carcinoma: Resection versus transplantation. Semin Liver Dis.
33:282–292. 2013. View Article : Google Scholar : PubMed/NCBI
|
|
7
|
Peng ZW, Lin XJ, Zhang YJ, Liang HH, Guo
RP, Shi M and Chen MS: Radiofrequency ablation versus hepatic
resection for the treatment of hepatocellular carcinomas 2 cm or
smaller: A retrospective comparative study. Radiology.
262:1022–1033. 2012. View Article : Google Scholar : PubMed/NCBI
|
|
8
|
Ramakrishna G, Rastogi A, Trehanpati N,
Sen B, Khosla R and Sarin SK: From cirrhosis to hepatocellular
carcinoma: New molecular insights on inflammation and cellular
senescence. Liver Cancer. 2:367–383. 2013. View Article : Google Scholar
|
|
9
|
Zhao YJ, Ju Q and Li GC: Tumor markers for
hepatocellular carcinoma. Mol Clin Oncol. 1:593–598. 2013.
|
|
10
|
Timek DT, Shi J, Liu H and Lin F:
Arginase-1, HepPar-1, and Glypican-3 are the most effective panel
of markers in distinguishing hepatocellular carcinoma from
metastatic tumor on fine-needle aspiration specimens. Am J Clin
Pathol. 138:203–210. 2012. View Article : Google Scholar : PubMed/NCBI
|
|
11
|
Tomuleasa C, Soritau O, Rus-Ciuca D, Pop
T, Todea D, Mosteanu O, Pintea B, Foris V, Susman S, Kacsó G, et
al: Isolation and characterization of hepatic cancer cells with
stem-like properties from hepatocellular carcinoma. J
Gastrointestin Liver Dis. 19:61–67. 2010.PubMed/NCBI
|
|
12
|
Krings G, Ramachandran R, Jain D, Wu TT,
Yeh MM, Torbenson M and Kakar S: Immunohistochemical pitfalls and
the importance of glypican 3 and arginase in the diagnosis of
scirrhous hepatocellular carcinoma. Mod Pathol. 26:782–791. 2013.
View Article : Google Scholar : PubMed/NCBI
|
|
13
|
Shiran MS, Isa MR, Sherina MS, Rampal L,
Hairuszah I and Sabariah AR: The utility of hepatocyte paraffin 1
antibody in the immunohistological distinction of hepatocellular
carcinoma from cholangiocarcinoma and metastatic carcinoma. Malays
J Pathol. 28:87–92. 2006.
|
|
14
|
Pfeiffer E, Kegel V, Zeilinger K,
Hengstler JG, Nüssler AK, Seehofer D and Damm G: Featured Article:
Isolation, characterization, and cultivation of human hepatocytes
and non-parenchymal liver cells. Exp Biol Med (Maywood).
240:645–656. 2015. View Article : Google Scholar
|
|
15
|
Ihara A, Koizumi H, Hashizume R and
Uchikoshi T: Expression of epithelial cadherin and alpha- and
beta-catenins in nontumoral livers and hepatocellular carcinomas.
Hepatology. 23:1441–1447. 1996.PubMed/NCBI
|
|
16
|
Wands JR and Kim M: WNT/β-catenin
signaling and hepatocellular carcinoma. Hepatology. 60:452–454.
2014. View Article : Google Scholar : PubMed/NCBI
|
|
17
|
Ho M and Kim H: Glypican-3: A new target
for cancer immunotherapy. Eur J Cancer. 47:333–338. 2011.
View Article : Google Scholar :
|
|
18
|
The International Consensus Group for
Hepatocellular Neoplasia. Pathologic diagnosis of early
hepatocellular carcinoma: A report of the international consensus
group for hepatocellular neoplasia. Hepatology. 49:658–664. 2009.
View Article : Google Scholar : PubMed/NCBI
|
|
19
|
Capurro M, Martin T, Shi W and Filmus J:
Glypican-3 binds to Frizzled and plays a direct role in the
stimulation of canonical Wnt signaling. J Cell Sci. 127:1565–1575.
2014. View Article : Google Scholar : PubMed/NCBI
|
|
20
|
Capurro MI, Xiang YY, Lobe C and Filmus J:
Glypican-3 promotes the growth of hepatocellular carcinoma by
stimulating canonical Wnt signaling. Cancer Res. 65:6245–6254.
2005. View Article : Google Scholar : PubMed/NCBI
|
|
21
|
Yao M, Wang L, Dong Z, Qian Q, Shi Y, Yu
D, Wang S, Zheng W and Yao D: Glypican-3 as an emerging molecular
target for hepatocellular carcinoma gene therapy. Tumour Biol.
35:5857–5868. 2014. View Article : Google Scholar : PubMed/NCBI
|
|
22
|
Zhu Z, Hao X, Yan M, Yao M, Ge C, Gu J and
Li J: Cancer stem/progenitor cells are highly enriched in
CD133+CD44+ population in hepatocellular
carcinoma. Int J Cancer. 126:2067–2078. 2010. View Article : Google Scholar
|
|
23
|
Endo K and Terada T: Protein expression of
CD44 (standard and variant isoforms) in hepatocellular carcinoma:
Relationships with tumor grade, clinicopathologic parameters, p53
expression, and patient survival. J Hepatol. 32:78–84. 2000.
View Article : Google Scholar : PubMed/NCBI
|
|
24
|
Afify A, Purnell P and Nguyen L: Role of
CD44s and CD44v6 on human breast cancer cell adhesion, migration,
and invasion. Exp Mol Pathol. 86:95–100. 2009. View Article : Google Scholar : PubMed/NCBI
|
|
25
|
Xie Z, Choong PF, Poon LF, Zhou J, Khng J,
Jasinghe VJ, Palaniyandi S and Chen CS: Inhibition of CD44
expression in hepatocellular carcinoma cells enhances apoptosis,
chemosensitivity, and reduces tumorigenesis and invasion. Cancer
Chemother Pharmacol. 62:949–957. 2008. View Article : Google Scholar : PubMed/NCBI
|
|
26
|
Blaner WS, O'Byrne SM, Wongsiriroj N,
Kluwe J, D'Ambrosio DM, Jiang H, Schwabe RF, Hillman EM, Piantedosi
R and Libien J: Hepatic stellate cell lipid droplets: A specialized
lipid droplet for retinoid storage. Biochim Biophys Acta.
1791:467–473. 2009. View Article : Google Scholar :
|
|
27
|
Amann T, Bataille F, Spruss T, Mühlbauer
M, Gäbele E, Schölmerich J, Kiefer P, Bosserhoff AK and Hellerbrand
C: Activated hepatic stellate cells promote tumorigenicity of
hepatocellular carcinoma. Cancer Sci. 100:646–653. 2009. View Article : Google Scholar : PubMed/NCBI
|
|
28
|
Yu G, Jing Y, Kou X, Ye F, Gao L, Fan Q,
Yang Y, Zhao Q, Li R, Wu M, et al: Hepatic stellate cells secreted
hepatocyte growth factor contributes to the chemoresistance of
hepatocellular carcinoma. PLoS One. 8:e733122013. View Article : Google Scholar : PubMed/NCBI
|
|
29
|
Geng ZM, Li QH, Li WZ, Zheng JB and Shah
V: Activated human hepatic stellate cells promote growth of human
hepatocellular carcinoma in a subcutaneous xenograft nude mouse
model. Cell Biochem Biophys. 70:337–347. 2014. View Article : Google Scholar : PubMed/NCBI
|
|
30
|
Gao D, Vela I, Sboner A, Iaquinta PJ,
Karthaus WR, Gopalan A, Dowling C, Wanjala JN, Undvall EA, Arora
VK, et al: Organoid cultures derived from patients with advanced
prostate cancer. Cell. 159:176–187. 2014. View Article : Google Scholar : PubMed/NCBI
|
|
31
|
Liang Y, Shilagard T, Xiao SY, Snyder N,
Lau D, Cicalese L, Weiss H, Vargas G and Lemon SM: Visualizing
hepatitis C virus infections in human liver by two-photon
microscopy. Gastroenterology. 137:1448–1458. 2009. View Article : Google Scholar : PubMed/NCBI
|
|
32
|
Sachs N and Clevers H: Organoid cultures
for the analysis of cancer phenotypes. Curr Opin Genet Dev.
24:68–73. 2014. View Article : Google Scholar : PubMed/NCBI
|
|
33
|
Zittermann SI, Capurro MI, Shi W and
Filmus J: Soluble glypican 3 inhibits the growth of hepatocellular
carcinoma in vitro and in vivo. Int J Cancer. 126:1291–1301.
2010.
|
|
34
|
Sun CK, Chua MS, He J and So SK:
Suppression of glypican 3 inhibits growth of hepatocellular
carcinoma cells through up-regulation of TGF-β2. Neoplasia.
13:735–747. 2011. View Article : Google Scholar : PubMed/NCBI
|
|
35
|
Gao W, Kim H, Feng M, Phung Y, Xavier CP,
Rubin JS and Ho M: Inactivation of Wnt signaling by a human
antibody that recognizes the heparan sulfate chains of glypican-3
for liver cancer therapy. Hepatology. 60:576–587. 2014. View Article : Google Scholar : PubMed/NCBI
|
|
36
|
Liu S, Li Y, Chen W, Zheng P, Liu T, He W,
Zhang J and Zeng X: Silencing glypican-3 expression induces
apoptosis in human hepatocellular carcinoma cells. Biochem Biophys
Res Commun. 419:656–661. 2012. View Article : Google Scholar : PubMed/NCBI
|
|
37
|
Stock P, Brückner S, Ebensing S, Hempel M,
Dollinger MM and Christ B: The generation of hepatocytes from
mesenchymal stem cells and engraftment into murine liver. Nat
Protoc. 5:617–627. 2010. View Article : Google Scholar : PubMed/NCBI
|