Introduction
The childhood cancer neuroblastoma (NB) is a tumor
of the sympathetic nervous system. The patients show high degree of
clinical and biological heterogeneity ranging from patients with
highly aggressive tumors with fatal outcome, even after intense
multimodal treatment, to patients with spontaneous regression
despite metastatic disease. Tumors with whole chromosome gains or
losses and near triploid karyotypes generally have a good prognosis
while tumors with segmental rearrangements and near di- or
tetraploid karyotype are associated with a poor prognosis.
Consequently, analyses of chromosomal aberrations are an important
tool, that together with age at diagnosis, presence of metastases,
tumor differentiation and histological grade are used for patient
stratification and to determine therapeutic strategy (1). Recurrent genomic alterations with
clinical importance include loss of chromosome 1p, 3p, 4p, 11q,
gain of 1q, 2p, 17q and amplification of the MYCN oncogene
where 11q-deletion and MYCN-amplification both are strongly
associated with aggressive disease (2–4).
Different analysis techniques commonly used in clinical routine for
detection of segmental and numerical aberrations include
karyotyping, fluorescence in situ hybridization (FISH),
comparative genomic hybridization (CGH) microarrays or multiplex
ligation-dependent probe amplification (MLPA) (5,6).
However, cancer diagnostics is moving towards a paradigm with tests
that perform comprehensive characterization of genomic alterations
of individual tumors such as next generation sequencing (NGS) in
order to detect actionable targets. Depending on settings, NGS
could provide information of different sorts of therapeutically
relevant alterations such as single nucleotide variants, indels and
translocations. In addition, by analysis of the distribution of
read-depth between test tumor sample and normalization control, it
is possible to identify gains, losses, amplifications as well as
homozygous deletions (7–10). Thus, NGS provides an attractive
tool in clinical diagnostics of neuroblastoma, enabling
simultaneous assessment of copy number alterations alongside
detection of point mutations (e.g., activating mutations in the
ALK oncogene) that could be used to aid in choice of
therapy. In order to investigate the accuracy of genomic
alterations characterized from exome sequencing, exome data for 30
neuroblastoma tumors were compared with corresponding genomic
profiles generated from established Affymetrix high resolution
SNP-microarrays, the golden standard for copy number detection in
neuroblastoma in many laboratories.
Materials and methods
Samples and microarray analysis
The collection of tumors from Swedish patients were
performed after either written or verbal consent was obtained from
parents/guardians according to ethical permits approved by the
local ethics committee (Karolinska Institutet and Karolinska
University Hospital, registration number 03–736 and 2009/1369).
Clinical information is described in Table I. The tumors were histologically
assessed for tumor cell content using adjacent tissue and genomic
DNA was isolated from fresh frozen tumor or blood using DNeasy
blood and tissue kit (Qiagen, Hilden, Germany) according to the
manufacturer's protocol. DNA concentration and purity were assessed
through fluorometric analysis and absorbance measurements,
respectively.
 | Table IClinical data and sequencing
settings. |
Table I
Clinical data and sequencing
settings.
| Clinical
information | Sequencing
information |
|---|
|
|
|---|
| PatID | INSS | INRG | Outcome | Enrichment kit | Read length | Raw coverage |
|---|
| NBL12R6 | 4 | M | DOD | 50Mb V4 | 2×100 | 379 |
| NBL28R2 | 3 | L | NED | 50Mb V4 | 2×100 | 242 |
| NBL49R0 | 4 | M | AWD | 50Mb V4 | 2×100 | 321 |
| NBL9R9 | 3 | M | DOD | 50Mb V3 | 2×75 | 136 |
| NBL10R8 | 3 | L | DOD | 50Mb V3 | 2×75 | 128 |
| NBL46R6 | 4 | M | NA | 50Mb V3 | 2×75 | 129 |
| NBL15R8 | 3 | L | DOD | 50Mb V3 | 2×75 | 102 |
| NBL11E1 | 4 | M | NED | 50Mb V3 | 2×100 | 117 |
| NBL30R0 | 4 | M | NED | 50Mb V3 | 2×100 | 135 |
| NBL13R1 | 3 | L | DOD | 50Mb V3 | 2×100 | 90 |
| NBL11E8 | 1 | L | NED | 50Mb V3 | 2×100 | 62 |
| NBL44R5 | 1 | L | NED | 50Mb V3 | 2×100 | 100 |
| NBL12E3 | 4S | M | DOD | 50Mb V4 | 2×100 | 364 |
| NBL13E5 | 3 | L | DOD | 50Mb V4 | 2×100 | 338 |
| NBL13E6 | 3 | L | DOD | 50Mb V4 | 2×100 | 340 |
| NBL18E2 | 1 | L | NED | 50Mb V3 | 2×75 | 119 |
| NBL3E2 | 4 | M | DOD | 50Mb V3 | 2×75 | 120 |
| NBL4E1 | 4 | M | DOD | 50Mb V3 | 2×75 | 127 |
| NBL6E9 | 3 | L | DOD | 50Mb V3 | 2×75 | 156 |
| NBL11E4 | 4 | M | DOD | 50Mb V3 | 2×75 | 141 |
| NBL14R2 | 4S | M | DOD | 50Mb V4 | 2×100 | 122 |
| NBL19R6 | 1 | L | DOD | 50Mb V4 | 2×100 | 291 |
| NBL25R6 | 4 | M | DOD | 50Mb V3 | 2×100 | 99.8 |
| NBL28R8 | 4 | M | DOD | 50Mb V3 | 2×75 | 132 |
| NBL39R1 | 4 | M | NED | 50Mb V4 | 2×100 | 321 |
| NBL46R2 | 4 | M | AWD | 50Mb V4 | 2×100 | 362 |
| NBL47R4 | 4 | M | DOD | 50Mb V3 | 2×75 | 126 |
| NBL49R1 | 4 | M | AWD | 50Mb V3 | 2×75 | 101 |
| NBL50R1 | 4 | M | DOD | 50Mb V4 | 2×100 | 376 |
| NBL56R2 | 4 | M | AWD | 50Mb V4 | 2×100 | 240 |
Microarray analysis of 30 neuroblastoma tumors were
performed using either Affymetrix 50K, 250K gene mapping arrays or
CytoScan HD (Affymetrix Inc., Santa Clara, CA, USA) containing
59,015, 262,338 and 2,822,125 probes respectively (corresponding to
~50, 10 and 1 kb average probe spacing). Handling of the
microarrays has been described previously (2,11).
Primary data analysis was performed using GDAS software
(Affymetrix) with in silico normalization against control
samples from healthy individuals. Genomic position annotations were
based on the hg19 build (http://genome.ucsc.edu/) of the human genome.
Exome sequencing and CNV-analysis
Exome sequencing was performed on DNA from 30
neuroblastoma tumors and corresponding constitutional blood from 14
of these patients using Agilent SureSelect All Exon 50Mb V3 or V4
(Agilent, Santa Clara, CA, USA) according to the suppliers protocol
before performing pair-end sequencing (2×100 bp or 2×75 bp) on
Illumina HiSeq2000 or HiScan SQ (Illumina, San Diego, CA, USA). The
sequencing was performed at three separate occasions at SciLife
laboratory, Stockholm, Sweden and the Genomics Core facility at
University of Gothenburg, Sweden with a median raw coverage of 91X,
127X and 340X for each batch (Table
I). Reads were aligned against the reference genome (hg19)
using BWA-0.5.10 after fastq trimming with prinseq 0.20.3 prior
realignment and recalibration using GATK-2.5-.-gf57256b. Variant
calling were made through SNPeff followed by Annovar
annotation.
Copy number alterations were generated from the
bioinformatical tool Control-FREEC (control-FREE Copy Number
Caller) (10) using the normalized
distribution of aligned reads in window-by-window basis, in order
to determine differences in coverage between tumor and normal.
Neuroblastoma tumors were compared against either constitutional
DNA from blood from corresponding patient or from that of other
controls. The ratios generated with Control-FREEC were visualized
using the statistical software R. We constructed a web-based Shiny
application (12) that runs with R
in the background. The Shiny application for visualizing
Control-FREEC profiles is available at https://malinost.shinyapps.io/CNPupload, and the
source code at https://gist.github.com/malinost/324f77309eb103147747.
The application imports the ratios from an uploaded Control-FREEC
output file, and visualizes the results either chromosome by
chromosome, or for the whole genome in one figure. In the single
chromosome mode the values can also be colored according to e.g.,
copy number or genotype. In order to detect segmental changes and
breakpoints we need to extract segmental averages and detect the
jumps that correspond to gains or losses, this is done by applying
the Fused Lasso Signal Approximator (FLSA) (13) to the ratios. With different
settings we can adjust how much the variations in the ratios affect
the FLSA lines. In the whole genome setting ratios are plotted with
different colors for different chromosomes in proportion to
chromosome size. Results of CNV detection from exome sequencing
were compared to SNP-microarray through visual annotation in order
to determine the performance of respective platform.
Results
Ratio profiles of tumor-control read coverage were
generated using Control-FREEC and visualized with the Shiny
application. Break points for structural rearrangements were
recorded through FREEC and the plotted profiles were compared to
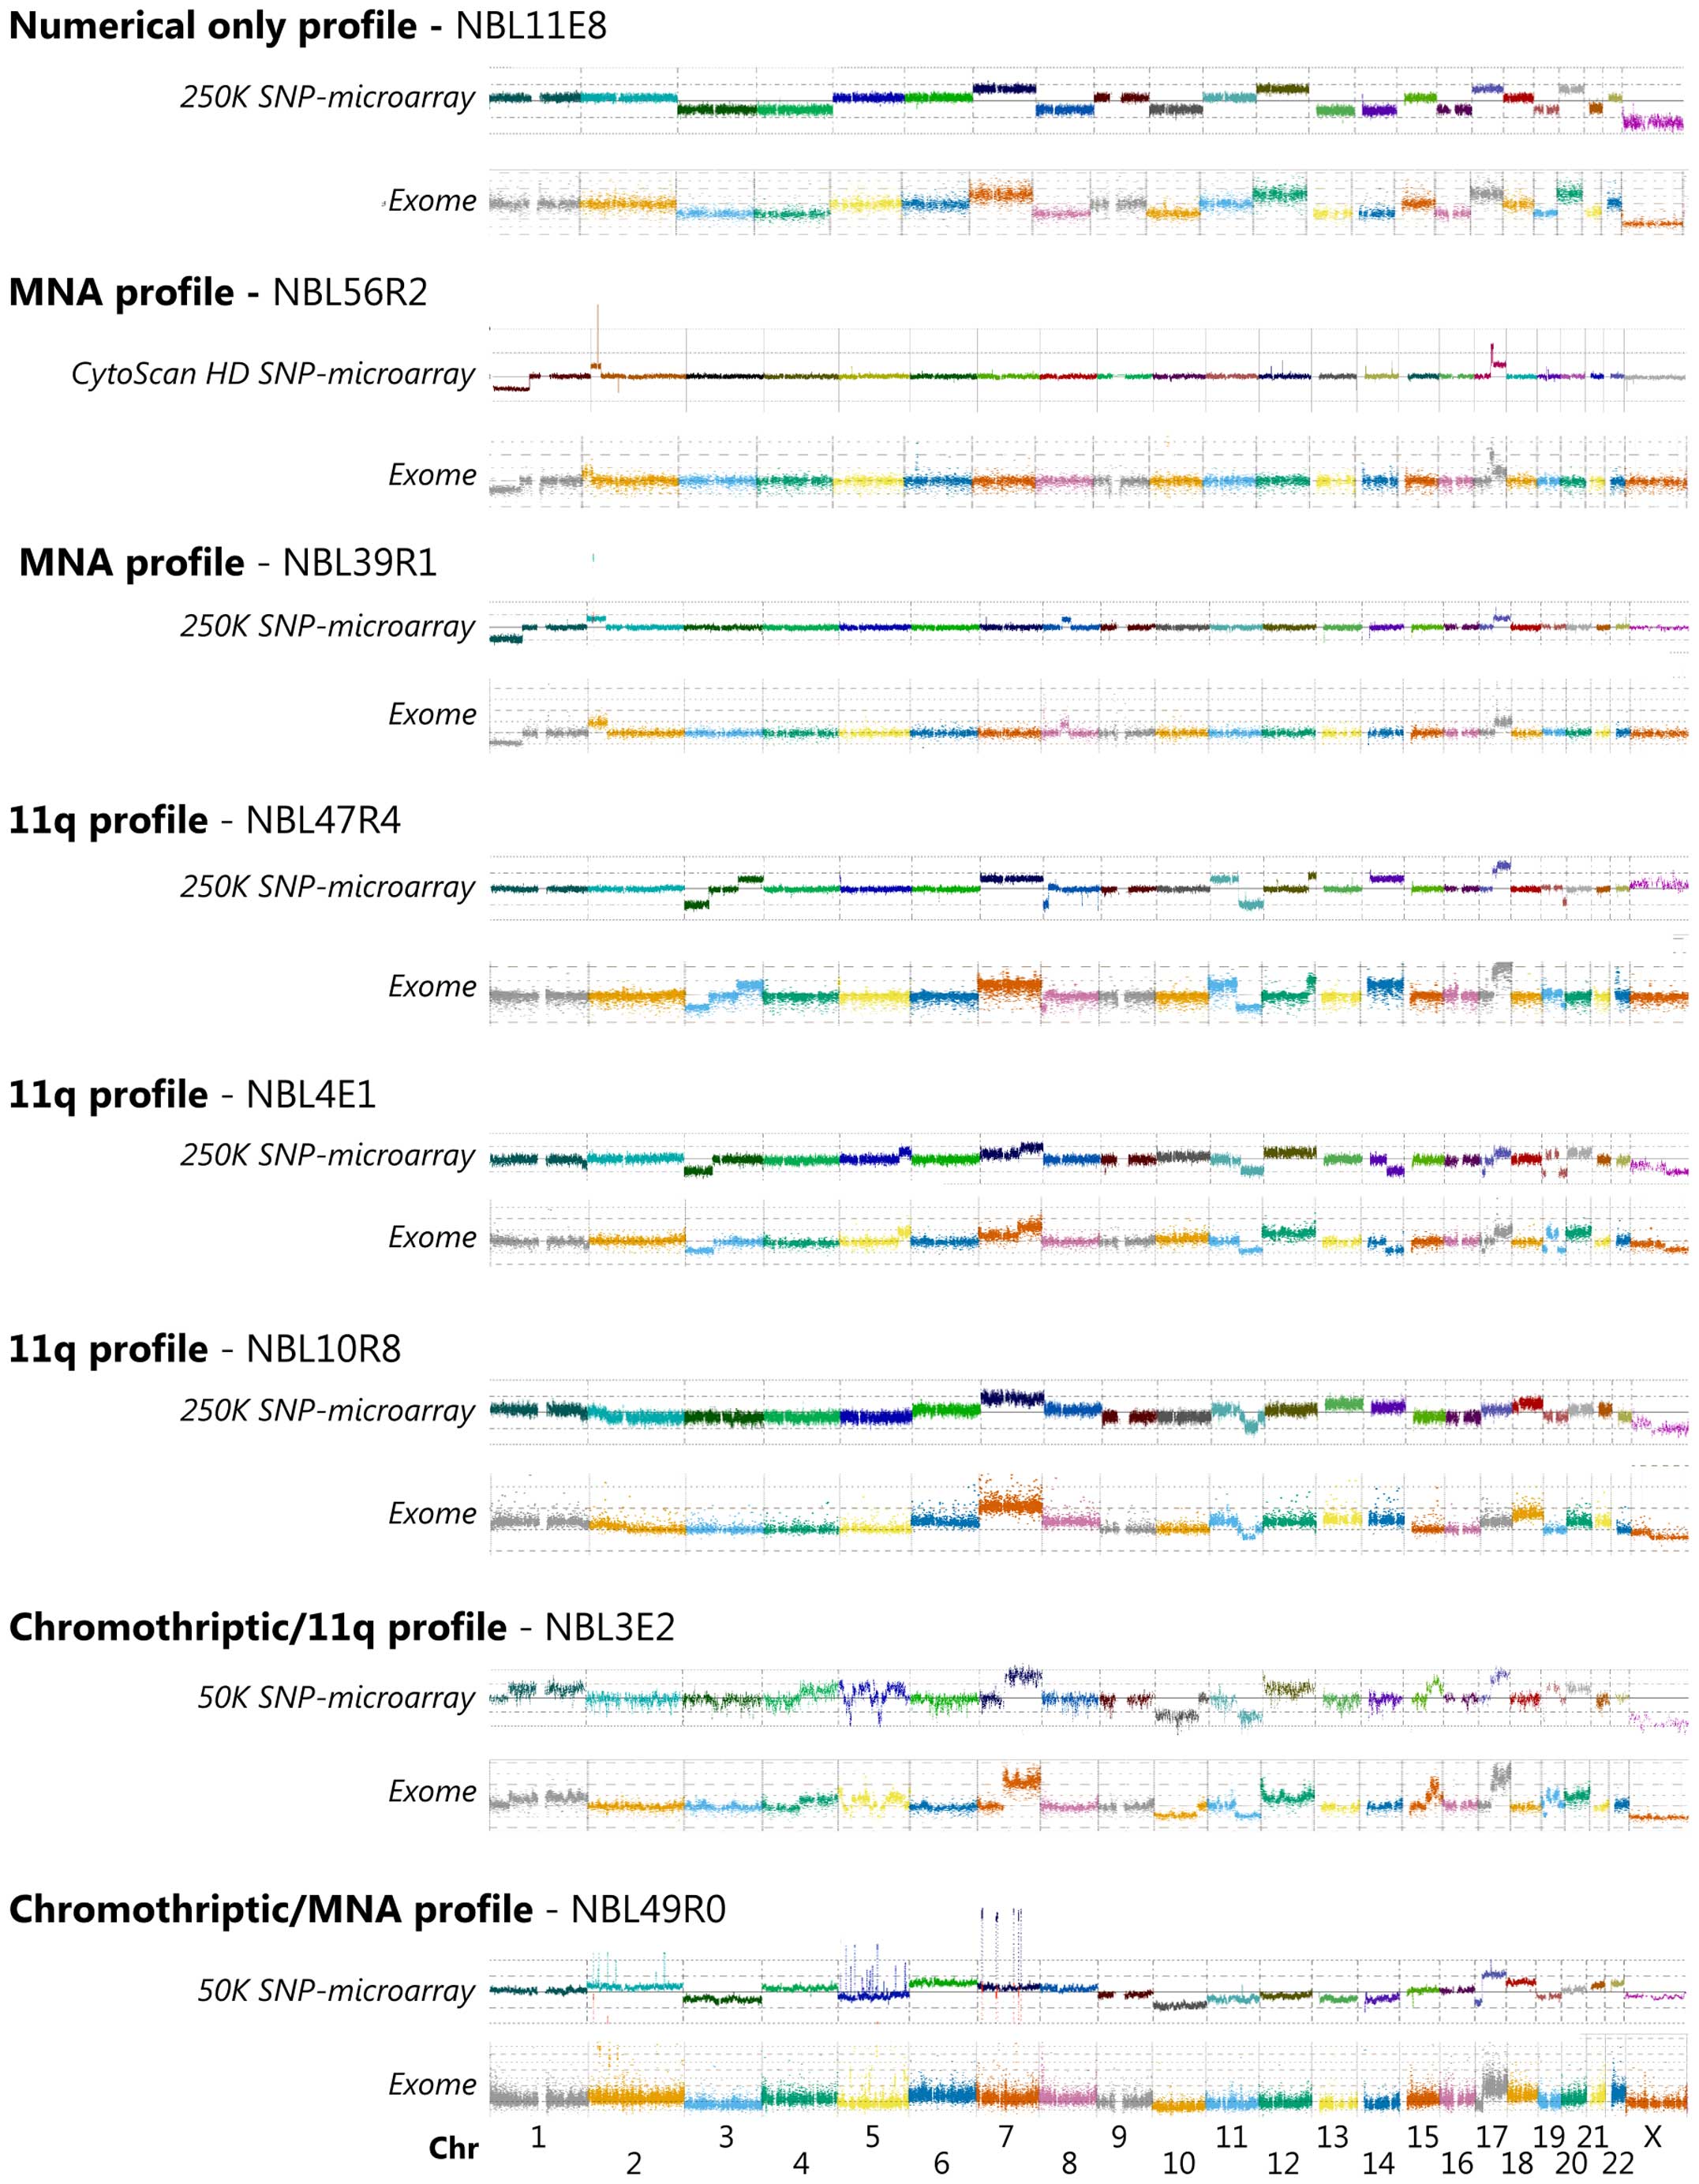
profiles generated from SNP microarrays. Visual annotation shows
that the two different methods have high degree of concordance
regarding larger alterations (Fig.
1). Both platforms detected a significant number of imbalances
including gains, amplification, deletion and homozygous deletions,
as well as whole chromosome gains and losses in the thirty analyzed
tumor samples. The genomic positions recorded for copy number
changes shows close consistency between exome generated profiles
and SNP-microarray profiles (Fig.
1), commonly separated with <1 Mb. Among the four deviations
recorded when comparing copy number variation generated from
SNP-microarray and exome sequencing analysis, two were located in
the ATRX gene where sample NBL28R8 and NBL10R8 showed loss of exon
3–8 and exon 1–15, respectively and one were located at chromosome
19: 42.75–44.93 Mb from p-terminal end (pter) in sample NBL13E6
(Table II). However, probe
density in these regions is low in the 50k and 250K arrays and
thus, the smaller deletions detected through coverage read plots
are below the resolution of the arrays used in this study. One
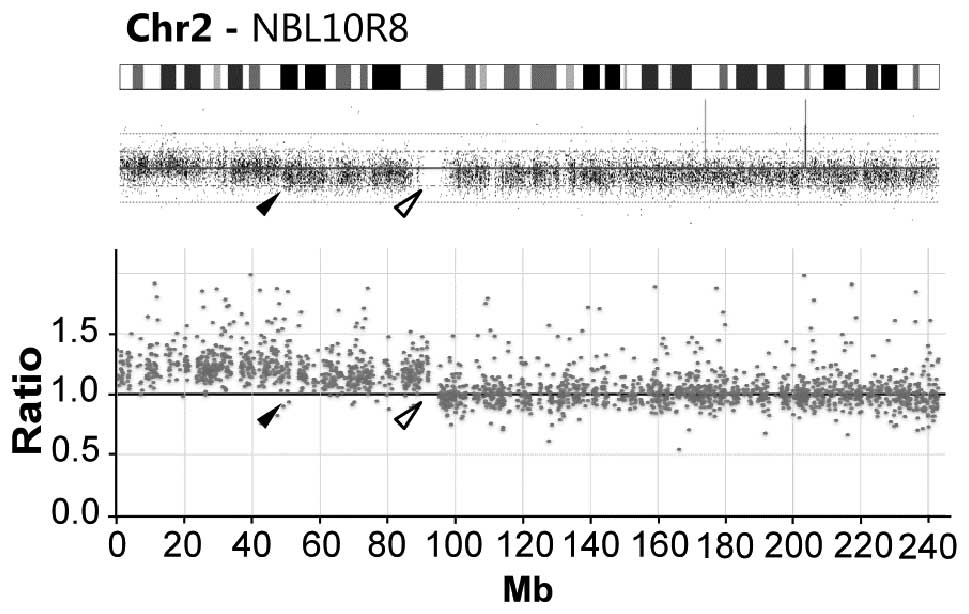
additional deviation between the two methods was seen for sample
NBL10R8 where copy number profiling through exome and
SNP-microarray analysis both indicates 2p-gain. Intriguingly, the
two methods show highly different 2p gain breakpoint; exome
analysis show gain of the entire chromosome 2p arm (92.2 Mb from
pter) while microarrays show a gain ending at 48.2 Mb from pter
(Fig. 2).
| Table IISummary of findings. |
Table II
Summary of findings.
| Sample | Segmental
alterations | Numerical
alterations | With possible
clinical relevance | Rearrangement | Comment |
|---|
| NBL12R6 | Chr1:pter-38.40
Mb/Loss; Chr1:38.45–40.25 Mb fr pter/Gain; Chr1:242.32
Mb-qter/Gain; Chr2: pter-15.73 Mb/Gain, 15.73–17.08 Mb fr
pter/Amplification (DDX, MYCNOS, MYCN, FAM49A);
Chr2:17.08–39.75 Mb fr pter/Gain; Chr2:29.75–30.70 Mb fr
pter/X-gain (ALK); Chr6: 157.35
Mb-qter/Gain;Chr7:pter-127.85 Mb/Gain; Chr11:84.85–87.00 Mb fr
pter/Loss; Chr15: 33.35 Mb-qter/Loss | wcl5, wcl9 wcl10,
wcg13, wcl14, wcg17, wcg18, wclX | MYCN-amp,
ALK F1174L, | Chr2:15.73 Mb
joined with 17.08 Mb, Chr2:15.74 Mb joined with 16.14 Mb | |
| NBL28R2 | Chr1:pter-51.35
Mb/Loss; Chr2:7.5–15.30 Mb fr pter/Loss; Chr2:15.30–16.08 Mb fr
pter/Gain; Chr2:16.08–17.38 Mb fr pter/Amplification (MYCNOS,
MYCN, FAM49A); Chr2:17.38–17.85 Mb fr pter/Gain;
Chr2:17.85–21.50 Mb fr pter/Loss; Chr2:95.45–101.70 Mb fr
pter/Loss; Chr17;34.8 Mb-qter/Gain; Chr19:pter-11.00 Mb/Loss | |
MYCN-amp | | Microarray:
chr2:17.8–21.5 Mb fr pter/Loss. Exome: few data points between
21.5–23.6 Mb fr pter |
| NBL49R0 |
Chr2:pter-qter/chromothriptic
amplification including: Chr2:15.96–16.62 Mb fr pter/Amplification
(MYCNOS, MYCN);Chr2:31.28–31.34 Mb fr pter/Amplification
(partial GALNT14); Chr2:53.80–54.12 Mb fr pter/Gain;
Chr2:74,00–74,23 fr pter/Gain; Chr2:174.92–174.99 Mb fr pter/Gain;
Chr5:pter-qter/chromothripric amplification including TERT
(1.20–1.29 Mb); Chr7:11.00–12.88 Mb fr pter/Amplication (PHF14,
THSD7A, TMEM106B, VWDE, SCIN, ARL4A); Chr7:47.78–50.60 Mb fr
pter/Amplification (LINC00525, PKD1L1, HUS1, SUN3, C7ORF57,
UPP1, ABCA13, CDC14C, VWC2, ZPBP, C7orf72, IKZF1, GIGNL1,
partial DDC); Chr7:92.22–92.68 Mb fr pter/Amplification
(CDK6); Chr7:103.71–105.22 Mb fr pter/Amplification
(ORC5, LHFPL3, NR_024586, KMT2E, SRPK2, PUS7, RINT1,
EFCAB10), Chr7:110.43–111.27 Mb fr pter/Amplification (partial
IMMP2L); Chr17:pter-19.10 Mb/Loss; Chr17:19.10
Mb-qter/Gain | wcl3, wcg6, wcl10,
wcl11, wcl13, wcl14, wcg18, wcl19, wcg21, wcg22 | MYCN-amp,
CDK6-amp, TERT-amp | Chr2:16.62 Mb
joined with 31.34 Mb; Chr2:15.96 Mb joined with 31.28 Mb; Chr7:
11.00 Mb joined with 103.71 Mb, Chr7:12.88 Mb joined with 92.68 Mb;
Chr7: 50.62 Mb joined with 105.22 Mb, Chr7: 111.27 Mb joined with
92.22 Mb | |
| NBL9R9 | Chr1:pter-26.35
Mb/Loss; Chr1:153.30 Mb-qter/Gain; Chr3:pter-64.53 Mb/Loss;
Chr3:29.75–29.90 Mb fr pter/homozygous deletion (partial
RBMS3), Chr5:pter-1.3 Mb/Gain, Chr5:145.55–158.40 Mb fr
pter/Loss; Chr6:pter-24.70 Mb/Gain; Chr6:114.10 Mb-qter/Loss,
Chr6:128,45-qter/xLoss; Chr7:ptel-25.70 Mb/Gain; Chr7:101.10
Mb-qter/Gain; Chr11:73.10 Mb-qter/Loss; Chr12:108.90 Mb-qter/Gain;
Chr14:61.60–66.20 Mb fr pter/Loss; Chr16:pter-17.99 Mb/Loss;
Chr17:46.00 Mb-qter/Gain;Chr21:42.69 Mb-qter/Gain | | 11q-del, ALK
F1245L, TERT-gain | | |
| NBL10R8 | Chr1:231.30
Mb-qter/Loss; Chr2:pter-92.10 Mb/Gain; Chr11:pter-70.65 Mb/Gain;
Chr11:83.20–115.35 Mb fr pter/Loss; Chr18:15,40-qter/Gain;
ChrX:46.70 Mb-qter/Loss:ChrX:76.90–77.10 Mb fr pter/Homozygous
deletion (ATRX) | wcl3, wcl4, wcl5,
wcg7, wcl9, wcl10, wcg13, wcl15, wcl16, wcl19, wcl22 | 11q-del,
ATRX-del, TENM1 I2152L | | Microarray:
chr2:pter-48.2 Mb fr pter/Gain. Likely due to tumor heterogeneity.
Microarray:ATRX deletion not detected. Likely due to low probe
coverage over region or tumor heterogeneity |
| NBL46R6 | Chr4:pter-39.65
Mb/Loss; Chr11:pter-72.75 Mb/Gain; Chr11:72.75 Mb-qter/Loss;
Chr17:38.90 Mb-qter/Gain | wcg7, wcl10,
wcg12 | 11q-del, CHEK2
T146fs (germline) | | |
| NBL15R8 | Chr1:pter-38.50
Mb/Loss; Chr2:pter-55.15 Mb/Gain; Chr4:pter-27.20 Mb/Loss;
Chr6:pter-30.20 Mb/Gain; Chr7:75.10 Mb-qter/Gain; Chr11:66.99–70.15
Mb fr pter/Gain (incl CCND1); Chr11: 70.15–118.2 Mb fr
pter/Loss; Chr11:118.2–119.0 Mb fr pter/Gain; Chr11:
119.0-qter/Loss; Chr16:pter-23.55 Mb/Gain; Chr17:40.94
Mb-qter/Gain; Chr19:pter-15.40 Mb/Loss | | 11q-del,
CCND1-gain | | |
| NBL11E1 | Chr2:pter-29.75
Mb/Gain (inkl partial ALK); Chr3:pter-54.30 Mb/Loss;
Chr3:54.3–136.6 Mb fr pter/Gain; Chr7:96.30 Mb-qter/Gain:,
Chr11:71.65 Mb-qter/Loss; Chr15:40.35–45.95 Mb fr pter/Loss;
Chr17:36.35 Mb-qter/Gain; Chr17:41,28-qter/xGain; Chr22:pter-27.7
Mb/Gain; Chr22:28.1 Mb-qter/Loss | |
ALK-translocation | | |
| NBL30R0 | Chr1:145.2
Mb-qter/Gain; Chr2:pter-88.18 Mb/Gain; Chr7:pter-108.50 Mb/Gain;
Chr11:84.95 Mb-qter/Loss | wcg6, wcg17, wcg18,
wcg19, wgc22, wclX | 11q-del, ALK
R1275Q | | Microarray:
chr7:pter-109.6 Mb fr pter/Gain. Exome: few data points between
108.5–110.3 Mb fr pter |
| NBL13R1 | Chr1:pter-98.35
Mb/Loss; Chr2:15.65–16.70 Mb fr pter/Amp (partial NBAS, DDX,
MYCNOS, MYCN); Chr4:pter-15.75 Mb/Loss; Chr7:98.00
Mb-qter/Gain; Chr17:44.80 Mb-qter/Gain; Chr17:57.90 Mb-qter/xGain;
Chr19:41.50 Mb-qter/Loss | | MYCN-amp,
CSMD1 E1766K | Chr2:15.65 Mb
joined with 16.70 Mb | |
| NBL11E8 | | wcl3, wcl4, wcg7,
wcl8, wcl10, wcg12, wcl13, wcl14, wcl16, wcg17, wcll19, wcg20,
wcl21, wclX | RETSAT R590Q | | |
| NBL44R5 | | wcg2, wcg6, wcg7,
wcg8, wcl9, wcg12, wcg17, wcg18 wcg20, wcl21, wcg22 | ALK F1174L | | |
| NBL50R1 | Chr1:pter-66.80
Mb/Loss; Chr1:178.2 Mb-qter/Gain; Chr2:pter-44.6 Mb/Gain;
Chr2:15.95–16.82 Mb fr pter/Amplification (MYCNOS, MYCN,
partial FAM49A); Chr2:166.20–168.10 Mb fr pter/Gain;
Chr3:25.20–51.95 Mb fr pter/Loss; Chr3:135.7-qter/Gain;Chr4:
pter-27.75 Mb/Loss; Chr7:77.55–151.25 Mb fr pter/Gain; Chr7:151.25
Mb-qter/Loss; Chr9:21.75–22.05 Mb fr pter/Loss (CDKN2A,
partial CDKN2B-AS1); Chr17:pter-1.77 Mb/Loss; Chr17:38.90
Mb-qter/Gain; Chr17:63.60–66.85 Mb fr pter/xGain; Chr20:55.90
Mb-qter/Gain | | MYCN-amp,
CDKN2A-del, ALK F1174L, PTEN FG282R | Chr2:15.95 Mb
joined with 16.82 Mb | Microarray:
chr17:38.9–69.4 Mb fr pter/xGain; chr17:69.4 Mb-qter/Gain. Exome:
few data points between 68.15–70.0 Mb fr pter |
| NBL12E3 | Chr1:pter-98.50
Mb/Loss;Chr2:pter-38.95 Mb/Gain, Chr2:16.03–16.39 Mb fr
pter/Amplification (MYCNOS, MYCN); Chr3:pter-5.30 Mb/Loss;
Chr17:46.90 Mb-qter/Gain; Chr19:43,34–43,53/Loss | |
MYCN-amp | Chr2:16.03 Mb
joined with 16.39 Mb | |
| NBL49R1 | Chr1:142.1
Mb-qter/Gain; Chr2:232.95 Mb-qter/Gain; Chr4:pter-25.90 Mb/Loss;
Chr4:186.90 Mb-qter/Loss;Chr7:76.10–76.60 Mb fr pter/Loss;
Chr7:86.35 Mb-qter/Gain;Chr11;pter-2.44 Mb/Gain; Chr11:2.44–3.25 Mb
fr pter/Loss; Chr11:3.25–36.65 Mb/Gain; Chr11:65.80–71.60 Mb fr
pter/Gain; Chr11:71.65 Mb-qter/Loss;Chr17:34.45 Mb-qter/Gain | | 11q-del, TENM3
R925C | | Microarray:
chr11:3.25–39.9 Mb fr pter/Gain. Exome: few data points between
36.65–43.3 Mb fr pter |
| NBL13E5 | Chr2:15.92–16.40 Mb
fr pter/Amplification (MYCNOS, MYCN); Chr2:27.14–28.43 Mb fr
pter/Gain; Chr2: 29.28–30.25 Mb fr pter/Amplification
(ALK);Chr2:33.41–33.98 Mb fr pter/Gain; Chr2:95.62
Mb-qter/Gain; Chr17:40.55 Mb-qter/Gain | | MYCN-amp,
ALK-amp | Chr2:16.40 Mb
joined with 30.25 Mb | |
| NBL28R8 | Chr3:pter-50.88
Mb/Loss; Chr4:2.45–49.05 Mb fr peter/Loss, Chr6:pter-58.22 Mb/Gain;
Chr7: 87.90 Mb-qter/Gain; Chr10:pter-33.55 Mb/Loss;
Chr11;57.05–71.64 Mb fr pter/Gain; Chr11: 71.64 Mb-qter/Loss;
Chr17:41.45 Mb-qter/Gain; Chr18:72.15 Mb-qter/Loss;
Chr22:40.95–47.99 Mb fr pter/Loss; ChrX:76.94–76.96 Mb fr pter/Loss
(ATRX) | | 11q-del,
ATRX-del | ChrX:76.94 Mb
joined with 76.96 Mb | Microarray: ATRX
deletion not detected. Likely due to low probe coverage over
region |
| NBL4E1 | Chr1:236.25
Mb-qter/Loss; Chr3:pter-71.55 Mb/Loss; Chr5:149.20 Mb-qter/Gain;
Chr7:99.70 Mb-qter/Gain; Chr11:76.50 Mb-qter/Loss; Chr14:62.45
Mb-qter/Loss; Chr17:5.95–12.90 Mb fr pter/Loss; Chr17;37.60
Mb-qter/Gain; Chr19:pter-10.85 Mb/Loss; Chr19:38.65 Mb-qter/Loss;
Chr19: 42.7–43.0 Mb fr pter/Homozygous loss (DEDD2, ZNF526,
GSK3A, ERF, CIC, PAFAH1B2, PRR19, TMEM145, MEGF8, CNFN, LIPE-AS1,
LIPE, CXCL17); ChrX:89.15 Mb-qter/Loss | wcg12, wcg20 | 11q-del | | |
| NBL13E6 | Chr1:pter-112.50
Mb/Loss; Chr2:15.43–17.96 Mb fr pter/Amplification (partial
NBAS, DDX1, MYCNOS, MYCN, FAM49A, RAD51AP2, SMC6, partial
GEN1);Chr3:98.30 Mb-qter/Gain; Chr9:pter-22.50 Mb/Loss;
Chr9:21.80–21.95 Mb fr pter/Homozygous loss (MTAP, CDKN2A);
Chr11:110.10 Mb-qter/Loss; Chr13:27.60 Mb-qter/Gain; Chr17:56.65
Mb-qter/Gain; Chr19:36.45–48.15 Mb fr pter/Loss; Chr19:42.75–42.93
Mb fr pter/Homozygous loss (ERF, CIC, PAFAH1B2, PRR19, TMEM145,
MEGF8, CNFN, LIPE-AS1, LIPE) | | MYCN-amp,
CDKN2A-del | Chr2:15.43 Mb
joined with 17.96 Mb; Chr19:42.75 Mb joined with 42.93 Mb | Microarray: 19q
deletion not detected. Likely due to low probe coverage over
region |
| NBL14R2 | Chr1:pter-45.40
Mb/Loss; Chr2:pter-10.70 Mb/Gain; Chr2:2.88–3.14 Mb fr
pter/Amplification; Chr2:14.88–15.09 Mb fr pter/Amplification;
Chr2:15.58–16.38 Mb fr pter/Amplification (partial NBAS, DDX1,
MYCNOS, MYCN); Chr3:pter-28.60 Mb/Loss;Chr8:113.20
Mb-qter/Loss; Chr12:83.05 Mb-qter/Gain; Chr17:28.95 Mb-qter/Gain;
Chr19:38.75 Mb-qter/Loss; Chr22:29.80 Mb-qter/Gain | |
MYCN-amp | Chr2:14.88 Mb
joined with 3.14 Mb | 50K Microarray |
| NBL19R6 | Chr1:pter-85.40
Mb/Loss; Chr1:178.00–193.20 Mb/Loss; Chr2:15,68–15.91
Mb/Amplification (partial NBAS, DDX1); Chr2:15.960–15.965 Mb
fr pter/Amplification Chr2:16.04–17.10 Mb fr pter/Amplification
(MYCNOS, MYCN, FAM49A); Chr2:17.13–17.33 Mb fr
pter/Amplification; Chr7:pter-48.30 Mb/Gain; Chr17:38.90
Mb-qter/Gain | |
MYCN-amp | Chr2:17.10 Mb
joined with 15.960 Mb; Chr2:15.91 Mb; joined with 15.965 Mb
Chr2:16.04 Mb joined with 17.13 Mb | 50K Microarray |
| NBL3E2 | Chr1:51.50–247.90
Mb fr pter/Gain; Chr1:247.95–248.55 Mb fr pter/Loss; Chr1:248.60
Mb-qter/Gain; Chr4:95.10 Mb-qter/Gain;Chr5:pter-10.7 Mb/Gain;
Chr5:30.7–32.4 Mb fr pter/Loss; Chr5:34.8–79.12 Mb fr pter/Gain;
Chr5:99.86–108.2 Mb fr pter/Loss; Chr5:121.6–168.2 Mb fr pter/Gain;
Chr5:179.6 Mb-qter/Gain; Chr7:65.55 Mb-qter/Gain; Chr10:pter-108.40
Mb/Loss; Chr11:70.30 Mb-qter/loss; Chr12:3.75 Mb-qter/Gain;
Chr12:pter-3.75 Mb/xGain; Chr15:60.2 Mb-qter/Gain;
Chr15:73.75–91.45 Mb fr pter/xGain; Chr17:32.55 Mb-qter/Gain;
Chr17:39.60 Mb-qter/xGain; Chr19: 6.30–13.85 Mb fr pter/Loss;
Chr19:13.90–43.30 Mb fr pter/Gain | wcg20 | 11q-del | | 50K Microarray |
| NBL39R1 | Chr1:pter-83.90
Mb/Loss; Chr2:pter-48.10 Mb/Gain; Chr2:15.78–16.73 Mb fr
pter/Amplification (DDX1 MYCNOS, MYCN, partial
FAM49A); Chr8:48.85–69.70 Mb fr pter/Gain; Chr9:21.50–22.00
Mb fr pter/Loss (CDKN2A); Chr17:38.52 Mb-qter/Gain | | MYCN-amp,
CDKN2A-del | Chr2:16.73 Mb
joined with 15.78 Mb | |
| NBL6E9 | Chr1:pter-28.85
Mb/Loss; Chr4:85.10 Mb-qter/Gain; Chr6:pter-22.2 Mb/Loss;
Chr7:pter-90.15 Mb/Gain; Chr7:90.15 Mb-qter/xGain; Chr8:pter-8.9
Mb/Loss; Chr9:20.70–37.85 Mb fr pter/Loss; Chr11:71.15
Mb-qter/Loss; Chr12:110.75 Mb-qter/Gain; Chr17:pter-4.45 Mb/Gain;
Chr17:45.65 Mb-qter/Gain; Chr19:15.20 Mb-qter/Loss;
Chr19:42.65–43.60 Mb fr pter/homozygous loss (DEDD2, ZNF526,
GSK3A, ERF, CIC, PAFAH1B2, PRR19, TMEM145, MEGF8, CNFN, LIPE-AS1,
LIPE, CXCL17, PSG3, PSG8, PSG10P, PSG1, PSG6, PSG7, PSG2);
Chr22:32.96–36.65 Mb fr pter/Gain | wcg18 | 11q-del | | |
| NBL18E2 | Chr11:64.45–69.60
Mb fr pter/Gain; Chr11:78.05 Mb-qter/Loss;Chr14:89.10 Mb-qter/Loss;
Chr17:28.65 Mb-qter/Gain; Chr17:37.15 Mb-qter/xGain;
Chr19:pter-15.35 Mb/Loss | wcg7, wcg12, wcg18,
wcl21 | | | |
| NBL47R4 | Chr3:pter-61.70
Mb/Loss; Chr3:133.30 Mb-qter/Gain; Chr5:pter-1.25 Mb/Gain;
Chr8:pter-13.25 Mb/Loss; Chr8:97.50–98.15 Mb fr pter/Loss;
Chr11:pter-71.20 Mb/Gain; Chr11:71.25 Mb-qter/Loss; Chr12: 114.35
Mb-qter/Gain; Chr17:34.45 Mb-qter/Gain; Chr17:46.55 Mb-qter/xGain;
Chr19:48.85 Mb-qter/Loss | wcg7, wcg14 | | | |
| NBL46R2 | Chr1:pter-98.85
Mb/Loss; Chr1:181.45–208.35 Mb fr pter/gain; Chr2:10.40–10.58 Mb fr
pter/Amplification (HPCAL1); Chr2:15.95–16.81 Mb fr
pter/Amplification (MYCNOS, MYCN, partial FAM49A);
Chr9:70.30 Mb-qter/Gain; Chr17:43.40 Mb-qter/Gain; Chr20:pter-8.00
Mb/Gain | |
MYCN-amp | Chr2:10.40 Mb
joined with 16.81 Mb; Chr2:10.58 Mb joined with 15.95 Mb | |
| NBL25R6 | Chr1:pter-118.1
Mb/Loss;Chr2:pter-8.8 Mb/Gain: Chr2:15.05–16.45 Mb fr
pter/Amplification (NBAS, DDX1, MYCNOS, MYCN);
Chr2:20.05–65.43 Mb fr pter/Gain; Chr17:37,12-qter/Gain;
Chr18:67,94-qter/Loss | |
MYCN-amp | | |
| NBL11E4 | Chr2:9,10–58.32 Mb
fr pter/Gain; Chr4:pter-19.5 Mb/Loss; Chr5:148.5 Mb-qter/Gain;
Chr9:pter-28.86 Mb/Loss; Chr11:71.57 Mb-qter/Loss;Chr12:69.13
Mb-qter/Gain; Chr15:31.83–54.93 Mb fr pter/Loss;
Chr17:2664-qter/Gain | wcg18 | 11q-del | | Microarray:
chr9:pter-31.3 Mb fr pter/Loss. Exome: few data points between
28.86–32.4 Mb fr pter |
| NBL56R2 | Chr1:pter-92.85
Mb/Loss; Chr2:pter-15.50 Mb/Gain; Chr2:15.52–18.21 Mb fr
pter/Amplification (partial NBAS, DDX1, MYCNOS, MYCN, FAM49A,
RAD51AP2, VSNL2, SMC6, GEN1, MSGN1, KCNS3); Chr2:18.24–25.65 Mb
fr pter/Gain; Chr13: 114.15 Mb/Loss; Chr17:41 45–48.05 Mb fr
pter/xGain; Chr17:48.05 Mb-pter/Gain | |
MYCN-amp, | Chr2:15.52 Mb
joined with 18.21 Mb | CytoScan HD
microarray |
Additional aberrations of specific interest included
one tumor showing chromothriptic features of chromosome 2, 5 and 7
causing amplification of MYCN, TERT and CDK6 and
three tumors showing loss of CDKN2A (Fig. 1).
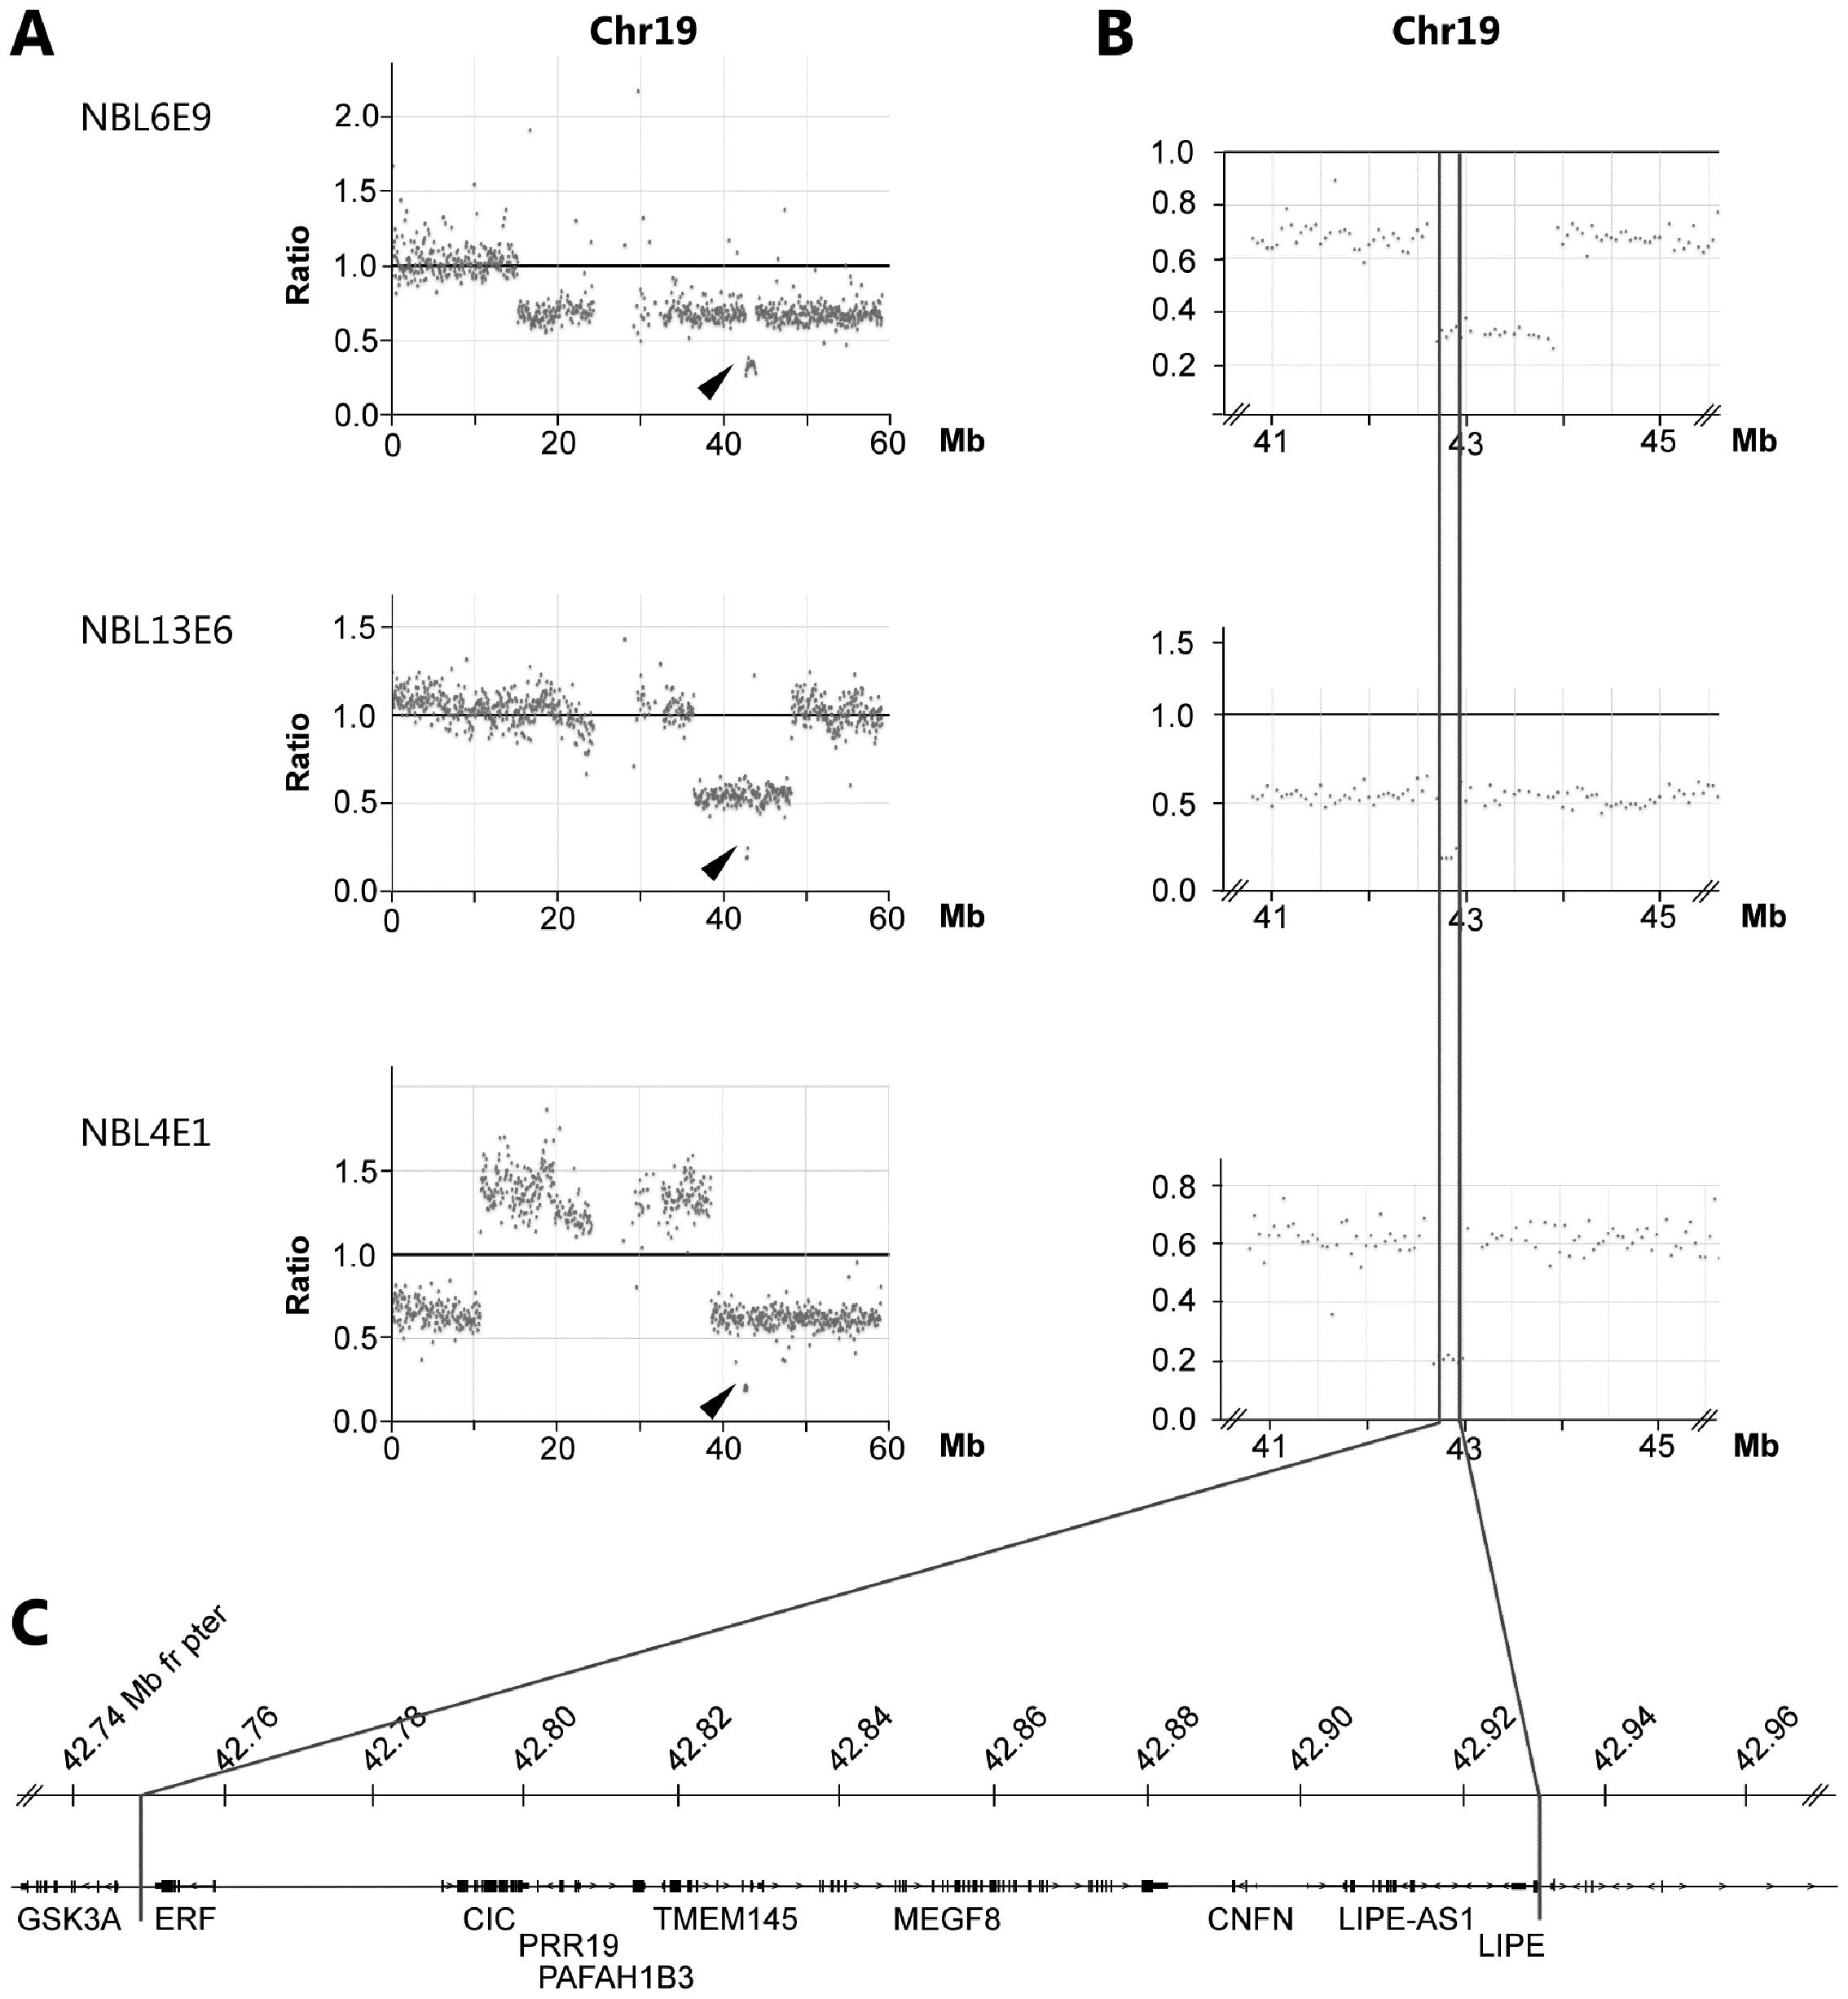
Through the copy number analysis of exome sequencing
we observed that three tumors (NBL4E1, NBL6E9 and NBL13E6) carried
smaller deletions causing homozygous loss in chromosomal region
19q13.2. The shortest region of overlap (SRO) of deletions are
delimitated by sample NBL13E6 showing loss of
chr19:42,749,732–42,931,020 containing the genes ERF, CIC,
PAFAH1B2, PRR19, TMEM145, MEGF8, CNFN, LIPE-AS1 and LIPE
(Fig. 3 and Table I). A minor heterozygous deletion
was observed in sample NBL12E3 also at 19q13.2 albeit distally
(43.34–43.53 Mb from pter) relative the three samples with
homozygous loss at 19q. Of the genes located within the region
delimitated by sample NBL16E9, rare variants (e.g. not present in
1,000 genome database, exome variant server or our in house
database) were detected in MEGF8 (p.P195L, NBL13E5) and in
LIPE (p.G627S, NBL47R4; p.A351V, NBL19R6). All three
variants were predicted by SIFT to be non-deleterious.
Tumor specific alterations, such as rearrangements
could be used to monitoring residual disease and treatment
response. Although MYCN amplification is common in
neuroblastoma, the exact start and end-points of amplicons are
unique for each patient and thus requires precise characterization
of each tumor. Exome sequencing shows that neuroblastoma samples
NBL14R2, NBL13E5 and NBL19R6 display complex amplicon structures
consisting of multiple 2p-regions in addition to the genomic region
containing the MYCN gene; NBL14R2: 2.88–3.14 Mb, 14.88–15.09
Mb and 15.58–16.38 Mb from pter; NBL13E5: 15.92–16.40 Mb and
29.28–30.25 Mb from pter; NBL19R6: 15.68–15.91 Mb, 15.960–15.965
Mb, 16.04–17.10 Mb and 17.13–17.33 Mb from pter. The breakpoints
provide several tumor and patient specific junction sites useful
for analyses of minimal residual disease follow-up. The high-level
amplification seen in MYCN-amplified tumors produces a great
amount of off-target reads within the amplified regions that can be
used to deduct specific breakpoints and fusions. From the exome
sequencing data we were able to retrieve at least one unique
junction site for 12 of 14 NB tumors (86%) with
MYCN-amplification. We could also identify unique junction
sites due to deletions in two patients: NBL28R8 with a deletion in
ATRX located at the X-chromosome where 76.94 Mb joined 76.96
Mb and NBL13E6 with a small interstitial chromosome 19 deletion
fusing position 42.75 Mb with 42.93 Mb.
Discussion
Next generation sequencing has recently entered
clinical practice in evaluation of cancer development and
progression. This ranges from use of targeted cancer gene panels to
whole genome sequencing. In neuroblastoma there are few recurrent
mutations in well-established cancer genes besides ALK
(14–17) and thus, other approaches beyond
cancer gene panels is required for exploring the mutational
landscape. Although sequencing at the whole genome level is
reaching affordable levels for clinical utility, the bioinformatic
handling and data storage is still a bottleneck for many
laboratories. Thus, exome sequencing provides an attractive
approach for identification of protein changing mutations for
theranostic purposes in neuroblastoma. In this context it is also
important to note that the cost of exome sequencing has dropped
dramatically in the last five years.
The ability to use exome data for detection of
segmental and whole chromosome alterations is crucial as the
genomic profile of a neuroblastoma tumor is highly important for
decision of treatment regime and indicates prognosis for the
patient. In order to analyze the utility of exome based copy number
profiling in neuroblastoma we performed a visual annotation of
genomic profile and compared exome and SNP-microarray generated
profiles of thirty neuroblastoma samples.
The Shiny application for visualization of
normalized coverage ratios, developed by us and presented here,
allows for a rapid overview of the genomic profiles. Side-by-side
comparison of profiles generated from the two different methods
show high degree of concordance indicating that exome generated
copy number profiles could be used for clinical interpretation.
Using exome sequence data we readily detected high level
amplifications as well as hetero- and homozygous deletions of gene
containing regions (Figs. 1 and
3). Through the exome sequencing
data we were able to detect smaller deletions of gene containing
genomic regions that were not recorded in the SNP-microarray
generated profiles due to inadequate probe density, thereby showing
the power of the exome sequencing. However, it is likely that the
opposite would be seen also for imbalances occurring outside the
targeted regions. When analyzing SNP-microarray profiles an
estimation of the minimal number of probes is needed to take into
account in order to avoid false positives, and similar
considerations should also be addressed in exome generated profiles
e.g., by using a sliding window approach. Control-FREEC apply a
sliding window approach in several steps, first raw CNP is
calculated by counting reads in non-overlapping windows. After the
raw CNPs are normalized against a normal sample, a Lasso-based
segmentation-algorithm is applied (18).
Besides the resolution of smaller deletions in gene
containing regions, only one major deviation was seen in comparing
the two methods; in sample NBL10R8 gain of chromosomal region 2p is
detected through both methods although with different end-points
(Fig. 2). Tracing the source of
DNA indicated that DNA extraction was performed on separate
occasions and that the difference in breakpoints at 2p likely is
due to tumor heterogeneity.
Interestingly, we were able to detect three cases of
homozygous deletions at 19q causing loss of multiple genes
including the CIC gene (Fig.
3). This gene encodes the HMG-box transcriptional repressor
Capicua. Capicua is a key sensor of multiple receptor tyrosine
kinases (RTK), repressing RTK-responsive genes in absence of
activating signaling and is involved in various biological
processes including neuroblast differentiation (19). CIC mutations, deletions or
truncating mutations are seen in the majority of oligodendrogliomas
(20) and Capicua has also been
implicated in other malignancies such as breast-, colorectal and
prostate cancer (21,22). Allelic loss of the 19q region and
recurrent mutations of CIC is a common feature of
oligodendroglioma and frequently seen in combination with allelic
loss of 1p and/or deletions of the far upstream element (FUSE)
binding protein 1 gene FUBP1 on 1p31.1 or mutations of the
isocitrate dehydrogenase genes (IDH1/2) (20). However, allelic loss of
FUBP1 is only seen in one of the samples with homozygous 19q
deletion (NBL13E6) and no novel protein changing variant could be
detected in IDH1/2, FUBP1 or CIC in our set of 30
neuroblastoma tumors. If and how CIC deficiency contributes
to cancer progression in neuroblastoma tumors requires further
studies. A heterozygous deletion was also observed distally the
CIC locus at 43.34–43.53 Mb from pter in sample NBL12E3.
However, this particular region contains several pregnancy-specific
glycoprotein (PSG) genes that previously have been shown to inhabit
various copy number polymorphisms.
Besides identifying genomic copy number alterations
we could detect tumor specific junctions in 86% of the
MYCN-amplified tumors in using the boundaries from
off-target reads in amplified regions. As these junctions are
likely to be highly specific for each tumor, and by definition not
present in normal DNA, they could be used to monitor disease
through analysis of circulating tumor-DNA.
Collectively, we show that copy number profiles
generated from normalized coverage of exome sequencing are easily
interpreted through the web based Shiny application with similar
resolution as the Affymetrix 250K SNP-arrays. The extended use of
exome sequencing beyond variant- and indel calling is of particular
interest in neuroblastoma tumor biology as genomic profiling is of
uttermost importance in the clinical evaluation of these tumors.
Use of exome sequencing has the advantage compared to other methods
for copy number variants, in that it can also identify protein
changing events that can be used for gene targeted therapy such as
the ALK specific inhibitor Crizotinib.
Acknowledgements
The authors wish to thank the Genomics and
Bioinformatics Core Facility platforms at Sahlgrenska Academy,
University of Gothenburg, Gothenburg, Sweden for access and
assistance with instrumentation and analysis. This study was
supported with grants from the Swedish Childhood Cancer Foundation
(S.F.; NBCNSPDHEL10/021, NCp2015-0061, TJ2014-0064. T.M.;
PR2013-0102), the Swedish Cancer Foundation (T.M.; 14-0342), The
Swedish state under the LUA/ALF agreement (ALFGBG-447171), Project
grant from Laboratory division Sahlgrenska University Hospital,
Lions Cancerfond Väst, The Selma Anderson Foundation, Fondkistan,
Assar Gabrielssons Foundation, Sahlgrenska University Hospital
Foundations, the Swedish Research Council (T.M./S.F.; 2014–3031),
the Swedish Foundation for Strategic Research (T.M.;
RB13-0204).
References
|
1
|
Cohn SL, Pearson AD, London WB, Monclair
T, Ambros PF, Brodeur GM, Faldum A, Hero B, Iehara T, Machin D, et
al: INRG Task Force: The International Neuroblastoma Risk Group
(INRG) classification system: An INRG Task Force report. J Clin
Oncol. 27:289–297. 2009. View Article : Google Scholar :
|
|
2
|
Carén H, Kryh H, Nethander M, Sjöberg RM,
Träger C, Nilsson S, Abrahamsson J, Kogner P and Martinsson T:
High-risk neuroblastoma tumors with 11q-deletion display a poor
prognostic, chromosome instability phenotype with later onset. Proc
Natl Acad Sci USA. 107:4323–4328. 2010. View Article : Google Scholar : PubMed/NCBI
|
|
3
|
Janoueix-Lerosey I, Schleiermacher G,
Michels E, Mosseri V, Ribeiro A, Lequin D, Vermeulen J, Couturier
J, Peuchmaur M, Valent A, et al: Overall genomic pattern is a
predictor of outcome in neuroblastoma. J Clin Oncol. 27:1026–1033.
2009. View Article : Google Scholar : PubMed/NCBI
|
|
4
|
Cetinkaya C, Martinsson T, Sandgren J,
Träger C, Kogner P, Dumanski J, Díaz de Ståhl T and Hedborg F: Age
dependence of tumor genetics in unfavorable neuroblastoma: arrayCGH
profiles of 34 consecutive cases, using a Swedish 25-year
neuroblastoma cohort for validation. BMC Cancer. 13:2312013.
View Article : Google Scholar : PubMed/NCBI
|
|
5
|
Combaret V, Iacono I, Bréjon S,
Schleiermacher G, Pierron G, Couturier J, Bergeron C and Blay JY:
Analysis of genomic alterations in neuroblastoma by multiplex
ligation-dependent probe amplification and array comparative
genomic hybridization: A comparison of results. Cancer Genet.
205:657–664. 2012. View Article : Google Scholar : PubMed/NCBI
|
|
6
|
Ambros IM, Brunner B, Aigner G, Bedwell C,
Beiske K, Bénard J, Bown N, Combaret V, Couturier J, Defferrari R,
et al: A multilocus technique for risk evaluation of patients with
neuroblastoma. Clin Cancer Res. 17:792–804. 2011. View Article : Google Scholar : PubMed/NCBI
|
|
7
|
Sathirapongsasuti JF, Lee H, Horst BA,
Brunner G, Cochran AJ, Binder S, Quackenbush J and Nelson SF: Exome
sequencing-based copy-number variation and loss of heterozygosity
detection: Exome CNV. Bioinformatics. 27:2648–2654. 2011.
View Article : Google Scholar : PubMed/NCBI
|
|
8
|
Krumm N, Sudmant PH, Ko A, O'Roak BJ,
Malig M, Coe BP, Quinlan AR, Nickerson DA and Eichler EE: NHLBI
Exome Sequencing Project: Copy number variation detection and
genotyping from exome sequence data. Genome Res. 22:1525–1532.
2012. View Article : Google Scholar : PubMed/NCBI
|
|
9
|
Valdés-Mas R, Bea S, Puente DA, López-Otín
C and Puente XS: Estimation of copy number alterations from exome
sequencing data. PLoS One. 7:e514222012. View Article : Google Scholar
|
|
10
|
Boeva V, Popova T, Bleakley K, Chiche P,
Cappo J, Schleiermacher G, Janoueix-Lerosey I, Delattre O and
Barillot E: Control-FREEC: A tool for assessing copy number and
allelic content using next-generation sequencing data.
Bioinformatics. 28:423–425. 2012. View Article : Google Scholar :
|
|
11
|
Carén H, Erichsen J, Olsson L, Enerbäck C,
Sjöberg RM, Abrahamsson J, Kogner P and Martinsson T:
High-resolution array copy number analyses for detection of
deletion, gain, amplification and copy-neutral LOH in primary
neuroblastoma tumors: Four cases of homozygous deletions of the
CDKN2A gene. BMC Genomics. 9:3532008. View Article : Google Scholar : PubMed/NCBI
|
|
12
|
Chang WCJ, Allaire JJ, Xie Y and McPehrson
J: Shiny: Web Application Framework for R. R package version
0.12.0. R package version 0120. 2015, https://cran.r-project.org/web/packages/shiny/index.html.
Accessed August 5, 2015
|
|
13
|
Hoefling H: A Path Algorithm for the Fused
Lasso Signal Approximator. J Comput Graph Stat. 19:984–1006. 2010.
View Article : Google Scholar
|
|
14
|
Molenaar JJ, Koster J, Zwijnenburg DA, van
Sluis P, Valentijn LJ, van der Ploeg I, Hamdi M, van Nes J,
Westerman BA, van Arkel J, et al: Sequencing of neuroblastoma
identifies chromothripsis and defects in neuritogenesis genes.
Nature. 483:589–593. 2012. View Article : Google Scholar : PubMed/NCBI
|
|
15
|
Pandey GK, Mitra S, Subhash S, Hertwig F,
Kanduri M, Mishra K, Fransson S, Ganeshram A, Mondal T, Bandaru S,
et al: The risk-associated long noncoding RNA NBAT-1 controls
neuroblastoma progression by regulating cell proliferation and
neuronal differentiation. Cancer Cell. 26:722–737. 2014. View Article : Google Scholar : PubMed/NCBI
|
|
16
|
Pugh TJ, Morozova O, Attiyeh EF,
Asgharzadeh S, Wei JS, Auclair D, Carter SL, Cibulskis K, Hanna M,
Kiezun A, et al: The genetic landscape of high-risk neuroblastoma.
Nat Genet. 45:279–284. 2013. View
Article : Google Scholar : PubMed/NCBI
|
|
17
|
Sausen M, Leary RJ, Jones S, Wu J,
Reynolds CP, Liu X, Blackford A, Parmigiani G, Diaz LA Jr,
Papadopoulos N, et al: Integrated genomic analyses identify ARID1A
and ARID1B alterations in the childhood cancer neuroblastoma. Nat
Genet. 45:12–17. 2013. View
Article : Google Scholar :
|
|
18
|
Boeva V, Zinovyev A, Bleakley K, Vert JP,
Janoueix-Lerosey I, Delattre O and Barillot E: Control-free calling
of copy number alterations in deep-sequencing data using GC-content
normalization. Bioinformatics. 27:268–269. 2011. View Article : Google Scholar :
|
|
19
|
Jiménez G, Shvartsman SY and Paroush Z:
The Capicua repressor - a general sensor of RTK signaling in
development and disease. J Cell Sci. 125:1383–1391. 2012.
View Article : Google Scholar
|
|
20
|
Eisenreich S, Abou-El-Ardat K, Szafranski
K, Campos Valenzuela JA, Rump A, Nigro JM, Bjerkvig R, Gerlach EM,
Hackmann K, Schröck E, et al: Novel CIC point mutations and an
exon-spanning, homozygous deletion identified in oligodendroglial
tumors by a comprehensive genomic approach including transcriptome
sequencing. PLoS One. 8:e766232013. View Article : Google Scholar : PubMed/NCBI
|
|
21
|
Sjöblom T, Jones S, Wood LD, Parsons DW,
Lin J, Barber TD, Mandelker D, Leary RJ, Ptak J, Silliman N, et al:
The consensus coding sequences of human breast and colorectal
cancers. Science. 314:268–274. 2006. View Article : Google Scholar : PubMed/NCBI
|
|
22
|
Choi N, Park J, Lee JS, Yoe J, Park GY,
Kim E, Jeon H, Cho YM, Roh TY and Lee Y:
miR-93/miR-106b/miR-375-CIC-CRABP1: A novel regulatory axis in
prostate cancer progression. Oncotarget. 6:23533–23547. 2015.
View Article : Google Scholar : PubMed/NCBI
|