Introduction
The overexpression of anti-apoptotic B-cell lymphoma
2 (Bcl-2) protein members such as Bcl-2/Bcl-xL/Mcl-1 frequently
occurs in human cancers and is closely associated with cancer
development and resistance to chemotherapies (1,2). By
competing with anti-apoptotic Bcl-2 proteins, Bcl-2 homology domain
3 (BH3) mimetics induce cell death in a wide range of cancer cell
lines. They have therefore been used as novel cancer therapy tools
that target the functional BH3 binding groove of anti-apoptotic
members of the Bcl-2 family (3).
Recent studies suggest that as well as regulating apoptosis, Bcl-2
is also involved in cancer cell metabolism (4,5). For
example, inhibiting Bcl-2 by the BH3 mimetic ABT-737 reduces
mitochondrial oxidative phosphorylation in primitive leukemia cells
(6). Moreover, Bcl-2
overexpression prevents the brain mitochondrial respiratory
dysfunction induced by glutathione depletion (7). These observations imply that the
regulation of cancer metabolism may be intertwined in the antitumor
effect of Bcl-2 inhibitors.
Aerobic glycolysis is a key hallmark of many cancers
including ovarian cancer (8),
which is characterized by enhanced glucose uptake and lactate
secretion, and is abnormally dependent on glycolysis for ATP
production even in the presence of oxygen (9). This metabolic phenotype with a high
glucose dependence and increased glucose metabolism may facilitate
the proliferation of cancer cells and enable them to evade
apoptosis (10,11). While investigating cell death,
mitochondria were shown to be under extensive metabolic control,
and appear to determine whether cells respond to stress in an
adaptive or suicidal way (12).
Recently, the manipulation of metabolic derangement through
inhibiting glycolysis and targeting mitochondrial apoptotic
machinery were proposed as strategies to improve ovarian cancer
therapy (13). However, the effect
of Bcl-2 inhibitors on ovarian cancer cell metabolism remains
unclear.
SIRT3 is a member of the sirtuin family of
NAD-dependent deacetylases, which preferentially localizes to
mitochondria (14). Through the
deacetylation of target enzymes, SIRT3 is involved in processes of
energy metabolism, including the respiratory chain, tricarboxylic
acid cycle, fatty acid oxidation, and ketogenesis (15). Moreover, SIRT3 was recently
suggested to mediate metabolic reprogramming by destabilizing
hypoxia-inducible factor 1-α, a transcription factor that controls
glycolytic gene expression (16).
Under basal (non-stress) conditions, SIRT3 was also found to be
required for apoptosis induced by the selective silencing of Bcl-2
in HCT116 human epithelial cancer cells (17). These findings imply that SIRT3
serves as an important therapeutic target involved in both cancer
metabolism and apoptosis.
We previously found that S1, a novel pan-BH3 mimetic
targeting both Bcl-2 and Mcl-1, may inhibit cancer cell growth and
induce apoptosis through mitochondrial pathways and endoplasmic
reticulum stress-mediated pathways (18). This study aimed to determine
whether S1 exerts anticancer roles in SKOV3 ovarian carcinoma cells
through regulating glucose metabolism. Here we found that S1
induces cell apoptosis and interrupts glucose metabolism in human
ovarian cancer cells, partially through the activation of SIRT3. A
combination of 2-DG and S1 further promotes the activation of
apoptosis through enhancing the expression of SIRT3. Therefore, we
proposed that a novel strategy for tumor therapy could exploit the
role of SIRT3 to enhance the antitumor effect of BH3 mimetics, and
glycolysis should be also considered as a potential target for the
improvement of S1 efficacy.
Materials and methods
Reagents and antibodies
S1 was synthesized as previously reported (19) and dissolved in dimethyl sulfoxide
(DMSO). The Bcl-2 inhibitors ABT-737, ABT-199, and obatoclax
mesylate (Oba) were purchased from ApexBio (Boston, MA, USA). The
glycolysis inhibitor 2-DG was purchased from Santa Cruz
Biotechnology (Santa Cruz, CA, USA). Hoechst 33342,
3-(4,5-dimethylthiazol-2-yl)-2,5-diphenyltetrazolium bromide (MTT),
and fetal bovine serum (FBS) were purchased from Sigma (St. Louis,
MO, USA). Anti-SIRT3, anti-Mcl-1, anti-Bcl-2, anti-lamin A/C,
anti-Cox IV, anti-Tom20, anti-caspase-3, anti-PARP and anti-β-actin
antibodies were purchased from Santa Cruz Biotechnology.
Cell culture
Human ovarian carcinoma cells (SKOV3 cells) were
purchased from American Tissue Culture Collection (Rockville, MD,
USA) and cultured in RPMI-1640 medium supplemented with 10% FBS,
100 U/ml penicillin, and 100 mg/ml streptomycin (complete medium),
and were grown in a humidified cell culture incubator equilibrated
with 95% air and 5% CO2 at 37°C.
Cell viability assays
Cells were seeded in 96-well plates at a density of
1×10⁴ cells/well in 200 μl of complete medium at 37°C
with 5% CO2. A total of 10 μl of 10 mg/ml MTT reagent in
phosphate-buffered saline was added to each well and incubated for
4 h, after which any formazan crystals that formed were dissolved
in 150 μl DMSO. Absorbance was recorded at a wavelength of 490 nm.
The treatment was repeated in six separate wells.
Mouse experiments
All animal manipulations were performed in
accordance with institutional guidelines under approved protocols.
Six-week-old female athymic BALB/c nude mice were purchased from
the Animal Experimental Center (Beijing, China). SKOV3 ovarian
cancer cells (2×10⁶ cells), were s.c. implanted into
into the upper flank. Seven days after tumor cell injection, the
nude mice were randomized into 2 groups of 5 mice per group:
vehicle (control) and S1 (6 mg/kg). The groups of mice were
intraperitoneally administered with 0.2 ml of vehicle (DMSO in PBS,
control group) or S1 in 0.2 ml of vehicle every 2 days. The body
weights and tumor volumes of the control and drug-treated mice were
recorded prior to the start of the experiment. Tumor volume was
monitored by using external caliper measurement and calculated
according to the formula tumor volume (in millimeters cubed) = D ×
d2/2, where D and d are the longest and shortest
diameters, respectively. The mice in both the control and
S1-treated groups were sacrificed at 21 days after the tumor cell
injection. Tumors from each mouse treated with vehicle or S1 were
carefully dissected out at the time of sacrifice, weighed, and
photographed for graphical representation.
Apoptosis analysis by Hoechst 33258
staining
Apoptotic morphological alterations in nuclear
chromatin were detected by Hoechst 33258 staining. Briefly, SKOV3
cells were cultured in 24-well plates and treated as indicated for
24 h. Cells were washed with ice-cold PBS and fixed with 4% (w/v)
paraformaldehyde overnight. The plates were then incubated with 10
M Hoechst 33258 staining solution for 10 min. The cells were
visualized under a fluorescence microscope (IX-71, Olympus).
Western blot analysis
Briefly, after quantitating protein in each sample
with the Bio-Rad protein reagent (Bio-Rad Laboratories, Hercules,
CA, USA), (40 μg protein per well) were separated by SDS-PAGE and
transferred onto an Immun-Blot PVDF membrane (Bio-Rad
Laboratories). After blocked in Tris-buffered saline containing 5%
(w/v) non-fat dry milk at room temperature for 1 h, the membranes
were incubated with specific primary antibodies overnight at 4°C.
After washed with PBS-Tween-20, membranes were incubated with
horseradish-peroxidase-conjugated secondary antibodies (Santa Cruz
Biotechnology) at room temperature for 1 h. Membranes were then
incubated in ECL reagents and images captured by Syngene Bio
Imaging (Synoptics, Cambridge, UK). Densitometric quantitation of
bands was performed using Syngene Bio Imaging tools.
Oxygen consumption and extracellular
acidification rates
Briefly, SKOV3 cells were plated at 8×10⁴
cells/well in 96-multiwell, clear-bottom, black-body plates and
allowed to adhere overnight. The following day, different
concentrations of drugs were added and incubated for 6 h. Each
treatment was repeated in three wells. The determination of cell
oxygen consumption and extracellular acidification rates was
carried out using the fluorescent oxygen-sensitive and pH-sensitive
probes Mito-Xpress and pH-Xtra (Luxcel Bioscience, Cork, Ireland),
respectively, as described previously (20).
Determination of glucose and lactate
concentrations
Following treatment as indicated, the medium of
SKOV3 cells was collected. The glucose and lactate concentrations
were then determined with the glucose assay kit and the lactate
assay kit (Bioassay Systems), respectively.
ATP measurements
Following treatment as indicated, the SKOV3 cells
were lysed. After centrifugation, ATP concentrations were measured
in the supernatant based on ATP-dependent luciferase activity with
the ATP assay kit (Beyotime Biotechnology).
Glucose metabolism RT2
profiler PCR array
The Human Glucose Metabolism RT2
Profiler™ PCR array(SABiosciences-Qiagen, Hilden, Germany) profiles
the expression of 84 key genes involved in the regulation and
enzymatic pathways of glucose and glycogen metabolism. Total
cellular RNA was extracted from cultured cells according to the
manufacturer's instructions. Single-stranded cDNA was obtained by
reverse transcription of 1 μg of total RNA using the SABiosciences
RT2 First Strand kit. Real-time qPCRs were performed
using Applied Biosystems 7300 Fast with SYBR Green Fluorophore. The
reactions were carried out using RT2 SYBR Green
Mastermix. cDNA was used as template and cycling parameters were
95°C for 10 min, followed by 40 cycles of 95°C for 15 sec and 60°C
for 1 min. Fluorescence intensities were analyzed using the
manufacturer's software, and relative quantification was calculated
using the 2−ΔΔCt method. Change of expression of the 84
genes was shown by heat imaging. GAPDH was used as a reference
gene.
Quantitative real-time PCR (qRT-PCR)
Total RNA was extracted using TRIzol (Invitrogen,
Carlsbad, CA, USA) according to the manufacturer's protocol.
First-strand cDNAs were generated by reverse transcription of RNA
samples with SuperScript preamplification system (Promega, Madison,
MI, USA). Reverse transcribed products were used to amplify SIRT3
by qRT-PCR. qRT-PCR was performed using a FastStart Universal SYBR
Green Master (Roche) on an ABI 7300 instrument. The primer
sequences used for qRT-PCR were 5′-TGGAAAGCCTAGTGGAGCTTCTGGG-3′
(forward) and 5′-TGGGGGCAGCCATCATCCTATTTGT-3′ (reverse) for SIRT3,
and 5′-GGGTGATGCTGGTGCTGAGTATGT-3′ (forward) and
5′-AAGAATGGGAGTTGCTGTTGAAGT-3′ (reverse) for GAPDH. The expression
of each investigated gene was normalized to the housekeeping gene
GAPDH. Data are presented as the fold change in gene expression
relative to the control sample.
Measurement of intracellular
NAD+/NADH ratio
Both oxidized and reduced forms of intracellular
nicotin-amide adenine dinucleotide were determined using an
NADH/NAD quantification kit (BioVision Inc., Milpitas, CA, USA) as
described by the manufacturer. Briefly, 2×10⁵ cells were
washed with cold PBS, pelleted, and extracted with 400 μl of
NADH/NAD extraction buffer by two freeze/thaw cycles. Samples were
vortexed and centrifuged at 14,000 rpm for 5 min. For each sample,
a 200-μl aliquot of extracted NADH/NAD supernatant was transferred
to a microcentrifuge tube. Samples were heated to 60°C for 30 min
to allow decomposition of all NAD+ while retaining NADH
intact and then placed on ice. Samples were rapidly centrifuged and
transferred to a multiwell-plate. Standards and a NAD cycling mix
were prepared according to the manufacturer's protocol. An amount
of 100 μl of the reaction mix was added into each well of NADH
standards and samples, and all samples were incubated at room
temperature for 5 min to convert NAD+ to NADH. NADH
developer solution was added to each well, and plates were
incubated at room temperature. The reaction was stopped by adding
10 μl of stop solution into each well and mixing well, and
absorbance was measured at 450 nm.
Preparation of nuclear- and
mitochondrial-enriched extracts
To generate fractions enriched in nuclear and
mitochondrial proteins, 5.0×10⁶ cells were harvested and
washed in PBS. Cells were resuspended in 0.2 ml of buffer MgRSB (10
mM NaCl, 1.5 mM MgCl2, 10 mM Tris-HCl at pH 7.5, 0.1 mM
PMSF, 1 mM DTT) and incubated on ice for 10 min. Cells were dounced
to yield free nuclei, and 0.034 ml of sucrose buffer (2 M sucrose,
35 mM EDTA, 50 mM Tris-HCl at pH 7.5) was immediately added. Free
nuclei were collected by centrifugation at 1,000 g for 10 min.
Mitochondria were collected by centrifugation at 11,000 g for 10
min. Nuclei were resuspended in buffer C (20 mM Tris-HCl at pH 7.9,
25% glycerol, 0.42 M NaCl, 1.5 mM MgCl2, 0.2 mM EDTA,
0.1 mM PMSF, 0.5 mM DTT) and incubated on ice for 20 min. To
generate nuclear extract, nuclei were spun down at 14,000 g, and
the supernatant was collected. Mitochondria were resuspended in
buffer C to be used in western blot analyses.
Immunofluorescent confocal laser
microscopy
SKOV3 cells were cultured on coverslips at a density
of 5×10⁴ cells/well in 500 μl of complete medium. After
treatment, SKOV3 cells were washed with cold PBS three times and
fixed in 4% (w/v) paraformaldehyde/PBS for 20 min then washed with
cold PBS three times. Fixed cells were digested by protein enzyme K
for 1 min and washed with PBS twice. Cells were incubated with 0.1%
(v/v) Triton X-100 for 6–10 min, washed once with PBS, and then
blocked for 30 min in 5% (v/v) non-immune animal serum/PBS. Cells
were incubated with primary antibody (SIRT3, Tom20, dilution 1:200;
Santa Cruz Biotechnology) overnight and washed three times with
PBS. Cells were then incubated with secondary antibody (rabbit and
mouse, dilution 1:400; Thermo, Waltham, MA, USA) for 30 min in the
dark. Plates were washed three times in PBS, treated with Hoechst
33342/H2O (1 μg/ml) for 2 min, and then washed three
times with PBS. Cells were examined by Olympus FV1000 confocal
laser microscope.
SIRT3 knockdown by small interfering
RNA Small interfering RNA (siRNA) sequences
targeting human SIRT3 (GenBank accession no. NM_012239) and a
non-target sequence were constructed by Genechem (Shanghai, China).
The SIRT3-RNAi (23504) sequence was GCTTGATGGACCAGACAAA, SIRT3-RNAi
(23505) sequence was GCTGTACCCTGGAAACTAC, SIRT3-RNAi (23506)
sequence was ACCTCCAGCAGTACG ATCT, and SIRT3-RNAi (23507) sequence
was TCGATGGGC TTGAGAGAGT. The non-target siRNA (Scramble) sequence
was TTCTCCGAACGTGTCACGT. Transfections with siRNA were performed
using Lipofectamine 2000 (Invitrogen) according to the
manufacturer's protocol. Briefly, SKOV3 cells were placed into
6-well plates, and transfected the next day with 4 μg si-SIRT3 or
si-Scramble, using 10 μl (1 μg/μl) Lipofectamine 2000. Cells were
harvested 2 days after transfection; whole cell lysates were
isolated for western blot analyses. For MTT assay, transfected
cells were treated with S1 for 24 h, followed by MTT assay to
determine cell viability.
Morphological assessment
Cells were seeded at 2.0×10⁵ cells/well
in 6-well cell culture dishes and treated with experimental
conditions, as indicated in the individual figures, during their
logarithmic growth phase. After various treatments and time-points,
morphological alterations were analyzed under an inverted phase
contrast microscope (Olympus, Tokyo, Japan) at ×20
magnification.
Caspase-3/7 activity
Caspase-3/7 activity was measured using the
Caspase-Glo 3/7 assay kit (Promega) according to the manufacturer's
instructions. Each experiment was performed in quintuplicate and
experiments were carried out twice.
Statistical analysis
Data are expressed as the mean ± SD. SPSS 17.0
software was used for analysis. All experiments were repeated at
least three times. The statistical significance of the difference
between two groups was assessed using Student's t-test, and
P<0.05 was considered to be significant.
Results
BH3 mimetic S1 inhibits the proliferation
of SKOV3 cells and tumor growth in a xenograft model of ovarian
cancer
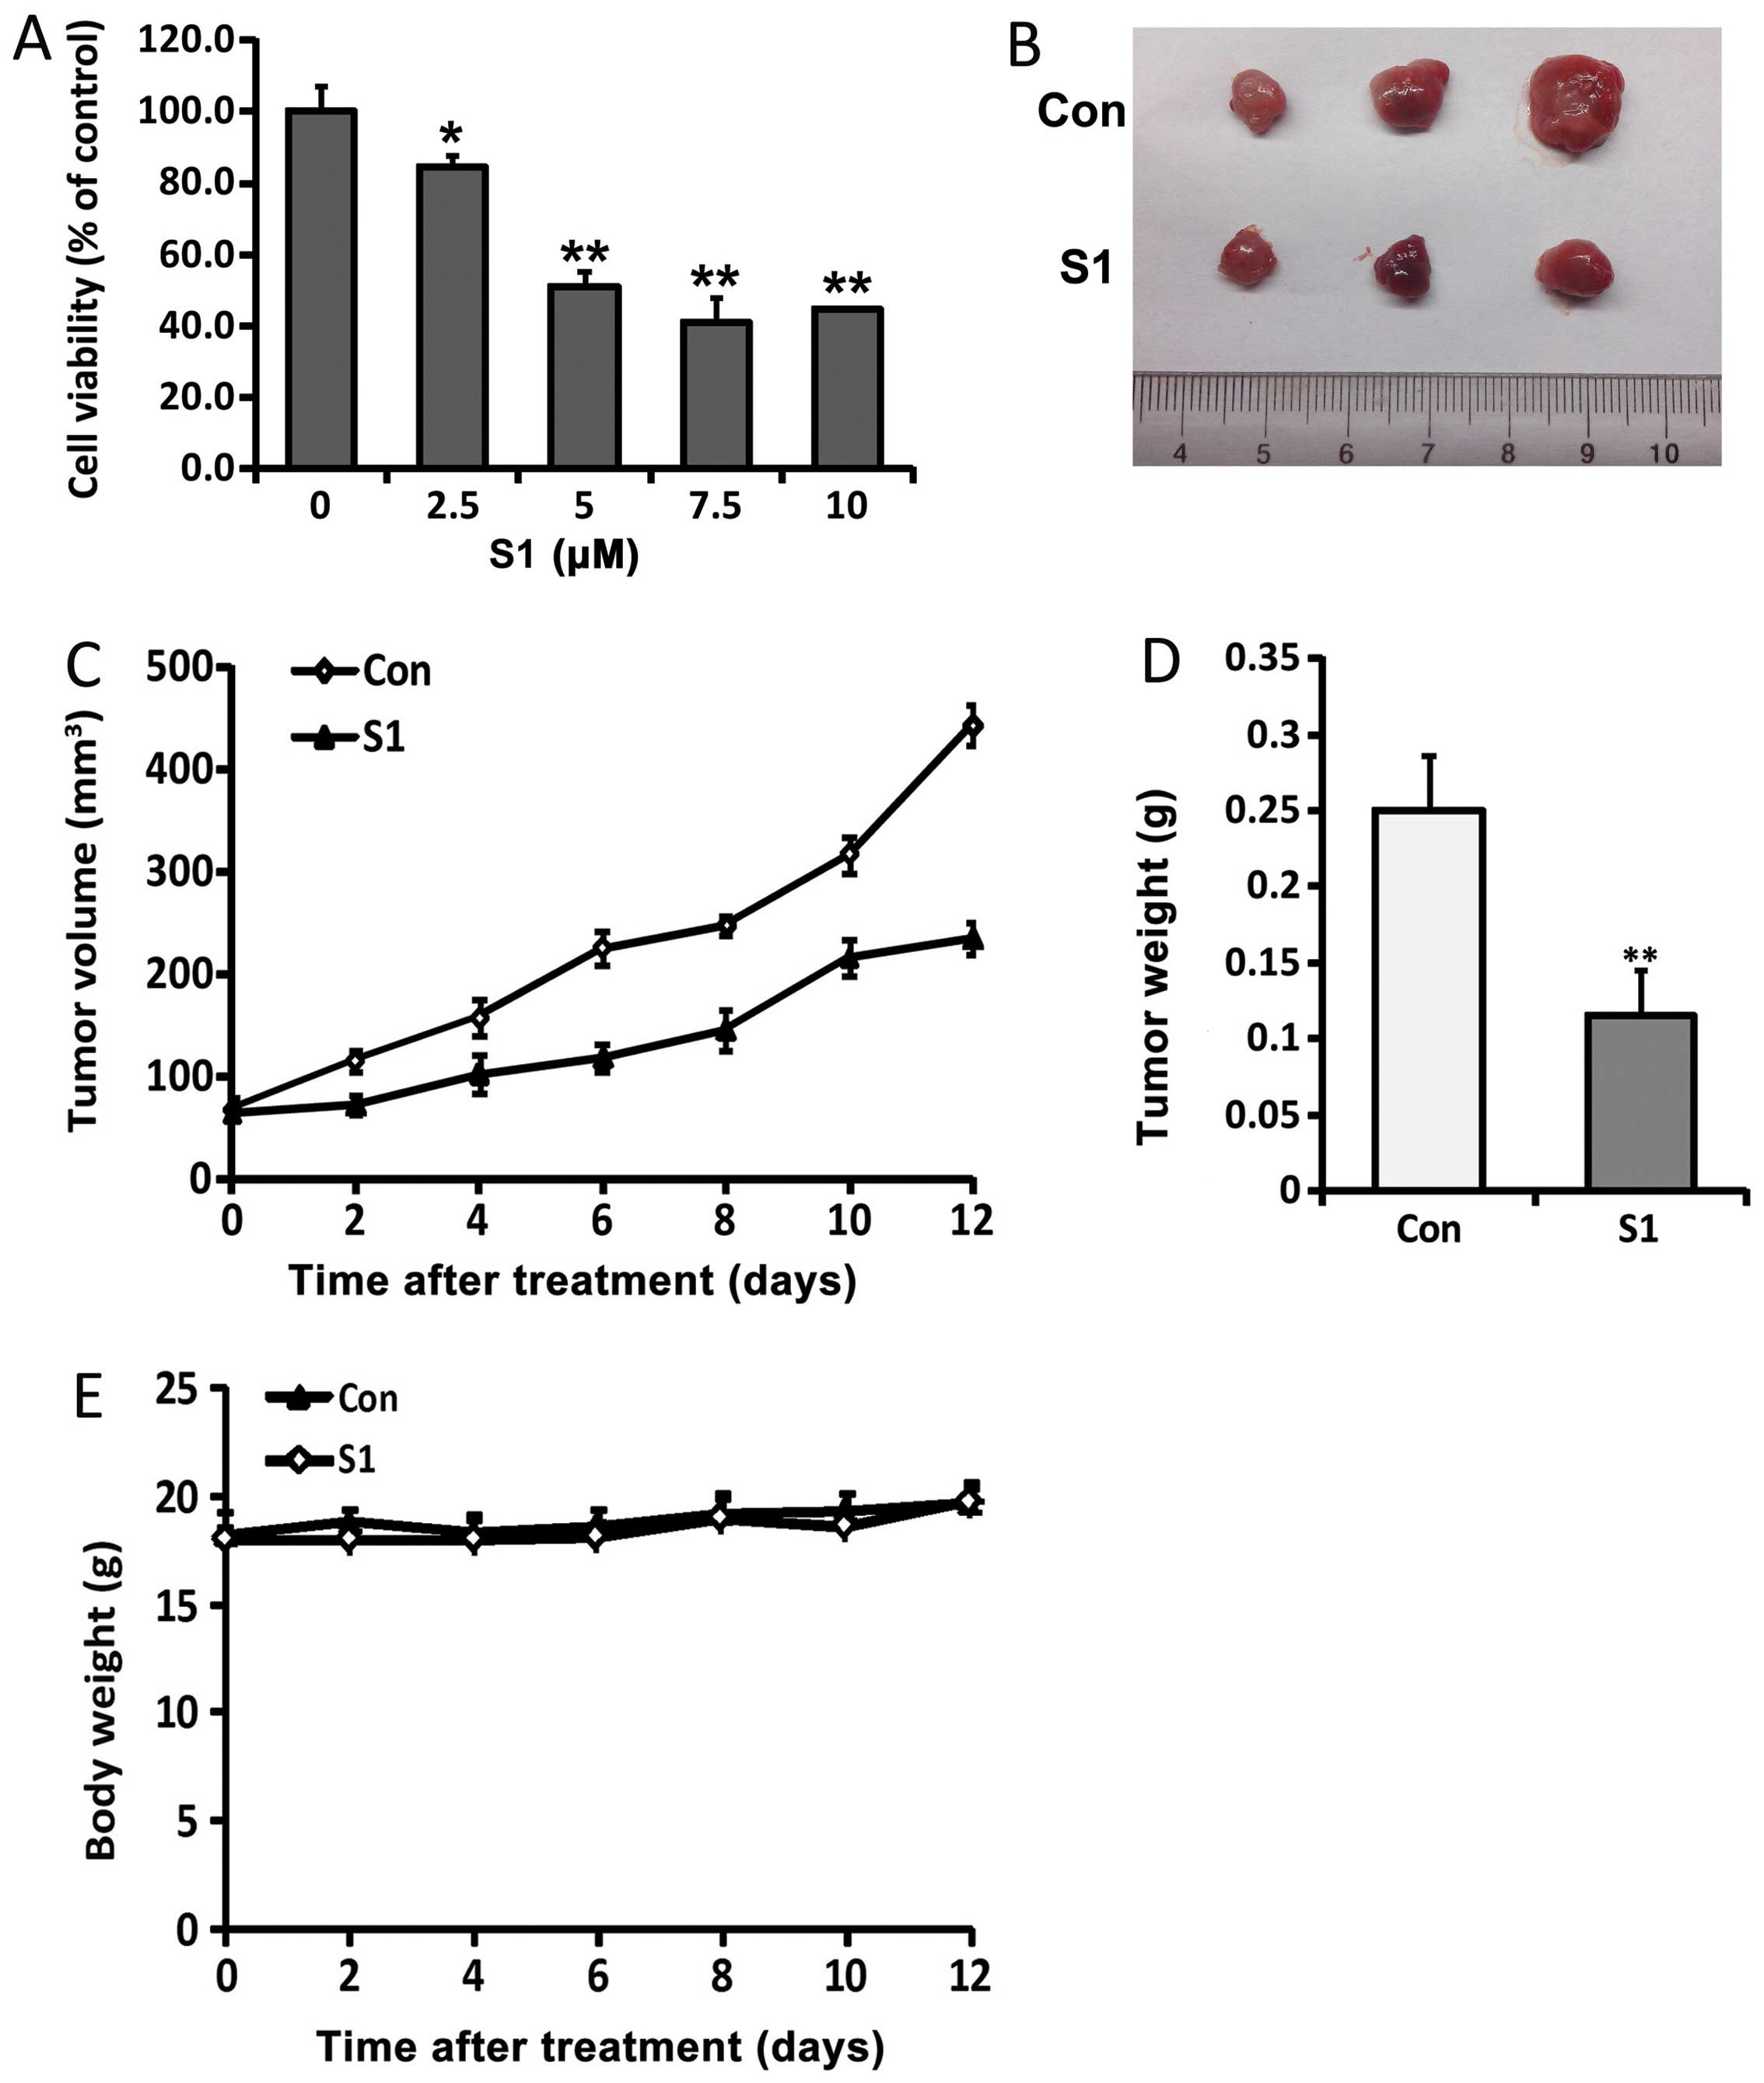
SKOV3 cells were treated with different doses of S1
for 24 h, and the survival rate was then examined using MTT assays.
The viability of SKOV3 cells was shown to be decreased by S1
treatment (Fig. 1A). To initiate
the treatment on palpable tumors, SKOV3 xenografts were inoculated
subcutaneously into Balb/c nude mice. S1 was then injected 7 days
later, and shown to significantly inhibit the growth of tumor
xenografts compared with vehicle-treated controls. At sacrifice,
the mean tumor volumes in animals treated with S1 were 235
mm3 compared with 443.3 mm3 for control
animals (Fig. 1C), while mean
tumor weights were 0.116 and 0.25 g, respectively (Fig. 1D). Notably, there was no overt
gross toxicity in either vehicle- or S1-treated mouse, as
determined by measuring body weights (Fig. 1E).
Ovarian tumor growth was compared between animals
with and without S1 treatment. The direct measurement of tumor
volume was performed at the start of tumor inoculation. After S1
treatment, a significant reduction in tumor volume and weight was
observed compared with the vehicle-treated control (Fig. 1B–D). We found that 6 mg/kg of S1
caused a reduction in tumor growth of 53.7% compared with the
vehicle-treated control group, while it had no adverse effects on
body weight, indicating that it lacked potential toxicity in nude
mice. These results indicate that S1 inhibits SKOV3 cell
proliferation and retards the growth of SKOV3 xenografts in
vivo.
S1 induces apoptosis and inhibits
mitochondrial respiration and glycolysis in ovarian cancer
cells
Based on MTT results, we treated SKOV3 cells with 5
μM S1 for 6, 12 and 24 h, and detected apoptotic chromatin
condensation by Hoechst 33342 staining using confocal microscopy.
S1-induced apoptotic chromatin condensation was obviously seen
after 12-h treatment (Fig. 2A). We
next examined the apoptotic effects through detecting the
expression of Bcl-2, Mcl-1, cytoplasmic cytochrome c and the
activation of caspase-3 and PARP by western blotting. S1 decreased
the expression of Bcl-2 and Mcl-1, and enhanced expression of
cleaved caspase-3, cleaved PARP and cytoplasmic cytochrome c
in SKOV3 cells (Fig. 2B and C).
These results indicate that S1 efficiently induces apoptosis in
SKOV3 cells.
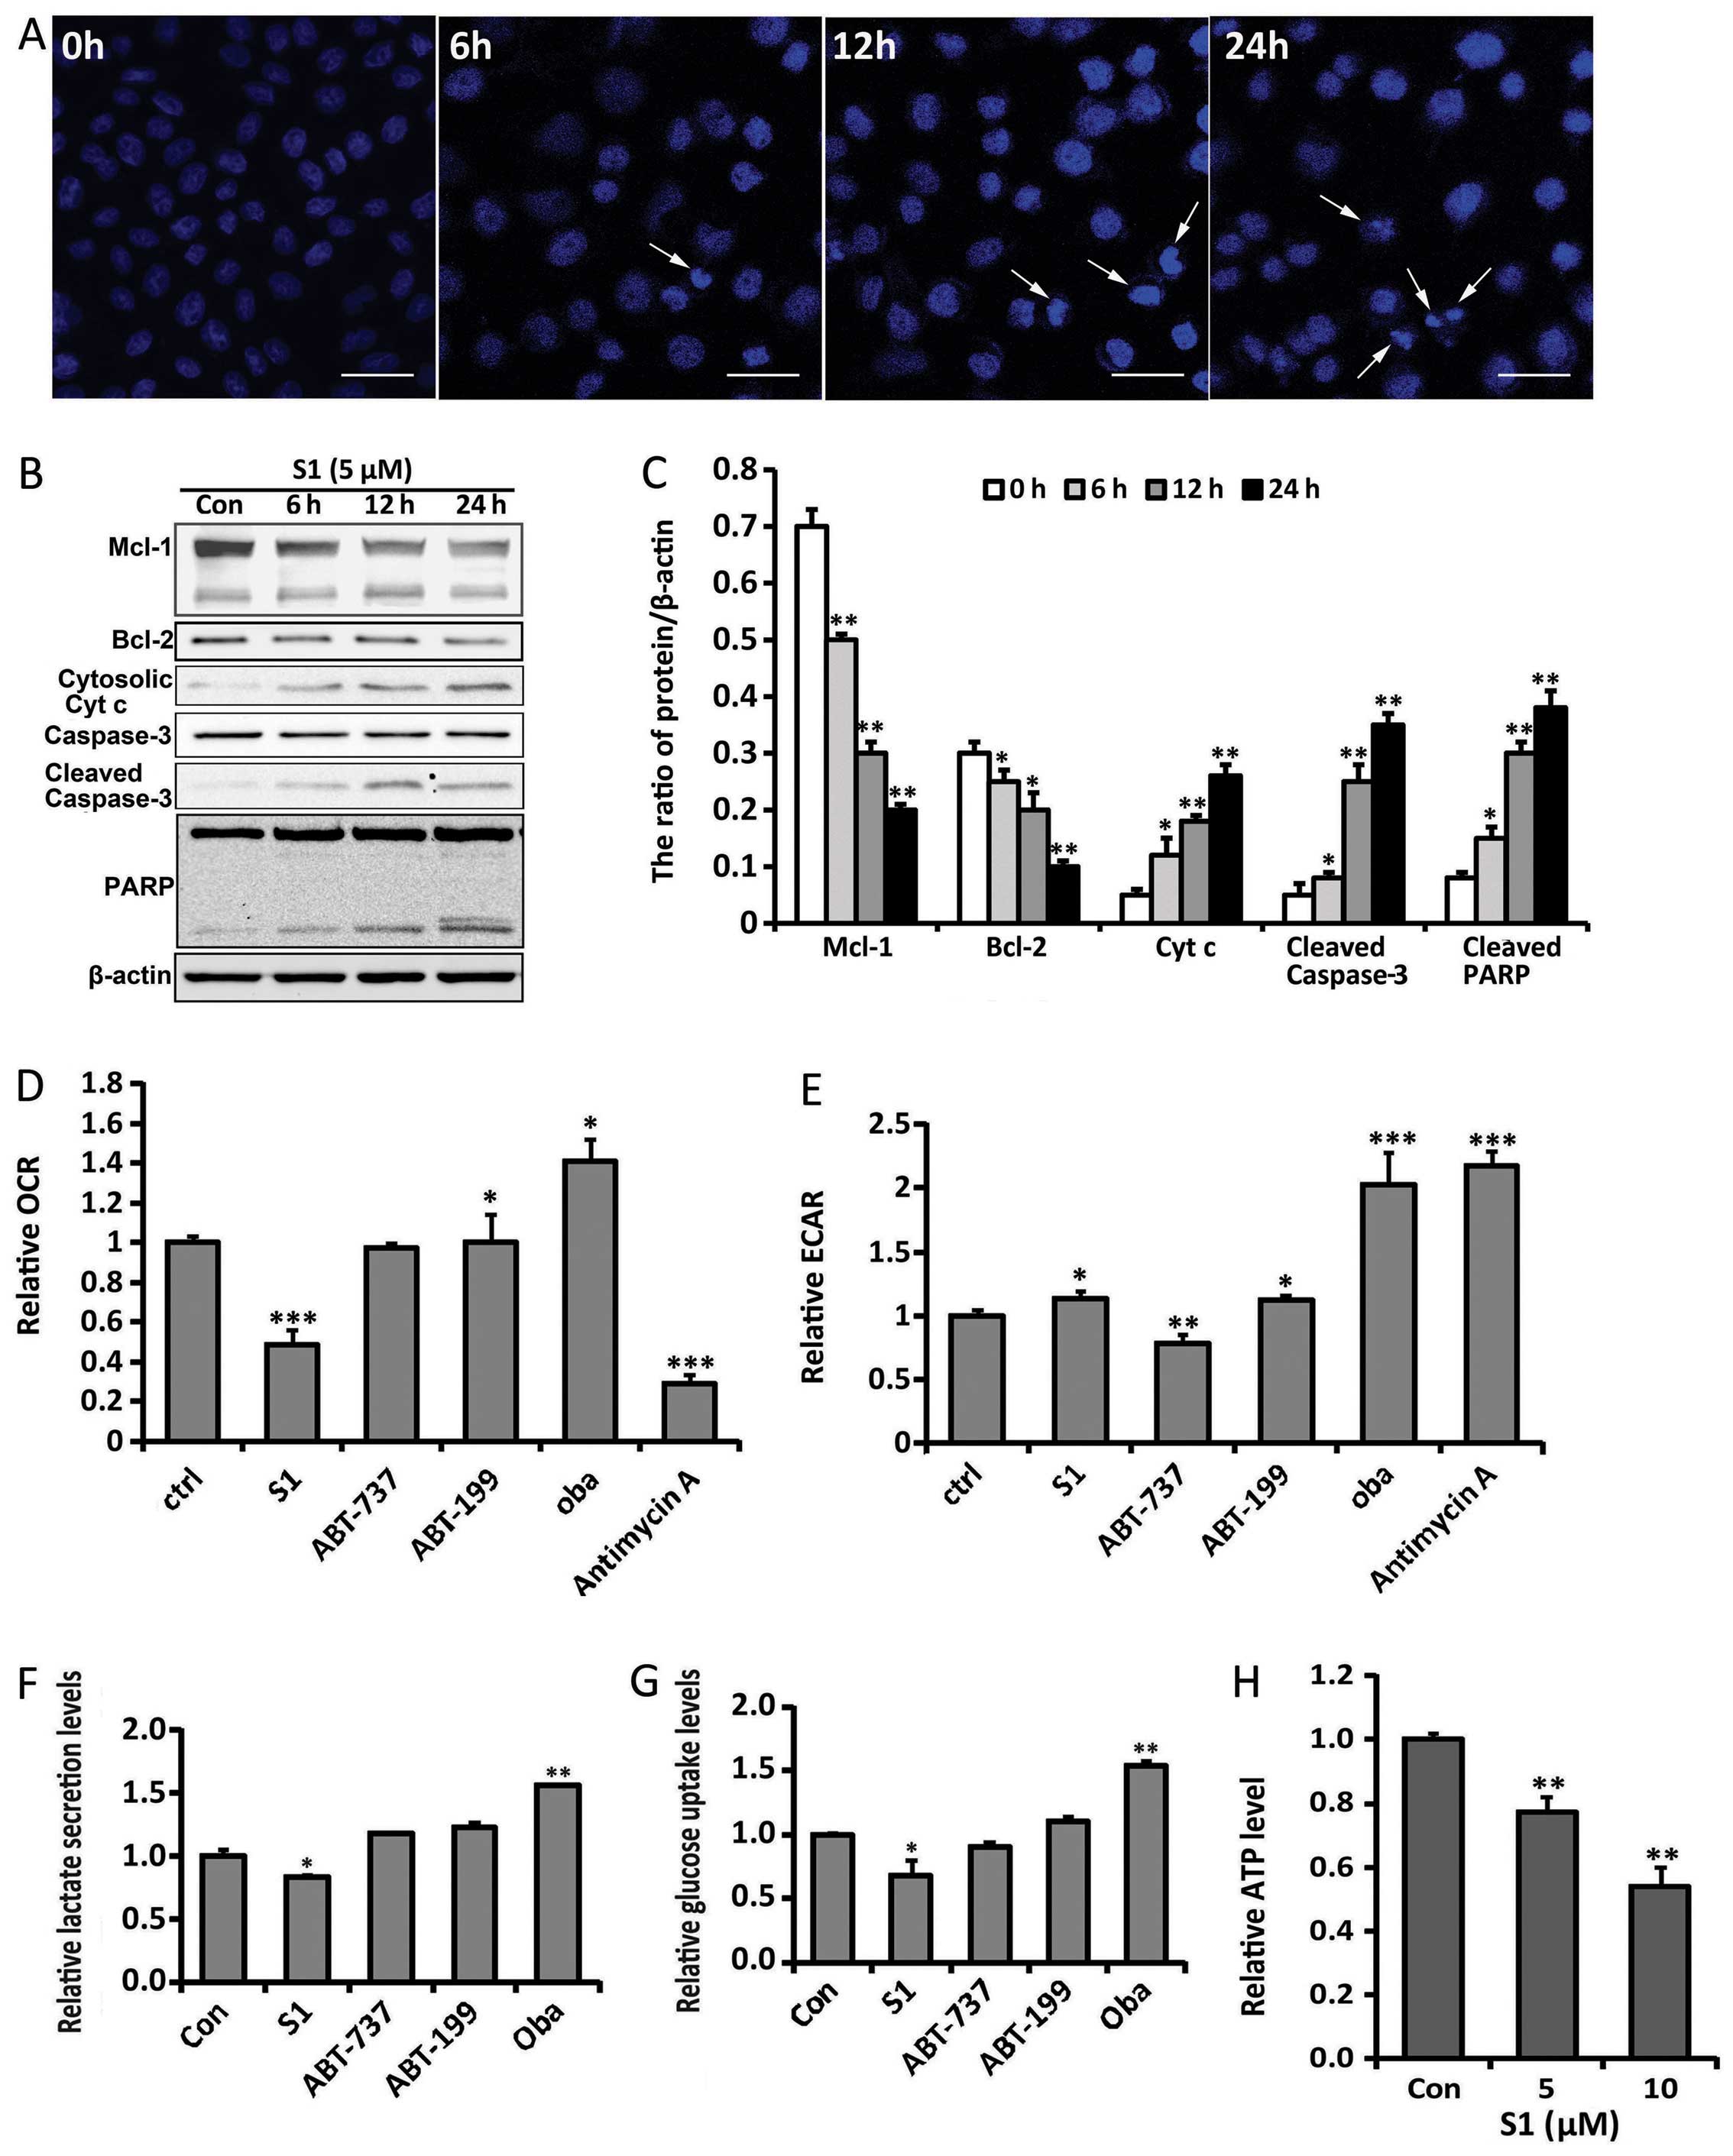 | Figure 2S1 induces apoptosis and interrupts
glucose metabolism in SKOV3 cells. (A) SKOV3 cells were treated
with 5 μM S1 for 6, 12 and 24 h, and stained with Hoechst 33342.
Cell morphology was observed by confocal microscopy (bar, 10 μm;
arrows, apoptotic cells). (B) Western blot analysis for the
expression of Bcl-2, Mcl-1, caspase-3, PARP and cytosolic
cytochrome c protein in SKOV3 cells treated with S1. (C)
Quantitation of Bcl-2, Mcl-1, cleaved caspase-3, cleaved PARP and
cytosolic cytochrome c protein levels. Data were presented
as mean ± SD, n=3, *P<0.05, **P<0.01
compared with control group. Oxygen consumption rates (D) and
extracellular acidification rates (E) were measured in the presence
of Bcl-2 inhibitors or antimycin A (2.5 μM). *P<0.05,
**P<0.01, ***P<0.001 compared with
control group (n=4). Extracellular glucose (F) and lactate (G)
concentrations were determined enzymatically in the culture media
and expressed as a relative metabolite concentration after
indicated times and after normalization to protein content.
*P<0.05, compared with control group (n=3). (H) ATP
production after treatment with different doses of S1 relative to
the control group. **P<0.01 compared with the control
group (n=3). |
Previous studies showed that aerobic glycolysis is
important for the growth of ovarian tumors (13). To determine whether S1 affects
glucose metabolism before exerting obvious cytotoxity such as the
induction of apoptosis, we first analyzed its effects on oxygen
consumption rate (OCR) and extracellular acidification rates (ECAR)
in SKOV3 cells after short-term exposure for 6 h (Fig. 2D and E). Following the inhibition
of mitochondrial respiration by antimycin A in SKOV3 cells, we
observed a drop in OCR, whereas ECAR increased. We also found that
S1 induced a significant decrease in OCR, whereas ECAR increased
slightly. Moreover, the effects of several different Bcl-2
inhibitors, including ABT-737, ABT-199 and obatoclax mesylate
(oba), were also observed. ABT-737 showed no obvious effect on
either OCR or ECAR, while ABT-199 and oba induced an increase in
both OCR and ECAR. These results indicate that the effects of
different Bcl-2 inhibitors on glucose metabolism are specific, and
S1 mainly inhibits mitochondrial respiration in SKOV3 cells before
exerting obvious cytotoxity.
We next determined cellular metabolic profiles by
measuring extracellular glucose and lactate levels. Compared with
the control group, S1-treated cells showed a decreased glycolytic
phenotype with significantly lower glucose consumption and lactate
production after long-term exposure for 12 h (Fig. 2F and G). Because glycolysis and
mitochondrial respiration are the two main sources of cellular ATP
production, we assessed whether S1 affected ATP levels. S1 was
shown to decrease ATP levels in a dose-dependent manner (Fig. 2H). Taken together, these results
suggest that S1 inhibits mitochondrial respiration and glycolysis
and induces apoptosis in SKOV3 cells.
Array analysis reveals S1-induced
regulation of glucose metabolism-related gene expression
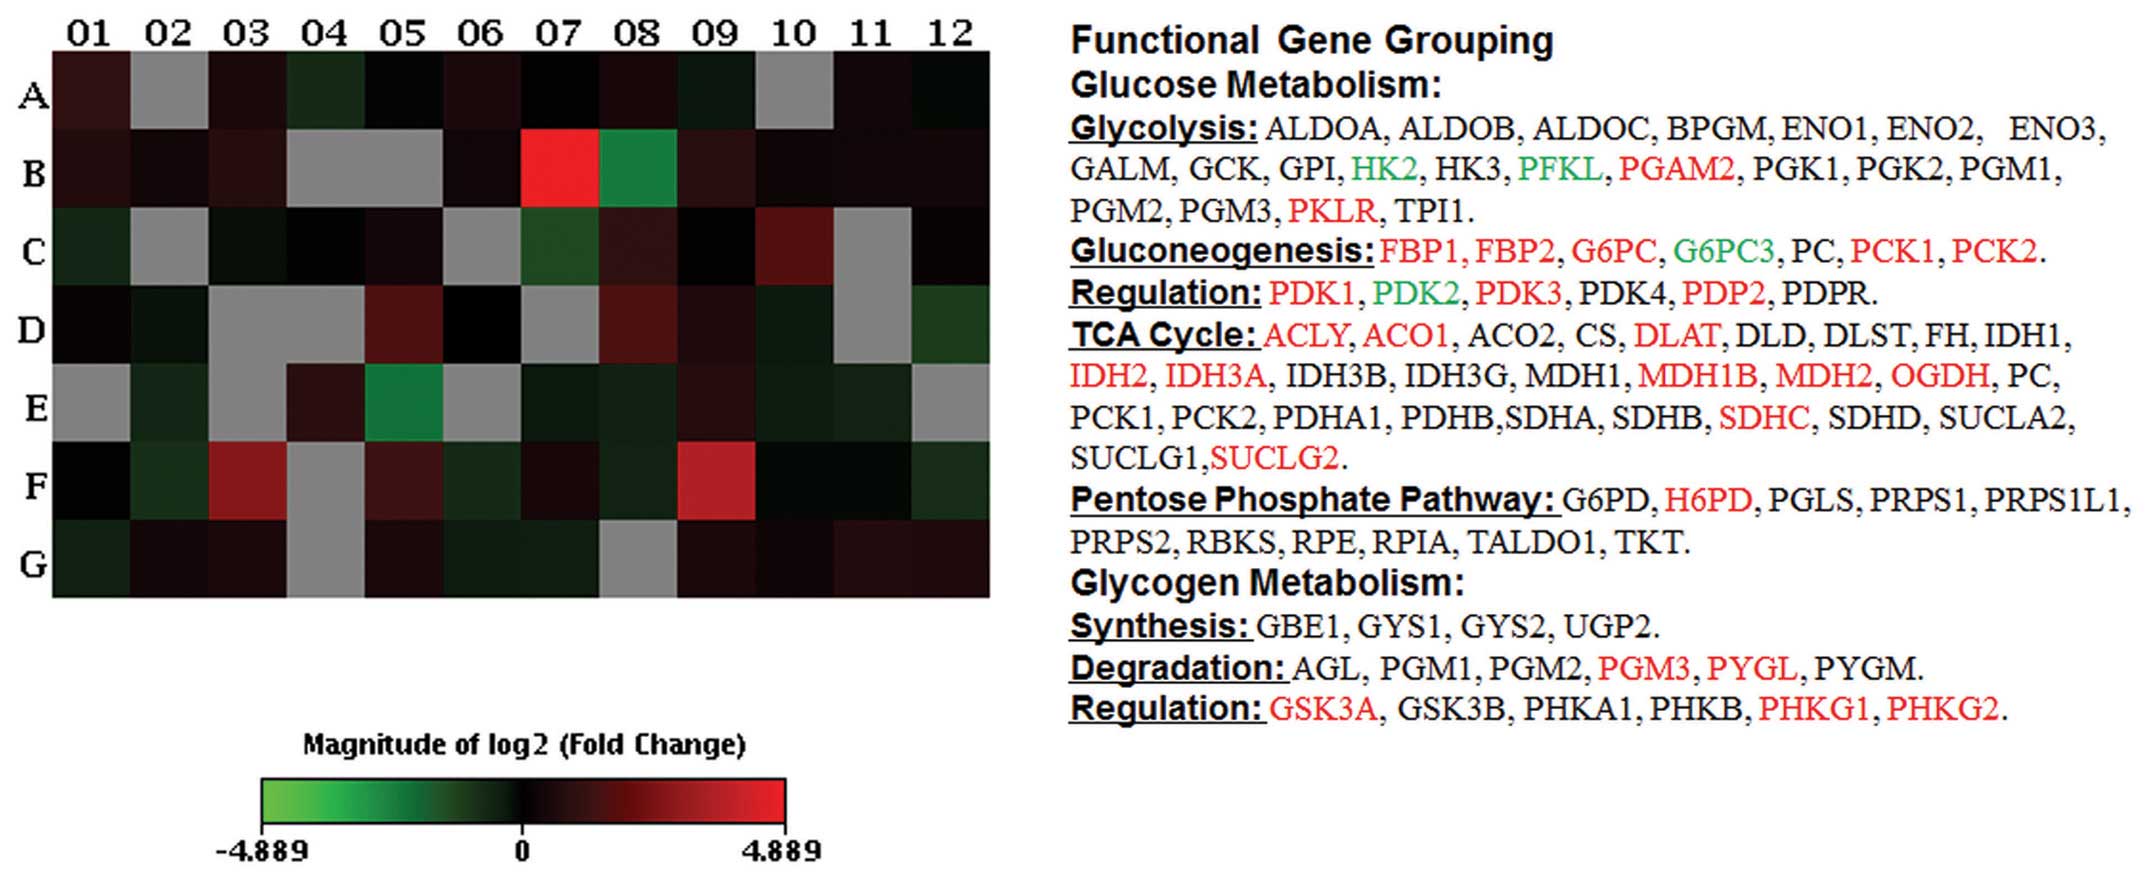
To gain further insight into the regulation of
glucose metabolism by S1, the expression levels of the human
glucose metabolism-related genes were examined in SKOV3 cells
treated by S1 (5 μM, 6-h exposure) using the RT2 Human
Glucose Metabolism Profiler PCR array technology.
As shown in Fig. 3,
significant downregulation of gene expression indicative of
glycolysis was induced by S1 including hexokinase 2 (HK-2; position
C7), liver phosphofructokinase (PFKL; position E5) and pyruvate
dehydrogenase kinase isozyme 2 (PDK2; position D12), consistent
with the detection of S1-induced inhibition of glucose uptake and
lactate secretion (as detailed in Fig.
2). Upregulation of hexose-6-phosphate dehydrogenase (H6PD;
position C6), which is responsive to the pentose phosphate pathway,
was observed. S1 also affected tricarboxylic acid (TCA) cycle
encoding genes [upregulation of ATP citrate lyase (ACLY; position
A1), aconitase 1 (ACO1; position A2), dihydrolipoamide
S-acetyltransferase (DLAT; position A10), isocitrate dehydrogenase
2 (IDH2; position C10), isocitrate dehydrogenase 3α (IDH3A;
position C11), malate dehydrogenase 1B (MDH1B; position D3), malate
dehydrogenase 2 (MDH2; position D4), oxoglutarate α-ketoglutarate
ehydrogenase (OGDH; position D5), succinate dehydrogenase complex
subunit C (SDHC; position G4), succinate-CoA ligase GDP-forming β
subunit (SUCLG2; position G8)]. In addition, S1-treatment changed
expression of genes encoding enzymes involved in gluconeogenesis
[upregulation of fructose-1,6-bisphosphatase 1 (FBP1; position B4),
fructose-1,6-bisphosphatase 2 (FBP2; position B5),
glucose-6-phosphatase catalytic subunit (G6PC; position B7),
phosphoenolpyruvate carboxykinase 1 (PCK1; position D7),
phosphoenolpyruvate carboxykinase 2 (PCK2; position D8)], together
with downregulation of glucose 6 phosphatase catalytic 3 (G6PC3;
position B8)]. The array results show that S1 inhibits glycolysis
and activates gluconeogenesis and TCA cycle at the mRNA level in
SKOV3 cells.
Mitochondrial localization of SIRT3 is
promoted by S1 treatment
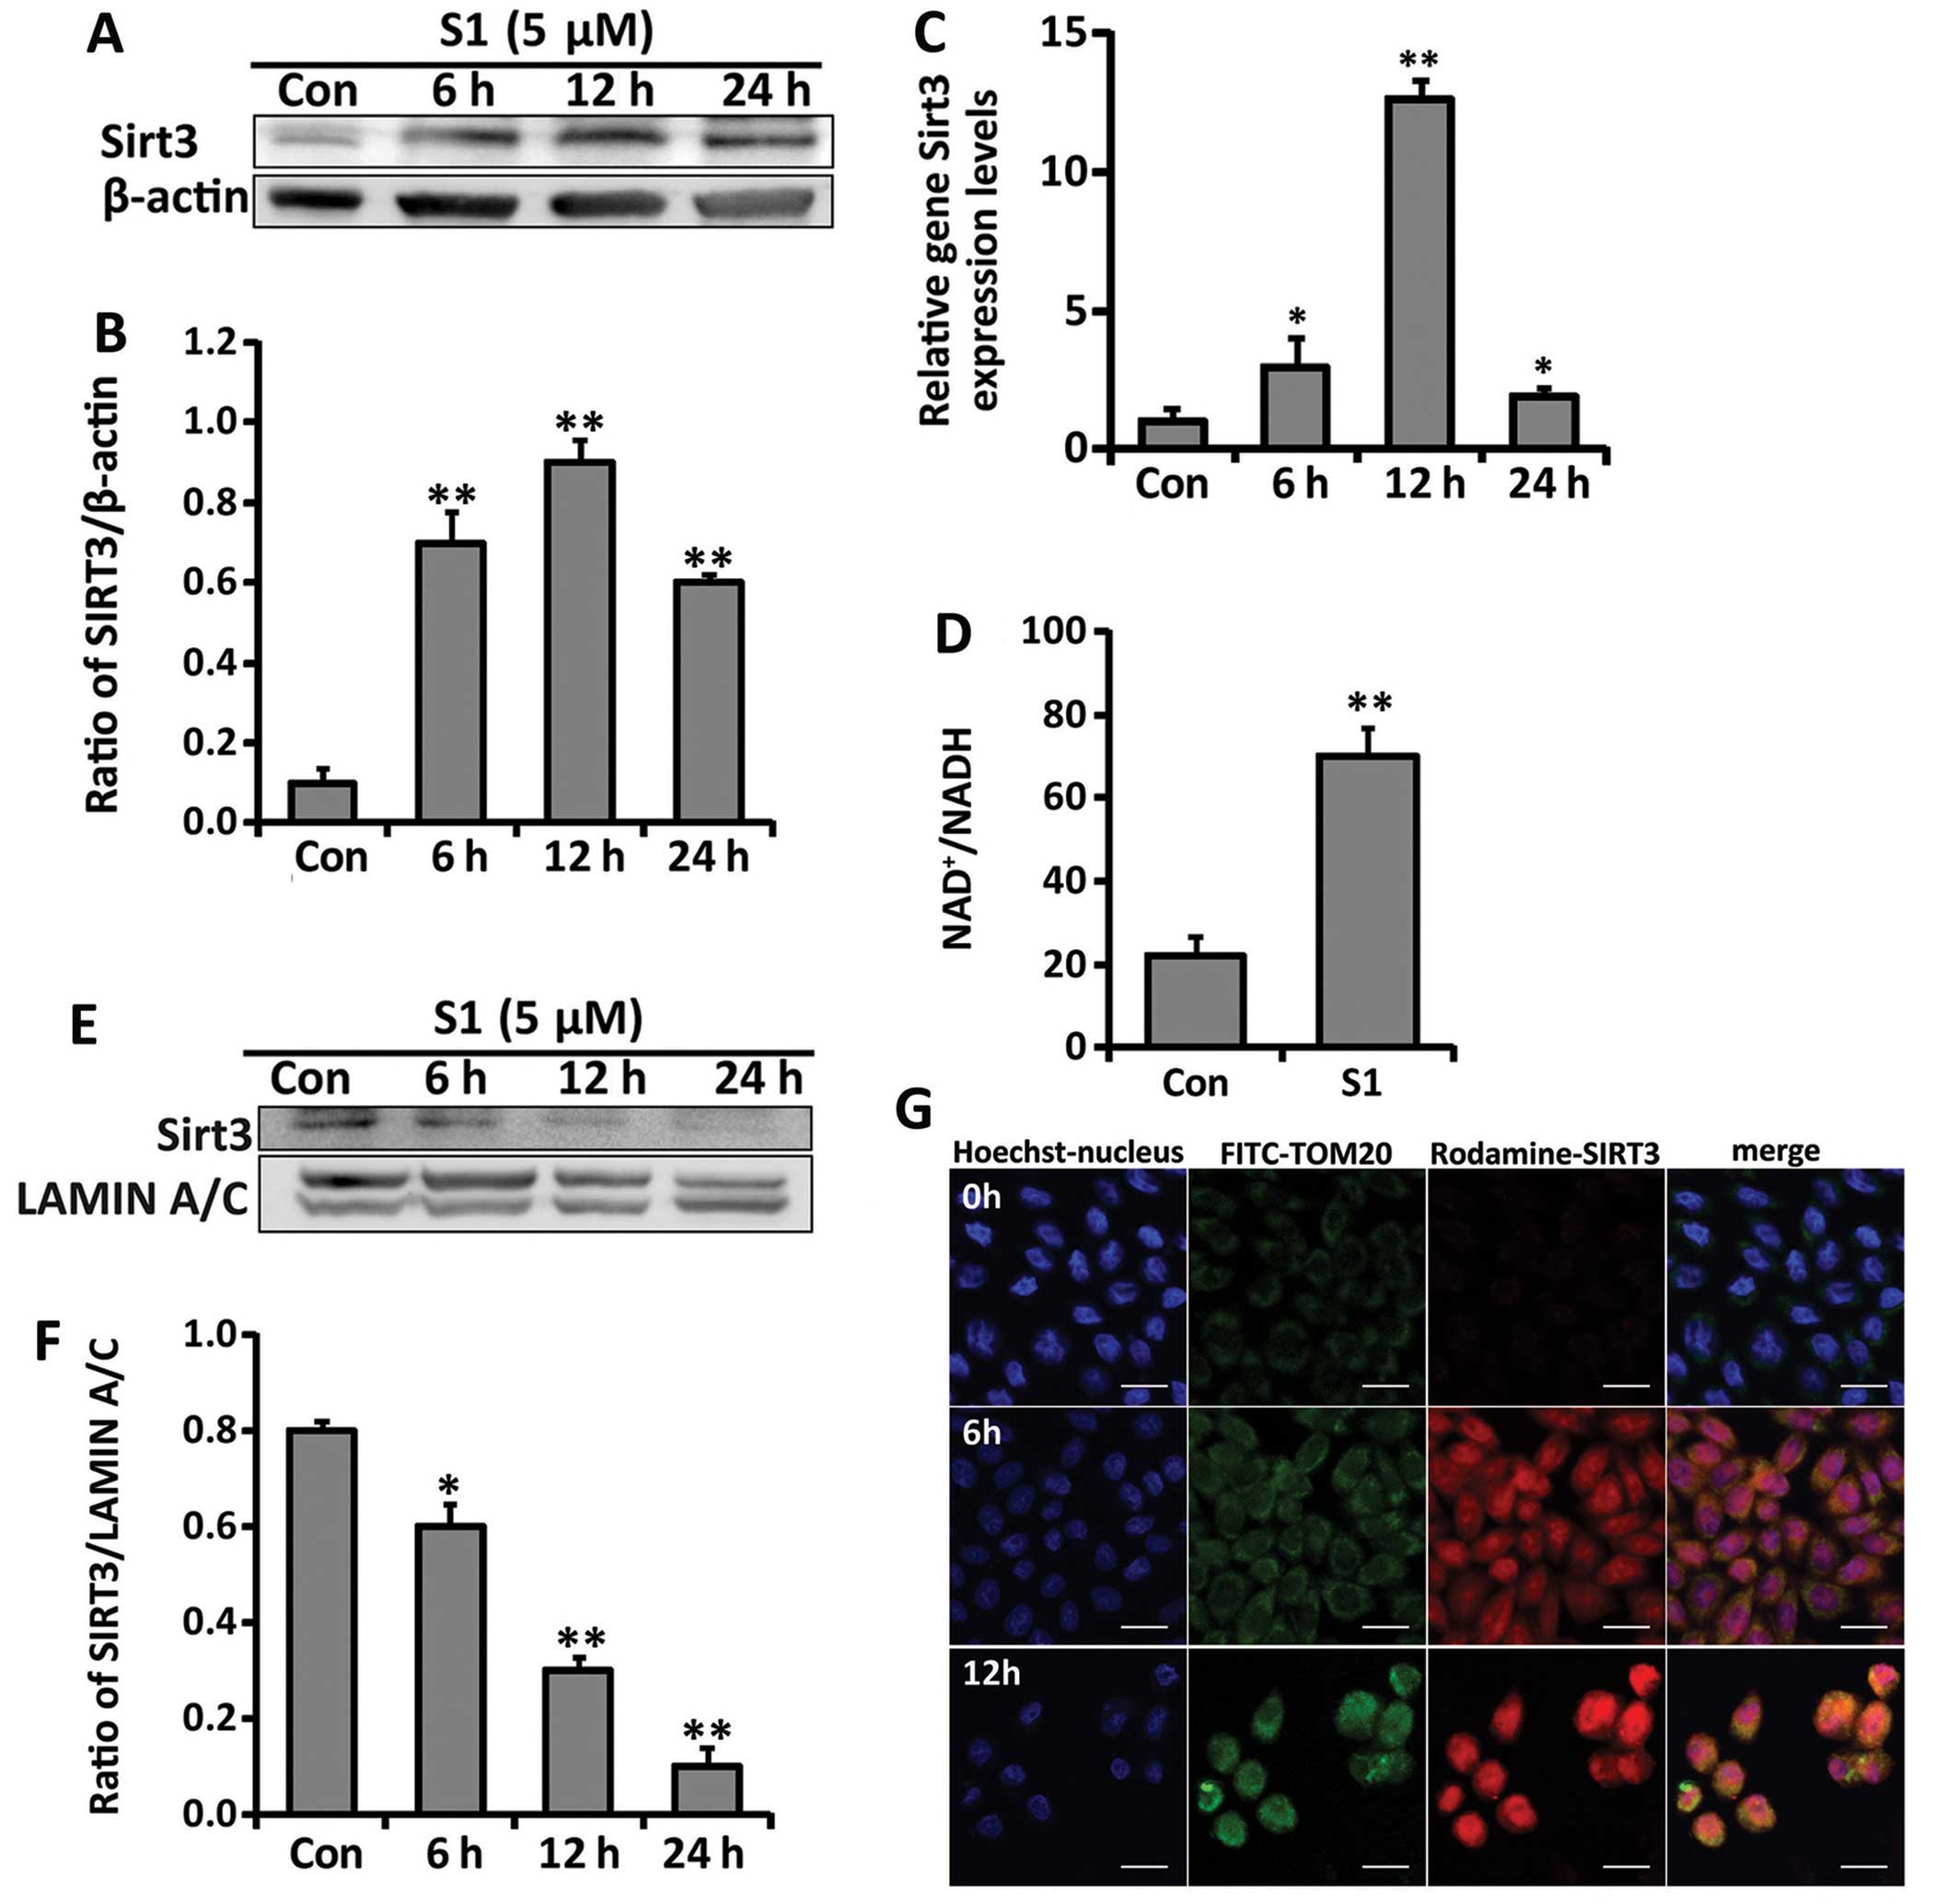
SIRT3, a mitochondrial stress protein, is a key
regulator of cancer metabolism and apoptosis (21). Because S1 inhibited mitochondrial
respiration and glycolysis and induced apoptosis in SKOV3 cells, we
considered whether SIRT3 was involved in this role. By observing
the gene and protein expression of SIRT3, we found that S1
upregulated SIRT3 in a time-dependent manner (Fig. 4A–C). As NAD+ is an
important cofactor for the activation of SIRT3, we also checked
whether the intracellular NAD+/NADH ratio was modulated
by S1. We found that S1 effectively increased the intracellular
NAD+/NADH ratio, which may contribute to the activation
of SIRT3 (Fig. 4D).
Although SIRT3 has been reported to be exclusively
expressed in mitochondria (14),
another study showed that it may exist in the nucleus and
translocate to the mitochondria under stress (22). In this study, western blot analysis
and immunofluorescence studies of the protein expression of SIRT3
suggested that S1 induced the SIRT3 translocation from the nucleus
to mitochondria (Fig. 4E–G). A
decrease in the nuclear expression of SIRT3 was matched by an
increase in its colocalization with TOM20, a mitochondrial marker.
These results indicate that S1 upregulates the expression of SIRT3
and induces its translocation from the nucleus to mitochondria.
SIRT3 activation contributes to
S1-induced apoptosis and glycolysis inhibition
To examine the role of SIRT3 activation after S1
treatment, we first used small interfering (si)RNA to knockdown
SIRT3 expression, and then determined the effects of this on
S1-induced growth inhibition. We transfected SKOV3 cells with siRNA
against SIRT3 or non-target sequence for 48 h. As shown in Fig. 5A, the SIRT3 protein expression was
significantly decreased in siSIRT3-23507 group compared with cells
transfected with control siRNA, and we adopted this effective siRNA
to knockdown SIRT3 expression. Importantly, SIRT3 knockdown
alleviated S1-induced growth inhibition compared with control siRNA
cells (Fig. 5B and C).
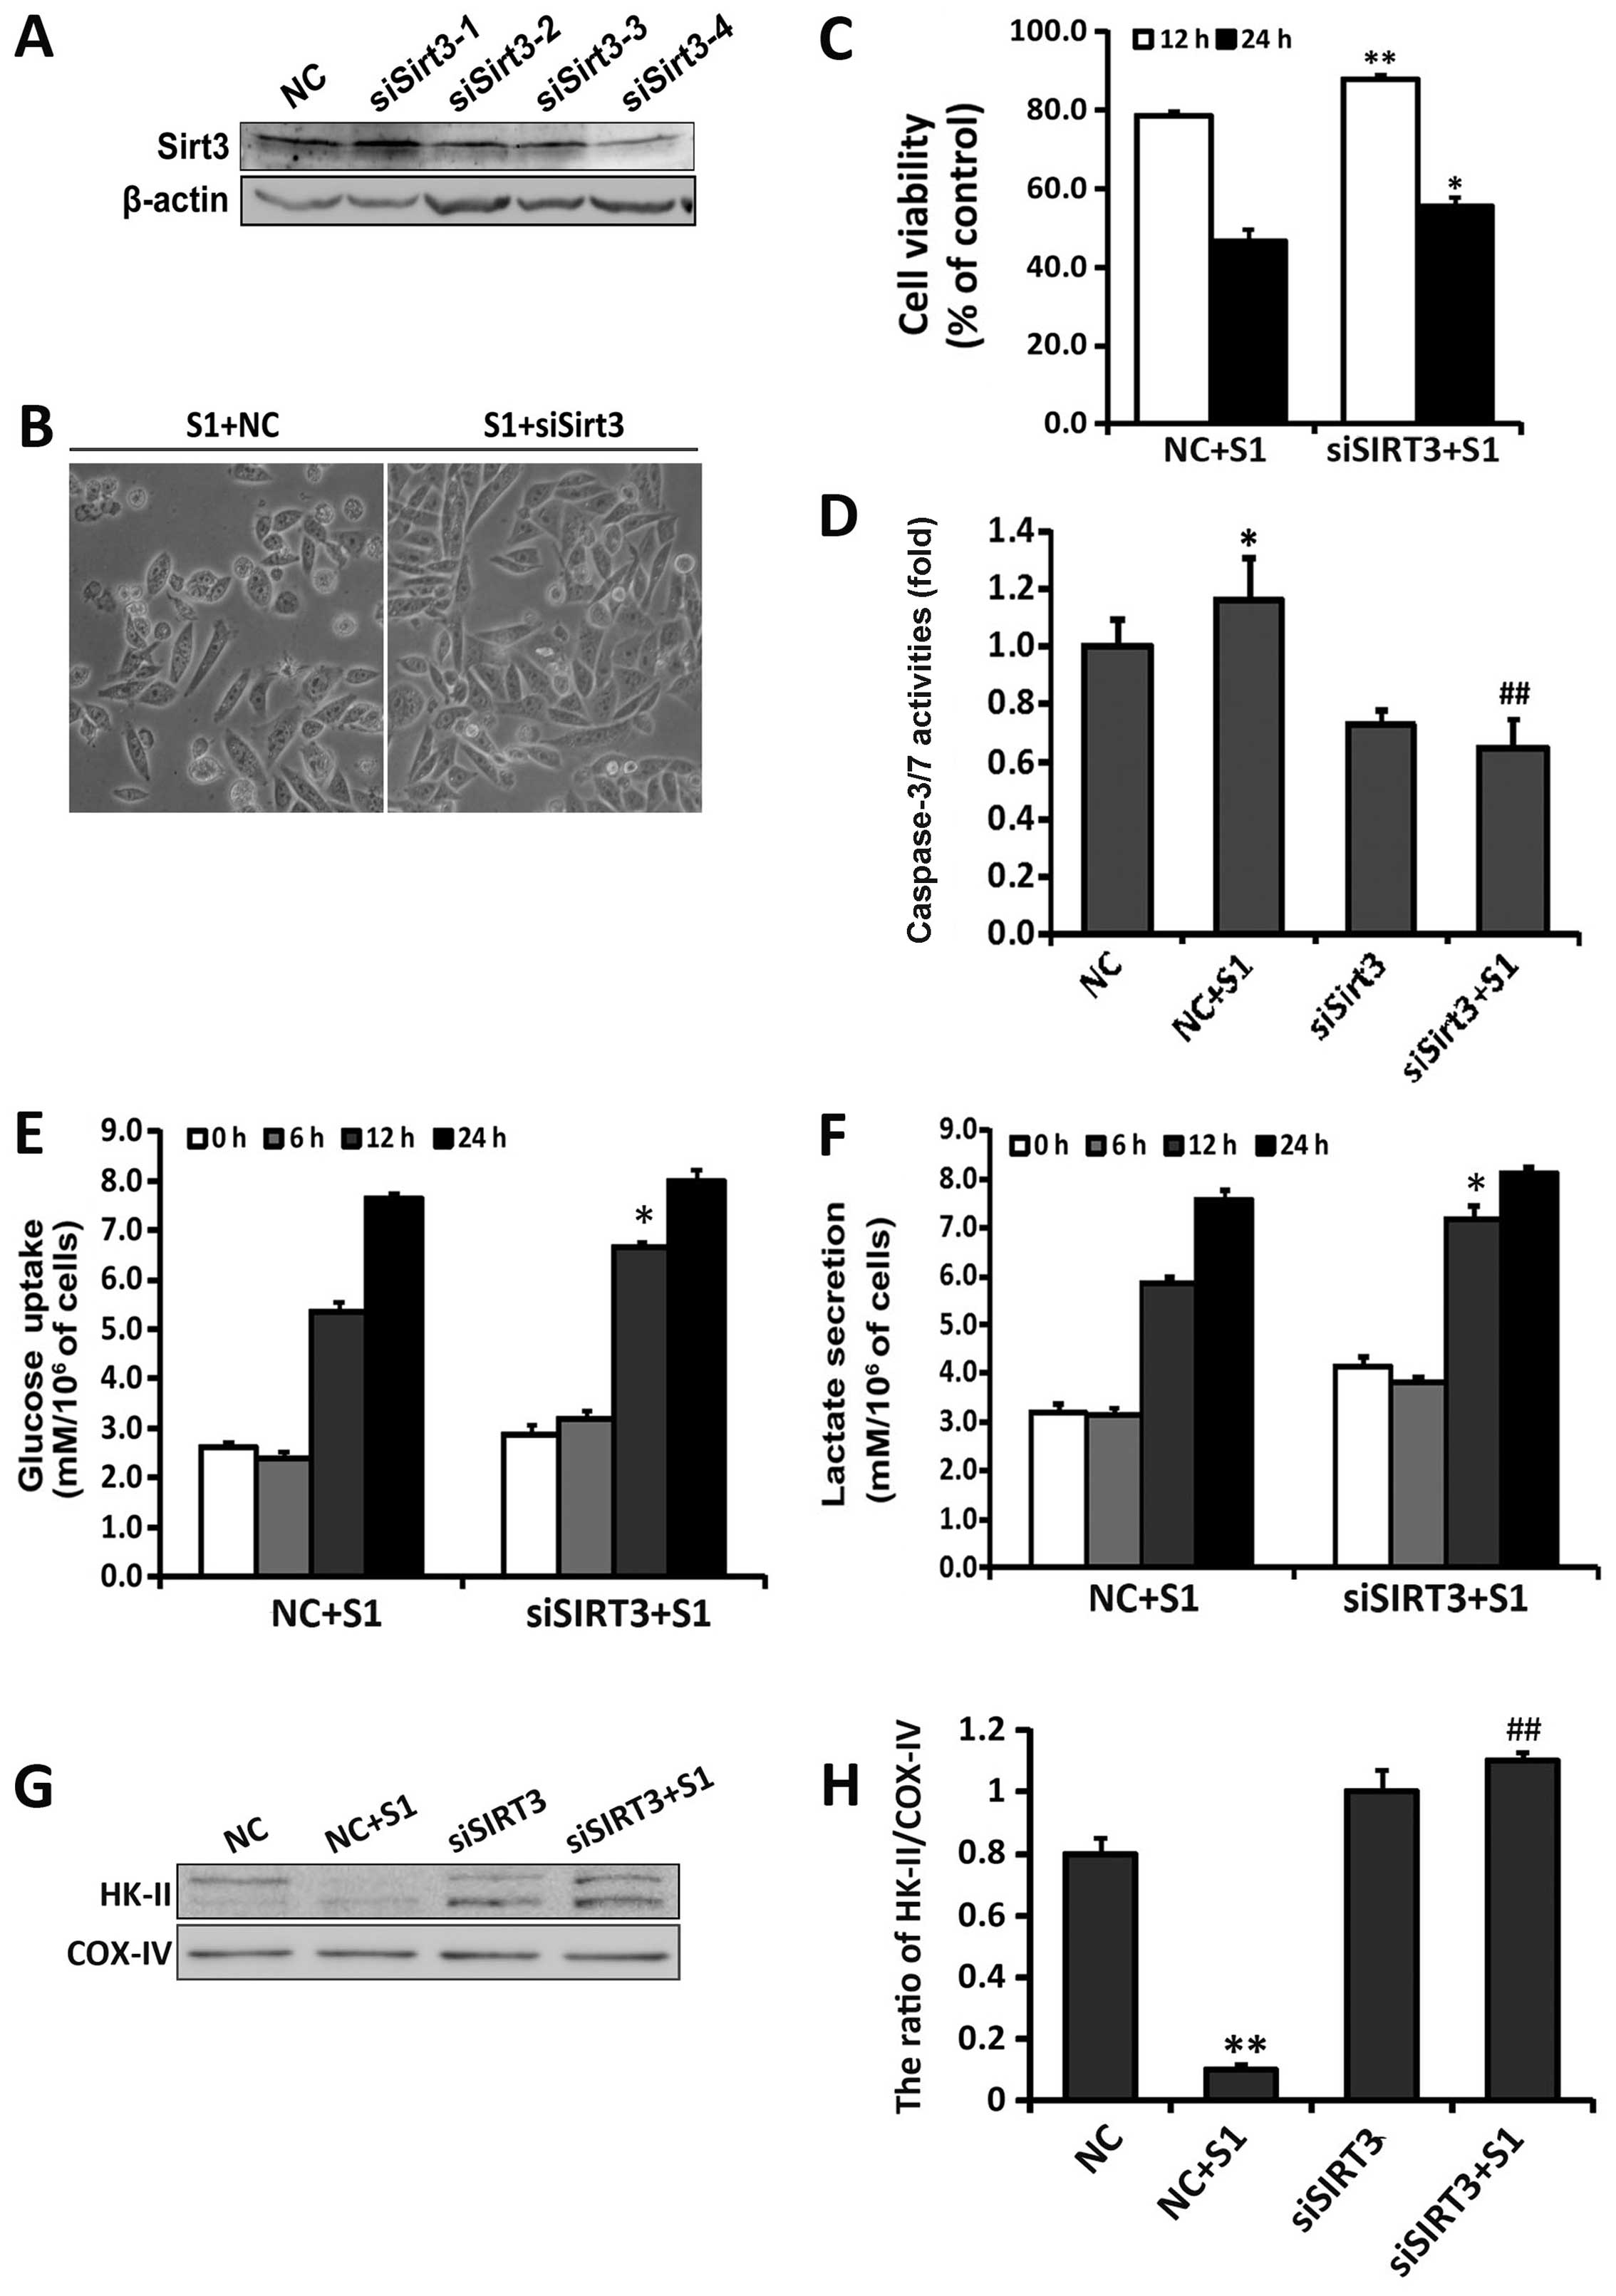 | Figure 5Knockdown of SIRT3 decreases
S1-induced cell death and alleviates the inhibition of glycolysis.
SKOV3 cells were transfected with SIRT3 siRNA (siSIRT3) and
non-target sequence siRNA (NC). (A) Western blot analyzed the
knockdown efficiency of the four siRNAs targeting SIRT3. SKOV3
cells were transfected with siSIRT3 (siSIRT3-23504, siSIRT3-23505,
siSIRT3-23506 and siSIRT3-23507) and NC for 48 h, respectively. (B)
Cell morphology was observed using an optical microscope (bar, 50
μm). (C) Cell viability was determined by MTT assay. Data are
presented as mean ± SD (n=3). *P<0.05,
**P<0.01 compared with the S1-treated NC group. (D)
Caspase-3/7 activities in transfected SKOV3 cells treated with or
without S1. Data are the mean ± SEM (n=3). *P<0.05
vs. the NC group, ##P<0.01 vs. the S1-treated NC
group. Extracellular glucose (E) and lactate (F) concentrations
were determined enzymatically in the culture media and expressed as
a relative metabolite concentration after indicated times and after
normalization to protein content. *P<0.05, compared
with control group (n=3). (G) Western blot analysis of HK-II
protein expression in the mitochondria of transfected SKOV3 cells
treated with or without S1. (H) Quantitation of SIRT3 protein level
normalized to COX-IV. Data were presented as mean ± SD, n=3,
*P<0.05 vs. the NC group, ##P<0.01 vs.
the S1-treated NC group. |
Next, we assessed the role of SIRT3 in S1-induced
apoptosis. After 24-h treatment with 5 μM S1, a significant
decrease in caspase-3/7 activity was shown in siSIRT3-SKOV3 cells
compared with cells transfected with control siRNA (Fig. 5D). To further investigate whether
the activation of SIRT3 is involved in the regulation of glucose
metabolism by S1, we examined cellular metabolic profiles by
measuring extracellular glucose and lactate levels in the growth
media of SKOV3 cells transfected with siRNA against SIRT3 or
non-target sequence. The consumption of glucose and lactate
secretion after 12-h treatment with S1 were considerably higher in
siSIRT3-SKOV3 than control-transfected cells (Fig. 5E and F). Previous research found
that a potential anticancer drug Oroxylin A could inhibit
glycolysis and induce the dissociation of hexokinase II from the
mitochondria in human breast carcinoma cell lines, which is related
to the activation of SIRT3 (23).
We also checked whether the activation of SIRT3 induced by S1 could
affect the expression of HK-II in the mitochondria. As shown in
Fig. 5G, compared with control
transfected group, knockdown of SIRT3 increased the expression of
HK-II in the mitochondria after S1 treatment. These results
indicate that the activation of SIRT3 exerts a pro-apoptotic role
in S1-treated SKOV3 cells, and may contribute to the regulation of
glucose metabolism by S1.
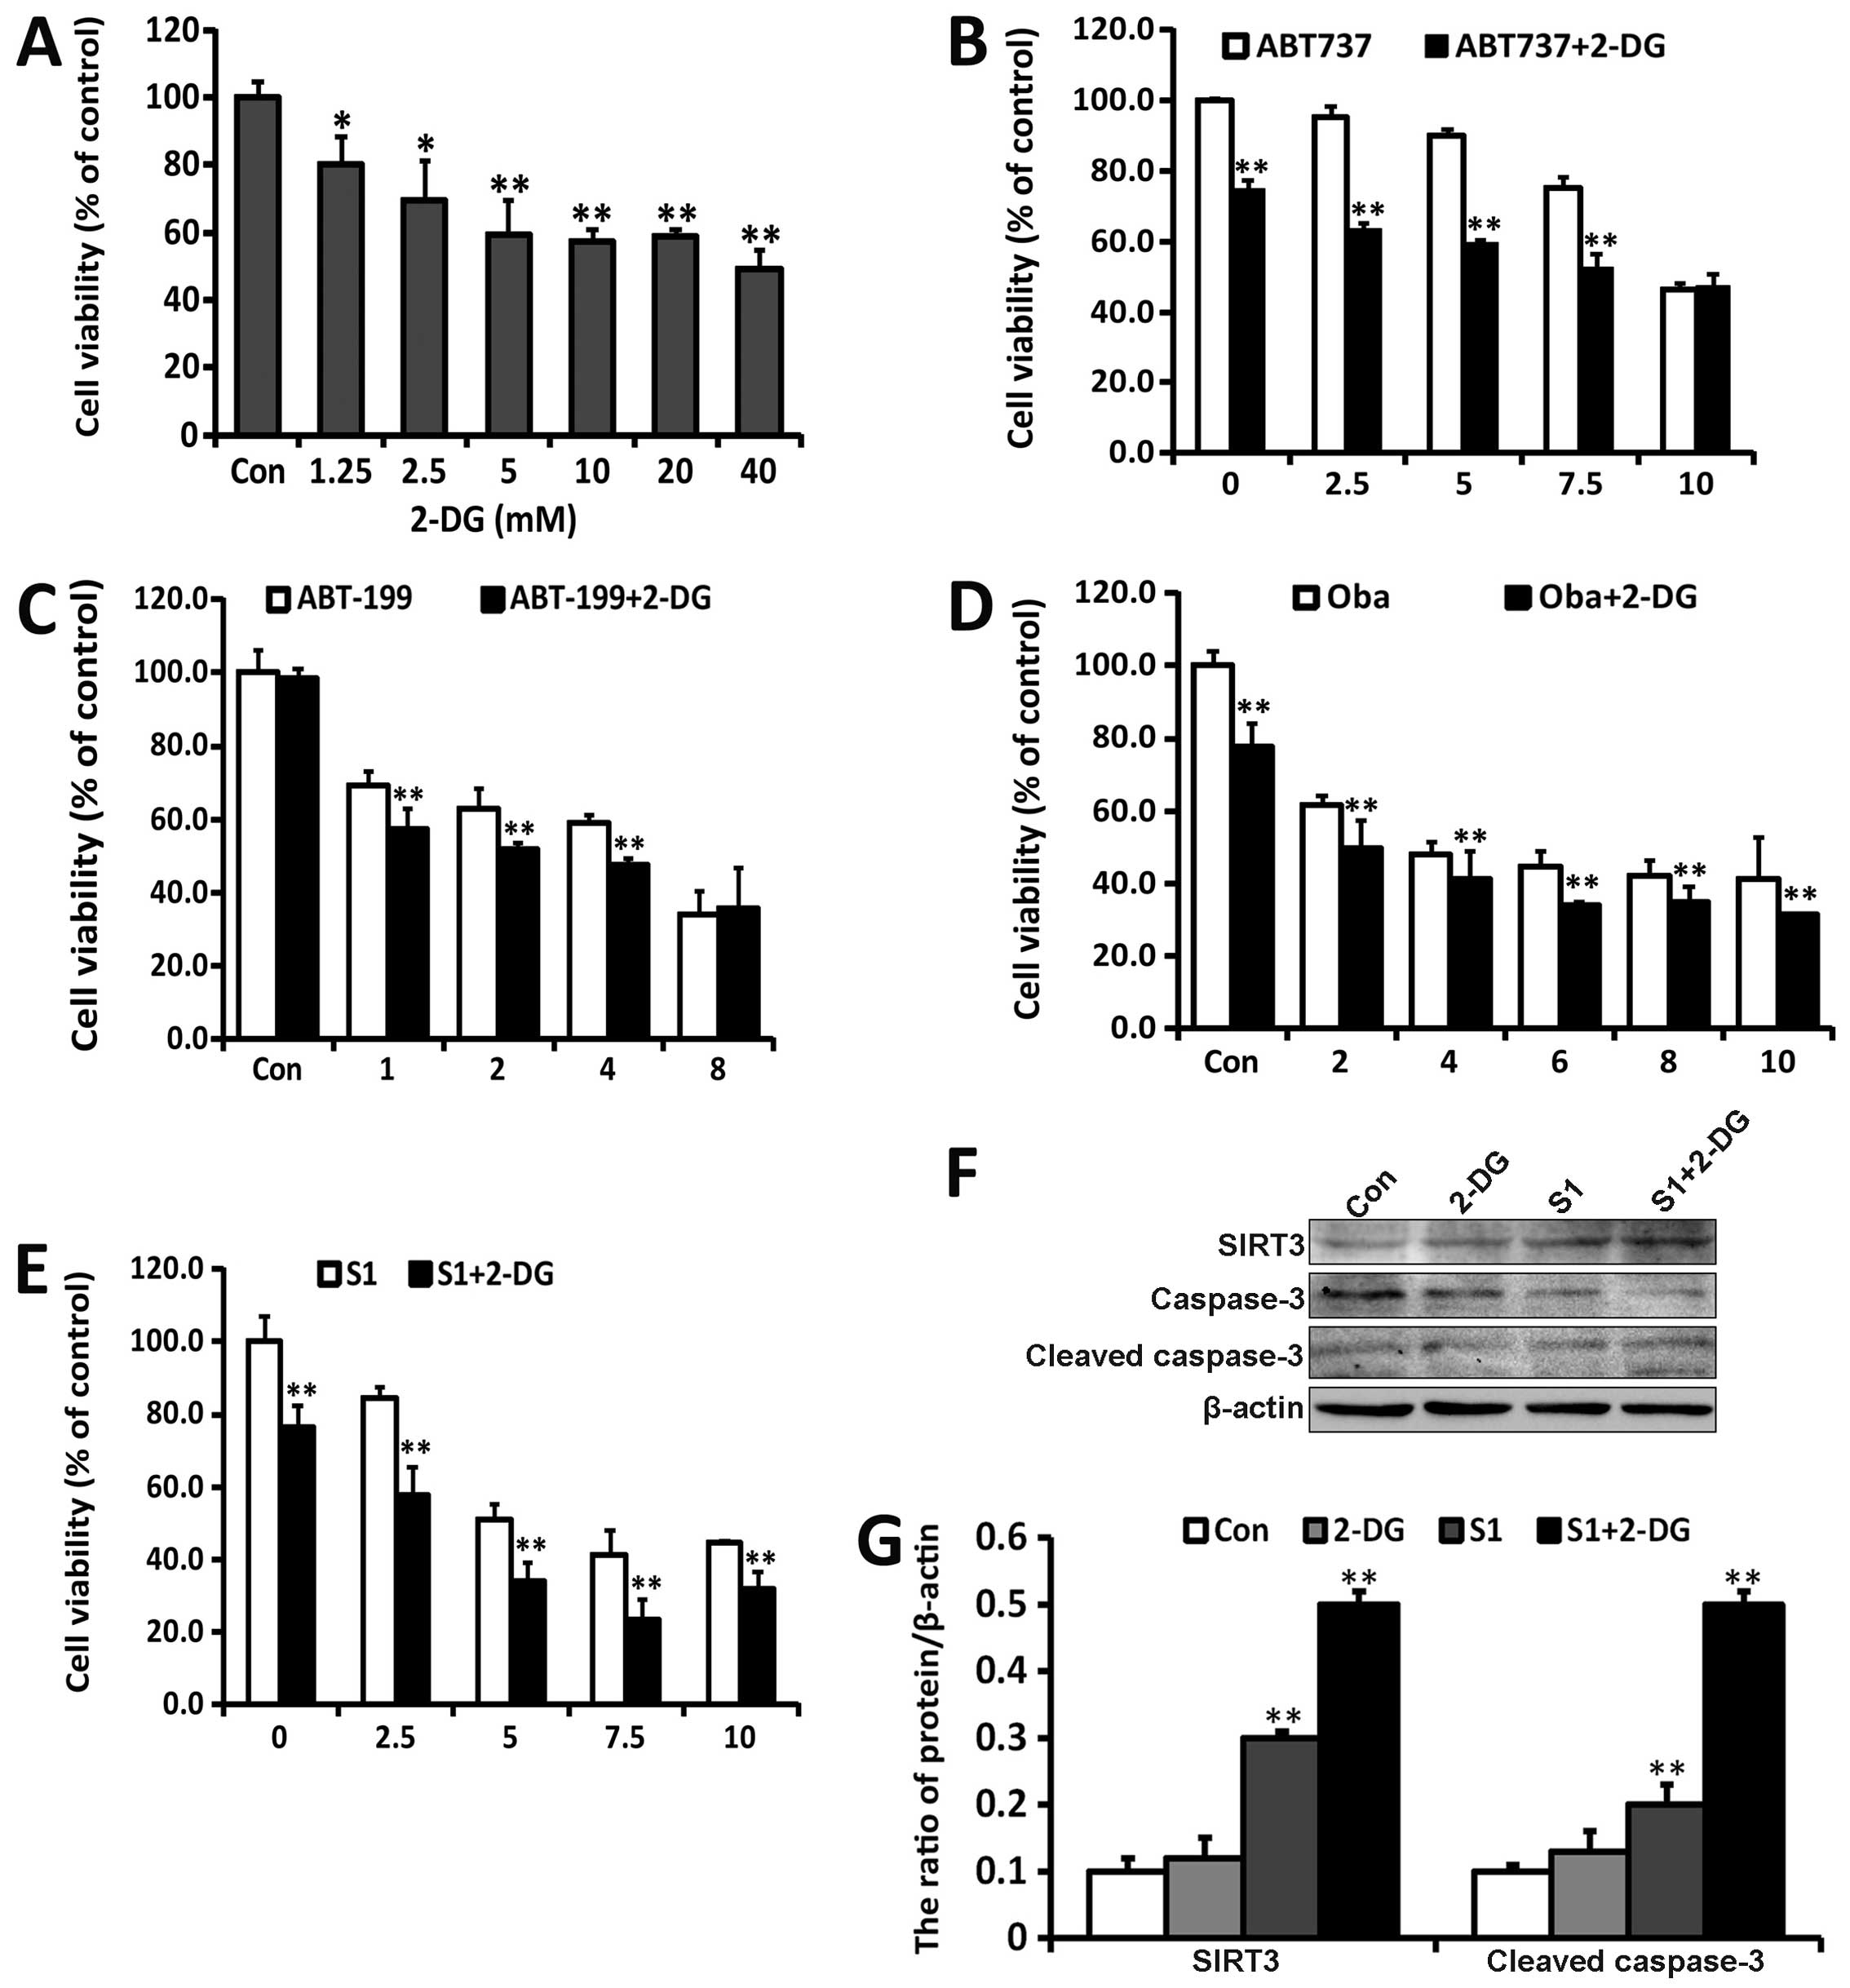
Combination of S1 with glycolysis
inhibitor 2-DG aggravates apoptosis
In MTT assays, use of a combination of 2-DG with
Bcl-2 inhibitors such as ABT737, ABT199, Oba, and S1 inhibited cell
viability to a greater extent than that of cells treated only with
Bcl-2 inhibitors (Fig. 6A–E). To
determine the effect on apoptosis, we examined the activation of
caspase-3 in SKOV3 cells treated with S1 and/or 2-DG for 24 h
(Fig. 6F). 2-DG upregulated the
activation of caspase 3 induced by S1, which correlated with the
upregulation of SIRT3 (Fig. 6G).
These results demonstrated that the manipulation of Bcl-2
inhibitors combined with the use of classic glycolysis inhibitors
may be rational strategies to improve ovarian cancer therapy
through glycolysis inhibition and targeting mitochondrial apoptotic
machinery.
Discussion
During ovarian cancer progression cells become more
glycolytic (24), so metabolic
interventions have been proposed as promising treatment strategies
(13). We previously demonstrated
that the BH3 mimetic S1 induces endoplasmic reticulum
stress-associated apoptosis through activating the c-Jun N-terminal
kinase (JNK) signaling pathway in human ovarian cancer cells
(25). However, the effect of S1
on ovarian cancer cell metabolism remained unclear. In this study,
we found that SIRT3, which is involved in the reprogramming of
metabolism and apoptosis, was upregulated in S1-treated SKOV3
cells. Moreover, our data also showed that S1 interrupted glucose
metabolism by inhibiting mitochondrial respiration and glycolysis
in SKOV3 cells. PCR array results demonstrated that S1 inhibited
glycolysis and activated gluconeogenesis and TCA cycle at the mRNA
level, suggesting the involvement of metabolic regulation in
S1-induced cytotoxicity. Moreover, SIRT3 knockdown using siRNA
alleviated S1-induced apoptosis and glycolysis inhibition. The
combination of S1 with the classic glycolysis inhibitor 2-DG
appeared to intensify the antitumor effects of S1 through further
upregulation of SIRT3 expression in ovarian cancer cells. These
results indicate that S1 exerts anticancer roles in SKOV3 cells
through the interruption of glucose metabolism and induction of
apoptosis involving the activation of SIRT3.
Other groups have shown that antiapoptotic proteins
such as Bcl-xL and Mcl-1 may exert regulatory roles in both
cellular metabolism and apoptosis (26,27).
The classic Bcl-2 inhibitor ABT737 has been demonstrated to target
oxidative phosphorylation and selectively eradicate quiescent human
leukemia stem cells (6). In this
study, we found that S1 exerted cytotoxicity against ovarian cancer
both in vitro and in vivo (Fig. 1). To investigate whether the
effects of S1 on glucose metabolism are involved in its
cytotoxicity, we measured the OCR, which is indicative of
mitochondrial respiration, and the ECAR, which is indicative of
glycolysis. Early responses to S1 exposure (6 h) involved a
significant decrease in OCR and a slight increase in ECAR (Fig. 2). By measuring extracellular
metabolites, we found that glucose consumption and lactate
production were reduced after a long exposure to S1 (12 h)
(Fig. 2). The glucose
metabolism-related gene expression array analysis further
demonstrated that S1 treatment inhibited glycolysis (Fig. 3). These results indicate that S1
inhibits mitochondrial respiration and glycolysis in SKOV3 cells.
Upon addition of other Bcl-2 inhibitors such as ABT-737, ABT-199
and oba, the cellular respiration and acidification demonstrated
different changes, which may be related to their respective
specific target. These results indicate that it is necessary to
study the effects of different types of Bcl-2 inhibitors on the
metabolism.
Because oxidative phosphorylation and glycolysis are
the main intracellular sources of adenosine triphosphate (ATP)
production (28), we next checked
the effect of S1 on ATP production. Our results showed that S1
inhibited ATP production in SKOV3 cells (Fig. 2). Thus, it appears that the Bcl-2
inhibitor S1 affects cellular metabolism through inhibiting
mitochondrial respiration and glycolysis, leading to a decrease in
ATP production. Intracellular ATP levels have been shown to be a
pivotal determinant of chemoresistance in colon cancer cells
(29). Interruption of ATP levels
through targeting glycolysis or inhibiting ATP citrate lyase can
suppress tumor cell growth (30,31).
Our results showed that S1 downregulates the intracellular ATP
level in SKOV3 cells, which may be intertwined with its antitumor
effects.
SIRT3 was initially thought to be an important
mitochondrial nicotinamide adenine dinucleotide
(NAD+)-dependent deacetylase (14) that regulates the mitochondrial
adaptive response to stress through antioxidant defense mechanisms
(16). Indeed, it was reported to
be activated in myocytes during genotoxic and oxidative stress
(32). SIRT3 expression was also
found to be increased after Bcl-2 silencing in HCT116 human
epithelial cancer cells through the JNK pathway (17). We previously showed that S1 induces
oxidative stress and activates the JNK pathway in ovarian cancer
cells (33). In this study, S1 was
shown to upregulate the expression of SIRT3 in SKOV3 cells. We also
observed that S1 induced the translocation of SIRT3 from the
nucleus to the mitochondria, which supports the findings of an
earlier study (22). Because SIRT3
has been shown to serve as an important regulator of the balance
between glycolytic and anabolic pathways and mitochondrial
oxidative metabolism (15), we
speculate that SIRT3 may be a key factor which participates in the
regulation of both glucose metabolism and apoptosis induced by
S1.
The function of SIRT3 varies in different normal and
tumor tissues, and may be cell- and tumor-type specific (34). For example, combined with radiation
and chemotherapy treatments, SIRT3 downregulation in OSCC cells
further inhibited cell growth and increased cell death (35). Moreover, SIRT3 promotes cell
survival of HT22 cells through attenuating oxidative stress induced
by hydrogen peroxide and protecting mitochondrial function
(36). In contrast, other reports
indicate a proapoptotic function for SIRT3. SIRT3 was shown to
induce growth arrest and apoptosis in several colorectal carcinoma
and osteosarcoma cells, and in noncancer human cell lines such as
retinal epithelial cells and lung fibroblasts (17).
As a novel antitumor target, the role of SIRT3 in
ovarian cancer remains unclear. Here, we found that SIRT3 knockdown
attenuated the apoptosis induced by S1, indicating that the
activation of SIRT3 induced by S1 exerted a proapoptotic role in
SKOV3 cells. In addition to regulating apoptosis, other studies
have also shown that SIRT3 may regulate the activity of enzymes to
coordinate global shifts in cellular metabolism (15). We found that SIRT3 knockdown
effectively decreased the consumption of glucose and the production
of lactate induced by S1 in SKOV3 cells. Furthermore, SIRT3
knockdown increased the expression of mitochondria-localized HK-II,
a key glycolytic enzyme. Studies have shown that SIRT3-mediated
dissociation of HK II from the mitochondria may activate apoptosis
and inhibit glycolysis in some cancer cells (23,37).
These results indicated that SIRT3 activation is involved in the
interruption of glucose metabolism and the induction of apoptosis
induced by S1.
Tumor glycolysis is regarded as a target for cancer
therapy (38), and experimental
data show that the inhibition of glycolysis enhances
cisplatin-induced apoptosis in ovarian cancer cells (39). Because our findings showed that
earlier exposure to S1 mainly reduces mitochondrial respiration and
that the upregulation of glycolysis seemed to be a compensatory
effect, we speculated that the glycolysis inhibitor 2-DG would
further aggravate the apoptosis induced by S1. Our study
demonstrated that the inhibition of glycolysis may also enhance
S1-induced apoptosis in ovarian cancer cells, with further
upregulation of SIRT3. SIRT3 silencing partially reversed the
effects of S1 on cell metabolism and apoptosis, while a combination
of 2-DG and S1 further promoted the activation of apoptosis through
enhancing the expression of SIRT3. In conclusion, our study shows
that glycolysis should be considered a potential target for the
improvement of S1 efficacy. Moreover, we show that SIRT3 is
involved in both the glucose metabolism interruption and apoptosis
induced by S1. Therefore, a novel strategy for tumor therapy could
exploit the role of SIRT3 to enhance the antitumor effect of BH3
mimetics.
Acknowledgements
This study was supported by National Natural Science
Foundation of China (nos. 81272876, 81472419 and 81541148) and the
Foundation of Jilin Provincial Department of Health (no.
2013Z062).
Abbreviations:
|
SIRT3
|
Sirtuin-3
|
|
2-DG
|
2-deoxy-D-glucose
|
|
BH3
|
Bcl-2 homology domain 3
|
|
Oba
|
obatoclax mesylate
|
|
OCR
|
oxygen consumption rate
|
|
ECAR
|
extracellular acidification rates
|
|
TCA
|
tricarboxylic acid cycle
|
References
|
1
|
Quinn BA, Dash R, Azab B, Sarkar S, Das
SK, Kumar S, Oyesanya RA, Dasgupta S, Dent P, Grant S, et al:
Targeting Mcl-1 for the therapy of cancer. Expert Opin Investig
Drugs. 20:1397–1411. 2011. View Article : Google Scholar : PubMed/NCBI
|
|
2
|
Su J, Zhou L, Xia MH, Xu Y, Xiang XY and
Sun LK: Bcl-2 family proteins are involved in the signal crosstalk
between endoplasmic reticulum stress and mitochondrial dysfunction
in tumor chemotherapy resistance. BioMed Res Int. 2014:2343702014.
View Article : Google Scholar : PubMed/NCBI
|
|
3
|
Hartman MŁ and Czyż M: BH3 mimetics as a
strategy to complement anticancer therapies. Postepy Hig Med Dosw
(Online). 66:67–77. 2012.(In Polish).
|
|
4
|
Giménez-Cassina A and Danial NN:
Regulation of mitochondrial nutrient and energy metabolism by BCL-2
family proteins. Trends Endocrinol Metab. 26:165–175. 2015.
View Article : Google Scholar : PubMed/NCBI
|
|
5
|
Chen ZX and Pervaiz S: Involvement of
cytochrome c oxidase subunits Va and Vb in the regulation of cancer
cell metabolism by Bcl-2. Cell Death Differ. 17:408–420. 2010.
View Article : Google Scholar
|
|
6
|
Lagadinou ED, Sach A, Callahan K, Rossi
RM, Neering SJ, Minhajuddin M, Ashton JM, Pei S, Grose V, O'Dwyer
KM, et al: BCL-2 inhibition targets oxidative phosphorylation and
selectively eradicates quiescent human leukemia stem cells. Cell
Stem Cell. 12:329–341. 2013. View Article : Google Scholar : PubMed/NCBI
|
|
7
|
Mérad-Saïdoune M, Boitier E, Nicole A,
Marsac C, Martinou JC, Sola B, Sinet PM and Ceballos-Picot I:
Overproduction of Cu/Zn-superoxide dismutase or Bcl-2 prevents the
brain mitochondrial respiratory dysfunction induced by glutathione
depletion. Exp Neurol. 158:428–436. 1999. View Article : Google Scholar : PubMed/NCBI
|
|
8
|
Kueck A, Opipari AW Jr, Griffith KA, Tan
L, Choi M, Huang J, Wahl H and Liu JR: Resveratrol inhibits glucose
metabolism in human ovarian cancer cells. Gynecol Oncol.
107:450–457. 2007. View Article : Google Scholar : PubMed/NCBI
|
|
9
|
Muñoz-Pinedo C, El Mjiyad N and Ricci JE:
Cancer metabolism: Current perspectives and future directions. Cell
Death Dis. 3:e2482012. View Article : Google Scholar : PubMed/NCBI
|
|
10
|
Deberardinis RJ, Sayed N, Ditsworth D and
Thompson CB: Brick by brick: Metabolism and tumor cell growth. Curr
Opin Genet Dev. 18:54–61. 2008. View Article : Google Scholar : PubMed/NCBI
|
|
11
|
Andersen JL and Kornbluth S: The tangled
circuitry of metabolism and apoptosis. Mol Cell. 49:399–410. 2013.
View Article : Google Scholar : PubMed/NCBI
|
|
12
|
Green DR, Galluzzi L and Kroemer G: Cell
biology. Metabolic control of cell death. Science. 345:1250256.
2014. View Article : Google Scholar : PubMed/NCBI
|
|
13
|
Suh DH, Kim MK, No JH, Chung HH and Song
YS: Metabolic approaches to overcoming chemoresistance in ovarian
cancer. Ann NY Acad Sci. 1229:53–60. 2011. View Article : Google Scholar : PubMed/NCBI
|
|
14
|
Kim HS, Patel K, Muldoon-Jacobs K, Bisht
KS, Aykin-Burns N, Pennington JD, van der Meer R, Nguyen P, Savage
J, Owens KM, et al: SIRT3 is a mitochondria-localized tumor
suppressor required for maintenance of mitochondrial integrity and
metabolism during stress. Cancer Cell. 17:41–52. 2010. View Article : Google Scholar : PubMed/NCBI
|
|
15
|
Finley LWS and Haigis MC: Metabolic
regulation by SIRT3: Implications for tumorigenesis. Trends Mol
Med. 18:516–523. 2012. View Article : Google Scholar : PubMed/NCBI
|
|
16
|
Bell EL, Emerling BM, Ricoult SJH and
Guarente L: SirT3 suppresses hypoxia inducible factor 1α and tumor
growth by inhibiting mitochondrial ROS production. Oncogene.
30:2986–2996. 2011. View Article : Google Scholar : PubMed/NCBI
|
|
17
|
Allison SJ and Milner J: SIRT3 is
pro-apoptotic and participates in distinct basal apoptotic
pathways. Cell Cycle. 6:2669–2677. 2007. View Article : Google Scholar : PubMed/NCBI
|
|
18
|
Zhong JT, Xu Y, Yi HW, Su J, Yu HM, Xiang
XY, Li XN, Zhang ZC and Sun LK: The BH3 mimetic S1 induces
autophagy through ER stress and disruption of Bcl-2/Beclin 1
interaction in human glioma U251 cells. Cancer Lett. 323:180–187.
2012. View Article : Google Scholar : PubMed/NCBI
|
|
19
|
Song T, Chang X, Zhang Z, Liu Y and Shen
X: S1, a novel pan-BH3 mimetic, induces apoptosis in
Mcl-1-overexpressing cells through Bak. J Pharmacol Sci.
119:330–340. 2012. View Article : Google Scholar : PubMed/NCBI
|
|
20
|
Bol V, Bol A, Bouzin C, Labar D, Lee JA,
Janssens G, Porporato PE, Sonveaux P, Feron O and Grégoire V:
Reprogramming of tumor metabolism by targeting mitochondria
improves tumor response to irradiation. Acta Oncol. 54:266–274.
2015. View Article : Google Scholar
|
|
21
|
Giralt A and Villarroya F: SIRT3, a
pivotal actor in mitochondrial functions: Metabolism, cell death
and aging. Biochem J. 444:1–10. 2012. View Article : Google Scholar : PubMed/NCBI
|
|
22
|
Scher MB, Vaquero A and Reinberg D: SirT3
is a nuclear NAD+-dependent histone deacetylase that
translocates to the mitochondria upon cellular stress. Genes Dev.
21:920–928. 2007. View Article : Google Scholar : PubMed/NCBI
|
|
23
|
Wei L, Zhou Y, Dai Q, Qiao C, Zhao L, Hui
H, Lu N and Guo QL: Oroxylin A induces dissociation of hexokinase
II from the mitochondria and inhibits glycolysis by SIRT3-mediated
deacetylation of cyclophilin D in breast carcinoma. Cell Death Dis.
4:e6012013. View Article : Google Scholar : PubMed/NCBI
|
|
24
|
Anderson AS, Roberts PC, Frisard MI,
McMillan RP, Brown TJ, Lawless MH, Hulver MW and Schmelz EM:
Metabolic changes during ovarian cancer progression as targets for
sphingosine treatment. Exp Cell Res. 319:1431–1442. 2013.
View Article : Google Scholar : PubMed/NCBI
|
|
25
|
Liu N, Xu Y, Sun JT, Su J, Xiang XY, Yi
HW, Zhang ZC and Sun LK: The BH3 mimetic S1 induces endoplasmic
reticulum stress-associated apoptosis in cisplatin-resistant human
ovarian cancer cells although it activates autophagy. Oncol Rep.
30:2677–2684. 2013.PubMed/NCBI
|
|
26
|
Yi CH, Pan H, Seebacher J, Jang IH,
Hyberts SG, Heffron GJ, Vander Heiden MG, Yang R, Li F, Locasale
JW, et al: Metabolic regulation of protein N-alpha-acetylation by
Bcl-xL promotes cell survival. Cell. 146:607–620. 2011. View Article : Google Scholar : PubMed/NCBI
|
|
27
|
Wensveen FM, Alves NL, Derks IAM,
Reedquist KA and Eldering E: Apoptosis induced by overall metabolic
stress converges on the Bcl-2 family proteins Noxa and Mcl-1.
Apoptosis. 16:708–721. 2011. View Article : Google Scholar : PubMed/NCBI
|
|
28
|
Nishikawa T, Bellance N, Damm A, Bing H,
Zhu Z, Handa K, Yovchev MI, Sehgal V, Moss TJ, Oertel M, et al: A
switch in the source of ATP production and a loss in capacity to
perform glycolysis are hallmarks of hepatocyte failure in advance
liver disease. J Hepatol. 60:1203–1211. 2014. View Article : Google Scholar : PubMed/NCBI
|
|
29
|
Zhou Y, Tozzi F, Chen J, Fan F, Xia L,
Wang J, Gao G, Zhang A, Xia X, Brasher H, et al: Intracellular ATP
levels are a pivotal determinant of chemoresistance in colon cancer
cells. Cancer Res. 72:304–314. 2012. View Article : Google Scholar
|
|
30
|
Khwairakpam AD, Shyamananda MS, Sailo BL,
Rathnakaram SR, Padmavathi G, Kotoky J and Kunnumakkara AB: ATP
citrate lyase (ACLY): A promising target for cancer prevention and
treatment. Curr Drug Targets. 16:156–163. 2015. View Article : Google Scholar
|
|
31
|
Ganapathy-Kanniappan S and Geschwind J-FH:
Tumor glycolysis as a target for cancer therapy: Progress and
prospects. Mol Cancer. 12:152. 2013. View Article : Google Scholar : PubMed/NCBI
|
|
32
|
Sundaresan NR, Samant SA, Pillai VB,
Rajamohan SB and Gupta MP: SIRT3 is a stress-responsive deacetylase
in cardio-myocytes that protects cells from stress-mediated cell
death by deacetylation of Ku70. Mol Cell Biol. 28:6384–6401. 2008.
View Article : Google Scholar : PubMed/NCBI
|
|
33
|
Yang X, Xiang X, Xia M, Su J, Wu Y, Shen
L, Xu Y and Sun L: Inhibition of JNK3 promotes apoptosis induced by
BH3 mimetic S1 in chemoresistant human ovarian cancer cells. Anat
Rec (Hoboken). 298:386–395. 2015. View Article : Google Scholar
|
|
34
|
Alhazzazi TY, Kamarajan P, Verdin E and
Kapila YL: SIRT3 and cancer: Tumor promoter or suppressor? Biochim
Biophys Acta. 1816:80–88. 2011.PubMed/NCBI
|
|
35
|
Kamarajan P, Alhazzazi TY, Danciu T,
D'silva NJ, Verdin E and Kapila YL: Receptor-interacting protein
(RIP) and Sirtuin-3 (SIRT3) are on opposite sides of anoikis and
tumorigenesis. Cancer. 118:5800–5810. 2012. View Article : Google Scholar : PubMed/NCBI
|
|
36
|
Dai SH, Chen T, Wang YH, Zhu J, Luo P, Rao
W, Yang YF, Fei Z and Jiang XF: Sirt3 attenuates hydrogen
peroxide-induced oxidative stress through the preservation of
mitochondrial function in HT22 cells. Int J Mol Med. 34:1159–1168.
2014.PubMed/NCBI
|
|
37
|
Shulga N, Wilson-Smith R and Pastorino JG:
Sirtuin-3 deacetylation of cyclophilin D induces dissociation of
hexokinase II from the mitochondria. J Cell Sci. 123:894–902. 2010.
View Article : Google Scholar : PubMed/NCBI
|
|
38
|
Hamanaka RB and Chandel NS: Targeting
glucose metabolism for cancer therapy. J Exp Med. 209:211–215.
2012. View Article : Google Scholar : PubMed/NCBI
|
|
39
|
Zhang L, Su J, Xie Q, Zeng L, Wang Y, Yi
D, Yu Y, Liu S, Li S and Xu Y: 2-Deoxy-d-glucose sensitizes human
ovarian cancer cells to cisplatin by increasing ER stress and
decreasing ATP stores in acidic vesicles. J Biochem Mol Toxicol.
29:572–578. 2015. View Article : Google Scholar : PubMed/NCBI
|