Introduction
Chronic myeloid leukemia (CML) is unequivocally
distinguishable from other myeloproliferative disorders by the
presence of a reciprocal translocation of chromosomes 9 and 22
(1–3). Although the Philadelphia chromosome
is detected in 90–95% of CML patients, evidence of the BCR-ABL
rearrangement is also usually detected in the subgroup of
Philadelphia chromosome-negative CML patients (4–6).
The presence of BCR-ABL in CML patients and the
requirement of kinase activity for BCR-ABL function make this an
attractive target for selective kinase inhibitors.
The old traditional therapy of newly diagnosed
chronic phase-CML patients includes busulfan and hydroxyurea and
most of the patients will stay in a chronic phase for approximately
3–5 years (7,8). Treatment of CML later evolved to
where the goal was prolongation of the chronic phase through
induction of karyotypic remission and possibly molecular remission
using Alfa-interferon therapy with or without cytosine arabinoside.
Thereafter, imatinib mesylate (IM) a tyrosine kinase inhibitor
(TKI) was introduced as potential molecular therapy for CML
(7,9). IM is capable of inhibiting BCR-ABL
kinase activity by blocking ABL tyrosine kinase action through the
binding and subsequent inactivation of the ATP-binding sites of ABL
tyrosine kinase in leukemic cells (9,10).
Since its introduction, several clinical trials have demonstrated
the efficacy of IM and new generation TKIs in the treatment of CML,
including patients with interferon-refractory CP-CML, as well as
patients with CML in blast crisis (11).
Approximately more than 50% of CML patients treated
with imatinib achieve a complete cytogenetic response (11,12).
CML progression while on imatinib is usually due to the emergence
of imatinib-resistant BCR-ABL mutant cells.
The relatively unpredictable biological behavior is
a major challenge in its management as the chronic phase of CML is
less aggressive and has very favorable prognosis with an excellent
5-year survival rate. By contrast, the biologically aggressive
blast phase of CML is often rapidly fatal (2). Currently, there is no recognized
prognostic value for the baseline BCR-ABL level, furthermore, there
are variations in sensitivity or dependability of RQ-PCR assays
across different laboratories (13). There is therefore a need to develop
molecular markers for selection of choice of therapy at the time of
diagnosis and to identify patients that are more likely to achieve
a sustained remission, and patients who are more likely to develop
resistance to imatinib therapy.
New analytical tools in proteomics are emerging that
give new insights into biological processes that may speed up the
discovery of potential biomarkers. Quantitative molecular
variations may be used for the development of methods for tumor
classification based on large amounts of gene expression data
generated by 2-DE analysis of proteins (14,15).
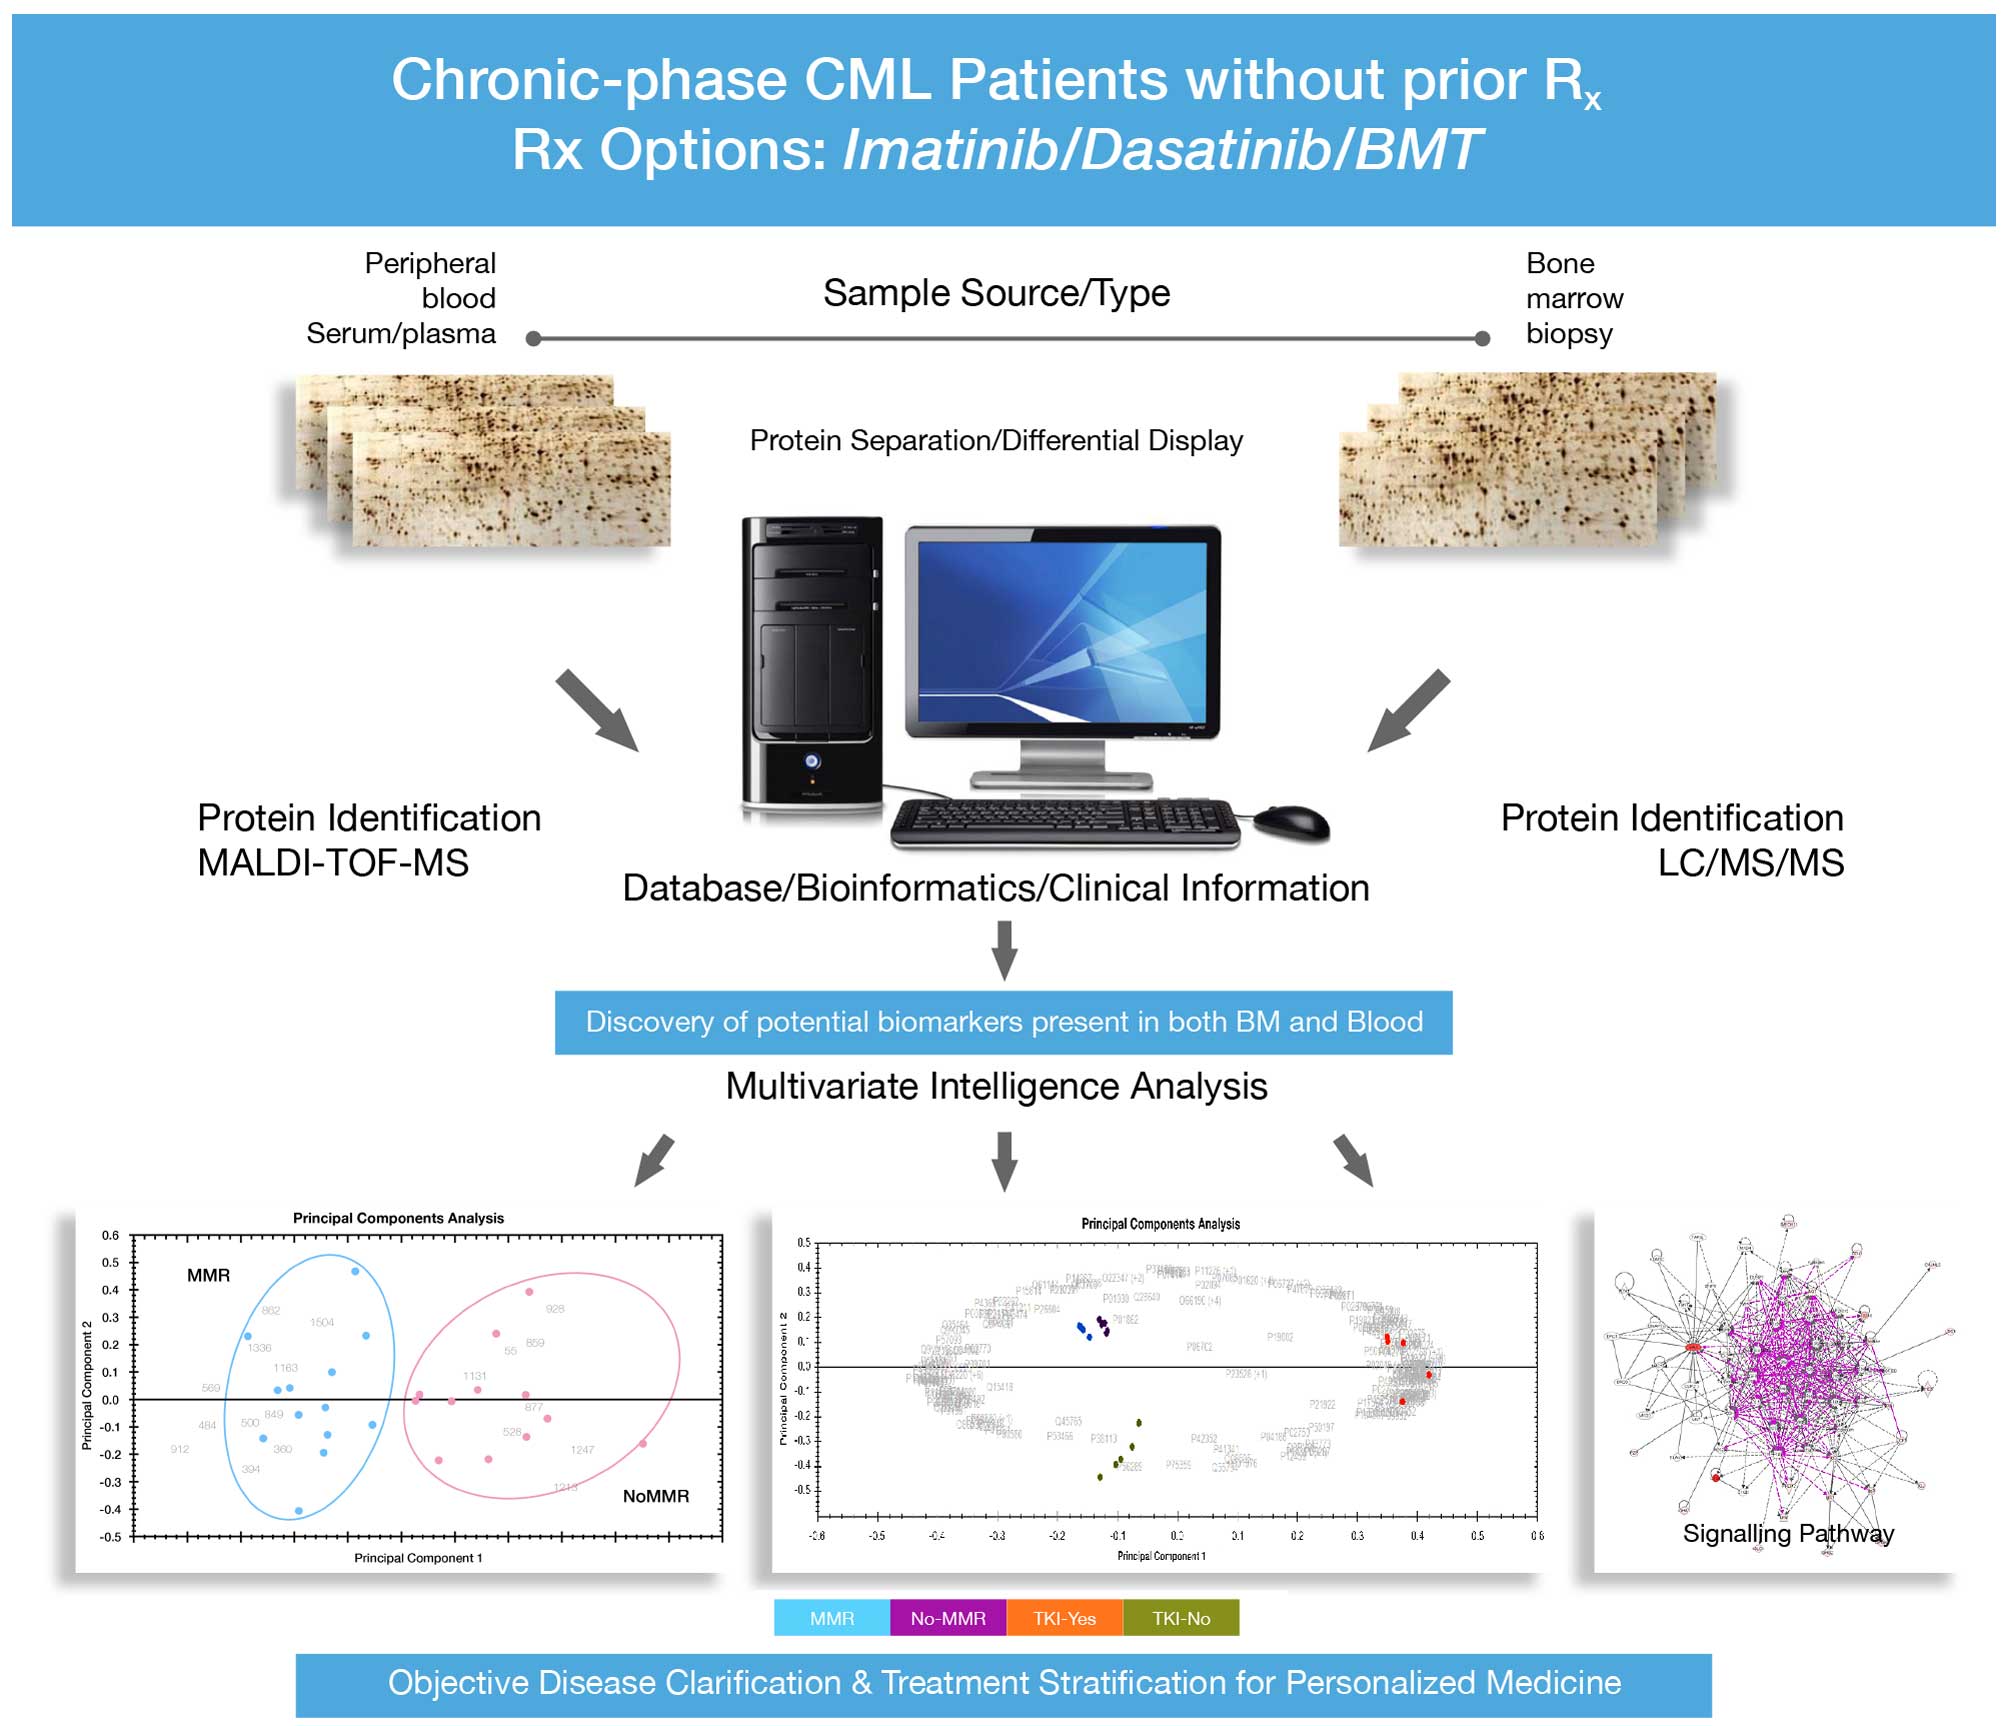
The main aim of the present study is towards
discovery of objective markers that predict patients’ response
status and selection of appropriate choice of therapy at the onset
of disease diagnosis. It focuses on the analysis of global
peripheral blood plasma and bone marrow plasma protein expression
profiles among CP-CML patients who achieved LT-MMR on imatinib
compared with patients without MMR as well as whether or not they
remain on TKI or switch to second generation TKI or requiring
alternative therapy.
The endpoint is to identify
disease-specific/disease-associated protein biomarkers seen in bone
marrow tissue as well as in peripheral blood plasma. This would
subsequently allow monitoring of such biomarker proteins in
peripheral blood, rather than bone marrow, demanding less invasive
procedures for objective prediction of individual’s best treatment
options and prognostic monitoring of CML patients.
Materials and methods
All bone marrow samples were obtained by aspiration
procedure via posterior iliac crest under local anesthesia.
Because of limited amount of materials for analysis, the cells were
not flow cytometry sorted, rather unsorted bone marrows as well as
unsorted peripheral blood plasma were collected and prepared for
analysis.
Bone marrow and plasma, samples obtained at
diagnosis and prior to initiation of treatment from 37 patients
with newly diagnosed CP-CML were subjected to expression proteome
analysis using combined gel-based 2-DE and label-free in-solution
quantitative liquid chromatography coupled with tandem mass
spectrometry (LC-MS/MS). Patients selections into those that
achieved or did not achieve MMR was based on patients with serial
positive or negative responses to treatment at different
time-points (3, 6, 12 and 24 months, respectively). Patients that
responded at a time-point but failed to respond at the next
time-point were not included in the analysis. However, patients
that did not achieve MMR at 3 months, but subsequently achieved MMR
at 6, 12 and 24 months were included. Because there was fewer
number of patients with MMR at 3 months, the focus of our analyzed
time-points were at 6, 12 and 24 months. Twenty-five patients
consisting 13 with major molecular response and 12 without major
molecular response were analyzed. In addition, patients that failed
tyrosine kinase inhibitor (TKI) were analyzed. Four additional
patients samples not included in the proteomics analysis were used
in the western blot analysis. The overview of experimental design
is shown in Fig. 1 and the
clinical characteristics of all patients were as indicated in
Table I.
 | Table IClinical characteristics of analyzed
samples. |
Table I
Clinical characteristics of analyzed
samples.
| | | TKI-fail | MMR at 6
months | MMR at 12
months | MMR at 18
months | MMR at 24
months |
|---|
| | |
|
|
|
|
|
|---|
| Samples | Gender | Age (years) | No | Yes | No | Yes | No | Yes | No | Yes | No | Yes |
|---|
| CML1 | Female | 14 | ✓ | | | ✓ | | ✓ | | ✓ | | ✓ |
| CML2 | Female | 14 | ✓ | | | ✓ | | ✓ | | ✓ | | ✓ |
| CML3 | Female | 26 | | ✓ | ✓ | | ✓ | | | | | |
| CML4 | Male | 18 | | ✓ | | ✓ | ✓ | | ✓ | | | ✓ |
| CML5 | Male | 50 | ✓ | | | ✓ | | ✓ | | ✓ | | ✓ |
| CML6 | Female | 50 | ✓ | | | ✓ | | ✓ | | ✓ | | ✓ |
| CML7 | Male | 41 | | ✓ | | ✓ | | ✓ | | ✓ | | ✓ |
| CML8 | Female | 64 | | ✓ | ✓ | | ✓ | | ✓ | | ✓ | |
| CML10 | Male | 27 | ✓ | | | ✓ | ✓ | | | ✓ | | ✓ |
| CML13 | Male | 44 | ✓ | | | ✓ | | ✓ | | ✓ | | ✓ |
| CML15 | Male | 21 | ✓ | | | ✓ | | ✓ | | ✓ | | ✓ |
| CML16 | Male | 44 | ✓ | | | ✓ | | ✓ | | ✓ | | ✓ |
| CML17 | Female | 18 | | ✓ | ✓ | | ✓ | | ✓ | | ✓ | |
| CML18 | Female | 65 | ✓ | | ✓ | | ✓ | | ✓ | | ✓ | |
| CML19 | Male | 26 | | ✓ | ✓ | | ✓ | | ✓ | | ✓ | |
| CML21 | Male | 39 | | ✓ | ✓ | | ✓ | | | ✓ | | ✓ |
| CML22 | Female | 67 | ✓ | | | ✓ | | ✓ | | ✓ | | ✓ |
| CML23 | Male | 47 | ✓ | | | ✓ | | ✓ | | ✓ | | ✓ |
| CML24 | Male | 18 | | ✓ | ✓ | | ✓ | | ✓ | | ✓ | |
| CML25 | Male | 40 | ✓ | | | ✓ | | ✓ | | ✓ | | ✓ |
| CML26 | Female | 30 | | ✓ | ✓ | | | | | | | |
| CML27 | Female | 36 | ✓ | | ✓ | | | ✓ | | ✓ | | ✓ |
| CML28 | Female | 37 | ✓ | | | ✓ | | ✓ | | ✓ | | ✓ |
| CML29 | Female | 33 | | ✓ | ✓ | | ✓ | | ✓ | | | ✓ |
| CML30 | Female | 44 | ✓ | | | ✓ | | ✓ | | ✓ | | ✓ |
| CML31 | Female | 48 | | | | | | | | | | |
| CML32 | Female | 38 | | ✓ | ✓ | | | | | | | |
| CML33 | Female | 32 | | ✓ | ✓ | | ✓ | | | | | |
| CML34 | Male | 52 | | ✓ | ✓ | | ✓ | | ✓ | | ✓ | |
| CML38 | Male | 37 | | | | | | | | | | |
| CML40 | Male | 61 | | ✓ | ✓ | | ✓ | | ✓ | | | |
| CML41 | Male | 47 | ✓ | | | ✓ | | ✓ | | ✓ | | ✓ |
| CML43 | Female | 51 | | ✓ | ✓ | | ✓ | | ✓ | | ✓ | |
| CML44 | Female | 14 | ✓ | | | ✓ | | ✓ | | ✓ | | ✓ |
| CML45 | Female | 45 | ✓ | | | ✓ | | ✓ | | ✓ | | ✓ |
| CML46 | Female | 45 | ✓ | | ✓ | | ✓ | | | ✓ | | ✓ |
| CML47 | Male | 32 | | ✓ | ✓ | | ✓ | | ✓ | | ✓ | |
| Total | | | 19 | 16 | 17 | 18 | 16 | 17 | 11 | 20 | 8 | 22 |
Sample preparation protocols for
proteomic analysis
All the patients with primary diagnosis of CML were
recruited in Oncology Center at KFSH&RC. From each of the
patients, 10 ml of peripheral EDTA-anti-coagulated blood (plasma)
was taken. Where possible, bone marrow aspirations were obtained
from the same patients in addition to peripheral blood samples.
All samples were subjected to extensive pre-analysis
cleanup using human albumin removal protocols (Agilent
Technologies). Written and signed informed consents were obtained
from all patients and the Institution’s Research Advisory Council,
under the Office of Research Affairs, approved the study (RAC#
2050-040).
Protein separation by high resolution two
dimensional gel electrophoresis, (2-DE) scanning and image
analysis
Equivalent amount of 50 mg total proteins for each
analyzed sample was dissolved in 350 ml volume of rehydration
buffer [2% (v/v) IPG-buffer 4–7 linear] and loaded onto an 11-cm
IPG-strip 4–7 linear (Bio-Rad Laboratories). This gave better
overview of gel separated protein spots across the entire chosen pH
window and gel images were visualized by SYPRO Ruby fluorescent
staining. Stained gels were scanned using a Typhoon Trio Imager
(GE) and data were analyzed using the Progenesis SameSpots software
(version 7.1.0; Nonlinear Dynamics, Ltd., Newcastle, UK). Gel
images were compared for qualitative and quantitative differences.
In addition, the protein expression profiles were used to assess
the level of individual variability and only samples with similar
phenotypic changes were used for sample pools for LC/MS/MS (due to
low through-put analysis) as detailed below. Polypeptide quantities
were calculated based on the normalized total integrated density
volume.
Protein in solution-digestion
The plasma samples were diluted and protein
concentrations of all samples were normalized as previously
described (16). Briefly, for
analytical runs, equal amount of protein was taken from each sample
to generate a pool of patient as one group. The samples within same
sample cohort were pooled due to low through-put of LC/MS/MS
analysis platform. However, samples were initially screened using
2-DE for homogeneity within the same analysis group. For each
analysis sample group, 200 μg complex protein mixture was taken and
exchanged twice with 500 μl of 0.1% RapiGest (Waters Corp.,
Manchester, UK). Protein concentrations of between 0.50 and 1 μg/μl
was achieved at the end of digestion. Details of digestion
protocols are as previously described (16,17).
Briefly, proteins were denatured in 0.1% RapiGest SF at 80°C for 15
min, reduced in 10 mM DTT at 60°C for 30 min, and alkylated in 10
mM Iodoacetamide (IAA) for 40 min at room temperature in the dark.
Samples were trypsin digested at 37°C overnight. Samples were
diluted with aqueous 0.1% formic acid prior to LC/MS analysis in
order to achieve a load of ~2 μg on analytical column. All samples
were spiked with yeast alcohol dehydrogenase (ADH; P00330) as
internal standard to the digests in order for absolute
quantitation.
Protein identification by mass
spectrometry: LC-MSE analysis
The digested peptides were subjected to
1-Dimensional Nano Acquity liquid chromatography coupled with
tandem mass spectrometry on Synapt G2 (Waters Corp.). Expression
proteomics data were generated between sample groups using both
qualitative and quantitative protein changes. The ESI-MS analysis
and instrument settings were optimized on the tune page as
previously reported (16).
A total of 2 μl sample injection representing ~1 μg
protein digests was loaded on-column and samples were infused using
the Acquity sample manager with mobile phase consisting of A1 99%
water +1% acetonitrile + 0.1% formic acid and B1 acetonitrile +
0.1% formic acid with sample flow rate of 0.450 μl/min. Data
acquisition using iron mobility separation experiments (HDMSE) were
performed and data were acquired over a range of m/z 50–2000 Da
with a total acquisition time of 115 min. All samples were analyzed
in triplicate runs (triplicate runs were repeated on two different
occasions as a measure of reproducibility) and data were acquired
using the MassLynx programs (version. 4.1, SCN833; Waters) operated
in resolution and positive polarity modes. ProteinLynx Global
Server (PLGS) 2.2 and Progenesis QI for proteomics (Progenesis QIfp
version 2.0.5387) (Nonlinear Dynamics/Waters) were used for all
automated data processing and database searching. The generated
peptide masses were searched against two-unified non-redundant
databases (Uniprot/Swiss-Prot Human protein sequence database)
using the PLGS 2.5 and Progenesis QIfp for protein identification
(Waters).
Data analysis and informatics
Progenesis QI v.2.0.5387 for proteomics was used to
process and search the data to accurately quantify and identify
proteins that are significantly changing between sample groups. The
human database containing thousands of reviewed non-redundant
entries were downloaded from UniProt/Swiss-Prot and search
algorithm was applied as previoudly described (18). The criteria used for the database
search were as previously described (16). Normalized label-free quantification
was achieved using Progenesis QI software. The generated
differentially expressed data was filtered to show only
statistically (ANOVA), significantly regulated proteins (P≤0.05)
and a fold change >1.5. In addition, ‘Hi3’ absolute
quantification was performed using ADH as an internal standard to
give an absolute amount of each identified protein. These options
are available as incorporated into the Progenesis QIfp (Nonlinear
Dynamics/Waters).
Results
Changes in protein expression between
patients with/without major molecular response at 6 months
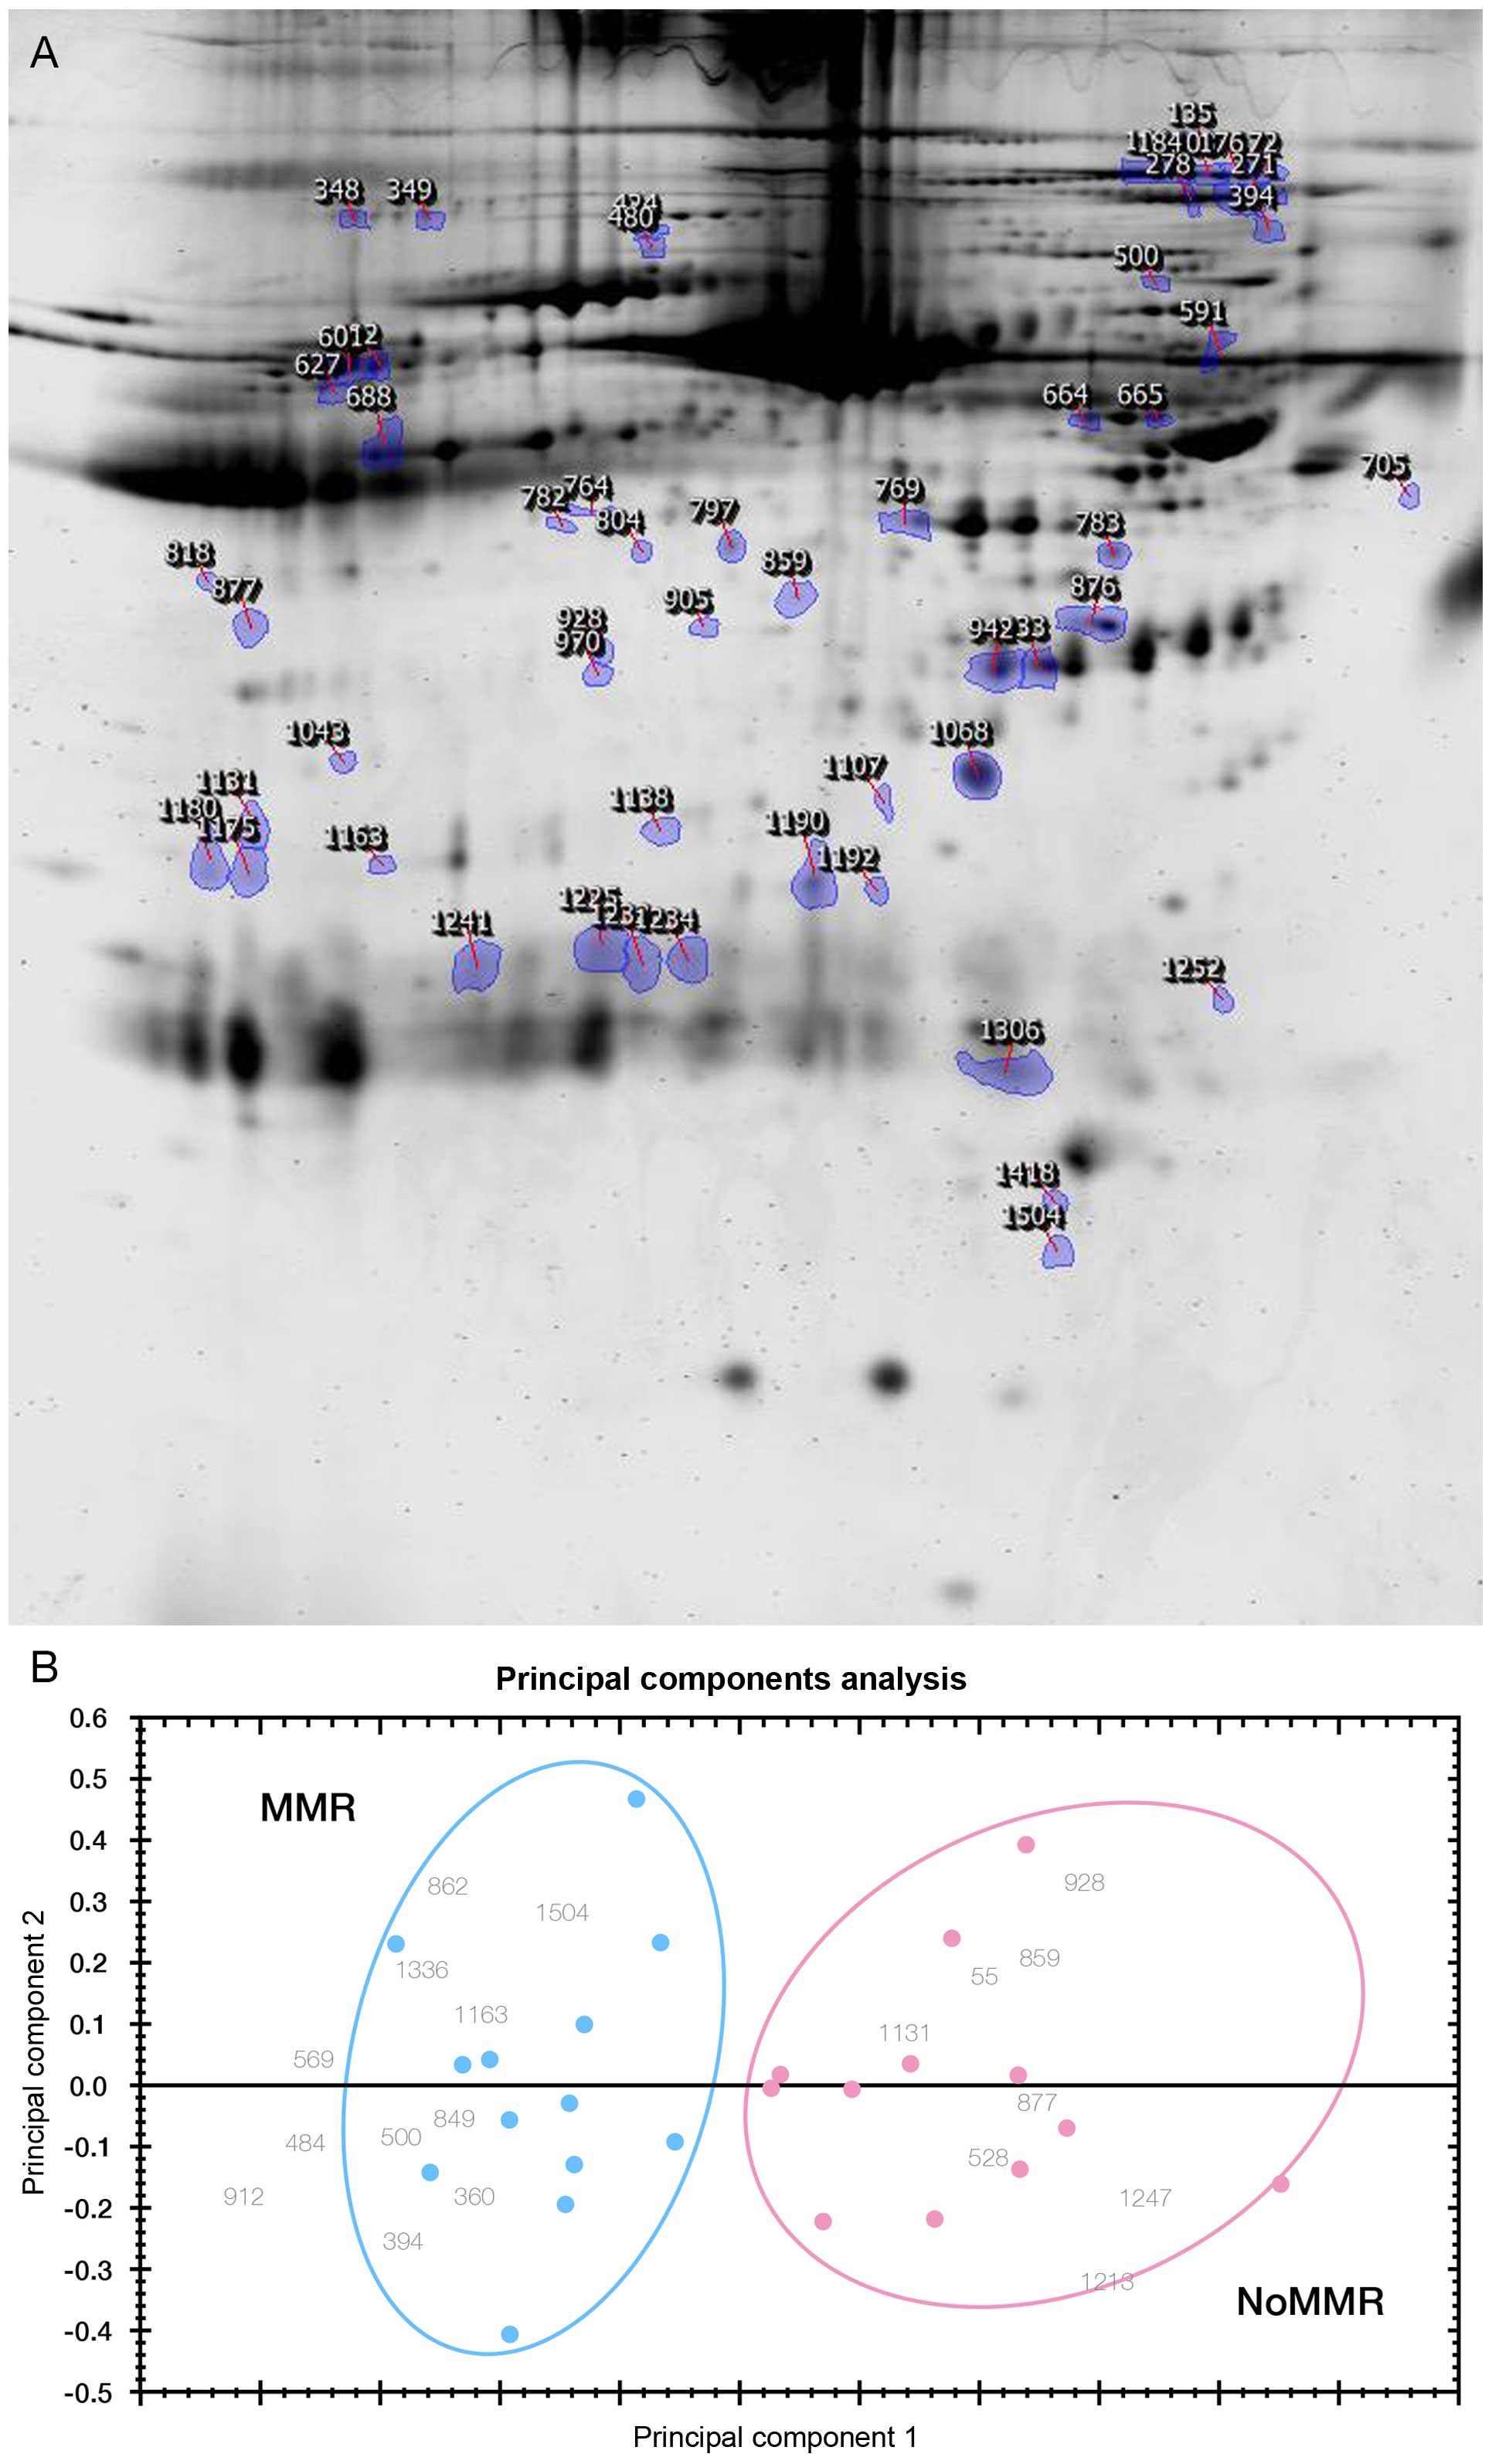
A total of 73 protein spots on 2-DE gels differed
significantly between patients that achieved MMR from those who did
not achieve MMR (P<0.05 and at least 1.5-fold difference). The
locations of these protein spots are shown as marked on a
representative 2-DE map derived from a sample with MMR in Fig. 2A. Even though the identifications
of these protein spots were not done, their quantitative expression
fingerprints from 2-DE analysis pattern accurately predicts 13
individuals that achieved MMR at 6 months from 12 subjects without
MMR (No-MMR) using principal component analysis (PCA) (Fig. 2B).
These findings are similar to what was observed with
PCA plot generated from non-gel LC/MS/MS analysis platform, as some
of the results were independently validated using the label free
quantitative liquid chromatography tandem mass spectrometry as
detailed below.
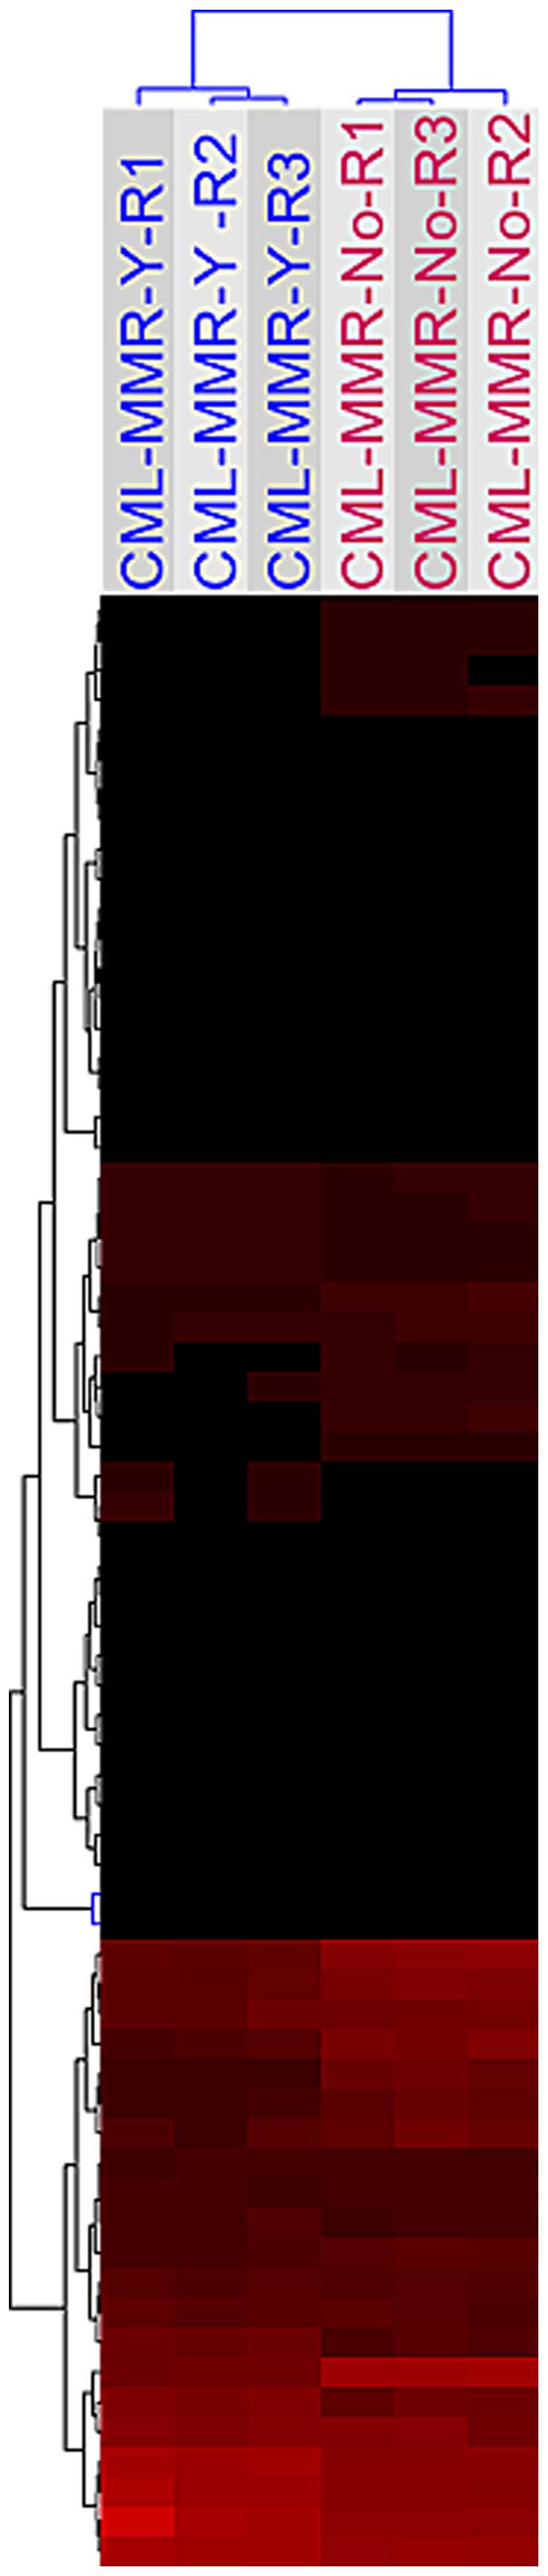
LC/MS/MS analysis of peripheral blood for
prognostic monitoring of early CML treatment response
Peripheral blood samples were evaluated for early
treatment response at 6 month and prediction of treatment options
towards personalized medicine. Approximately 115 protein species
were identified, of which only 64 were significantly differentially
expressed between MMR and No-MMR sample groups. (> 1.5- to
∞-fold change, p<0.05). These proteins predict accurately
patients with MMR vs. No-MMR patients using unsupervised
Hierarchical Cluster Analysis (Fig.
3).
Evaluation of bone marrow and peripheral
blood protein profiles for prognostic monitoring of prolonged and
sustained treatment response vs. persistent no-major molecular
response
Some of the patients have been followed for more
than 24 months. Patients who have been consistent over a long-term
in achieving and maintaining MMR from 6 months until 24 months were
labeled as LT-MMR, while patients that have been persistent with
No-MMR from 6 months until 24 months were called P-No-MMR. We
believe that the ability to select early responders from 6 months
all through 24 months would be very helpful to identify markers
that would accurately predict patients with risk of delayed or
suboptimal response further than 6 months. These cohorts of
patients were considered as important in an effort to provide the
possibility to identify surrogate biomarkers to evaluate long-term
treatment response and discovery of
disease-specific/disease-associated proteins for objective
prognostic monitoring of CML patients.
Equal amounts of total peripheral blood plasma
proteins from 10 LT-MMR patients were pooled and compared for their
protein expressions among 10 other samples from P-No-MMR patients
using quantitative label-free LC/MS/MS expression proteome
analysis.
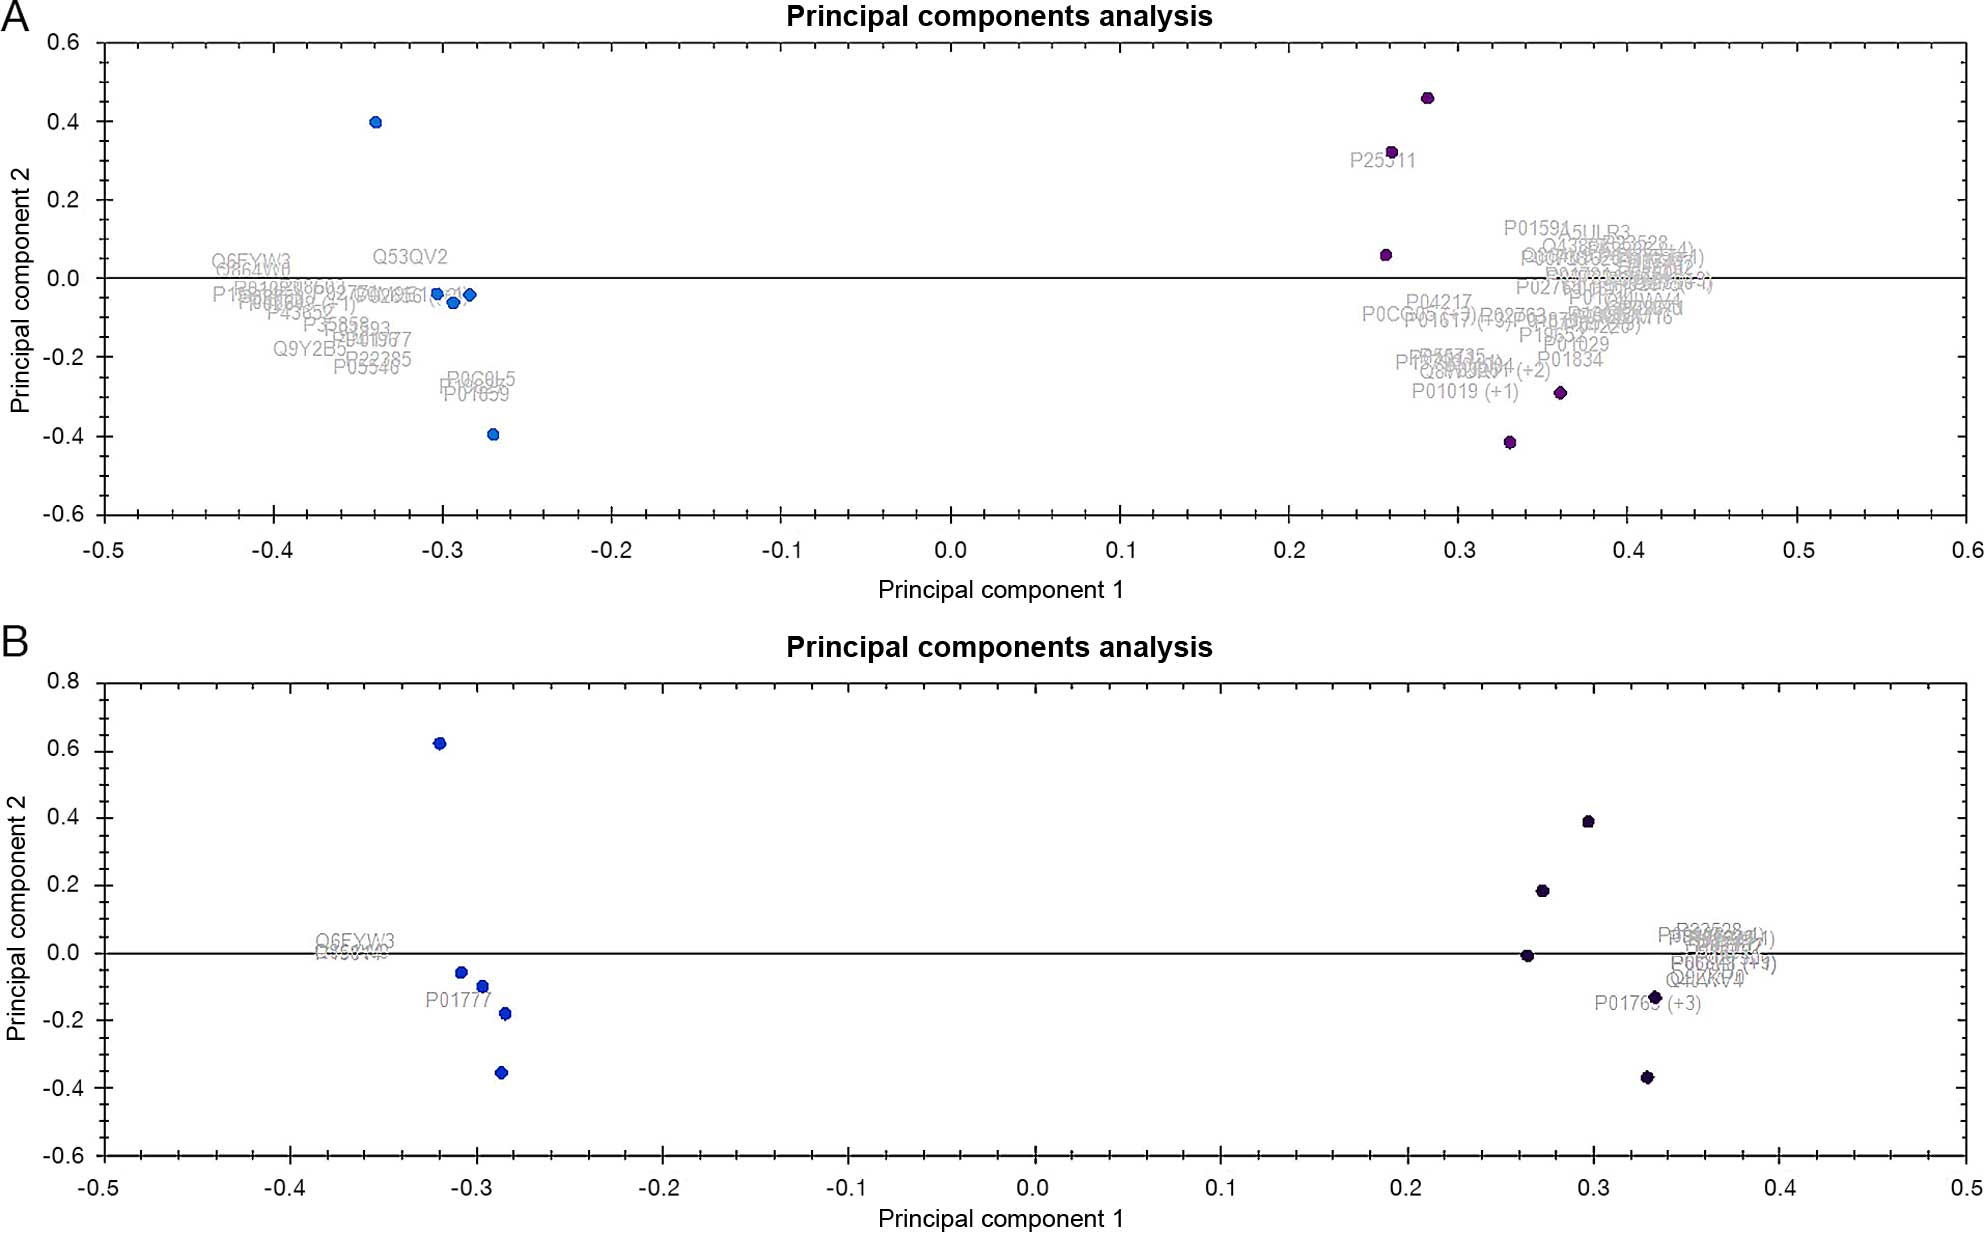
Approximately 700 proteins representing 280 unique
protein species were identified (due to different protein
isoforms). Only 164 of the 280 proteins were significantly
differentially expressed between LT-MMR and P-No-MMR sample groups
(>1.5- to ∞-fold change; P<0.05) and accurately predict
patients with major molecular response (LT-MMR) vs. No-major
molecular response (P-No-MMR) using unsupervised principal
component analysis (Fig. 4A). The
list of identified differentially expressed proteins in PBP is
described in Table IIA.
| Table IIThe identified differentially
expressed proteins in peripheral blood plasma (PBP) and bone marrow
plasma (BMP) from CML patients with major molecular response (MMR),
No-MMR, On-tyrosine kinase inhibitor (On-TKI) and NOT-on-TKI. |
Table II
The identified differentially
expressed proteins in peripheral blood plasma (PBP) and bone marrow
plasma (BMP) from CML patients with major molecular response (MMR),
No-MMR, On-tyrosine kinase inhibitor (On-TKI) and NOT-on-TKI.
| A, The identified
differentially expressed proteins in PBP of CML patients |
|---|
|
|---|
| Accession | Peptide count | Anova (p) | Max fold
change | Highest mean
condition | Lowest mean
condition | Description |
|---|
| P50197 | 2 | 0.000534 | 2.41067 | CML-PBP-TKI-Y | CML-PBP-MMR |
2,5-dichloro-2,5-cyclohexadiene-1,4-diol
dehydrogenase |
| P16281 | 4 | 9.90E-08 | 2.92498 | CML-PBP-TKI-N | CML-PBP-TKI-Y | 23 kDa
protein |
| P49313 | 4 | 1.97E-07 | 9.09421 | CML-PBP-TKI-Y | CML-PBP-No-MMR | 30 kDa
ribonucleoprotein, chloroplast precursor |
| O86535 | 3 | 4.48E-12 | 22.9885 | CML-PBP-TKI-N | CML-PBP-TKI-Y | 3-isopropylmalate
dehydratase small subunit |
| P42352 | 1 | 2.83E-12 | 12.8902 | CML-PBP-TKI-N | CML-PBP-MMR | 50S ribosomal
protein L9. |
| O66190 | 3 | 0.001921 | 15.3266 | CML-PBP-No-MMR | CML-PBP-TKI-N | 60 kDa chaperonin
(Protein Cpn60) (groEL protein) |
| P50174 | 1 | 0.000148 | 2.33176 | CML-PBP-TKI-Y | CML-PBP-MMR | Acetyl-CoA
acetyltransferase |
| P41341 | 5 | 1.37E-09 | 3.82215 | CML-PBP-TKI-N | CML-PBP-No-MMR | Actin 11 |
| P53458 | 4 | 2.59E-10 | 25.5243 | CML-PBP-TKI-Y | CML-PBP-No-MMR | Actin 5
(Fragment) |
| P53506 | 4 | 1.85E-05 | 6.06449 | CML-PBP-TKI-Y | CML-PBP-No-MMR | Actin, cytoplasmic
type 8 |
| P53466a | 4 | 0.000178 | 4.16358 | CML-PBP-TKI-N | CML-PBP-TKI-Y | Actin, cytoskeletal
2 (LPC2) |
| P07326 | 1 | 1.50E-14 | 33782.8 | CML-PBP-TKI-Y | CML-PBP-MMR | Allophycocyanin
beta chain |
| P72505 | 1 | 1.97E-11 | 50.0172 | CML-PBP-TKI-Y | CML-PBP-TKI-N | Allophycocyanin
beta chain |
| P02763 | 9 | 8.94E-05 | 2.16961 | CML-PBP-TKI-Y | CML-PBP-MMR | Alpha-1-acid
glycoprotein 1 precursor (AGP 1) |
| P19652 | 7 | 8.07E-10 | 3.8292 | CML-PBP-TKI-Y | CML-PBP-MMR | Alpha-1-acid
glycoprotein 2 precursor (AGP 2) |
| P01009 | 35 | 7.33E-06 | 2.57662 | CML-PBP-TKI-Y | CML-PBP-TKI-N |
Alpha-1-antitrypsin precursor |
| P04217a | 17 | 4.44E-11 | 2.21378 | CML-PBP-TKI-Y | CML-PBP-MMR |
Alpha-1B-glycoprotein |
| P01023 | 71 | 4.34E-09 | 3.03669 | CML-PBP-TKI-Y | CML-PBP-No-MMR |
Alpha-2-macroglobulin precursor
(Alpha-2-M) |
| P39701 | 2 | 0.001857 | 17.1724 | CML-PBP-MMR | CML-PBP-TKI-Y |
Alpha-ribazole-5′-phosphate
phosphatase |
| P41361a,b | 6 | 2.78E-07 | 2.68159 | CML-PBP-TKI-N | CML-PBP-TKI-Y | Antithrombin-III
(ATIII) |
| P01008 | 15 | 1.56E-12 | 5.19919 | CML-PBP-TKI-Y | CML-PBP-TKI-N | Antithrombin-III
precursor (ATIII) (PRO0309) |
|
P32262a | 6 | 2.65E-06 | Infinity | CML-PBP-MMR | CML-PBP-TKI-Y | Antithrombin-III
precursor (ATIII) |
| P32261 | 8 | 7.40E-06 | Infinity | CML-PBP-No-MMR | CML-PBP-TKI-Y | Antithrombin-III
precursor (ATIII) |
| P15497 | 4 | 8.88E-16 | 32.5405 | CML-PBP-MMR | CML-PBP-TKI-Y | Apolipoprotein A-I
precursor (Apo-AI) |
| P18648 | 3 | 6.73E-08 | 2.76435 | CML-PBP-MMR | CML-PBP-TKI-Y | Apolipoprotein A-I
precursor (Apo-AI) |
| P02648 | 12 | 7.81E-06 | 2.49354 | CML-PBP-TKI-N | CML-PBP-TKI-Y | Apolipoprotein
A-I precursor (Apo-AI) |
| P02652 | 6 | 4.96E-10 | 3.48432 | CML-PBP-TKI-Y | CML-PBP-No-MMR | Apolipoprotein
A-II precursor (Apo-AII) (ApoA-II) |
|
P06727a | 12 | 0.00063 | 2.06242 | CML-PBP-TKI-Y | CML-PBP-TKI-N | Apolipoprotein
A-IV precursor (Apo-AIV) |
| P02655 | 2 | 3.46E-11 | 7.42195 | CML-PBP-TKI-Y | CML-PBP-No-MMR | Apolipoprotein C-II
precursor (Apo-CII) |
| P02649 | 10 | 8.01E-08 | 3.13115 | CML-PBP-TKI-Y | CML-PBP-No-MMR | Apolipoprotein E
precursor (Apo-E) |
| P43773 | 1 | 1.03E-08 | 3.21196 | CML-PBP-TKI-N | CML-PBP-MMR | ATP-dependent
hsl protease ATP-binding subunit |
| P01884 | 1 | 2.13E-09 | Infinity | CML-PBP-TKI-Y | CML-PBP-MMR |
Beta-2-microglobulin precursor |
| P31625 | 1 | 4.44E-16 | 29.2811 | CML-PBP-TKI-Y | CML-PBP-MMR | Bifunctional
protease/dUTPase [Includes: Aspartic] |
| Q08595 | 2 | 5.42E-07 | 2.36202 | CML-PBP-TKI-N | CML-PBP-No-MMR | BR1
protein |
|
P06702a | 3 | 2.35E-12 | 5.10685 | CML-PBP-No-MMR | CML-PBP-MMR | Calgranulin B
(Migration inhibitory factor-related |
| P07090 | 2 | 9.28E-09 | 4.35593 | CML-PBP-TKI-Y | CML-PBP-MMR | Calretinin
(CR) |
| P00450 | 33 | 6.96E-10 | 2.07132 | CML-PBP-TKI-Y | CML-PBP-TKI-N | Ceruloplasmin
precursor (EC 1.16.3.1) (Ferroxidase) |
| P13635 | 19 | 3.89E-07 | 2.06575 | CML-PBP-TKI-Y | CML-PBP-No-MMR | Ceruloplasmin
precursor (EC 1.16.3.1) (Ferroxidase) |
| Q61147 | 19 | 6.29E-05 | 5.77271 | CML-PBP-No-MMR | CML-PBP-TKI-N | Ceruloplasmin
precursor (EC 1.16.3.1) (Ferroxidase) |
| O34002 | 1 | 0.000137 | 68.1783 | CML-PBP-MMR | CML-PBP-TKI-Y | Citrate synthase
(EC 4.1.3.7) |
| P23528 | 1 | 6.64E-09 | 17.4873 | CML-PBP-No-MMR | CML-PBP-MMR | Cofilin, non-muscle
isoform (18 kDa phosphoprotein) |
| Q03708 | 2 | 2.25E-07 | Infinity | CML-PBP-MMR | CML-PBP-TKI-N | Colicin E7
immunity protein (ImmE7) |
| P00736 | 4 | 1.06E-11 | 3.2943 | CML-PBP-TKI-Y | CML-PBP-No-MMR | Complement C1r
component precursor |
| P09871 | 4 | 2.38E-07 | 2.92284 | CML-PBP-TKI-Y | CML-PBP-TKI-N | Complement C1s
component precursor |
|
P01027a | 22 | 1.58E-11 | 8.12844 | CML-PBP-TKI-N | CML-PBP-TKI-Y | Complement C3
precursor (HSE-MSF) |
| P01024 | 83 | 5.80E-10 | 2.95796 | CML-PBP-TKI-Y | CML-PBP-TKI-N | Complement C3
precursor [Contains: C3a anaphylatox] |
| P01030a | 20 | 0.001479 | 2.42252 | CML-PBP-No-MMR | CML-PBP-TKI-N | Complement C4
precursor [Contains: C4A anaphylatox] |
| P04186 | 7 | 0.000166 | 2.2386 | CML-PBP-TKI-N | CML-PBP-MMR | Complement
factor B precursor (C3/C) |
| P05156 | 3 | 4.54E-07 | 3.80805 | CML-PBP-TKI-Y | CML-PBP-No-MMR | Complement
factor I precursor (EC 3.4.21) (C3B/) |
| Q33439 | 1 | 6.13E-11 | 76.1488 | CML-PBP-TKI-Y | CML-PBP-TKI-N | Cytochrome c
oxidase polypeptide I |
| P14532 | 1 | 8.42E-08 | 11.1984 | CML-PBP-TKI-N | CML-PBP-TKI-Y | Cytochrome C551
peroxidase precursor |
| Q38732 | 1 | 5.73E-08 | 16.099 | CML-PBP-TKI-N | CML-PBP-TKI-Y | DAG protein,
chloroplast precursor |
| P57759 | 3 | 5.60E-13 | 5.45666 | CML-PBP-TKI-N | CML-PBP-TKI-Y | Endoplasmic
reticulum protein ERp29 precursor |
| P20710 | 1 | 1.19E-08 | 24.9012 | CML-PBP-TKI-N | CML-PBP-TKI-Y |
Excisionase |
| Q45765 | 1 | 0.000582 | 13.2686 | CML-PBP-TKI-N | CML-PBP-No-MMR | Ferric uptake
regulation protein |
| P02671 | 23 | 0 | 5.53907 | CML-PBP-TKI-Y | CML-PBP-TKI-N | Fibrinogen
alpha/alpha-E chain precursor |
| P02675 | 36 | 1.52E-09 | 2.8323 | CML-PBP-TKI-Y | CML-PBP-TKI-N | Fibrinogen beta
chain precursor |
| P02679 | 26 | 6.02E-06 | 3.07718 | CML-PBP-TKI-Y | CML-PBP-TKI-N | Fibrinogen gamma
chain precursor |
| P11276 | 11 | 0.000201 | 2.27101 | CML-PBP-No-MMR | CML-PBP-TKI-N | Fibronectin
precursor (FN) (Fragments) |
| P08041 | 1 | 4.74E-05 | 4.36822 | CML-PBP-MMR | CML-PBP-TKI-Y | Gas vesicle protein
C |
| P47805 | 2 | 0.005106 | 6.89488 | CML-PBP-TKI-Y | CML-PBP-MMR | Gastrulation
specific protein G12 |
| P13020 | 3 | 2.96E-06 | 2.44545 | CML-PBP-TKI-Y | CML-PBP-MMR | Gelsolin
(Actin-depolymerizing factor) |
| P06396 | 3 | 0.000102 | 4.00281 | CML-PBP-TKI-Y | CML-PBP-TKI-N | Gelsolin precursor,
plasma (Actin-depolymerizing) |
| P06228 | 2 | 5.86E-07 | 2.30924 | CML-PBP-TKI-Y | CML-PBP-TKI-N | Gene 27
protein |
| P15751 | 1 | 1.74E-07 | 2.52369 | CML-PBP-TKI-Y | CML-PBP-MMR | General secretion
pathway protein L |
| P23722 | 4 | 0.004817 | 3.55572 | CML-PBP-MMR | CML-PBP-TKI-N | Glyceraldehyde
3-phosphate dehydrogenase |
| P55042 | 2 | 1.22E-08 | 4.00025 | CML-PBP-TKI-Y | CML-PBP-TKI-N | GTP-binding
protein RAD (RAS associated) |
| P00739 | 13 | 3.99E-11 | 5.55201 | CML-PBP-TKI-Y | CML-PBP-TKI-N | Haptoglobin-related
protein precursor |
| P91953 | 1 | 1.37E-07 | 4.42879 | CML-PBP-TKI-Y | CML-PBP-No-MMR | Hatching enzyme
precursor (HE) (HEZ) |
| P01922 | 6 | 6.01E-14 | 10.9884 | CML-PBP-TKI-Y | CML-PBP-MMR | Hemoglobin α
chain |
| P07414 | 2 | 0.001548 | 22.3314 | CML-PBP-No-MMR | CML-PBP-TKI-N | Hemoglobin α
chain |
|
P19002a | 2 | 2.15E-05 | 2.87378 | CML-PBP-No-MMR | CML-PBP-MMR | Hemoglobin
α-1, α-2, and α-3 chains |
| P02054 | 4 | 8.10E-15 | 54.1252 | CML-PBP-TKI-Y | CML-PBP-MMR | Hemoglobin β
chain |
| P14391 | 5 | 4.48E-11 | 5.10044 | CML-PBP-TKI-N | CML-PBP-No-MMR | Hemoglobin β
chain |
| P18985 | 8 | 1.04E-09 | 2.8812 | CML-PBP-TKI-Y | CML-PBP-No-MMR | Hemoglobin β
chain |
| P02134 | 2 | 2.66E-09 | 19.544 | CML-PBP-MMR | CML-PBP-TKI-Y | Hemoglobin β
chain |
| P18984 | 5 | 4.21E-09 | 3.66515 | CML-PBP-TKI-Y | CML-PBP-MMR | Hemoglobin β
chain |
| P02049 | 5 | 3.19E-05 | 976.807 | CML-PBP-TKI-Y | CML-PBP-No-MMR | Hemoglobin β
chain |
| P11758 | 6 | 0.002277 | 13.0218 | CML-PBP-MMR | CML-PBP-TKI-N | Hemoglobin β
chain |
| P02094a | 2 | 0.004366 | 7.02752 | CML-PBP-MMR | CML-PBP-TKI-N | Hemoglobin β-major
chain |
| Q28220 | 4 | 0.000235 | 30.7953 | CML-PBP-TKI-N | CML-PBP-TKI-Y | Hemoglobin ɛ
chain |
| P05546 | 13 | 0.005774 | 2.11422 | CML-PBP-TKI-Y | CML-PBP-TKI-N | Heparin cofactor II
precursor (HC-II) |
| P33433 | 5 | 0.000577 | 3.03464 | CML-PBP-MMR | CML-PBP-TKI-N | Histidine-rich
glycoprotein (Histidine-proline rich) |
| Q28640 | 5 | 0.001028 | 6.73632 | CML-PBP-MMR | CML-PBP-TKI-N | Histidine-rich
glycoprotein precursor |
| P11457 | 1 | 2.09E-10 | 43.477 | CML-PBP-TKI-N | CML-PBP-TKI-Y | Histone-like
protein HLP-1 precursor (DNA-binding) |
| P09631a | 1 | 8.27E-14 | 6.74686 | CML-PBP-MMR | CML-PBP-TKI-Y | Homeobox protein
Hox-A9 (Hox-1.7) |
|
Q10521a | 1 | 2.13E-05 | 3.30175 | CML-PBP-TKI-Y | CML-PBP-TKI-N | Hypothetical
16.9 kDa protein Rv2239c |
| P37506a | 1 | 8.12E-10 | 3.91542 | CML-PBP-TKI-Y | CML-PBP-MMR | Hypothetical 20.4
kDa protein in COTF-TETB |
| Q10616 | 1 |
1.93E-06 | 2.87092 |
CML-PBP-TKI-N |
CML-PBP-TKI-Y | Hypothetical 56.0
kDa protein Rv1290c |
| P07083 | 1 | 0.000415 | 11.8324 | CML-PBP-No-MMR | CML-PBP-TKI-N | Hypothetical 9.8
kDa protein in Gp55-nrdG intergenic region |
| Q9KD45 | 2 | 1.21E-10 | 3.97407 | CML-PBP-MMR | CML-PBP-TKI-Y | Hypothetical
protein BH1374 |
| P47679 | 2 | 0.000507 | 4.0852 | CML-PBP-TKI-Y | CML-PBP-TKI-N | Hypothetical
protein MG441 |
| P42962a | 2 | 0.000554 | 9.91114 | CML-PBP-TKI-Y | CML-PBP-TKI-N | Hypothetical
protein ycsE |
| P54462 | 2 | 2.28E-13 | 60.8113 | CML-PBP-MMR | CML-PBP-TKI-Y | Hypothetical
protein yqeV |
|
P01876b | 14 | 1.04E-12 | 4.48826 | CML-PBP-TKI-N | CML-PBP-MMR | Ig alpha-1 chain
C region |
|
P01862a | 2 | 0.001527 | Infinity | CML-PBP-No-MMR | CML-PBP-TKI-N | Ig gamma-2 chain
C region |
| P01860 | 11 | 0.000542 | 4.16369 | CML-PBP-TKI-Y | CML-PBP-No-MMR | Ig gamma-3 chain C
region (Heavy chain) |
| P01861 | 14 | 3.90E-09 | 2.35422 | CML-PBP-TKI-Y | CML-PBP-No-MMR | Ig gamma-4 chain C
region |
|
P19181a | 4 | 0.005572 | 2.28883 | CML-PBP-MMR | CML-PBP-TKI-N | Ig heavy chain V
region 5A precursor |
|
P01765a | 2 | 4.91E-09 | 5.63765 | CML-PBP-TKI-N | CML-PBP-TKI-Y | Ig heavy chain
V-III region TIL |
|
P01620a | 5 | 0.000589 | 11.6515 | CML-PBP-No-MMR | CML-PBP-TKI-N | Ig kappa chain
V-III region SIE |
| P01842 | 6 | 0.000394 | 2.20304 | CML-PBP-TKI-Y | CML-PBP-TKI-N | Ig lambda chain C
regions |
| P01714 | 2 | 5.10E-12 | 3.83063 | CML-PBP-No-MMR | CML-PBP-TKI-Y | Ig lambda chain
V-III region SH |
| P04220 | 12 | 7.49E-06 | 3.79369 | CML-PBP-TKI-N | CML-PBP-TKI-Y | Ig MU heavy chain
disease protein (BOT) |
| P01591 | 5 | 0.000549 | 5.43077 | CML-PBP-No-MMR | CML-PBP-TKI-N | Immunoglobulin J
chain |
| P15814 | 2 | 9.08E-06 | 5.19282 | CML-PBP-MMR | CML-PBP-TKI-Y | Immunoglobulin
lambda-like polypeptide 1 |
| P36228 | 1 | 0.000179 | 3.92057 | CML-PBP-MMR | CML-PBP-TKI-Y | Infection
structure-specific protein 56 |
| P56289 | 3 | 3.29E-07 | 2.32089 | CML-PBP-TKI-N | CML-PBP-No-MMR | Initiation factor
EIF-5A-1 |
| P01314 | 1 | 2.90E-09 | 5.68794 | CML-PBP-TKI-N | CML-PBP-TKI-Y | Insulin |
| O02833 | 6 | 2.32E-09 | 183.422 | CML-PBP-MMR | CML-PBP-TKI-Y | Insulin-like growth
factor binding protein complex |
| P19827a | 13 | 2.04E-07 | 2.19294 | CML-PBP-TKI-N | CML-PBP-TKI-Y | Inter-alpha-trypsin
inhibitor heavy chain H1 precursor |
| P56651 | 1 | 5.41E-11 | 18.9887 | CML-PBP-MMR | CML-PBP-TKI-Y |
Inter-alpha-trypsin inhibitor heavy
chain H2 |
| P19823 | 17 | 0.001377 | 2.02663 | CML-PBP-TKI-Y | CML-PBP-TKI-N |
Inter-alpha-trypsin inhibitor heavy
chain H2 |
| P02750 | 7 | 1.91E-12 | 2.51124 | CML-PBP-TKI-N | CML-PBP-MMR | Leucine-rich
alpha-2-glycoprotein (LRG) |
| P06267 | 2 | 1.32E-12 | 4.06168 | CML-PBP-TKI-N | CML-PBP-No-MMR | Light-independent
protochlorophyllide reductase |
| P18428 | 2 | 7.86E-08 | 2.56066 | CML-PBP-TKI-Y | CML-PBP-MMR |
Lipopolysaccharide-binding protein
precursor (LBP) |
| P13796a | 4 | 9.06E-13 | 7.72276 | CML-PBP-No-MMR | CML-PBP-TKI-Y | L-plastin
(Lymphocyte cytosolic protein 1) (LCP-1) |
| P28717 | 1 | 2.95E-07 | 4.88405 | CML-PBP-TKI-Y | CML-PBP-TKI-N | Mating pheromone
3 precursor |
| Q9RV62 | 1 | 8.32E-07 | 2.27719 | CML-PBP-TKI-N | CML-PBP-MMR | NADH
pyrophosphatase (EC 3.6.1.-) |
| P41211 | 1 | 2.57E-06 | 2.48053 | CML-PBP-MMR | CML-PBP-TKI-Y | Neuron specific
calcium-binding protein |
| P70563 | 1 | 0.000537 | 13.799 | CML-PBP-No-MMR | CML-PBP-TKI-N | Nucleoside
diphosphate-linked moiety X motif 6 |
| P14287 | 1 | 5.51E-05 | 142.537 | CML-PBP-MMRs | CML-PBP-TKI-N | Osteopontin
precursor (Bone sialoprotein 1) |
| P97085 | 2 | 2.31E-06 | 2.01262 | CML-PBP-TKI-Y | CML-PBP-MMR | Outer membrane
protein U precursor (Porin ompU) |
| P31544 | 2 | 0.000651 | 49.286 | CML-PBP-MMR | CML-PBP-TKI-Y | PhoH protein
(Phosphate starvation-inducible protein |
| P57093 | 1 | 4.74E-10 | 5.0011 | CML-PBP-No-MMR | CML-PBP-TKI-Y | Phytanoyl-CoA
dioxygenase, peroxisomal |
| P03952 | 2 | 5.36E-10 | 3.76097 | CML-PBP-TKI-Y | CML-PBP-No-MMR | Plasma
kallikrein precursor |
| P02753a | 4 | 5.90E-13 | 3.91711 | CML-PBP-TKI-Y | CML-PBP-No-MMR | Plasma
retinol-binding protein precursor (PRBP) |
| P21922 | 1 | 0.000235 | 36.2475 | CML-PBP-TKI-Y | CML-PBP-No-MMR | Precorrin-4
C11-methyltransferase |
| Q06253 | 2 | 1.39E-09 | 4.17508 | CML-PBP-MMR | CML-PBP-TKI-Y | Prevent host death
protein |
| P07737a | 3 | 3.18E-14 | 14.753 | CML-PBP-TKI-Y | CML-PBP-MMR | Profilin I |
| P26604 | 1 | 0.001614 | Infinity | CML-PBP-No-MMR | CML-PBP-TKI-Y | Protein hdeA
precursor (10K-S protein) |
| Q9SM41 | 1 | 5.77E-08 | 6.67068 | CML-PBP-TKI-N | CML-PBP-TKI-Y | Protein translation
factor SUI1 homolog. |
| P00734 | 15 | 0.000479 | 3.44209 | CML-PBP-TKI-Y | CML-PBP-TKI-N | Prothrombin
precursor (EC 3.4.21.5) |
| Q55794 | 2 | 2.35E-13 | 8.13328 | CML-PBP-TKI-N | CML-PBP-MMR | Putative arsenical
pump-driving ATPase |
| Q15418 | 4 | 0.004805 | 6.05567 | CML-PBP-TKI-N | CML-PBP-TKI-Y | Ribosomal protein
S6 kinase alpha 1 |
| P00580 | 3 | 2.27E-09 | 4.02263 | CML-PBP-TKI-N | CML-PBP-TKI-Y | RNA polymerase
sigma-32 factor (Heat shock regulator) |
| P14072 | 1 | 0.000233 | 168.597 | CML-PBP-No-MMR | CML-PBP-TKI-N | Rubredoxin
(Rd) |
| P58402 | 2 | 9.27E-06 | 9.67406 | CML-PBP-TKI-N | CML-PBP-TKI-Y | Sensor protein evgS
precursor |
| Q9ZK14 | 2 | 6.65E-12 | 18.9567 | CML-PBP-TKI-N | CML-PBP-TKI-Y | Serine
acetyltransferase (SAT) |
|
P02787a | 53 | 2.49E-05 | 2.63861 | CML-PBP-TKI-Y | CML-PBP-TKI-N | Serotransferrin
precursor (Siderophilin) |
| P49064a | 4 | 5.43E-05 | Infinity | CML-PBP-TKI-Y | CML-PBP-MMR | Serum albumin
precursor (Allergen Fel d 2) |
| Q28522 | 43 | 5.22E-11 | 5.61756 | CML-PBP-TKI-Y | CML-PBP-No-MMR | Serum albumin
precursor (Fragment) |
| P02768 | 120 | 1.15E-09 | 2.87802 | CML-PBP-TKI-Y | CML-PBP-No-MMR | Serum albumin
precursor |
| P02743 | 1 | 1.17E-12 | 6.80911 | CML-PBP-TKI-Y | CML-PBP-TKI-N | Serum amyloid
P-component precursor (SAP) |
| P27169 | 5 | 2.21E-05 | 2.43474 | CML-PBP-TKI-Y | CML-PBP-MMR | Serum
paraoxonase/arylesterase 1 |
| P04278 | 2 | 8.55E-09 | 4.0875 | CML-PBP-TKI-Y | CML-PBP-No-MMR | Sex hormone-binding
globulin precursor (SHBG) |
| P95340a | 1 | 3.77E-15 | 16.6343 | CML-PBP-TKI-Y | CML-PBP-No-MMR | Shikimate
5-dehydrogenase |
| P57675 | 1 | 1.56E-07 | 24.6905 | CML-PBP-TKI-Y | CML-PBP-MMR | Stanniocalcin 2
(STC-2) (Fragments) |
| Q9R0K8 | 2 | 2.68E-10 | 6.96573 | CML-PBP-TKI-Y | CML-PBP-MMR | Stanniocalcin 2
precursor (STC-2) |
| P41691 | 3 | 4.82E-11 | 19.1566 | CML-PBP-TKI-Y | CML-PBP-TKI-N | Superfast myosin
regulatory light chain 2 (MYLC2) |
| P03729 | 1 | 2.18E-12 | 11.1468 | CML-PBP-TKI-N | CML-PBP-TKI-Y | Tail assembly
protein K |
| P43691 | 3 | 9.61E-11 | 3.55237 | CML-PBP-No-MMR | CML-PBP-TKI-Y | Transcription
factor GATA-4(GATA binding factor-4) |
| O22347 | 1 | 0.002132 | 12.1326 | CML-PBP-MMR | CML-PBP-TKI-N | Tubulin alpha-1
chain (Alpha-1 tubulin) |
| P12459 | 1 | 8.40E-14 | 9.68647 | CML-PBP-TKI-N | CML-PBP-No-MMR | Tubulin beta-1
chai |
|
P02774a | 17 | 2.45E-07 | 2.6983 | CML-PBP-TKI-Y | CML-PBP-No-MMR | Vitamin
D-binding protein precursor (DBP) (Group-s) |
| P04004 | 9 | 6.06E-09 | 2.12057 | CML-PBP-TKI-Y | CML-PBP-MMR | Vitronectin
precursor (Serum spreading factor) |
|
| B, The identified
differentially expressed proteins in BMP of CML patients with MMR,
No-MMR, On-TKI and NOT-on-TKI |
|
| Accession | Peptide count used
for quantification | Anova (p) | Max fold
change | Highest mean
condition | Lowest mean
condition | Description |
|
| Q9ZEY8 | 2 | 0.00866 | 1.5676 | CMR-N | TKI-N | 2-isopropylmalate
synthase (EC 4.1.3.12) |
| P49313a,b | 1 | 0.00086 | 2.8992 | TKI-N | CMR-Y | 30 kDa
ribonucleoprotein, chloroplast precursor |
| P02578b | 1 | 0.00023 | 2.4784 | TKI-N | CMR-Y | Actin 1 |
|
Q03341b | 1 | 0.00033 | 19.7447 | CMR-N | TKI-Y | Actin 2 |
| P02580b | 2 | 0.00001 | 16.5471 | CMR-Y | CMR-N | Actin 3 |
| P07829 | 1 | 0.01832 | 3.2349 | CMR-Y | TKI-N | Actin 3-SUB1 |
| P93584 | 1 | 0.01376 | 1.5206 | CMR-N | CMR-Y | Actin 82
(Fragment) |
| P53460 | 1 | 0.00928 | 8.5512 | TKI-N | CMR-N | Actin, muscle
1A |
| P50138b | 1 | 0.00431 | 88.6922 | CMR-Y | TKI-Y | Actin |
| Q9P4D1 | 1 | 0.01099 | 3.7590 | CMR-Y | TKI-Y | Actin |
|
P43652b | 13 | 0.00003 | 2.0878 | CMR-Y | TKI-N | Afamin precursor
(Alpha-albumin) (Alpha-Alb) |
| P19652b | 6 | 0.00163 | 1.5175 | CMR-Y | TKI-N | Alpha-1-acid
glycoprotein 2 precursor (AGP 2) |
| P01010b | 1 | 0.00421 | 2.2484 | CMR-Y | CMR-N | Alpha-1-antitrypsin
precursor (Alpha-1 protease inhibitor) |
| P01009 | 27 | 0.02049 | 1.7589 | CMR-Y | TKI-N |
Alpha-1-antitrypsin precursor (Alpha-1
protease inhibitor) |
|
P08697b | 7 | 0.00231 | 2.7616 | CMR-Y | TKI-N |
Alpha-2-antiplasmin precursor
(Alpha-2-plasmin inhibitor) |
| Q9N2D0 | 1 | 0.03147 | 4.9779 | CMR-Y | TKI-N |
Alpha-2-HS-glycoprotein precursor
(Fetuin-A) |
| P01023a | 67 | 0.00130 | 1.5666 | CMR-Y | TKI-N |
Alpha-2-macroglobulin precursor
(Alpha-2-M) |
| P01019 | 11 | 0.02295 | 1.4615 | CMR-Y | CMR-N | Angiotensinogen
precursor [Contains: Angiotensin I |
| P00896b | 1 | 0.00001 | 5.0581 | CMR-N | TKI-N | Anthranilate
synthase component I (EC 4.1.3.27) |
| P01008a | 9 | 0.00320 | 1.4376 | CMR-Y | TKI-Y | Antithrombin-III
precursor (ATIII) (PRO0309) |
| P32261b | 2 | 0.00084 | 5.0712 | TKI-N | CMR-N | Antithrombin-III
precursor (ATIII) |
| P09809 | 2 | 0.02421 | 1.5680 | TKI-N | CMR-Y | Apolipoprotein A-I
precursor (Apo-AI) |
|
P15497a | 2 | 0.03898 | 4.7003 | CMR-Y | CMR-N | Apolipoprotein
A-I precursor (Apo-AI) |
| P06727 | 14 | 0.01399 | 2.0475 | CMR-Y | TKI-Y | Apolipoprotein A-IV
precursor (Apo-AIV) |
| P02655a,b | 2 | 0.00001 | 2.0801 | CMR-Y | TKI-N | Apolipoprotein C-II
precursor (Apo-CII) |
| P41697 | 1 | 0.00423 | 1.9243 | TKI-Y | CMR-N | Bud site selection
protein BUD6 (Actin interacting protein) |
| P05109 | 2 | 0.04617 | 9.0518 | CMR-Y | TKI-N | Calgranulin A
(Migration inhibitory factor-related protein) |
| P25854 | 2 | 0.01368 | 1.5390 | TKI-Y | CMR-N | Calmodulin-1
(Fragment) |
| Q9NZT1 | 1 | 0.00088 | 1.9462 | CMR-N | TKI-Y | Calmodulin-like
skin protein |
| Q00371b | 1 | 0.00002 | 23.1103 | TKI-N | CMR-N | CAP22 protein |
| P00915b | 6 | 0.00072 | 5.4236 | CMR-N | TKI-N | Carbonic anhydrase
I (EC 4.2.1.1) (Carbonate dehydrase) |
| P25773b | 1 | 0.00000 | 6.6740 | CMR-Y | CMR-N | Cathepsin L (EC
3.4.22.15) (Progesterone-dependent) |
| P00450 | 20 | 0.00727 | 1.5284 | CMR-Y | CMR-N | Ceruloplasmin
precursor (EC 1.16.3.1) (Ferroxidase) |
| P13635 | 6 | 0.02286 | 1.5201 | CMR-Y | TKI-N | Ceruloplasmin
precursor (EC 1.16.3.1) (Ferroxidase) |
| Q61147 | 5 | 0.03054 | 2.4399 | TKI-N | TKI-Y | Ceruloplasmin
precursor (EC 1.16.3.1) (Ferroxidase) |
| P10909 | 6 | 0.00012 | 1.5866 | CMR-Y | CMR-N | Clusterin
precursor (Complement-associated protein) |
| P25958 | 3 | 0.00747 | 1.9061 | TKI-Y | TKI-N | ComG operon protein
6 |
| P02747 | 2 | 0.04052 | 28.8755 | CMR-Y | TKI-Y | Complement C1q
subcomponent, C chain precursor |
| P01026 | 10 | 0.00001 | 1.8285 | TKI-N | CMR-Y | Complement C3
precursor [Contains: C3A anaphylatox] |
| P12387 | 7 | 0.00010 | 1.8101 | CMR-N | CMR-Y | Complement C3
precursor [Contains: C3A anaphylatox] |
|
P01024a | 68 | 0.00088 | 1.6430 | CMR-Y | TKI-N | Complement C3
precursor [Contains: C3a anaphylatox] |
| P01028b | 42 | 0.00020 | 2.0579 | CMR-Y | TKI-Y | Complement C4
precursor [Contains: C4A anaphylatox] |
| P10643 | 3 | 0.04712 | 1.4974 | CMR-Y | CMR-N | Complement
component C7 precursor |
| P02748b | 7 | 0.00131 | 2.5543 | CMR-Y | TKI-N | Complement
component C9 precursor |
| P08603 | 30 | 0.00365 | 1.4060 | CMR-Y | TKI-N | Complement
factor H precursor (H factor 1) |
|
P48416b | 3 | 0.00000 | 3.5184 | TKI-N | CMR-Y | Cytochrome P450
10 (EC 1.14.-.-) (CYPX) |
| Q92I25b | 1 | 0.00007 | 2.6454 | TKI-Y | CMR-N | Dihydrodipicolinate
synthase (EC 4.2.1.52) (DHDPS) |
| P31073b | 1 | 0.00010 | 2.2735 | TKI-N | CMR-N | Dihydrofolate
reductase (EC 1.5.1.3) |
| P20861b | 1 | 0.00000 | 16.7020 | TKI-N | CMR-Y | Fan G protein
precursor |
|
P02671a,b | 21 | 0.00003 | 2.2257 | CMR-Y | TKI-Y | Fibrinogen
alpha/alpha-E chain precursor |
| P02675a,b | 24 | 0.00010 | 2.4767 | CMR-Y | CMR-N | Fibrinogen beta
chain precursor [Contains: Fibrinogen] |
|
Q02020b | 2 | 0.00461 | 2.5361 | CMR-Y | CMR-N | Fibrinogen beta
chain precursor [Contains: Fibrinogen] |
| P14480 | 7 | 0.00542 | 2.0499 | CMR-N | CMR-Y | Fibrinogen beta
chain precursor [Contains: Fibrinogen] |
| P02679a,b | 13 | 0.00110 | 2.1792 | CMR-Y | CMR-N | Fibrinogen gamma
chain precursor |
| Q92T27 | 2 | 0.00030 | 1.5959 | TKI-N | CMR-N | Glucokinase (EC
2.7.1.2) (Glucose kinase) |
| Q92J74 | 1 | 0.00712 | 2.6314 | CMR-Y | CMR-N |
Glutamyl-tRNA(Gln) amidotransferase
subunit C |
| Q60759 | 4 | 0.00301 | 1.8431 | TKI-N | CMR-Y | Glutaryl-CoA
dehydrogenase, mitochondrial precursor |
|
P23722a | 3 | 0.00380 | 1.5602 | TKI-N | CMR-Y | Glyceraldehyde
3-phosphate dehydrogenase |
|
Q9ZKP0a,b | 2 | 0.00292 | 2.4902 | CMR-Y | TKI-N |
Glycerol-3-phosphate dehydrogenase
[NAD(P)+] |
| P50150 | 1 | 0.03327 | 5.9505 | TKI-N | CMR-Y | Guanine
nucleotide-binding protein G(I)/G(S)/G(O) |
|
P07736b | 1 | 0.00189 | 2.7741 | TKI-N | CMR-Y | Guanyl-specific
ribonuclease U1 (EC 3.1.27.3) (Rna) |
| P50417 | 1 | 0.00764 | 5.7455 | CMR-Y | TKI-N | Haptoglobin
precursor |
| P00738 | 4 | 0.04834 | 2.6291 | CMR-Y | TKI-Y | Haptoglobin-2
precursor |
| P07414 | 2 | 0.00753 | 8.8724 | CMR-N | TKI-N | Hemoglobin alpha
chain |
| P01932 | 1 | 0.04336 | Infinity | CMR-Y | TKI-Y | Hemoglobin alpha
chain |
|
P01948b | 1 | 0.00432 | 2.0401 | TKI-Y | CMR-Y | Hemoglobin
alpha-1 and alpha-2 chains |
| Q9XSN3 | 1 | 0.00834 | 1.3880 | CMR-Y | TKI-N | Hemoglobin alpha-1
chain |
| P19002b | 2 | 0.00000 | 3.9434 | CMR-N | CMR-Y | Hemoglobin alpha-1,
alpha-2, and alpha-3 chains |
| P02037b | 1 | 0.00166 | 5.3495 | CMR-N | TKI-Y | Hemoglobin beta
chain |
| P11758 | 2 | 0.03762 | 3.2576 | CMR-Y | TKI-Y | Hemoglobin beta
chain |
| P02027 | 1 | 0.04456 | 16.1529 | CMR-N | CMR-Y | Hemoglobin beta
chain |
| P02064 | 1 | 0.02202 | 2.3093 | TKI-N | CMR-N | Hemoglobin beta-1
chain (Major) |
| P02074b | 1 | 0.00000 | 4.1199 | CMR-N | CMR-Y | Hemoglobin beta-III
chain |
| P19886b | 2 | 0.00008 | 2.0278 | CMR-N | CMR-Y | Hemoglobin delta
chain |
| P20058 | 2 | 0.03619 | 1.8809 | TKI-N | CMR-N | Hemopexin
precursor |
| P45965 | 1 | 0.04029 | 13.7398 | CMR-Y | CMR-N | Hypothetical 19.4
kDa protein T09A5.5 in chromosome |
| Q05107 | 1 | 0.02505 | 2.0311 | CMR-Y | CMR-N | Hypothetical 23.6
kDa protein |
| O34717 | 2 | 0.01355 | 1.4268 | TKI-Y | CMR-Y | Hypothetical
oxidoreductase ykuF (EC 1) |
|
P44030b | 1 | 0.00000 | 4.4405 | TKI-Y | CMR-Y | Hypothetical
protein HI0659 |
|
P42968b | 1 | 0.00003 | 4.3060 | TKI-N | CMR-N | Hypothetical
transcriptional regulator ycsO |
| P01876a,b | 1 | 0.00013 | 3.1121 | CMR-Y | CMR-N | Ig alpha-1 chain C
region |
| P01859 | 8 | 0.00015 | 1.8808 | TKI-Y | TKI-N | Ig gamma-2 chain
C region |
| P01860a | 3 | 0.00018 | 1.4555 | TKI-Y | TKI-N | Ig gamma-3 chain C
region (Heavy chain disease protein) |
| P01861a | 5 | 0.02495 | 1.4049 | CMR-Y | TKI-N | Ig gamma-4 chain C
region |
| P01779 | 2 | 0.02052 | 2.4688 | CMR-Y | CMR-N | Ig heavy chain
V-III region TUR |
| P01617 | 1 | 0.00016 | 1.9790 | CMR-Y | TKI-N | Ig kappa chain V-II
region TEW |
| P01625 | 3 | 0.01464 | 1.8173 | CMR-Y | CMR-N | Ig kappa chain
V-IV region Len |
|
P01842a | 5 | 0.00763 | 1.4632 | CMR-Y | CMR-N | Ig lambda chain
C regions |
|
P01591a | 5 | 0.03430 | 2.1773 | CMR-Y | TKI-Y | Immunoglobulin J
chain |
| P01335 | 1 | 0.00514 | 2.4827 | TKI-N | CMR-Y | Insulin
precursor |
| O02668 | 1 | 0.01041 | 13.1392 | CMR-Y | TKI-Y | Inter-alpha-trypsin
inhibitor heavy chain H2 precursor |
| P97279 | 2 | 0.03423 | 2.0472 | TKI-Y | TKI-N | Inter-alpha-trypsin
inhibitor heavy chain H2 precursor |
| Q42891b | 1 | 0.00002 | 2.2505 | TKI-N | CMR-N | Lactoylglutathione
lyase (EC 4.4.1.5) (Methylglyoxal) |
| P02750a | 9 | 0.01798 | 1.3841 | TKI-Y | CMR-N | Leucine-rich
alpha-2-glycoprotein (LRG) |
|
P06267a,b | 1 | 0.00005 | 3.9296 | CMR-N | TKI-N |
Light-independent protochlorophyllide
reductase iron-sulfur ATP-binding protein |
| Q61233 | 2 | 0.01594 | 3.5492 | CMR-Y | TKI-Y | L-plastin
(Lymphocyte cytosolic protein 1) (LCP-1) |
| P52162 | 1 | 0.01027 | 25.2703 | CMR-Y | TKI-N | MAX protein |
| P48310b | 1 | 0.00024 | 2.4866 | CMR-Y | TKI-N | Minor capsid
protein VI precursor |
|
O03698b | 1 | 0.00041 | 2.9113 | CMR-N | CMR-Y | NADH-ubiquinone
oxidoreductase chain 4 (EC 1.6.5.3) |
| Q43875 | 1 | 0.01342 | 4.0047 | CMR-Y | CMR-N | Nonspecific
lipid-transfer protein 4.2 precursor |
| P23051 | 1 | 0.00002 | 3.3474 | TKI-Y | TKI-N | Nucleocapsid
protein |
| P39115b | 1 | 0.00000 | 3.4012 | CMR-N | CMR-Y | Nucleotide binding
protein ExpZ |
| P32119b | 3 | 0.00000 | 4.3238 | CMR-N | CMR-Y | Peroxiredoxin 2
(Thioredoxin peroxidase 1) |
|
Q42858b | 1 | 0.00007 | 4.2693 | CMR-N | TKI-N | Phenylalanine
ammonia-lyase (EC 4.3.1.5) |
| O07125b | 1 | 0.00099 | 2.7853 | CMR-N | TKI-N | Phosphocarrier
protein HPr (ptsH) |
| P09411 | 1 | 0.01886 | 1.5949 | TKI-Y | TKI-N | Phosphoglycerate
kinase 1 (EC 2.7.2.3) |
| Q9KDM4 | 2 | 0.00513 | 1.6582 | TKI-N | CMR-N | Phosphoserine
aminotransferase (serC) (PSAT) |
| P02753 | 3 | 0.01195 | 1.5216 | CMR-N | TKI-N | Plasma
retinol-binding protein precursor (PRBP) |
| P76159 | 1 | 0.00538 | 1.7156 | TKI-N | CMR-Y | Probable lysozyme
from lambdoid prophage Qin |
| O67024 | 1 | 0.03110 |
Infinity | CMR-Y | TKI-N | Probable
peroxiredoxin |
| P07737 | 2 | 0.00870 | 1.8459 | CMR-Y | CMR-N | Profilin I |
| P00536 | 2 | 0.00697 | 1.5076 | TKI-N | CMR-N | Proto-oncogene
serine/threonine-protein kinase mos |
| P45604 | 1 | 0.00021 | 1.9033 | CMR-N | CMR-Y | PTS system,
N-acetylglucosamine-specific EIIABC component |
| Q59482 | 1 | 0.00519 | 4.2028 | CMR-Y | TKI-N | Purine
nucleoside phosphorylase (deoD) |
|
P55429b | 1 | 0.00004 | 2.5979 | CMR-N | CMR-Y | Putative
integrase/recombinase Y4EF |
| Q9AB80 | 3 | 0.00001 | 1.5354 | TKI-Y | CMR-Y | Putative outer
membrane protein CC0351 precursor |
| Q9X480 | 2 | 0.00113 | 1.8668 | CMR-N | CMR-Y | Putative signal
peptide peptidase sppA |
| P34443 | 3 | 0.02905 | 2.3131 | CMR-Y | TKI-Y | Ras-like protein
F54C8.5 |
| P34295 | 2 | 0.02474 | 1.4695 | TKI-Y | CMR-N | Regulator of G
protein signaling rgs-1 |
| Q9CG17a | 1 | 0.00003 | 1.7092 | CMR-Y | TKI-N | Ribonuclease HII
(EC 3.1.26.4) (RNase HII) |
|
P56566b | 2 | 0.00478 | 3.4601 | TKI-N | CMR-N | S100
calcium-binding protein A3 (S-100E protein) |
| P12346b | 2 | 0.00000 | 2.4638 | TKI-Y | TKI-N | Serotransferrin
precursor (Siderophilin) (Beta-1-metal-binding globulin) |
|
P19134b | 11 | 0.00347 | 2.2136 | TKI-N | CMR-N | Serotransferrin
precursor (Siderophilin) (Beta-1-metal-binding globulin) |
| P02787 | 44 | 0.00574 | 1.4954 | CMR-Y | CMR-N | Serotransferrin
precursor (Siderophilin) (Beta-1-m-b-g) |
|
P02769b | 5 | 0.00003 | 2.4650 | TKI-Y | CMR-N | Serum albumin
precursor (Allergen Bos d 6) |
| Q28522 | 7 | 0.04108 | 2.6927 | CMR-Y | TKI-N | Serum albumin
precursor (Fragment) |
|
P49065a,b | 2 | 0.00016 | 6.1150 | CMR-N | TKI-Y | Serum albumin
precursor |
| P27169a,b | 3 | 0.00416 | 2.1032 | TKI-Y | TKI-N | Serum
paraoxonase/arylesterase 1 (EC 3.1.1.2) |
| Q9CES7b | 1 | 0.00006 | 2.0972 | TKI-Y | TKI-N | Shikimate
5-dehydrogenase (EC 1.1.1.25) |
| P29950b | 2 | 0.00297 | 2.6116 | CMR-Y | TKI-Y | Uracil-DNA
glycosylase (EC 3.2.2.-) (UDG) (Fragment) |
| P02774 | 24 | 0.00013 | 1.9884 | CMR-Y | TKI-N | Vitamin D-binding
protein precursor (DBP) (VDB) |
| P73069 | 1 | 0.00765 | 1.8377 | CMR-N | CMR-Y | Ycf48-like
protein |
Similar to peripheral blood samples, >700
proteins representing 250 unique protein species were identified
when similar analysis was done on bone marrow pooled samples from 8
LT-MMR patients and 8 P-No-MMR patients. One hundred and
thirty-eight of the total identified proteins were significantly
differentially expressed between LT-MMR and P-No-MMR bone marrow
sample groups (>1.5- to ∞-fold change, P<0.05; Table IIB). These proteins predict
accurately LT-MMR patients vs. P-No-MMR patients using unsupervised
principal component analysis (Fig.
4B). These results were subsequently evaluated for comparisons
with the patterns obtained in early treatment response at 6 months.
Notably, the pattern and accuracy of clustering of samples is very
similar to that observed with the hierarchical cluster analysis
plots at 6 months (Fig. 3).
Protein fingerprinting for prediction of
treatment options for individualized therapy
Towards achieving the goal of personalized medicine,
the above observed differentially expressed proteins between
samples derived from LT-MMR patients vs. P-No-MMR patients were
evaluated for their potential for objective prediction of treatment
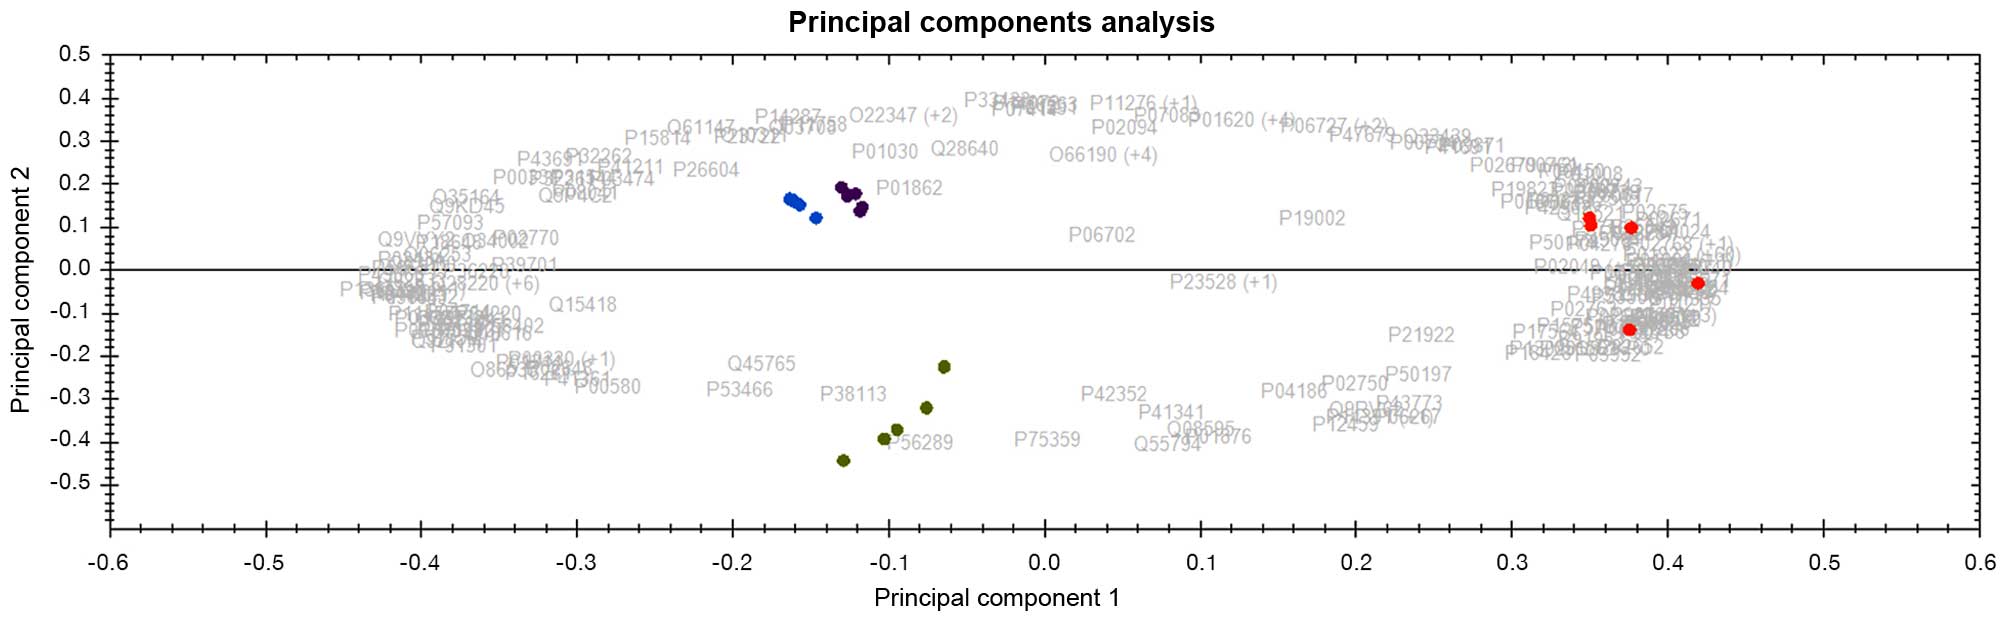
options for some of these cohorts of CML patients. Interestingly,
the panel of 164 and 138 differentially expressed protein datasets
derived from peripheral blood plasma (PBP) and bone marrow (BM)
respectively, also discriminates patients that stay on IM after 1
year of treatment from patients that ultimately required
alternative treatment options (second generation TKI/others)
(Fig. 5). Following >2 years of
follow-up of these patients the same dataset of potential protein
biomarkers could still accurately separate all analyzed sample
groups into their respective molecular response and treatment sub
groups, indicating their usefulness for treatment monitoring as
well as prediction of best choice of therapy for individual
patient. Some of the identified proteins were implicated in
hematological diseases as potential biomarkers using ingenuity
pathway analysis (IPA) (Fig. 6).
Functional annotations/disease affiliations of some of these
proteins implicated in CML are further described under discussion
below.
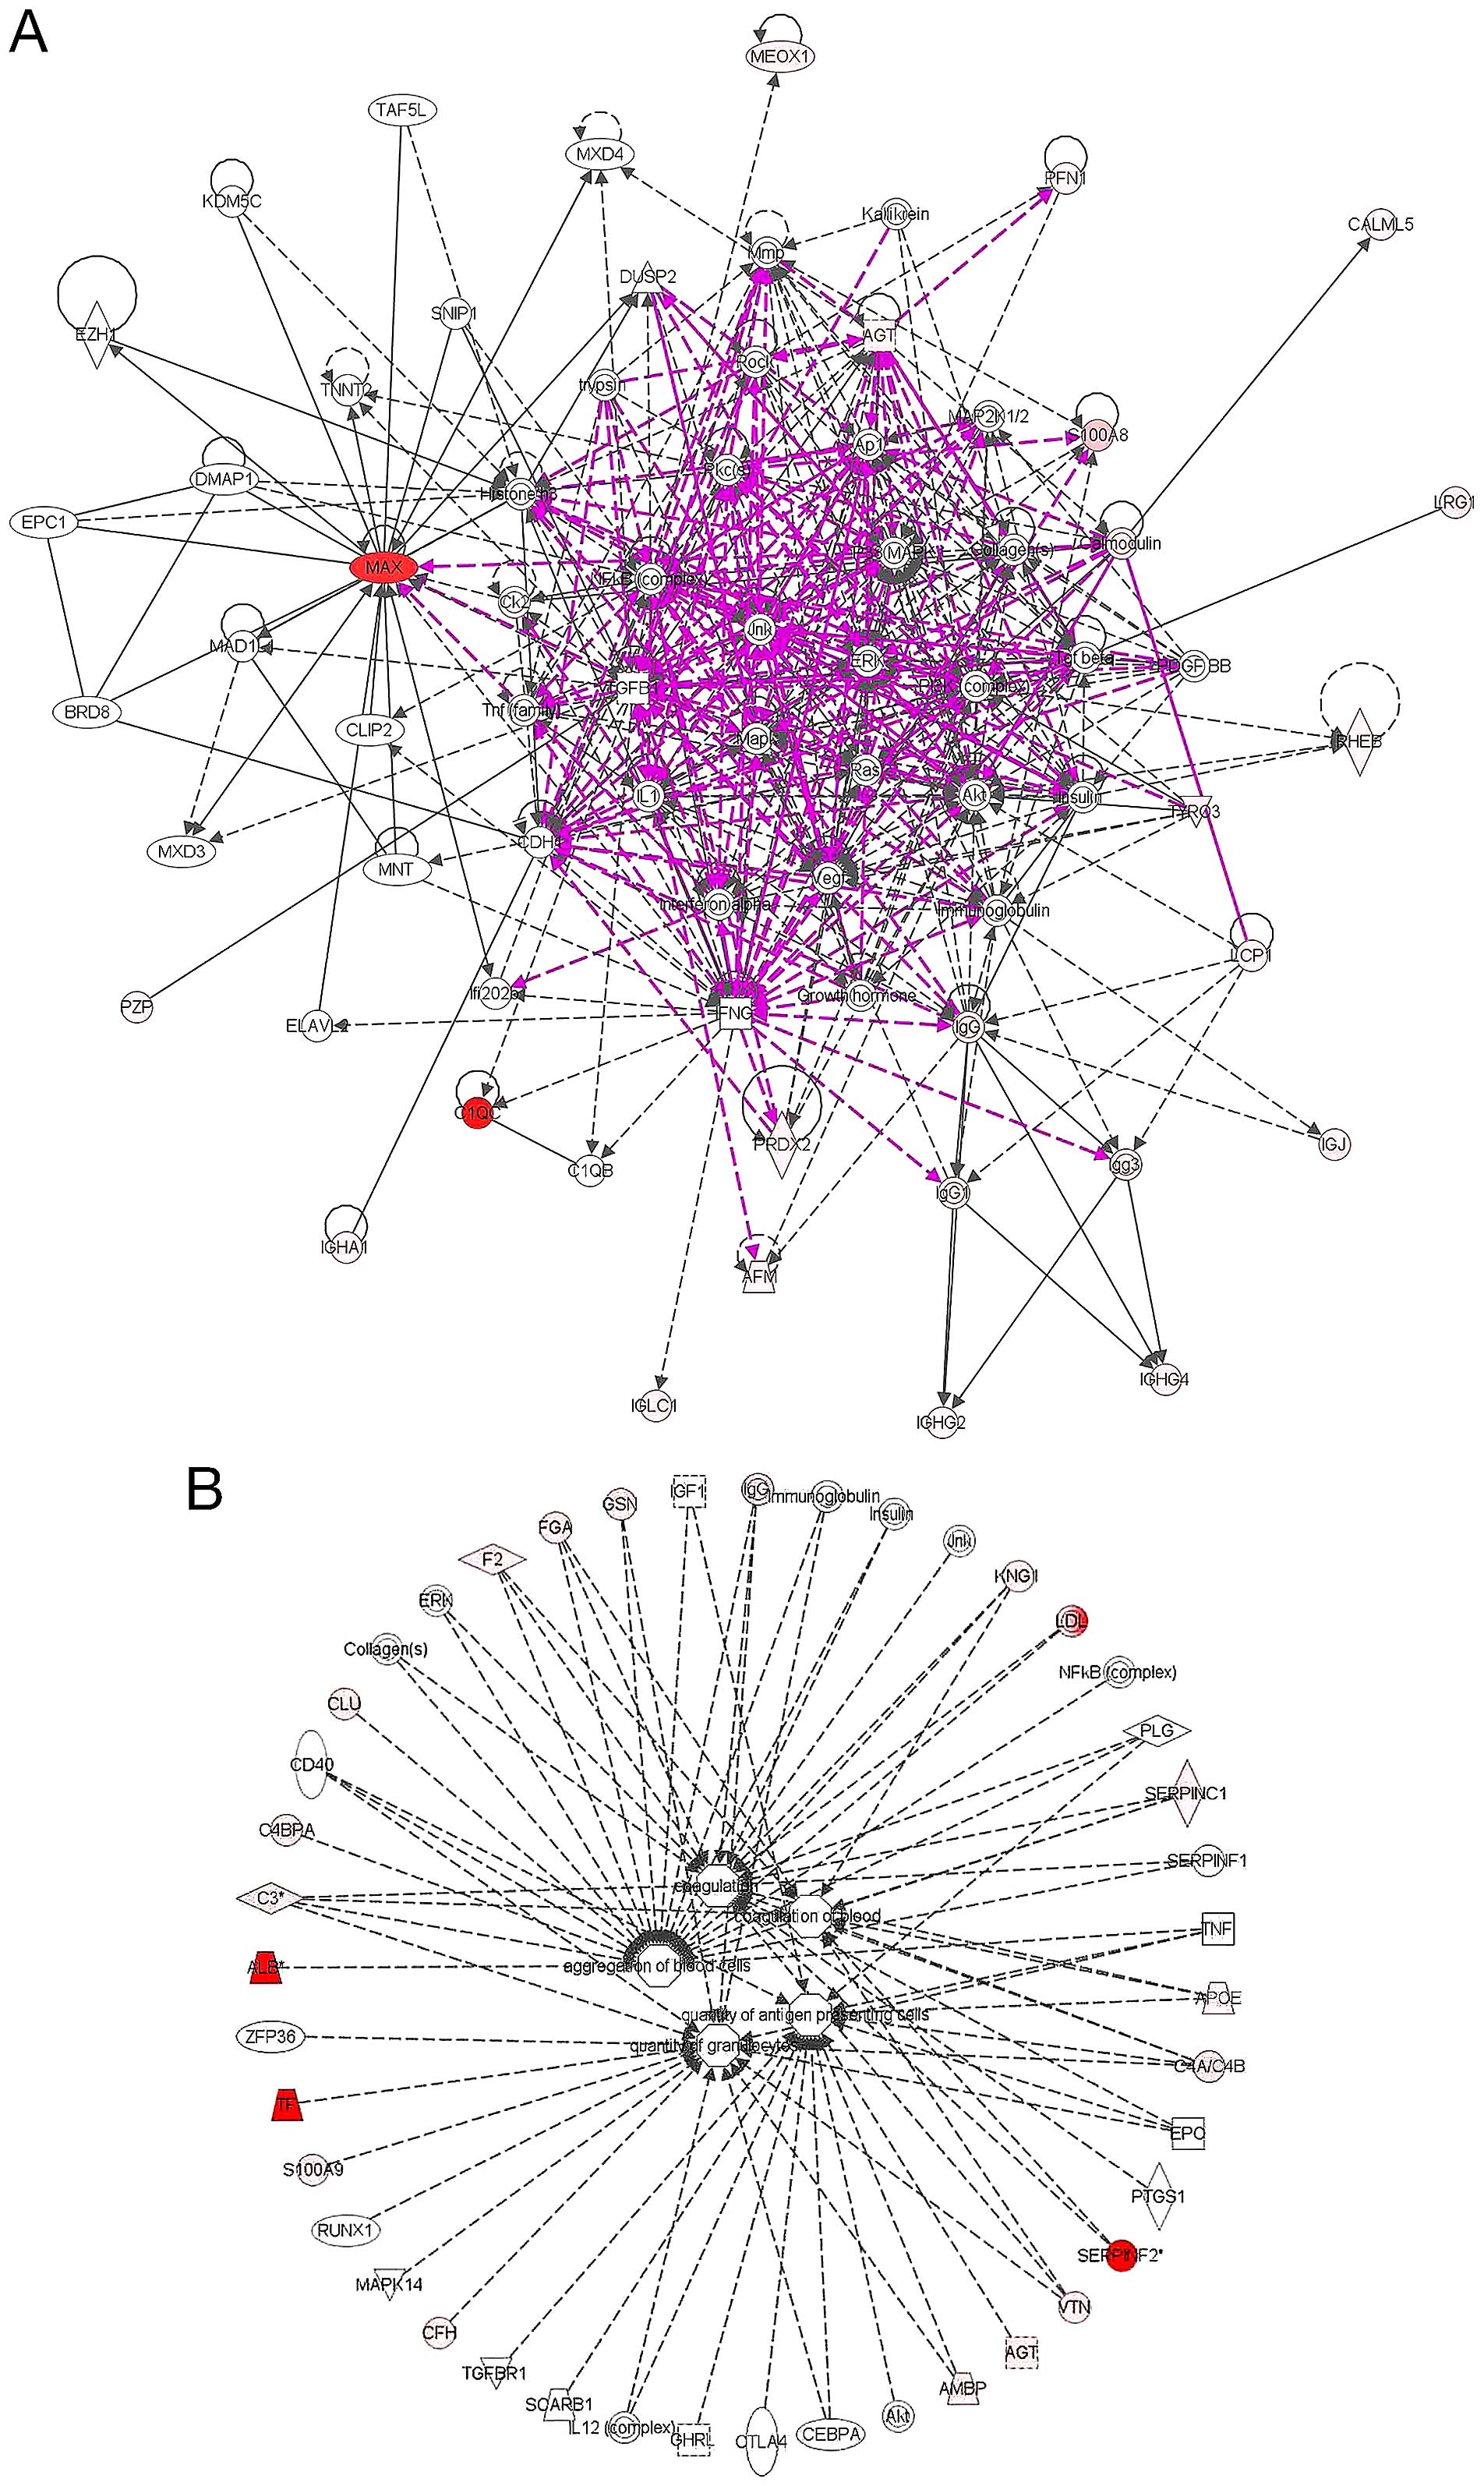 | Figure 6(A) Pathway analysis of network
signaling of some of the identified proteins as represented in the
ingenuity pathway analysis database. The analysis of the identified
proteins is composed of 2 hematological disease related networks
with over 100 associated molecules that were merged into one as
shown above. The connections and the expression profiles of some of
the identified proteins are as indicated. Red indicates an
upregulated protein, and pink color is indicative of
downregulation. A direct connection is by solid line and broken
lines indicate an indirect interaction between different molecules.
Other molecules outside the identified in this study are in grey
color. (B) The functional characteristics and disease relatedness
of some of the identified proteins were mapped in Ingenuity
database. The majority of these molecules are located mostly in the
plasma membrane, cytoplasm and extracellular space, while only a
few are located in the nucleus. Some these molecules functions as
enzymes, transporters, transcription regulator, or G-protein
coupled receptor. Others act as kinases, peptidase or growth
factor. Furthermore, some of these molecules as represented in
multiple sub-signaling networks mostly regulate among others:
Cell-To-Cell Signaling and Interaction, Hematological System
Development and Function. Other implicated functional annotations
include, aggregation of blood cells, coagulation, quantity of
aggregate cells as well as quantity of granulocytes. [The network
analysis was done and figure generated in ingenuity pathway
analysis program (IPA v8.7)]. |
Identification of protein changes in BM
as a reflection of detectable changes in peripheral blood
One of the main goals of this study was to
identify/develop disease-specific/disease-associated protein
biomarkers seen in bone marrow tissue as well as in peripheral
blood plasma. This would subsequently allow monitoring of such
biomarker proteins in peripheral blood, rather than bone marrow,
demanding less invasive procedures for objective prediction of
individual’s best treatment options and prognostic monitoring of
CML patients. We therefore explored the possibility whether the
proteins that are significantly differentially expressed in bone
marrow do also show similar expression pattern in peripheral blood.
With this in mind, we calculated how many of the 164 differentially
expressed proteins in peripheral blood and the 138 protein dataset
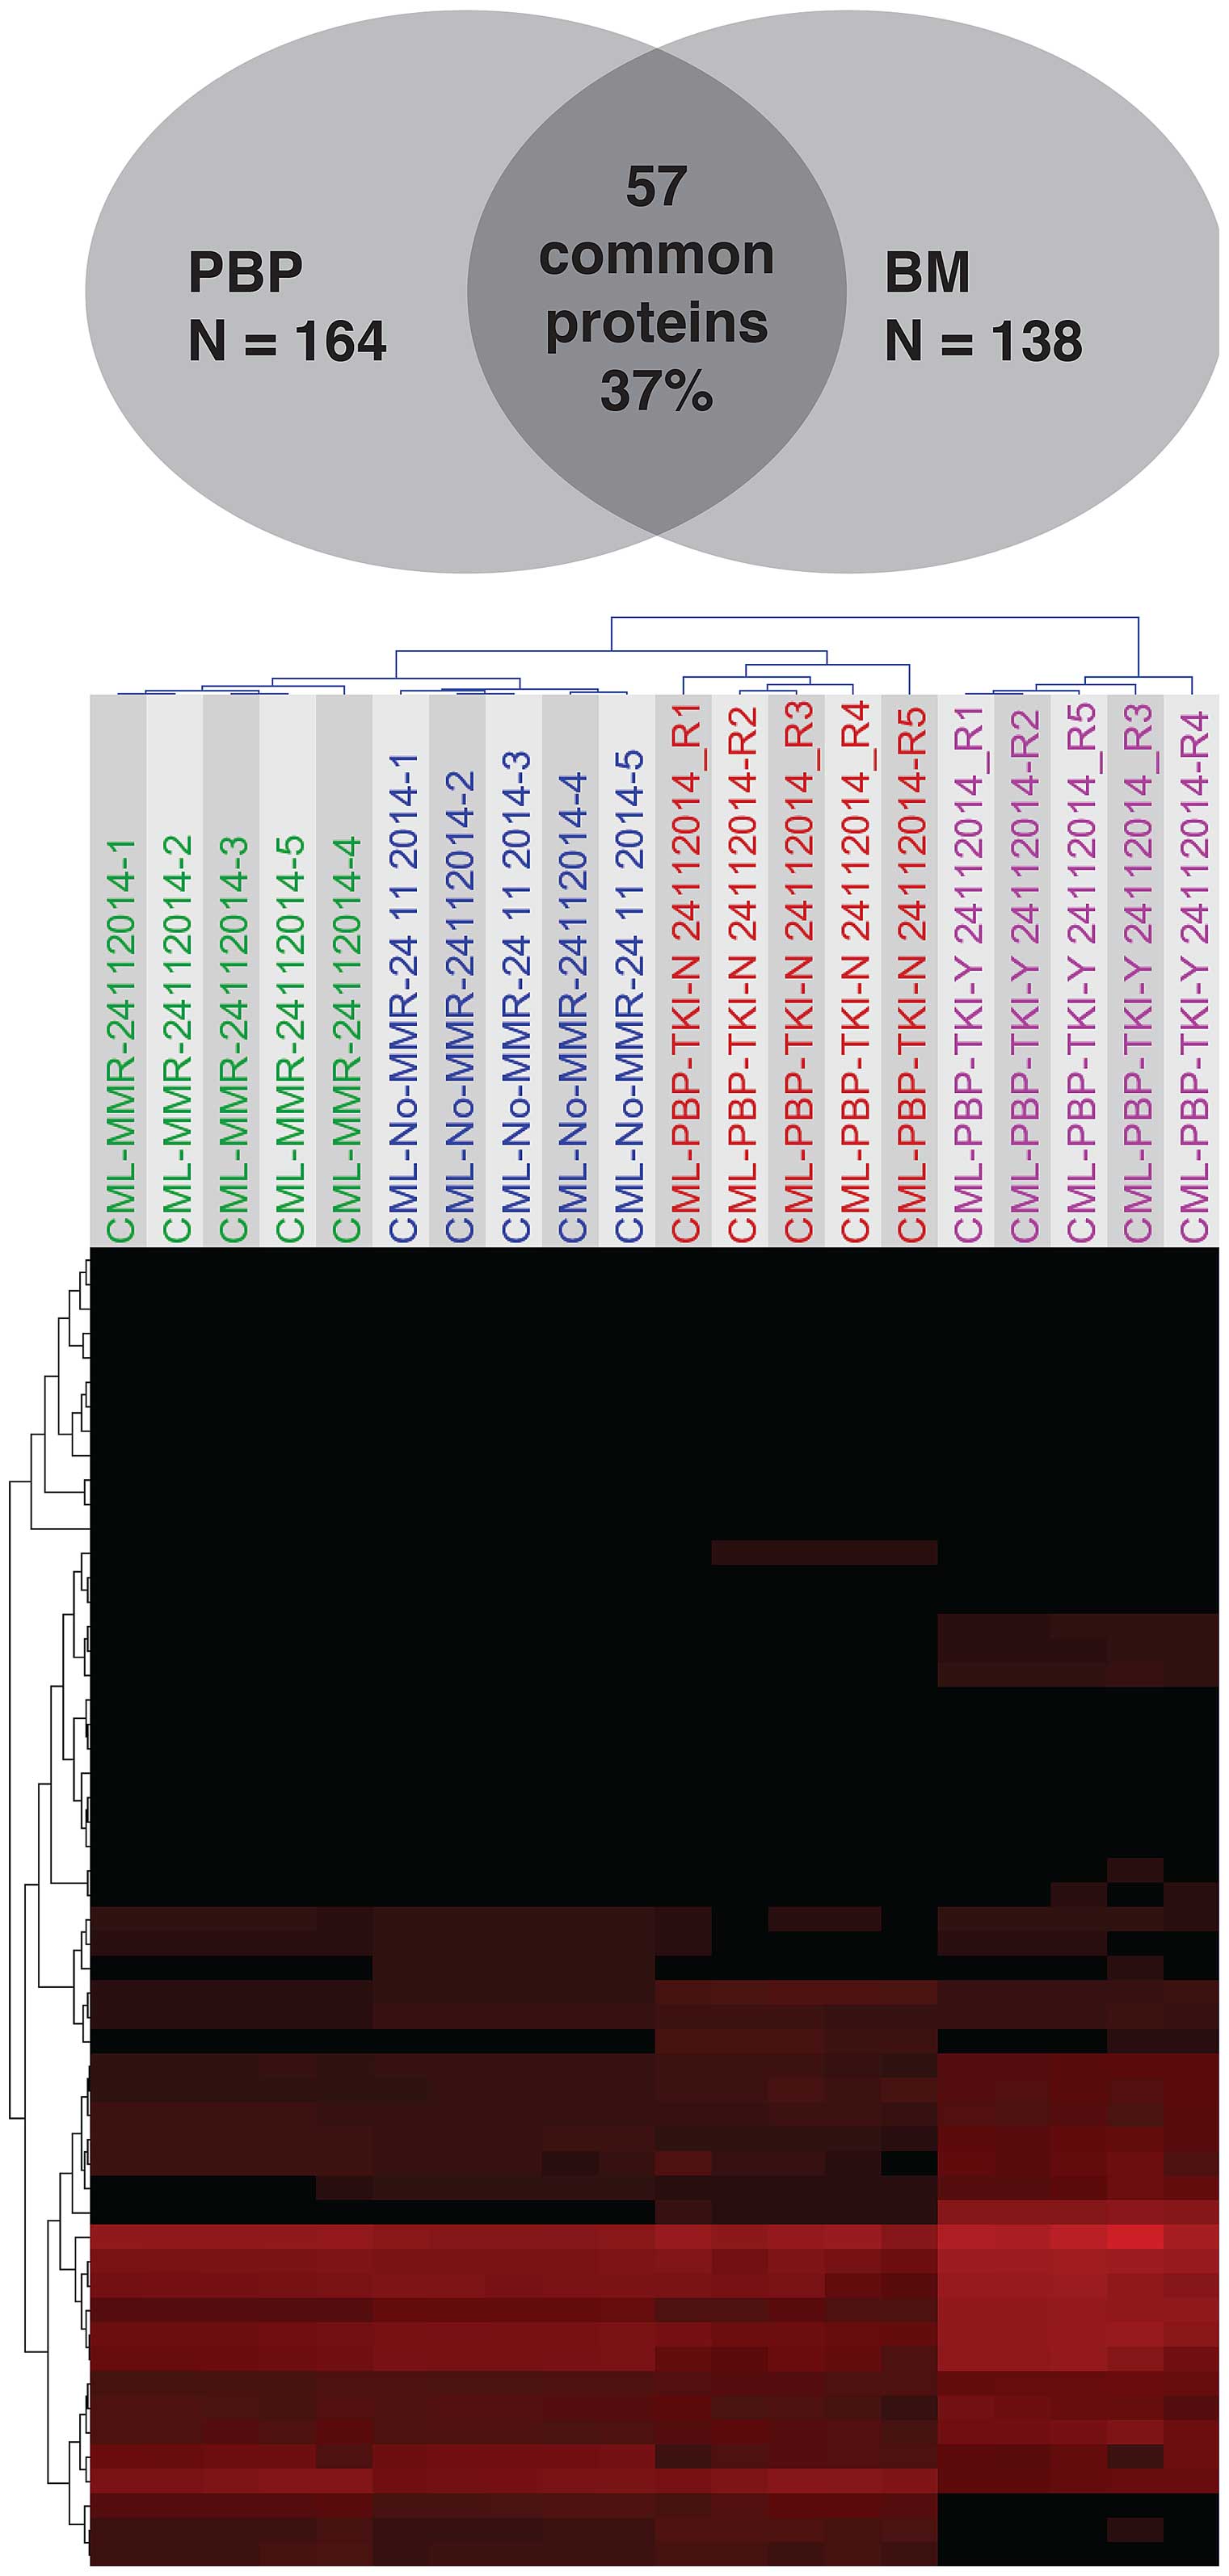
in bone marrow are common to both body compartments. We found that
only 54 proteins (~35%) were in common between the two 164 and 138
datasets as described above. This set of 54 proteins was then
subjected to unsupervised hierarchical clustering and
correspondence analyses. As shown in Fig. 7, all sample groups were
distinctively separated into four response subtypes using
unsupervised hierarchical cluster analysis. The common proteins
between the two body fluid compartments were highlighted in bold in
Table II.
Validation by western blot analysis of
some of the identified proteins
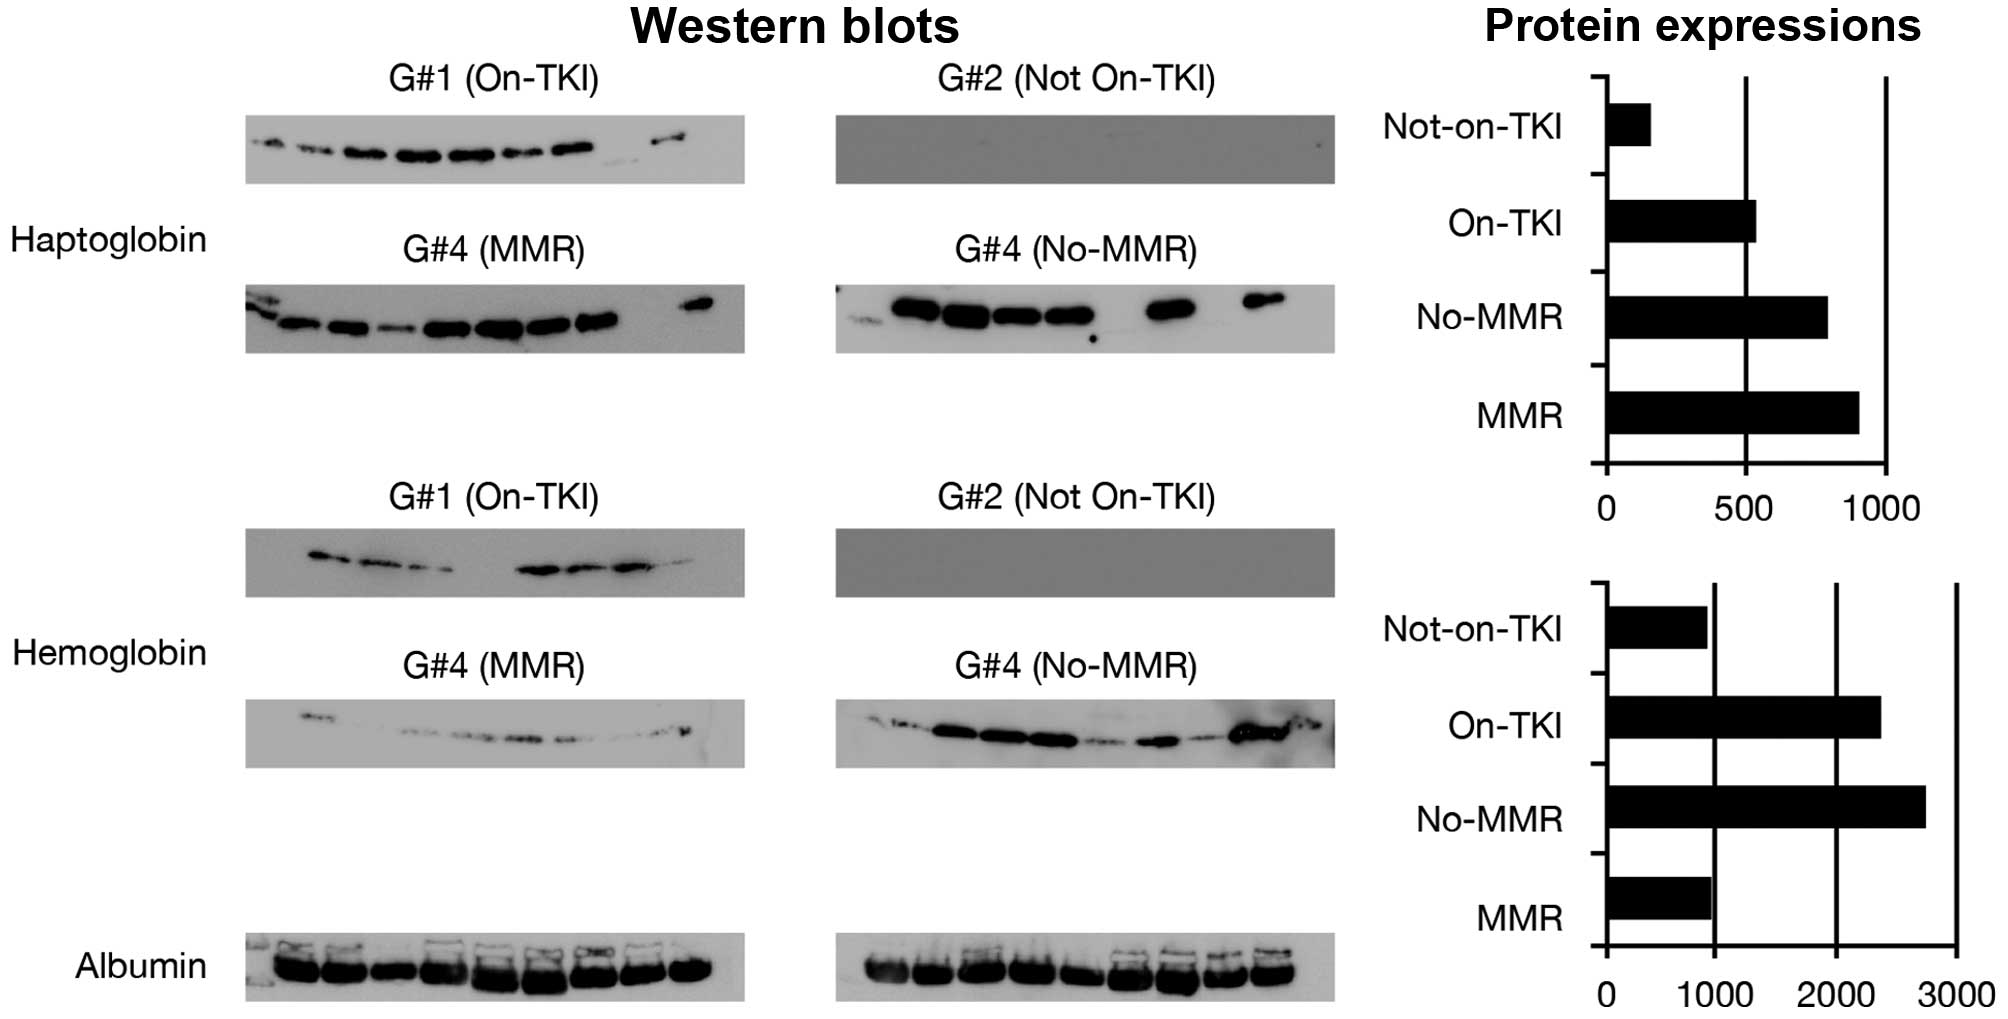
In an attempt to validate some of the differentially
expressed proteins, we have used immunoblotting analysis. Nine
individual samples consisting of 4 samples not included in the
proteomics analysis and 5 other samples from the proteomics
analyzed sample groups were tested for their expression of
haptoglobin and hemoglobin using specific antibodies against these
proteins. The expression levels of these proteins across all sample
groups were consistent with the average protein normalized levels
seen with label-free quantitative LC/MS/MS analysis (Fig. 8). Large scale validation of the
majority of these proteins was beyond the scope of this study in
order to develop limited panel of markers for clinical trial in a
later study.
Discussion
Clinical and molecular diagnosis of most
hematological malignancies including CML can be accurately made;
however, prediction of treatment response elude the currently
available tools for patient care.
A subset of significantly differentially expressed
proteins from both peripheral blood and bone marrow were selected
for their ability to discriminate samples derived from CML patients
that responded differently to initial first line treatment with
imatinib. Our strategy of proteomics mining of BM and PBP from the
same individual patient would provide unique possibility to
identify biomarkers from both sources thus, entailing less invasive
procedures.
Report of microarray analysis of peripheral blood
and bone marrow of CML samples in blast crisis cells, has been
shown with demonstrable biological changes between two bodily
fluids (19). Our analysis of
peripheral blood samples of 164 differentially expressed proteins
show that all samples were correctly classified and similar result
was observed with 138 protein changes in bone marrow samples as
shown in Fig. 4. Only 54 proteins
were shown to be commonly differentially expressed between blood
dataset and bone marrow protein dataset in the present study,
supporting our notion that it might be possible to identify
significant changes in the bone marrow of CML patients that are
measurable at peripheral blood compartment for routine
diagnostics.
We have attempted to use both the BMP and PBP
data-sets that accurately predict patients MMR status for possible
prediction of patients that continue to stay on IM after 1 year of
treatment vs. those that ultimately required alternative treatment
options (second generation TKI/others). Thus, the expression of the
158 protein changes in BM between MMR and No-MMR were further
evaluated in 16 unrelated patients that stay on TKI after 1 year of
imatinib treatment from patients that ultimately required
alternative treatment options (second generation TKI/others). We
found four distinct clusters with samples with MMR and No-MMR being
very closely separated (not as distinct as in Fig. 4), while patients that stay on TKI
(i.e. after 1 year of imatinib) treatment were distantly separated
from patients that ultimately required alternative treatment
options (second generation TKI/others) as shown in Fig. 5, meaning that it will be
challenging to construct a universal model for management of CML
patients and that prognostic datasets need to be created for each
specific response type.
We have used two independent proteomics analysis
platforms in the present study. The expression profiles of 2-DE
protein spots successfully discriminated two sample groups of CML
patients with MMR and No-MMR. We recognized the inherent limitation
of 2-DE based studies (20–22)
hence, we have in addition used label-free quantitative protein
expression using high definition liquid chromatography tandem mass
spectrometry (LC/MS/MS) to extensively map the proteome of bone
marrow as well as peripheral blood samples.
Previous studies have used multivariate statistical
algorithms and artificial learning models to predict cancer
prognosis and for grading different solid tumors (15,23–28).
The majority of these studies reported varying degrees of
sensitivity and specificity based on evaluation of different
clinical parameters (20,24).
Gene expression studies on hematological disease
have been largely carried out by analysis of DNA or RNA
microarrays. These genomics studies have indicated the potentials
of large scale analysis of gene expression towards better
understanding the molecular basis of leukemogenesis and that this
information could potentially be useful in the classification of
subtypes of hematological malignancies (19,29,30).
In a recent study of CLL samples, Alsagaby and colleagues used
combined transcriptomics and proteomics analyses to unravel the
heterogeneity of gene expression patterns as well attempting to
identify proteins that are implicated in prognosis of chronic
lymphocytic leukemia (31). Recent
studies have attempted to evaluate protein changes between imatinib
sensitive and resistance samples (32) as well as to better understand the
molecular mechanism in therapy resistance at the level of bone
marrow extracellular fluid in CML (33).
Our initial analysis of 64 differentially expressed
proteins of peripheral blood for prognostic monitoring of early CML
treatment response at 6 months was encouraging and led us into
extensive analysis of samples with sustained long-term MMR against
patients that persistently could not achieve MMR.
Some of the identified proteins in the bone marrow
of the 138 dataset for the prolonged and sustained MMR vs.
persistent No-MMR were further evaluated for their functional
characteristics and their hematological disease relevance using
ingenuity pathway analysis (IPA). In the canonical pathway analysis
of network signaling of identified proteins, only 48 of the 138
identified differentially expressed proteins were represented in
the IPA database. The analysis of the identified proteins is
composed of multiple networks of which, one is implicated in
hematological disorders. The cellular localization,
interconnections and functional annotation as well as the
expression profile of some of these 48 identified molecules are as
detailed in Fig. 6A. A review of
some of these molecules showed that they mostly regulate among
others: cell-to-cell signaling and interaction, hematological
system development and function, aggregation of blood cells,
coagulation, as well as quantity of granulocytes as indicated in
Fig. 6. Among the identified
proteins in this study is TYRO3 protein tyrosine kinase, a member
of TAM family of receptor tyrosine kinases (RTKs) and known for
their role as regulator of cellular proliferation, migration and
survival processes, as well as maintenance of blood coagulation
equilibrium (34). We observed
connection of TYRO 3 in AKT/P13K pathway; similar to that
previously described (34–36).
The S100A8 is a calcium-binding protein of the S100
family and have been described to be associated with myeloid
differentiation (37). We observed
a more than 9-fold differential expression of S100A8 and in the
network connecting with RAS, TGFb, MAPK and MMP. The S-100 protein
has been previously reported as a useful marker in juvenile chronic
myeloid leukemia (JCML) as well as myeloid leukemia cutis (LC)
(38,39).
Overexpression of MYC has been associated with CML
with poor response to imatinib (40,41).
We observed a more than 25-fold differential expression of MYC
associated factor x in this study.
Altogether our findings indicate that rather than
the use of a single marker, analyses of a panel of protein markers
have the potential to provide better insight into complex biologic
processes towards better prognostication of CML patients.
We recognize the limitation of this study as samples
were prospectively collected and patients observed over the years
for their treatment responses. One other issue with this study is
the low number of patients enrolled in different clinical and
molecular response groups; hence we have limited the analysis to
evaluation of patients based on MMR and whether or not they are on
IM or alternative treatment option (second generation
TKI/others).
In conclusion, we have identified protein signatures
capable of prediction of molecular response and choice of therapy
for CML patients at 6 months and beyond using expression proteomics
as objective stratification of CML patients for treatment
options.
Although these results are very promising, we
recognized that analysis of much larger materials of patients with
similar treatments and responses will be necessary to validate if
clustering analysis can be used as a routine prognostic tool for
CML patients.
These proteins might be valuable once validated, to
complement the currently existing parameters for reliable and
objective prediction of disease progression, monitoring treatment
response and clinical outcome of CML patients as a model of
personalized medicine.
Acknowledgements
We thank Dr Abdelilah Aboussekhra for critical
review, as well as Mr. Melvin Velasco, Mr. Parvez Siddiqui, Mr.
Romeo Caracas and Ms. Tusneem Elhassan for technical assistant. We
acknowledge the assistant and support of Mr. Faisal Al Otaibi and
the logistics and purchasing department, RC, KFSH&RC. The
present study was supported by the Research Center Administration,
KFSH&RC, Riyadh, Saudi Arabia (RAC# 2050 040).
Abbreviations:
|
CML
|
chronic myeloid leukemia
|
|
CMR
|
complete molecular response
|
|
CP
|
chronic phase
|
|
DAS
|
dasatinib
|
|
IM
|
imatinib mesylate
|
|
MCyR
|
major cytogenetic response
|
|
MMR
|
major molecular response
|
|
No-MMR
|
no-major molecular response
|
|
LT-MMR
|
long-term-MMR
|
|
P-No-MMR; persistent-no-MMR; TKI
|
tyrosine kinase inhibitors
|
|
2-DE
|
two-dimensional gel
electrophoresis
|
|
LC-MS/MS
|
liquid chromatography coupled with
tandem mass spectrometry
|
References
|
1
|
Bartram CR, de Klein A, Hagemeijer A, van
Agthoven T, Geurts van Kessel A, Bootsma D, Grosveld G,
Ferguson-Smith MA, Davies T, Stone M, et al: Translocation of c-ab1
oncogene correlates with the presence of a Philadelphia chromosome
in chronic myelocytic leukaemia. Nature. 306:277–280. 1983.
View Article : Google Scholar : PubMed/NCBI
|
|
2
|
Faderl S, Talpaz M, Estrov Z, O’Brien S,
Kurzrock R and Kantarjian HM: The biology of chronic myeloid
leukemia. N Engl J Med. 341:164–172. 1999. View Article : Google Scholar : PubMed/NCBI
|
|
3
|
Goldman JM and Melo JV: Chronic myeloid
leukemia--advances in biology and new approaches to treatment. N
Engl J Med. 349:1451–1464. 2003. View Article : Google Scholar : PubMed/NCBI
|
|
4
|
Kantarjian HM, Kurzrock R and Talpaz M:
Philadelphia chromosome-negative chronic myelogenous leukemia and
chronic myelomonocytic leukemia. Hematol Oncol Clin North Am.
4:389–404. 1990.PubMed/NCBI
|
|
5
|
Martiat P, Michaux JL and Rodhain J:
Philadelphia-negative (Ph-) chronic myeloid leukemia (CML):
Comparison with Ph+ CML and chronic myelomonocytic leukemia. The
Groupe Français de Cytogénétique Hématologique. Blood. 78:205–211.
1991.PubMed/NCBI
|
|
6
|
Santucci MA, Saglio G and Tura S:
Pathogenesis and progression of chronic myeloid leukemia.
Haematologica. 81:63–76. 1996.PubMed/NCBI
|
|
7
|
Goldman JM: Chronic myeloid leukemia: A
historical perspective. Semin Hematol. 47:302–311. 2010. View Article : Google Scholar : PubMed/NCBI
|
|
8
|
Kantarjian HM, O’Brien S, Smith TL, Rios
MB, Cortes J, Beran M, Koller C, Giles FJ, Andreeff M, Kornblau S,
et al: Treatment of Philadelphia chromosome-positive early chronic
phase chronic myelogenous leukemia with daily doses of interferon
alpha and low-dose cytarabine. J Clin Oncol. 17:284–292.
1999.PubMed/NCBI
|
|
9
|
Druker BJ, Sawyers CL, Kantarjian H, Resta
DJ, Reese SF, Ford JM, Capdeville R and Talpaz M: Activity of a
specific inhibitor of the BCR-ABL tyrosine kinase in the blast
crisis of chronic myeloid leukemia and acute lymphoblastic leukemia
with the Philadelphia chromosome. N Engl J Med. 344:1038–1042.
2001. View Article : Google Scholar : PubMed/NCBI
|
|
10
|
Gambacorti-Passerini C, le Coutre P,
Mologni L, Fanelli M, Bertazzoli C, Marchesi E, Di Nicola M, Biondi
A, Corneo GM, Belotti D, et al: Inhibition of the ABL kinase
activity blocks the proliferation of BCR/ABL+ leukemic
cells and induces apoptosis. Blood Cells Mol Dis. 23:380–394. 1997.
View Article : Google Scholar
|
|
11
|
Kantarjian HM, Cortes JE, O’Brien S, Giles
F, Garcia-Manero G, Faderl S, Thomas D, Jeha S, Rios MB, Letvak L,
et al: Imatinib mesylate therapy in newly diagnosed patients with
Philadelphia chromosome-positive chronic myelogenous leukemia: High
incidence of early complete and major cytogenetic responses. Blood.
101:97–100. 2003. View Article : Google Scholar
|
|
12
|
Kantarjian H, Talpaz M, O’Brien S,
Garcia-Manero G, Verstovsek S, Giles F, Rios MB, Shan J, Letvak L,
Thomas D, et al: High-dose imatinib mesylate therapy in newly
diagnosed Philadelphia chromosome-positive chronic phase chronic
myeloid leukemia. Blood. 103:2873–2878. 2004. View Article : Google Scholar : PubMed/NCBI
|
|
13
|
Hughes TP and Branford S: Monitoring
disease response to tyrosine kinase inhibitor therapy in CML.
Hematology Am Soc Hematol Educ Program. 2009.477–487.
2009.PubMed/NCBI
|
|
14
|
Alaiya AA1, Franzén B, Hagman A, Dysvik B,
Roblick UJ, Becker S, Moberger B, Auer G and Linder S: Molecular
classification of borderline ovarian tumors using hierarchical
cluster analysis of protein expression profiles. Int J Cancer.
98:895–899. 2002. View Article : Google Scholar : PubMed/NCBI
|
|
15
|
Alaiya AA, Franzén B, Hagman A,
Silfverswärd C, Moberger B, Linder S and Auer G: Classification of
human ovarian tumors using multivariate data analysis of
polypeptide expression patterns. Int J Cancer. 86:731–736. 2000.
View Article : Google Scholar : PubMed/NCBI
|
|
16
|
Alaiya A, Fox J, Bobis S, Matic G,
Shinwari Z, Barhoush E, Márquez M, Nilsson S and Holmberg AR:
Proteomic analysis of soft tissue tumor implants treated with a
novel polybisphosphonate. Cancer Genomics Proteomics. 11:39–49.
2014.PubMed/NCBI
|
|
17
|
Al-Moghrabi N, Nofel A, Al-Yousef N,
Madkhali S, Bin Amer SM, Alaiya A, Shinwari Z, Al-Tweigeri T,
Karakas B, Tulbah A, et al: The molecular significance of
methylated BRCA1 promoter in white blood cells of cancer-free
females. BMC Cancer. 14:8302014. View Article : Google Scholar : PubMed/NCBI
|
|
18
|
Li GZ, Vissers JP, Silva JC, Golick D,
Gorenstein MV and Geromanos SJ: Database searching and accounting
of multiplexed precursor and product ion spectra from the data
independent analysis of simple and complex peptide mixtures.
Proteomics. 9:1696–1719. 2009. View Article : Google Scholar : PubMed/NCBI
|
|
19
|
Nowicki MO, Pawlowski P, Fischer T, Hess
G, Pawlowski T and Skorski T: Chronic myelogenous leukemia
molecular signature. Oncogene. 22:3952–3963. 2003. View Article : Google Scholar : PubMed/NCBI
|
|
20
|
Alaiya A, Al-Mohanna M and Linder S:
Clinical cancer proteomics: Promises and pitfalls. J Proteome Res.
4:1213–1222. 2005. View Article : Google Scholar : PubMed/NCBI
|
|
21
|
Celis JE: Gel-based proteomics: What does
MCP expect? Mol Cell Proteomics. 3:9492004.PubMed/NCBI
|
|
22
|
Celis JE and Gromov P: High-resolution
two-dimensional gel electrophoresis and protein identification
using western blotting and ECL detection. EXS. 88:55–67.
2000.PubMed/NCBI
|
|
23
|
Alaiya AA, Franzén B, Fujioka K, Moberger
B, Schedvins K, Silfversvärd C, Linder S and Auer G: Phenotypic
analysis of ovarian carcinoma: polypeptide expression in benign,
borderline and malignant tumors. Int J Cancer. 73:678–683. 1997.
View Article : Google Scholar : PubMed/NCBI
|
|
24
|
Alaiya AA, Franzén B, Moberger B,
Silfverswärd C, Linder S and Auer G: Two-dimensional gel analysis
of protein expression in ovarian tumors shows a low degree of
intratumoral heterogeneity. Electrophoresis. 20:1039–1046. 1999.
View Article : Google Scholar : PubMed/NCBI
|
|
25
|
Erler BS, Hsu L, Truong HM, Petrovic LM,
Kim SS, Huh MH, Ferrell LD, Thung SN, Geller SA and Marchevsky AM:
Image analysis and diagnostic classification of hepatocellular
carcinoma using neural networks and multivariate discriminant
functions. Lab Invest. 71:446–451. 1994.PubMed/NCBI
|
|
26
|
Goldschmidt D, Decaestecker C, Berthe JV,
Gordower L, Remmelink M, Danguy A, Pasteels JL, Salmon I and Kiss
R: The contribution of image cytometry and artificial
intelligence-related methods of numerical data analysis for adipose
tumor histopathologic classification. Lab Invest. 75:295–306.
1996.PubMed/NCBI
|
|
27
|
Ravdin PM, Clark GM, Hilsenbeck SG, Owens
MA, Vendely P, Pandian MR and McGuire WL: A demonstration that
breast cancer recurrence can be predicted by neural network
analysis. Breast Cancer Res Treat. 21:47–53. 1992. View Article : Google Scholar : PubMed/NCBI
|
|
28
|
Tewari A and Narayan P: Novel staging tool
for localized prostate cancer: A pilot study using genetic adaptive
neural networks. J Urol. 160:430–436. 1998. View Article : Google Scholar : PubMed/NCBI
|
|
29
|
Albano F, Zagaria A, Anelli L, Coccaro N,
Impera L, Minervini CF, Minervini A, Rossi AR, Tota G, Casieri P,
et al: Gene expression profiling of chronic myeloid leukemia with
variant t(9;22) reveals a different signature from cases with
classic translocation. Mol Cancer. 12:362013. View Article : Google Scholar : PubMed/NCBI
|
|
30
|
Verhaak RG, Wouters BJ, Erpelinck CA,
Abbas S, Beverloo HB, Lugthart S, Löwenberg B, Delwel R and Valk
PJ: Prediction of molecular subtypes in acute myeloid leukemia
based on gene expression profiling. Haematologica. 94:131–134.
2009. View Article : Google Scholar :
|
|
31
|
Alsagaby SA, Khanna S, Hart KW, Pratt G,
Fegan C, Pepper C, Brewis IA and Brennan P: Proteomics-based
strategies to identify proteins relevant to chronic lymphocytic
leukemia. J Proteome Res. 13:5051–5062. 2014. View Article : Google Scholar : PubMed/NCBI
|
|
32
|
Pizzatti L, Panis C, Lemos G, Rocha M,
Cecchini R, Souza GH and Abdelhay E: Label-free MSE proteomic
analysis of chronic myeloid leukemia bone marrow plasma: Disclosing
new insights from therapy resistance. Proteomics. 12:2618–2631.
2012. View Article : Google Scholar : PubMed/NCBI
|
|
33
|
Gjertsen BT and Wiig H: Investigation of
therapy resistance mechanisms in myeloid leukemia by protein
profiling of bone marrow extracellular fluid. Expert Rev
Proteomics. 9:595–598. 2012. View Article : Google Scholar : PubMed/NCBI
|
|
34
|
Linger RM, Keating AK, Earp HS and Graham
DK: TAM receptor tyrosine kinases: Biologic functions, signaling,
and potential therapeutic targeting in human cancer. Adv Cancer
Res. 100:35–83. 2008. View Article : Google Scholar : PubMed/NCBI
|
|
35
|
Sun WS, Fujimoto J and Tamaya T: Clinical
implications of coexpression of growth arrest-specific gene 6 and
receptor tyrosine kinases Axl and Sky in human uterine leiomyoma.
Mol Hum Reprod. 9:701–707. 2003. View Article : Google Scholar : PubMed/NCBI
|
|
36
|
Zhu S, Wurdak H, Wang Y, Galkin A, Tao H,
Li J, Lyssiotis CA, Yan F, Tu BP, Miraglia L, et al: A genomic
screen identifies TYRO3 as a MITF regulator in melanoma. Proc Natl
Acad Sci USA. 106:17025–17030. 2009. View Article : Google Scholar : PubMed/NCBI
|
|
37
|
Kerkhoff C, Klempt M and Sorg C: Novel
insights into structure and function of MRP8 (S100A8) and MRP14
(S100A9). Biochim Biophys Acta. 1448:200–211. 1998. View Article : Google Scholar
|
|
38
|
Thomas CG, Patel RM and Bergfeld WF:
Cytophagic and S-100 protein immunoreactive myeloid leukemia cutis.
J Cutan Pathol. 37:390–395. 2010. View Article : Google Scholar
|
|
39
|
Ng CS, Lam TK, Chan JK, Hui PK, Ng HK,
Szeto SC and Feng CS: Juvenile chronic myeloid leukemia. A
malignancy of S-100 protein-positive histiocytes. Am J Clin Pathol.
90:575–582. 1988. View Article : Google Scholar : PubMed/NCBI
|
|
40
|
Gómez-Casares MT, García-Alegria E,
López-Jorge CE, Ferrándiz N, Blanco R, Alvarez S, Vaqué JP,
Bretones G, Caraballo JM, Sánchez-Bailón P, et al: MYC antagonizes
the differentiation induced by imatinib in chronic myeloid leukemia
cells through downregulation of p27KIP1. Oncogene.
32:2239–2246. 2013. View Article : Google Scholar
|
|
41
|
Vaqué JP, Navascues J, Shiio Y, Laiho M,
Ajenjo N, Mauleon I, Matallanas D, Crespo P and León J: Myc
antagonizes Ras-mediated growth arrest in leukemia cells through
the inhibition of the Ras-ERK-p21Cip1 pathway. J Biol
Chem. 280:1112–1122. 2005. View Article : Google Scholar
|