Introduction
Ovarian cancer is the fifth leading cause of cancer
deaths in women and has the highest overall mortality rate and poor
5-year survival. More than 90% of ovarian cancer cases are
epithelial ovarian cancer (EOC), which represents a series of
etiologically and molecularly distinct disease. Although early
diagnosis and therapy are considered to be the most effective
methods to improve the outcome of patients with any cancer, the
majority of EOC patients often do not manifest clinical symptoms
and receive medical intervention when their tumor cells have
disseminated to the peritoneal cavity. Currently, the standard
therapy for EOC is surgical resection followed by postoperative
chemotherapy with carboplatin and paclitaxel (PTX). Despite initial
responsiveness to cisplatin-based chemotherapy, surgical and
chemotherapy is far from satisfactory and most patients eventually
develop drug-resistant tumors and succumb to the recurrent disease.
This is why the majority of EOC patients with advanced disease
relapse within 5 years, and little progress has been made in
improving overall survival rates. Previous studies have proposed
numerous factors to influence drug-resistance, such as
ATP-dependent efflux pumps, extracellular microenvironment, DNA
repair mechanism, modification of the drug target, drug-induced
cytotoxicity, disruptions in apoptotic signaling pathways and
changes in the expression of protein associated with tumor
resistance (1,2). Cisplatin has been used to treat
various cancers primarily by causing DNA damage and has been
accepted worldwide as a first-line anticancer drug for EOC
chemotherapy. In this regard, to identify those patients who have
potential recurrence and to overcome chemoresistance and therefore
improving patient outcome are the serious challenges in the
management of EOC patients. Nevertheless, none of the identified
biomarkers for drug resistance have been proven acceptable for
routine clinical use. Hence, identification of clinical reliable
biomarkers has come to the forefront of investigation. Moreover, if
a non-invasive but sensitive blood assay that can monitor responses
to chemotherapy was available, it would be invaluable for guiding
chemotherapy and greatly improving the overall survival rate of EOC
patients.
Mass spectrometry (MS) is an important
high-throughput, industrially stable, information-rich technique
for profiling small molecular compounds and is widely used to
assess potential diagnostic and prognostic biomarkers. We applied
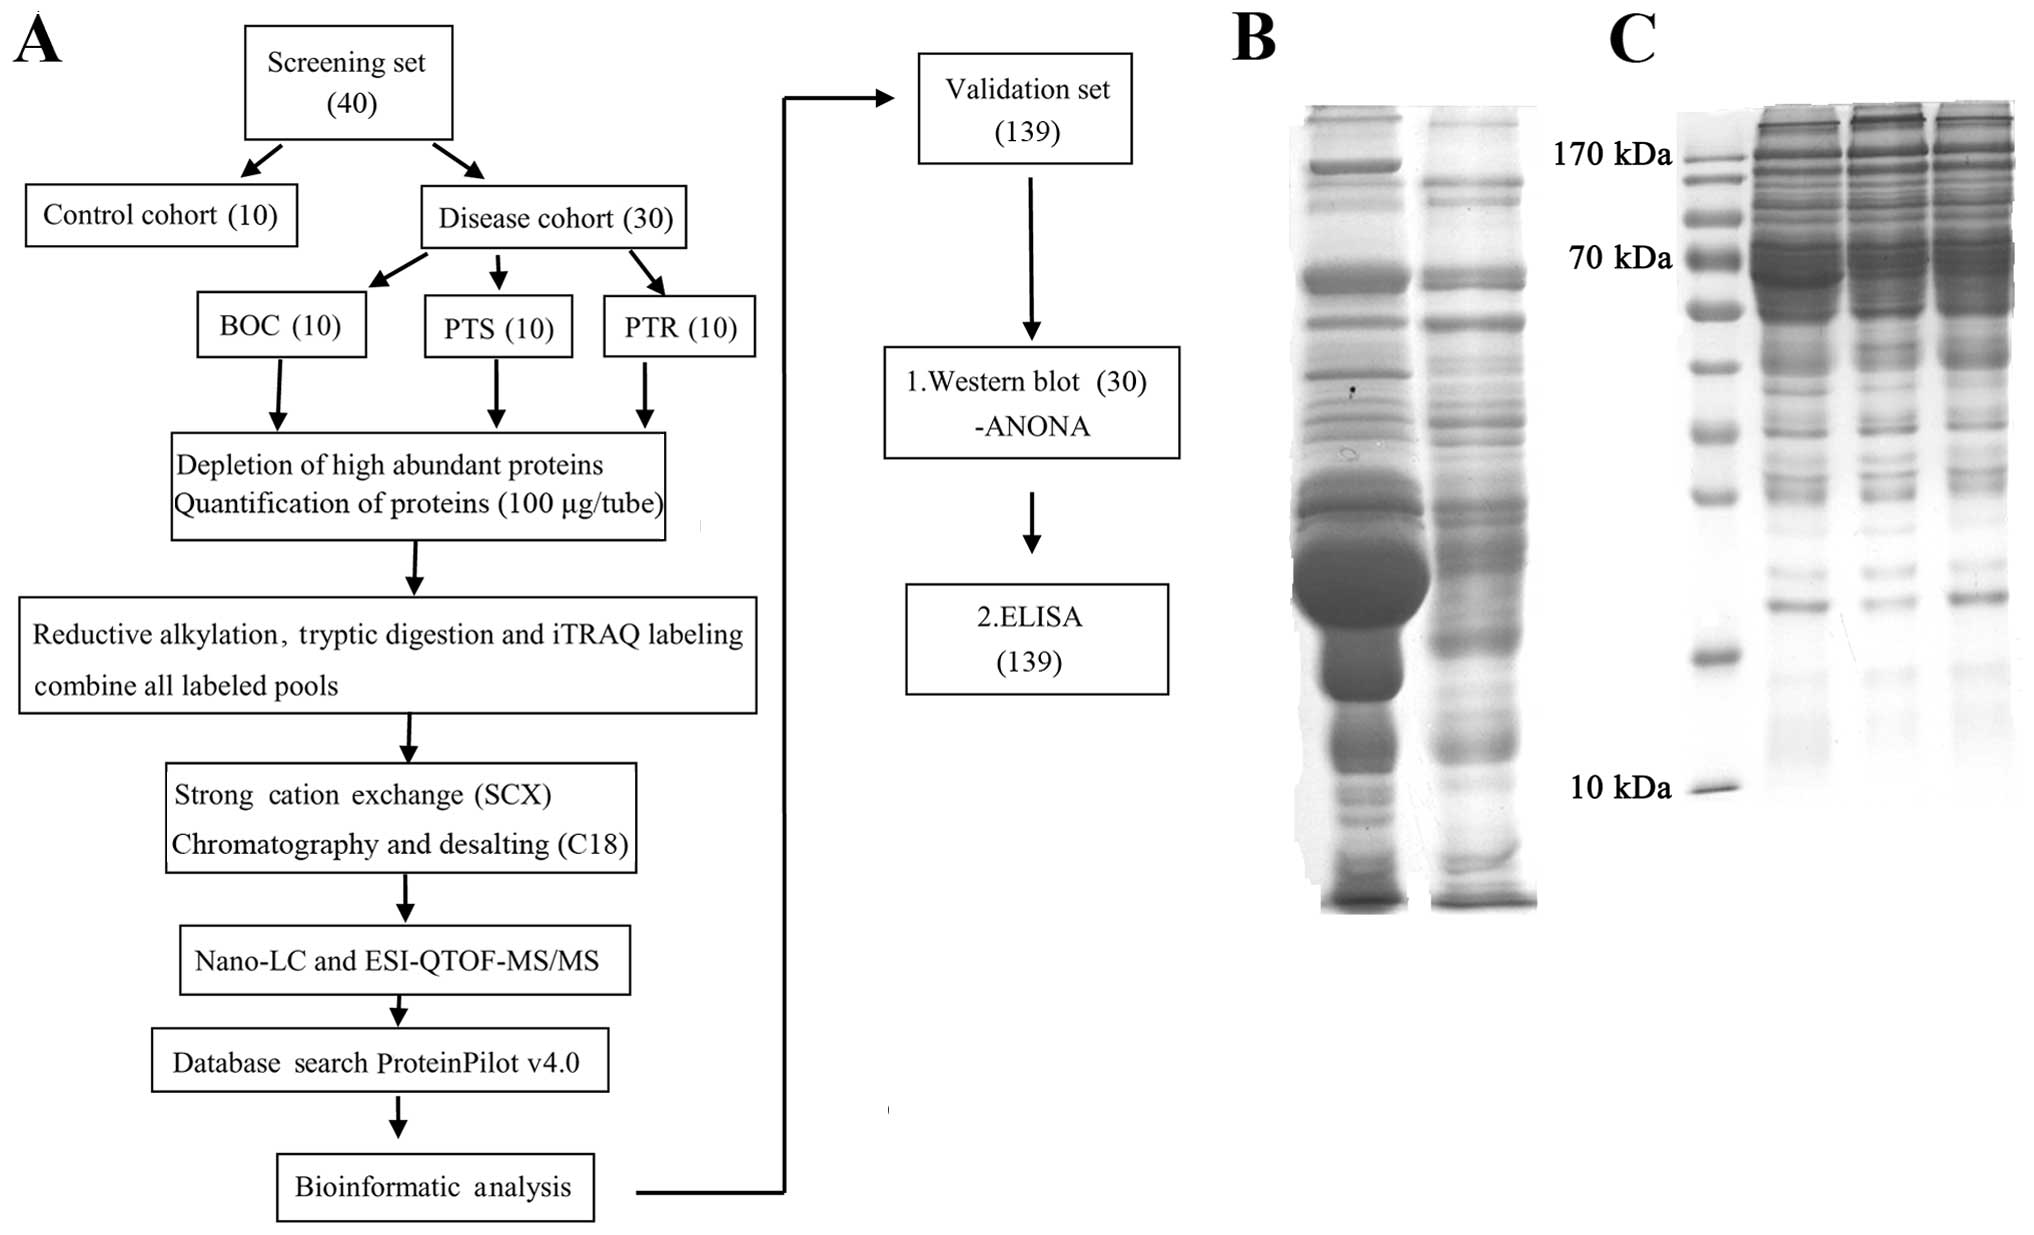
isobaric tags for relative and absolute quantitation (iTRAQ)-based
quantitative proteomic approach (Fig.
1A) and HPLC-micrOTOF-Q II high-resolution mass
spectrometer-based metabolic analysis to compare and identify
proteins and metabolites with differential profile in normal
control (NC) group, benign ovarian cyst (BOC), platinum-sensitive
(PTS) and platinum-resistant (PTR) cohort of serum samples. The
emergence of resistance to platinum-based therapy is the main
clinical endpoint of this experiment. iTRAQ proteomic analysis that
combines 2D-LC and MALDI-TOF-MS/MS is an established technique in
which total proteins are enzymatically digested into a large array
of small peptide fragments and then directly analyzed by liquid
chromatography-mass spectrometry (LC-MS). A total of 64 proteins
with different expression levels were identified. In the list of
differentially identified proteins via this method, most of these
proteins were in accordance with the previously published
literatures and associated with cancers. In addition, to further
explore the new biomarkers predicting the responses to cisplatin,
four of these proteins (FN1, SERPINA1, ORM1
and GPX3) were confirmed in a large patient cohort using
western blotting and commercial enzyme-linked immunosorbent assay
(ELISA), respectively. Moreover, HPLC-micrOTOF-Q II MS coupled with
multivariate analysis was utilized, good separations were obtained
for PTR, PTS vs. health controls. Finally, six substances with low
molecular weight were identified based on the database using
nuclear magnetic resonance (NMR). Receiver operating characteristic
(ROC) curve analysis was then used to elucidate the potential power
of FN1, SERPINA1, ORM1 and six small molecular
metabolites for discriminating between the PTS and PTR group. The
findings of this study are expected to reveal new proteins and
metabolites related to platinum resistance and to provide candidate
biomarkers to predict clinical response to chemotherapy. However,
we do need an effective serum marker to predict the patients who
have no response to cisplatin chemotherapy and will progress or
recur during or after chemotherapy that cannot be easily judged
from ultrasound or CT scan. This prediction is fundamental since
patients that are resistant might benefit from a different
combinational chemotherapy.
Materials and methods
Human serum samples
After Institutional Review Board approval (Ethics
Committees of the Affiliated Tumor Hospital of Guangxi Medical
University, Nanning, China), we obtained specimens (Table I) between September 1998 and March
2013, including EOC and BOC specimens. EOC cases were assigned to
the PTR and PTS group. The FIGO classification was used for
clinical staging, and the Gynecologic Oncology Group criteria were
used for histological grading. NC blood samples were voluntarily
donated by healthy individuals. Patients were eligible to
participate in this trial if they had a pathologically confirmed
diagnosis of BOC or EOC. After giving informed consent, serum
samples were collected by clean venipuncture, centrifuged for 10
min at 3,000 × g at 4°C and stored at −80°C until further
analysis.
 | Table IClinical characteristics of 40 cases
of samples used in screening, 129 cases in validating and 132
samples in comparing metabolomic profiles between NC, BOC, PTS and
PTR groups. |
Table I
Clinical characteristics of 40 cases
of samples used in screening, 129 cases in validating and 132
samples in comparing metabolomic profiles between NC, BOC, PTS and
PTR groups.
| Clinical
characteristics | NC | BOC | PTS | PTR | P-value |
|---|
| iTRAQ (n=40) |
| No. of
patients | 10 | 10 | 10 | 10 | - |
| iTRAQ-labeled
sample | 113 (run 1) | 114 (run 1) | 115 (run 1) | 116 (run 1) | - |
| 117 (run 2) | 118 (run 2) | 119 (run 2) | 121 (run 2) | - |
| Age (years) (mean
± SD) | 39.80±5.53 | 44.1±18.11 | 47.21±12.64 | 44.85±16.17 | - |
| Histological
type |
| Serous | - | 6/10 | 4/10 | 6/10 | - |
| Mucinous | - | 2/10 | 2/10 | 1/10 | - |
| Other | - | 2/10 | 4/10 | 3/10 | - |
| FIGO stage |
| I–II | - | - | 3/10 | 3/10 | - |
| III–IV | - | - | 7/10 | 7/10 | - |
| Tumor grade |
|
Well-differentiated | - | - | 1/10 | 2/10 | - |
|
Moderately-differentiated | - | - | 1/10 | 1/10 | - |
|
Poorly-differentiated | - | - | 8/10 | 7/10 | - |
| ELISA (n=129) |
| No. of
patients | 33 | - | 52 | 44 | - |
| Age (years) (mean
± SD) | 39.71±10.05 | - | 46.33±10.65 | 47.08±10.85 | - |
| Histological
type |
| Serous | - | - | 26/52 | 17/44 | - |
| Mucinous | - | - | 7/52 | 6/44 | - |
| Other | - | - | 19/52 | 21/44 | - |
| TNM stage |
| I–II | - | - | 19/52 | 2/44 | - |
| III–IV | - | - | 33/52 | 42/44 | - |
| Tumor grade |
|
Well-differentiated | - | - | 14/52 | 7/44 | - |
|
Moderately-differentiated | - | - | 9/52 | 10/44 | - |
|
Poorly-differentiated | - | - | 29/52 | 27/44 | - |
| FN1 (mean ±
SD) | 69.14±13.29 | - | 62.41±12.78 | 71.08±13.19 | 0.004 |
| ORM1 (mean
± SD) | 157.43±18.26 | - | 173.64±22.69 | 221.12±34.60 | 0.000 |
| SERPINA1
(mean ± SD) | 756.19±244.39 | - | 685.69±204.59 | 816.26±245.53 | 0.021 |
| Metabolomics
(n=132) |
| No. of
patients | 41 | 9 | 45 | 37 | - |
| Age (years) (mean
± SD) | 39.61±9.25 | 42.56±15.44 | 46.56±10.03 | 47.41±12.46 | - |
| Histological
type |
| Serous | - | - | 23/45 | 11/37 | - |
| Mucinous | - | - | 6/45 | 4/37 | - |
| Other | - | - | 14/45 | 19/37 | - |
| NA | - | - | 2/45 | 3/37 | - |
| FIGO stage |
| I–II | - | - | 13/45 | 3/37 | - |
| III–IV | - | - | 31/45 | 32/37 | - |
| NA | - | - | 1/45 | 2/37 | - |
| Tumor grade |
|
Well-differentiated | - | - | 6/45 | 3/37 | - |
|
Moderately-differentiated | - | - | 5/45 | 4/37 | - |
|
Poorly-differentiated | - | - | 27/45 | 20/37 | - |
| NA | - | - | 7/45 | 10/37 | - |
| Primary therapy
outcome |
| Success | - | - | 22/45 | 13/37 | - |
| CR+PR | - | - | 21/45 | 23/37 | - |
| SD+PD | - | - | 2/45 | 1/37 | - |
| NA | | | | | |
Chemicals and reagents
The iTRAQ™ Reagent kit and mass calibration
standards were purchased from Applied Biosystems (Bedford, MA,
USA). Sequencing grade trypsin was obtained from Promega (Madison,
WI, USA). Amicon Ultra-15 Certifugal Filter Units (3 kDa) were
purchased from EMD Millipore (Billerica, MA, USA). All the solvents
and chemicals used in this experiment were of LC-MS or analytical
grade. HPLC grade water and acetonitrile (ACN) were purchased from
Merck KGaA (Darmstadt, Germany). BCA assay kit was purchased from
Pierce Biotechnology, Inc. (Rockford, IL, USA). Methyl
methanethiosulfonate (MMTS) and methanol were obtained from Thermo
Fisher Scientific (Rockford, IL, USA). Triethylammonium bicarbonate
(TEAB), trifluoroacetic acid (TFA), formic acid and
α-cyano-4-hydroxycinnamic acid (CHCA) were all obtained from Sigma
(St. Louis, MO, USA).
Proteomic analysis
Depletion of high abundant
proteins
Pooled serum samples were depleted of the 14 most
highly abundant proteins using antibody-based depletion with Human
14 Multiple Affinity Removal System (MARS Hu-14; Agilent
Technologies, Inc., Palo Alto, CA, USA), according to the
manufacturer’s instructions. Crude serum samples were thawed on
ice. Equal amounts of blood (20 μl) from 10 individuals in each
group were pooled. Thereafter, MARS Hu-14 column was used to
deplete specific 14 high-abundant proteins ~94% of total protein
mass from human serum (Fig. 1B).
The total protein concentrations of the depleted sera were
determined using the BCA Protein Assay Reagent Kit (Pierce
Biotechnology, Inc.) (Fig.
1C).
iTRAQ labeling
Prior to iTRAQ analysis, aliquots of 100 μg protein
from each of the four sample pools were reduced using dissolution
buffer (0.5 M TEAB) to a volume of 20 μl. To each of the four
pools, 1 μl denaturant (2% SDS) and 2 μl reducing reagent [50 mM
tris(2-carboxyethyl)phosphine] were added. Each pool was incubated
at 60°C for 1 h. Cysteines were stopped by adding 1 μl
cystine-blocking reagent (200 mM MMTS in isopropanol), and samples
were incubated for additional 10 min at room temperature. The
samples were digested with Sequencing Grade Modified Trypsin
(Promega) at a protein-to-trypsin ratio of 30:1, at 37°C overnight.
After that, peptides from each of the four depleted serum pools
were labeled with 8-plex iTRAQ reagents (AB SCIEX, Foster City, CA,
USA) according to the manufacturer’s instructions. The labels were
applied in the following order: NC pool (113 Da), BOC pool (114
Da), PTS pool (115 Da); PTR pool (116 Da), so as to run the same
sample in duplicate in each run. The four labeled samples were then
evaporated to a volume of roughly 30 μl using a SpeedVac
Concentrator and combined as a mixture followed by cleaning up by a
strong cation exchange (SCX) column.
2D-LC-ESI-MS/MS
The combined peptide sample was subjected to SCX
chromatography employing a PolySulfoethyl A column (2.1×200 nm;
PolyLC, Inc., Columbia, MD, USA), on a high-pressure LC-pump (1200
series; Agilent Technologies, Inc.). The mixed sample was diluted
in 10 mM KH2PO4 (pH 3.0), 25% v/v ACN (mobile
phase A). Peptides were eluted with a linear gradient of 0–500 mM
KCl (mobile phase B: 25% v/v ACN, 10 mM
KH2PO4, 500 mM KCl, pH 3.0) for 115 min at a
flow rate of 0.2 ml/min. Fractions were collected at 2-min
intervals, and 16 fractions were collected from 24.5 to 98.5 min.
Each SCX fraction was desalted using C18 Spin Columns (The Nest
Group, Inc., Southborough, MA, USA) following the manufacturer’s
instructions and then vacuum centrifuged to dryness. The peptide
fractions were separated on a nano-reverse-phase LC system (Tempo™
LC MALDI Spotting System; Applied Biosystems), using a Magic C18AQ
column (150 mm × 200 μm, 3 μm, 200 Å; Michrom Bioresources, Inc.,
Auburn, CA, USA), at a flow rate of 2 μl/min. A binary gradient
with buffer A (98% H2O, 2% ACN, and 0.1% TFA) and buffer
B (2% H2O, 98% ACN, and 0.1% TFA) was employed as the
mobile phase. The peptide solutions were first loaded for 20 min
using buffer A only on the pre-column, and the separation occurred
over a period of 110 min. The elution from the column was mixed in
1:1 ratio with 5 mg/ml CHCA with a flow rate of 2 μl/min, and
spotted onto the MALDI plates in a 44×28 spot array format. MS and
MS/MS analysis was performed on a TOF-TOF 5800 MALDI platform
(Applied Biosystems). MS spectra were recorded in the positive-ion
reflector mode covering 700/800–4000 mass-to-charge ratio (m/z)
acquiring 1,500 laser shots per spectrum (30 subspectra of 50
shots). After screening of all LC-MALDI sample positions the
fragmentation of automatically selected precursors was performed at
a collision energy of 2 kV with collision-induced dissociation gas
(air). Up to 20 of the most intense ion signals per spot position,
characterized by an S/N >45, were selected as precursors for
MS/MS acquisition.
Database searches and criteria
Peptide matching, protein identification, and
relative protein quantification for the iTRAQ experiment were
performed with ProteinPilot v4.0 software (Applied Biosystems) in
which the paragon search algorithm was applied. MS/MS spectra were
searched against the UniProt/Swiss-Prot database for species of
Homo sapiens. The database was searched using the following
parameters: trypsin was used as the digestion agent, MMTS as a
fixed modification of cysteine, thorough as search effort, and
biological modification as the ID focus. Identifications of
proteins were only accepted with a ‘local false discovery rate
(FDR)’ estimation of ≤5% and an unused ProtScore ≥1.3 (>95% CI).
In addition, proteins were considered for further statistical
analysis when meet the following standards: one or more unique
peptides with 95% confidence had to be identified; proteins were
considered up- or downregulated when their fold changes were
>1.3 or <0.77. The results obtained from ProteinPilot were
exported to Microsoft Excel for manual interpretation. The protein
lists from the two iTRAQ experiments (run 1 and 2; Table II) were merged with ratios
calculated to the reference pool.
| Table IIDifferentially expressed proteins
identified by iTRAQ between PTR group compared to PTS group. |
Table II
Differentially expressed proteins
identified by iTRAQ between PTR group compared to PTS group.
| Unused protein
score | Sequence coverage
(%) | Accession no. | Name | Gene symbol | Species | iTRAQ ratio | Expression
pattern |
|---|
|
|---|
| Run 1 | Run 2 |
|---|
| 13.01 | 47.80 | P02763 | α-1-acid
glycoprotein 1 | ORM1a | Human | 3.32 | 2.34 | Up |
| 4.56 | 41.80 | P19652 | α-1-acid
glycoprotein 2 | ORM2a | Human | - | 2.33 | Up |
| 8.52 | 46.50 | D1MGQ2 | α-2 globin
chain | HBA2 | Human | 1.58 | 1.56 | Up |
| 23.74 | 72.70 | P02647 | Apolipoprotein
A-I |
APOA1a | Human | 2.00 | 1.72 | Up |
| 3.52 | 68.00 | P02652 | Apolipoprotein
A-II | APOA2 | Human | 1.33 | - | Up |
| 2.99 | 23.60 | Q13790 | Apolipoprotein
F | APOF | Human | 1.36 | - | Up |
| 2.00 | 30.00 | P08519 |
Apolipoprotein(a) | LPA | Human | - | 1.57 | Up |
| 19.91 | 35.80 | P22792 | Carboxypeptidase
N subunit 2 | CPN2 | Human | - | 1.45 | Up |
| 8.27 | 30.10 | P06276 |
Cholinesterase | BCHEa | Human | - | 1.31 | Up |
| 1.60 | 25.20 | P31146 |
Coronin-1A | CORO1A | Human | 1.81 | - | Up |
| 1.86 | 35.30 | Q5VVP7 | C-reactive
protein, pentraxin-related | CRP | Human | 3.82 | 2.46 | Up |
| 17.63 | 55.50 | E9KL23 | Epididymis
secretory sperm binding protein Li 44a |
SERPINA1a | Human | 6.02 | 3.80 | Up |
| 4.23 | 44.00 | P02675 | Fibrinogen β
chain | FGBa | Human | 2.42 | - | Up |
| 111.13 | 54.60 | P02751 |
Fibronectin | FN1 | Human | 2.52 | - | Up |
| 16.43 | 55.20 | O75636 |
Ficolin-3 | FCN3 | Human | - | 1.37 | Up |
| 63.09 | 79.10 | P00738 |
Haptoglobin | HPa | Human | 2.71 | 2.59 | Up |
| 18.65 | 84.40 | D9YZU5 | Hemoglobin,
β | HBBa | Human | 1.76 | 1.46 | Up |
| 1.46 | 14.30 | P01880 | Ig δ chain C
region | IGHD | Human | - | 2.54 | Up |
| 2.03 | 39.30 | P01860 | Ig γ-3 chain C
region | IGHG3 | Human | 1.36 | 1.47 | Up |
| 3.89 | 51.90 | P0CG05 | Ig λ-2 chain C
regions | IGLC2 | Human | - | 1.72 | Up |
| 13.88 | 41.20 | P01871 | Ig μ chain C
region | IGHM | Human | - | 1.37 | Up |
| 224.13 | 70.60 | P02751–8 | Isoform 8 of
fibronectin | FN1a | Human | - | 2.35 | Up |
| 1.35 | 43.70 | Q9BWP8–9 | Isoform 9 of
collectin-11 | COLEC11 | Human | 1.34 | - | Up |
| 25.71 | 70.90 | P02750 | Leucine-rich
α-2-glycoprotein | LRG1 | Human | - | 1.55 | Up |
| 2.43 | 19.00 | Q6Q3G8 |
Lysosomal-associated membrane protein
2, isoform CRA_b |
LAMP2a | Human | 1.81 | - | Up |
| 2.23 | 6.70 | Q6UXB8 | Peptidase
inhibitor 16 | PI16 | Human | - | 1.30 | Up |
| 2.56 | 47.40 | P06702 | Protein
S100A9 |
S100A9a | Human | 1.36 | - | Up |
| 94.91 | 82.10 | P02787 |
Serotransferrin | TFa | Human | 1.63 | 1.58 | Up |
| 75.06 | 73.60 | P02768 | Serum
albumin | ALBa | Human | - | 1.50 | Up |
| 3.27 | 70.00 | E9PR14 | Serum amyloid A
protein | SAA2 | Human | 4.57 | 2.63 | Up |
| 2.04 | 17.80 | E7ES66 | Uncharacterized
protein | GP1BA | Human | 1.50 | - | Up |
| 5.51 | 37.80 | B4E1D3 | Uncharacterized
protein | FGB | Human | - | 2.46 | Up |
| 2.01 | 20.40 | C9JC84 | Uncharacterized
protein | FGG | Human | - | 2.60 | Up |
| 8.99 | 21.90 | P04275 | von Willebrand
factor | VWFa | Human | - | 1.33 | Up |
| 499.38 | 71.20 | P04114 | Apolipoprotein
B-100 | APOBa | Human | - | 0.74 | Down |
| 3.82 | 61.50 | B2R526 | Apolipoprotein
C-I | APOC1 | Human | 0.63 | - | Down |
| 6.00 | 65.40 | P02655 | Apolipoprotein
C-II | APOC2 | Human | 0.62 | 0.68 | Down |
| 7.18 | 61.50 | B0YIW2 | Apolipoprotein
C-III variant 1 |
APOC3a | Human | 0.60 | 0.58 | Down |
| 23.95 | 77.30 | P02649 | Apolipoprotein
E | APOEa | Human | - | 0.60 | Down |
| 8.96 | 43.20 | Q96KN2 | β-Ala-His
dipeptidase | CNDP1 | Human | - | 0.71 | Down |
| 2.01 | 30.60 | P49913 | Cathelicidin
antimicrobial peptide | CAMP | Human | 0.71 | - | Down |
| 4.00 | 21.70 | P00488 | Coagulation
factor XIII A chain |
F13A1a | Human | 0.75 | 0.67 | Down |
| 2.60 | 21.90 | Q12860 |
Contactin-1 |
CNTN1a | Human | 0.72 | - | Down |
| 2.10 | 22.60 | P22352 | Glutathione
peroxidase 3 | GPX3a | Human | - | 0.76 | Down |
| 5.52 | 43.20 | Q1KLZ0 | HCG15971,
isoform CRA_a |
PS1TP5BP1a | Human | 0.62 | 0.39 | Down |
| 50.43 | 70.10 | P05546 | Heparin cofactor
II |
SERPIND1 | Human | - | 0.76 | Down |
| 3.78 | 31.50 | P26927 | Hepatocyte
growth factor-like protein | MST1 | Human | 0.75 | - | Down |
| 110.79 | 52.90 | P19823 | Inter-α-trypsin
inhibitor heavy chain H2 |
ITIH2a | Human | - | 0.77 | Down |
| 1.66 | 14.60 | Q9NPH3 | Interleukin-1
receptor accessory protein | IL1RAP | Human | 0.52 | - | Down |
| 2.00 | 36.20 | O14791–2 | Isoform 2 of
apolipoprotein L1 | APOL1 | Human | - | 0.76 | Down |
| 4.00 | 19.20 | P16070–5 | Isoform 5 of
CD44 antigen | CD44a | Human | 0.74 | - | Down |
| 204.25 | 80.80 | B7ZKJ8 | ITIH4
protein | ITIH4 | Human | - | 0.59 | Down |
| 44.35 | 54.80 | P01042 |
Kininogen-1 | KNG1a | Human | 0.77 | - | Down |
| 8.29 | 43.20 | Q5SQS3 | Mannan-binding
lectin | MBL2a | Human | 0.69 | 0.59 | Down |
| 1.33 | 11.80 | P04180 |
Phosphatidylcholine-sterol
acyltransferase | LCAT | Human | 0.64 | - | Down |
| 2.00 | 13.60 | Q53Y44 |
Profilin | PFN1 | Human | - | 0.68 | Down |
| 99.83 | 76.50 | P00734 |
Prothrombin | F2a | Human | - | 0.65 | Down |
| 21.20 | 60.10 | P02743 | Serum amyloid P
component | APCS | Human | - | 0.58 | Down |
| 9.43 | 27.90 | P27169 | Serum
paraoxonase/arylesterase 1 | PON1a | Human | 0.66 | - | Down |
| 2.00 | 17.70 | O00391 | Sulfhydryl
oxidase 1 |
QSOX1a | Human | - | 0.37 | Down |
| 2.00 | 23.10 | D3DUS9 | Triosephosphate
isomerase | TPI1a | Human | - | 0.70 | Down |
| 3.05 | 51.60 | P67936 | Tropomyosin α-4
chain | TPM4 | Human | - | 0.68 | Down |
| 6.31 | 26.60 | A6NHF2 | Uncharacterized
protein | BTD | Human | 0.41 | - | Down |
| 2.00 | 21.50 | E7EX29 | Uncharacterized
protein |
YWHAZa | Human | 0.75 | - | Down |
Western blotting
To confirm the identity of the proteins discovered
by iTRAQ, western blotting was performed (Fig. 3A–E). Briefly, equal volumes of
non-depleted serum from NC, PTS and PTR individuals (n=9 per group)
were electrophoretically separated by 10% SDS-PAGE and transferred
to a 0.45-mm polyvinylidene fluoride membranes (EMD Millipore)
using a Bio-Rad wet transfer apparatus. Anti-human ORM1 (2
μg/ml), FN1 (1:1,000 dilution), SERPINA1 (1:1,000)
and GPX3 (1:500) antibodies were from R&D Systems, Inc.
(cat. no. MAB3694), Sigma (cat. no. F3648), OriGene Technologies,
Inc., (cat. no. TA500376) and Abcam (cat. no. ab27325). Secondary
antibodies were DyLight 680 anti-mouse (cat. no. 072-06-18-06,
1:5,000 dilution; KPL, Inc.) and IRDye 680RD donkey anti-rabbit
(cat. no. 926-32223, 1:5,000 dilution; LI-COR Biosciences).
Membranes were blocked with 5% skim milk in phosphate-buffered
saline (PBS) with 0.1% Tween-20 for 2 h at room temperature. The
concentration of primary and secondary antibodies was consistent as
recommended in the instructions. Then membranes were incubated with
primary antibodies overnight at 4°C, followed by fluorescent
secondary antibodies (1:5,000) for 1 h at ambient temperature.
After washing three times in PBST, proteins were detected with
Odyssey infrared imaging system (LI-COR Biosciences, Lincoln, NE,
USA) following the manufacturer’s instructions.
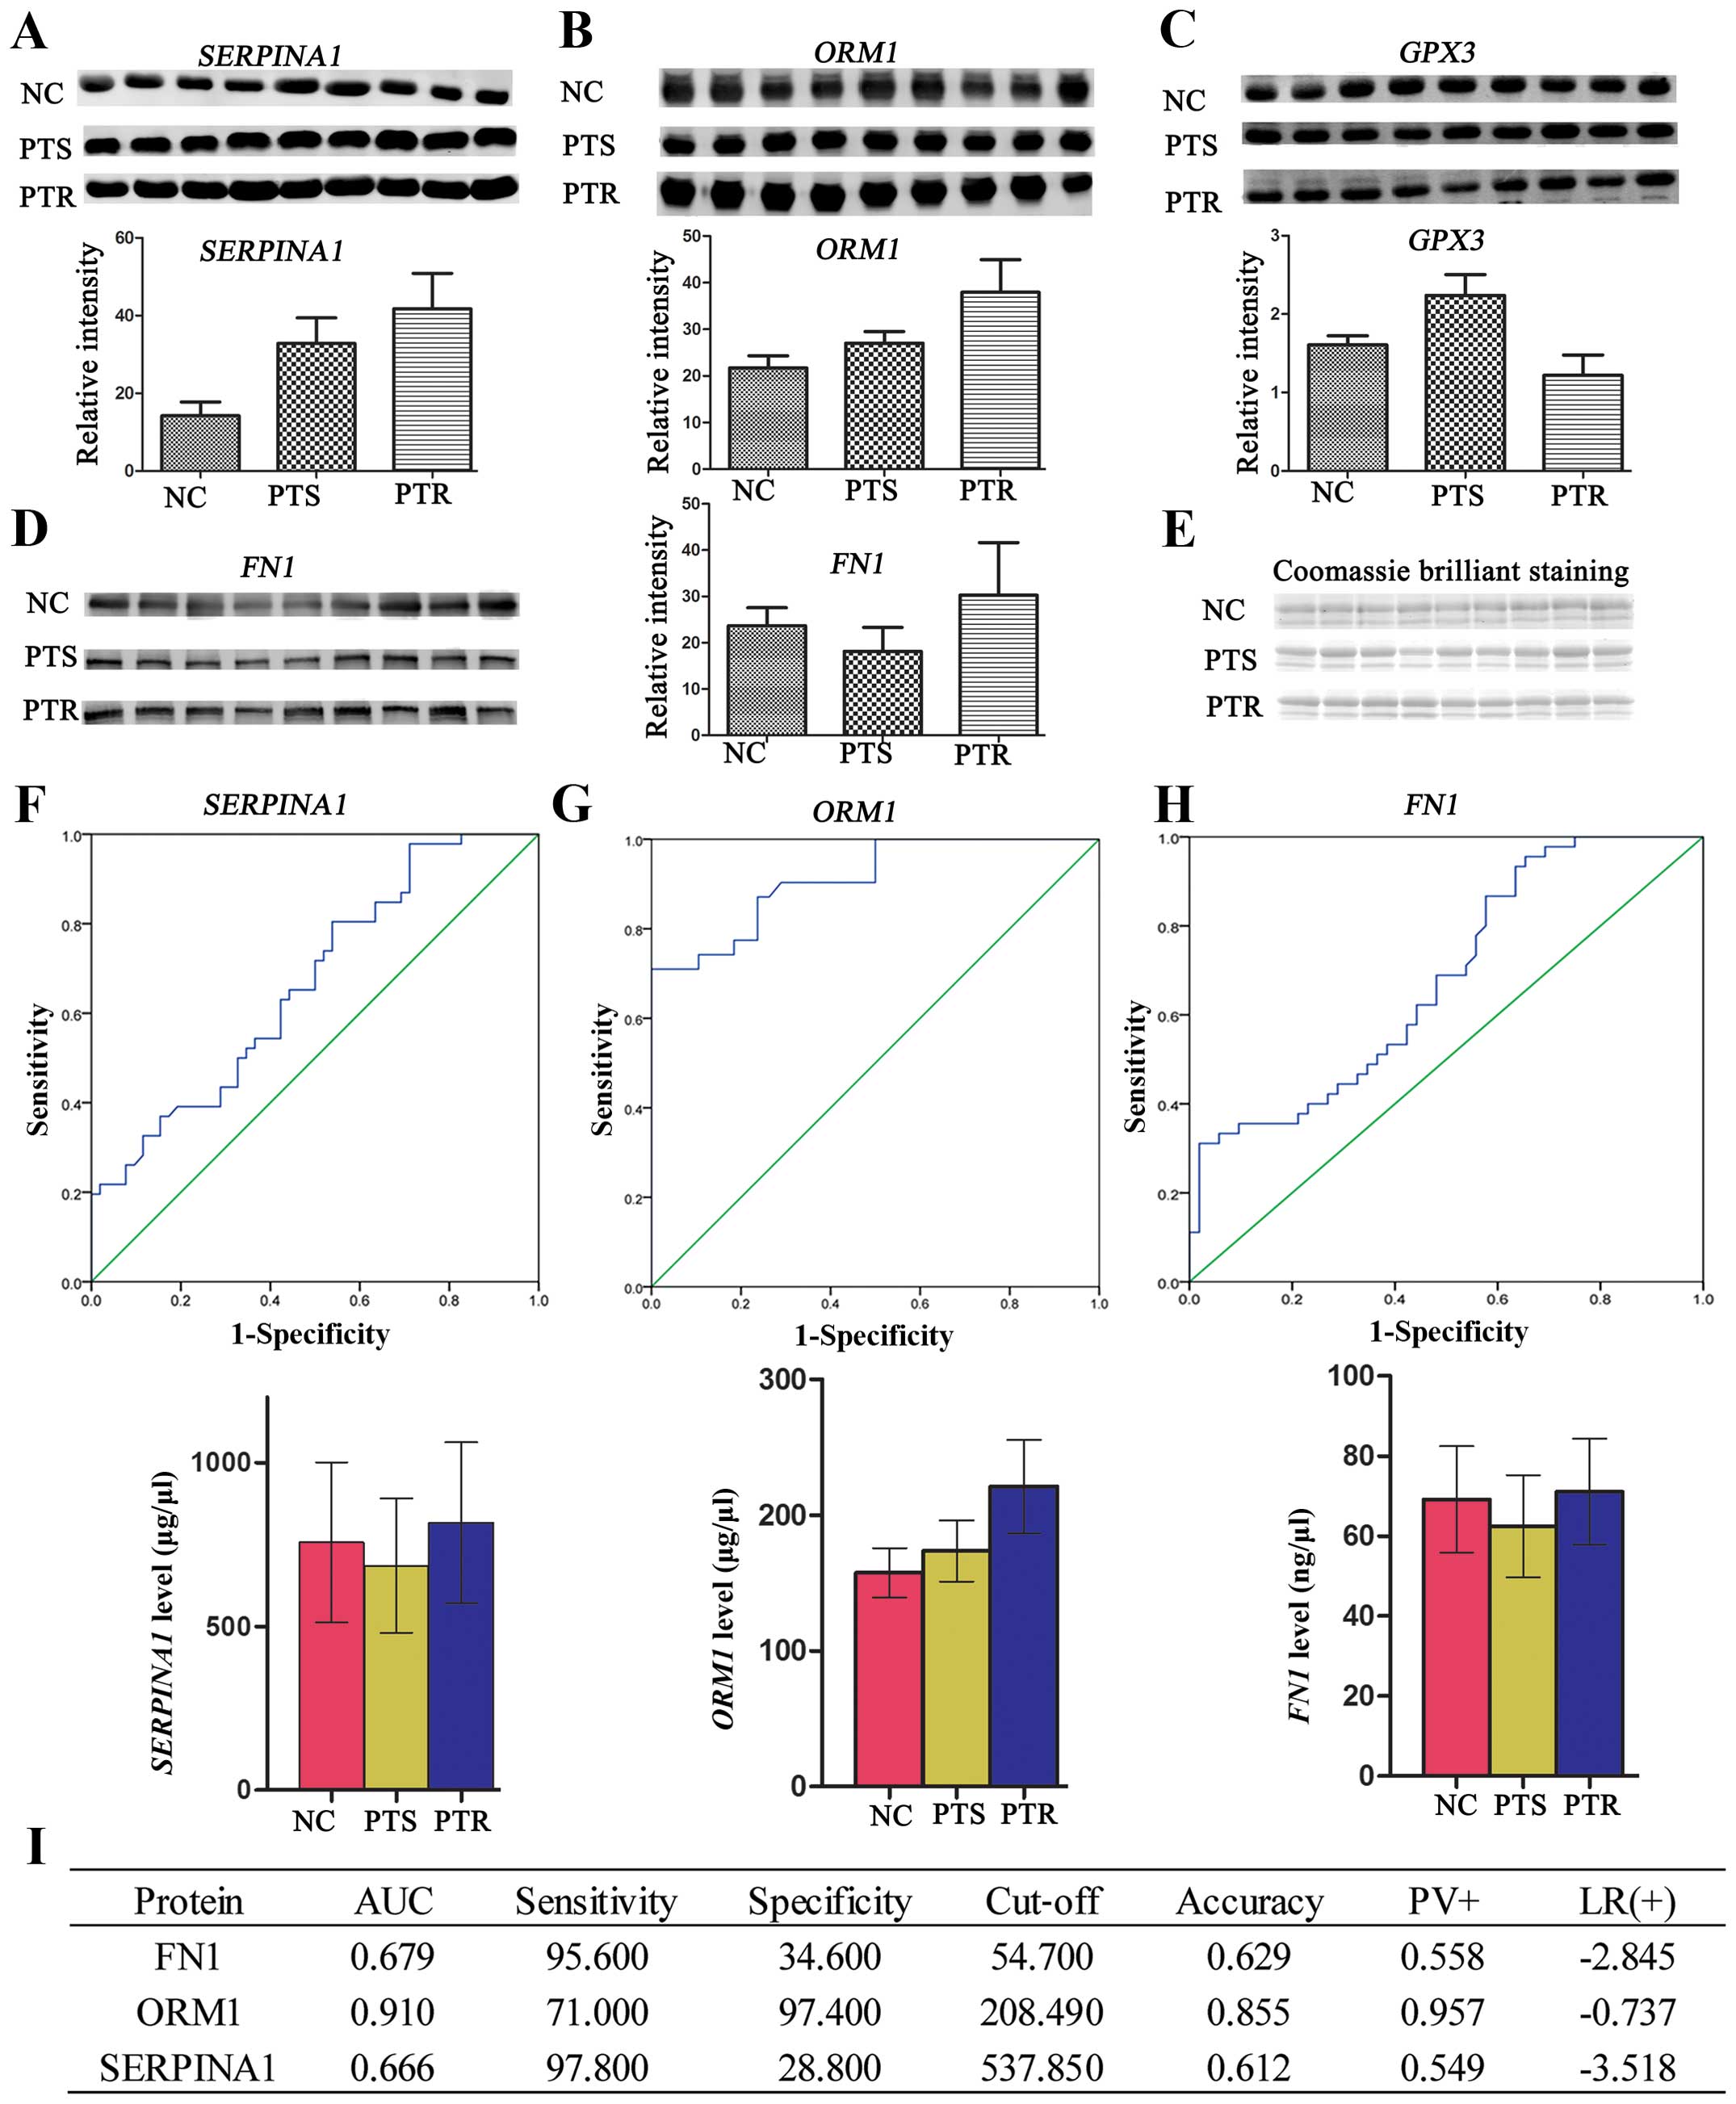 | Figure 3(A–D) Western blotting of SERPINA1,
ORM1, GPX3 and FN1 protein expressions in human serum. Western
blotting was carried out using antibodies against SERPINA1, ORM1,
GPX3 and FN1. Consistent with the proteomic results, the
expressions of SERPINA1, ORM1 and FN1 were significantly
upregulated (p<0.05), whereas, GPX3 protein expression was
significantly downregulated (p<0.05) in PTR group, compared to
the PTS group. (E) The overall protein profile of the NC, PTS and
PTR groups. The gel was stained with Coomassie Brilliant Blue to
ensure equal loadings during immunoblotting analysis. The
expression levels of the four differential proteins were normalized
based on the Coomassie Brilliant Blue staining.
*P<0.05. ROC curve analysis using the ELISA profile
of the (F) SERPINA1, (G) ORM1 and (H) FN1 for the 129 sera
analyzed. SPSS software was used to construct ROC curves and to
calculate the AUC. The solid lines in the ROC curves represent the
plot of 1-specificity vs. sensitivity. Histogram was used to
elucidate the profile of ELISA. Mean ± SD was used to express
protein level. *P<0.05, **p<0.01. (I)
Clinical diagnostic performance of the three proteins in PTR and
PTS groups. PTR, platinum-resistant; PTS, platinum-sensitive; NC,
normal control; ROC, receiver operating characteristic; ELISA,
enzyme-linked immunosorbent assay; AUC, area under the curve. |
ELISA
Based on the iTRAQ and western blotting findings
above we selected four targets, SERPINA1, ORM1,
GPX3 and FN1, the protein markers potentially
associated with PTR, for the validation using ELISA method.
ORM1, FN1, SERPINA1 ELISA kits were obtained
from and utilized according to the manufacture’s instructions.
ORM1 and FN1 serum samples were diluted 100-fold, and
SERPINA1 serum samples were diluted 50-fold. All samples and
standards were tested in triplicate. Absorbance was determined
using Power Scan 4 multiplex microplate reader (DS Pharma
Biomedical Co. Ltd., Osaka, Japan) and analysis of results was
conducted by SPSS 16.0 software.
Statistical analysis
Statistical analyses were performed with SPSS 16.0
software (SPSS, Inc., Chicago, IL, USA). A comparative analysis of
multiple groups was analyzed by one-way ANOVA or Kruskal-Wallis
test and multiple comparisons were performed with the least
significant difference test. Results are presented as means ± SD.
ROC curves were used to determine the diagnostic value of the
markers. P<0.05 was considered statistically significant.
Metabolical analysis
Serum sample preparation
Prior to serum preparation, samples were thawed on
ice for 1 h. A total of 200 μl of serum (stored at −80°C) was
resuspended with 800 μl cold CAN (stored at −20°C) mixed
thoroughly, and precipitated on ice for 2 h. The samples were
centrifuged at 4°C and 12,000 × g for 15 min. The supernatant was
then transferred to a new tube. Subsequently, serums were
lyophilized for 24 h using a freeze dryer (Beijing Songyuan Huaxing
Biotechnology Co., Ltd., Beijing, China). Methanol (200 μl) was
added to lyophilized samples, vortexed, sonicated for 5 min, and
centrifuged (12,000 × g, 4°C, 5 min). The supernatant (150 μl) was
collected for further analysis.
Metabolic signature via LC-MS
LC-MS analysis was performed using Agilent HPLC
(1290 series) fitted with a Zorbax Rx-C8 column (5 μm, 150×2.1 mm;
Agilent Technologies, Inc.) and coupled to a Bruker Daltonics’
micrOTOF-Q II high-resolution mass spectrometer. The flow rate was
0.25 ml/min, injection volume 5 μl and column temperature 30°C. The
mobile phase was consisted of solvent A (0.1% formic acid, 99.9%
water) and solvent B (0.1% formic acid, 99.9% ACN). HPLC conditions
were 15% solvent B changing linearly to 40% solvent B over 5 min,
to 80% solvent B over 10 min, 80% solvent B over 5 min, to 90%
solvent B over 5 min, and then 90% solvent B over 15 min. Finally,
mobile phase constituents reverted to starting conditions for 5 min
re-equilibration. Total analysis time was 45 min. Mass spectral
analysis was operated on a micrOTOF-Q II high-resolution mass
spectrometer (Bruker Daltonics) linked to an Agilent HPLC (1290
series) by HyStar software (Bruker Daltonics). Electrospray
ionization (ESI) (positive ion mode) was used to identify the
molecular ion mass [M+H]. Source parameters are: ESI capillary
voltage, 4,500 V; nebulizing gas pressure, 1 bar; drying gas flow,
6 l/min; and drying gas temperature, 220°C. Data were acquired in a
mass range of 50–1,500 m/z.
Data analysis
Following LC-MS, raw MS data were converted into a
matrix that is compatible with multivariate statistical analysis
and interpretation by using an in-house set of tools, such as the
Compass software package (Bruker Daltonics). Signals obtained from
each sample in the chromatogram were segmented into a series of
regions characterized by retention time and m/z using the Compass
software, furthermore, the theoretical m/z values were compared
with the experimental values from MS signals. Based on the exact
m/z, elemental formulas were generated using the DataAnalysis
software (Bruker Daltonics). C, H, N, O, P and S were the elements
of the formulas. The lists of generated formulas were searched
against the METLIN database (https://metlin.scripps.edu/) to identify compounds.
Principal component analysis (PCA) was then operated utilizing
Profile Analysis software (Compass software package; Bruker
Daltonics).
Results
Proteomic analysis
Serum proteomic data analysis
To enhance the detection of the lower abundance
proteins, most of the 14 abundant proteins were removed in equal
volumes from each sample. Technical replicate samples were used to
increase the reliability of the iTRAQ technique for relative
quantitation. The relative expression levels, statistical
parameters and the peptide information of identified proteins for
each pool were obtained from two (replicate) peptide spectra data
as described above. Subsequently, all the identified proteins were
filtered with manually selected filter exclusion parameters. Thus,
in the first iTRAQ data set (run 1), identification of 197 proteins
was made. Similarly, 184 proteins were discovered in the second
iTRAQ data set (run 2). The proteins identified from the two iTRAQ
data sets were subsequently combined, and a total of 248 unique
proteins were identified and quantified. Proteins were considered
up- or downregulated when their ratios were >1.3 or <0.77
(Fig. 2C). Therefore 64 proteins
were screened out as candidate biomarkers in one or two separate
experiments as differentially expressed proteins between PTS and
PTR sets: 33 of which were increased (PTR/PTS >1.3) and 31 were
decreased (PTR/PTS <0.77). Candidate biomarkers selected by
these criteria are summarized in Table II. For better understanding of the
data structure in our experiment, a clustering algorithm for
grouping proteins was required (Fig.
2B), and k-means clustering approach was then performed to
group the data based on the degree of similarity between the PTS
and PTR group. The different trends of identified proteins during
PTS and PTR can be grouped into six subsets with a similar
expression pattern (Fig. 2E). In
the first subset, most of the 20 proteins were upregulated in a
stepwise way in NC, BOC, PTS and PTR groups. Most are extracellular
proteins involved in cell adhesion, cell communication and immune
system process. The trend of these proteins differentially
expressed in PTS and PTR groups were of interest as these could
provide leads for potentially useful biomarkers of platinum status.
In the second set, all the 10 proteins were specifically increased
in PTS group and are therefore interesting candidates for EOC
diagnosis or prognostic studies.
Gene ontology analysis
Data analysis of 64 unique proteins identified by
two iTRAQ experiments was performed using the Blast2GO database
(http://www.blast2go.com/b2ghome) and Web
Gene Ontology Annotation Plot (WEGO: http://wego.genomics.org.cn/cgi-bin/wego/index.pl) to
class each protein into its respective cellular components,
molecular function and biological process (Fig. 2A). For the 64 differential
proteins, the subcellular distributions were enriched mainly in
extracellular region (90.6 and 78.1%) (the two numbers represent
the upregulated and downregulated proteins proportion of the total,
respectively), which imply that most of these proteins are
secretary proteins. According to GO molecular function analysis,
the top three common functional annotations were binding (87.5 and
93.8%), catalytic (28.1 and 56.3%), and enzyme regulator (25 and
31.3%). Most of the differential proteins were involved in
biological regulation (90.6 and 84.4%), response to stimulus (81.3
and 87.5%), and pigmentation (84.4 and 71.9%). To clearly show the
expression trend of differential proteins during cancer progress,
k-means clustering method was used to classify the 64 protein. The
results are shown in Fig. 2E. For
further text mining, PANTHER Classification System (http://www.pantherdb.org/) was used to carry out the
GO analysis. During tumor progression, 20 proteins were upregulated
gradually in cluster A and most of these members participated in
immune system process, cell adhesion, and cell communication, which
would make sense in connection with drug resistance.
Pathway and biological interaction
network analyses
Enrichment analysis of associated diseases and drugs
was performed for the differentially expressed proteins that met
our thresholds (fold, rank) using the IPAD browser (http://bioinfo.hsc.unt.edu/IPAD/) tools. Results
of associated diseases and drug analysis showed that 30 proteins
(14 upregulated, 16 downregulated) among them were significantly
associated with EOC (indicated as pentagrams in Table II) and GPX3 was associated
with cisplatin. In addition, DAVID Bioinformatics Resources 6.7
(http://david.abcc.ncifcrf.gov/home.jsp) was used to
investigate possible interactions between the 30 proteins
associated with EOC, which revealed that the differential proteins
were significantly enriched in complement and coagulation cascades
and ECM-receptor interaction. To model the signaling network
potentially affected in the context of platinum status, the 17
focus proteins with fold changes between PTS and PTR group >1.5
were then subjected to network analysis using STRING software
(http://string-db.org/). The network analysis
identified ALB, APOA1, SERPINA1, FN1,
ORM1 and TF as the major molecules affected in PTR
patients (Fig. 2D). Candidate
proteins with the most extreme deviation from the NC, BOC, PTS
groups, including SERPINA1 (3.8-fold increased), ORM1
(3.32-fold increased), FN1 (2.35-fold increased) and
cisplatin-associated GPX3 (1.35-fold decreased), were
commonly identified in two iTRAQ experiments, and chosen for
further analyses.
Co-occurrence analysis with
COREMINE
COREMINE was used to performe co-occurrence analysis
based on literature. The 64 differentially expressed proteins and
the following list of keywords were used to interrogate the tools:
drug resistance, neoplasm; drug resistance; drug resistance,
multiple. In order to restrict the number of proteins potentially
associated with drug resistance or MDR, p<0.01 was considered
statistically significant. The cumulative frequency top 50 protein
lists out of connected proteins, which showed a p<0.01 and the
64 differentially expressed proteins were compared to look for the
degree of overlap. Finally, proteomic and co-occurrence analysis
shared the following 11 proteins: ALB, CRP, FN1,
S100A8, TF, VWF, APOC2, APOE,
CAT, CD44, F2.
Western blotting
A total of 27 serum samples, composing 9 from NC
group, 9 from PTS group, and 9 from PTR group, were subjected to
western blotting against SERPINA1, ORM1, GPX3
and FN1. These proteins were selected for western blotting
primarily the following factors: big fold changes of differential
expression, correlation with cancer/drug resistance from a
literature-based text mining, the expression trend in four pools
and the availability of commercial antibodies. Our results
indicated that three of the four candidates have similar trends
with the proteomic results (SERPINA1, ORM1,
FN1) in the serum of PTR cases, compared to PTS cases, which
implied the credibility of proteomic analysis (Fig. 3A–D). One-way ANONA was applied to
calculate means ± SD from each group along with p-values.
Clinical relevance of SERPINA1, ORM1,
GPX3 and FN1
In the initial experiment 10 NC, 10 PTS and 10 PTR
samples were used to validate the expression levels of
SERPINA1, ORM1, GPX3 and FN1. The
results illustrated that statistical significant difference between
PTS and PTR was seen for SERPINA1, ORM1 and
FN1, but not GPX3 (data not shown). However, the
expression of GPX3, which was observed to be downregulated
(FC=1.35) in proteomic analysis, was not significantly different
(p>0.05) by ELISA. Consequently, we carried a full validation
study for SERPINA1, ORM1 and FN1, using the entire 129
samples collected (data are shown in Table I). Consistent with the iTRAQ
results in the previous experiment, relative quantitation of
SERPINA1, ORM1 and FN1 (Fig. 3F–I) between PTS 52 samples and PTR
44 samples were all found to be significantly upregulated
(p<0.05). Likewise, to further evaluate the diagnostic
significance of these three proteins, a ROC curve analysis was
constructed for each protein by plotting sensitivity vs.
specificity. The overall predictive accuracy of each protein was
reflected by the area under the ROC curve (AUC), a commonly used
indicator for estimating the diagnostic efficacy of a potential
biomarker. FN1 and SERPINA1 with ROC areas of 0.679
and 0.666, respectively, suggest that their use as a biomarker may
not be reliable. Unlike the FN1 and SERPINA1, the AUC
for ORM1 was 0.91 and its sensitivity and specificity for
predicting PTR was 71 and 97.4%, respectively, which could clearly
separate the PTS patients from the PTR individuals. These results
highlight a potential role for ORM1 in the response to
platinum therapy.
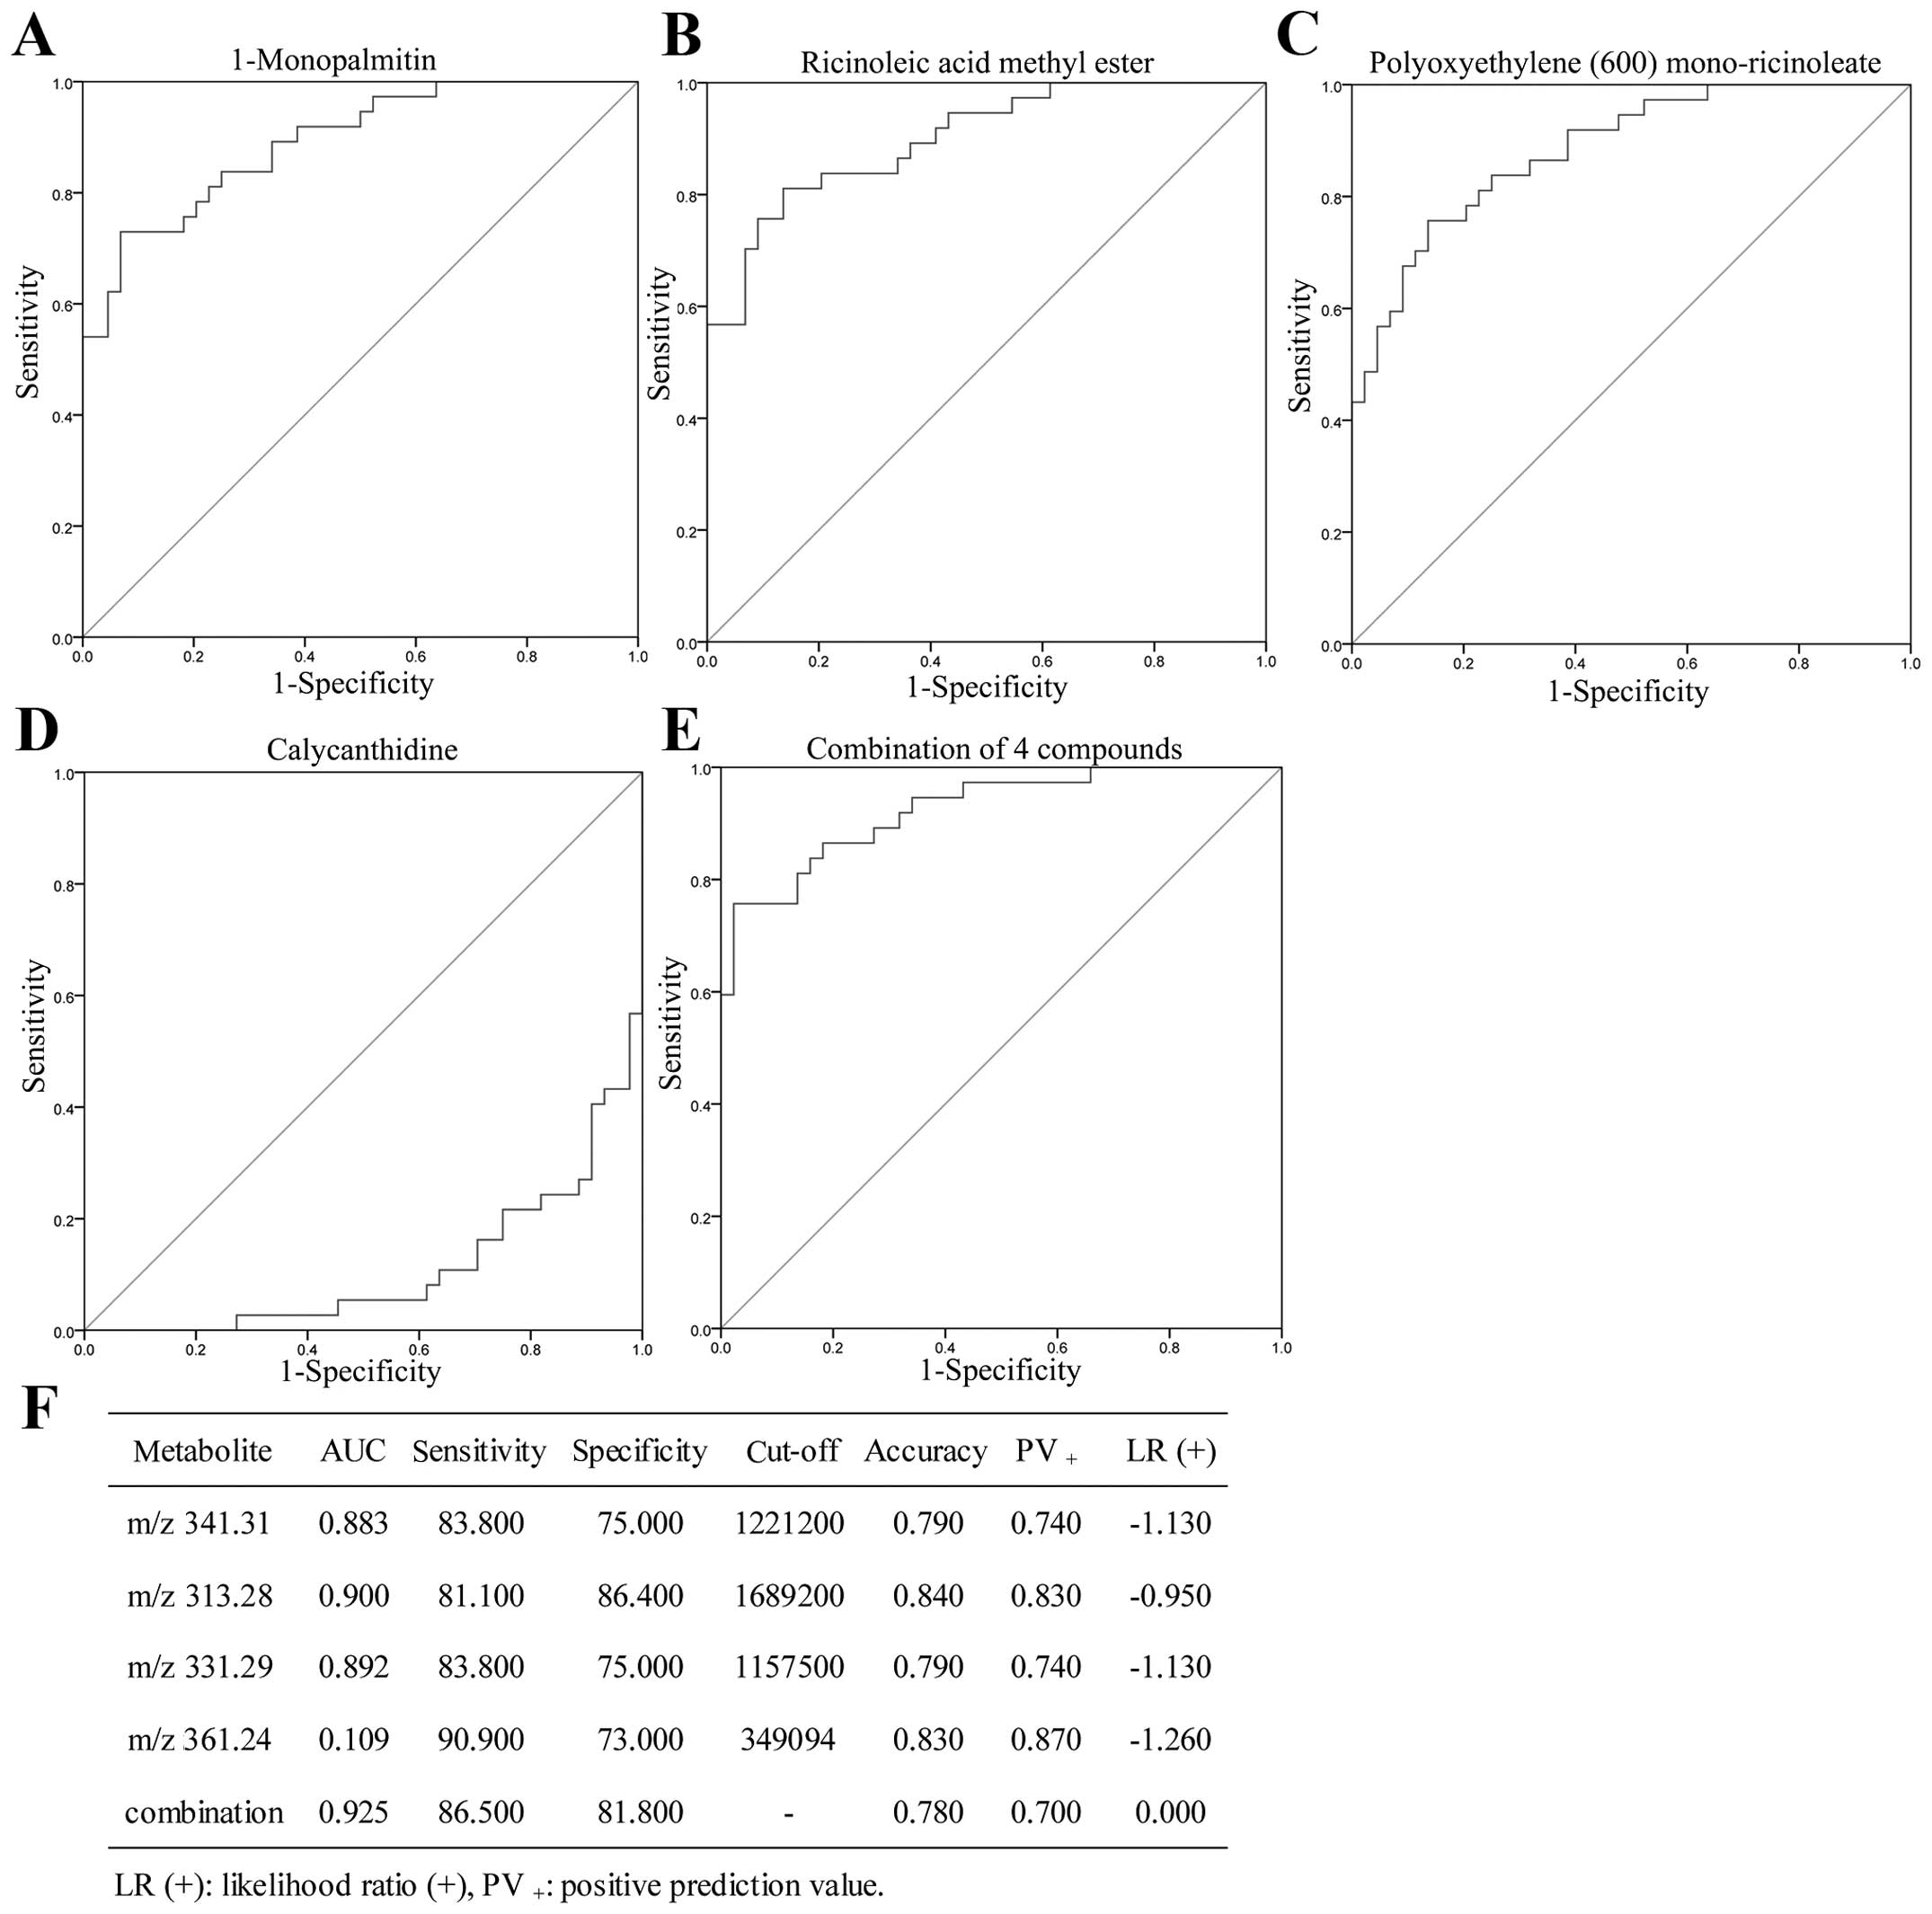
Metabolic analysis
A total of 25,800 metabolic features was observed in
our study. Data of identified compounds were subjected to t-test
analysis to identify significant metabolic patters and variations.
Compounds having p<0.01 and fold-change >2 were considered as
statistically significant. PCA and multivariate statistics were
then applied to identify key PTR-associated metabolic perturbations
in PTR compared to PTS. Unsupervised PCA of the resultant data
showed clear metabolic separation of PTR from PTS along the first
principal component, and clear distinctions of EOC (PTR and PTS)
from healthy individuals along the second principal component
(Fig. 4A). The BOC sera were not
obviously grouped because of their limited sample size. PCA loading
plots (Fig. 4B) provided six
metabolite features contributing to the separation of groups along
PC1 and PC2. Six known compounds were identified using NMR based on
database (Table III). The levels
of the six potential biomarkers in blood from PTR, PTS and NC group
were determined by LC-MS/MS. Compared to PTS, PTR exhibit a
specific metabolic trait characterized by decreased levels of
calycanthidine and increased levels of
1-monopalmitin, ricinoleic acid methl ester,
polyoxyethylene (600)mono-ricinoleate/glycidyl
stearate. Furthermore, the concentration of dodemorph
was higher and of C16 sphinganine was lower in the EOC
compared to NC (Table III). ROC
curve was used to calculate sensitivity and specificity of the four
biomarkers for PTR compared with PTS. The AUC for
1-monopalmitin, ricinoleic acid methyl ester, polyoxyethylene
(600)mono-ricinoleate and calycanthidine was 0.892,
0.900, 0.883 and 0.109, respectively, and their sensitivity and
specificity for predicting PTR were 83.8 and 75%; 81.1 and 86.4%;
83.8 and 75%; 90.9 and 73%, respectively, which could clearly
separate the PTS patients from the PTR individuals. The
combinational four biomarkers achieved an AUC value (AUC=0.925)
while the statistical analysis provided 86.5% sensitivity and 81.8%
specificity for the prediction of PTR (Fig. 5).
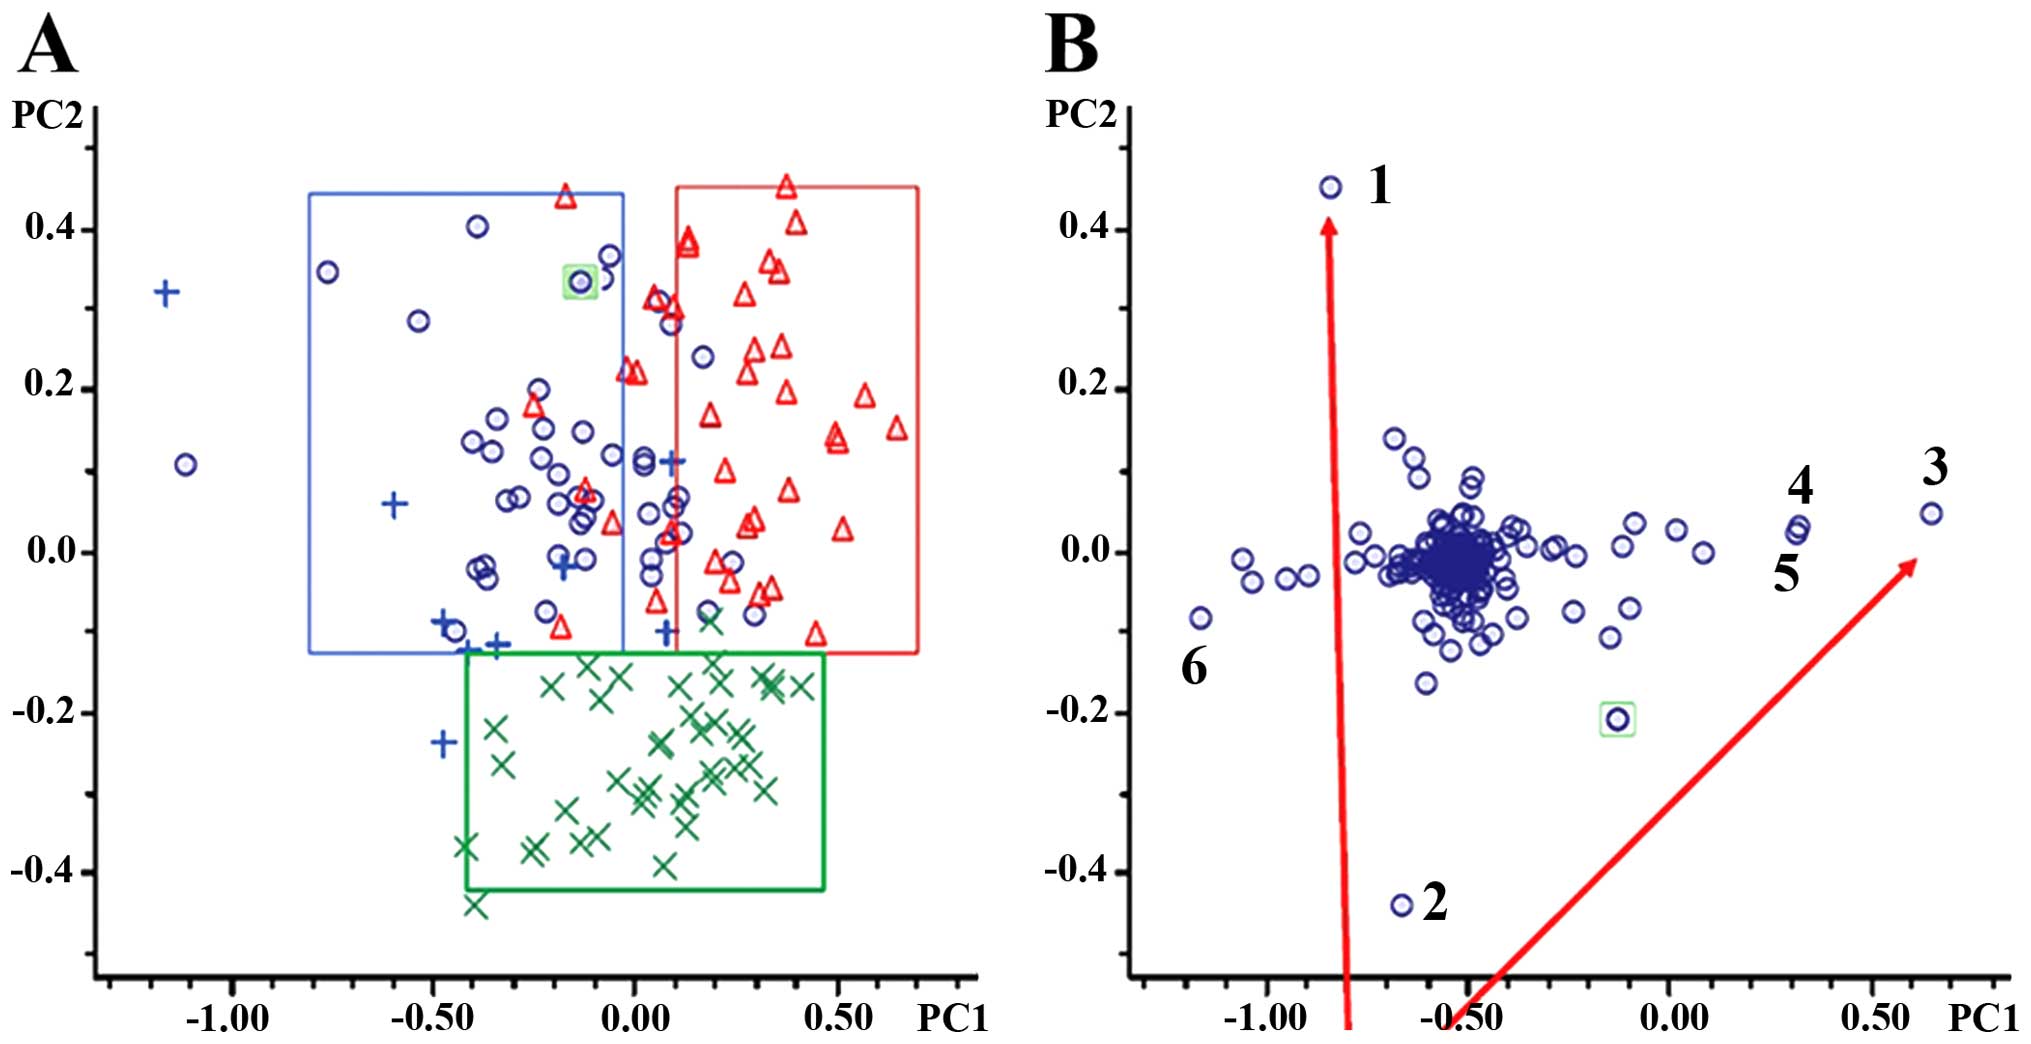 | Figure 4Multivariate statistical analysis.
(A) PCA score plots. Blue rings, PTS; red triangles, PTR; blue
plus, BOC; green multiplication, NC. (B) PCA loading plots.
Selecting compounds far away from the center were assumed to have a
greater contribution to the classification of PTS, PTR, BOC, and NC
are numbered. PCA, principal component analysis; PTS,
platinum-sensitive; PTR, platinum-resistant; BOC, benign ovarian
cyst; NC, normal control. |
| Table IIIRelevant analytical data for the
metabolites identified in PTR, PTS, BOC and NC groups. |
Table III
Relevant analytical data for the
metabolites identified in PTR, PTS, BOC and NC groups.
| Retention time
(min) | Adduct | m/z | Error (mDa) | σ value | Molecular
formula | Trend | CAS/PubChem | Possible
metabolite |
|---|
| 19.9 | [M+H] | 282.2807 | −1.5 | 0.0064 |
C18H35NO | Up (EOC/NC) | 1593-77-7 |
Dodemorph |
| 9.4 | [M+H] | 274.2777 | −3.6 | 0.0329 |
C16H35NO2 | Down (EOC/NC) | 4266342 | C16
sphinganine |
| 16.9 | [M+H] | 313.2775 | −3.9 | 0.0334 |
C19H36O3 | Up (PTR/PTS) | 141-24-2 | Ricinoleic acid
methyl ester |
| 16.8 | [M+H] | 331.2871 | −2.8 | 0.006 |
C19H38O3 | Up (PTR/PTS) | 542-44-9 |
1-Monopalmitin |
| 19.2 | [M+H] | 341.3071 | −2.1 | 0.0067 |
C21H40O3 | Up (PTR/PTS) | 977137-78-2 | Polyoxyethylene
(600)mono-ricinoleate |
| 19.2 | [M+H] | 341.3071 | −2.1 | 0.0067 |
C21H40O3 | Up (PTR/PTS) | 7460-84-6 | Glycidyl
stearate |
| 19.9 | [M+H] | 361.2419 | −4.6 | 0.0235 |
C23H28N4 | Down (PTR/PTS) | 5516-85-8 |
Calycanthidine |
Discussion
Cisplatin is one of chemotherapeutical agents
commonly used to treat EOC, which causes DNA damage via forming
inter- and/or intrastrand DNA adduct lesions and eventually
cytotoxicity. However, the benefits of chemotherapy can be
attenuated because of the emergence of platinum resistance. To
eradicate the mechanisms of platinum resistance in EOC is a
difficult task. The recent development of proteomic approaches
applied to investigate drug-resistance mechanisms has greatly
helped in addressing these issues. Comparative proteomic approach
is a powerful tool, which might help to guide future research and
cross validation of various proteomic profiling with a high
throughput. In our experiment, a panel of 64 different proteins
that have altered expression in PTR patients were compared to the
parental PTS group using a shotgun quantitative proteomics
approach, and four of these proteins were confirmed with western
blotting and ELISA. The results of serum FN1,
SERPINA1, GPX3 and ORM1 from 2D-LC-MS/MS
analysis were validated in a 139 cohort using a different
methodology. Western blotting and ELISA confirmed that the serum
level of FN1, SERPINA1 and ORM1 was
upregulated in PTR group, which indicated that the FN1,
SERPINA1 and ORM1 serum levels might be a tool for
screening and diagnosis of PTR. However, it should be noted that
although the change in direction (up- or down-regulated) of
GPX3 detected by western blotting between PTS and PTR group
was consistent with iTRAQ, the changes measured by ELISA assay in
43 patients was not statistically significant (p>0.05). The
differences in fold change determined by iTRAQ, western blotting
and ELISA can be attributed to methodological factors such as the
use of isobaric tags and/or differences inherent in the technical
method. ROC curve analysis was applied to find the cut-off value of
serum FN1, SERPINA1 and ORM1 to discriminate
between PTS and PTR group. The sensitivity and specificity were
calculated. ROC curves show, ORM1 with 71% sensitivity and
97.4% specificity could give a higher accuracy (Fig. 3). However, FN1 and
SERPINA1 were not reliable for clinical diagnosis because of
low sensitivity and specificity. Our comprehensive study of
proteomics led to the possibility that monitoring the level of
serum ORM1 could be clinically useful for the screening and
diagnosis of PTR patients.
α-1-antitrypsin (SERPINA1) is an
inhibitor of serine proteases principally secreted by hepatocytes,
but also by monocytes, neutrophils, macrophages and alveolar
epithelial cells, and plays a critical role in modulating host
immunity, inhibiting T lymphocyte-mediated antitumor function and
thereby accelerated tumor proliferation, and metastasis (3–5).
Moreover, there have been numerous studies documenting a link
between SERPINA1 and various cancers, although for most the
mechanism for the linkage is unclear. Giving the expression levels
of SERPINA1 in rat bladder tumor tissues were 2.5-fold
higher than those in normal bladder tissues using two-dimensional
difference gel electrophoresis (2D-DIGE) (6). Similar conclusions were also obtained
in pancreatic tumors, hepatocellular carcinoma, non-small cell lung
cancer, gastric cancer in gastric juice, prostate cancer patients
and malignancy in insulinomas. Much attention has been focused on
the role of SERPINA1 as a tumor suppressor, but no report
has shown directly the relation between SERPINA1 and
chemotherapy drugs. In our study, the contribution of
SERPINA1 to drug resistance was implicated in human serum
samples. SERPINA1 shows one of the largest fold increases
(3.8-fold increased) in protein expression level in PTR cohort
compared with PTS cohort (p<0.05). Nevertheless, our data are in
good agreement with prior studies elicited above, but disagree with
the results of Normandin et al (7).
Fibronectin is a glycoprotein that is involved in
cell adhesion, signal transduction and migration processes
including embryogenesis, wound healing, blood coagulation, host
defense, and metastasis, especially possibly suppression of
apoptosis (8–10). There have been many reports on the
relation between FN1 and human tumors. Similar thesis
reported that fibronectin was involved in Ras, Erk, Akt and
ECM pathways and mediate various signals such as cancer cell
adhesion, growth migration and invasion (11,12).
Akiyama et al showed that FN1 played a causal role in
tumor neovascularization and metastasis (13). In addition, a recent study found
that FN1 is one of the key genes in regulating SOX2 cell
migration, invasion, colony formation and drug resistance in
ovarian cancer cells (14–16). Qian et al also indicated
that FN1 is targeted by let-7g to promote mammary carcinoma
cell migration and invasion via p44/42 MAPK and MMPs (17). FN1 was also suggested as a
marker for renal cell carcinoma aggressiveness (18,19).
Moreover, FN1 was shown to be a direct target gene for miR-1
and miR-200. While miR-1 may play a role as a tumor suppressor gene
in laryngeal carcinoma. Similarly, miR-200 is crucial for the
maintenance of epithelial identity, behavior, and sensitivity to
chemotherapy in ovarian cancer cell line (20,21),
which confirmed our previous observation by miRNA microarrays with
samples obtained from the same patients as this study (22). All these findings suggest that a
functional relation is present between FN1 and platinum
response, which supports our data in EOC.
As a member of guutathione peroxidases,
GPX3 is located in 5q23 and has critical roles in the
detoxification of hydrogen peroxide and other oxygen-free radicals.
Previous studies have demonstrated that GPX3 had a broader
downregulated pattern in a variety of cancers, such as ovarian,
cervical, thyroid, head and neck, lung, colorectal, gastric,
gallbladder, breast, and esophageal cancers than in healthy
controls. These reports suggest that GPX3 contains a
tumor-suppressor function. The mechanisms involved in mediating the
GPX3 tumor-suppressor function are mainly due to promoter
hypermethylation (23), the
downregulation of c-Met expression (24,25),
and the role of antioxidant enzymes which are involved in reactive
oxygen species (ROS) metabolism. As a messenger molecule, ROS might
increase cancer cell proliferation, genetic mutations, instability,
and thereby invasion and angiogenesis (26). In addition, ROS also mediates the
induction of tumor cell death via many chemotherapeutic agents such
as platinum (27). Although the
researchers failed to measure the serum concentration of
GPX3, this statement is supported by our results. However,
GPX3 is identified to be highly expressed in clear cell
adenocarcinoma compared to control tissues at a DNA, mRNA and
protein level on cell lines and clinical samples of ovarian clear
cell adenocarcinoma (28,29). Although the molecular biological
mechanism is not clarified, these results might indicate that
GPX3 activity is tumor-specific. In our present study,
GPX3 was shown to be downregulated in PTR group compared
with PTS group, which confirmed the previous results, but the exact
mechanism, in response to anticancer drugs remains to be further
understood.
The α-1-acid glycoprotein primarily
synthesized by the liver is an acute-phase reactant with
immunomodulatory and immunosuppressive properties (30) and its serum levels are increased by
inflammation, stress, and chronic disease such as cancer (31). Two main biological functions were
involved in α-1-acid glycoprotein, binding and transporting
of endogenous substances or drugs, and a strong immunomodulatory
function. Previous investigations in patients with carcinoma of the
breast, lung, ovary and endometrium have suggested that serum
ORM1 concentrations were increased two times higher than
that in healthy individuals, and ORM1 might act as blocking
agent protecting tumor cells against immunological attack, thereby
contributing to the ‘immune escape’ of the tumor (32,33).
ORM1 can also interfere with cytokine function by inducing
the secretion of soluble TNFα receptor and IL-1, -6 and -12
receptor antagonist (30,34). Although the mechanisms by which
ORM1 mediates its functions are not fully understood,
ORM1 has been shown to bind to the chemokine receptor
CCR5 in macrophages, the asialoglycoprotein receptor in
hepatocytes, the surface lectin-like receptor Siglec-5 in
neutrophils and can also modulate TNFα-induced phosphorylation of
p38 MAPK, MEK1/2, c-Jun N-terminal kinase which is required for
angiogenesis in macrophages (35–39),
but not VEGF-induced signaling. In addition, ORM1 has been
shown to enhance endothelial cell migration and capillary tube
formation in vitro (40).
Moreover, several reports suggested that the serum levels of
α-1-acid glycoprotein influenced the pharmacokinetics
(PK)/pharmacodynamics (PD) of chemotherapy drugs such as docetaxel,
PTX and imatinib (41–44). As these reports remarked,
α-1-acid glycoprotein may function as a carrier of PTX from
the serum into the liver via the α-1-acid glycoprotein
receptors, and this might result in the enhancement of the PTX
metabolism. Although ORM1 has been reported to be associated
with cancers or metabolisms of chemotherapy drugs according to
previous reports, no studies have underlined the importance of
ORM1 in cisplatin resistance in PTR patients, and this is
the first time that ORM1 was identified as an important
biomarker of response to cisplatin-based chemotherapy. The
mechanism of this phenomenon may be attributed to the PK/PD changes
of cisplatin, however, further studies will be required to fully
understand ORM1 functional roles in drug resistance.
In the present study, we undertook a non-destructive
metabolomic technique (HPLC-micrOTOF-Q II MS/MS) to investigate the
metabolic traits. All the six metabolites in our experiment were
identified as fatty acid or derivatives. Profiling of metabolomics
elucidated changes in the levels of fatty acid metabolism, which
confirmed our previous observations by proteome approach and
conclusions of many addressed articles on chemotherapeutic
resistance and metabolism, and served as an insightful reference to
the mechanism research of drug resistance. Fatty acid synthese
(FASN) providing proliferating cancer cell lipids for membrane
biogenesis was assumed to have metabolic characteristics of cancel
cells (45). Expression level of
FASN is significantly upregulated in kinds of neoplasm and
correlates with poor prognosis, but in a health individual is very
low even undetectable, suggesting that FASN serves as a metabolic
oncogene (46). Fatty acids were
used by proliferating tumor cells for membrane assembly, lipid
modifications of proteins, and as an efficient source of energy,
all are required to sustain neoplasm growth and survival (47). Furthermore, it is shown that FASN
is overexpressed in drug-resistant breast neoplasm cell line
(MCF7/AdVp3000), and that reducing the expression of FASN increased
the drug sensitivity in MCF7 and MDA-MB-468 (breast cancer cell
lines) (48). Analogously, FASN
was reported to be associated with acquired
trastuzumab/docetaxel/5-fluorouracil resistance in breast cancer or
radiation and gemcitabine in pancreatic neoplasm. FASN also played
an active role in chemotherapy resistance of HER-2/neu-induced
breast neoplasm. FASN not only played a key role in acquired
resistant phenotype but also in inherent resistant phenotype in
hepatocellular carcinoma (49).
Roodhart et al identified two platinum-induced
polyunsaturated fatty acids which induce resistance to
chemotherapeutic drugs. When the central enzymes associated with
the production of polyunsaturated fatty acids were blocked, the
mesenchymal stem cells induced resistance which was prevented
(50). All the above further
confirmed the metabolism abnormality of fatty acid is induced by
PTR.
In conclusion, we identified a panel of new ovarian
epithelial cancer serum protein biomarkers, which have an indicator
value for platinum status and allow patients who have a high chance
of being resistant to cisplatin-based chemotherapy to receive an
alternative therapy. Although thousands of metabolites were
identified, links were weak and annotated only a small proportion
of the total analytes. In further studies, the role of these
differentially proteins or compounds in cisplatin resistance needs
to be validated on a large scale to evaluate the clinical benefit
of using these candidate biomarkers for diagnosis or prognosis
analyses. The contribution of the identified biomarkers in
cisplatin resistance should also be explored to help understand and
design chemosensitizing agents. In addition, our study demonstrated
that metabolomics and proteomics could validate one another
partially and their combination could better elucidate the
mechanism of drug resistance and provide candidate molecular
targets for personalizing therapeutic interventions and treatment
efficacy monitoring.
Acknowledgements
This study was supported by the National Natural
Science Foundation of China (grant no. 81572579), Guangxi
Scientific Research and Technological Development Program Topics
(no. 14124004) and the Specialized Research Fund for the Doctoral
Program of Higher Education (nos. 20124503110003 and
2013.01–2016.10).
References
|
1
|
Leonessa F and Clarke R: ATP binding
cassette transporters and drug resistance in breast cancer. Endocr
Relat Cancer. 10:43–73. 2003. View Article : Google Scholar : PubMed/NCBI
|
|
2
|
Gottesman MM, Fojo T and Bates SE:
Multidrug resistance in cancer: Role of ATP-dependent transporters.
Nat Rev Cancer. 2:48–58. 2002. View
Article : Google Scholar : PubMed/NCBI
|
|
3
|
Zhang D, Wu M, Nelson DE, Pasula R and
Martin WJ II: Alpha-1-antitrypsin expression in the lung is
increased by airway delivery of gene-transfected macrophages. Gene
Ther. 10:2148–2152. 2003. View Article : Google Scholar : PubMed/NCBI
|
|
4
|
Hansson M, Jönsson S, Persson AM, Calafat
J, Tapper H and Olsson I: Targeting proteins to secretory lysosomes
of natural killer cells as a principle for immunoregulation. Mol
Immunol. 40:363–372. 2003. View Article : Google Scholar : PubMed/NCBI
|
|
5
|
Cekmen M, Evereklioglu C, Er H, Inalöz HS,
Doganay S, Türköz Y and Ozerol IH: Vascular endothelial growth
factor levels are increased and associated with disease activity in
patients with Behçet’s syndrome. Int J Dermatol. 42:870–875. 2003.
View Article : Google Scholar : PubMed/NCBI
|
|
6
|
Lu Y, Liu P, Wen W, Grubbs CJ, Townsend
RR, Malone JP, Lubet RA and You M: Cross-species comparison of
orthologous gene expression in human bladder cancer and
carcinogen-induced rodent models. Am J Transl Res. 3:8–27.
2010.PubMed/NCBI
|
|
7
|
Normandin K, Péant B, Le Page C, de
Ladurantaye M, Ouellet V, Tonin PN, Provencher DM and Mes-Masson
AM: Protease inhibitor SERPINA1 expression in epithelial ovarian
cancer. Clin Exp Metastasis. 27:55–69. 2010. View Article : Google Scholar : PubMed/NCBI
|
|
8
|
de la Fuente MT, Casanova B, Garcia-Gila
M, Silva A and Garcia-Pardo A: Fibronectin interaction with
alpha4beta1 integrin prevents apoptosis in B cell chronic
lymphocytic leukemia: Correlation with Bcl-2 and Bax. Leukemia.
13:266–274. 1999. View Article : Google Scholar : PubMed/NCBI
|
|
9
|
Schwarzbauer JE and DeSimone DW:
Fibronectins, their fibrillogenesis, and in vivo functions. Cold
Spring Harb Perspect Biol. 3:32011. View Article : Google Scholar
|
|
10
|
Tapper J, Kettunen E, El-Rifai W, Seppälä
M, Andersson LC and Knuutila S: Changes in gene expression during
progression of ovarian carcinoma. Cancer Genet Cytogenet. 128:1–6.
2001. View Article : Google Scholar : PubMed/NCBI
|
|
11
|
Mutlu P, Ural AU and Gündüz U:
Differential gene expression analysis related to extracellular
matrix components in drug-resistant RPMI-8226 cell line. Biomed
Pharmacother. 66:228–231. 2012. View Article : Google Scholar : PubMed/NCBI
|
|
12
|
Ahmed N, Riley C, Rice G and Quinn M: Role
of integrin receptors for fibronectin, collagen and laminin in the
regulation of ovarian carcinoma functions in response to a matrix
microenvironment. Clin Exp Metastasis. 22:391–402. 2005. View Article : Google Scholar : PubMed/NCBI
|
|
13
|
Akiyama SK, Olden K and Yamada KM:
Fibronectin and integrins in invasion and metastasis. Cancer
Metastasis Rev. 14:173–189. 1995. View Article : Google Scholar : PubMed/NCBI
|
|
14
|
Shibata K, Kikkawa F, Nawa A, Suganuma N
and Hamaguchi M: Fibronectin secretion from human peritoneal tissue
induces Mr 92,000 type IV collagenase expression and invasion in
ovarian cancer cell lines. Cancer Res. 57:5416–5420.
1997.PubMed/NCBI
|
|
15
|
Lou X, Han X, Jin C, Tian W, Yu W, Ding D,
Cheng L, Huang B, Jiang H and Lin B: SOX2 targets fibronectin 1 to
promote cell migration and invasion in ovarian cancer: New
molecular leads for therapeutic intervention. OMICS. 17:510–518.
2013. View Article : Google Scholar : PubMed/NCBI
|
|
16
|
Jinawath N, Vasoontara C, Jinawath A, Fang
X, Zhao K, Yap KL, Guo T, Lee CS, Wang W, Balgley BM, et al:
Oncoproteomic analysis reveals co-upregulation of RELA and STAT5 in
carboplatin resistant ovarian carcinoma. PLoS One. 5:e111982010.
View Article : Google Scholar : PubMed/NCBI
|
|
17
|
Qian P, Zuo Z, Wu Z, Meng X, Li G, Wu Z,
Zhang W, Tan S, Pandey V, Yao Y, et al: Pivotal role of reduced
let-7g expression in breast cancer invasion and metastasis. Cancer
Res. 71:6463–6474. 2011. View Article : Google Scholar : PubMed/NCBI
|
|
18
|
Waalkes S, Atschekzei F, Kramer MW,
Hennenlotter J, Vetter G, Becker JU, Stenzl A, Merseburger AS,
Schrader AJ, Kuczyk MA, et al: Fibronectin 1 mRNA expression
correlates with advanced disease in renal cancer. BMC Cancer.
10:5032010. View Article : Google Scholar : PubMed/NCBI
|
|
19
|
Yokomizo A, Takakura M, Kanai Y, et al:
Use of quantitative shotgun proteomics to identify fibronectin 1 as
a potential plasma biomarker for clear cell carcinoma of the
kidney. Cancer biomarkers: Section. Dis Markers. 10:175–183.
2011.
|
|
20
|
He X, Wang Y, Zhang W, Li H, Luo R, Zhou
Y, Li C, Liao M, Huang H, Lv X, et al: Screening differential
expression of serum proteins in AFP-negative HBV-related
hepatocellular carcinoma using iTRAQ -MALDI-MS/MS. Neoplasma.
61:17–26. 2014. View Article : Google Scholar
|
|
21
|
Cochrane DR, Spoelstra NS, Howe EN,
Nordeen SK and Richer JK: MicroRNA-200c mitigates invasiveness and
restores sensitivity to microtubule-targeting chemotherapeutic
agents. Mol Cancer Ther. 8:1055–1066. 2009. View Article : Google Scholar : PubMed/NCBI
|
|
22
|
Liu L, Zou J, Wang Q, Yin FQ, Zhang W and
Li L: Novel microRNAs expression of patients with chemotherapy
drug-resistant and chemotherapy-sensitive epithelial ovarian
cancer. Tumour Biol. 35:7713–7717. 2014. View Article : Google Scholar : PubMed/NCBI
|
|
23
|
Zhang X, Yang JJ, Kim YS, Kim KY, Ahn WS
and Yang S: An 8-gene signature, including methylated and
down-regulated glutathione peroxidase 3, of gastric cancer. Int J
Oncol. 36:405–414. 2010.PubMed/NCBI
|
|
24
|
Bottaro DP, Rubin JS, Faletto DL, Chan AM,
Kmiecik TE, Vande Woude GF and Aaronson SA: Identification of the
hepatocyte growth factor receptor as the c-met proto-oncogene
product. Science. 251:802–804. 1991. View Article : Google Scholar : PubMed/NCBI
|
|
25
|
Park M, Dean M, Kaul K, Braun MJ, Gonda MA
and Vande Woude G: Sequence of MET protooncogene cDNA has features
characteristic of the tyrosine kinase family of growth-factor
receptors. Proc Natl Acad Sci USA. 84:6379–6383. 1987. View Article : Google Scholar : PubMed/NCBI
|
|
26
|
Azad MB, Chen Y and Gibson SB: Regulation
of autophagy by reactive oxygen species (ROS): Implications for
cancer progression and treatment. Antioxid Redox Signal.
11:777–790. 2009. View Article : Google Scholar
|
|
27
|
Davis W Jr, Ronai Z and Tew KD: Cellular
thiols and reactive oxygen species in drug-induced apoptosis. J
Pharmacol Exp Ther. 296:1–6. 2001.
|
|
28
|
Lee HJ, Do JH, Bae S, Yang S, Zhang X, Lee
A, Choi YJ, Park DC and Ahn WS: Immunohistochemical evidence for
the over-expression of Glutathione peroxidase 3 in clear cell type
ovarian adenocarcinoma. Med Oncol. 28(Suppl 1): S522–S527. 2011.
View Article : Google Scholar
|
|
29
|
Saga Y, Ohwada M, Suzuki M, Konno R,
Kigawa J, Ueno S and Mano H: Glutathione peroxidase 3 is a
candidate mechanism of anticancer drug resistance of ovarian clear
cell adenocarcinoma. Oncol Rep. 20:1299–1303. 2008.PubMed/NCBI
|
|
30
|
Hochepied T, Berger FG, Baumann H and
Libert C: Alpha(1)-acid glycoprotein: An acute phase protein with
inflammatory and immunomodulating properties. Cytokine Growth
Factor Rev. 14:25–34. 2003. View Article : Google Scholar
|
|
31
|
Fournier T, Medjoubi-N N and Porquet D:
Alpha-1-acid glycoprotein. Biochim Biophys Acta. 1482:157–171.
2000. View Article : Google Scholar : PubMed/NCBI
|
|
32
|
Fan C, Stendahl U, Stjernberg N and
Beckman L: Association between orosomucoid types and cancer.
Oncology. 52:498–500. 1995. View Article : Google Scholar : PubMed/NCBI
|
|
33
|
Duché JC, Urien S, Simon N, Malaurie E,
Monnet I and Barré J: Expression of the genetic variants of human
alpha-1-acid glycoprotein in cancer. Clin Biochem. 33:197–202.
2000. View Article : Google Scholar : PubMed/NCBI
|
|
34
|
Tilg H, Vannier E, Vachino G, Dinarello CA
and Mier JW: Antiinflammatory properties of hepatic acute phase
proteins: Preferential induction of interleukin 1 (IL-1) receptor
antagonist over IL-1 beta synthesis by human peripheral blood
mononuclear cells. J Exp Med. 178:1629–1636. 1993. View Article : Google Scholar : PubMed/NCBI
|
|
35
|
Matsumoto K, Nishi K, Kikuchi M, Watanabe
H, Nakajou K, Komori H, Kadowaki D, Suenaga A, Maruyama T and
Otagiri M: Receptor-mediated uptake of human alpha1-acid
glycoprotein into liver parenchymal cells in mice. Drug Metab
Pharmacokinet. 25:101–107. 2010. View Article : Google Scholar : PubMed/NCBI
|
|
36
|
Lee YS, Choi JW, Hwang I, Lee JW, Lee JH,
Kim AY, Huh JY, Koh YJ, Koh GY, Son HJ, et al: Adipocytokine
orosomucoid integrates inflammatory and metabolic signals to
preserve energy homeostasis by resolving immoderate inflammation. J
Biol Chem. 285:22174–22185. 2010. View Article : Google Scholar : PubMed/NCBI
|
|
37
|
Gunnarsson P, Levander L, Påhlsson P and
Grenegård M: The acute-phase protein alpha 1-acid glycoprotein
(AGP) induces rises in cytosolic Ca2+ in neutrophil
granulocytes via sialic acid binding immunoglobulin-like lectins
(siglecs). FASEB J. 21:4059–4069. 2007. View Article : Google Scholar : PubMed/NCBI
|
|
38
|
Atemezem A, Mbemba E, Vassy R, Slimani H,
Saffar L and Gattegno L: Human alpha1-acid glycoprotein binds to
CCR5 expressed on the plasma membrane of human primary macrophages.
Biochem J. 356:121–128. 2001. View Article : Google Scholar : PubMed/NCBI
|
|
39
|
Ligresti G, Aplin AC, Dunn BE, Morishita A
and Nicosia RF: The acute phase reactant orosomucoid-1 is a bimodal
regulator of angiogenesis with time- and context-dependent
inhibitory and stimulatory properties. PLoS One. 7:e413872012.
View Article : Google Scholar : PubMed/NCBI
|
|
40
|
Irmak S, Oliveira-Ferrer L, Singer BB,
Ergün S and Tilki D: Pro-angiogenic properties of orosomucoid
(ORM). Exp Cell Res. 315:3201–3209. 2009. View Article : Google Scholar : PubMed/NCBI
|
|
41
|
Goh BC, Lee SC, Wang LZ, Fan L, Guo JY,
Lamba J, Schuetz E, Lim R, Lim HL, Ong AB, et al: Explaining
interindividual variability of docetaxel pharmacokinetics and
pharmacodynamics in Asians through phenotyping and genotyping
strategies. J Clin Oncol. 20:3683–3690. 2002. View Article : Google Scholar : PubMed/NCBI
|
|
42
|
Delbaldo C, Chatelut E, Ré M, Deroussent
A, Séronie-Vivien S, Jambu A, Berthaud P, Le Cesne A, Blay JY and
Vassal G: Pharmacokinetic-pharmacodynamic relationships of imatinib
and its main metabolite in patients with advanced gastrointestinal
stromal tumors. Clin Cancer Res. 12:6073–6078. 2006. View Article : Google Scholar : PubMed/NCBI
|
|
43
|
Bruno R, Olivares R, Berille J, Chaikin P,
Vivier N, Hammershaimb L, Rhodes GR and Rigas JR: Alpha-1-acid
glycoprotein as an independent predictor for treatment effects and
a prognostic factor of survival in patients with non-small cell
lung cancer treated with docetaxel. Clin Cancer Res. 9:1077–1082.
2003.PubMed/NCBI
|
|
44
|
Katori N, Sai K, Saito Y, Fukushima-Uesaka
H, Kurose K, Yomota C, Kawanishi T, Nishimaki-Mogami T, Naito M,
Sawada J, et al: Genetic variations of orosomucoid genes associated
with serum alpha-1-acid glycoprotein level and the pharmacokinetics
of paclitaxel in Japanese cancer patients. J Pharm Sci.
100:4546–4559. 2011. View Article : Google Scholar : PubMed/NCBI
|
|
45
|
Pandey PR, Liu W, Xing F, Fukuda K and
Watabe K: Anti-cancer drugs targeting fatty acid synthase (FAS).
Recent Patents Anticancer Drug Discov. 7:185–197. 2012. View Article : Google Scholar
|
|
46
|
Flavin R, Peluso S, Nguyen PL and Loda M:
Fatty acid synthase as a potential therapeutic target in cancer.
Future Oncol. 6:551–562. 2010. View Article : Google Scholar : PubMed/NCBI
|
|
47
|
Chen Y, Ma Z, Li A, Li H, Wang B, Zhong J,
Min L and Dai L: Metabolomic profiling of human serum in lung
cancer patients using liquid chromatography/hybrid quadrupole
time-of-flight mass spectrometry and gas chromatography/mass
spectrometry. J Cancer Res Clin Oncol. 141:705–718. 2015.
View Article : Google Scholar
|
|
48
|
Liu H, Liu Y and Zhang JT: A new mechanism
of drug resistance in breast cancer cells: Fatty acid synthase
overexpression-mediated palmitate overproduction. Mol Cancer Ther.
7:263–270. 2008. View Article : Google Scholar : PubMed/NCBI
|
|
49
|
Meena AS, Sharma A, Kumari R, Mohammad N,
Singh SV and Bhat MK: Inherent and acquired resistance to
paclitaxel in hepatocellular carcinoma: Molecular events involved.
PLoS One. 8:e615242013. View Article : Google Scholar : PubMed/NCBI
|
|
50
|
Roodhart JM, Daenen LG, Stigter EC, Prins
HJ, Gerrits J, Houthuijzen JM, Gerritsen MG, Schipper HS, Backer
MJ, van Amersfoort M, et al: Mesenchymal stem cells induce
resistance to chemotherapy through the release of platinum-induced
fatty acids. Cancer Cell. 20:370–383. 2011. View Article : Google Scholar : PubMed/NCBI
|