Introduction
According to WHO, gastric cancer (GC) is the fourth
most common cancer and the second most common cause of
cancer-related death worldwide (1). In China, gastric cancers are
considered to be the second most frequently diagnosed cause of
cancer death (2). Recently, owing
to the global environment worsening and change in people’s habits,
incidence of gastric cancer has increased year by year. Despite
some advances in diagnosis, staging and treatment of GC, especially
surgery, chemotherapy and radiotherapy, the long-term survival rate
remains quite low because of local invasion and distant metastasis.
The incidence, development, infiltration and metastasis of GC are a
multistep and multifactor process. It may be regulated by many
genes and involves a variety of gene activation, regulated disorder
or inactivation (3). Recently,
many characteristic biological markers are being studied, which may
be very helpful to clinicians to predict metastatic progression and
prognosis of GC patients.
FBJ murine osteosarcoma viral oncogene homolog B,
also known as FOSB (in humans) or FosB (in other species), is a
protein that is encoded by the FOSB gene that is localized on
chromosome 19q13 and is composed of four exons in humans (4,5).
FosB is an acidic protein of 338 amino acids which shares
structural similarities with the prototype of the Fos family,
c-Fos, namely, a prolin-rich basic DNA-binding region, a leucine
zipper required for dimer formation, and a C-terminal
transactivation domain (6). FOSB
gene encodes leucine zipper proteins that dimerize with proteins of
the JUN family, thereby forming the transcription factor complex
AP-1. AP-1 regulates gene expression in response to a variety of
stimuli, including cytokines, growth factors, stress and bacterial
and viral infections (7). It was
shown in various experimental systems that stronger proliferation,
malignant transformation and enhanced aggressiveness are
accompanied by a change in AP-1 complex composition (8–10).
Similarly, the inhibition of proliferation and induction of
differentiation processes leads to a shift of expression of the
individual AP-1 proteins (11–13).
In the past several years, some studies identified that
downregulated expression of FOSB is frequent in breast carcinomas
(14) and pancreatic cancer
(15). Up to now, there has not
been research reporting the role of FOSB in GC. Thus, the purpose
of the present study was to determine FOSB expression in human GC
patient specimens and then to evaluate the clinicopathological
implications of FOSB expression in GC. Furthermore, we investigated
the potential influence of FOSB in the development of GC.
Materials and methods
Tissue collection
We retrospectively analyzed clinicopathological data
from 116 gastric cancer patients who underwent surgical resection
at the Second Affiliated Hospital of Nantong University from
January 2008 to December 2010, and obtained fresh gastric cancer
and surrounding non-cancerous tissue samples randomly from 40 GC
patients. After surgical resection, fresh samples were frozen in
liquid nitrogen immediately and divided into two parts, and one was
maintained at −80°C until use for real-time PCR, the other used for
western blot analysis. Paraffin-embedded samples were obtained from
116 GC patients for immunohistochemistry. The clinical information
related to the 116 GC patients, including gender, age, tumor size,
TNM stage and lymph node metastasis was also collected. Staging and
grading were referred to the classification of the International
Union against Cancer (UICC) criteria. None of the patients were
administered preoperative radiotherapy or chemotherapy. All human
tissues were collected using protocols approved by the Ethics
Committee of The Second Affiliated Hospital of Nantong
University.
Western blot analysis
Paired cancer and their paracancerous tissue
specimens were used for western blot analysis. We used lysis buffer
which contain protease inhibitors (Promega, Madison, WI, USA) to
extract total protein. Then, equal amounts (30 μg) of protein
separated by 10% sodium dodecyl sulfate polyacrylamide gel
electrophoresis (SDS-PAGE). After that, they were transferred to a
poly-vinylidene fluoride (PVDF) membrane, and we used 5% non-fat
milk in TBST (Tris-buffered saline containing 0.1% Tween-20) to
block non-specific binding for 2 h. After the incubation with the
primary antibodies overnight at 4°C [a rabbit polyclonal anti-human
FOSB antibody (1:100, sc-48; Santa Cruz Biotechnology, Inc., Santa
Cruz, CA, USA) or a rabbit anti-β-actin as internal reference, at
1:2,000 dilution (Sigma-Aldrich, St. Louis, MO, USA)], membranes
were washed three times in TBST for 5 min and then incubated with
horseradish peroxidase-conjugated goat anti-rabbit secondary
antibody (1:1,000 dilution; Sigma-Aldrich) for 2 h at room
temperature. Finally signals were scanned with an Odyssey infrared
imaging system (LI-COR Biosciences, Lincoln, NE, USA), and analyzed
with PDQuest 7.2.0 software (Bio-Rad Laboratories, Hercules, CA,
USA).
Quantitative real-time PCR
The mRNA expression of FOSB was analyzed by the
quantitative real-time PCR. Total RNAs were isolated from tumor
tissue samples (100–200 mg) adjacent to the region which was used
for protein extraction. Quantitative real-time PCR was performed
using HotStart-IT SYBR-Green qPCR Master Mix (2X; USB Corp.,
Cleveland, OH, USA). On the basis of the HotStart-IT protocol, 25
μl reactions were run with 2 μl of cDNA. In addition, RT-PCR
experiments were performed in a LightCycler 480 system (Roche
Applied Science). PCR procedures: first, hot start at 95°C for 10
min; 40 cycles of amplification/quantification at 95°C for 10 sec,
then 60°C for 30 sec, and 72°C for 30 sec when fluorescence was
measured. Melting curve analysis was performed using continuous
fluorescence acquisition from 65 to 97°C. These cycling parameters
generated single amplicons for both primer sets used according to
the presence of a single melt peak. The sequences of the primers
for FOSB were: FOSB forward, 5′-TGACAGTGTTATCCCAAGACCC-3′ and FOSB
reverse, 5′-CCAGCAGGACGGCATCA-3′. The β-actin was selected as the
internal reference. All quantitative real-time PCRs were repeated
three times for each gene and each sample was done in
triplicate.
Immunohistochemistry
The tissue sections were deparaffinized with
dimethylbenzene and rehydrated through 100, 95, 90, 80 and 70%
ethanol. After three washes in phosphate-buffered saline (PBS), the
slides were boiled in antigen retrieval buffer containing 0.01 M
sodium citrate-hydrochloric acid for 10 min in a microwave oven.
After rinsing with PBS, the tissue sections were incubated with a
rabbit polyclonal anti-human FOSB antibody (1:100; Santa Cruz
Biotechnology) and the slides were then rinsed in 3% hydrogen
peroxide to block endogenous peroxidase. The sections were
incubated with a donkey anti-rabbit second antibody conjugated
horseradish peroxidase (1:5,000; Abcam, Cambridge, UK) at 4°C
overnight and then incubated with horseradish peroxidase (HRP) (at
room temperature for 30 min. After washing in PBS, the
visualization signal was developed with 3,3′-diaminobenzi-dine
(DAB) solution, and all of the slides were counterstained with
hematoxylin.
The total FOSB immunohistochemistry staining score
was calculated as the sum of the percentage of positively stained
cells and the staining intensity. Briefly, the percentage of
positive staining was scored as 0 (0–9%), 1 (10–25%), 2 (26–50%) or
3 (51–100%), and the intensity was scored as 0 (no staining), 1
(weak staining), 2 (moderate staining) or 3 (strong staining). The
expression level of FOSB was defined as follows: ‘−’ (negative,
score of 0), ‘+’ (weak positive, score of 1–3), ‘++’ (positive,
score of 4–6) and ‘+++’ (strong positive, score of 7–9). We defined
high FOSB expression as a total score of >3, and low FOSB
expression as a total score of <3.
Cell culture, plasmid construction and
transfection
The human GC cell lines, AGS, SGC7901, BGC823 and
MKN45 and the human normal gastric epithelial mucosa cell line
GES-1 were all obtained from the Cell Bank of the Committee on Type
Culture Collection of the Chinese Academy of Sciences (Shanghai,
China). All cell lines were grown in Dulbecco’s modified Eagle’s
medium (DMEM) or RPMI-1640 medium (Gibco) with 10% fetal bovine
serum (FBS; HyClone Laboratories, Inc., Logan, UT, USA) and were
cultured in humidified incubator at 37°C with 5%
CO2.
For siRNA silencing of FOSB, two pairs of siRNA
oligos for FOSB were designed and purchased from Shanghai
GenePharma, Co., Ltd. (Shanghai, China). The targeting sequences
were: FOSB siRNA1: 5′-AAGGGTGCGCCGGGA ACGAAATAAA-3′; FOSB siRNA2:
5′-GGAACGAAATAA ACTAGCAGCAGCT-3′; and FOSB siRNA3: 5′-GGCTTCT
CTCTTTACACACAGTGAA-3′. Synthesized siRNAs were transfected into GC
cells, respectively, using the Lipofectamine RNAiMAX transfection
reagent (Invitrogen, Carlsbad, CA, USA) according to the
manufacturer’s instructions. In addition, siRNA3 could effectively
reduce endogenous FOSB expression by western blotting assay.
Therefore, siRNA3 was chosen for downstream experiment.
FOSB overexpression vector pcDNA 3.1(+)-FOSB was
constructed using the PCR method. The PCR products were confirmed
by direct DNA sequencing and cloned into the mammalian expression
vector pcDNA 3.1(+). We obtained stably transfected clones by G418
selection (Promega). A stable transfectant of the pcDNA 3.1(+)
vector was used as a control. For transfection, pcDNA 3.1(+)-FOSB
expression plasmids were transfected into GC cells using
Lipofectamine 2000 (Invitrogen) according to the manufacturer’s
instructions. The level of FOSB expression after transfection was
analyzed by western blot analysis.
Cell viability assay
Cell viability was tested by using MTT assay. All
cells were plated in 96-well plates at 5×10³ cells/well
in complete medium and cultured for 24 h, and replaced with medium
which contained 10% FBS, then 10 μl MTT was added to each
corresponding test well and the plates were further incubated for 4
h. All samples were measured at 490 nm spectrophotometric
absorbance. All experiments were performed in triplicate.
Colony formation assay
After transfection, cells (5×10⁴/well)
were separately plated in a 24-well plate. After 24 h, the cells
were collected and seeded (1,000–1,500/well) in a fresh 6-well
plate for 12 days. Surviving colonies (>50 cells per colony)
were counted after fixed with methanol/acetone (1:1) and stained
with 5% Gentian violet (ICM Pharma Pte. Ltd., Singapore,
Singapore), after that rinsed three times with PBS to remove excess
dye, photographed and counted. The experiment was carried out in
triplicate wells three times.
Cell migration assay
According to the manufacturer’s instructions, the
cell migratory capacity was determined by Transwell chambers (BD
Biosciences, San Jose, CA, USA). After transfection, cells were
harvested at 24 h and then 3.0×10⁵ transfected cells or
untreated cells in serum-free medium were added to each upper
insert. The chemotactic factor, DMEM medium (Gibco) which contained
10% FBS (500 μl) was added to the lower chamber. After incubation
for 48 h, non-migrated cells on the upper surface were removed
gently with a cotton swab and the migrated cells on the lower
membrane surface were fixed in methanol. Cells were stained with
0.1% crystal violet, photographed and counted. The experiment was
performed in triplicate and repeated three times.
Statistical analysis
The SPSS 17.0 statistical software (SPSS, Inc.,
Chicago, IL, USA) was used for statistical analysis. The
relationship between the FOSB expression level and the
clinicopathological characteristics was subjected to the
χ2 test. Survival curves were calculated by the
Kaplan-Meier method and the differences were analyzed with the
log-rank test. A multivariate analysis of several prognostic
factors was carried out using the Cox proportional hazards
regression model. The results were expressed as the mean ± SD of at
least three independent experiments, for all statistical analyses.
P-value <0.05 was considered to be statistically
significant.
Results
FOSB expression analyzed in gastric
cancer tissue samples by western blot analysis and qRT-PCR
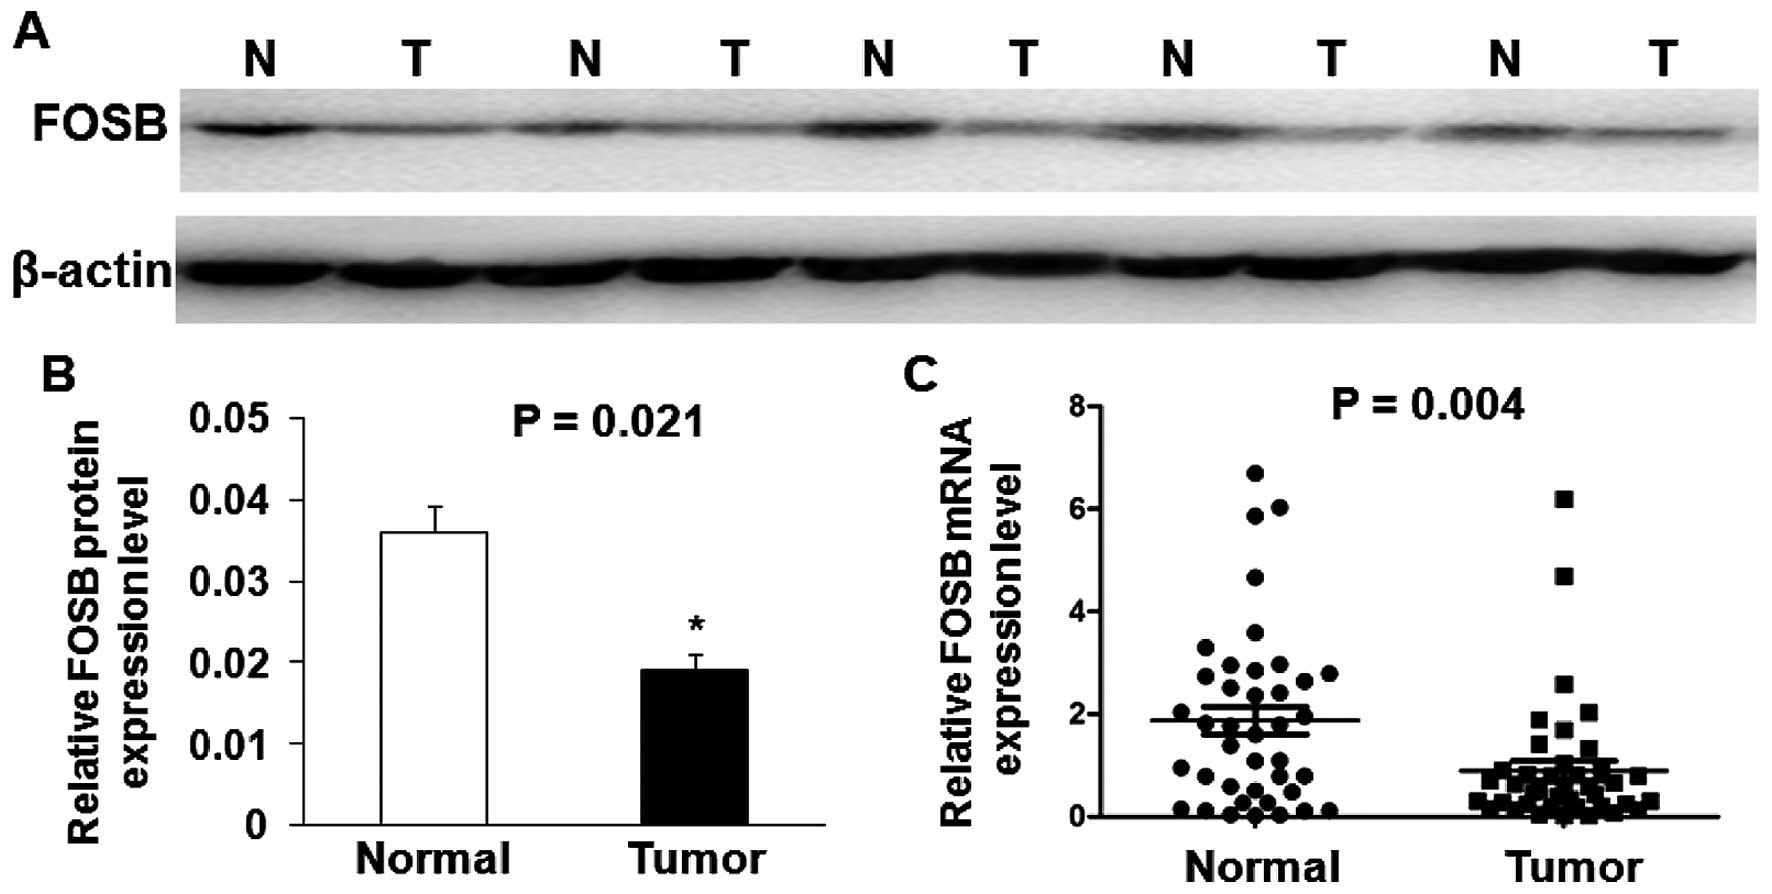
Twenty-four gastric cancer specimens as well as
their adjacent non-cancerous tissues were selected from 40 gastric
cancer patients randomly and used to evaluate FOSB protein
expression by western blot analysis. The representative results of
western blot analysis in five cases are shown in Fig. 1A. The results show that the
expression of FOSB protein level was significantly down-regulated
in most of GC tissues (79.17%, 19 of 24) compared with adjacent
non-cancerous tissues, and the average FOSB protein level in 24 GC
tissues was significantly lower than that in adjacent non-cancerous
tissues (P=0.021; Fig. 1B). We
also performed qRT-PCR analysis in 40 GC tissues and matched
adjacent non-cancerous tissues. As shown in Fig. 1C, the average relative expression
of FOSB mRNA level was significantly lower in GC tissues compared
with adjacent non-cancerous tissues (P=0.004).
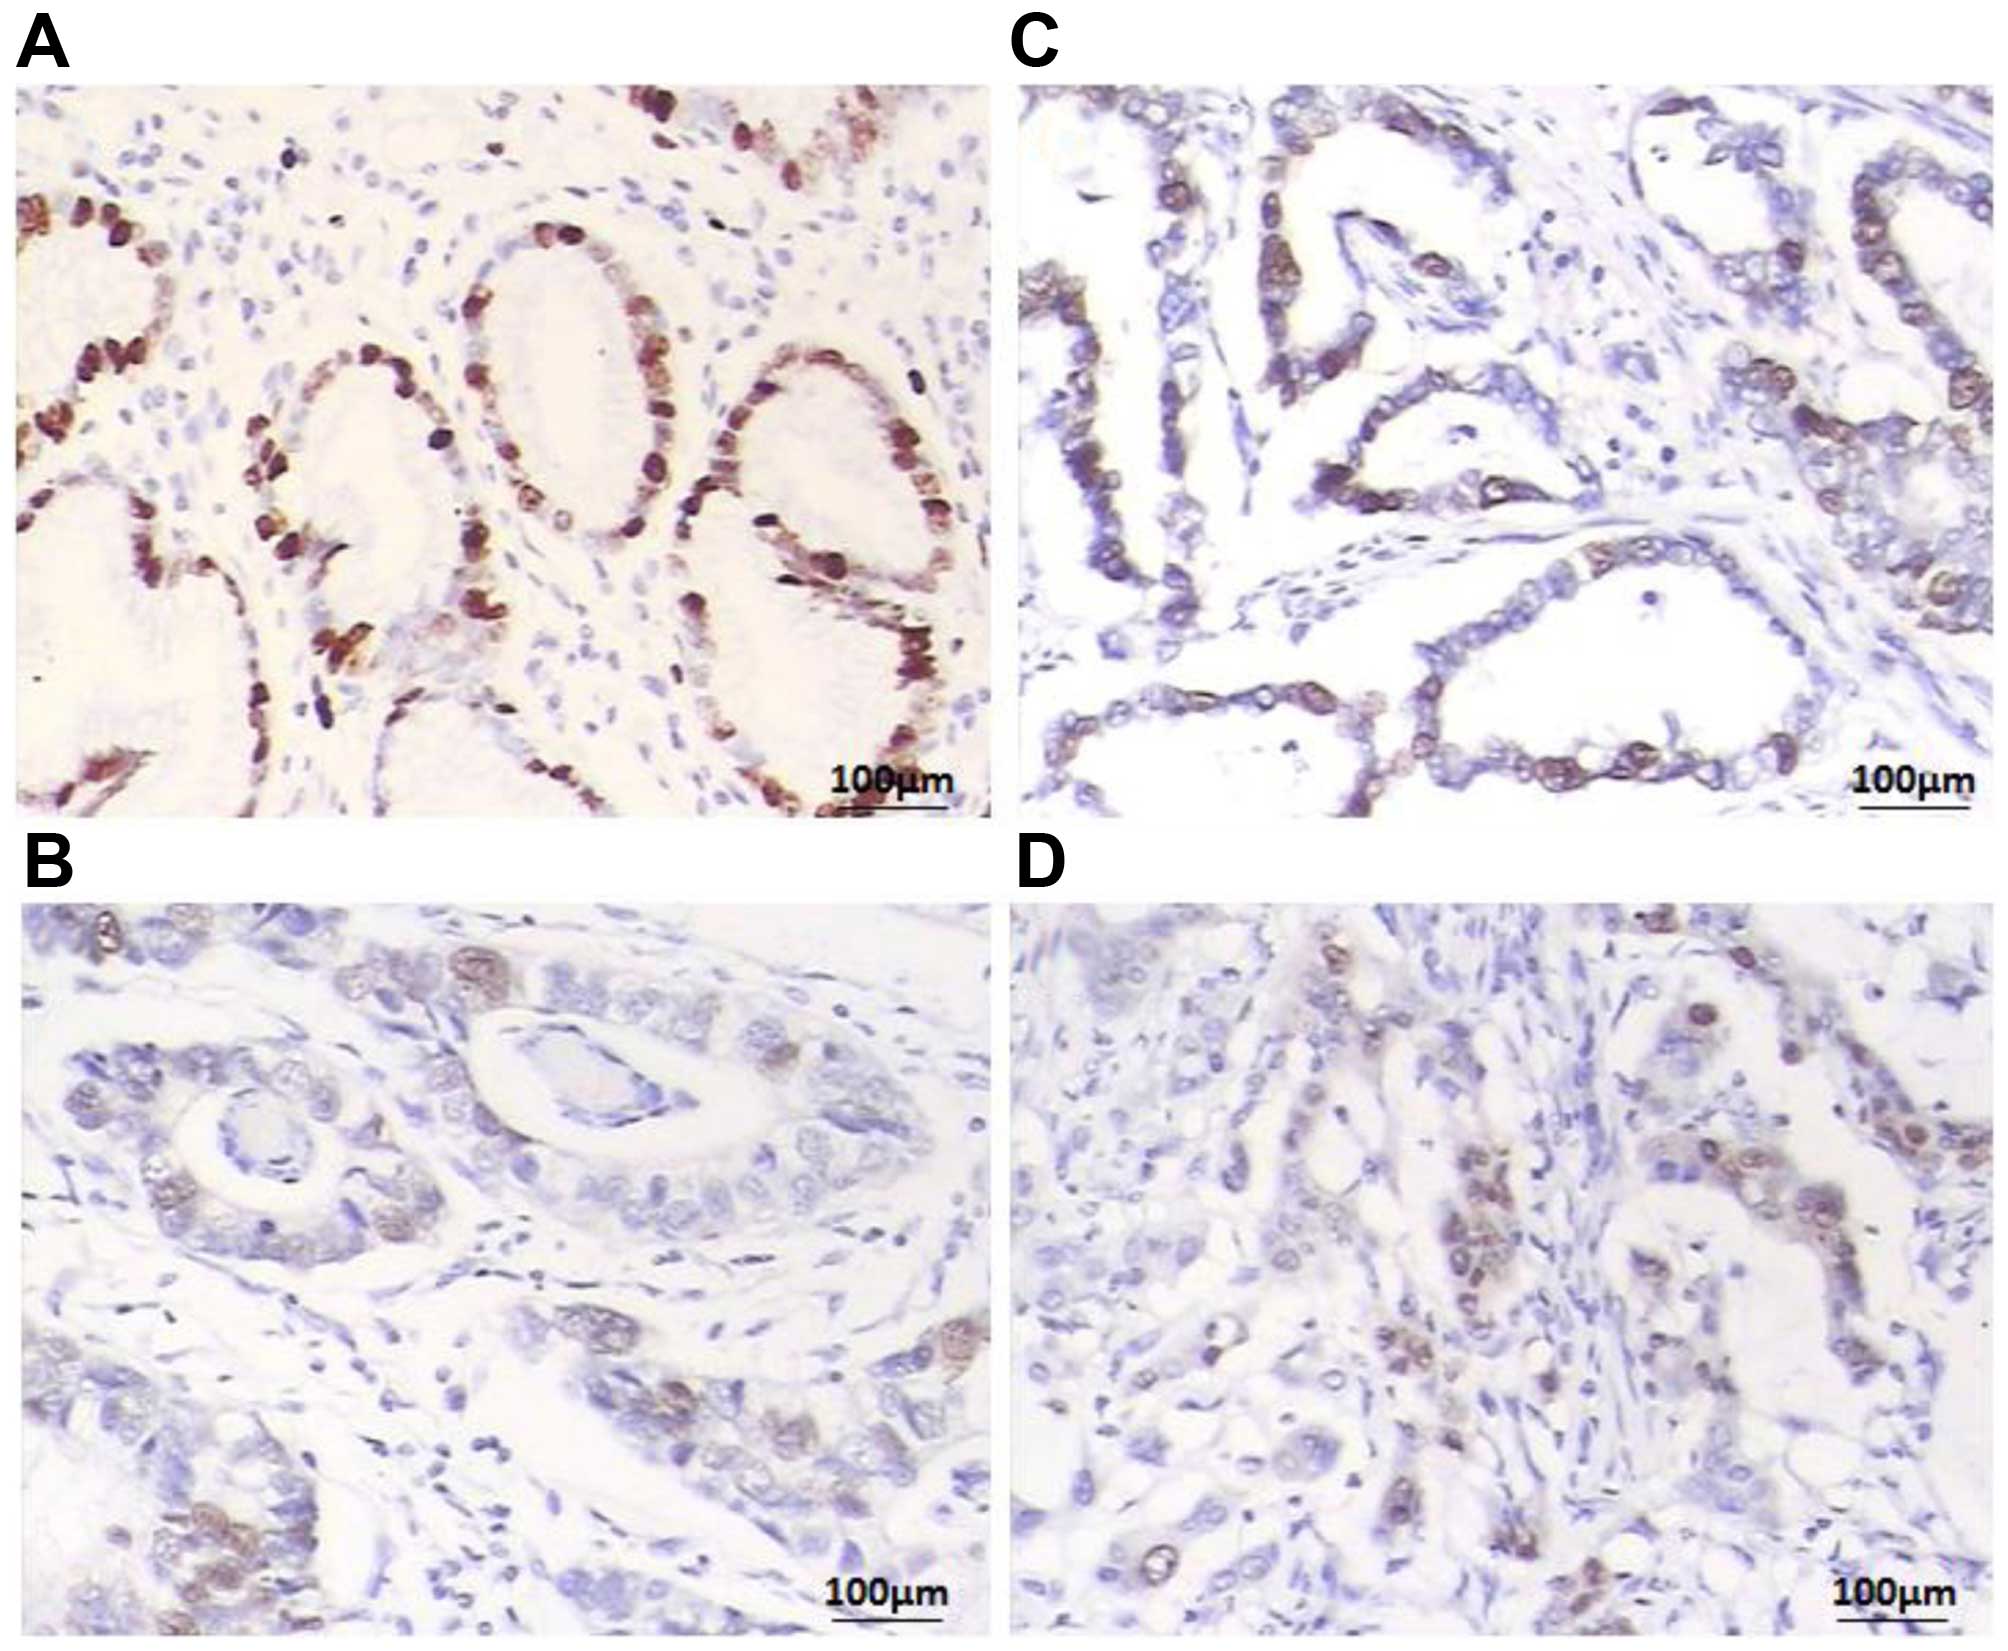
To further investigate FOSB expression level, a
total of 116 paraffin-embedded GC blocks were evaluated by IHC
analysis. We found that FOSB was expressed at various levels in the
GC tissues and the adjacent non-cancerous tissue samples (Fig. 2) Overall, 64 of 116 (55.17%) cases
showed low FOSB expression (FOSB − or FOSB +) in GC tissues, while
the remaining 52 (44.83%) cases displayed high SPOP expression
(FOSB ++ or FOSB +++) (Table I).
The adjacent non-cancerous tissues showed the strongest
FOSB-positive staining (Fig.
2A).
 | Table ICorrelation between the FOSB
expression and the clinicopathological characteristics in patients
with gastric cancer. |
Table I
Correlation between the FOSB
expression and the clinicopathological characteristics in patients
with gastric cancer.
| | FOSB expression | |
|---|
| |
| |
|---|
| Parameters | Total (n=116) | Low (n=64) | High (n=52) | P-value |
|---|
| Gender | | | | 0.507 |
| Male | 72 | 38 | 34 | |
| Female | 44 | 26 | 18 | |
| Age (years) | | | | 0.978 |
| <60 | 40 | 22 | 18 | |
| ≥60 | 76 | 42 | 34 | |
| Tumor size (cm) | | | | 0.115 |
| <5 | 54 | 34 | 20 | |
| ≥5 | 62 | 30 | 32 | |
| Location | | | | 0.418 |
| Cardia | 38 | 23 | 15 | |
| Body/antrum | 78 | 41 | 37 | |
| Histological
grade | | | | 0.001a |
| Well/moderate | 52 | 13 | 39 | |
| Poor | 64 | 51 | 13 | |
| Invasive depth | | | | 0.064 |
| T1/2 | 45 | 20 | 25 | |
| T3/4 | 71 | 44 | 27 | |
| H. pylori
infection | | | | |
| Negative | 30 | 16 | 14 | 0.814 |
| Positive | 86 | 48 | 38 | |
| Lymph node
metastasis | | | | 0.001a |
| Negative | 34 | 11 | 23 | |
| Positive | 82 | 53 | 29 | |
| TNM stage | | | | 0.021a |
| I/II | 69 | 32 | 37 | |
| III/IV | 47 | 32 | 15 | |
| Distant
metastasis | | | | 0.243 |
| Negative | 108 | 58 | 50 | |
| Positive | 8 | 6 | 2 | |
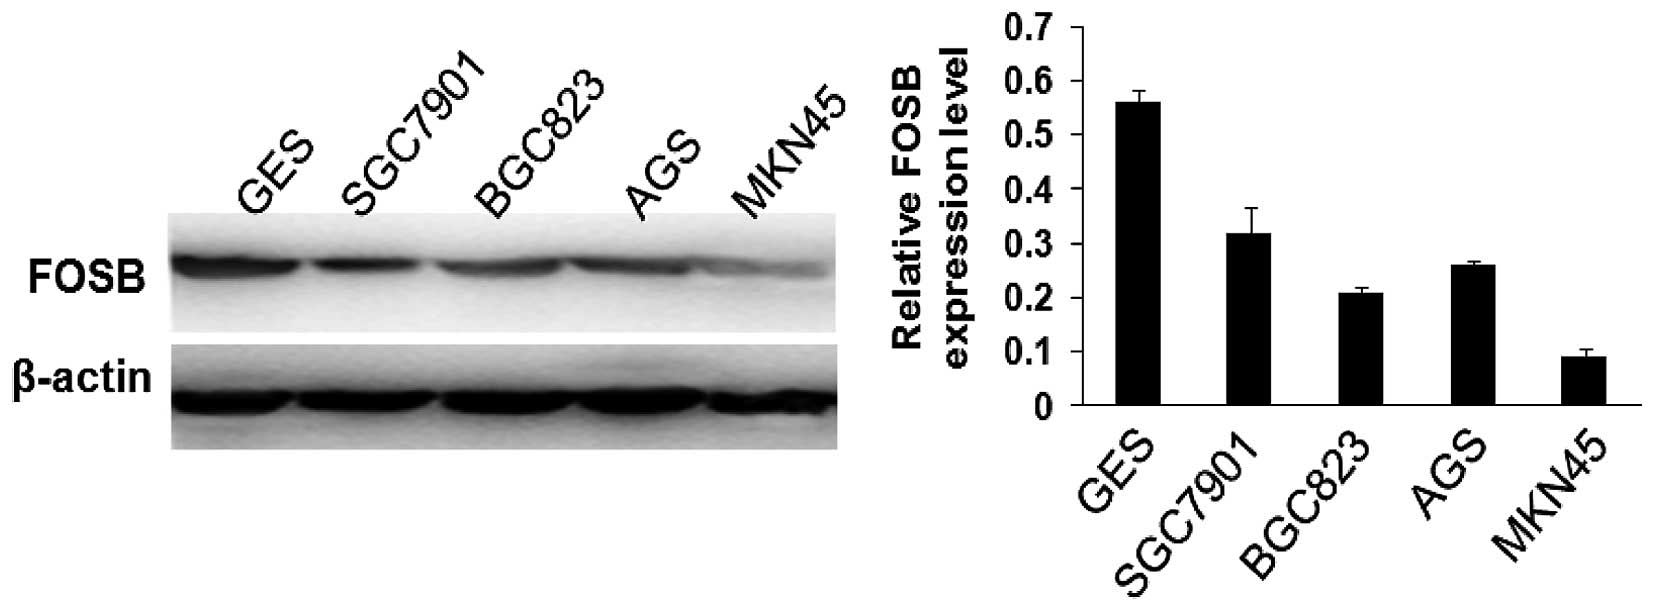
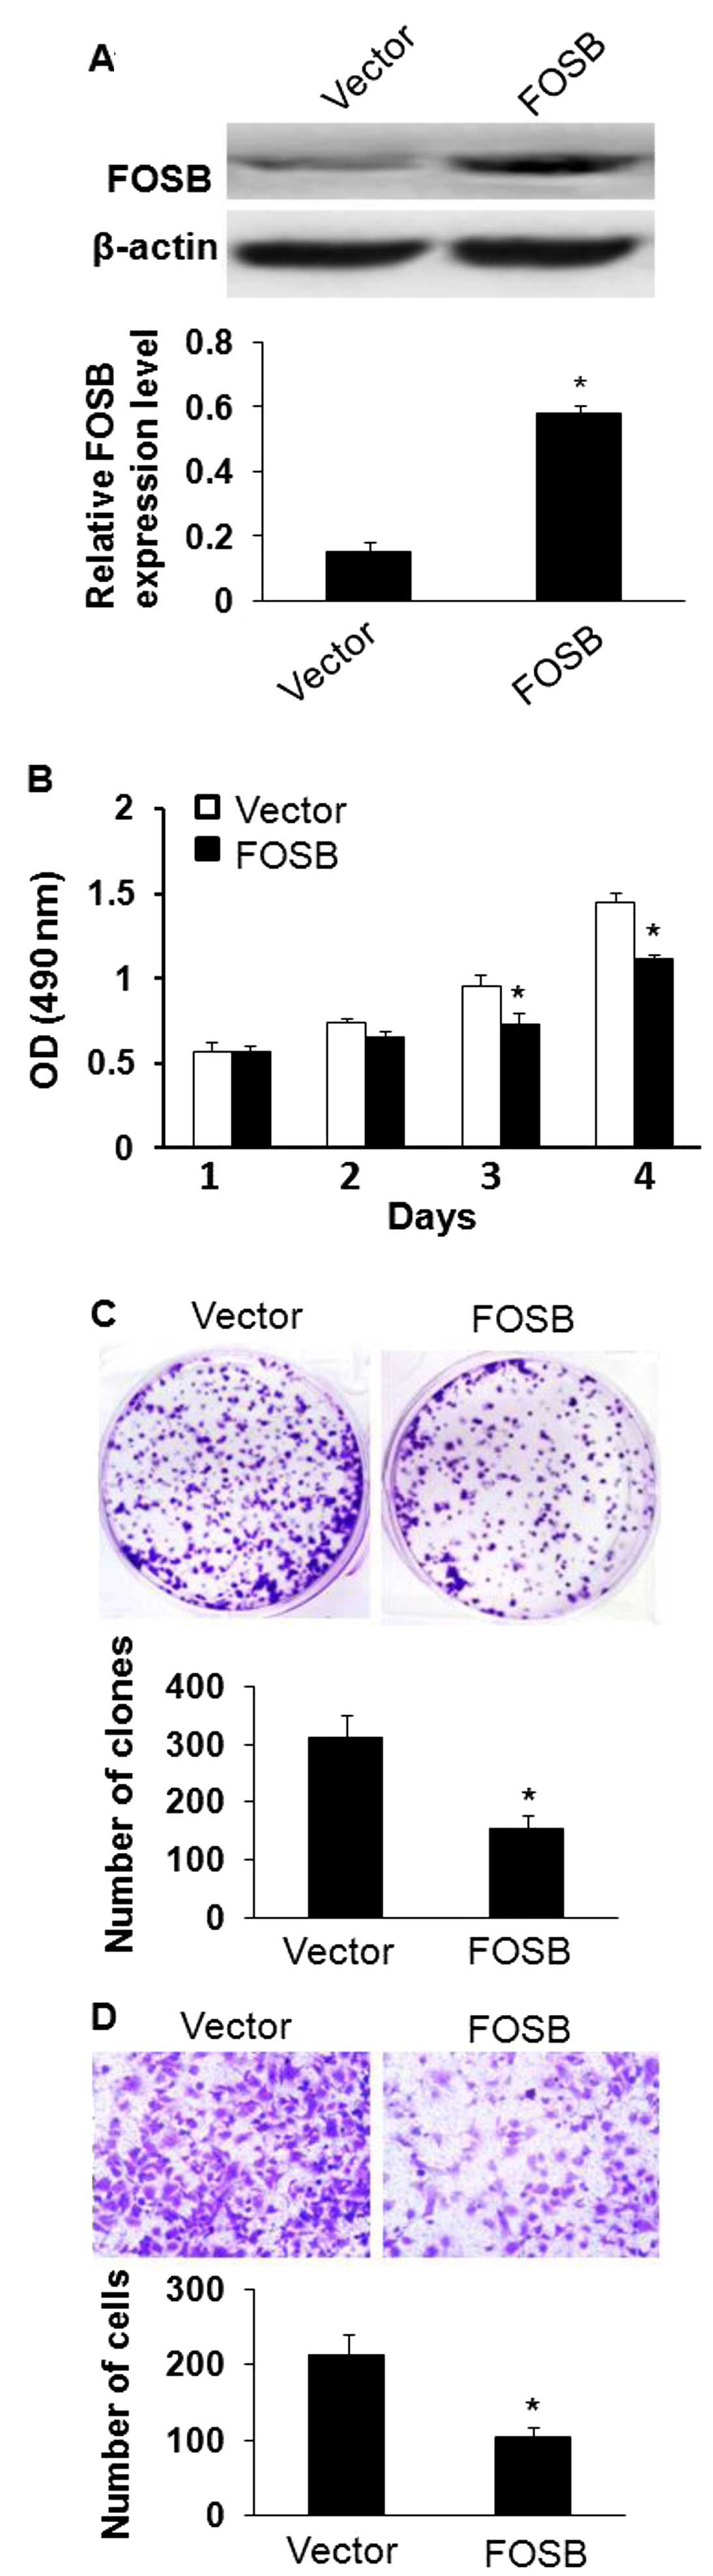
Overexpression of FOSB inhibits gastric
cancer cell viability, proliferation and migration in vitro
FOSB was significantly decreased in GC tissues and
acted as a tumor suppressor gene. MKN45 cell line with the lowest
expression of FOSB of the five tested GC cell lines (Fig. 3) was chosen to examine whether
overexpression of FOSB affected cell viability, proliferation and
migration in GC. The effects of FOSB on cell viability and
proliferation were evaluated by MTT and colony formation assay, and
the results showed that overexpression of FOSB suppressed the
viability and the number of colonies of MKN45 cells (Fig. 4B and C; P<0.05). In addition,
these results were further confirmed by assay, overexpression of
FOSB could decrease the transformation phenotype of GC cells in
vitro. Besides, we investigated the potential role of FOSB on
cellular migration by Transwell assays. MKN45 cells were
transfected with FOSB overexpressing plasmid or control plasmid and
seeded in the chamber, and their migratory abilities were
determined 24 h later. The results showed that the overexpression
of FOSB inhibited the migratory capacity of MKN45 cells (Fig. 4C; P<0.05).
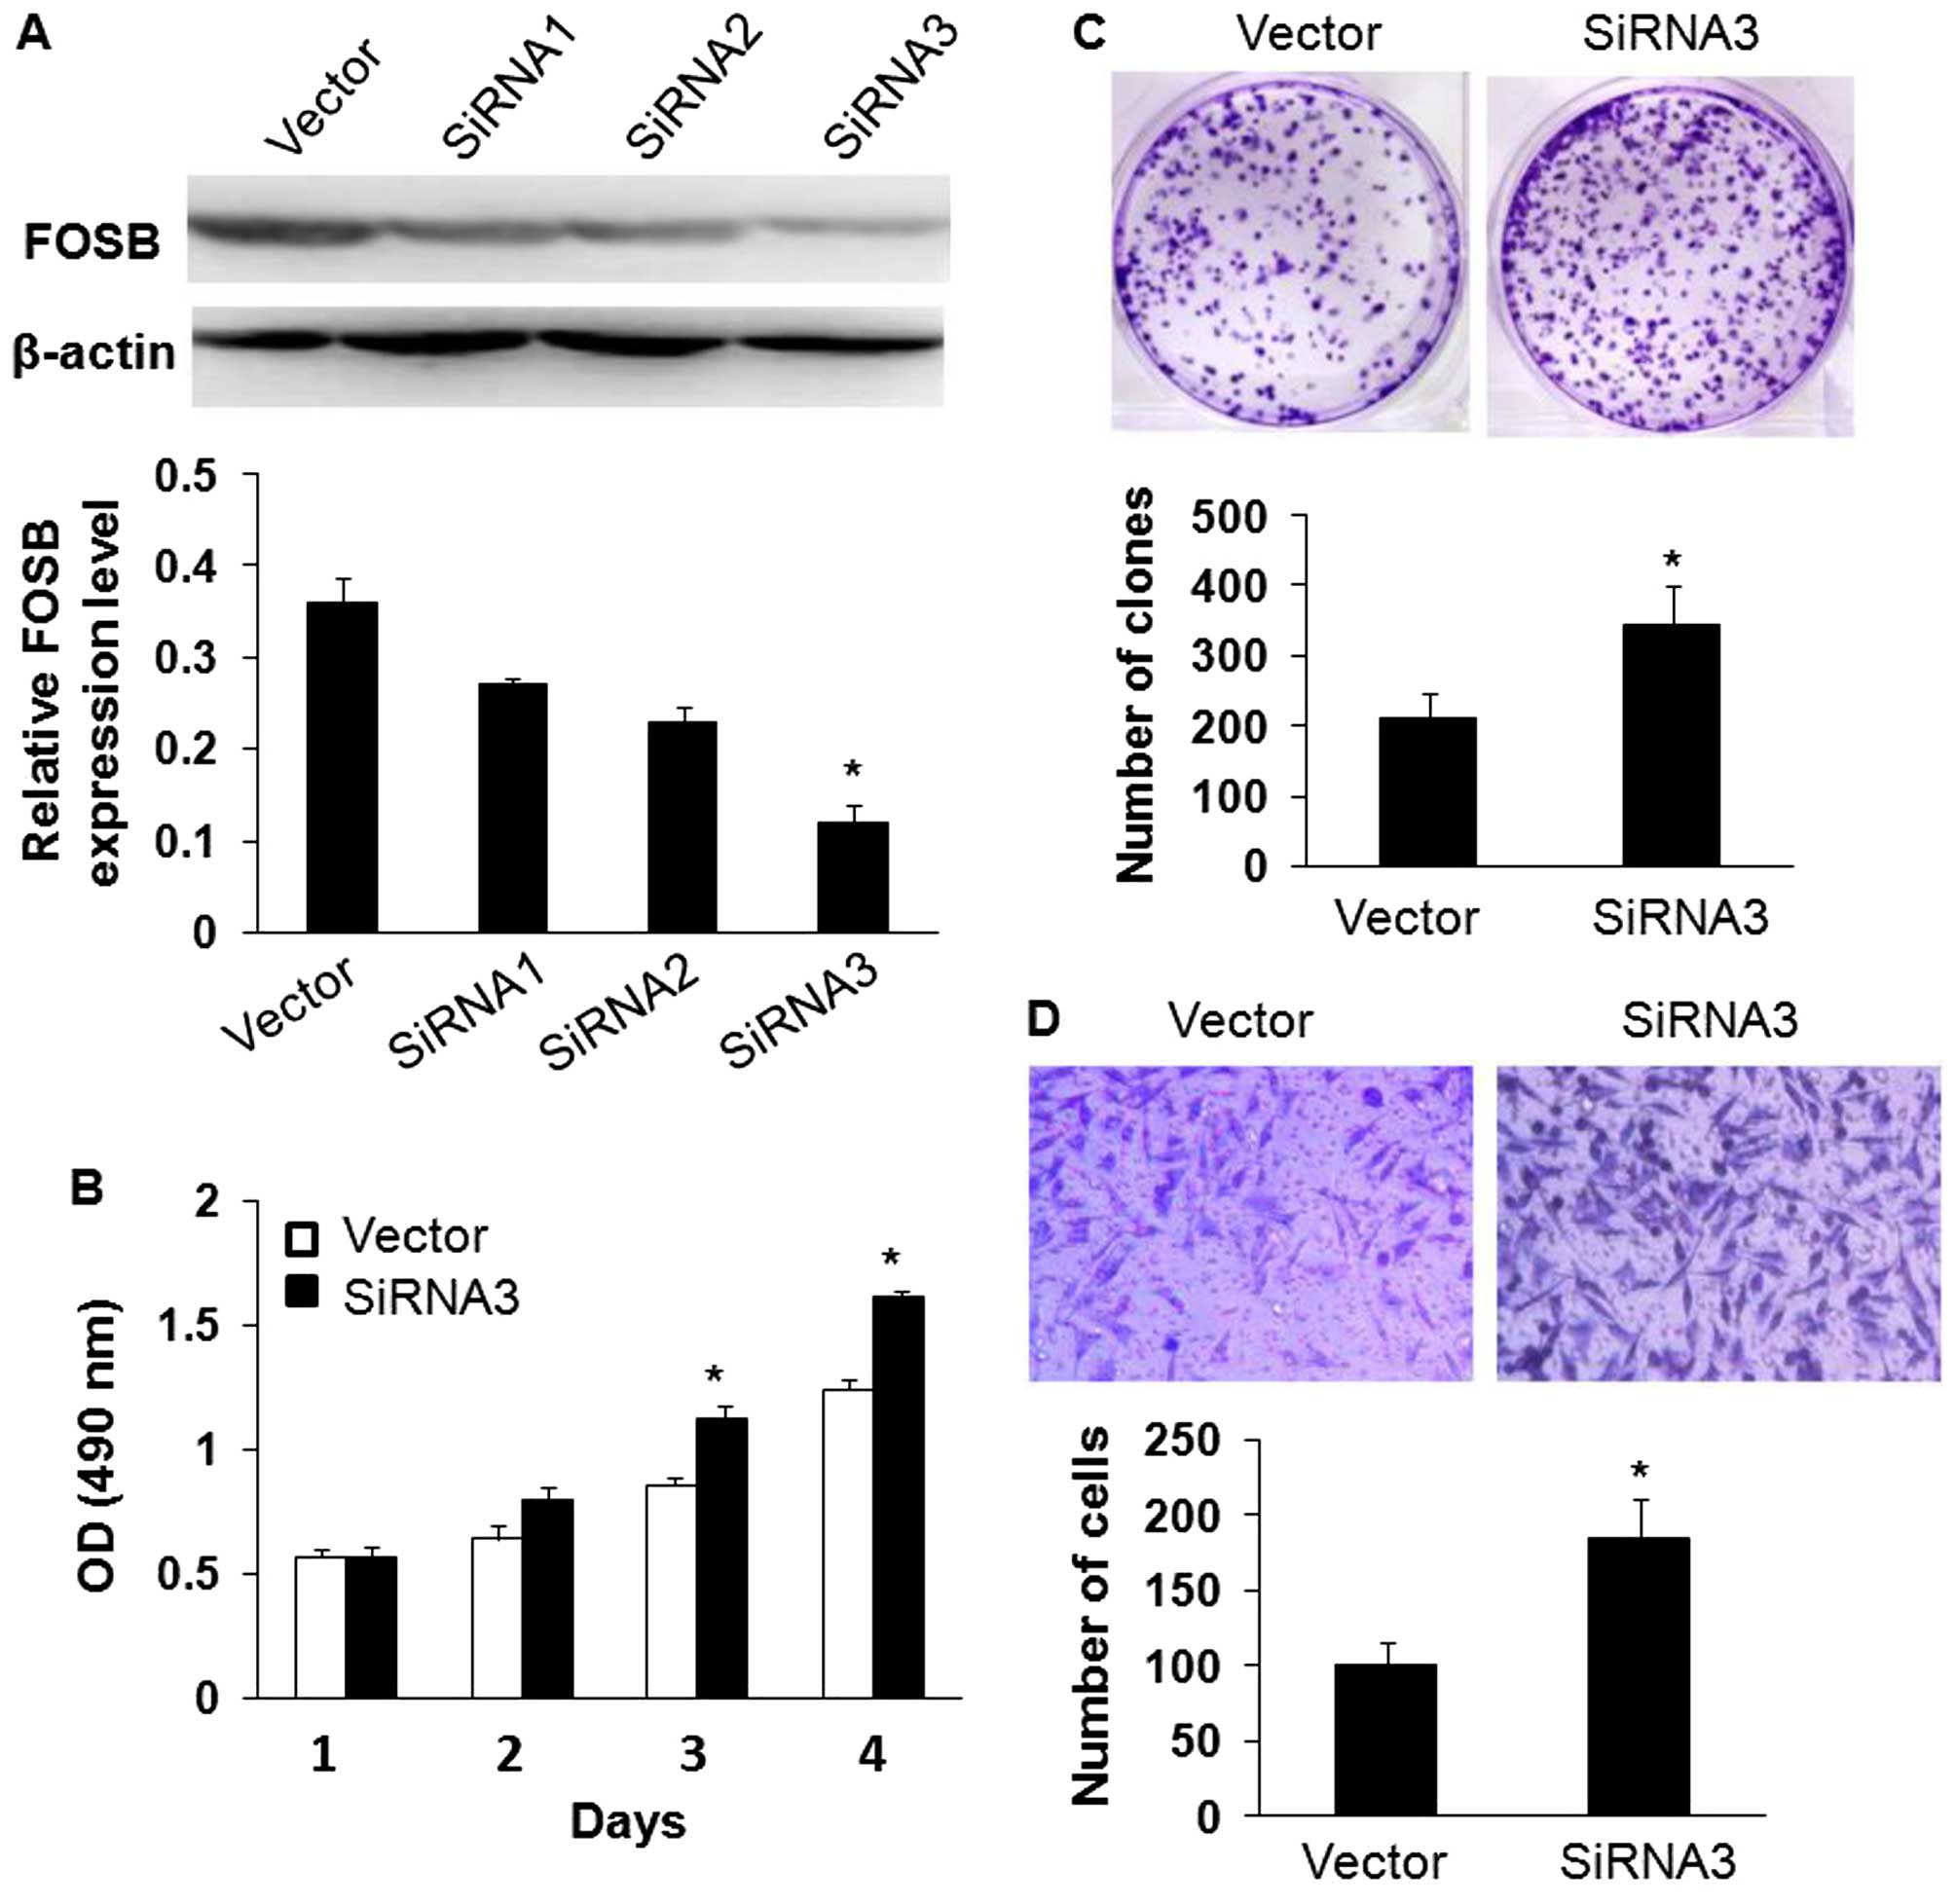
Knockdown of FOSB expression promotes
gastric cancer cell viability, proliferation and migration in
vitro
To further study the effects of FOSB on the
viability, proliferation and migration of gastric cancer cells,
SGC7901 cells that possessed the highest FOSB expression in the
four GC cells (Fig. 3) were
transfected with FOSB siRNA1, FOSB siRNA2 and FOSB siRNA3. Western
blot analysis showed that siRNA3 reduced the level of endogenous
FOSB expression more significantly than siRNA1 and siRNA2 (Fig. 5A). The effects of FOSB on cell
viability and proliferation was assessed by MTT and colony
formation assays, and the results indicated that downregulation of
FOSB expression promoted the viability of SGC7901 cells and
increased the number of colonies of SGC7901 cells compared with the
control cells (Fig. 5B and C;
P<0.05). In addition, knockdown of FOSB expression dramatically
reduced the migrated cell number of SGC7901 cells by Transwell
assay (Fig. 5D; P<0.05).
FOSB expression is correlated to
clinicopathological factors in GC
Chi-square test was used to analyze the correlation
between the FOSB expression in GC tissues and various
clinicopathological characteristics. Table I, indicates that we found that
decreased expression of FOSB was significantly correlated to poor
differentiation (P<0.001), lymph node metastasis (P=0.001) and
high TNM stage (P=0.021). However, there was no statistically
significant correlation between FOSB expression and gender, age,
tumor size, location, invasive depth, H. pylori infection
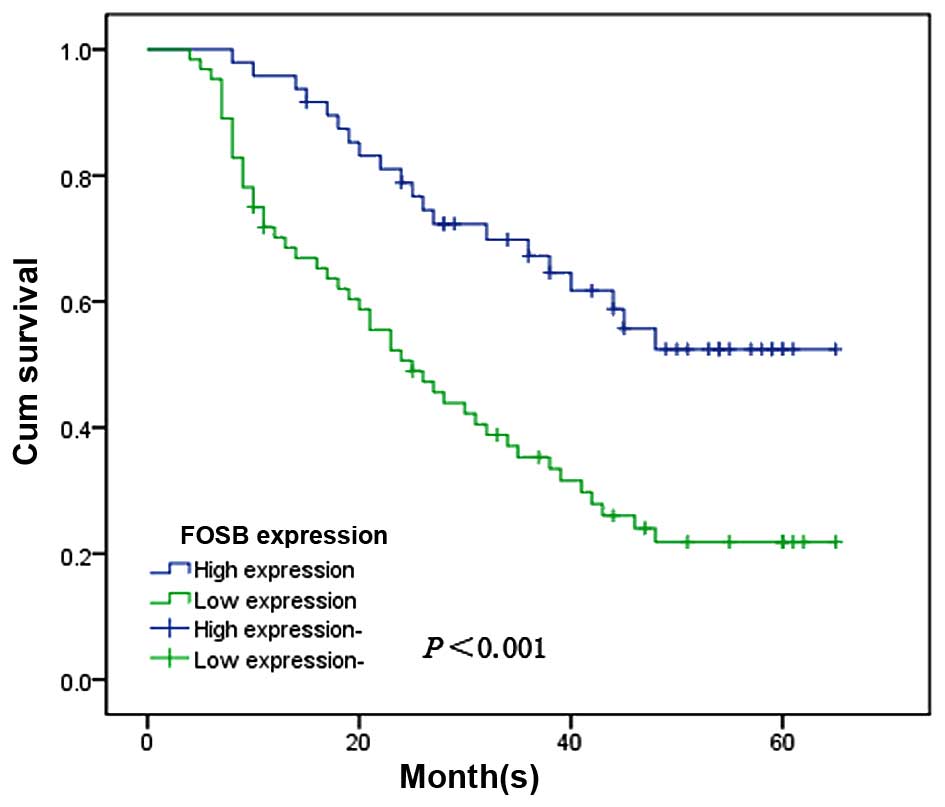
and distant metastasis (P>0.05). To further estimate the
correlation between the FOSB expression and the prognosis of GC
patients, we used Kaplan-Meier survival curves and the log-rank
test to investigate the prognostic effect of FOSB on the overall
survival rate of GC patients by comparing the 5-year survival rate
of patients with high or low levels of FOSB expression. The
patients with the low levels of FOSB expression had a poorer
prognosis than the patients with high levels of FOSB expression
(χ2, 13.421, P<0.001; Fig. 6).
Univariate and multivariate analysis was performed
to evaluate the independent prognostic roles of FOSB (Table II). Univariate Cox regression
analysis showed that histological grade, invasive depth, TNM stage,
lymph node metastasis and FOSB expression were significantly
associated with overall survival in GC patients. Moreover,
multivariate Cox regression analysis confirmed FOSB expression and
TNM stage as independent predictors of the overall survival of GC
patients.
| Table IIUnivariate and multivariate analyses
of prognostic factors in gastric cancer. |
Table II
Univariate and multivariate analyses
of prognostic factors in gastric cancer.
| Univariate
analysis | Multivariate
analysis |
|---|
|
|
|
|---|
| Variables | RR | 95% CI | P-value | RR | 95% CI | P-value |
|---|
| Gender (Male vs.
female) | 1.428 | 1.049–1.827 | 0.126 | - | - | - |
| Age (<60 vs. ≥60
years) | 1.336 | 1.023–2.062 | 0.057 | - | - | - |
| Tumor size (<5
vs. ≥5 cm) | 1.137 | 0.810–1.618 | 0.164 | - | - | - |
| Location (Cardia
vs. body/antrum) | 1.523 | 1.184–1.843 | 0.504 | - | - | - |
| Histological grade
(Poor vs. well + mod) | 0.675 | 0.426–0.944 | 0.022a | 0.527 | 0.376–0.926 | 0.807 |
| Distant metastasis
(+ vs. −) | 1.879 | 1.079–2.682 | 0.326 | - | - | - |
| Invasive depth (T3
+ T4 vs. T1 + T2) | 1.077 | 0.864–1.563 | <0.001a | 1.656 | 1.023–2.543 | 0.956 |
| TNM stage (III + IV
vs. I + II) | 1.758 | 0.984–2.197 | 0.032a | 0.649 | 0.284–0.914 | 0.016a |
| Lymph node
metastasis (+ vs. −) | 1.233 | 0.824–1.860 | 0.004a | 0.418 | 0.240–1.048 | 0.608 |
| FOSB expression
(Low vs. high) | 0.332 | 0.204–0.605 | <0.001a | 0.430 | 0.324–0.695 | <0.001a |
Discussion
Gastric cancer has one of the highest incidence
rates in the world, and the 5-year survival rate of is less than
20–25% in China because of frequent relapse and high metastasis
rate postoperatively (16), and
most patients present advanced disease at diagnosis making its
treatment very intricate (17). It
is widely accepted that early diagnosis and treatment are keys for
better clinical outcome in patients with gastric cancer (18). There have been many advances in
diagnostics and therapeutics in GC, however, dismal prognosis,
despite these improvements, still persist (19). Many cancer-related molecules have
been characterized with the goal of developing novel anticancer
therapies, including targeted drugs or antibodies and cancer
vaccines (20). FosB is known as a
kind of the biological markers, but there is no related report on
FOSB in GC.
FOSB is a member of the Fos gene family. It is
activated by growth factors and is a nuclear protein of 338-amino
acids that shows 70% homology with Fos. Furthermore, like Fos, it
forms complexes with the Jun-family of transcription factors 8,
suggesting that it is involved in regulating gene expression
(6). Together with the Jun family
members, the Fos family of transcription factors form the group of
AP-1 proteins which, after dimerization, bind to so-called
TPA-responsive elements in the promoter and enhancer regions of
target genes (21). In contrast to
Jun proteins, Fos family members are not able to form homodimers,
but heterodimerize with Jun partners, giving rise to various
trans-activating or trans-repressing complexes with different
biochemical properties (22). AP-1
in turn controls a number of cellular processes including
differentiation, proliferation and apoptosis (7). To further analyze the role of the
FOSB transcription factor in GC and to explore whether the level of
FOSB expression is involved in GC cell viability, proliferation and
migration, we used immunohistochemistry on paraffin sections of 116
gastric carcinomas. According to our new measurements, we
demonstrated that FOSB was expressed higher in adjacent
non-cancerous tissues than in GC tissues. In addition, we also
found that a downregulated expression of FOSB was markedly
connected with advanced TNM stage, poor differentiation and lymph
node metastasis. Thus, the abnormal expression of FOSB might be
involved in GC tumor progression and metastasis, and we speculated
that FOSB may play a tumor suppressor role in GC. Subsequently,
qPCR and western blot analysis were used to find that FOSB
expression was decreased at the mRNA and protein levels in most
cancer tissues compared to their adjacent non-cancerous tissues.
Moreover, we showed that the viability, proliferation and migration
in vitro of MKN45 cells were observably inhibited by
overexpression of FOSB, whereas knockdown of FOSB expression
promoted the viability, proliferation and migration of SGC7901
cells in vitro. Furthermore, it is well known that a high
prevalence of H. pylori is always accompanied by a high
incidence of gastric cancer (23).
One study demonstrates that H. pylori positivity is a
beneficial prognostic indicator in patients with gastric cancer
(24). However, in the present
study, there was no significant discrepancy in the expression of
FOSB in the patients with and without H. pylori
infection.
In accordance with the Kaplan-Meier survival, it
showed that low FOSB expression had significant relationship with
shorter survival time of GC patients. Multivariate analysis
suggested that in patient overall survival, FOSB expression was an
independent prognostic indicator. Moreover, in a study on human
keratinocytes, the calcium-induced differentiation and expression
of the differentiation marker involucrin was accompanied by an
increase of FOSB and a decrease of Fra-1 expression (13). Regarding the functional differences
between Fos family members, FOSB is the only AP-1 protein which
cannot bind and inactivate glucocorticoid receptors (25). Vice versa, unlike other AP-1 family
members, FOSB proteins cannot be blocked by GR proteins which are
expressed in the epithelial cells of terminal lobular units and
which play a role in the differentiation of mammary epithelial
cells (26,27). The knowledge on FOSB is still not
complete, thus, further research on the effect of FOSB will be
necessary. The mechanisms which lead to the downregulated
expression of FOSB in GC patients still require further
investigation.
The above data show that the downregulated
expression of FOSB is involved in tumor progression of GC patients
and might represent a prognostic indicator. Thus, extra experiments
will be necessary to prove this hypothesis and that FOSB may play a
useful role in new therapeutic interventions in GC patients.
References
|
1
|
Ajani JA, Bentrem DJ, Besh S, D’Amico TA,
Das P, Denlinger C, Fakih MG, Fuchs CS, Gerdes H, Glasgow RE, et
al; National Comprehensive Cancer Network. Gastric cancer, version
2.2013: Featured updates to the NCCN Guidelines. J Natl Compr Canc
Netw. 11:531–546. 2013.PubMed/NCBI
|
|
2
|
Lin Y, Ueda J, Kikuchi S, Totsuka Y, Wei
WQ, Qiao YL and Inoue M: Comparative epidemiology of gastric cancer
between Japan and China. World J Gastroenterol. 17:4421–4428. 2011.
View Article : Google Scholar : PubMed/NCBI
|
|
3
|
Howlett M, Menheniott TR, Judd LM and
Giraud AS: Cytokine signalling via gp130 in gastric cancer. Biochim
Biophys Acta. 1793:1623–1633. 2009. View Article : Google Scholar : PubMed/NCBI
|
|
4
|
Siderovski DP, Blum S, Forsdyke RE and
Forsdyke DR: A set of human putative lymphocyte
G0/G1 switch genes includes genes homologous
to rodent cytokine and zinc finger protein-encoding genes. DNA Cell
Biol. 9:579–587. 1990. View Article : Google Scholar : PubMed/NCBI
|
|
5
|
Martin-Gallardo A, McCombie WR, Gocayne
JD, FitzGerald MG, Wallace S, Lee BM, Lamerdin J, Trapp S, Kelley
JM, Liu LI, et al: Automated DNA sequencing and analysis of 106
kilobases from human chromosome 19q13.3. Nat Genet. 1:34–39. 1992.
View Article : Google Scholar : PubMed/NCBI
|
|
6
|
Zerial M, Toschi L, Ryseck RP, Schuermann
M, Müller R and Bravo R: The product of a novel growth factor
activated gene, fos B, interacts with JUN proteins enhancing their
DNA binding activity. EMBO J. 8:805–813. 1989.PubMed/NCBI
|
|
7
|
Hess J, Angel P and Schorpp-Kistner M:
AP-1 subunits: Quarrel and harmony among siblings. J Cell Sci.
117:5965–5973. 2004. View Article : Google Scholar : PubMed/NCBI
|
|
8
|
Krosl J and Sauvageau G: AP-1 complex is
effector of Hox-induced cellular proliferation and transformation.
Oncogene. 19:5134–5141. 2000. View Article : Google Scholar : PubMed/NCBI
|
|
9
|
Mechta F, Lallemand D, Pfarr CM and Yaniv
M: Transformation by ras modifies AP1 composition and activity.
Oncogene. 14:837–847. 1997. View Article : Google Scholar : PubMed/NCBI
|
|
10
|
Pospelova TV, Medvedev AV, Kukushkin AN,
Svetlikova SB, van der Eb AJ, Dorsman JC and Pospelov VA: E1A +
cHa-ras transformed rat embryo fibroblast cells are characterized
by high and constitutive DNA binding activities of AP-1 dimers with
significantly altered composition. Gene Expr. 8:19–32.
1999.PubMed/NCBI
|
|
11
|
Chung JY, Huang C, Meng X, Dong Z and Yang
CS: Inhibition of activator protein 1 activity and cell growth by
purified green tea and black tea polyphenols in H-ras-transformed
cells: Structure-activity relationship and mechanisms involved.
Cancer Res. 59:4610–4617. 1999.PubMed/NCBI
|
|
12
|
Darne C, Martinez A, Lallemand D, Morel L,
Jean C, Saru JP, Schmid HP and Manin M: Down-regulation of AP1
activities after polarization of vas deferens epithelial cells
correlates with androgen-induced gene expression. J Steroid Biochem
Mol Biol. 72:103–113. 2000. View Article : Google Scholar : PubMed/NCBI
|
|
13
|
Ng DC, Shafaee S, Lee D and Bikle DD:
Requirement of an AP-1 site in the calcium response region of the
involucrin promoter. J Biol Chem. 275:24080–24088. 2000. View Article : Google Scholar : PubMed/NCBI
|
|
14
|
Milde-Langosch K, Kappes H, Riethdorf S,
Löning T and Bamberger AM: FosB is highly expressed in normal
mammary epithelia, but down-regulated in poorly differentiated
breast carcinomas. Breast Cancer Res Treat. 77:265–275. 2003.
View Article : Google Scholar : PubMed/NCBI
|
|
15
|
Kim JH, Lee JY, Lee KT, Lee JK, Lee KH,
Jang KT, Heo JS, Choi SH and Rhee JC: RGS16 and FosB underexpressed
in pancreatic cancer with lymph node metastasis promote tumor
progression. Tumour Biol. 31:541–548. 2010. View Article : Google Scholar : PubMed/NCBI
|
|
16
|
Wang J, Yu JC, Kang WM and Ma ZQ:
Treatment strategy for early gastric cancer. Surg Oncol.
21:119–123. 2012. View Article : Google Scholar
|
|
17
|
Mahar AL, Coburn NG, Singh S, Law C and
Helyer LK: A systematic review of surgery for non-curative gastric
cancer. Gastric Cancer. 15(Suppl 1): S125–S137. 2012. View Article : Google Scholar
|
|
18
|
Piazuelo MB and Correa P: Gastric cáncer:
Overview. Colomb Med (Cali). 44:192–201. 2013.
|
|
19
|
Jemal A, Bray F, Center MM, Ferlay J, Ward
E and Forman D: Global cancer statistics. CA Cancer J Clin.
61:69–90. 2011. View Article : Google Scholar : PubMed/NCBI
|
|
20
|
van Seventer GA, Salmen HJ, Law SF,
O’Neill GM, Mullen MM, Franz AM, Kanner SB, Golemis EA and van
Seventer JM: Focal adhesion kinase regulates beta1
integrin-dependent T cell migration through an HEF1 effector
pathway. Eur J Immunol. 31:1417–1427. 2001. View Article : Google Scholar : PubMed/NCBI
|
|
21
|
Milde-Langosch K: The Fos family of
transcription factors and their role in tumourigenesis. Eur J
Cancer. 41:2449–2461. 2005. View Article : Google Scholar : PubMed/NCBI
|
|
22
|
Ryseck RP and Bravo R: c-JUN, JUN B, and
JUN D differ in their binding affinities to AP-1 and CRE consensus
sequences: Effect of FOS proteins. Oncogene. 6:533–542.
1991.PubMed/NCBI
|
|
23
|
Yamaoka Y, Kato M and Asaka M: Geographic
differences in gastric cancer incidence can be explained by
differences between Helicobacter pylori strains. Intern Med.
47:1077–1083. 2008. View Article : Google Scholar : PubMed/NCBI
|
|
24
|
Wang F, Sun GP, Zou YF, Zhong F, Ma T, Li
XQ and Wu D: Helicobacter pylori infection predicts favorable
outcome in patients with gastric cancer. Curr Oncol. 20:e388–e395.
2013. View Article : Google Scholar : PubMed/NCBI
|
|
25
|
Lucibello FC, Slater EP, Jooss KU, Beato M
and Müller R: Mutual transrepression of Fos and the glucocorticoid
receptor: Involvement of a functional domain in Fos which is absent
in FosB. EMBO J. 9:2827–2834. 1990.PubMed/NCBI
|
|
26
|
Angel P and Karin M: The role of Jun, Fos
and the AP-1 complex in cell-proliferation and transformation.
Biochim Biophys Acta. 1072:129–157. 1991.PubMed/NCBI
|
|
27
|
Rosen JM, Zahnow C, Kazansky A and Raught
B: Composite response elements mediate hormonal and developmental
regulation of milk protein gene expression. Biochem Soc Symp.
63:101–113. 1998.PubMed/NCBI
|