Introduction
Ovarian cancer is one of the most aggressive and
lethal types of gynecological cancer. Worldwide, it was responsible
for an estimated 152,000 deaths in 2012 (1). At present, the standard treatment for
patients with ovarian cancer comprises of maximum surgical
debulking, which is then followed by adjuvant chemotherapy,
entailing a combination of a platinum compound with a taxane
(2–4). However, the great majority of ovarian
cancer cases are diagnosed in patients at an advanced stage of the
disease and they have a poor response to currently available
therapeutic interventions. As a result, the 5-year survival rates
for ovarian cancer patients who are diagnosed at stages I/II and
III/IV is 90 and 20–40% respectively (2,5).
This highlights the urgent need for the development of novel and
more effective therapeutic agents with different mechanisms of
action, and the identification of biomarkers for use in the early
detection of such cancers and for the selection of relevant patient
populations who may benefit from such therapeutic interventions
(3,6–8).
Since the early 1980s, aberrant expression and
activation of human epidermal growth factor receptor (EGFR), which
is the prototype of the type I growth factor receptor family (also
known as ErbB/HER family), has been reported in a wide range of
human cancers (9–11). The EGFR transmits the mitogenic
action of seven ligands including EGF, TGFα, HB-EGF, amphiregulin,
BTC, and AREG. The binding of ligands to the extracellular domain
of the EGFR results in the formation of EGFR homo-dimerisation or
its heterodimerisation with the other three members of the EGFR
family, which include HER-2 (Neu, c-ErbB-2), HER-3 (ErbB-3) and
HER-4 (ErbB-4), the autophosphorylation of such receptor, and
ultimately leading to activation of several downstream
adaptor/signaling molecules including the ras/raf/MAPK, PI3K/Akt,
PLC-Y and JAK/STAT pathways. Such biochemical signaling in turn
sets off the cancer hallmark which include increased tumour cell
proliferation and migration and invasion (12–15).
Increased expression and activation of HER family
members have been reported in a wide range of epithelial tumours,
including ovarian cancer, and in some ovarian cancer studies they
have been associated with a poorer prognosis (16–19).
To date, several monoclonal antibodies and small molecule tyrosine
kinase inhibitors specific for the HER members have been approved
for the treatment of patients with colorectal, head and neck,
breast, stomach, lung and pancreatic cancers (11,20).
However, none of these inhibitors has yet been approved for the
treatment of ovarian cancers, and this may be due the heterogeneous
nature of ovarian cancer and the lack of reliable biomarkers for
response to such therapeutic interventions (21–26).
Moreover, in some studies the presence of a small subpopulation of
tumour cells, called cancer stem cells, is thought to be
responsible for the poor response and the development of resistance
to therapeutic interventions (27–29).
Therefore, in this study, we investigated the
sensitivity of a large panel of human ovarian cancer cell lines to
treatment with various forms of EGFR TKIs including reversible EGFR
specific, and reversible and irreversible pan-ErbB family
inhibitors. In addition, we determined the effect of other
inhibitors including dasatinib (v-abl/src/c-Kit TKI), imatinib
(v-abl/c-Kit/PDGFR TKI), NVP-AEW541 (IGF-1R inhibitor), crizotinib
(C-met/Alk inhibitor) and cytotoxic agents (paclitaxel, cisplatin
and doxorubicin) on the growth of the ovarian cancer cells, and
whether there was any association between the expression of various
biomarkers such as putative ovarian cancer stem cell (CSC) markers
(e.g., CD24, CD44, CD117/c-Kit), P-glycoprotein (P-gp), and HER
family members and their responses to treatment with these
agents.
Materials and methods
Tumour cell lines
Of ten human ovarian tumour cell lines examined in
this study, SW626, PA1, ES2, Caov3 and Ovcar-3 were purchased from
American Type Culture Collection (Manassas, VA, USA) and SKOV3,
Cov318, A2780, A2780CIS and A2780ADR were
purchased from the European Collection of Cell Culture (Porton
Down, UK). Caov3, SKOV3, Cov318, PA1 and ES2 were cultured in
Dulbecco's modified Eagle's medium (DMEM) (Sigma, UK), A2780,
A2780CIS, A2780ADR and Ovcar-3 in Roswell
Park Memorial Institute-1640 medium (RPMI-1640) (Sigma), and SW626
cells in Liebovitz's L-15 medium (L-15). All media were
supplemented with 10% fetal calf serum (FCS) (Sigma) and the
antibiotics penicillin, streptomycin, neomycin. All RPMI and
Liebovitz medium were also supplemented with glutamine (Sigma).
Drug-resistant cell lines A2780CIS and
A2780ADR were also supplemented with cisplatin (1 μM,
2–3 passages) and doxorubicin (100 nM, once a week) respectively to
maintain their resistant phenotype.
Antibodies, tyrosine kinase inhibitors,
and other reagents
The IGF-1R TKI NVP-AEW541, the reversible EGFR TKI
erlotinib (OSI-774), and irreversible pan-HER family blocker
afatinib (BIBW2992) were kindly provided by Novartis (Switzerland),
OSI Pharmaceuticals (Farmingdale, NY, USA), Boehringer Ingelheim
(Austria) respectively. Sapitinib (AZD8931), lapatinib (GW-572016
ditosylate), canertinib (CI-1033), imatinib, dasatinib and
neratinib (HKI-272) were purchased from Selleckhem (Suffolk, UK),
crizotinib and gefitinib (Tocris, Bristol/Macclesfield, UK). The
cytotoxic drugs paclitaxel, doxorubicin and cisplatin and the mouse
anti-EGFR mAb F4 were purchased from Sigma-Aldrich (Dorset, UK).
The mouse monoclonal antibodies against HER-3 (MAB3481), HER-4
(MAB11311), IGF-IR (MAB391), ALK (MAB77491), and HGF R/c-MET
(MAB3583) were purchased from R&D Systems (Oxford, UK) and
those against CD24 (55426), CD44 (555476), CD117/c-Kit (555713) and
P-glycoprotein (557001) were purchased from Becton-Dickinson Ltd.,
(Oxford, UK) respectively. The primary in-house mouse antibodies
HM50.67A and HM43.16B were raised against the external domain of
HER-2 and EGFR respectively (30).
The mouse anti-IGF-IR and the rabbit anti-pIGF-1R antibodies were
purchased from Insight Biotechnology (Middlesex, UK). The mouse
phosphor-Ty-100 and the rabbits anti-phosphor-EGFR, HER-2,
phosphor-HER-2, HER-3, phosphor-HER-3, phosphor-HER-4, HER-4, MAPK,
phosphor-MAPK, Akt, phosphor-Akt, Met, phospho-Met, Stat-3,
phosphor-stat-3, Stat-5, phospho-stat-5, β-actin, and
CD44+ were all purchased from Cell Signaling Technology
(Hitchin, UK). The anti-mouse IgG FITC conjugated STAR9B was from
Serotec Ltd. (Oxford, UK), and the alkaline phosphatase conjugated
goat anti-mouse IgG and anti-rabbit IgG were from Fisher Scientific
Ltd. (Loughborough, UK). The donkey anti-rabbit IgG IRDye 680RD and
goat anti-mouse IgG IRDye 800CW were purchased from LI-COR Ltd.
(Cambridge, UK).
Flow cytometry
The cell surface expression of the HER family
members, IGF-IR, ALK, c-MET, putative CSC and P-glycoprotein
markers was determined using flow cytometry, as described
previously (31). Briefly,
~1×10⁶ cells in 1 ml of 2% FBS medium were incubated in
the presence of primary mouse antibody or control medium for 1 h by
rotation at 4°C. The tumour cells were then washed three times by
centrifugation, and then incubated in the presence of the
FITC-conjugated rabbit anti-mouse IgG secondary antibody for 1 h by
rotation at 4°C. Cells were again washed three times by
centrifugation, and the cell pellet was finally re-suspended in
FACS Flow buffer (Becton-Dickinson). A minimum of 10,000 events
were recorded through excitation with an argon laser at 488 nm and
data were analysed using the FITC detector (at 525 nm) of BD
FacsCalibur flow cytometer (Becton-Dickinson), and mean
fluorescence intensity values were calculated using CellQuest pro
software (Becton-Dickinson).
Growth response studies
The effect of the various agents on the growth of
human ovarian cancer cell lines was determined using the
sulforhodamine B (SRB) colourimetric assay (Sigma-Aldrich), as
described previously (31).
Briefly, tumour cells were seeded at a density of 5,000 cells per
well in 100 μl of growth medium supplemented with 2% FBS in a
96-well plate. Following 4-h incubation at 37°C, 100 μl aliquots of
doubling dilutions of the drugs or control medium (i.e., without
drug) were added to triplicate wells. Cells in the 96-well plates
were then incubated at 37°C until cells in the wells containing the
control medium were almost confluent. Tumour cells were then fixed
with 10% trichloroacetic acid (TCA) for 1 h and were gently washed
with tap water, air-dried for ~24 h, and then stained with 0.04%
sulforhodamine B (SRB) in 1% acetic acid for further 1 h. Each
plate was then washed with 1% acetic acid, air dried overnight and
the SRB stain was solubilized by adding 100 μl of 10 mM Tris-base
per well. The absorbance of each well was measured at 565 nm using
the Epoch plate reader (Thermo Fisher, UK). To determine the
initial number of cells prior to treatment, an extra plate of cells
was set up and processed under the same condition after 4-h
incubation at 37°C without the drugs. Growth as percentage of
growth of control was determined through the following formula: %
Growth = B−A/C−A × 100, where A = A565 nm before treatment, B =
A565 nm after treatment with drugs, and C = A565 nm after medium
(32). The IC50 value
of each agent was determined using Gen5 software (BioTek, UK).
Determination of combination index
The effect of two agents, when used in combination,
on the growth of ovarian cells was determined, using the
combination index (CI) as described previously (32). Briefly, the drugs for each
combination were mixed at 8X their IC50 value followed
by 8 doubling dilutions (32).
Data analysis was then performed using CalcuSyn software (Biosoft,
UK). The combination index values <0.9 indicates synergistic
effect, while CI values between 0.90–1.10 indicates an additive
effect and CI values >1.1 denotes antagonistic effect.
Western blot analysis
Tumour cells were grown to near confluency in 6-well
culture plates containing 5 ml of 10% FBS growth medium. Cells were
washed once with 5 ml of 0.5% FCS/medium and then incubated in 5 ml
of fresh 0.5% medium containing no drug (control), a TKI, or a
cytotoxic drug for 24 h at 37°C, prior to treatment with the HER
ligand heregulin (20 nM) (R&D Systems) for 15 min at 37°C.
Tumour cells were then lysed in 400 μl of lysis buffer (Invitrogen,
Paisley, UK) containing the cocktail protease inhibitor
(Sigma-Aldrich). Cell lysates were heated to 75°C for 10 min, then
30 μl of protein samples (30 μg) were separated on 4–12% Bis-Tris
gels (Invitrogen) and transferred onto polyvinylidene difluoride
(PVDF) membranes using the XCell II Mini-Cell Blot Module kit
(Invitrogen). PVDF membranes were probed with antibodies using SNAP
i.d systems (Millipore, Watford, UK). Signal for all were detected
using either the Western Breeze chemiluminescence kit
(alkaline-phosphatase conjugated secondary antibody, Invitrogen)
and visualized by the G-box imaging system (Syngene, Cambridge UK)
or a fluorescence conjugated secondary antibody (LI-COR Ltd) and
visualized by the accompanying software, LI-COR Image Studio.
Cell cycle distribution analysis
The effect of various agents on the cell cycle
distribution of ovarian cancer cell lines was determined using flow
cytometry as described previously (32). Approximately 2.5×10⁵
cells were seeded into 25 cm2 culture flasks containing
10 ml of 2% FBS growth medium plus no drug (control medium) or an
agent. Once the cells containing medium only were almost confluent
in the control flasks, the cells were harvested and pooled together
with the cell supernatant, and washed three times with cold PBS.
The final cell pellet was re-suspended in 200 μl of cold PBS, and
permeabilised by the addition of cold 70% ethanol overnight at 4°C.
The tumour cells were then washed once with PBS and incubated with
0.5 ml of PI/RNAse mix (Becton-Dickinson) for ~35 min at room
temperature. The PI-stained tumour cells were then excited at 488
nm using the FL-3 detector (620 nM) of a BD FACsCalibur flow
cytometer (Becton-Dickinson), and analysed using CellQuest Pro
software (Becton-Dickinson).
Migration assay
The cell migration assay was conducted using the
IncuCyte Clear View 96-well cell migration plate according to the
manufacturer's instructions (Essen Bioscience Ltd., Hertfordshire,
UK). Briefly, ~1×10³ tumour cells plus the treatment in
total volume of 60 μl 0.5% FBS medium were added into Clear View
96-well insert. Each cell plate was then left to settle at the room
temperature for 15 min followed by incubation for a further 30 min
at 37°C. Then 200 μl of medium containing 10% FBS (chemoattractant)
was added to the lower chamber. The cell plate was then placed onto
the IncuCyte Zoom® instrument and were left for 15 min
at 37°C to settle. After careful removal of any condensation on the
lid or bottom of the reservoir, each plate was returned into
IncuCyte Zoom instrument with a 10× objective using the IncuCyte™
chemotaxis system. Chamber wells were analysed every 3 h using the
IncuCyte chemotaxis software.
Statistical analysis
Linear regression was used to analyse the
relationship between the expression of the HER family receptors in
response to treatment with afatinib, erlotinib, crizotinib,
NVP-AEW541 and cytotoxic drugs. A one-way analysis of variance
(ANOVA) test was used to compare mean values between more than two
groups. Data are presented as mean ± SD. P<0.05 was considered
statistically significant.
Results
Growth factor receptors and putative
cancer stem cell marker expression in ovarian cancer cells
The cell surface expression of HER-family members
(EGFR/HER-1, HER-2/neu, HER-3 and HER-4) was determined by FACS
analysis. Of the 10 ovarian cell lines examined, SW626, ES2, SKOV3,
and Caov3 were moderately positive for the EGFR with the mean
fluorescence intensity (MFI) values of 10, 15, 15 and 40, and
respectively (Table I). Of the
seven HER-2 positive cancer cell lines, HER-2 overexpression was
only detected in SKOV3 cells (MFI=574) (Table I). SKOV3 cells were also found to
be positive for the expression of IGF-IR and c-MET. In contrast,
all ovarian tumour cell lines had undetectable levels of both HER-3
and HER-4. The highest level of IGF-IR, ALK and c-MET were present
in A2780CIS (MFI=13), Cov318 (MFI=11), and Cov318
(MFI=24) (Table I). Of the
putative cancer stem cell markers, 5 cell lines were CD24-positive,
with the highest level of CD24 expression in SKOV3 cells (MFI=440),
and 6 cells lines were CD44-positive with the highest level of CD44
in ES2 (MFI=1,105). Finally, none of the ovarian cancer cell lines
had overexpression of P-glycoprotein and all were found to be
CD117/c-Kit-negative (Table
I).
 | Table IThe cell surface expression of HER
family members, IGF-1R, ALK, c-MET and putative ovarian cancer stem
cell markers measured by FACS analysis in human ovarian cancer cell
lines.a |
Table I
The cell surface expression of HER
family members, IGF-1R, ALK, c-MET and putative ovarian cancer stem
cell markers measured by FACS analysis in human ovarian cancer cell
lines.a
|
Mean
fluorescence intensity (MFI) |
|---|
|
|
|---|
| Cell line | Control | EGFR | HER-2 | HER-3 | HER-4 | IGF-IR | ALK | c-MET | CD24 | CD44 | CD117/C-Kit | P-glycoprotein |
|---|
| ES2 | 2.2±0.1 | 15±6.0 | 2.6±0.2 | 2.4±0.0 | 2.5±0.1 | 9.3±2.1 | 4.1±1.6 | 2.7±0.9 | 2.4±0.1 | 1,105±91 | 2.3±0.2 | 3.5±0.2 |
| PA1 | 2.6±0.3 | 2.4±0.1 | 6.5±4.2 | 2.8±0.4 | 2.8±0.2 | 10±2.4 | 2.8±0.3 | 2.5±0.2 | 67±43 | 101±53 | 2.8±0.5 | 4.5±1.3 |
| SKOV3 | 2.1±0.0 | 15±7 | 576±13 | 2.5±0.3 | 2.2±0.7 | 7.5±2.0 | 2.9±1.4 | 7.7±2.7 | 440±12 | 581±92 | 2.8±0.5 | 3.0±0.5 |
| Caov3 | 2.1±0.0 | 40±6.5 | 11±1.2 | 5.2±0.0 | 2.1±0.3 | 4.2±0.5 | 1.4±0.5 | 11±3.2 | 59±31 | 38±10 | 2.2±0.1 | 3.5±1.4 |
| Cov318 | 2.4±0.2 | 5.1±0.1 | 6.8±1.0 | 2.1±0.5 | 3.4±0.4 | 8.7±2.9 | 11±2.9 | 24±12 | 4.7±0.2 | 6.1±4.5 | 2.7±0.3 | 4.9±1.9 |
| SW626 | 2.5±0.2 | 10.±0.2 | 3.8±0.4 | 3.7±0.7 | 2.6±0.4 | 4.4±1.4 | 4.0±0.4 | 14±0.0 | 31±0.2 | 72±10 | 2.2±0.0 | 4.1±1.7 |
| Ovcar-3 | 2.5±0.3 | 4.8±1.3 | 6.7±0.0 | 2.6±0.2 | 1.7±0.0 | 3.1±0.2 | 2.3±1.0 | 3.9±1.0 | 192±35 | 8.0±2.5 | 2.3±0.2 | 4.4±1.5 |
| A2780 | 2.4±0.3 | 2.2±0.0 | 2.3±0.1 | 3.8±1.7 | 3.3±0.6 | 5.0±1.9 | 2.4±0.1 | 2.0±0.7 | 4.3±0.3 | 2.2±0.1 | 2.4±0.5 | 4.5±0.1 |
| A2780ADR | 2.5±0.2 | 3.0±0.0 | 7.2±1.1 | 2.2±0.9 | 2.5±0.8 | 4.1±1.4 | 2.0±1.2 | 2.0±1.2 | 3.6±1.5 | 2.2±0.1 | 2.1±0.1 | 5.5±1.2 |
| A2780CIS | 2.6±0.4 | 3.8±0.7 | 11±4.7 | 2.4±0.5 | 2.4±1.2 | 13±0.0 | 3.4±0.2 | 2.9±2.5 | 2.7±0.3 | 3.2±1.3 | 2.3±0.3 | 4.4±1.7 |
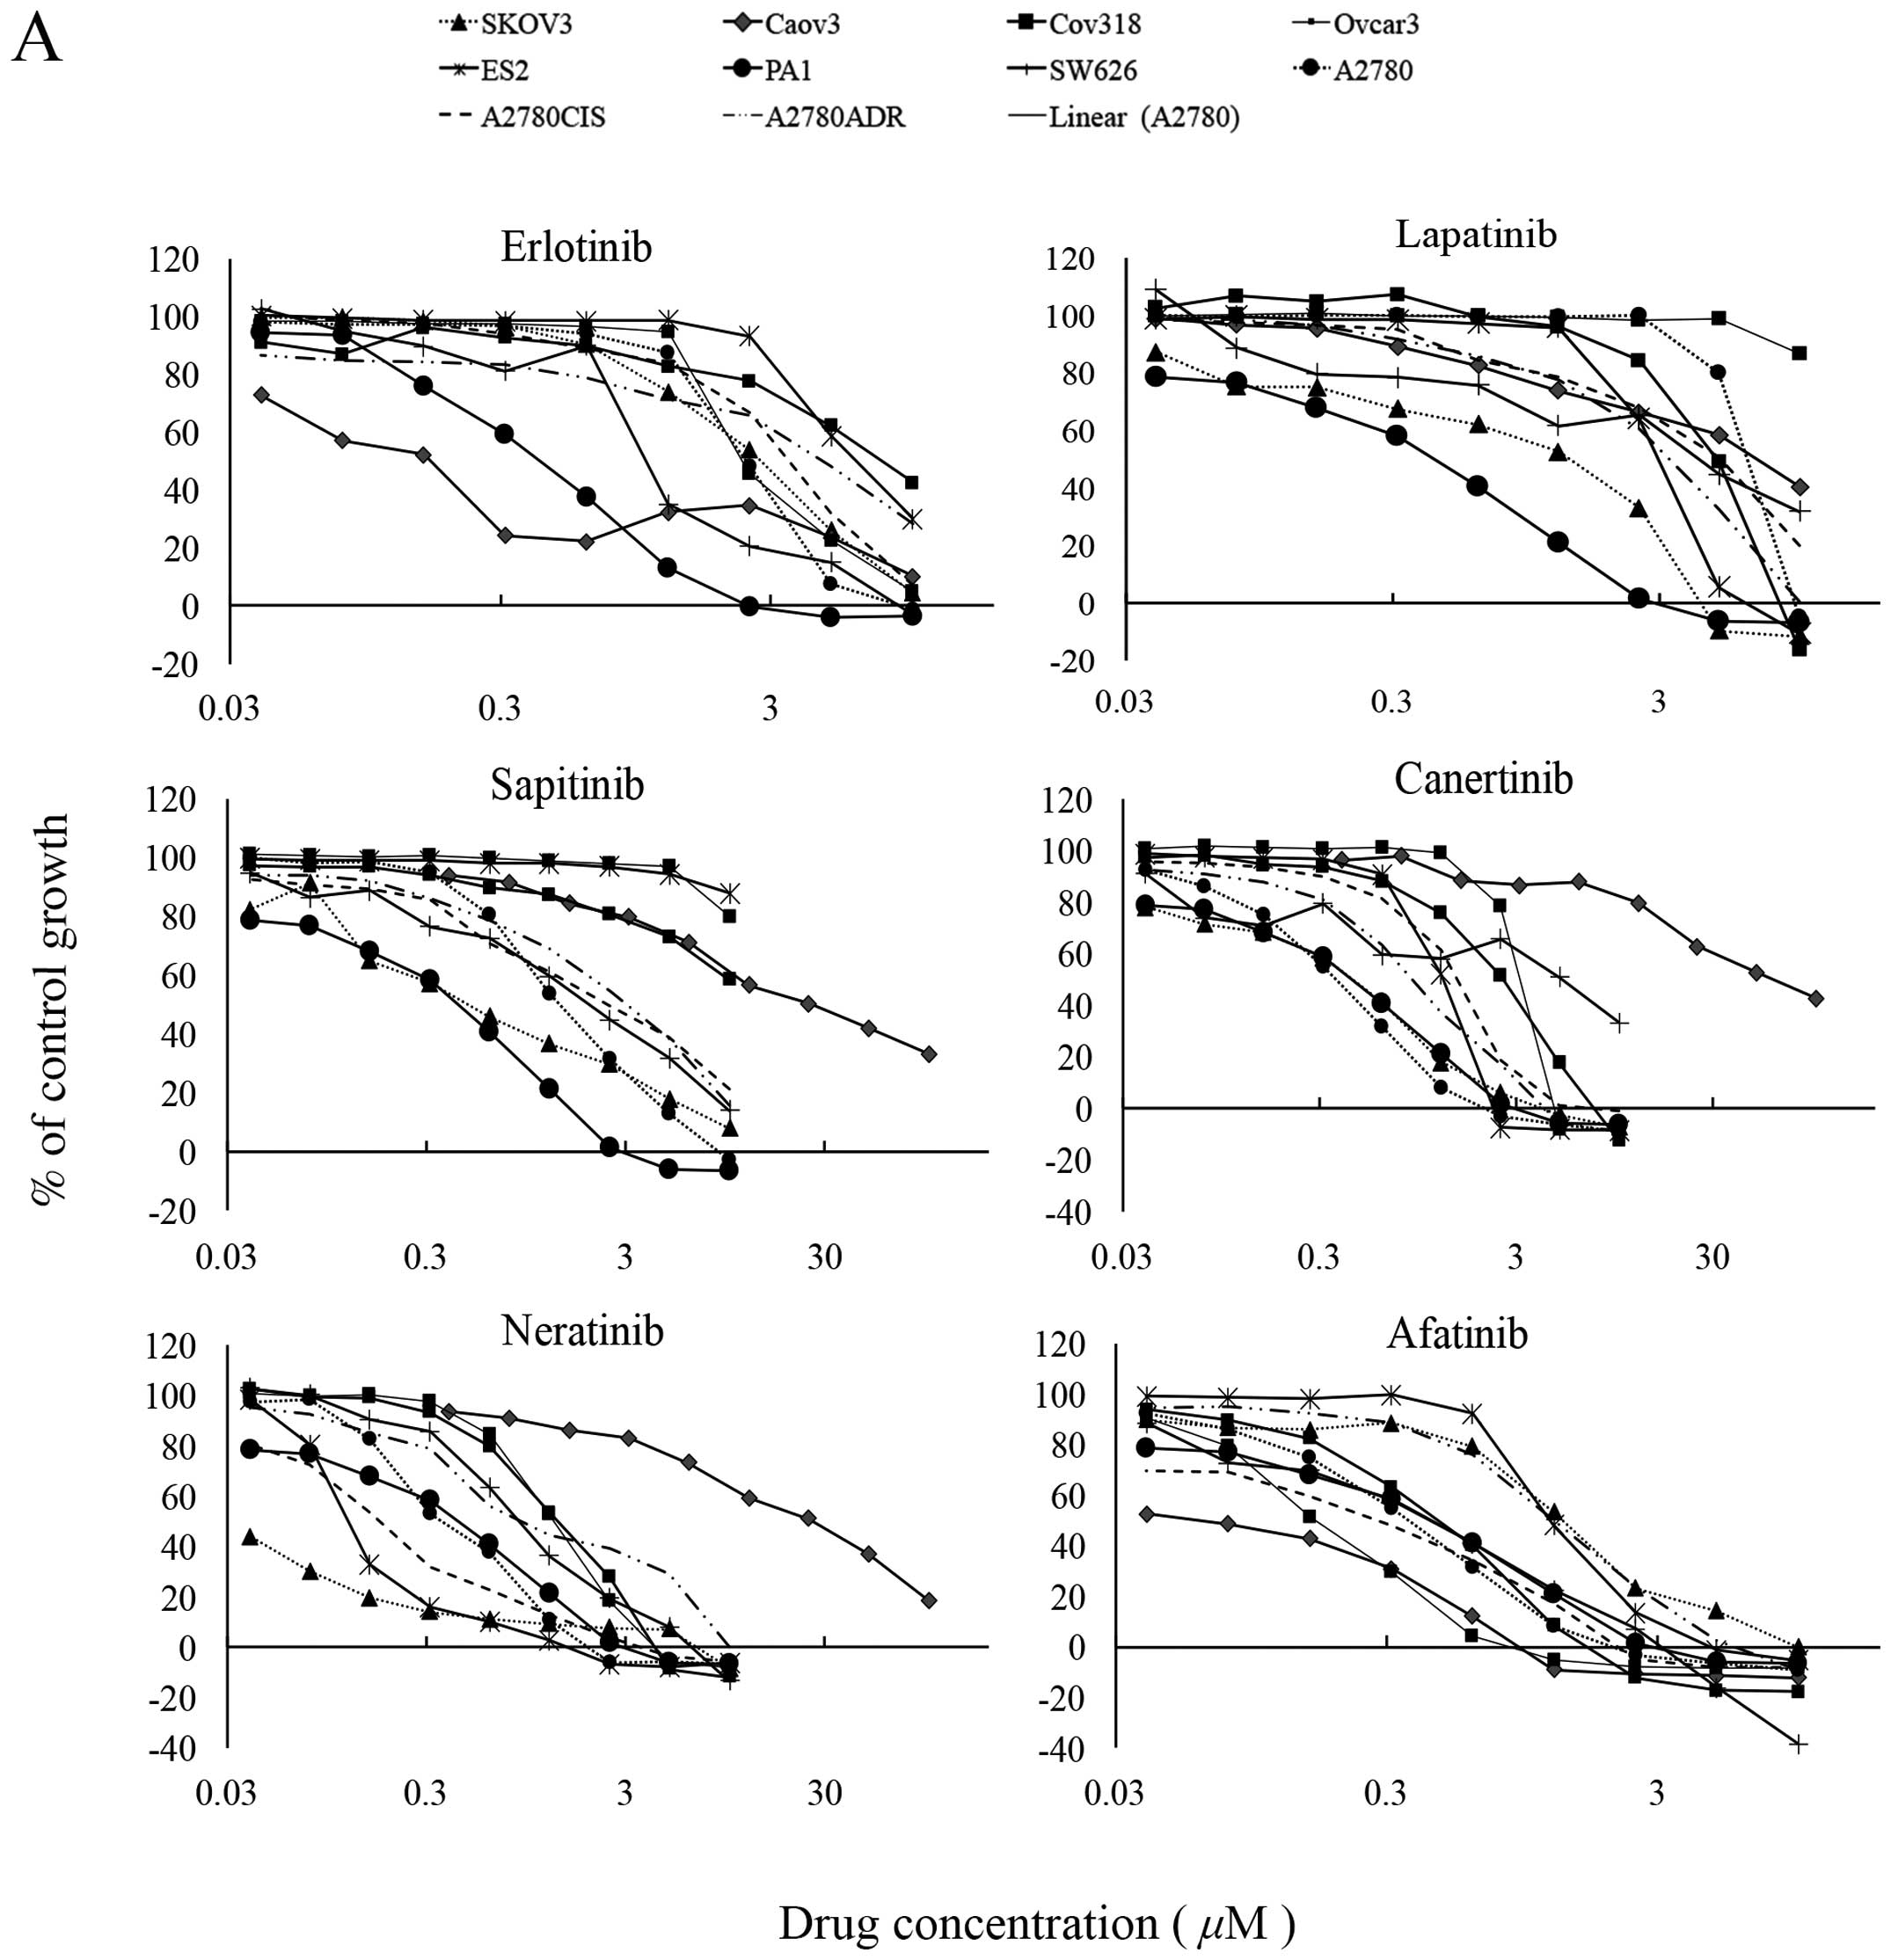
The irreversible pan-HER inhibitors were
more effective than the reversible EGFR inhibitors at inhibiting
the growth of ovarian cancer cells
Of the TKIs, the two reversible EGFR TKI gefitinib
and erlotinib inhibited the growth of 6 and all 10 ovarian cancer
cell lines with IC50 values ranging from 1.82 nM (Caov3)
to 5.5 μM (A2780), and 152 nM (Caov3) to 9.6 μM
(A2780ADR) respectively (Table I). The reversible dual EGFR/HER-2
lapatinib inhibited the growth of 9 cancer cell lines, with
IC50 values ranging from 1.42 nM (SKOV3) to 5.28 μM
(A2780). At cutoff value of 10 μM, the reversible EGFR/HER-2/HER-3
TKI sapitinib was less effective than the irreversible pan-HER
family blockers (i.e., canertinib, neratinib and afatinib) at
inhibiting the growth of ovarian cancer cells, and its
IC50 values were >10 μM for three ovarian cancer cell
lines ES2, Cov318 and Ovcar-3 (Table
II and Fig. 1A). Canertinib,
neratinib and afatinib were the best cytotoxic HER TKIs and they
inhibited the growth of all ovarian cancer cells with
IC50 values ranging from 57.6 nM (Caov3) to 3.55 μM
(SW626), 1.38 nM (Cov318) to 927 nM (SW626), and 83 nM (Caov3) to
1.4 μM (ES2) respectively (Table
II and Fig. 1A). At nM
concentration, the IGF-IR TKI NVP-AEW541 was only effective at
inhibiting the growth in vitro of PA1 cells
(IC50=79.3 nM). The ALK/c-MET inhibitor crizotinib
inhibited the growth of all ovarian cancer cell lines with
IC50 values ranging from 162 nM (PA1) to 2.7 μM
(A2780ADR). Interestingly, the majority of ovarian
cancer cells were highly sensitive to treatment with dasatinib with
IC50 values of <26 nM, but all were relatively
resistant to treatment with imatinib (i.e., IC50 value
>10 μM, Table II and Fig. 1B). Of the three cytotoxic drugs
used in this study, paclitaxel was the most effective agent at
inhibiting the proliferation of ovarian cancer cell lines
[IC50 range: 102 pM (Caov3) to 278 nM (Ovcar-3)],
followed by doxorubicin. Interestingly, the great majority of
ovarian cancer cells were relatively resistant to treatment with
cisplatin and had an IC50 >20 μM (Table II and Fig. 1B).
| Table IIIC50 values for various
types of HER TKIs (A), and other TKIs and cytotoxic agents (B) in
human ovarian cancer cell lines. |
Table II
IC50 values for various
types of HER TKIs (A), and other TKIs and cytotoxic agents (B) in
human ovarian cancer cell lines.
| A, IC50
values for various types of HER TKIs |
|---|
|
|---|
| Cell lines | Gefitinib | Erlotinib | Lapatinib | Sapitinib | Canertinib | Neratinib | Afatinib |
|---|
| ES2 | >10 μM | 5.6 μM | 2.9 μM | >10 μM | 1.4 μM | 125 nM | 1.4 μM |
| PA1 | 5.3 nM | 420 nM | 2.2μM | 4.4 μM | 1.1 μM | 458 nM | 555 nM |
| SKOV3 | 2.3 μM | 2.4 μM | 1.4 nM | 584 nM | 449 nM | 23 nM | 1.4 μM |
| CAOV3 | 1.8 nM | 152 nM | 53.6 nM | 24.3 nM | 57.6 nM | 28 nM | 83 nM |
| COV318 | >10 μM | 7.5 μM | 4.6 μM | >10 μM | 2.6 μM | 1.4 nM | 451 nM |
| SW626 | 3.3 μM | 1.3 μM | 3.4 μM | 2.3 μM | 3.6 μM | 927 nM | 445 nM |
| OVCAR3 | >10 μM | 2.3 μM | >10 μM | >10 μM | 2.6 μM | 1.3 nM | 165 nM |
| A2780 | 5.5 μM | 2.4 μM | 5.3 μM | 1.7 μM | 1.2 μM | 373 nM | 365 nM |
|
A2780ADR | >10 μM | 9.6 μM | 3.4 μM | 3.1 μM | 735 nM | 1.4 μM | 1.3 μM |
|
A2780CIS | 5.3 μM | 3.7 μM | 4.8 μM | 2. 4 μM | 1.4 μM | 176 nM | 340 nM |
|
| B, IC50
values for other TKIs and cytotoxic agents |
|
| Cell lines | NVP-AEW541 | Crizotinib | Imatinib | Dasatinib | Doxorubicin | Paclitaxel | Cisplatin |
|
| ES2 | 3.5 μM | 2.3 μM | >10 μM | 1.6 μM | 554 nM | 13.9 nM | >20 μM |
| PA1 | 79.3 nM | 162 nM | >10 μM | 3.3 nM | 169 nM | 164 pM | 1.5 μM |
| SKOV3 | 2.5 μM | 2.3 μM | >10 μM | 145 pM | 207 nM | 38.7 nM | >20 μM |
| CAOV3 | 2.1 μM | 340 nM | >10 μM | 4.7 nM | 1.6 μM | 102 pM | 16.4 μM |
| COV318 | 1.6 μM | 1.4 μM | >10 μM | 2.7 nM | 255 nM | 116 nM | >20 μM |
| SW626 | 4.1 μM | 2.6 μM | >10 μM | 471 pM | 2.2 μM | 28.9 nM | >20 μM |
| OVCAR3 | 2.5 μM | 906 nM | >10 μM | 26.7 nM | 1.2 μM | 278 nM | 16.5 μM |
| A2780 | 4.9 μM | 333 nM | >10 μM | 3.3 μM | 154 nM | 440 nM | 13.3 μM |
|
A2780ADR | 6.5 μM | 2.7 μM | >10 μM | 3.0 nM | 2.4 μM | 114 nM | >20 μM |
|
A2780CIS | 2.3 μM | 808 nM | >10 μM | 3.3 μM | 43.3 nM | 754 pM | >20 μM |
Treatment with TKIs increases the
population of ovarian cancer cells in sub-G1 and
G2/M phase
We examined the effect of treatment with various
agents on the cell cycle distribution of ovarian cancer cells. As
shown by flow cytometry, SKOV3 cells have the highest level of
HER-2 expression, low levels of EGFR, IGF-IR and c-MET expression,
and overexpress the two putative ovarian cancer stem cell markers
(Table I). As a result, SKOV3
cells were selected for comparing the effect of various forms of
inhibitors (i.e., reversible EGFR, irreversible pan-HER inhibitor,
IGF-IR TKI, C-MET-TKI) with cytotoxic drugs on cell cycle
distribution. Treatment of SKOV3 cells with both the cytotoxic
drugs paclitaxel and doxorubicin increased the proportion of
apoptotic/dead cells in sub-G1 phase (i.e., from 2 to 31
and 16%) and this was accompanied by a significant increase in the
proportion of cells in G2-M phase (i.e., from 8 to 28
and 54%) and a slight increase in S phase of the cell cycle (i.e.,
from 7 to 13 and 12%) respectively (Table III). Treatment of SKOV3 cells
with various TKIs (erlotinib, afatinib, crizotinib, NVP-AEW541)
also increased the proportion of cells in sub-G1 phase,
but this was accompanied by a reduction in the proportion of cells
in S phase of the cell cycle (Table
III).
| Table IIIEffect of afatinib, erlotinib,
crizotinib, NVP-AEW541 and cytotoxic agents on the cell cycle
distribution of ovarian SKOV3 cancer cell line. |
Table III
Effect of afatinib, erlotinib,
crizotinib, NVP-AEW541 and cytotoxic agents on the cell cycle
distribution of ovarian SKOV3 cancer cell line.
| Treatment |
Sub-G0 |
G0-G1 | S |
G2-M |
|---|
| Medium | 2 | 82 | 7 | 8 |
| Erlotinib | 15 | 64 | 5 | 12 |
| Afatinib | 20 | 60 | 5 | 11 |
| Crizotinib | 34 | 8 | 3 | 18 |
| NVP-AEW541 | 9 | 58 | 7 | 22 |
| Paclitaxel | 32 | 12 | 13 | 28 |
| Doxorubicin | 16 | 14 | 12 | 54 |
Growth response of human ovarian tumour
cells to treatment with NVP-AEW541 in combination with afatinib,
erlotinib, crizotinib and paclitaxel
In some studies, IGF-IR cross-talk with HER family
members was associated with resistance to treatment with the HER
inhibitors (please see Discussion e.g., refs. 58–60).
As a result, we next examined the effect of IGF-IR TKI in
combination with other agents on the growth of three human ovarian
cancer cell lines. When NVP-AEW541 was combined with the reversible
EGFR TKI erlotinib, there was an antagonistic response in all three
ovarian cancer cell lines (SKOV3, Caov3 and ES2). When combined
with afatinib there was a synergistic effect only in the HER-2
overexpressing SKOV3 cells (Table
IV). Next, we examined the effect of NVP-AEW541 in combination
with crizotinib and this combination resulted in the synergistic
growth inhibition of both SKOV3 and Caov3 cells, but it was
antagonistic in ES2 cells. Finally, when NVP-AEW541 was used in
combination paclitaxel, this resulted in the synergistic or
additive growth inhibition of all three ovarian cancer cells
(Table IV).
| Table IVMean combination index values of
NVP-AEW541 when combined with afatinib, erlotinib, crizotinib and
paclitaxel in human ovarian cancer cell lines.a |
Table IV
Mean combination index values of
NVP-AEW541 when combined with afatinib, erlotinib, crizotinib and
paclitaxel in human ovarian cancer cell lines.a
| Mean combination
index (effect) |
|---|
|
|
|---|
| Cell line | NVP-AEW541 +
afatinib | NVP-AEW541 +
erlotinib | NVP-AEW541 +
crizotinib | NVP-AEW541 +
paclitaxel |
|---|
| SKOV3 | 0.88 (slight
synergism) | 1.64
(antagonism) | 0.10 (strong
synergism) | 0.96 (nearly
additive) |
| CAOV3 | 1.3 (moderate
antagonism) | 1.83
(antagonism) | 0.20 (strong
synergism) | 0.30 (strong
synergism) |
| ES2 | 1.87 (moderate
antagonism) | 5.54 (strong
antagonism) | 2.5 (strong
antagonism) | 0.89 (slight
synergism) |
Correlation analysis of the HER family
members, IGF-1R, ALK and c-Met and sensitivity to tyrosine kinase
inhibitors and cytotoxic drugs
Linear regression analysis was carried out for
determining the association between expression of growth factor
receptors and sensitivity to the tyrosine kinase inhibitors as well
as the cytotoxic drugs. There was no significant association
between the expression of EGFR, HER-2, IGF-IR, c-MET, ALK and
putative CSC markers and the response to treatment with the
irreversible HER TKIs, dasatinib, NVP-AEW541, and crizotinib.
However, a significant association was found between the
co-expression of CD24/HER-2, HER2/CD24/CD44, and EGFR/HER2/CD24 and
response to treatment with gefitinib and lapatinib, and the
co-expression of EGFR/HER2/CD24 and response to sapitinib (Table V). In addition, the co-expression
of CD44 with EGFR, HER2, CD24, EGFR/CD24, HER2/CD24, EGFR/HER2, or
EGFR/HER2/CD24 was associated with better response to treatment
with paclitaxel.
| Table VLinear regression analysis of the
relationship between the expression and co-expression of HER family
members, IGF-1R, ALK, c-MET and putative CSC markers in a panel of
human ovarian tumour cell lines and the response to treatment. |
Table V
Linear regression analysis of the
relationship between the expression and co-expression of HER family
members, IGF-1R, ALK, c-MET and putative CSC markers in a panel of
human ovarian tumour cell lines and the response to treatment.
| A, Treatment with
NVP-AEW541, crizotinib, dasatinib and cytotoxic drugs |
|---|
|
|---|
| Cell surface
markers | NVP-AEW541 R2
(P-value) | Crizotinib R2
(P-value) | Dasatinib R2
(P-value) | Paclitaxel R2
(P-value) | Doxorubicin R2
(P-value) | Cisplatin R2
(P-value) |
|---|
| EGFR | 0.002 (0.909) | 0.006 (0.895) | 0.167 (0.241) | 0.002 (0.909) | 0.005 (0.841) | 0.235 (0.516) |
| HER2 | 0.001 (0.927) | 0.006 (0.835) | 0.0304 (0.609) | 0.004 (0.858) | 0.004 (0.862) | 0.204 (0.548) |
| IGF-1R | 0.111 (0.348) | 0.011 (0.77) | 0.241 (0.15) | 0.008 (0.808) | 0.361 (0.066) | 0.076 (0.725) |
| c-MET | 0.012 (0.76) | 0.031 (0.625) | 0.171 (0.235) | 0.011 (0.772) | 0.054 (0.519) | 0.393 (0.373) |
| ALK | 0.088 (0.405) | 0.051 (0.53) | 0.041 (0.574) | 0.05 (0.533) | 0.445 (0.035) | 0.799 (0.106) |
| CD24 | 0.169 (0.237) | 0.009 (0.796) | 0.15 (0.269) | 0.043 (0.567) | 0.034 (0.609) | 0.031 (0.824) |
| CD44 | 0.059 (0.498) | 0.202 (0.193) | n/a (n/a) | 0.756 (0.001) | 0.054 (0.519) | 0.795 (0.108) |
| EGFR/HER2 | 0.017 (0.941) | 0.178 (0.503) | 0.181 (0.498) | 0.125 (0.627) | 0.026 (0.911) | 0.481 (0.72) |
| EGFR/IGF1R | 0.088 (0.724) | 0.059 (0.808) | 0.385 (0.182) | 0.053 (0.827) | 0.446 (0.127) | 0.996 (0.063) |
| HER2/IGF1R | 0.542 (0.065) | 0.144 (0.58 | 0.287 (0.306) | 0.071 (0.774) | 0.5 (0.089) | 0.873 (0.357) |
| EGFR/c-MET | 0.012 (0.96) | 0.058 (0.812) | 0.192 (0.475) | 0.055 (0.819) | 0.009 (0.097) | 0.768 (0.481) |
| HER2/c-MET | 0.432 (0.136) | 0.09 (0.718) | 0.201 (0.456) | 0.053 (0.826) | 0.075 (0.761) | 0.274 (0.852) |
| EGFR/ALK | 0.013 (0.954) | 0.074 (0.766) | 0.168 (0.526) | 0.032 (0.891) | 0.105 (0.679) | 0.53 (0.685) |
| HER2/ALK | 0.444 (0.128) | 0.119 (0.643) | 0.078 (0.754) | 0.027 (0.909) | 0.133 (0.608) | 0.429 (0.755) |
| c-MET/ALK | 0.109 (0.668) | 0.092 (0.712) | 0.3 (0.286) | 0.057 (0.815) | 0.471 (0.108) | 0.995 (0.073) |
|
EGFR/HER2/IGF-1R | 0.153 (0.941) | 0.179 (0.736) | 0.408 (0.336) | 0.158 (0.774) | 0.406 (0.339) | n/a (n/a) |
|
EGFR/HER2/c-MET | 0.478 (0.242) | 0.179 (0.735) | 0.212 (0.673) | 0.08 (0.91) | 0.101 (0.876) | n/a (n/a) |
| EGFR/HER2/ALK | 0.478 (0.242) | 0.196 (0.703) | 0.181 (0.732) | 0.042 (0.965) | 0.22 (0.658) | n/a (n/a) |
|
EGFR/HER2/IGF-1R/c-MET | 0.589 (0.267) | 0.237 (0.81) | 0.657 (0.507) | 0.127 (0.938) | 0.527 (0.357) | n/a (n/a) |
|
EGFR/HER2/IGF-1R/ALK/c-MET | 0.253 (0.908) | 0.235 (0.922) | 0.415 (0.533) | 0.254 (0.907) | 0.764 (0.188) | n/a (n/a) |
| EGFR/CD24 | 0.17 (0.521) | 0.017 (0.942) | 0.278 (0.319) | 0.044 (0.854) | 0.042 (0.86) | 0.254 (0.864) |
| EGFR/CD44 | 0.06 (0.805) | 0.209 (0.441) | 0.168 (0.525) | 0.764 (0.007) | 0.058 (0.811) | 0.955 (0.211) |
| HER2/CD24 | 0.539 (0.064) | 0.194 (0.47) | 0.252 (0.362) | 0.054) (0.823) | 0.088 (0.725) | 0.856 (0.38) |
| HER2/CD44 | 0.427 (0.124) | 0.222 (0.416) | 0.043 (0.858) | 0.973
(0.000003) | 0.096 (0.703) | 0.796 (0.452) |
| EGFR/CD24/CD44 | 0.193 (0.71) | 0.209 (0.679) | 0.29 (0.53) | 0.933 (0.001) | 0.079 (0.911) | n/a (n/a) |
|
| B, Treatment with
various HER TKIs. |
|
| Cell surface
markers | Erlotinib R2
(P-value) | Gefitinib R2
(P-value) | Lapatinib R2
(P-value) | Sapitinib R2
(P-value) | Canertinib R2
(P-value) | Afatinib R2
(P-value) | Neratinib R2
(P-value) |
|
| EGFR | 0.012 (0.766) | 0.338 (0.227) | 0.244 (0.176) | 0.63 (0.033) | 0.041 (0.577) | 0.051 (0.53) | 0.051 (0.53) |
| HER2 | 0.011 (0.775) | 0.006 (0.885) | 0.308 (0.121) | 0.211 (0.3) | 0.126 (0.315) | 0.216 (0.175) | 0.216 (0.175) |
| IGF-1R | 0 (0.993) | 0.03 (0.742) | 0.013 (0.773) | 0.026 (0.731) | 0.036 (0.602) | 0.53 (0.522) | 0.54 (0.522) |
| c-MET | 0.18 (0.222) | 0.175 (0.409) | 0 (0.985) | 0.442 (0.103) | 0.11 (0.349) | 0.01 (0.935) | 0.01 (0.935) |
| ALK | 0.01 (0.917) | 0 (0.993) | 0.054 (0.547) | 0.376 (0.143) | 0.14 (0.286) | 0.06 (0.833) | 0.06 (0.833) |
| CD24 | 0.115 (0.337) | 0.1(0.541) | 0.485 (0.037) | 0.176 (0.348) | 0.059 (0.498) | 0.053 (0.521) | 0.053 (0.521) |
| CD44 | 0.005 (0.847) | 0.08 (0.578) | 0.175 (0.262) | 0.466 (0.285) | 0.073 (0.768) | 0.491 (0.094) | 0.491 (0.094) |
| EGFR/HER2 | 0.015 (0.947) | 0.339 (0.537) | 0.48 (0.14) | 0.707 (0.086) | 0.146 (0.576) | 0.313 (0.269) | 0.313 (0.269) |
| EGFR/IGF1R | 0.013(0.956) | 0.338 (0.538) | 0.246 (0.429) | 0.63 (0.137) | 0.081 (0.744) | 0.052 (0.829) | 0.052 (0.829) |
| HER2/IGF1R | 0.022 (0.924) | 0.036 (0.947) | 0.323 (0.31) | 0.246 (0.568) | 0.153 (0.558) | 0.217 (0.425) | 0.217 (0.425) |
| EGFR/c-MET | 0.146 (0.575 | 0.343 (0.532) | 0.59 (0.069) | 0.631 (0.136) | 0.616 (0.053) | 0.062 (0.801) | 0.062 (0.801) |
| HER2/c-MET | 0.047 (0.844) | 0.175 (0.749) | 0.308 (0.331) | 0.546 (0.207) | 0.243 (0.377) | 0.281 (0.316) | 0.281 (0.316) |
| EGFR/ALK | 0.338 (0.236) | 0.413 (0.449) | 0.578 (0.075) | 0.699(0.091) | 0.373 (0.195) | 0.074 (0.765) | 0.074 (0.765) |
| HER2/ALK | 0.198 (0.463) | 0.008 (0.988) | 0.349 (0.276) | 0.403 (0.356) | 0.258 (0.351) | 0.217 (0.425) | 0.217 (0.425) |
| c-MET/ALK | 0.187 (0.485) | 0.498 (0.356) | 0.236 (0.445) | 0.14 (0.589) | 0.454 (0.298) | 0.006 (0.978) | 0.006 (0.978) |
|
EGFR/HER2/IGF-1R | 0.016 (0.947) | 0.34 (0.802) | 0.483 (0.309) | 0.709 (0.242) | 0.178 (0.738) | 0.122 (0.84) | 0.122 (0.84) |
|
EGFR/HER2/c-MET | 0.151 (0.787) | 0.345 (0.798) | 0.747 (0.059) | 0.708 (0.244) | 0.659 (0.075) | 0.313 (0.489) | 0.313 (0.489) |
| EGFR/HER2/ALK | 0.34 (0.443) | 0.423 (0.725) | 0.737 (0.065) | 0.729 (0.219) | 0.431 (0.303) | 0.365 (0.403) | 0.365 (0.403) |
|
EGFR/HER2/IGF-1R/ALK | 0.02 (0.998) | 0.432 (0.916) | 0.738 (0.17) | 0.729 (0.468) | 0.51 (0.383) | 0.135 (0.931) | 0.135 (0.931) |
|
EGFR/HER2/IGF-1R/c-MET | 0.152 (0.914) | 0.345 (0.949) | 0.756 (0.15) | 0.709 (0.497) | 0.678(0.159) | 0.314 (0.697) | 0.314 (0.697) |
|
EGFR/HER2/IGF-1R/ALK/c-MET | 0.435 (0.998) | n/a (n/a) | 0.762 (0.313) | 0.994 (0.134) | 0.698 (0.288) | 0.136 (0.978) | 0.419 (0.721) |
| EGFR/CD24 | 0.119 (0.534) | 0.36 (0.512) | 0.607 (0.061) | 0.654 (0.12) | 0.088 (0.725) | 0.121 (0.636 | 0.23 (0.401) |
| EGFR/CD44 | 0.16 (0.945) | 0.37 (0.5) | 0.431 (0.185) | 0.627 (0.125) | 0.068 (0.78) | 0.542 (0.065) | 0.218 (0.422) |
| HER2/24 | 0.214 (0.431) | 0.964
(0.007)a | 0.709
(0.025)a | 0.221 (0.606) | 0.145 (0.578) | 0.351 (0.221) | 0.168 (0.524) |
| HER2/CD44 | 0.038 (0.824) | 0.516 (0.337) | 0.368 (0.253) | 0.383 (0.38) | 0.128 (0.62) | 0.541 (0.066) | 0.323 (0.679) |
| CD24/CD44 | 0.139 (0.592) | 0.123 (0.822) | 0.53 (0.104) | 0.466 (0.285) | 0.029 (0.64) | 0.491 (0.094) | 0.179 (0.502) |
| EGFR/CD24/CD44 | 0.142 (0.805) | 0.408 (0.739) | 0.669 (0.112) | 0.68 (0.275) | 0.102 (0.874) | 0.553 (0.159) | 0.281 (0.545) |
| HER2/CD24/CD44 | 0.217 (0.664) | 0.97
(0.045)a | 0.793
(0.036)a | 0.526 (0.467) | 0.146 (0.797) | 0.616 (0.105) | 0.258 (0.589) |
| EGFR/HER2/CD44 | 0.044 (0.962) | 0.881 (0.174) | 0.559 (0.218) | 0.903 (0.05) | 0.149 (0.971) | 0.62 (0.101) | 0.222 (0.655) |
| EGFR/HER2/CD24 | 0.222 (0.655) | 0.995
(0.007)a | 0.766
(0.049)a | 0.945
(0.022)a | 0.164 (0.762) | 0.451 (0.275) | 0.283 (0.543) |
|
EGFR/HER2/CD24/CD44 | 0.225 (0.827) | 0.998 (0.066) | 0.86 (0.053) | 0.946 (0.106) | 0.166 (0.899) | 0.7 (0.135) | 0.384 (0.548) |
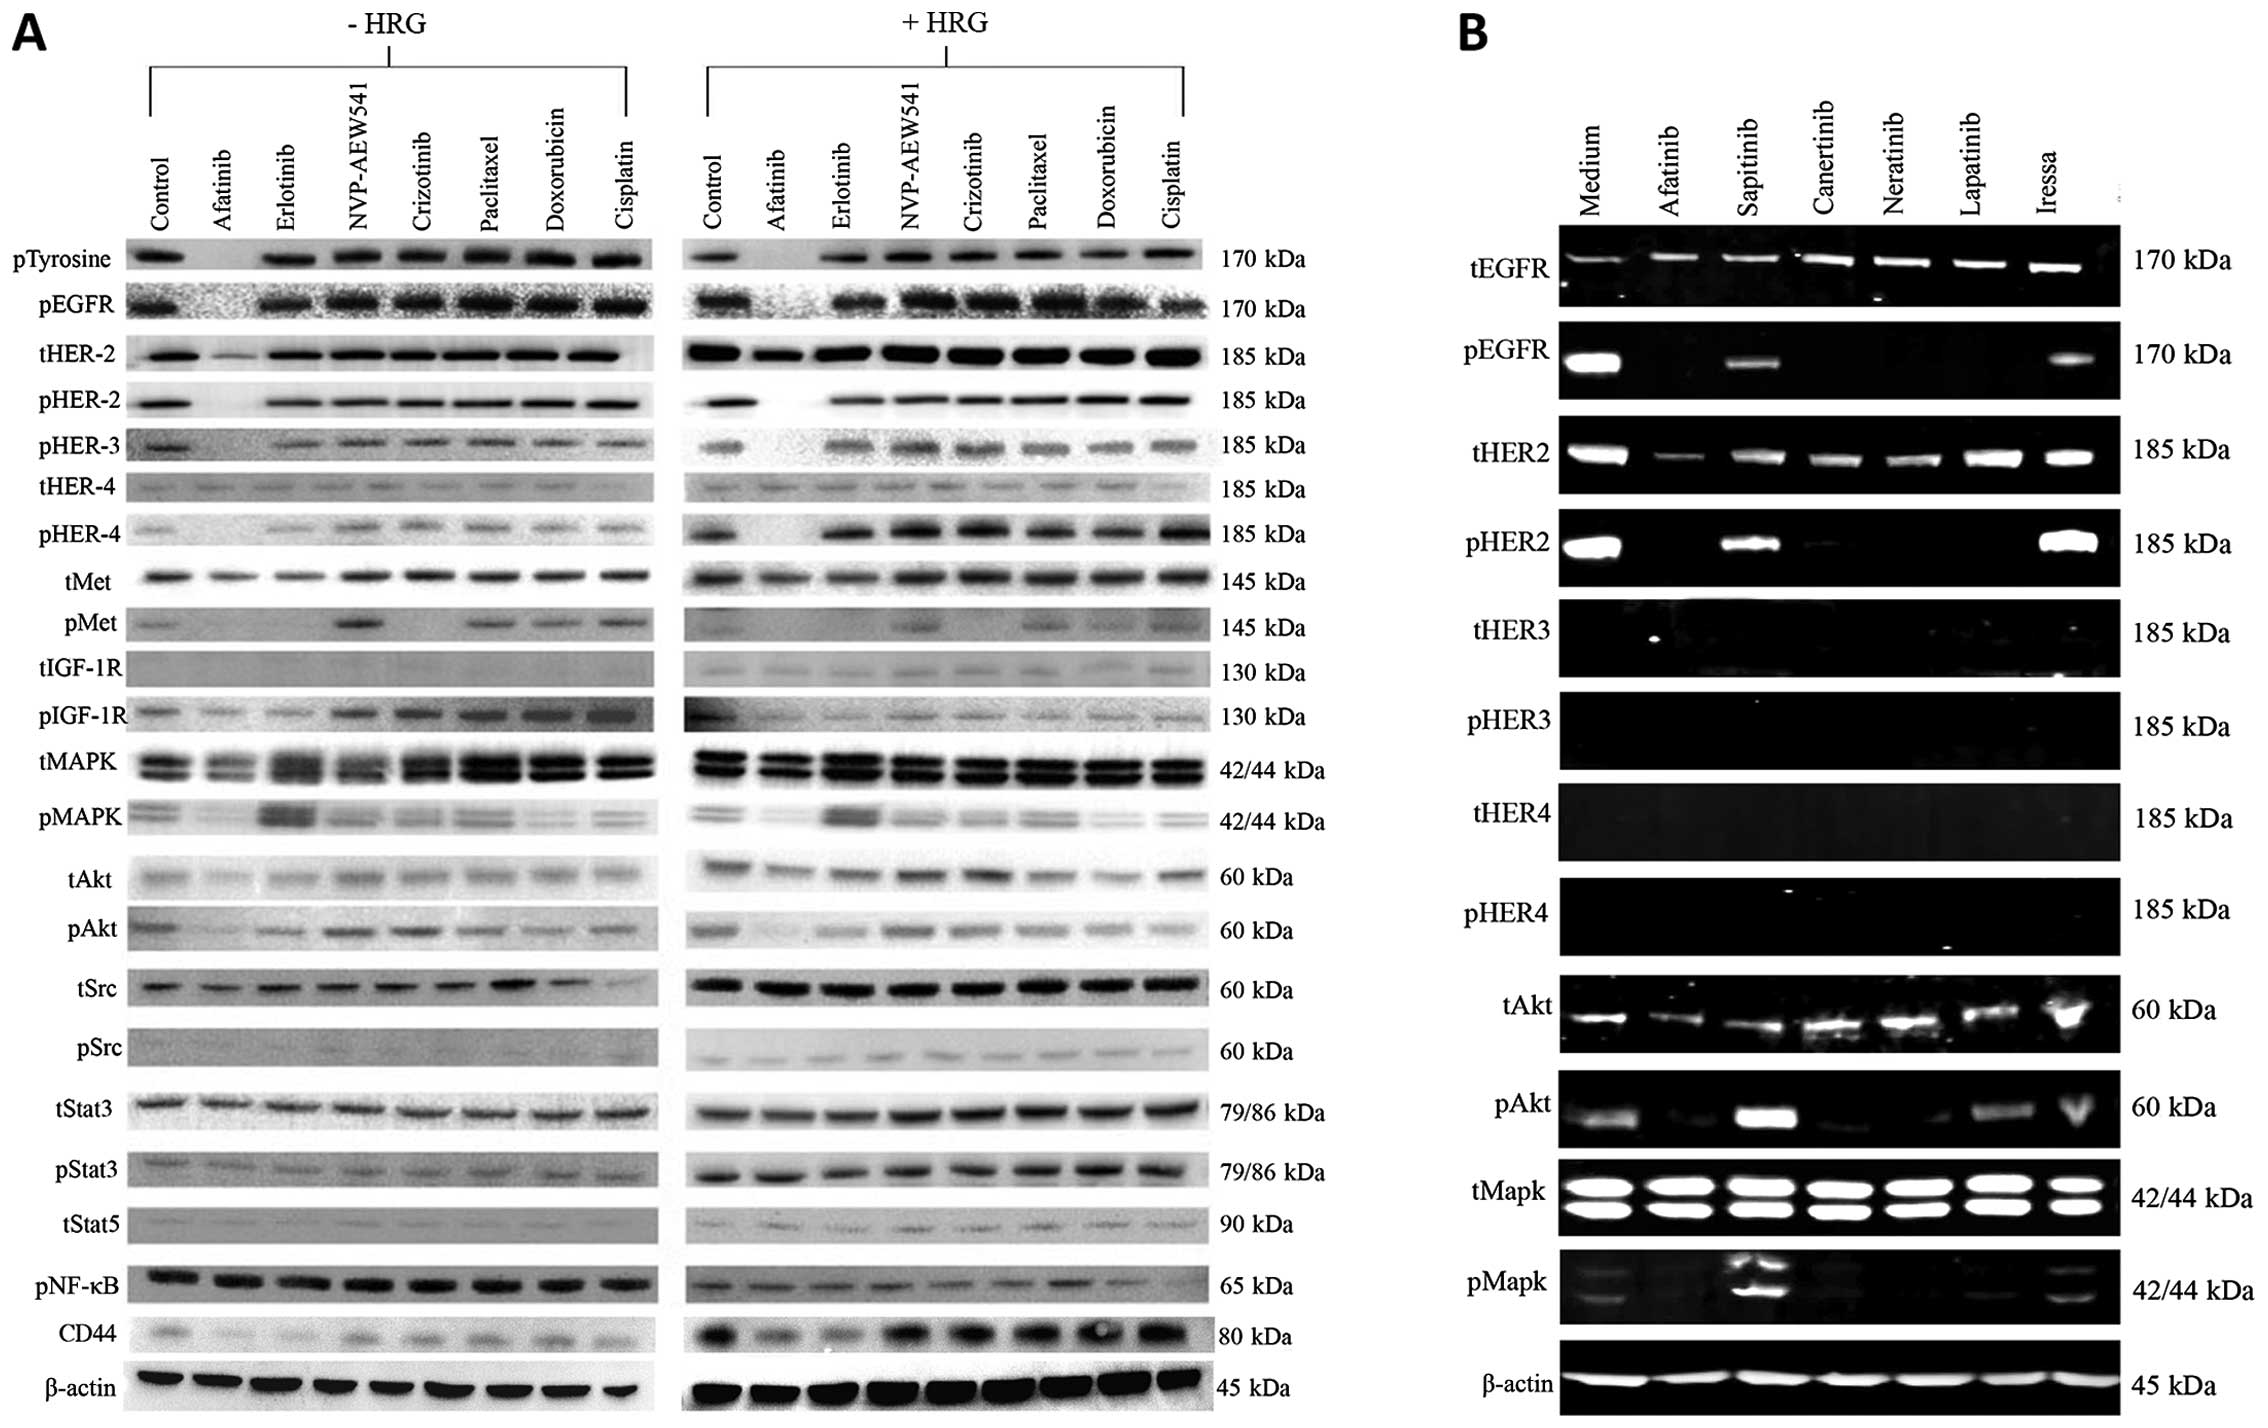
Treatment with the irreversible HER TKI
afatinib is highly effective in reducing the phosphorylation of
HER1–4, AKT, MAPK and CD44 expression in ovarian cancer cells
Next, we investigated the effect of various forms of
the HER inhibitors on the basal phosphorylation of the HER family
members and the downstream cell signaling molecules in SKOV3 cells.
With the exceptions of treatment with gefitinib and sapitinib, all
other HER TKIs induced complete inhibition of phosphorylated EGFR,
HER-2 and AKT and MAPK (Fig. 2A).
We also compared the effect of afatinib, erlotinib with those of
NVP-AEW541, crizotinib and three cytotoxic drugs on
heregulin-induced cell signaling. Of these, only afatinib was an
effective agent in inhibiting both the constitutive phosphorylation
and heregulin-induced phosphorylation of HER family members, c-MET,
IGF-IR as well as MAPK and AKT (Fig.
2B). Moreover, treatment with both afatinib and erlotinib were
accompanied by a reduction in the expression of CD44 in such cells
(Fig. 2B).
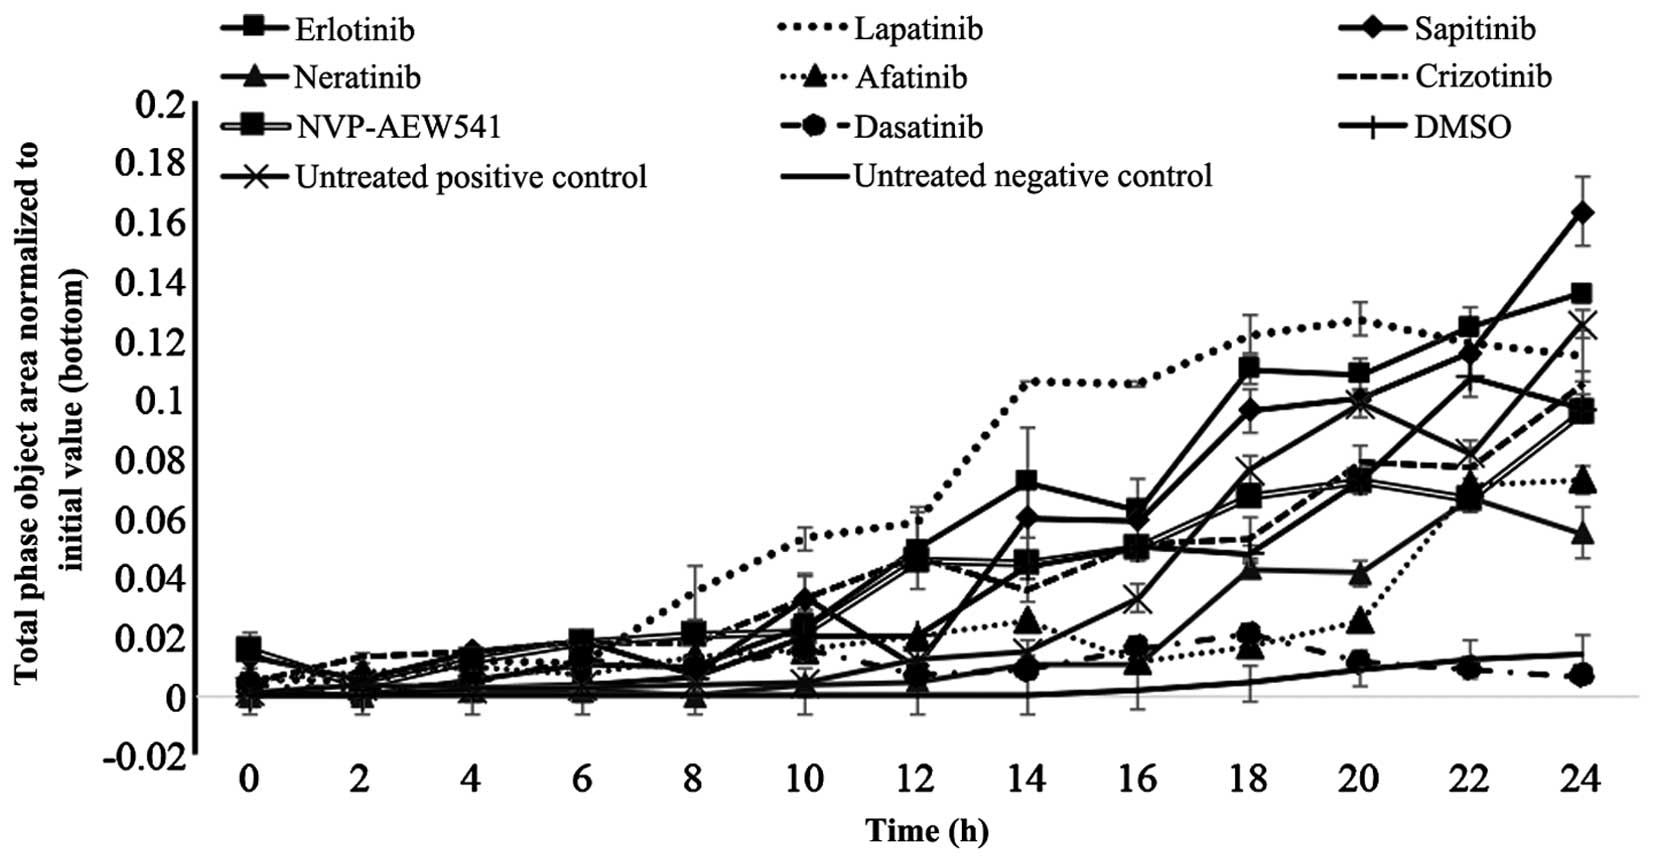
Treatment with afatinib, neratinib and
dasatinib inhibited the migration of SKOV3 cells
Finally, we investigated the migration of SKOV3
cells and whether treatment with various TKIs had any effect on the
migration ability of these cells. Of these, only treatment with
afatinib (p=0.027), neratinib (p=0.011) and dasatinib (p=0.004)
produced a significant reduction in migration of SKOV3 cells
(Fig. 3). Interestingly, treatment
with sapitinib was accompanied by an increase in the migration of
SKOV3 cells (Fig. 3).
Discussion
Ovarian cancer is one of the most lethal types of
gynecological cancer. A significant proportion of ovarian cancer
patients are diagnosed at the advanced stage of the disease and
have a poor response to current chemotherapeutic interventions
(2,33,34).
It is therefore considered essential to not only to develop more
effective and less toxic therapeutic agents for the management of
such patients, but also to identify more reliable biomarkers for
earlier diagnosis, predicting the response, and guiding the
treatment (2,3,6,8,16,35,36).
As noted earlier, the aberrant activation of the cell signaling
pathways by the epidermal growth factor receptor members have been
reported in a wide range of human cancers including ovarian cancer,
and this has been associated with a poorer prognosis in many such
patients (37,38). To date, several anti-EGFR and
anti-HER-2 monoclonal antibodies and various forms of small
molecule TKIs, with specificity for one more member of the HER
family, have been approved for the treatment of patients with a
wide range of epithelial cancers (11,17,18,39).
However, none has yet been approved for the treatment of patients
with ovarian cancer (7,22–24,40–47).
Some of the contributing factors may include the heterogeneous
nature of ovarian cancer, the presence of alternative pathways for
tumour cell proliferation, the absence of reliable predictive
biomarkers for the selection of a more specific population of
ovarian cancer patients who may benefit from such therapeutic
interventions, and the presence of chemoresistant cancer stem cells
(48–51).
In this study, for the first time to our knowledge,
we examined the growth response of 10 human ovarian cancer cell
lines to treatment with various forms of the EGFR TKIs including
reversible EGFR specific, reversible dual EGFR/HER-2 TKI and
reversible and irreversible pan-HER family inhibitors, as wells as
other TKIs and cytotoxic drugs. We also examined whether there was
any association between the expression of HER family members,
putative ovarian cancer stem cell markers or P-glycoprotein and
response to these agents. Of the HER inhibitors tested, we found
that treatment with the 3 irreversible pan-HER family TKIs (i.e.,
canertinib, neratinib and afatinib) were more effective than
treatment with the EGFR specific TKIs gefitinib and erlotinib, the
dual EGFR/HER-2 TKI lapatinib or the reversible pan
EGFR/HER-2/HER-3 TKI sapitinib, by inhibiting the growth of all
ovarian cancer cell lines at concentrations <3.5 μM (Table II and Fig. 1A). Unlike small molecule EGFR TKIs,
anti-EGFR antibody cetuximab, which has been approved for the
treatment of patients with colorectal and head and neck cancers,
blocks EGFR signaling by inhibiting the binding of ligands to the
external domain of the EGFR (20).
In another study, Bull Phelps and colleagues examined the effect of
gefitinib and cetuximab on the growth in vitro of 9 ovarian
cancer cell lines. They found gefitinib to inhibit the growth of
these nine ovarian cancer cell lines with IC50 values
ranging from 6.72 to 32.27 μM. In contrast, they could not
calculate the IC50 value for cetuximab as it was greater
than the highest dose tested (1,700 μM) (52). In another study, Glaysher and
colleagues examined the growth response of primary ovarian cell
cultures to treatment with gefitinib and erlotinib and found only 2
out of 9 and 1 out of 9 had strong single agent activity
respectively (53). In this study,
while the irreversible pan-HER-family inhibitors had more
anti-proliferative effect than the other forms of the EGFR TKIs,
the pattern of growth inhibition of the ovarian cancer cell lines
by the three irreversible pan-HER TKI were not identical (Table II and Fig. 1A). We also examined the effect of
the HER inhibitors on the constitutive phosphorylation of the HER
family members and downstream cell signaling molecules in SKOV3
cells and found that only treatment with the three irreversible
pan-HER TKIs resulted in complete inhibition of autophosphorylated
EGFR, HER-2, AKT and MAPK (Fig.
2A). In addition, of the HER-inhibitors studied, only treatment
with neratinib and afatinib resulted in a significant reduction in
the migration of the HER-2 overexpressing SKOV3 cells (Fig. 3). Interestingly, we did not find
any significant association between the expression level of one or
more members of the HER family and growth response to these
inhibitors (Table V).
In some studies, the co-expression of other growth
factor receptors and over-activation of downstream cell signaling
molecules have been associated with resistance of tumour cells to
treatment with the HER inhibitors and cytotoxic drugs (30,33,54–59).
As a result, we next examined the expression level of IGF-IR,
c-MET, ALK in these cancer cell lines and their predictive value
for response to treatment with the corresponding TKIs, the
HER-inhibitors, dasatinib and cytotoxic drugs. While some of the
cell lines expressed low level of IGF-IR, ALK and c-MET, we did not
find any significant association between the expression level of
these biomarkers and response to treatment with the TKIs and
cytotoxic drugs (Tables I and
V). Next, we investigated the
effect of the IGF-IR TKI in combination with the irreversible
pan-HER family blocker afatinib, the irreversible EGFR TKI
erlotinib, crizotinib or paclitaxel on the growth of three ovarian
cancer cells. We found that the combination of NVP-AEW541 with
erlotinib was antagonistic in all three ovarian cancer cells. In
contrast, treatment with a combination of NVP-AEW541 with afatinib
or crizotinib resulted in synergistic growth inhibition of the
HER-2 overexpressing and EGFR/IGF-IR/C-Met positive SKOV3 but the
same combinations were antagonistic in the
EGFR+/IGF-IR+/HER-2−/c-MET−
ES2 cells (Table IV). In other
studies while treatment with a combination of the IGF-IR TKI with
the HER inhibitors resulted in synergistic or additive cytotoxic
effects in a panel of colorectal and pancreatic cancer cells, the
same combination was found to be antagonistic in a sub-set of such
tumour cell lines (31,60) This highlights the complexity and
heterogeneous nature of cross-talk between the IGF-IR and the HER
family members and c-MET by different ovarian cancer cells.
Interestingly, only treatment with a combination of NVP-AEW541 and
paclitaxel resulted in the synergistic growth inhibition of all
three ovarian cancer cells (Table
III). In another study, Beltran and colleagues investigated the
antitumour activity of the fully human anti-IGF-IR antibody
ganitumab with paclitaxel or carboplatin in a panel of ovarian
cancer cell lines and found that treatment with a combination of
ganitumab with paclitaxel or carboplatin resulted in synergistic
and additive growth inhibition of these cancer cell lines (61). Therefore, further investigations
are warranted on the therapeutic potential of the IGF-IR inhibitor
in combination paclitaxel in ovarian cancer.
In several malignancies including ovarian cancer,
the presence of a rare population of cancer stem cells have been
suggested as the cause of tumour progression, metastasis and
resistance to chemotherapy (50,62–66).
As there is currently no specific ovarian cancer stem cell marker,
we next investigated the expression level and predictive value of
three putative cancer stem cell markers (CD24, CD44, CD117/c-Kit)
for the response to treatment with various TKIs and cytotoxic
agents in our panel of ovarian cancer cells. We found five and
seven ovarian cancer cell lines to be CD24- and CD44-positive,
respectively (Table I). In some
studies, CD44 expression has been associated with epithelial to
mesenchymal transition and shorter disease-free and overall
survival in patients with ovarian cancer (67,68).
In this study, we found that treatment of SKOV3 cells with both
afatinib and erlotinib was accompanied by the downregulation of
CD44 (Fig. 2B). In another study,
Su and colleagues found that downregulation of CD24 in SKOV3 cells
was accompanied by a significant reduction in cell viability and
induction of apoptosis in SKOV3 cells (69). More recently, Burgos-Ojeda and
colleagues showed that CD24+ ovarian cancer cells are
enriched with cancer initiating cells and play an important role in
tumour initiation and metastasis (70). However, while there was
overexpression of CD44 and CD24 in several of the ovarian cancer
cell lines used in this study, none of them were
CD117/c-Kit-positive or had overexpression of P-glycoprotein
(Table I). Moreover, while there
was not a significant association between the expression of CD44 or
CD24 and the response to treatment with TKIs and cytotoxic drugs, a
significant association was found between the co-expression of
HER-2/CD24, HER2/CD24/CD44 and EGFR/CD24/CD44 the response to
treatment with gefitinib and lapatinib, and the co-expression of
EGFR/HER2/CD24 and EGFR/HER2/CD44 and the response to treatment
with sapitinib. Of the three cytotoxic drugs, we found that
paclitaxel was the most effective drug for inhibiting the growth of
ovarian tumour cell lines with concentrations ranging from pico
molar concentrations and none >440 nM. Interestingly, the
co-expression of CD44/CD24 with EGFR, HER-2 or EGFR/HER-2 were all
associated with response to paclitaxel but not doxorubicin or
cisplatin (Table V). These results
support the need for further investigation on the predictive value
of these biomarkers for response to treatment with paclitaxel in
ovarian cancer patients.
Finally, the downstream signaling protein Src is a
known key signaling pathway inducer of several membrane bound
activated receptors, including EGFR. The result of a clinical trial
with the SRC-family kinase inhibitor dasatinib suggested that it
has minimal activity as a single agent in the treatment of patients
with recurrent or persistent epithelial ovarian carcinoma (71). However, in several preclinical
studies treatment with dasatinib in combination with a
chemotherapeutic resulted in synergistic growth inhibition of some
of the ovarian cancer cell lines (72–75).
We found that dasatinib was the most potent TKI in this study.
While dasatinib inhibited the growth of all ovarian cancer cell
lines in our study and it was the most effective TKI for inhibiting
SKOV3 cell migration, there was a 4-log-fold difference in its
IC50 value ranging from 145 pM in SKOV3 cells to 3.3 μM
in A2780CIS cells (Table
II and Figs. 1B and 3). This highlights the importance of the
identification of reliable predictive biomarkers for directing
dasatinib therapy, in particular further studies on its therapeutic
potential when used in combination with the irreversible HER
inhibitors or other chemotherapeutic agents, in ovarian cancer.
In conclusion, our results show that of the HER
TKIs, the irreversible pan-HER TKIs were more effective at
inhibiting the growth of ovarian cancer cells, blocking cell
signalling through HER family members and reducing the migration of
ovarian cancer cells. Moreover, of all the TKIs and the three
cytotoxic drugs used in our study, we found that the great majority
of ovarian cancer cells were most sensitive to treatment with the
Src/V-abl/C-kit inhibitor dasatinib and paclitaxel respectively.
The variation in growth suppression of various EGFR TKIs across the
panel of human ovarian tumour cell lines also highlights the
important role of tumour heterogeneity. Our results support the
need for further investigations of the therapeutic potential of
irreversible HER family blockers in ovarian cancer, and the
therapeutic potential of dasatinib when used in combination with
the inhibitors of the HER family members.
Acknowledgements
This study was supported by Kingston University
London and in part by GRACE cancer charity (UK). We are grateful to
OSI Pharmaceuticals, Boehringer Ingelheim and Novartis for
providing OSI-774 and BIBW2992 and NVP-AEW541, respectively, for
the use in this study.
Abbreviations:
|
EGFR
|
epidermal growth factor receptor
|
|
HER
|
human epidermal growth factor
receptor
|
|
CSC
|
cancer stem cells
|
|
IGF-IR
|
insulin-like growth factor receptor
I
|
|
CD44
|
cluster differentiation 44
|
|
CD24
|
cluster differentiation 24
|
|
ALK
|
anaplastic lymphoma kinase
|
|
c-MET
|
hepatocyte growth factor receptor
|
References
|
1
|
Ferlay J, Soerjomataram I, Dikshit R, Eser
S, Mathers C, Rebelo M, Parkin DM, Forman D and Bray F: Cancer
incidence and mortality worldwide: Sources, methods and major
patterns in GLOBOCAN 2012. Int J Cancer. 136:E359–E386. 2015.
View Article : Google Scholar
|
|
2
|
Hennessy BT, Coleman RL and Markman M:
Ovarian cancer. Lancet. 374:1371–1382. 2009. View Article : Google Scholar : PubMed/NCBI
|
|
3
|
Aleksandra Kujawa K and Lisowska KM:
Ovarian cancer - from biology to clinic. Postepy Hig Med Dosw
Online. 69:1275–1290. 2015.(In Polish). View Article : Google Scholar
|
|
4
|
Petrillo M, De Iaco P, Cianci S, Perrone
M, Costantini B, Ronsini C, Scambia G and Fagotti A: Long-term
survival for platinum-sensitive recurrent ovarian cancer patients
treated with secondary cytoreductive surgery plus hyperthermic
intraperitoneal chemotherapy (HIPEC). Ann Surg Oncol. 23:1660–1665.
2016. View Article : Google Scholar
|
|
5
|
Dinkelspiel HE, Tergas AI, Zimmerman LA,
Burke WM, Hou JY, Chen L, Hillyer G, Neugut AI, Hershman DL and
Wright JD: Use and duration of chemotherapy and its impact on
survival in early-stage ovarian cancer. Gynecol Oncol. 137:203–209.
2015. View Article : Google Scholar : PubMed/NCBI
|
|
6
|
Husseinzadeh N: Status of tumor markers in
epithelial ovarian cancer has there been any progress? A review.
Gynecol Oncol. 120:152–157. 2011. View Article : Google Scholar
|
|
7
|
Banerjee S and Kaye S: The role of
targeted therapy in ovarian cancer. Eur J Cancer. 47(Suppl 3):
S116–S130. 2011. View Article : Google Scholar : PubMed/NCBI
|
|
8
|
Gibson AJ, Krishnansu S, Tewari KS, Monk
BJ and Chase DM: updates on drug discovery in ovarian cancer.
Gynecol Oncol Res Pract. 1:32014. View Article : Google Scholar : PubMed/NCBI
|
|
9
|
Modjtahedi H and Dean C: The receptor for
EGF and its ligands - expression, prognostic value and target for
therapy in cancer (Review). Int J Oncol. 4:277–296. 1994.PubMed/NCBI
|
|
10
|
Mendelsohn J and Baselga J: Epidermal
growth factor receptor targeting in cancer. Semin Oncol.
33:369–385. 2006. View Article : Google Scholar : PubMed/NCBI
|
|
11
|
Arteaga CL and Engelman JA: ERBB
receptors: From oncogene discovery to basic science to
mechanism-based cancer therapeutics. Cancer Cell. 25:282–303. 2014.
View Article : Google Scholar : PubMed/NCBI
|
|
12
|
Mass RD: The HER receptor family: A rich
target for therapeutic development. Int J Radiat Oncol Biol Phys.
58:932–940. 2004. View Article : Google Scholar : PubMed/NCBI
|
|
13
|
Hanahan D and Weinberg RA: Hallmarks of
cancer: The next generation. Cell. 144:646–674. 2011. View Article : Google Scholar : PubMed/NCBI
|
|
14
|
Roskoski R Jr: ErbB/HER protein-tyrosine
kinases: Structures and small molecule inhibitors. Pharmacol Res.
87:42–59. 2014. View Article : Google Scholar : PubMed/NCBI
|
|
15
|
Appert-Collin A, Hubert P, Crémel G and
Bennasroune A: Role of ErbB Receptors in Cancer Cell Migration and
Invasion. Front Pharmacol. 6:2832015. View Article : Google Scholar : PubMed/NCBI
|
|
16
|
Lafky JM, Wilken JA, Baron AT and Maihle
NJ: Clinical implications of the ErbB/epidermal growth factor (EGF)
receptor family and its ligands in ovarian cancer. Biochim Biophys
Acta. 1785:232–265. 2008.PubMed/NCBI
|
|
17
|
Ioannou N, Seddon AM, Dalgleish A,
Mackintosh D and Modjtahedi H: Expression pattern and targeting of
HER family members and IGF-IR in pancreatic cancer. Front Biosci
(Landmark Ed). 17:2698–2724. 2012. View
Article : Google Scholar
|
|
18
|
Khelwatty SA, Essapen S, Seddon AM and
Modjtahedi H: Prognostic significance and targeting of HER family
in colorectal cancer. Front Biosci (Landmark Ed). 18:394–421. 2013.
View Article : Google Scholar
|
|
19
|
Davies S, Holmes A, Lomo L, Steinkamp MP,
Kang H, Muller CY and Wilson BS: High incidence of ErbB3, ErbB4,
and MET expression in ovarian cancer. Int J Gynecol Pathol.
33:402–410. 2014. View Article : Google Scholar : PubMed/NCBI
|
|
20
|
Modjtahedi H, Ali S and Essapen S:
Therapeutic application of monoclonal antibodies in cancer:
Advances and challenges. Br Med Bull. 104:41–59. 2012. View Article : Google Scholar : PubMed/NCBI
|
|
21
|
Serrano-Olvera A, Dueñas-González A,
Gallardo-Rincón D, Candelaria M and De la Garza-Salazar J:
Prognostic, predictive and therapeutic implications of HER2 in
invasive epithelial ovarian cancer. Cancer Treat Rev. 32:180–190.
2006. View Article : Google Scholar : PubMed/NCBI
|
|
22
|
Langdon SP, Faratian D, Nagumo Y, Mullen P
and Harrison DJ: Pertuzumab for the treatment of ovarian cancer.
Expert Opin Biol Ther. 10:1113–1120. 2010. View Article : Google Scholar : PubMed/NCBI
|
|
23
|
Sheng Q and Liu J: The therapeutic
potential of targeting the EGFR family in epithelial ovarian
cancer. Br J Cancer. 104:1241–1245. 2011. View Article : Google Scholar : PubMed/NCBI
|
|
24
|
Kaye SB, Poole CJ, Dańska-Bidzińska A,
Gianni L, Del Conte G, Gorbunova V, Novikova E, Strauss A, Moczko
M, McNally VA, et al: A randomized phase II study evaluating the
combination of carboplatin-based chemotherapy with pertuzumab
versus carboplatin-based therapy alone in patients with relapsed,
platinum-sensitive ovarian cancer. Ann Oncol. 24:145–152. 2013.
View Article : Google Scholar
|
|
25
|
Dutta DK and Dutta I: Origin of ovarian
cancer: Molecular profiling. J Obstet Gynaecol India. 63:152–157.
2013. View Article : Google Scholar :
|
|
26
|
Reyes HD, Thiel KW, Carlson MJ, Meng X,
Yang S, Stephan JM and Leslie KK: Comprehensive profiling of
EGFR/HER receptors for personalized treatment of gynecologic
cancers. Mol Diagn Ther. 18:137–151. 2014. View Article : Google Scholar : PubMed/NCBI
|
|
27
|
Bapat SA: Human ovarian cancer stem cells.
Reproduction. 140:33–41. 2010. View Article : Google Scholar : PubMed/NCBI
|
|
28
|
Walters Haygood CL, Arend RC, Straughn JM
and Buchsbaum DJ: Ovarian cancer stem cells: Can targeted therapy
lead to improved progression-free survival? World J Stem Cells.
6:441–447. 2014. View Article : Google Scholar : PubMed/NCBI
|
|
29
|
Zhao J, Klausen C, Qiu X, Cheng JC, Chang
HM and Leung PC: Betacellulin induces Slug-mediated down-regulation
of E-cadherin and cell migration in ovarian cancer cells.
Oncotarget. Feb 22–2016.(Epub ahead of print). View Article : Google Scholar
|
|
30
|
Cunningham MP, Thomas H, Fan Z and
Modjtahedi H: Responses of human colorectal tumor cells to
treatment with the anti-epidermal growth factor receptor monoclonal
antibody ICR62 used alone and in combination with the EGFR tyrosine
kinase inhibitor gefitinib. Cancer Res. 66:7708–7715. 2006.
View Article : Google Scholar : PubMed/NCBI
|
|
31
|
Khelwatty SA, Essapen S, Seddon AM and
Modjtahedi H: Growth response of human colorectal tumour cell lines
to treatment with afatinib (BIBW2992), an irreversible erbB family
blocker, and its association with expression of HER family members.
Int J Oncol. 39:483–491. 2011.PubMed/NCBI
|
|
32
|
Ioannou N, Dalgleish AG, Seddon AM,
Mackintosh D, Guertler U, Solca F and Modjtahedi H: Anti-tumour
activity of afatinib, an irreversible ErbB family blocker, in human
pancreatic tumour cells. Br J Cancer. 105:1554–1562. 2011.
View Article : Google Scholar : PubMed/NCBI
|
|
33
|
Davis A, Tinker AV and Friedlander M:
‘Platinum resistant’ ovarian cancer: What is it, who to treat and
how to measure benefit? Gynecol Oncol. 133:624–631. 2014.
View Article : Google Scholar : PubMed/NCBI
|
|
34
|
Dinkelspiel HE, Champer M, Hou J, Tergas
A, Burke WM, Huang Y, Neugut AI, Ananth CV, Hershman DL and Wright
JD: Long-term mortality among women with epithelial ovarian cancer.
Gynecol Oncol. 138:421–428. 2015. View Article : Google Scholar : PubMed/NCBI
|
|
35
|
Chase DM, Mathur N and Tewari KS: Drug
discovery in ovarian cancer. Recent Patents Anticancer Drug Discov.
5:251–260. 2010. View Article : Google Scholar
|
|
36
|
Bonneau C, Rouzier R, Geyl C, Cortez A,
Castela M, Lis R, Daraï E and Touboul C: Predictive markers of
chemoresistance in advanced stages epithelial ovarian carcinoma.
Gynecol Oncol. 136:112–120. 2015. View Article : Google Scholar
|
|
37
|
Wilken JA, Badri T, Cross S, Raji R,
Santin AD, Schwartz P, Branscum AJ, Baron AT, Sakhitab AI and
Maihle NJ: EGFR/HER-targeted therapeutics in ovarian cancer. Future
Med Chem. 4:447–469. 2012. View Article : Google Scholar : PubMed/NCBI
|
|
38
|
Roskoski R Jr: The ErbB/HER family of
protein-tyrosine kinases and cancer. Pharmacol Res. 79:34–74. 2014.
View Article : Google Scholar
|
|
39
|
Modjtahedi H, Khelwatty SA, Kirk RS,
Seddon AM, Essapen S, Del Vecchio CA, Wong AJ and Eccles S:
Immunohistochemical discrimination of wild-type EGFR from EGFRvIII
in fixed tumour specimens using anti-EGFR mAbs ICR9 and ICR10. Br J
Cancer. 106:883–888. 2012. View Article : Google Scholar : PubMed/NCBI
|
|
40
|
Weroha SJ, Oberg AL, Ziegler KL, Dakhilm
SR, Rowland KM, Hartmann LC, Moore DF Jr, Keeney GL, Peethambaram
PP and Haluska P: Phase II trial of lapatinib and topotecan
(LapTop) in patients with platinum-refractory/resistant ovarian and
primary peritoneal carcinoma. Gynecol Oncol. 122:116–120. 2011.
View Article : Google Scholar : PubMed/NCBI
|
|
41
|
Lheureux S, Krieger S, Weber B, Pautier P,
Fabbro M, Selle F, Bourgeois H, Petit T, Lortholary A, Plantade A,
et al: Expected benefits of topotecan combined with lapatinib in
recurrent ovarian cancer according to biological profile: A phase 2
trial. Int J Gynecol Cancer. 22:1483–1488. 2012.PubMed/NCBI
|
|
42
|
Teplinsky E and Muggia F: Targeting HER2
in ovarian and uterine cancers: Challenges and future directions.
Gynecol Oncol. 135:364–370. 2014. View Article : Google Scholar : PubMed/NCBI
|
|
43
|
Nimeiri HS, Oza AM, Morgan RJ, Friberg G,
Kasza K, Faoro L, Salgia R, Stadler WM, Vokes EE and Fleming GF;
Chicago Phase II Consortium; PMH Phase II Consortium; California
Phase II Consortium. Efficacy and safety of bevacizumab plus
erlotinib for patients with recurrent ovarian, primary peritoneal,
and fallopian tube cancer: A trial of the Chicago, PMH, and
California Phase II Consortia. Gynecol Oncol. 110:49–55. 2008.
View Article : Google Scholar : PubMed/NCBI
|
|
44
|
Pautier P, Joly F, Kerbrat P, Bougnoux P,
Fumoleau P, Petit T, Rixe O, Ringeisen F, Carrasco AT and Lhommé C:
Phase II study of gefitinib in combination with paclitaxel (P) and
carboplatin (C) as second-line therapy for ovarian, tubal or
peritoneal adenocarcinoma (1839IL/0074). Gynecol Oncol.
116:157–162. 2010. View Article : Google Scholar : PubMed/NCBI
|
|
45
|
Garcia AA, Sill MW, Lankes HA, Godwin AK,
Mannel RS, Armstrong DK, Carolla RL, Liepman MK, Spirtos NM,
Fischer EG, et al: A phase II evaluation of lapatinib in the
treatment of persistent or recurrent epithelial ovarian or primary
peritoneal carcinoma: A gynecologic oncology group study. Gynecol
Oncol. 124:569–574. 2012. View Article : Google Scholar
|
|
46
|
Vergote IB, Jimeno A, Joly F, Katsaros D,
Coens C, Despierre E, Marth C, Hall M, Steer CB, Colombo N, et al:
Randomized phase III study of erlotinib versus observation in
patients with no evidence of disease progression after first-line
platin-based chemotherapy for ovarian carcinoma: A European
Organisation for Research and Treatment of Cancer-Gynaecological
Cancer Group, and Gynecologic Cancer Intergroup study. J Clin
Oncol. 32:320–326. 2014. View Article : Google Scholar
|
|
47
|
Campos SM, Berlin ST, Parker LM, Chen WY,
Bunnell CA, Atkinson T, Lee J, Matulonis U, Hirsch MS, Harris L, et
al: Phase I trial of liposomal doxorubicin and ZD1839 in patients
with refractory gynecological malignancies or metastatic breast
cancer. Int J Clin Oncol. 15:390–398. 2010. View Article : Google Scholar : PubMed/NCBI
|
|
48
|
Davidson B and Tropé CG: Ovarian cancer:
Diagnostic, biological and prognostic aspects. Wom Health Lond.
10:519–533. 2014. View Article : Google Scholar
|
|
49
|
Au KK, Josahkian JA, Francis JA, Squire JA
and Koti M: Current state of biomarkers in ovarian cancer
prognosis. Future Oncol. 11:3187–3195. 2015. View Article : Google Scholar : PubMed/NCBI
|
|
50
|
Albini A, Bruno A, Gallo C, Pajardi G,
Noonan DM and Dallaglio K: Cancer stem cells and the tumor
microenvironment: Interplay in tumor heterogeneity. Connect Tissue
Res. 56:414–425. 2015. View Article : Google Scholar : PubMed/NCBI
|
|
51
|
Davidson B: Recently identified drug
resistance biomarkers in ovarian cancer. Expert Rev Mol Diagn.
16:569–578. 2016. View Article : Google Scholar : PubMed/NCBI
|
|
52
|
Bull Phelps SL, Schorge JO, Peyton MJ,
Shigematsu H, Xiang LL, Miller DS and Lea JS: Implications of EGFR
inhibition in ovarian cancer cell proliferation. Gynecol Oncol.
109:411–417. 2008. View Article : Google Scholar : PubMed/NCBI
|
|
53
|
Glaysher S, Bolton LM, Johnson P, Atkey N,
Dyson M, Torrance C and Cree IA: Targeting EGFR and PI3K pathways
in ovarian cancer. Br J Cancer. 109:1786–1794. 2013. View Article : Google Scholar : PubMed/NCBI
|
|
54
|
Viloria-Petit AM and Kerbel RS: Acquired
resistance to EGFR inhibitors: Mechanisms and prevention
strategies. Int J Radiat Oncol Biol Phys. 58:914–926. 2004.
View Article : Google Scholar : PubMed/NCBI
|
|
55
|
Jones HE, Gee JM, Barrow D, Tonge D,
Holloway B and Nicholson RI: Inhibition of insulin receptor
isoform-A signalling restores sensitivity to gefitinib in
previously de novo resistant colon cancer cells. Br J Cancer.
95:172–180. 2006. View Article : Google Scholar : PubMed/NCBI
|
|
56
|
Engelman JA, Zejnullahu K, Mitsudomi T,
Song Y, Hyland C, Park JO, Lindeman N, Gale CM, Zhao X, Christensen
J, et al: MET amplification leads to gefitinib resistance in lung
cancer by activating ERBB3 signaling. Science. 316:1039–1043. 2007.
View Article : Google Scholar : PubMed/NCBI
|
|
57
|
Mueller KL, Hunter LA, Ethier SP and
Boerner JL: Met and c-Src cooperate to compensate for loss of
epidermal growth factor receptor kinase activity in breast cancer
cells. Cancer Res. 68:3314–3322. 2008. View Article : Google Scholar : PubMed/NCBI
|
|
58
|
van der Veeken J, Oliveira S, Schiffelers
RM, Storm G, van Bergen En Henegouwen PM and Roovers RC: Crosstalk
between epidermal growth factor receptor- and insulin-like growth
factor-1 receptor signaling: Implications for cancer therapy. Curr
Cancer Drug Targets. 9:748–760. 2009. View Article : Google Scholar : PubMed/NCBI
|
|
59
|
Tandon R, Kapoor S, Vali S, Senthil V,
Nithya D, Venkataramanan R, Sharma A, Talwadkar A, Ray A, Bhatnagar
PK, et al: Dual epidermal growth factor receptor
(EGFR)/insulin-like growth factor-1 receptor (IGF-1R) inhibitor: A
novel approach for overcoming resistance in anticancer treatment.
Eur J Pharmacol. 667:56–65. 2011. View Article : Google Scholar : PubMed/NCBI
|
|
60
|
Ioannou N, Seddon AM, Dalgleish A,
Mackintosh D and Modjtahedi H: Treatment with a combination of the
ErbB (HER) family blocker afatinib and the IGF-IR inhibitor,
NVP-AEW541 induces synergistic growth inhibition of human
pancreatic cancer cells. BMC Cancer. 13:412013. View Article : Google Scholar : PubMed/NCBI
|
|
61
|
Beltran PJ, Calzone FJ, Mitchell P, Chung
YA, Cajulis E, Moody G, Belmontes B, Li CM, Vonderfecht S,
Velculescu VE, et al: Ganitumab (AMG 479) inhibits IGF-II-dependent
ovarian cancer growth and potentiates platinum-based chemotherapy.
Clin Cancer Res. 20:2947–2958. 2014. View Article : Google Scholar : PubMed/NCBI
|
|
62
|
Filip S, English D and Mokrý J: Issues in
stem cell plasticity. J Cell Mol Med. 8:572–577. 2004. View Article : Google Scholar : PubMed/NCBI
|
|
63
|
Bellantuono I: Haemopoietic stem cells.
Int J Biochem Cell Biol. 36:607–620. 2004. View Article : Google Scholar : PubMed/NCBI
|
|
64
|
Trounson A: Stem cells, plasticity and
cancer - uncomfortable bed fellows. Development. 131:2763–2768.
2004. View Article : Google Scholar : PubMed/NCBI
|
|
65
|
Zhou Q, Chen A, Song H, Tao J, Yang H and
Zuo M: Prognostic value of cancer stem cell marker CD133 in ovarian
cancer: A meta-analysis. Int J Clin Exp Med. 8:3080–3088.
2015.PubMed/NCBI
|
|
66
|
Saito T and Mimori K: Cancer stemness and
circulating tumor cells. Nihon Rinsho. 73:806–810. 2015.(In
Japanese). PubMed/NCBI
|
|
67
|
Sacks JD and Barbolina MV: Expression and
function of CD44 in epithelial ovarian carcinoma. Biomolecules.
5:3051–3066. 2015. View Article : Google Scholar : PubMed/NCBI
|
|
68
|
Elzarkaa AA, Sabaa BE, Abdelkhalik D,
Mansour H, Melis M, Shaalan W, Farouk M, Malik E and Soliman AA:
Clinical relevance of CD44 surface expression in advanced stage
serous epithelial ovarian cancer: A prospective study. J Cancer Res
Clin Oncol. 142:949–958. 2016. View Article : Google Scholar : PubMed/NCBI
|
|
69
|
Su D, Deng H, Zhao X, Zhang X, Chen L,
Chen X, Li Z, Bai Y, Wang Y, Zhong Q, et al: Targeting CD24 for
treatment of ovarian cancer by short hairpin RNA. Cytotherapy.
11:642–652. 2009. View Article : Google Scholar : PubMed/NCBI
|
|
70
|
Burgos-Ojeda D, Wu R, McLean K, Chen YC,
Talpaz M, Yoon E, Cho KR and Buckanovich RJ: CD24+
ovarian cancer cells are enriched for cancer-initiating cells and
dependent on JAK2 signaling for growth and metastasis. Mol Cancer
Ther. 14:1717–1727. 2015. View Article : Google Scholar : PubMed/NCBI
|
|
71
|
Schilder RJ, Brady WE, Lankes HA, Fiorica
JV, Shahin MS, Zhou XC, Mannel RS, Pathak HB, Hu W, Alpaugh RK, et
al: Phase II evaluation of dasatinib in the treatment of recurrent
or persistent epithelial ovarian or primary peritoneal carcinoma: A
Gynecologic Oncology Group study. Gynecol Oncol. 127:70–74. 2012.
View Article : Google Scholar : PubMed/NCBI
|
|
72
|
Konecny GE, Glas R, Dering J, Manivong K,
Qi J, Finn RS, Yang GR, Hong KL, Ginther C, Winterhoff B, et al:
Activity of the multikinase inhibitor dasatinib against ovarian
cancer cells. Br J Cancer. 101:1699–1708. 2009. View Article : Google Scholar : PubMed/NCBI
|
|
73
|
Teoh D, Ayeni TA, Rubatt JM, Adams DJ,
Grace L, Starr MD, Barry WT, Berchuck A, Murphy SK and Secord AA:
Dasatinib (BMS-35482) has synergistic activity with paclitaxel and
carboplatin in ovarian cancer cells. Gynecol Oncol. 121:187–192.
2011. View Article : Google Scholar : PubMed/NCBI
|
|
74
|
Xiao J, Xu M, Hou T, Huang Y, Yang C and
Li J: Dasatinib enhances antitumor activity of paclitaxel in
ovarian cancer through Src signaling. Mol Med Rep. 12:3249–3256.
2015.PubMed/NCBI
|
|
75
|
Secord AA, Teoh D, Jia J, Nixon AB, Grace
L, Adams DJ and Murphy SK: Dasatinib (BMS-35482) interacts
synergistically with docetaxel, gemcitabine, topotecan, and
doxorubicin in ovarian cancer cells with high SRC pathway
activation and protein expression. Int J Gynecol Cancer.
24:218–225. 2014. View Article : Google Scholar : PubMed/NCBI
|