Introduction
Colorectal cancer (CRC) is one of the most frequent
cancers in humans (1). Despite
recent advances and new treatments, including combination therapy
with anticancer and molecular targeted drugs (2,3), CRC
remains a major cause of cancer morbidity and mortality (4). Thus, there is still a need to
identify new therapeutic targets in CRC.
In the tumor microenvironment, cellular hyperplasia
and relative blood flow insufficiency often lead to tumor hypoxia.
To survive in this harsh environment, cancer cells develop adaptive
responses to hypoxia that are mediated by the activation of
hypoxia-inducible genes. In this context, hypoxia is a major
feature of cancer, and in hypoxic conditions, cancer cells can
develop into malignant cells that survive in the low-oxygen
environment. Previous reports have suggested associations between
hypoxia and solid tumors, including brain tumors (5), breast (6), liver (7), lung 8), ovarian (9), prostate (10) and CRC (11).
Microarray techniques allow researchers to detect
hypoxia-induced genes. Most hypoxia-related experiments are based
on in vitro conditions. However, the problem with hypoxic
models is that there are apparent differences between the
experimental hypoxic models and actual in vivo hypoxic
environments. In experimental hypoxic conditions, there are many
unpreventable biases, such as the degree of hypoxia, the duration
of the hypoxic conditions, pH, growth factors and nutrients.
Moreover, it is almost impossible to replicate the complex cellular
interactions that occur in vivo in an in vitro
environment.
We reported previously that liver metastasis of CRC
is like 'in vivo' hypoxia culture box, and that it is useful
for identifying hypoxia-inducible potential prognostic factors and
therapeutic targets (12). We used
this model to identify the following novel hypoxia-inducible genes:
Jumonji domain containing 1A (JMJD1A) (12), adrenomedullin (ADM) (13), ephrin-A1 (EFNA1) (14), procollagen-lysine, 2-oxoglutarate
5-dioxygenase 2 (PLOD2) (15) and
secretoglobin, family 2A, member 1 (SCGB2A1) (16).
In the present study, we investigated the
involvement of fructose-bisphosphate aldolase A (ALDOA) in CRC.
ALDOA is one of the glycolytic enzymes that catalyzes the
reversible conversion of fructose-1,6-bisphosphate to
glyceraldehyde-3-phosphate and dihydroxyacetone phosphate (17). Notably, previous studies have
reported that ALDOA is a downstream target of hypoxia-inducible
factor 1-alpha (HIF1A) (18,19),
and several studies have reported a relationship between ALDOA and
cancers such as osteosarcoma (20,21),
lung squamous cell carcinoma (22)
and hepatocellular carcinoma (23).
The aim of the present study was to investigate the
prognostic value and the biological significance of ALDOA in CRC.
We determined the expression of ALDOA in clinical samples and
performed functional analyses of ALDOA using overexpression and
knockdown assays. Furthermore, our data suggest possible mechanisms
that underlie the correlation of ALDOA with cancer malignancy.
Materials and methods
Cell lines and culture conditions
Six human CRC cell lines were used in this study.
HCT116 and LoVo cells were purchased from the Japanese Collection
of Research Bioresources Cell Bank (JCRB; Tokyo, Japan), and HT29
and SW480 cells were purchased from the American Type Culture
Collection (ATCC; Manassas, VA, USA). DLD-1 cells were purchased
from the Cell Resource Center for the Biomedical Research Institute
of Development, Aging, and Cancer at Tohoku University. The KM12SM
cells were the kind gift of Professor T. Minamoto (Kanazawa
University, Ishikawa, Japan). Authenticity of all cells was
confirmed. Cells were cultured in Dulbecco's modified Eagle's
medium containing 10% fetal bovine serum (FBS), 100 U/ml penicillin
and 100 µg/ml streptomycin in a 37°C incubator supplied with
5% CO2. Hypoxic culture conditions (1% O2)
were achieved in a multi-gas incubator (Panasonic MCO-5MUV;
Panasonic, Osaka, Japan) using a continuous infusion of a gas
mixture (95% N2, 5% CO2).
Ethics statement regarding the use of
clinical samples
The use of clinical samples was approved by the
Human Ethics Review Committee of the Graduate School of Medicine,
Osaka University. Written informed consent was obtained from all
patients included in the study.
Clinical tissue samples
For western blot analysis, 6 surgical CRC samples
from patients with no preoperative chemotherapy or irradiation were
randomly selected from samples collected at Osaka University
Hospital in 2016. For immunohistochemical staining, 14 surgical
samples of colorectal liver metastases from patients with no
preoperative chemotherapy or irradiation were collected from 2012
to 2015 at the Osaka University Hospital.
Clinical sample collection and microarray
analysis
Microarray analysis was performed as previously
described (12,16,24).
A total of 222 clinical samples were collected from consecutive
patients who underwent curative (R0) resection for CRC from 2003 to
2006 at the Osaka University Hospital and its nine associated
hospitals. The mean follow-up time was 40.2±26.4 months for
patients with disease-free survival (DFS) and 52.7±18.5 months for
all surviving patients (overall survival, OS). Table I shows the clinicopathological
features of the patients, including gender, tumor location, depth
of invasion, lymph node metastasis, histological grade, Dukes'
stage and vessel invasion. None of the patients whose samples were
analyzed in this study received preoperative chemotherapy or
irradiation. After surgery, patients with Dukes' stage C tumors
were generally treated with 5-fluorouracil (5-FU)-based
chemotherapy.
 | Table IThe relationship between ALDOA
expression and clinicopathological factors in patients with
colorectal cancer (n=222). |
Table I
The relationship between ALDOA
expression and clinicopathological factors in patients with
colorectal cancer (n=222).
| Total (n=222) | ALDOA expression
|
|---|
| Low (n=111) | High (n=111) | P-value |
|---|
| Age (years); mean ±
SD | 66.2±10.0 | 65.3±9.6 | 67.1±10.2 | 0.24 |
| Gender |
| Male/female | 133/89 | 65/46 | 68/43 | 0.78 |
| Tumor location |
| Colon/rectum | 141/81 | 68/43 | 73/38 | 0.58 |
| Depth of
invasion |
| ≤mp/≥ss | 27/195 | 12/99 | 15/96 | 0.68 |
| Lymph node
metastasis |
|
Present/absent | 109/113 | 45/66 | 64/47 | 0.016a |
| Histological
grade |
| Well
differentiated/other | 53/169 | 27/84 | 26/85 | 1 |
| Dukes' stage |
| AB/CD | 110/112 | 67/44 | 43/68 | 0.002a |
| Vessel
invasion |
|
Present/absent | 184/38 | 89/22 | 95/16 | 0.37 |
Quantitative PCR
mRNA expression was determined by real-time
polymerase chain reaction (PCR). Total RNA was isolated using an
RNeasy Maxi kit (Qiagen, Valencia, CA, USA), and reverse
transcription was performed using the reverse transcription system
(Promega, Madison, WI, USA) according to the manufacturer's
instructions. The real-time PCR analysis was performed using the
LightCycler 2.0 instrument system (Roche Diagnostics, Mannheim,
Germany), based on Thunderbird SYBR qPCR Mix (Toyobo Co., Ltd.,
Osaka, Japan). The β-actin housekeeping gene was used as an
internal control. The following primers were used in the present
study: ALDOA: forward 5′-CTGCCAGTATGTGACCGAGA-3′ and reverse
5′-ACAGGAAGGTGATCCCAGTG-3′; HIF1A: forward
5′-GAAAGCGCAAGTCCTCAAAG-3′ and reverse 5′-TGGGTAGGAGATGGAGATGC-3′;
vimentin: forward 5′-CCCTCACCTGTGAAGTGGAT-3′ and reverse
5′-TCCAGCAGCTTCCTGTAGGT-3′; and β-actin: forward
5′-GATGAGATTGGCATGGCTTT-3′ and reverse 5′-CACCTTCACC GTTCCAGTTT-3′.
The analysis was performed using the standard curve method. For
data analysis, raw counts were normalized to the housekeeping gene
average for the same time-point and condition.
Western blotting
Proteins were extracted from the cells and clinical
samples in radio-immunoprecipitation assay (RIPA) buffer (Thermo
Fisher Scientific, Waltham, MA, USA). Clinical samples were
homogenized in RIPA buffer using an ultrasonic disruptor
(Ultrasonic Disruptor UD-201; Tomy Seiko, Co., Ltd., Tokyo, Japan).
Proteins were separated by electrophoresis on SDS-PAGE Tris-HCl
gels (Bio-Rad Laboratories, Hercules, CA, USA). The separated
proteins were transferred onto polyvinylidene difluoride membranes
and blocked with 5% skim milk in Tris-buffered saline with Tween-20
(TBS-T) at room temperature for 1 h. The blots were incubated with
primary antibodies overnight and then with HRP-linked anti-rabbit
or anti-mouse IgG (GE Healthcare Biosciences, Piscataway, NJ, USA)
at a dilution of 1:100,000 for 1 h at room temperature. The
antigen-antibody complex was detected with the ECL Prime Western
blotting detection kit (GE Healthcare Biosciences).
Antibodies for western blot analysis
Western blot analyses were carried out using the
following antibodies: anti-ALDOA (#3188; Cell Signaling Technology,
Danvers, MA, USA); anti-E-cadherin (sc-7870; Santa Cruz
Biotechnology, Inc., Santa Cruz, CA, USA); anti-vimentin (#5741;
Cell Signaling Technology) and anti-ACTB (A2066; Sigma-Aldrich, St.
Louis, MO, USA).
Immunohistochemical staining
Paraffin-embedded tissue sections (4-µm) were
deparaffinized. After antigen retrieval treatment,
immunohistochemical staining was performed using the Vectastain ABC
Peroxidase kit (Vector Laboratories, Burlingame, CA, USA). The
tissue sections were then incubated overnight at 4°C with
antibodies at the following dilutions: anti-ALDOA, 1:100 (ab169544;
Abcam, Cambridge, MA, USA) and anti-CA9, 1:100 (#5649; Cell
Signaling Technology).
Expression vector transfection
Cell lines were transfected with an ALDOA expression
vector (pCMV6-XL5 vector, SC108418; Origene Technologies, Inc.,
Rockville, MD, USA) using the FuGENE®6 transfection
reagent (Promega) according to the manufacturer's recommended
protocol. The same method was used to transfect cells with an empty
vector as negative controls.
Small interfering RNA transfection
Cell lines were transfected with 20 nM siRNA
targeting ALDOA expression (Silencer Select siRNA, siRNA ID s71,
cat. no. 4390824; Life Technologies, Carlsbad, CA, USA:
5′-AGUCCCUCUUCGU CUCUAATT-3′ and 5′-UUAGAGACGAAGAGGGACUAG-3′) using
Lipofectamine® RNAiMAX transfection reagent (Invitrogen,
Carlsbad, CA, USA) according to the manufacturer's recommended
protocol. The same method was used to transfect cells with negative
control siRNA (Silencer Select negative control #1 siRNA, cat. no.
4390843; Life Technologies).
Proliferation assay
The proliferation assay was performed as previously
described (16). ALDOA
overexpression cells and knockdown cells plus controls for each
cell line were seeded and cultured in a 37°C incubator supplied
with 5% CO2. After 24, 48, 72 and 96 h of incubation,
cell viability was measured using the Cell Counting kit-8 (CCK-8;
Dojindo Laboratories, Kumamoto, Japan) according to the
manufacturer's recommended protocol. CCK-8 solution was added to
each well and incubated for 2 h.
Chemosensitivity assay
The chemosensitivity assay was performed as
previously described (16). Cell
viability was measured after 48 h of incubation in drug-containing
medium at IC50 concentrations.
Radiosensitivity assay
The radiosensitivity assay was performed as
previously described (16). Cells
were exposed to 8-Gy single-dose irradiation using a Gammacell 40
Exactor 137Cs radiation source (Nordion, Inc., Ottawa,
ON, Canada) and cell viability was measured after 48 h of
incubation in normal medium.
Sphere formation assay
The ability of cells to form spheres was evaluated
in Dulbecco's modified Eagle's medium/Nutrient Mixture F-12
(DMEM/F12) supplemented with 20 ng/ml epidermal growth factor
(Invitrogen), 20 ng/ml human platelet growth factor (Sigma-Aldrich)
and 1% antibiotic-antimycotic solution (Invitrogen). Single cells
were plated at a concentration of 100 cells/well in each well of a
96-well ultralow attachment plate (Corning Life Sciences, Acton,
MA, USA) and cultured in a 37°C incubator supplied with 5%
CO2. The number of spheres ≥100 µm in each well
was counted to evaluate the sphere-forming ability.
Invasion assay
The invasion assay was performed using
Corning® BioCoat™ Matrigel® Invasion Chambers
(Corning Life Sciences). Briefly, 25,000 cells were seeded in
triplicate onto the Matrigel-coated membrane. After 48 h, cells
that had invaded the undersurface of the membrane were fixed and
stained with Diff-Quik (Sysmex Internal Reagents, Co., Ltd., Kobe,
Japan). Three microscopic fields were randomly selected for cell
counting.
Lactate production assay
Lactate production was measured using the Lactate
Colorimetric Assay kit II (BioVision, Inc., Milpitas, CA, USA).
Cells were seeded in 12-well plates (Corning Life Sciences) at
densities of 100,000 cells (DLD-1) and 150,000 cells (HT29 and
KM12SM) per well. After 24 h, the cells were transfected with siRNA
targeting ALDOA or with an ALDOA expression vector, and then 48 h
after transfection, the subconfluent cells were washed three times
with phosphate-buffered saline (PBS). Krebs-Ringer bicarbonate
buffer containing 10 mM glucose was added, and the amount of
lactate was assessed 30 min later in aliquots of media from each
well. The absorbance at 450 nm was then measured using the Bio-Rad
Model 680 XR microplate reader (Bio-Rad Laboratories).
Apoptosis assay
Apoptosis was measured by flow cytometry using the
Annexin V-FITC apoptosis kit (BioVision) according to the
manufacturer's recommended protocol.
The samples were analyzed using BD FACSAria IIu™
instrument (BD Biosciences, San Jose, CA, USA). Both early
apoptotic (Annexin V-FITC-positive, PI-negative) and necrotic/late
apoptotic (Annexin V-FITC-positive, PI-positive) cells were
quantified as apoptotic cells.
Analysis of reactive oxygen species
(ROS)
ROS production was measured using the
CellROX® Deep Red reagent (Invitrogen) according to the
manufacturer's recommended protocol. Fluorescence was measured
using the BD FACSAria IIu instrument (BD Biosciences).
Cell cycle analysis
Cell cycle phase distribution was analyzed by flow
cytometry using PI staining. Briefly, cells were fixed in 70%
ethanol on ice for 30 min. Fixed cells were incubated in a solution
containing 0.1 mg/ml RNase A at 37°C for 20 min and then in a
solution containing 25 µg/ml PI on ice for 2 min.
Fluorescence was measured immediately using the BD FACSAria IIu
instrument. Flow cytometry data were analyzed using FlowJo software
(Tree Star, Inc., Ashland, OR, USA).
Statistical analysis
Data management and statistical analysis were
performed using the JMP software (version 11.0; SAS Institute,
Inc., Cary, NC USA). Tests for associations were performed using
the Student's t-tests and Chi-squared tests. The cumulative patient
OS and DFS were compared using the Kaplan-Meier technique, and
log-rank tests and Cox's model were used to assess the risk ratio
for multivariate analysis. A P<0.05 was considered statistically
significant.
Results
Relationship between ALDOA expression and
clinicopathological features
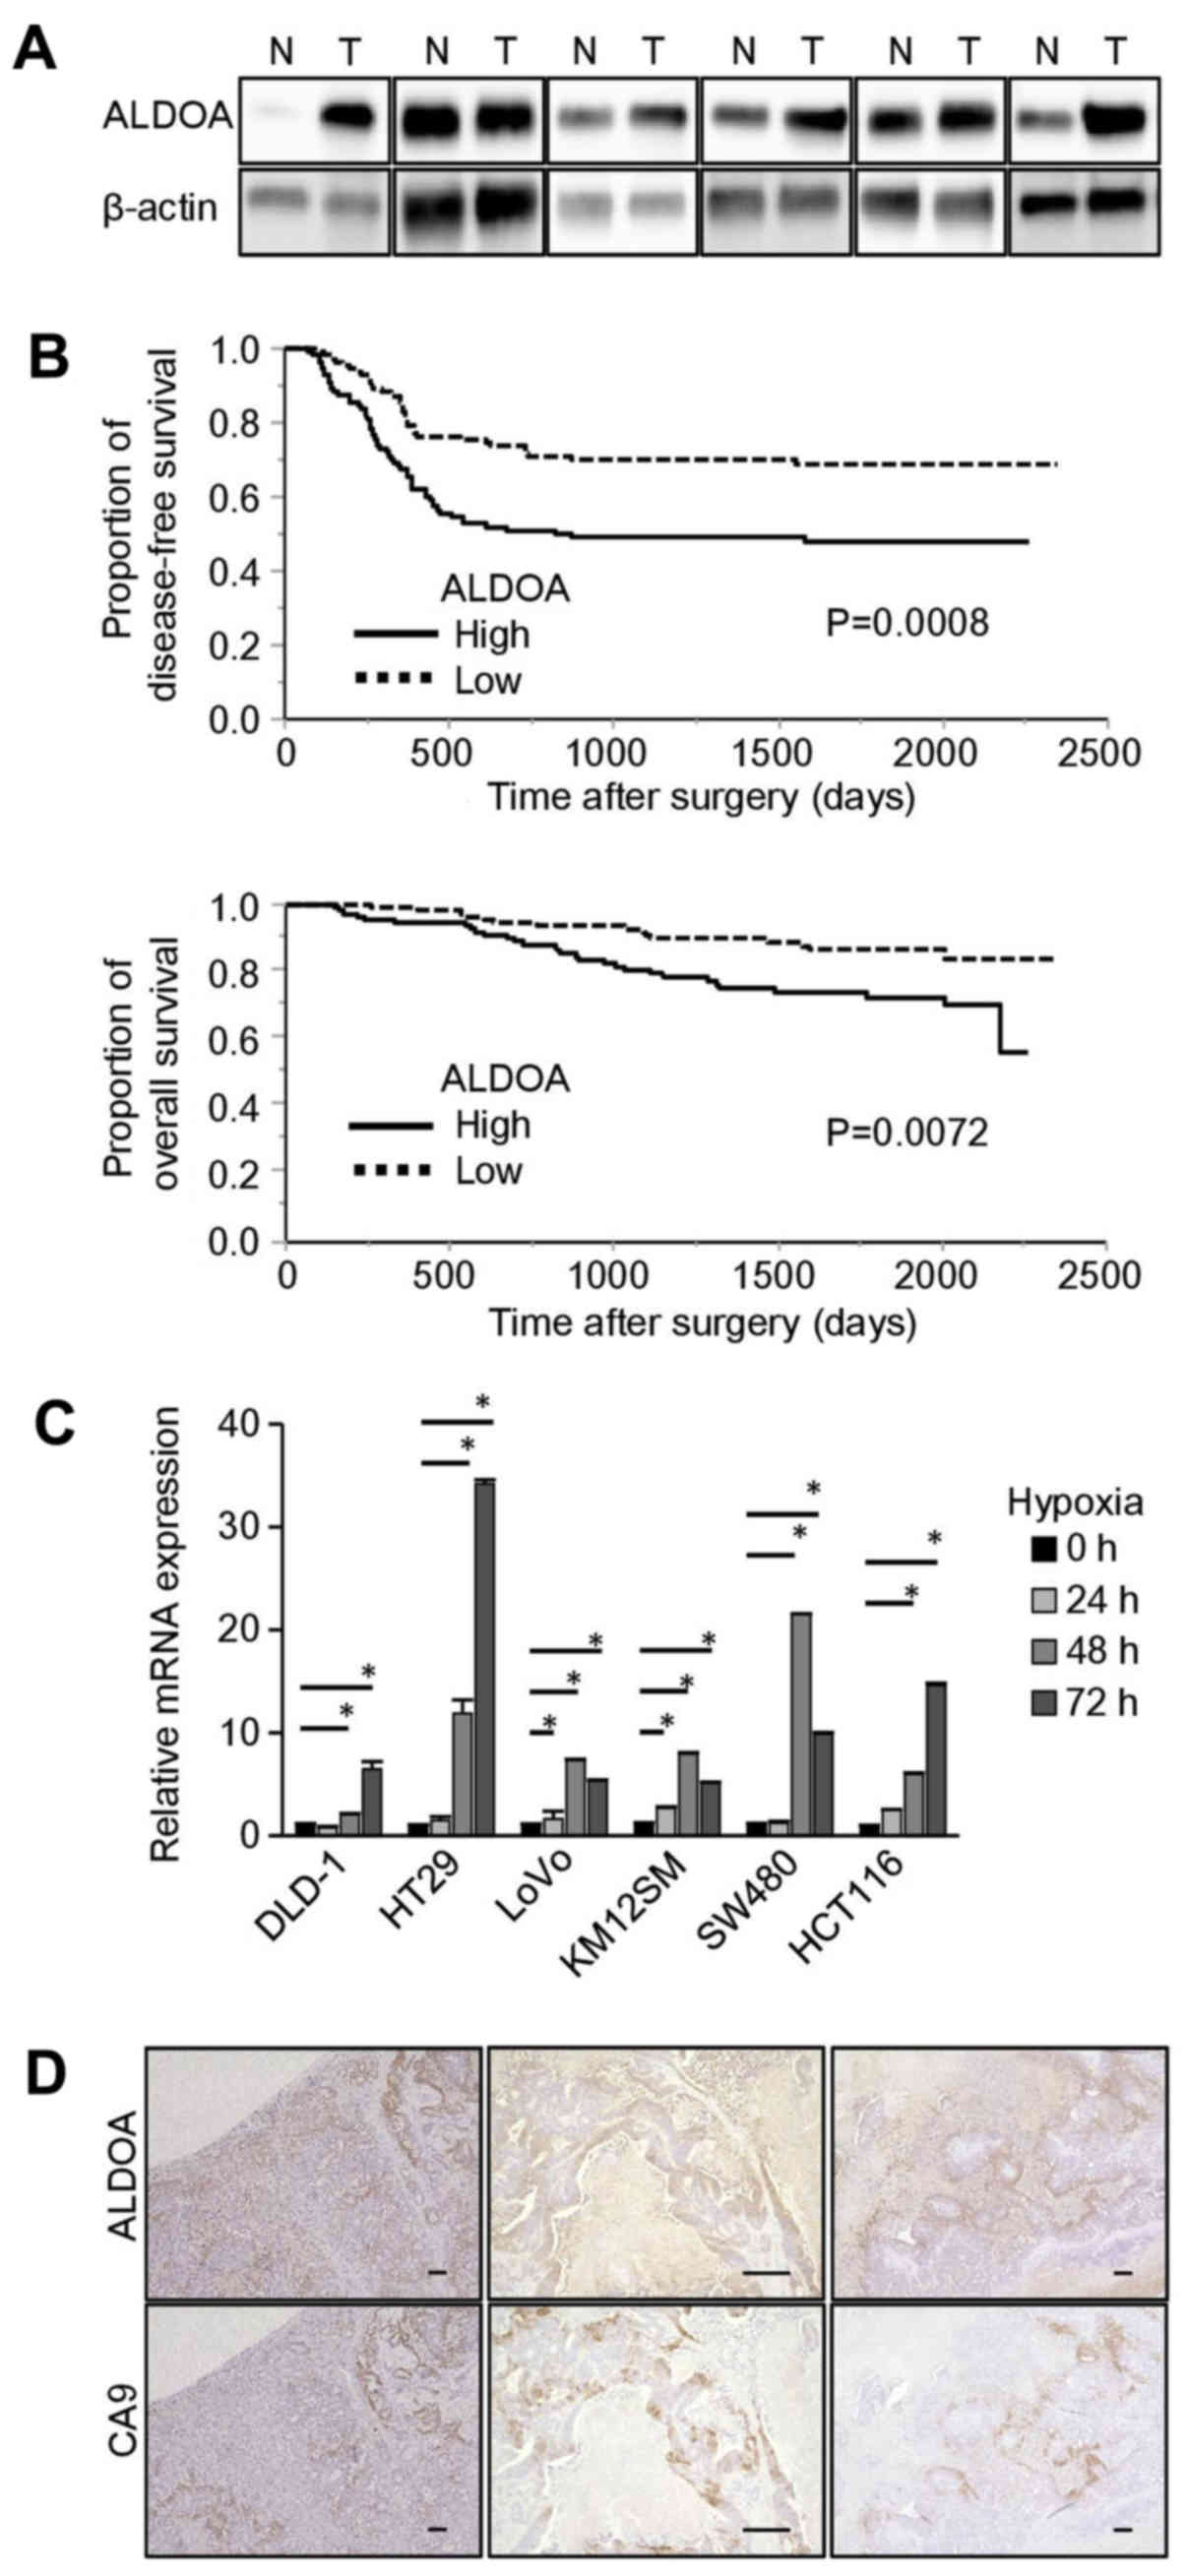
Western blot analysis indicated that in 5 out of 6
randomly selected CRC surgical samples, ALDOA expression was higher
in tumor tissue than in normal colon mucosa (Fig. 1A). Then, the 222 CRC patients were
divided into two groups according to the ALDOA mRNA expression
level in the tumor samples. The relationships between ALDOA mRNA
expression and clinicopathological features were analyzed (Table I). The high ALDOA expression group
included more patients with lymph node metastasis than the low
expression group (P=0.016), as for other clinicopathological
factors, there were no significant differences.
ALDOA mRNA expression level is
significantly associated with DFS and OS
DFS and OS were significantly longer in the low
expression group than in the high expression group (DFS: P=0.0008,
OS: P=0.0072; Fig. 1B). Univariate
and multivariate analysis showed that ALDOA mRNA expression was a
significant prognostic factor for DFS (P=0.0013; Table II) and for OS (P=0.0124; Table III).
| Table IIUnivariate and multivariate analysis
of clinicopathological factors associated with disease-free
survival in patients with colorectal cancer (n=222). |
Table II
Univariate and multivariate analysis
of clinicopathological factors associated with disease-free
survival in patients with colorectal cancer (n=222).
| Univariate analysis
| Multivariate
analysis
|
|---|
| P-value | Relative risk | 95% CI | P-value |
|---|
| Tumor location |
| Colon/rectum | 0.036a | 0.592 | 0.288–0.908 | 0.0167a |
| Depth of
invasion |
| ≤mp/≥ss | 0.0058a | 0.313 | 0.093–0.781 | 0.01a |
| Lymph node
metastasis |
|
Present/absent | <0.0001a | 1.324 | 0.852–2.100 | 0.2149 |
| Histological
grade |
| Well
differentiated/others | 0.0193a | 0.704 | 0.379–1.212 | 0.2147 |
| Dukes' stage |
| AB/CD | <0.0001a | | | |
| Vessel
invasion |
|
Present/absent | 0.0002a | 3.311 | 0.090–0.763 | 0.0088a |
| ALDOA |
| High/low | 0.0008 | 2.01 | 1.310–3.127 | 0.0013a |
| Table IIIUnivariate and multivariate analysis
of clinicopathological factors of overall survival in patients with
colorectal cancer (n=222). |
Table III
Univariate and multivariate analysis
of clinicopathological factors of overall survival in patients with
colorectal cancer (n=222).
| Univariate analysis
| Multivariate
analysis
|
|---|
| P-value | Relative risk | 95% CI | P-value |
|---|
| Tumor location |
| Colon/rectum | 0.8715 | | | |
| Depth of
invasion |
| ≤mp/≥ss | 0.241 | | | |
| Lymph node
metastasis |
|
Present/absent | <0.0001a | 3.219 | 1.342–9.060 | 0.0075a |
| Histological
grade |
| Well
differentiated/others | 0.0632 | | | |
| Dukes' stage |
| AB/CD | <0.0001a | | | |
| Vessel
invasion |
|
Present/absent | 0.0237a | 1.635 | 0.444–10.579 | 0.498 |
| ALDOA |
| High/low | 0.0072a | 2.71 | 1.231–6.593 | 0.0124a |
ALDOA expression is upregulated under
hypoxic conditions
In all of the CRC cell lines we examined, ALDOA mRNA
expression was significantly increased after 48 to 72 h of culture
in hypoxic conditions compared with the levels in cells cultured in
normoxic conditions (Fig. 1C).
Immunohistochemical staining of CRC liver metastases showed that
the regions stained by the anti-ALDOA antibody were almost the same
as the regions stained by an antibody to carbonic anhydrase IX
(CA9), which is an endogenous hypoxia marker (Fig. 1D).
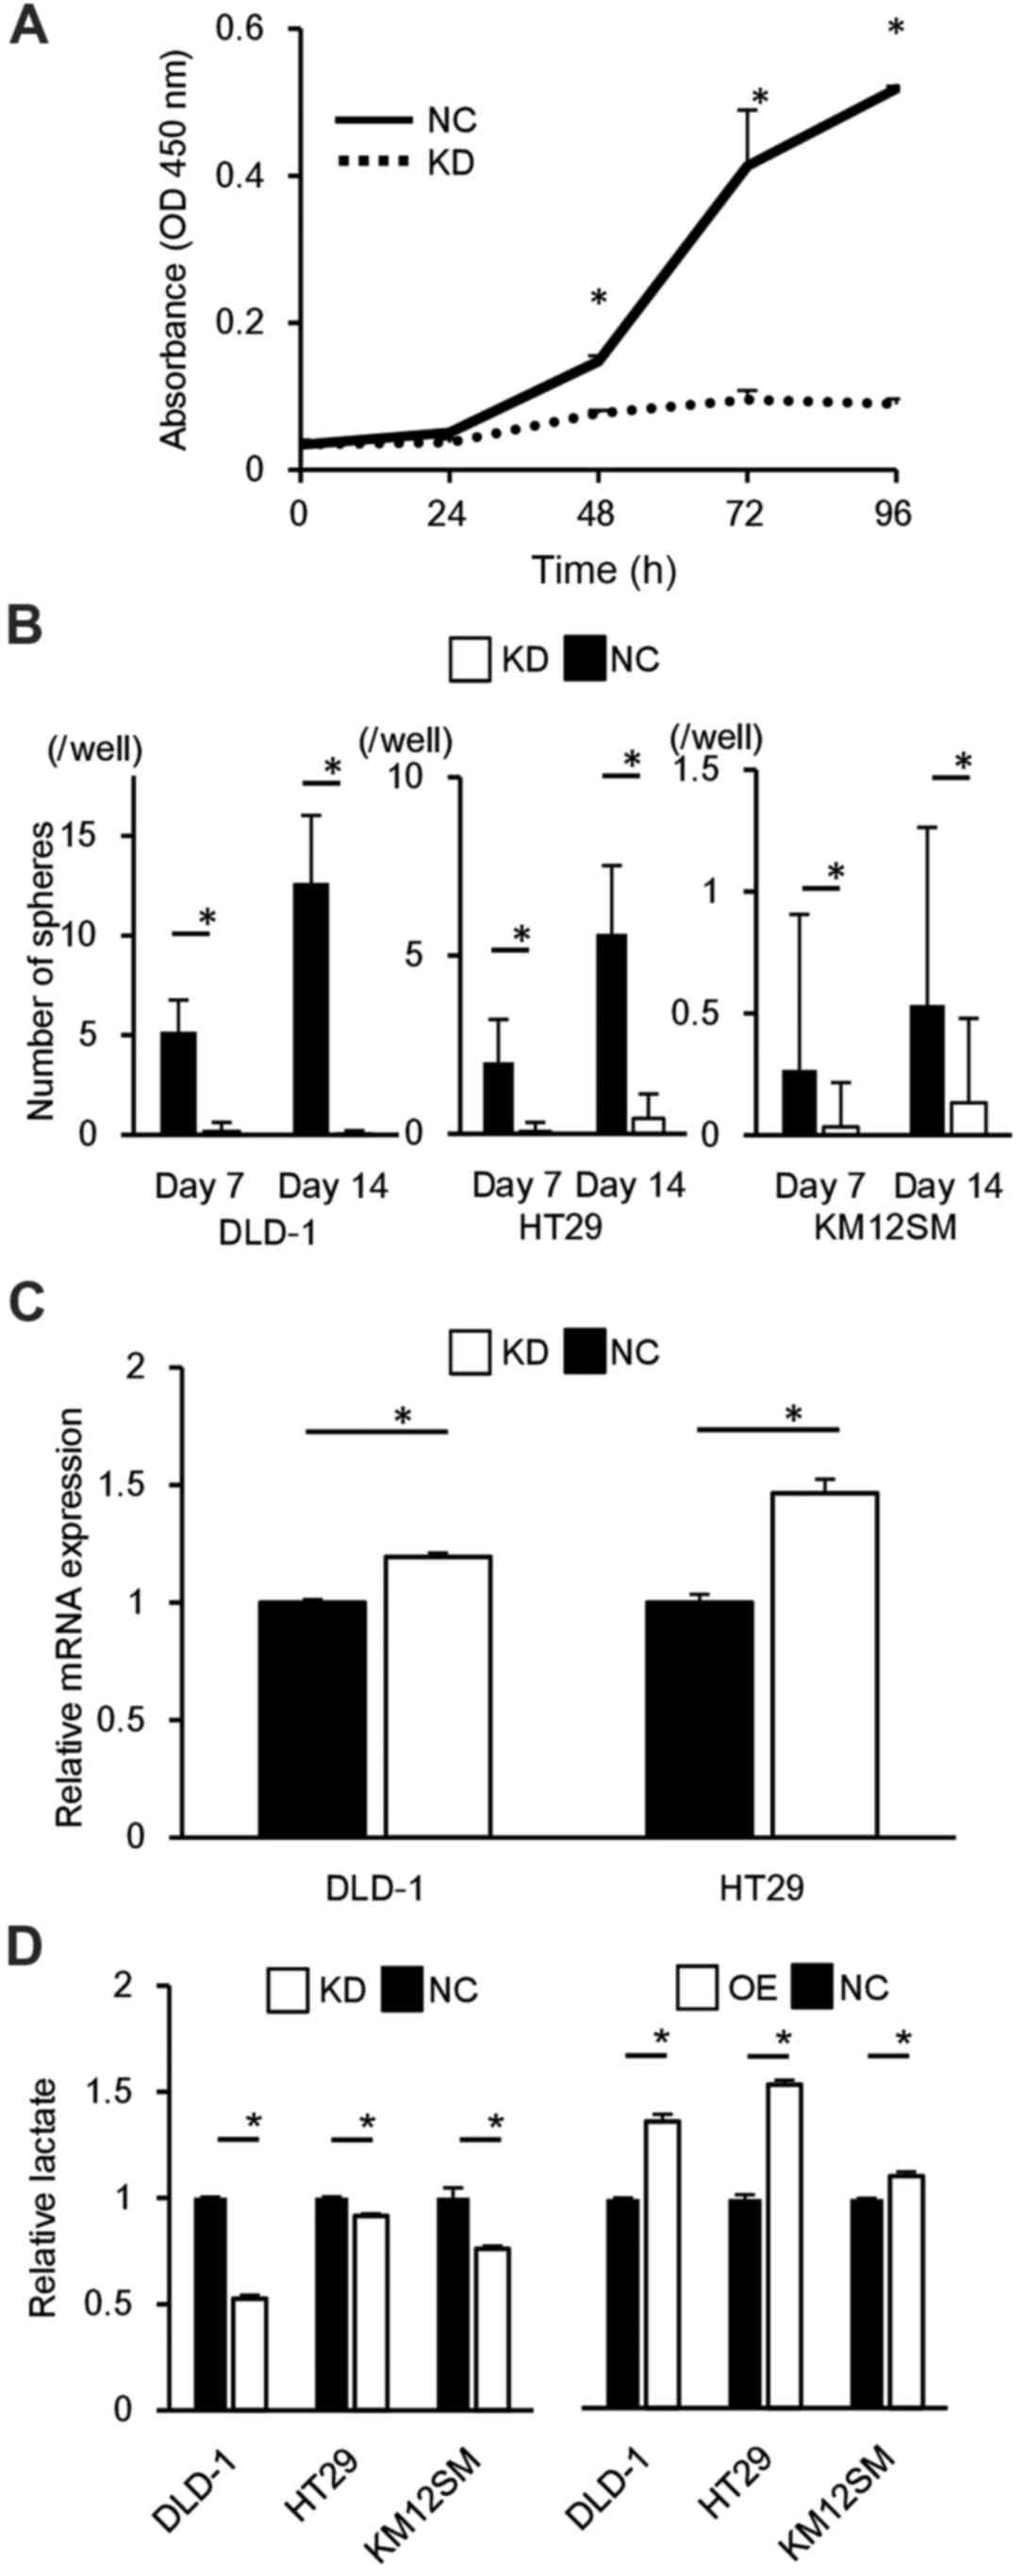
ALDOA expression correlates with
proliferative potential in CRC cells
PCR and western blot analysis demonstrated high
transfer efficiency of the ALDOA expression vector and of the siRNA
targeting ALDOA (data not shown). In the CRC-derived cell lines
DLD-1 HT29 and KM12SM, upregulation of ALDOA expression induced
significant cell proliferation compared to controls at 72 h
(P<0.05; Fig. 2A), and
downregulation of ALDOA expression reduced cell proliferation
compared to controls at 72 h (P<0.05; Fig. 2B).
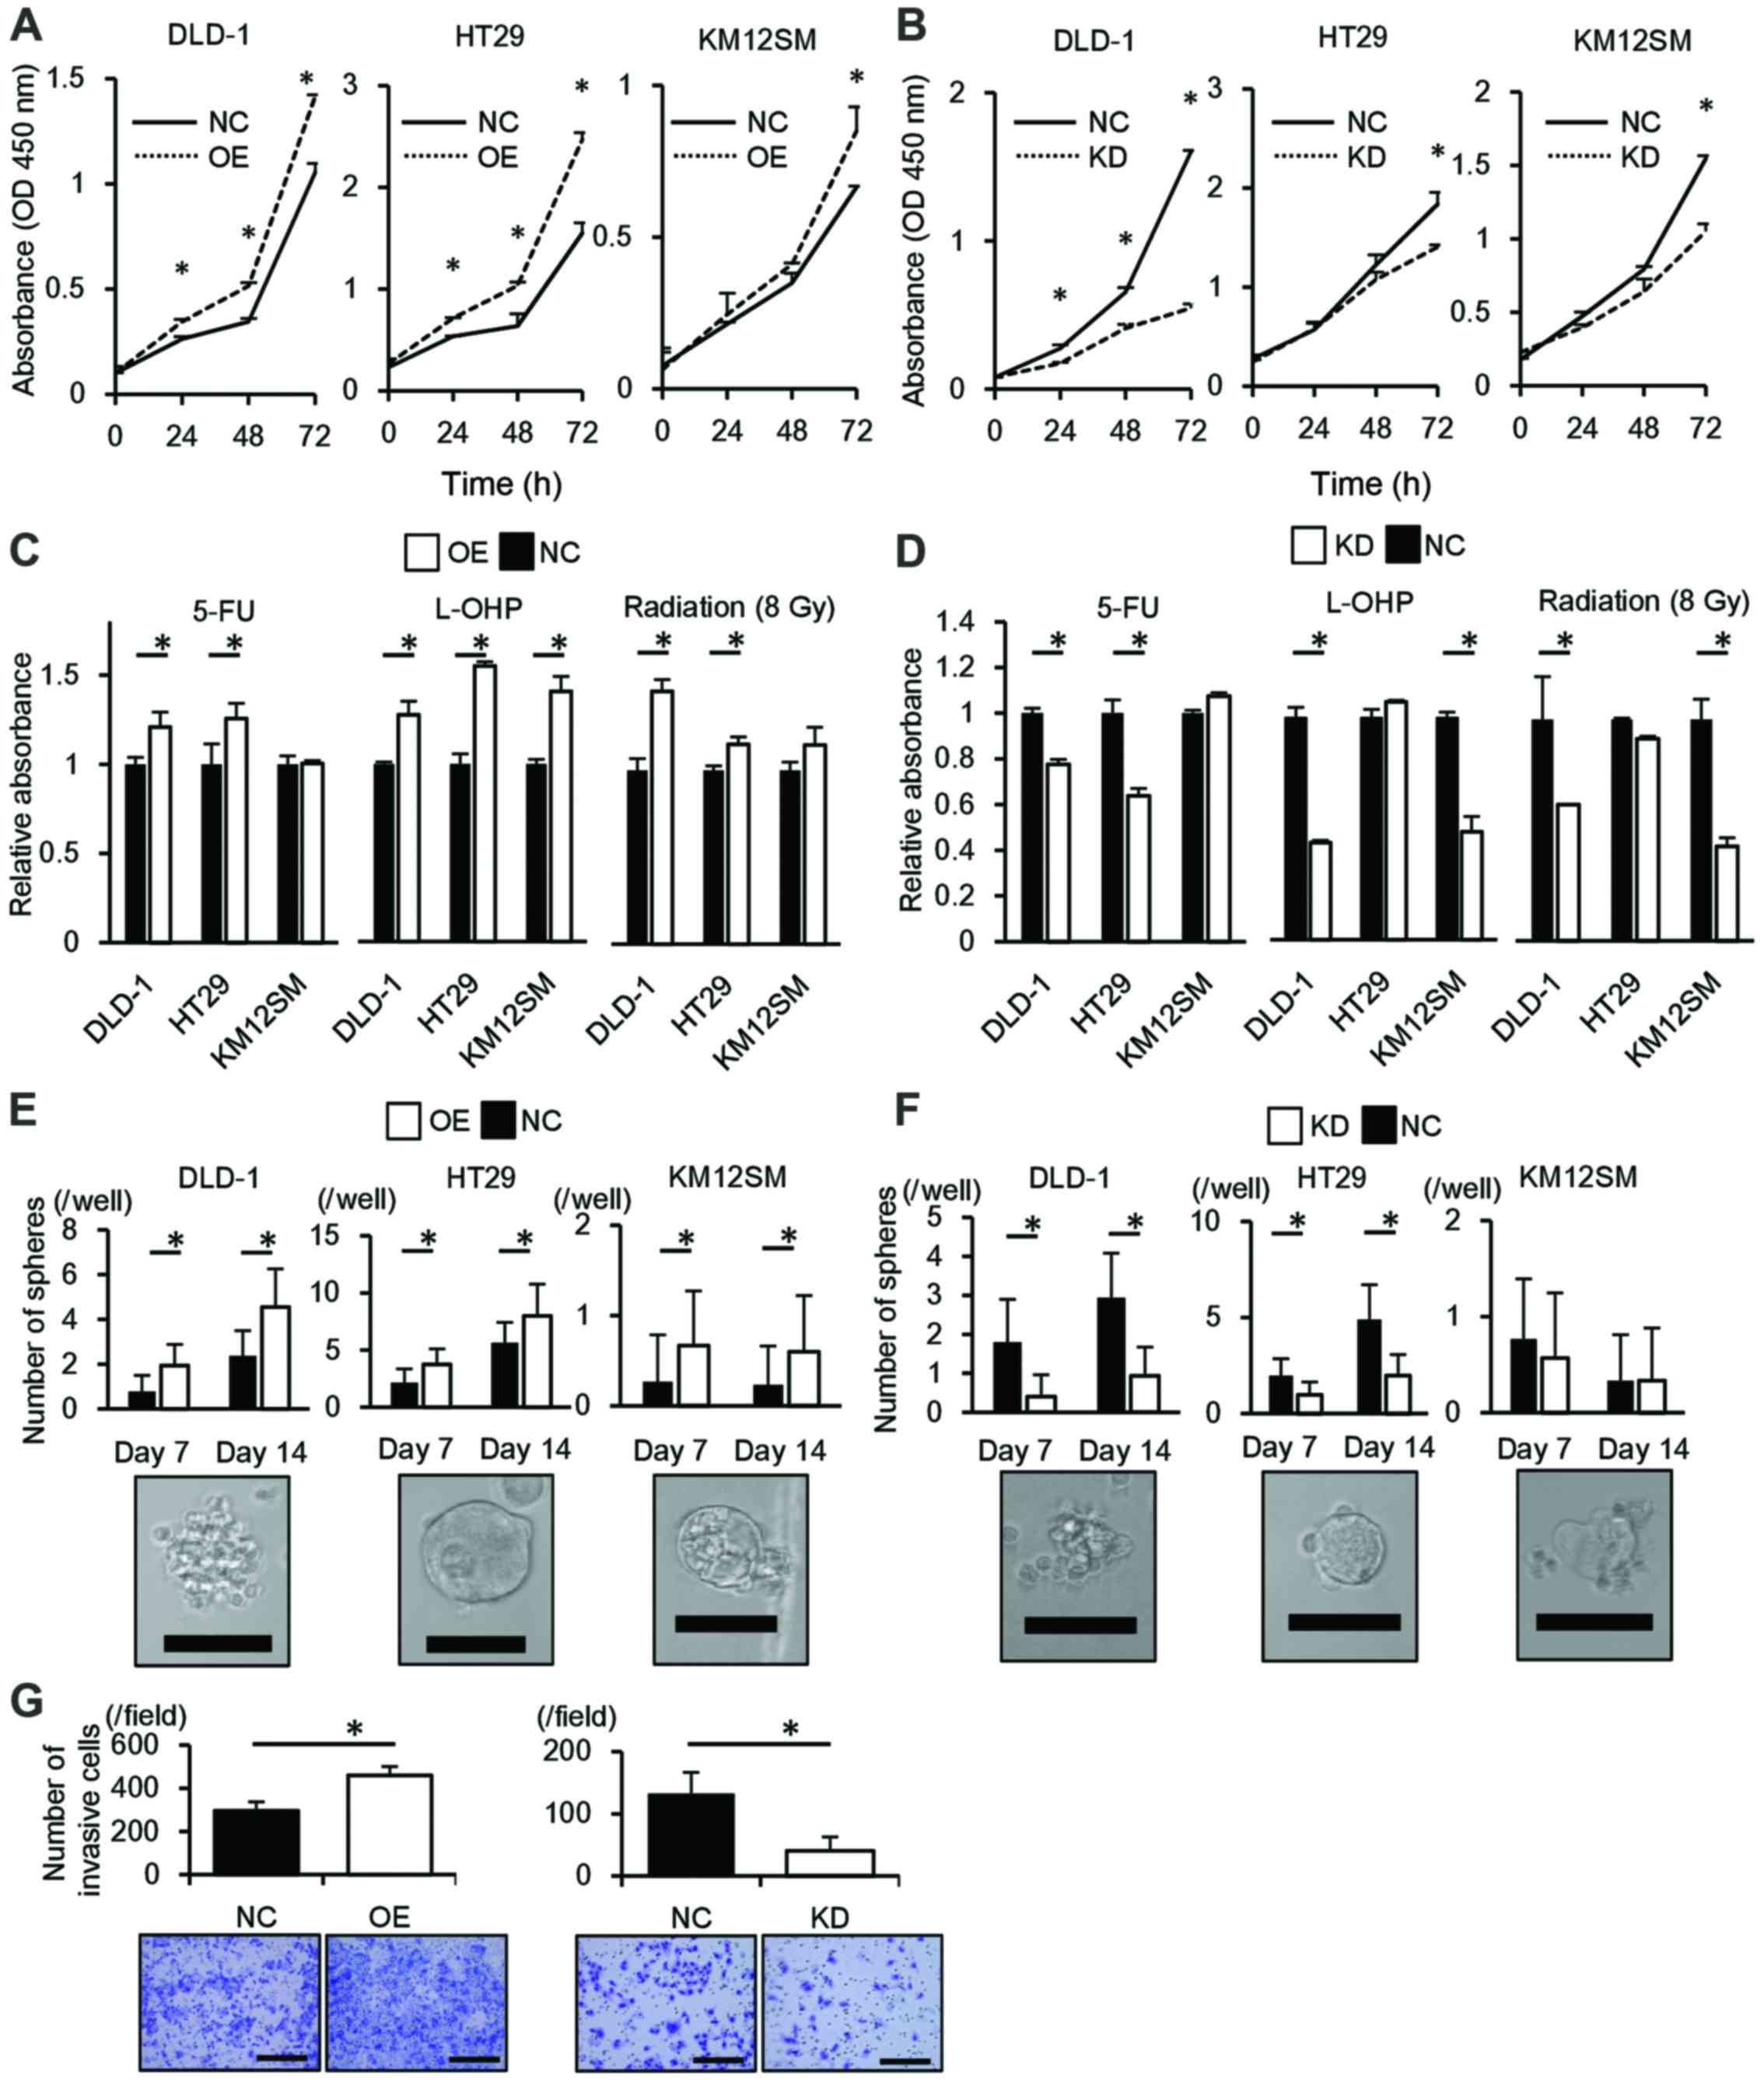 | Figure 2ALDOA is associated with the
malignant potential of cancer. (A) The proliferation of cells
transfected with the ALDOA expression vector. (B) The proliferation
of cells transfected with siRNA targeting ALDOA expression. (C) The
chemosensitivity and radiosensitivity of cells transfected with the
ALDOA expression vector. (D) The chemosensitivity and
radiosensitivity of cells transfected with siRNA targeting ALDOA
expression. (E) Sphere formation by cells transfected with the
ALDOA expression vector. Lower panel, representative images of a
sphere; scale bar, 100 µm. (F) Sphere formation by cells
transfected with siRNA targeting ALDOA expression. Lower panel,
representative images of a sphere; scale bar, 100 µm. (G)
Invasion by ALDOA overexpression cells (left) and ALDOA knockdown
cells (right). Lower panel, representative images of the
undersurface of the membrane; scale bar, 200 µm. The results
represent the means ± SD of three independent experiments. 5-FU,
5-fluorouracil; KD, ALDOA knockdown; L-OHP, oxaliplatin; NC,
negative control; OE, ALDOA overexpression. *P<0.05,
Student's t-test. |
ALDOA confers chemoresistance and
radioresistance
Upregulation of ALDOA significantly reduced
chemosensi-tivity to 5-FU in DLD-1 and HT29 cells and to
oxaliplatin in all three cell lines compared to controls
(P<0.05; Fig. 2C). In contrast,
ALDOA downregulation significantly induced chemosensitivity to 5-FU
in DLD-1 and HT29 cells and to oxaliplatin in DLD-1 and KM12SM
cells compared to controls (P<0.05; Fig. 2D). Upregulation of ALDOA
significantly reduced radiosensitivity in DLD-1 and HT29 cells and
that downregulation significantly induced radiosensitivity in DLD-1
and KM12SM cells compared to controls (P<0.05; Fig. 2C and D).
Correlation of ALDOA expression with
sphere formation
DLD-1, HT29 and KM12SM cells that overexpressed
ALDOA were more tumorigenic than controls (P<0.05; Fig. 2E). In DLD-1 and HT29, ALDOA
knockdown cells were less tumorigenic than controls (P<0.05;
Fig. 2F).
ALDOA induces cell invasion
DLD-1 cells that overexpressed ALDOA invaded the
Matrigel-coated membrane significantly faster than control cells
(P<0.05) and ALDOA knockdown cells invaded significantly more
slowly than control (P<0.05; Fig.
2G).
ALDOA expression is necessary for cancer
cells to grow in hypoxic conditions
To examine the role of ALDOA in hypoxia, the
proliferation and sphere formation assay were performed in hypoxic
conditions. DLD-1 cells transfected with siRNA targeting ALDOA
barely proliferated and formed very few spheres compared to
controls (P<0.05; Fig. 3A and
B). Similarly, in the other cell lines, ALDOA knockdown cells
formed hardly any spheres compared to controls (P<0.05; Fig. 3B), collectively indicating that
ALDOA is necessary for proliferation and tumor formation in hypoxic
conditions. In addition, PCR analysis showed that HIF1A expression
is upregulated by knockdown of ALDOA, probably because of a
negative feedback loop (Fig.
3C).
ALDOA expression is proportional to the
activity of glycolytic pathway
In DLD-1, HT29 and KM12SM cells, the knockdown of
ALDOA resulted in a decrease in lactate production compared to
controls, and, in contrast, its overexpression resulted in an
increase in lactate production (P<0.05; Fig. 3D). This means that the expression
of ALDOA and the activity of the glycolytic pathway were positively
correlated.
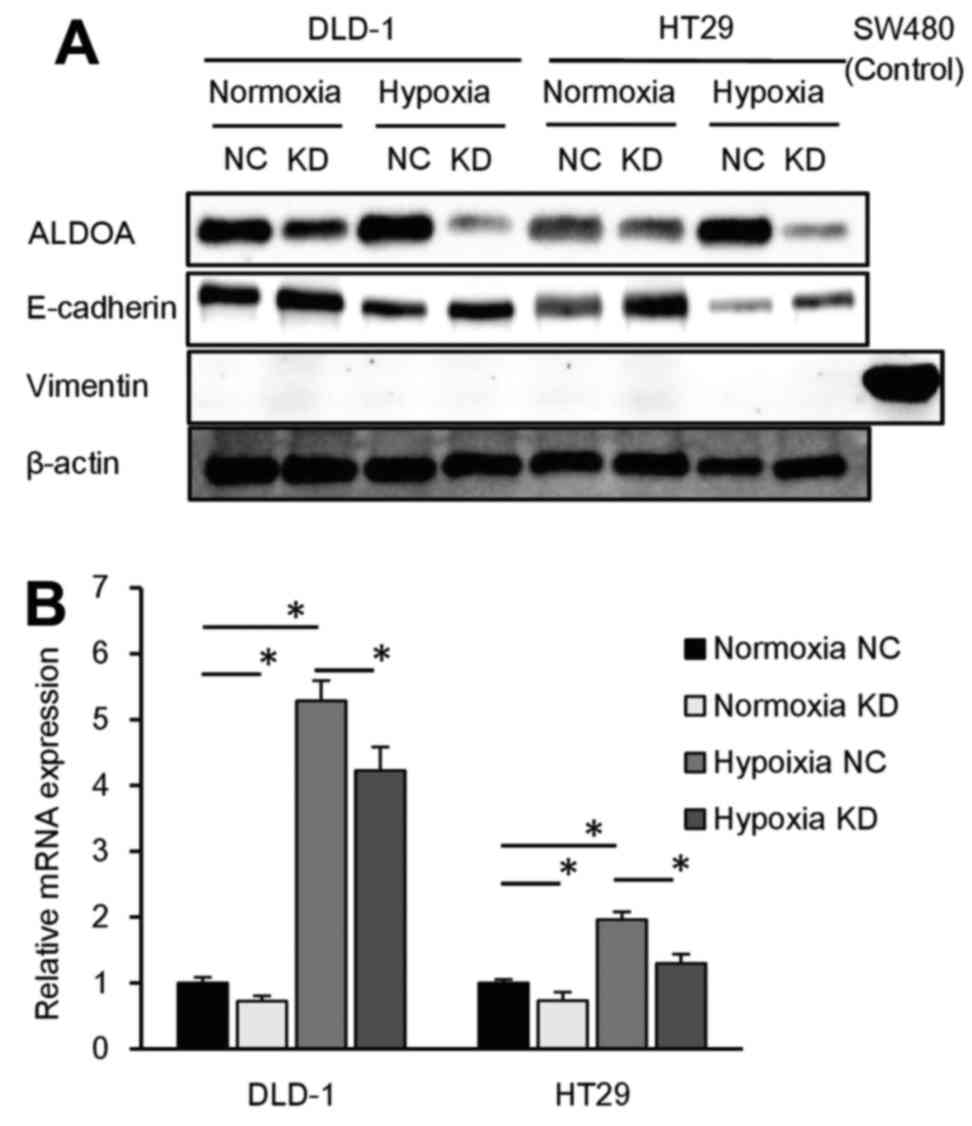
ALDOA expression is associated with EMT
progression
ALDOA knockdown assay was performed under hypoxia to
assess the function of ALDOA in hypoxic conditions. To focus on the
relationship between ALDOA and epithelial-mesenchymal transition
(EMT), we performed western blot analysis to assess the expression
of EMT markers in ALDOA knockdown DLD-1 and HT29 cells cultured
under normoxic and hypoxic conditions. We found that E-cadherin
expression was reduced by hypoxia and induced by knockdown of ALDOA
both in normoxia and hypoxia. As for mesenchymal markers, vimentin
expression level was too low to detect on western blots (Fig. 4A). PCR revealed that vimentin mRNA
expression was reduced by ALDOA knockdown in both normoxia and
hypoxia (P<0.05; Fig. 4B).
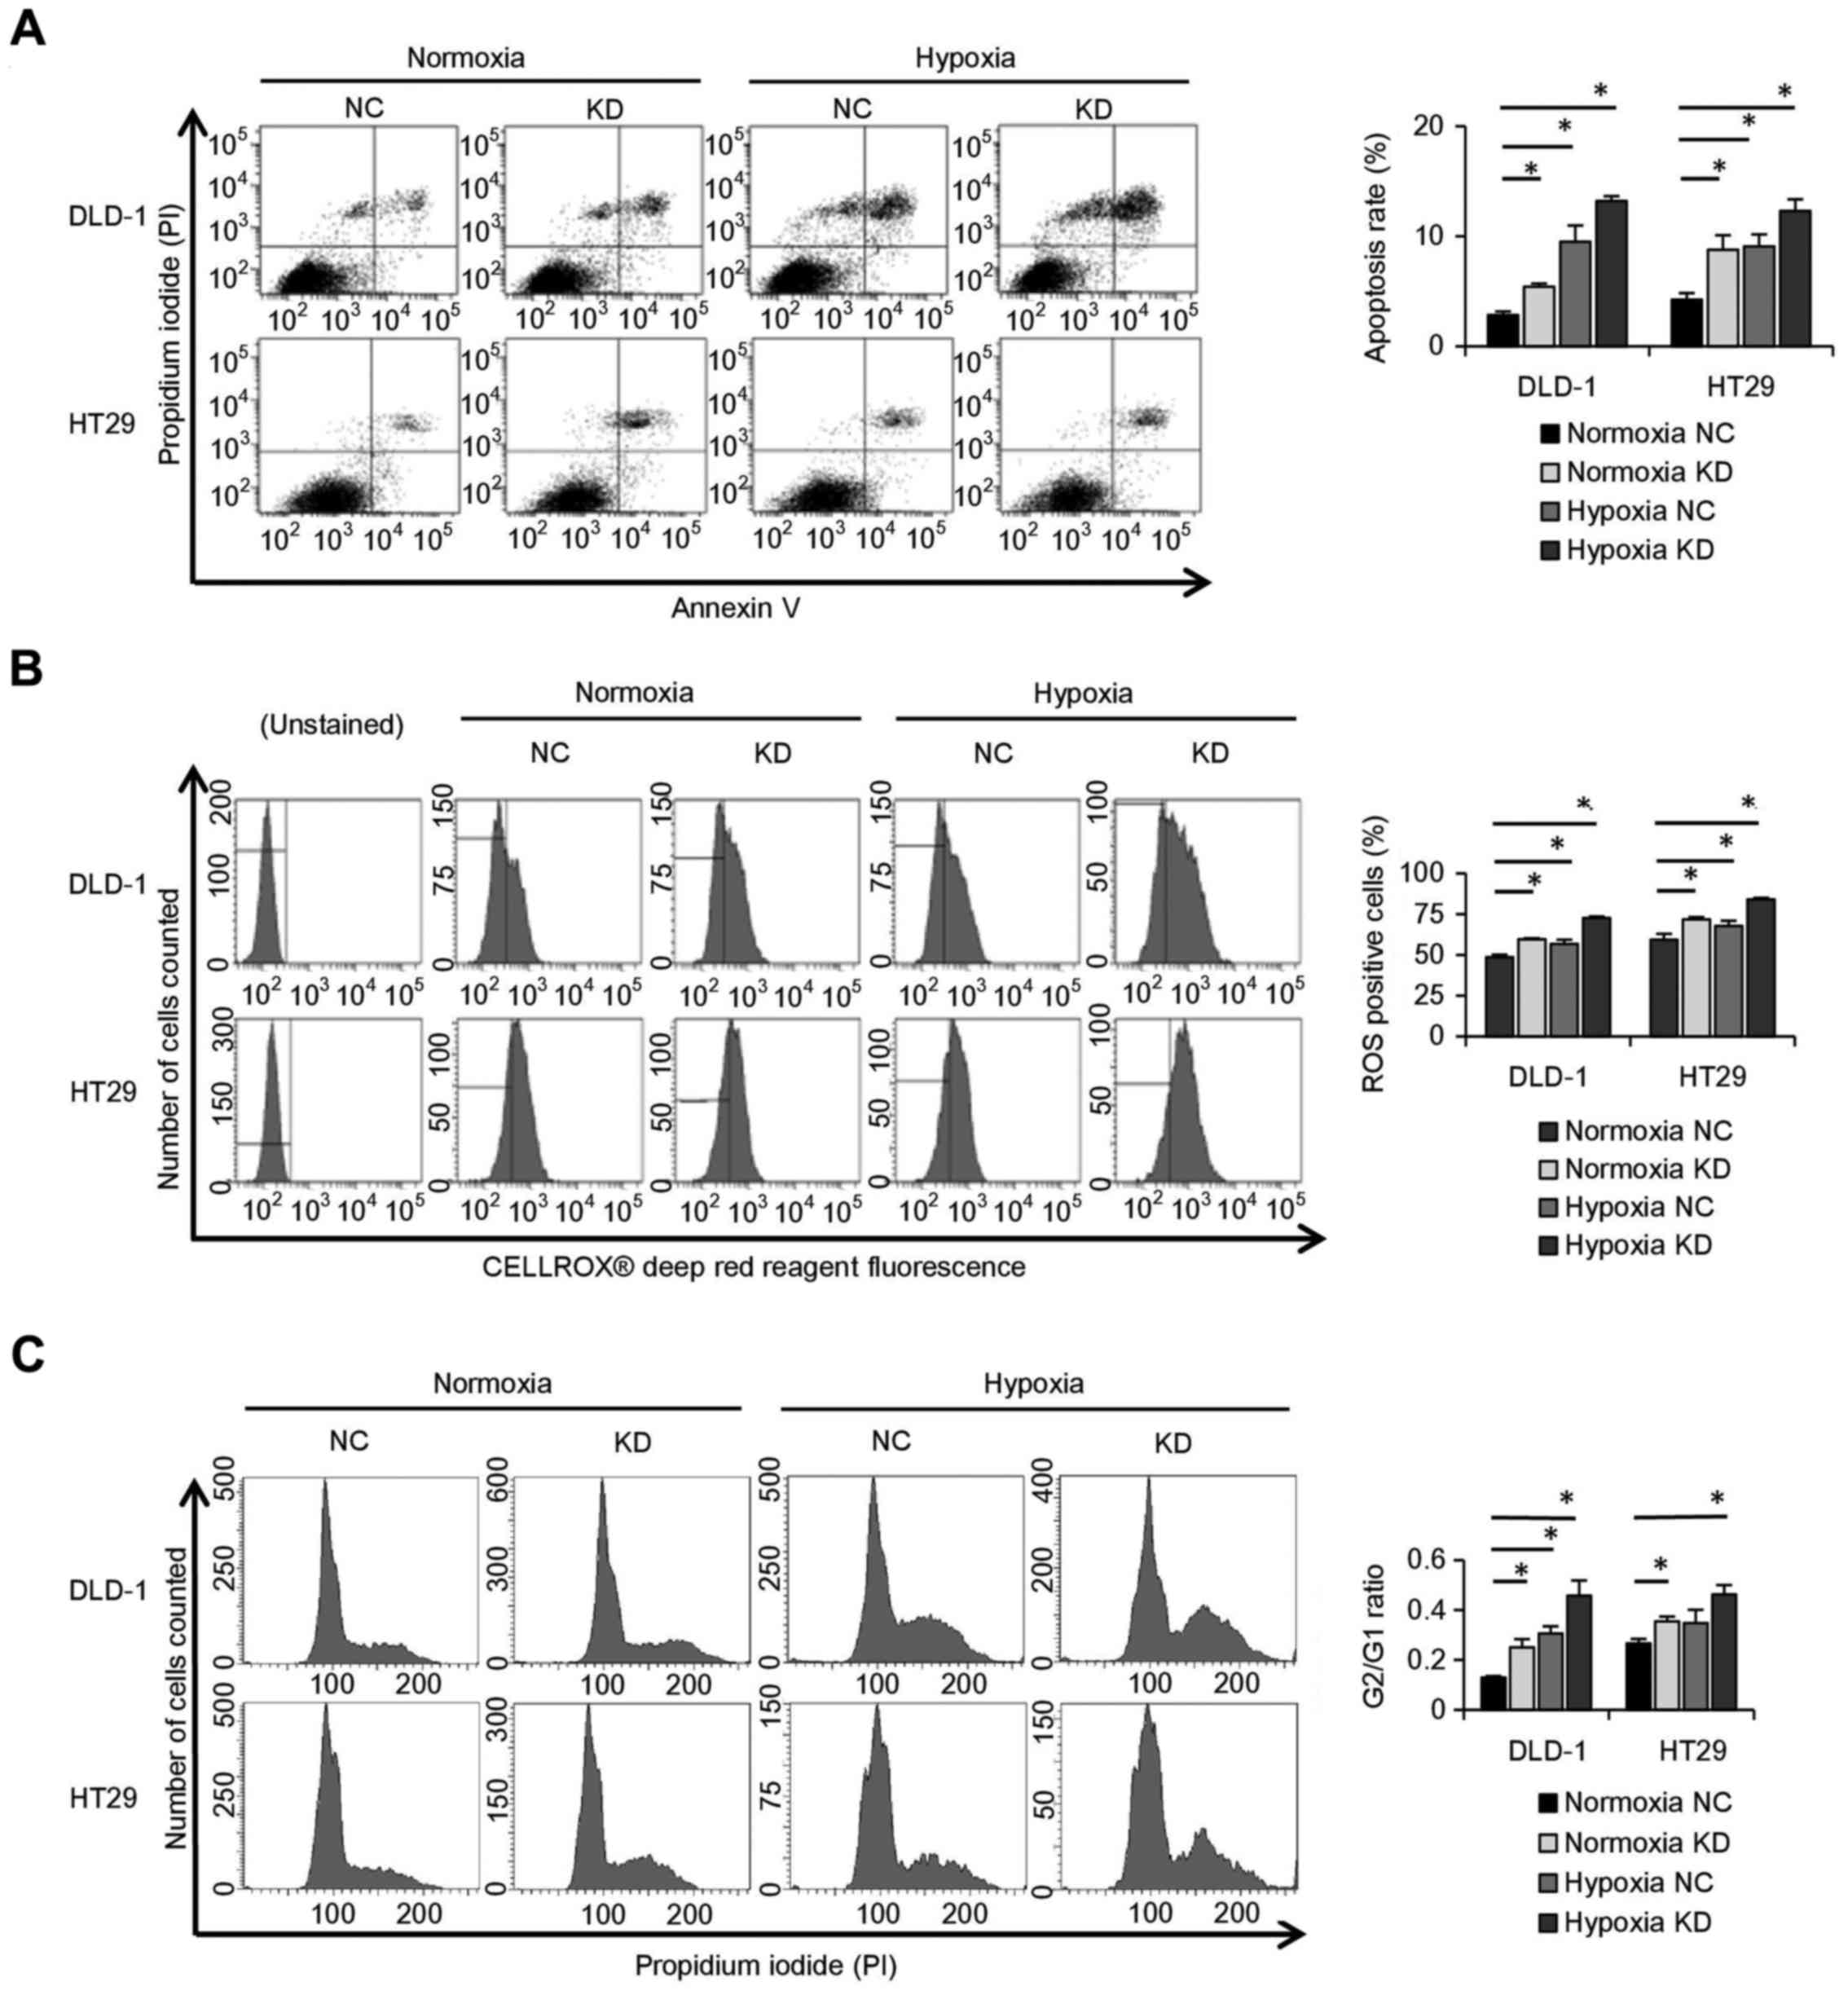
Knockdown of ALDOA stops cell cycle
progression and enhances apoptosis due to rapid accumulation of
ROS
The rate of apoptosis was higher in hypoxic DLD-1
and HT29 cells than in normoxic cells. It also showed that the rate
of apoptosis was higher in ALDOA knockdown cells than in controls
in both hypoxia and normoxia (P<0.05; Fig. 5A). In addition, the ROS-positive
cell rate of ALDOA knockdown cells was higher than controls both in
hypoxia and in normoxia (P<0.05; Fig. 5B). Cell cycle analysis showed that
the G2/G1 ratio was higher in ALDOA knockdown cells than in
controls in both hypoxia and normoxia (P<0.05; Fig. 5C).
Discussion
There has been increasing interest in glycolytic
enzymes as potential therapeutic targets because the
cancer-specific metabolism depends more on the glycolytic pathway
than on aerobic respiration, a phenomenon called the Warburg effect
(25). The present report is the
first to characterize the importance of ALDOA in CRC and to
investigate in detail the possible mechanisms underlying that
relationship.
The most meaningful finding in the present study was
that there is a close association between ALDOA expression and the
clinicopathological features and the malignant potential of CRC,
including cancer cell proliferation, sphere formation,
chemoresistance, radioresistance and invasion.
It seems likely that the relevance of ALDOA to
cancer proliferation, sphere formation, and radioresistance is
based on the function of ALDOA in glycolysis and cell cycle
regulation. Other studies have reported that the glycolytic pathway
and the expression of glycolytic enzymes are associated with cancer
radiosensitivity (26,27). We showed that ALDOA expression is
positively correlated with the activity of glycolysis, with cell
cycle progression and with ROS production. ALDOA is an isozyme of
the aldolase family, and a previous study showed that aldolase is
involved in the cell cycle. Its involvement in cell cycle
progression is mediated by the binding of aldolase to F-actin, with
the cell cycle defects observed at M phase (28). Our flow cytometry data were
consistent with these data. As a result of the cell cycle defect at
M phase, the G2/G1 ratio increased when ALDOA was knocked down.
Both inhibition of the glycolytic pathway and the arrest of cell
division caused by ALDOA knockdown induced apoptosis, probably
because of the increase in oxidative stress and the inhibition of
tumor progression.
As for the relevance of ALDOA in chemoresistance and
invasion, we suggested an association of ALDOA expression with EMT
progression. Other studies have previously concluded that the EMT
correlates with chemoresistance (29,30),
thus, it appeared that the association of ALDOA expression with the
EMT led to chemoresistance and cancer invasion in CRC cell lines.
This seems in line with the observed relationship between ALDOA
expression and the clinicopathological features of CRC i.e. the
ALDOA high expression group included more patients with lymph node
metastasis than the low expression group (Table I).
ALDOA is a hypoxia-inducible gene and a downstream
target of HIF1A. Hypoxia is an important feature in cancer
malignancy, and under hypoxic conditions the glycolytic pathway is
upregulated by activating HIF1A. Notably, the EMT is upregulated in
hypoxic environments (31), while
cell cycle progression is inhibited (7); accordingly, the present study
verified the effect of ALDOA on cancer under hypoxic conditions.
Our data revealed that especially under hypoxic conditions, ALDOA
is essential for CRC cell proliferation and sphere formation. On
the other hand, knockdown of ALDOA in normoxic conditions resulted
in less proliferation and sphere formation, but the gap with the
control was not so clear as in hypoxia. It is speculated that in
hypoxic conditions, cancer cells may try to adapt to hypoxia by
upregulating hypoxia-inducible genes; however, when ALDOA is
knocked down, they are unable to adapt, and the growth of cancer
cells stops. This implies that particularly in hypoxic conditions,
cancer cells could not grow well without ALDOA expression.
In summary, we found that ALDOA positively regulated
the activity of the glycolytic pathway and the EMT and was
necessary for cell cycle progression. Thus, ALDOA is implicated in
CRC proliferation, sphere formation, therapeutic resistance and
invasion.
Acknowledgments
The present study was supported by the JSPS KAKENHI
Grand Number 15K10140 and the Takeda Science Foundation.
Abbreviations:
|
ADM
|
adrenomedullin
|
|
ALDOA
|
fructose-bisphosphate aldolase A
|
|
CA9
|
carbonic anhydrase IX
|
|
CRC
|
colorectal cancer
|
|
DFS
|
disease-free survival
|
|
EFNA1
|
ephrin-A1
|
|
EMT
|
epithelial-mesenchymal transition
|
|
HIF1A
|
hypoxia-inducible factor 1-alpha
|
|
OS
|
overall survival
|
|
PCR
|
polymerase chain reaction
|
|
PI
|
propidium iodide
|
|
PLOD2
|
procollagen-lysine, 2-oxoglutarate
5-dioxygenase 2
|
|
RIPA
|
radio immunoprecipitation assay
|
|
SCGB2A1
|
secretoglobin, family 2A, member 1
|
|
5-FU
|
5-fluorouracil
|
References
|
1
|
Weitz J, Koch M, Debus J, Höhler T, Galle
PR and Büchler MW: Colorectal cancer. Lancet. 365:153–165. 2005.
View Article : Google Scholar : PubMed/NCBI
|
|
2
|
Beppu N, Yoshie H, Kimura F, Aihara T, Doi
H, Kamikonya N, Matsubara N, Tomita N, Yanagi H and Yamanaka N:
Clinicopathological outcomes of preoperative chemoradiotherapy
using S-1 plus Irinotecan for T4 lower rectal cancer. Surg Today.
46:852–859. 2016. View Article : Google Scholar
|
|
3
|
Saeki H, Emi Y, Kumashiro R, Otsu H,
Kawano H, Ando K, Ida S, Kimura Y, Tokunaga E, Oki E, et al: Impact
of second-line and later cetuximab-containing therapy and KRAS
genotypes in patients with metastatic colorectal cancer: A
multicenter study in Japan. Surg Today. 44:1457–1464. 2014.
View Article : Google Scholar
|
|
4
|
Jemal A, Siegel R, Xu J and Ward E: Cancer
statistics, 2010. CA Cancer J Clin. 60:277–300. 2010. View Article : Google Scholar : PubMed/NCBI
|
|
5
|
Jensen RL: Brain tumor hypoxia:
Tumorigenesis, angiogenesis, imaging, pseudoprogression, and as a
therapeutic target. J Neurooncol. 92:317–335. 2009. View Article : Google Scholar : PubMed/NCBI
|
|
6
|
Vaupel P, Briest S and Höckel M: Hypoxia
in breast cancer: Pathogenesis, characterization and
biological/therapeutic implications. Wien Med Wochenschr.
152:334–342. 2002. View Article : Google Scholar : PubMed/NCBI
|
|
7
|
Zhang L, Huang G, Li X, Zhang Y, Jiang Y,
Shen J, Liu J, Wang Q, Zhu J, Feng X, et al: Hypoxia induces
epithelial-mesenchymal transition via activation of SNAI1 by
hypoxia-inducible factor -1α in hepatocellular carcinoma. BMC
Cancer. 13:1–9. 2013. View Article : Google Scholar
|
|
8
|
Lee GW, Go SI, Cho YJ, Jeong YY, Kim HC,
Duk Lee J, Hwang YS, Ko GH, Lee JH, Kim DC, et al:
Hypoxia-inducible factor-1α and excision repair cross-complementing
1 in patients with small cell lung cancer who received front-line
platinum-based chemotherapy: A retrospective study. J Thorac Oncol.
7:528–534. 2012. View Article : Google Scholar : PubMed/NCBI
|
|
9
|
Liang D, Ma Y, Liu J, Trope CG, Holm R,
Nesland JM and Suo Z: The hypoxic microenvironment upgrades
stem-like properties of ovarian cancer cells. BMC Cancer.
12:2012012. View Article : Google Scholar : PubMed/NCBI
|
|
10
|
Higgins LH, Withers HG, Garbens A, Love
HD, Magnoni L, Hayward SW and Moyes CD: Hypoxia and the metabolic
phenotype of prostate cancer cells. Biochim Biophys Acta.
1787:1433–1443. 2009. View Article : Google Scholar : PubMed/NCBI
|
|
11
|
Chang LH, Chen CH, Huang DY, Pai HC, Pan
SL and Teng CM: Thrombin induces expression of twist and cell
motility via the hypoxia-inducible factor-1α translational pathway
in colorectal cancer cells. J Cell Physiol. 226:1060–1068. 2011.
View Article : Google Scholar
|
|
12
|
Uemura M, Yamamoto H, Takemasa I, Mimori
K, Hemmi H, Mizushima T, Ikeda M, Sekimoto M, Matsuura N, Doki Y,
et al: Jumonji domain containing 1A is a novel prognostic marker
for colorectal cancer: In vivo identification from hypoxic tumor
cells. Clin Cancer Res. 16:4636–4646. 2010. View Article : Google Scholar : PubMed/NCBI
|
|
13
|
Uemura M, Yamamoto H, Takemasa I, Mimori
K, Mizushima T, Ikeda M, Sekimoto M, Doki Y and Mori M:
Hypoxia-inducible adrenomedullin in colorectal cancer. Anticancer
Res. 31:507–514. 2011.PubMed/NCBI
|
|
14
|
Yamamoto H, Tei M, Uemura M, Takemasa I,
Uemura Y, Murata K, Fukunaga M, Ohue M, Ohnishi T, Ikeda K, et al:
Ephrin-A1 mRNA is associated with poor prognosis of colorectal
cancer. Int J Oncol. 42:549–555. 2013.
|
|
15
|
Noda T, Yamamoto H, Takemasa I, Yamada D,
Uemura M, Wada H, Kobayashi S, Marubashi S, Eguchi H, Tanemura M,
et al: PLOD2 induced under hypoxia is a novel prognostic factor for
hepatocellular carcinoma after curative resection. Liver Int.
32:110–118. 2012. View Article : Google Scholar
|
|
16
|
Munakata K, Uemura M, Takemasa I, Ozaki M,
Konno M, Nishimura J, Hata T, Mizushima T, Haraguchi N, Noura S, et
al: SCGB2A1 is a novel prognostic marker for colorectal cancer
associated with chemoresistance and radioresistance. Int J Oncol.
44:1521–1528. 2014.PubMed/NCBI
|
|
17
|
Tochio T, Tanaka H, Nakata S and Hosoya H:
Fructose-1,6-bisphosphate aldolase A is involved in HaCaT cell
migration by inducing lamellipodia formation. J Dermatol Sci.
58:123–129. 2010. View Article : Google Scholar : PubMed/NCBI
|
|
18
|
Semenza GL, Roth PH, Fang HM and Wang GL:
Transcriptional regulation of genes encoding glycolytic enzymes by
hypoxia-inducible factor 1. J Biol Chem. 269:23757–23763.
1994.PubMed/NCBI
|
|
19
|
Sharp FR and Bernaudin M: HIF1 and oxygen
sensing in the brain. Nat Rev Neurosci. 5:437–448. 2004. View Article : Google Scholar : PubMed/NCBI
|
|
20
|
Chen X, Yang TT, Zhou Y, Wang W, Qiu XC,
Gao J, Li CX, Long H, Ma BA, Ma Q, et al: Proteomic profiling of
osteosarcoma cells identifies ALDOA and SULT1A3 as negative
survival markers of human osteosarcoma. Mol Carcinog. 53:138–144.
2014. View Article : Google Scholar
|
|
21
|
Long F, Cai X, Luo W, Chen L and Li K:
Role of aldolase A in osteosarcoma progression and metastasis: In
vitro and in vivo evidence. Oncol Rep. 32:2031–2037.
2014.PubMed/NCBI
|
|
22
|
Du S, Guan Z, Hao L, Song Y, Wang L, Gong
L, Liu L, Qi X, Hou Z and Shao S: Fructose-bisphosphate aldolase A
is a potential metastasis-associated marker of lung squamous cell
carcinoma and promotes lung cell tumorigenesis and migration. PLoS
One. 9:e858042014. View Article : Google Scholar : PubMed/NCBI
|
|
23
|
Shimizu T, Inoue K, Hachiya H, Shibuya N,
Shimoda M and Kubota K: Frequent alteration of the protein
synthesis of enzymes for glucose metabolism in hepatocellular
carcinomas. J Gastroenterol. 49:1324–1332. 2014. View Article : Google Scholar :
|
|
24
|
Munakata K, Uemura M, Tanaka S, Kawai K,
Kitahara T, Miyo M, Kano Y, Nishikawa S, Fukusumi T, Takahashi Y,
et al: Cancer stem-like properties in colorectal cancer cells with
low proteasome activity. Clin Cancer Res. 22:5277–5286. 2016.
View Article : Google Scholar : PubMed/NCBI
|
|
25
|
Warburg O: On the origin of cancer cells.
Science. 123:309–314. 1956. View Article : Google Scholar : PubMed/NCBI
|
|
26
|
Meng MB, Wang HH, Guo WH, Wu ZQ, Zeng XL,
Zaorsky NG, Shi HS, Qian D, Niu ZM, Jiang B, et al: Targeting
pyruvate kinase M2 contributes to radiosensitivity of non-small
cell lung cancer cells in vitro and in vivo. Cancer Lett.
356:985–993. 2015. View Article : Google Scholar
|
|
27
|
Pitroda SP, Wakim BT, Sood RF, Beveridge
MG, Beckett MA, MacDermed DM, Weichselbaum RR and Khodarev NN:
STAT1-dependent expression of energy metabolic pathways links
tumour growth and radioresistance to the Warburg effect. BMC Med.
7:682009. View Article : Google Scholar : PubMed/NCBI
|
|
28
|
Ritterson Lew C and Tolan DR: Targeting of
several glycolytic enzymes using RNA interference reveals aldolase
affects cancer cell proliferation through a non-glycolytic
mechanism. J Biol Chem. 287:42554–42563. 2012. View Article : Google Scholar : PubMed/NCBI
|
|
29
|
Fischer KR, Durrans A, Lee S, Sheng J, Li
F, Wong ST, Choi H, El Rayes T, Ryu S, Troeger J, et al:
Epithelial-to-mesenchymal transition is not required for lung
metastasis but contributes to chemoresistance. Nature. 527:472–476.
2015. View Article : Google Scholar : PubMed/NCBI
|
|
30
|
Singh A and Settleman J: EMT, cancer stem
cells and drug resistance: An emerging axis of evil in the war on
cancer. Oncogene. 29:4741–4751. 2010. View Article : Google Scholar : PubMed/NCBI
|
|
31
|
Majmundar AJ, Wong WJ and Simon MC:
Hypoxia-inducible factors and the response to hypoxic stress. Mol
Cell. 40:294–309. 2010. View Article : Google Scholar : PubMed/NCBI
|