Introduction
Colorectal carcinoma (CRC) is the third most common
cancer and the second leading cause of tumor related deaths in the
world (1). Given the global
distribution of morbidity from CRC, it is apparent that the
environmental factors play a significant role in its etiology. The
connection between the diet and the incidence of CRC is now
well-established (2). Although
surgery, radiotherapy, chemotherapy and targeted therapies for CRC
are improving, the existing treatment methods cannot completely
control the high incidence or low survival rates of CRC.
Chemoprevention has emerged recently as one of the most practical
and effective tools to reduce the risk of cancer (3). Bioactive substances from plants are a
source for novel antitumor drugs, and polyphenolic compounds, in
particular, have been the focus of increasing interest due to their
strong anticancer activity (4,5).
Ellegic acid (EA; 2,3,7,8-tetrahydroxy-chromeno
[5,4, 3-cde] chromene-5,10-dione; International Union of Pure and
Applied Chemistry) is a polyphenolic compound abundant in woody
plants, berries, grapes and nuts (6). EA has been found to exert both
preventive and therapeutic effects against numerous human types of
cancer, including colon, skin, prostate, breast and esophageal
cancer (7-10). A number of studies have
investigated the mechanisms of EA in the inhibition of
carcinogenesis. Recent research has demonstrated that it suppresses
cancer cell proliferation and migration by downregulation of
VEGF-induced angiogenesis, VEGF-2 tyrosine kinase activity, and
downstream MAPK and PI3K/Akt signaling pathways (10). EA also inhibits the invasive
potential of tumors through its effects on the activity of
proteases, such as collagenase/gelatinase and collagenase IV
(11). In addition, EA can reduce
the cancer cell viability by increasing the caspase-3 activity,
downregulating Bcl-2 and decreasing the activity of telomerase
(12). Although these studies
focus on the mechanisms of EA in various signaling pathways, they
failed to comprehensively encompass all of its biological
activities. Moreover, the molecular effects of EA in inhibition of
human CRC cells remain to be thoroughly elucidated.
In the present study, we used a high-throughput
GeneChip containing >20,000 known genes to identify multiple
targets affected by EA in human colon adenocarcinoma HCT-116 cells.
This cDNA microarray method detects changes in gene expression
profiles, providing evidence for the effects of anticancer agents
on cancer cells (13). The
GeneChip results were further confirmed by the real-time RT-PCR.
Multiple different functions of EA were revealed in human CRC
cells, providing vital data that will be of significant value to
researchers.
Materials and methods
EA and cell lines
EA was purchased from Sigma Chemical Co. (St. Louis,
MO, USA). A stock solution of EA was prepared in dimethyl sulfoxide
(DMSO) and filter sterilized before use. The human CRC cell line,
HCT-116, was purchased from the Cell Bank of Shanghai Institute of
Biological Sciences, Chinese Academy of Sciences (Shanghai, China).
HCT-116 cells were cultured in Dulbecco's modified Eagle's medium
(DMEM) supplemented with 10% fetal bovine serum (FBS) and 1%
penicillin streptomycin solution in an atmosphere of 95% air and 5%
CO2 in a 37°C humidified incubator.
Cell proliferation assay
HCT-116 cells were seeded in 96-well plates at a
density designed to reach ~80% confluence. Cells were allowed to
adhere and 24 h later were treated with EA at 0, 25, 50, 75, 100
and 125 µM. After 24, 48 or 72 h of treatment, 10 µl
of MTT was added to 100 µl culture medium per well. After 4
h of incubation at 37°C, the medium was removed and 150 µl
DMSO was added. The absorbance was measured at a wavelength of 490
nm in a plate reader (Bio-Rad Laboratories, Hercules, CA, USA).
Cell viability was calculated according to: OD sample/OD control ×
100%. The assay was performed in triplicate.
RNA extraction
After 72 h of EA treatment, total RNA was extracted
using TRIzol reagent (Life Technologies, Carlsbad, CA, USA) and the
RNeasy kit (Qiagen, Hilden, Germany) according to the
manufacturer's instructions. The purity and integrity of the
ribosomal RNA was checked.
Transcriptome microarray assay
Affymetrix Human Transcriptome Array 2.0 arrays (HTA
2.0) were hybridized according to the Affymetrix recommendations,
using the Ambion WT protocol and Affymetrix Labeling and
Hybridization kits. GeneChips were scanned using
Affymetrix® GeneChip Command Console (AGCC). Data were
manipulated using the Expression Console software (Affymetrix) at
the Institut Curie Microarray Core Facility.
Differential gene expression
analysis
A random variance model t-test was used to filter
differentially expressed genes (DEGs) between the the control and
the experimental groups. We selected DEGs according to a P-value
threshold corrected using the false discovery rate (FDR) method,
and a corrected P<0.05 was considered statistically significant
(14–16).
Gene Ontology (GO) analysis
To analyze the main functions of the DEGs identified
by microarray analysis, we used the Gene Ontology (the key
functional classification from NCBI), which organizes genes into
hierarchical categories and reveals regulatory networks based on
the molecular functions and biological processes (17,18).
Due to the hierarchical relationships between the GO terms, the
number of genes in each term varies widely and can be between one
and several hundred genes. For a given marginal frequency (i.e. a
constant total number of genes in a GO term), the probability of a
gene being affected by a treatment obeys a hypergeometric
distribution and P-values can be calculated by Fisher's exact test.
Essentially, the P-value of a two-tailed Fisher's exact test solves
the cumulative hypergeometric distribution values.
Specifically, two-sided Fisher's exact and
χ2 tests were used to analyze GO categories, and the FDR
was used to correct P-values (19). Scores to assess the enrichment of
GOs were calculated using the following formula:
where 'nf' is the number of DEGs in a GO,
'n' is the number of genes in a GO, 'Nf'
is the total number of DEGs, and 'N' is the total number of
genes in the annotation system ().
Pathway analysis
Pathway analysis is used to determine the
significant pathways in which DEGs participate. Since entire
biochemical processes, including metabolism, signal transduction
and the cell cycle, are described as 'pathways', a single pathway
usually contains hundreds of genes. Fisher's exact and
χ2 tests were used to detect regulatory pathways
differing significantly according to the Kyoto Encyclopedia of
Genes and Genomes (KEGG), BioCarta and Reactome, and significance
thresholds were defined by FDR-corrected P-values (21–23).
Interaction networks of DEGs
Gene network analysis using the KEGG database is
used to construct systems of interactions and overcome the
limitations of determining interactions among genes in a single
pathway. Genes with discordant records of upregulation or
downregulation of mRNA expression in the database were excluded
from the analysis and were recorded as having a negative
association by default, which was not taken into account in
multi-group differentiation analysis. The intersection was taken as
the result. Therefore, gene signaling network analysis was able to
determine the upstream and downstream molecules for proteins
throughout the KEGG pathway database.
An interaction network was constructed based on the
DEG data. Network maps were constructed using Java, which allows
users to build and analyze molecular networks. Analysis was based
on the KEGG interaction database. Networks were stored and
presented as graphs, where nodes are mainly genes (proteins and
complexes) and edges represent types of relationships between
nodes, such as activation or phosphorylation.
The degree is defined as the number of links of one
node with all other nodes. For a gene in a network, the number of
source genes connecting to a gene is called its indegree, while the
number of target genes connected to by a gene is its outdegree. The
properties of genes are described by measures of betweenness
centrality, which reflects the importance of a node in modulation
of other nodes (24–28).
Real-time reverse transcription-PCR
analysis
Changes in the expression of ten selected genes
responding to EA were further assessed by quantitative RT-PCR. A
total of 2 µg of RNA from independent experiments was used
to perform reverse transcription using PrimeScript™ RT reagent kit
(Takara Bio, Tokyo, Japan). Real-time quantitative PCR of
transcribed cDNA was performed with SYBR Premix Ex Taq™ II (Takara
Bio). Primers were designed using Primer 5 software and synthesized
by Comate Bioscience, Co., Ltd. (Changchun, China). The primers are
listed in Table I. Real-time
RT-PCR reactions were then performed in a total of 25 µl of
reaction mixture using the ABI Prism 7500HT sequence detection
system (Applied Biosystems, Foster City, CA, USA). Data were
analyzed using the comparative Ct method, and the expression levels
of target genes were normalized to the levels of β-actin expression
in each sample.
 | Table IThe primers used for real-time RT-PCR
analysis. |
Table I
The primers used for real-time RT-PCR
analysis.
| Gene | Primer
sequence |
|---|
| β-actin |
CTCACCATGGATGATGATATCGC
AGGAATCCTTCTGACCCATGC |
| IL8 |
CACCGGAAGGAACCATCTCA
TGGCAAAACTGCACCTTCACA |
| JUN |
CCAACTCATGCTAACGCAGC
CTCTCCGTCGCAACTTGTCA |
| CCNB1 |
TGGTGAATGGACACCAACTCT
TAGCATGCTTCGATGTGGCA |
| IRS1 |
ACATCACAGCAGAATGAAGACCT
TGGATGCATCGTACCATCTACTG |
| PLK1 |
CAAGTACGGCCTTGGGTATCA
GTGCCGTCACGCTCTATGTA |
| CDC20 |
ATTCCCAGGTGTGCTCCATC
GCCATGGTTGGGTACTTCCA |
| SMC3 |
CAGACAACCGGTTACCAATCG
AGCGCTTTCAAGGAGGTTCA |
| BCL-2 |
AGATTGATGGGATCGTTGCCT
AGTCTACTTCCTCTGTGATGTTGT |
| BAD |
TCCTTTAAGAAGGGACTTCCTCG
CCAAGTTCCGATCCCACCAG |
| C-MYC |
CCTACCCTCTCAACGACAGC
TTCCTCCTCAGAGTCGCTGC |
Statistical analysis
All data were presented as the mean ± SD of six
independent experiments. Two-tailed Student's t-test and one-way
analysis of variance (ANOVA) were used to analyze significant
differences. P<0.05 was considered to indicate a statistically
significant result.
Results
The effects of EA on HCT-116 cell
proliferation
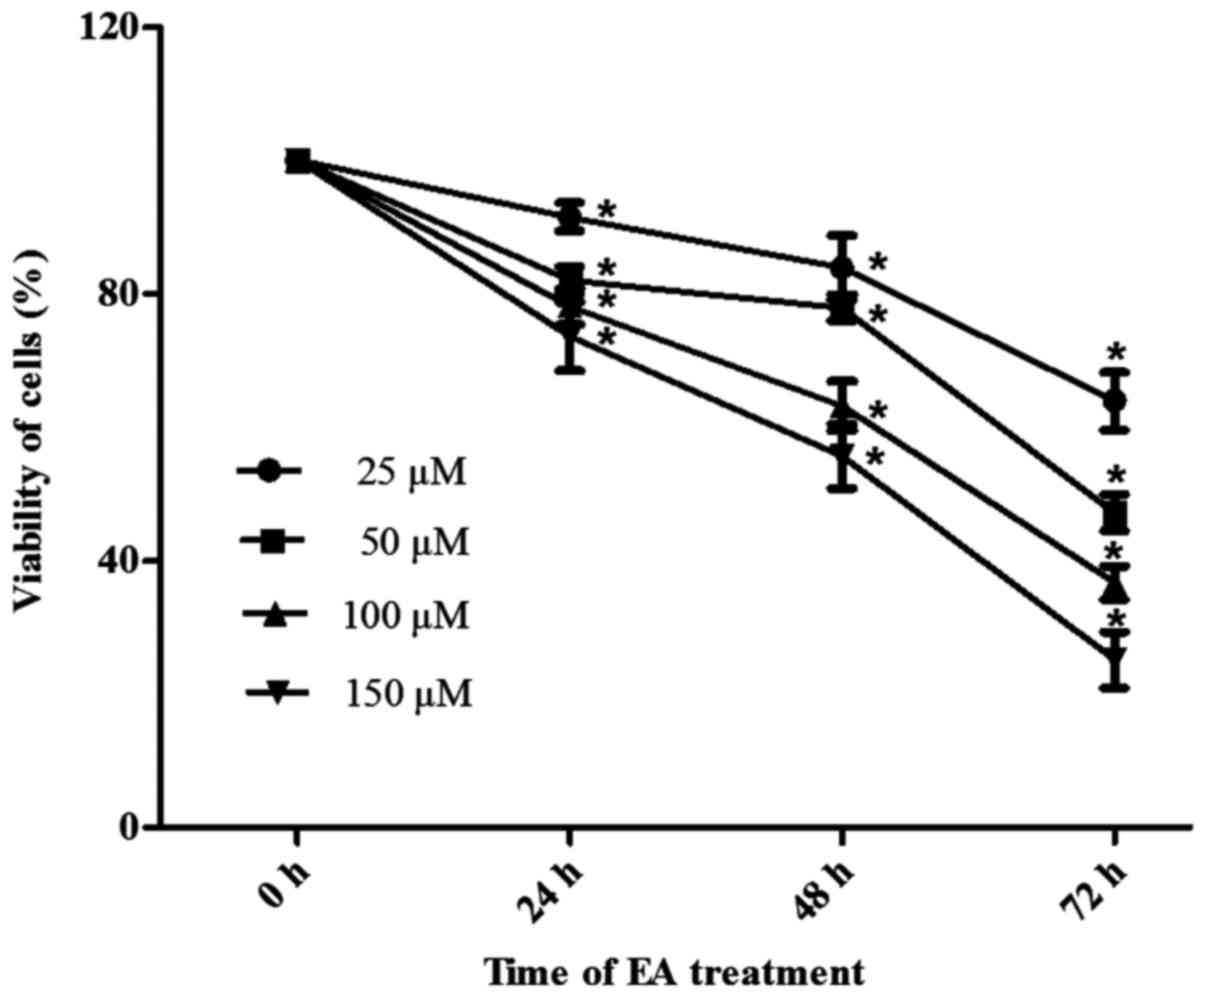
MTT assays were used to assess the
anti-proliferative effects of EA and to select the appropriate
concentration of EA and treatment duration for the microarray
assay. As shown in Fig. 1, HCT-116
cells were incubated with different concentrations of EA for 24, 48
or 72 h. EA exhibited anti-proliferative effects, which were both
time- and dose-dependent.
Screening for differentially expressed
genes
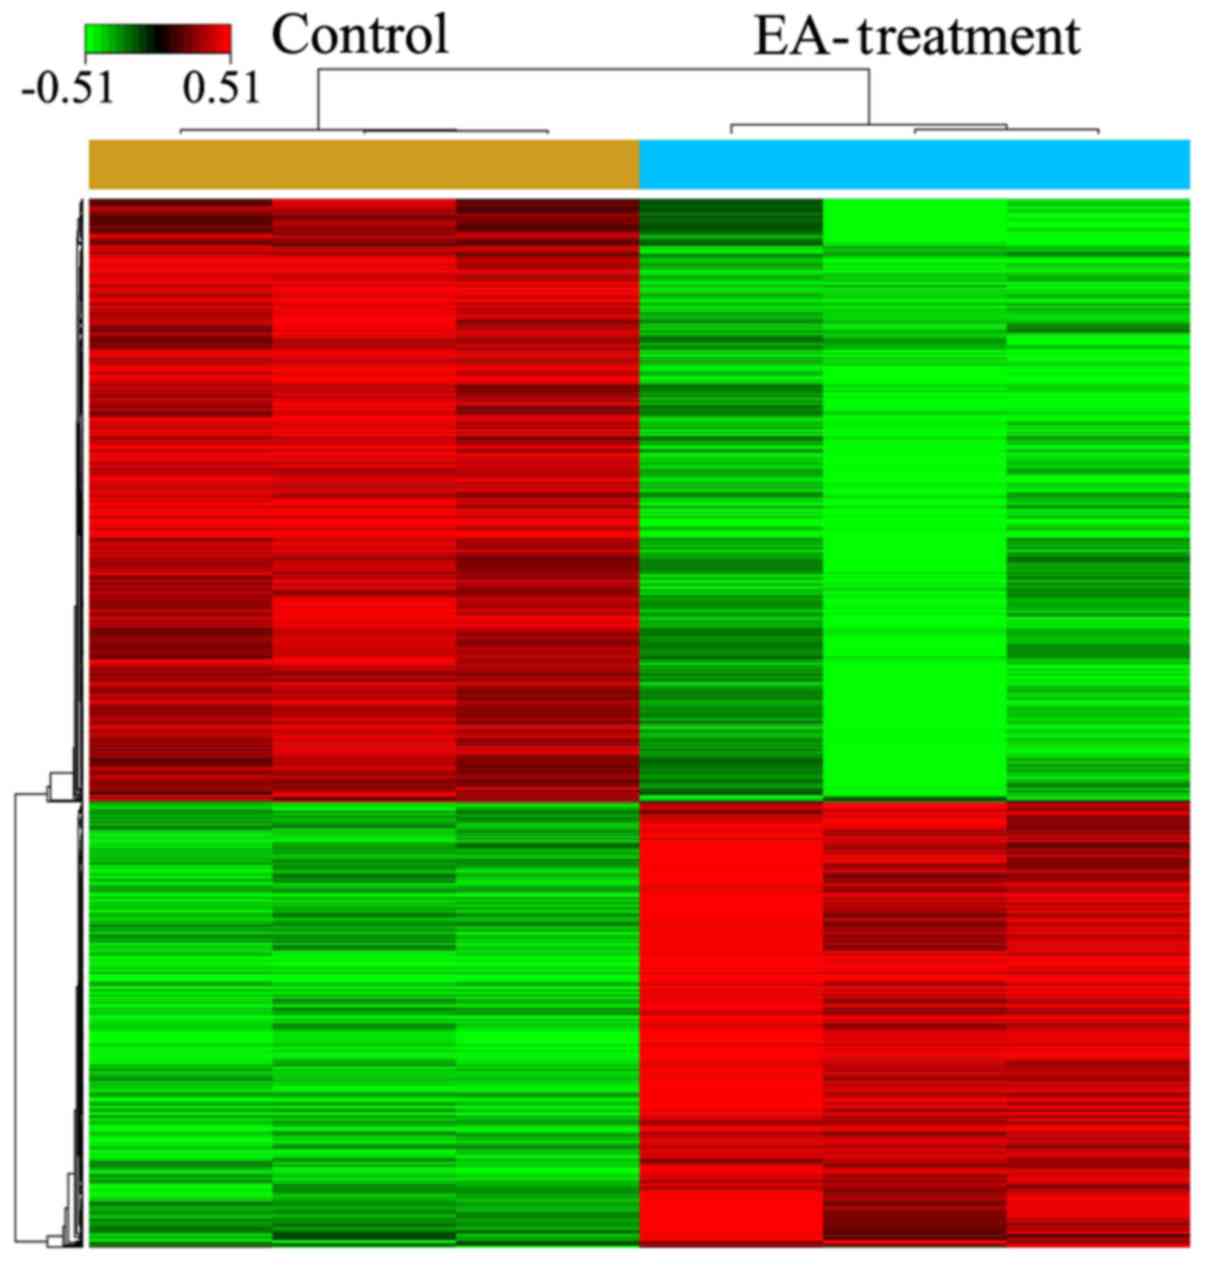
After treatment of HCT-116 cells with 100 µM
EA for 72 h, microarray analysis indicated that a total of 857
genes had expression levels changed by ≥1.5-fold (494 upregulated
and 363 down-regulated) (Fig. 2;
P<0.05). The top 10 DEGs are presented in Table II.
| Table IITop 10 regulated genes in
EA-treatment cells compared with the control cells in the HCT-116
cells. |
Table II
Top 10 regulated genes in
EA-treatment cells compared with the control cells in the HCT-116
cells.
| Rank | Gene symbol | Gene feature | Fold change | P-value |
|---|
| 1 | CPA4 | Upregulated | 7.393308 | 5.10E-05 |
| 2 | ABCC2 | Downregulated | −6.93316 | 5.60E-05 |
| 3 | CENPE | Downregulated | −5.35232 | 6.10E-05 |
| 4 | CENPF | Downregulated | −4.48105 | 8.00E-05 |
| 5 | BHLHE40 | Upregulated | 4.231785 | 7.00E-05 |
| 6 | HIST1H2BM | Downregulated | −4.22724 | 9.50E-05 |
| 7 | KRTAP2-3 | Upregulated | 4.124822 | 0.000148 |
| 8 | ID3 | Downregulated | −3.97283 | 0.000163 |
| 9 | GDF15 | Upregulated | 3.684665 | 0.000265 |
| 10 | HIST1H2AB | Downregulated | −3.65796 |
0.00025 |
GO analysis
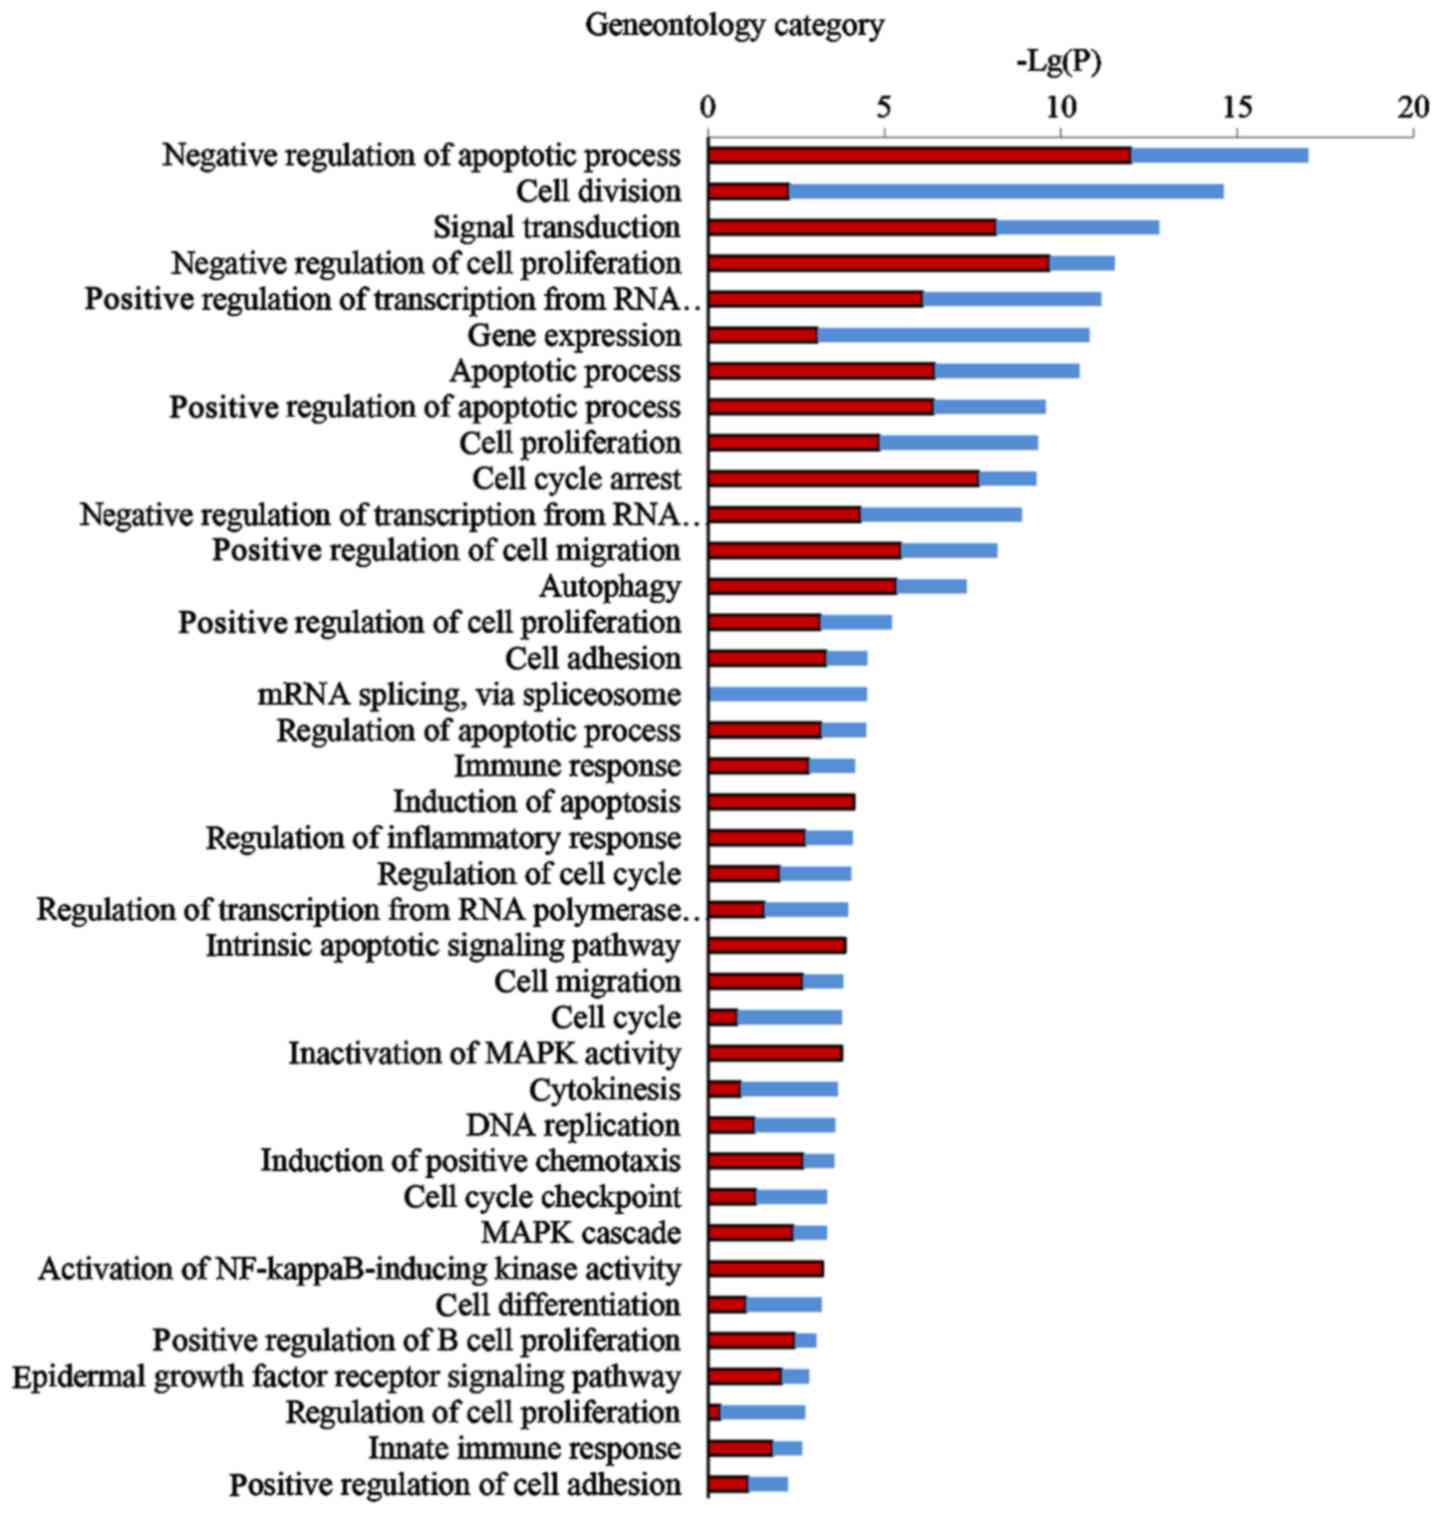
Comprehensive GO analysis of DEGs was performed to
determine the main functions of EA in cancer inhibition.
Thirty-eight GO terms significantly associated with differential
gene expression after EA treatment (Fig. 3; P<0.05) were classified into
key functional categories. The main GO categories identified
included regulation of the apoptotic process, cell division, signal
transduction, negative regulation of cell proliferation, gene
expression, transcription and cell cycle arrest. Larger enrichment
values indicate that the functions were affected more strongly by
EA treatment.
Pathway analysis of DEGs
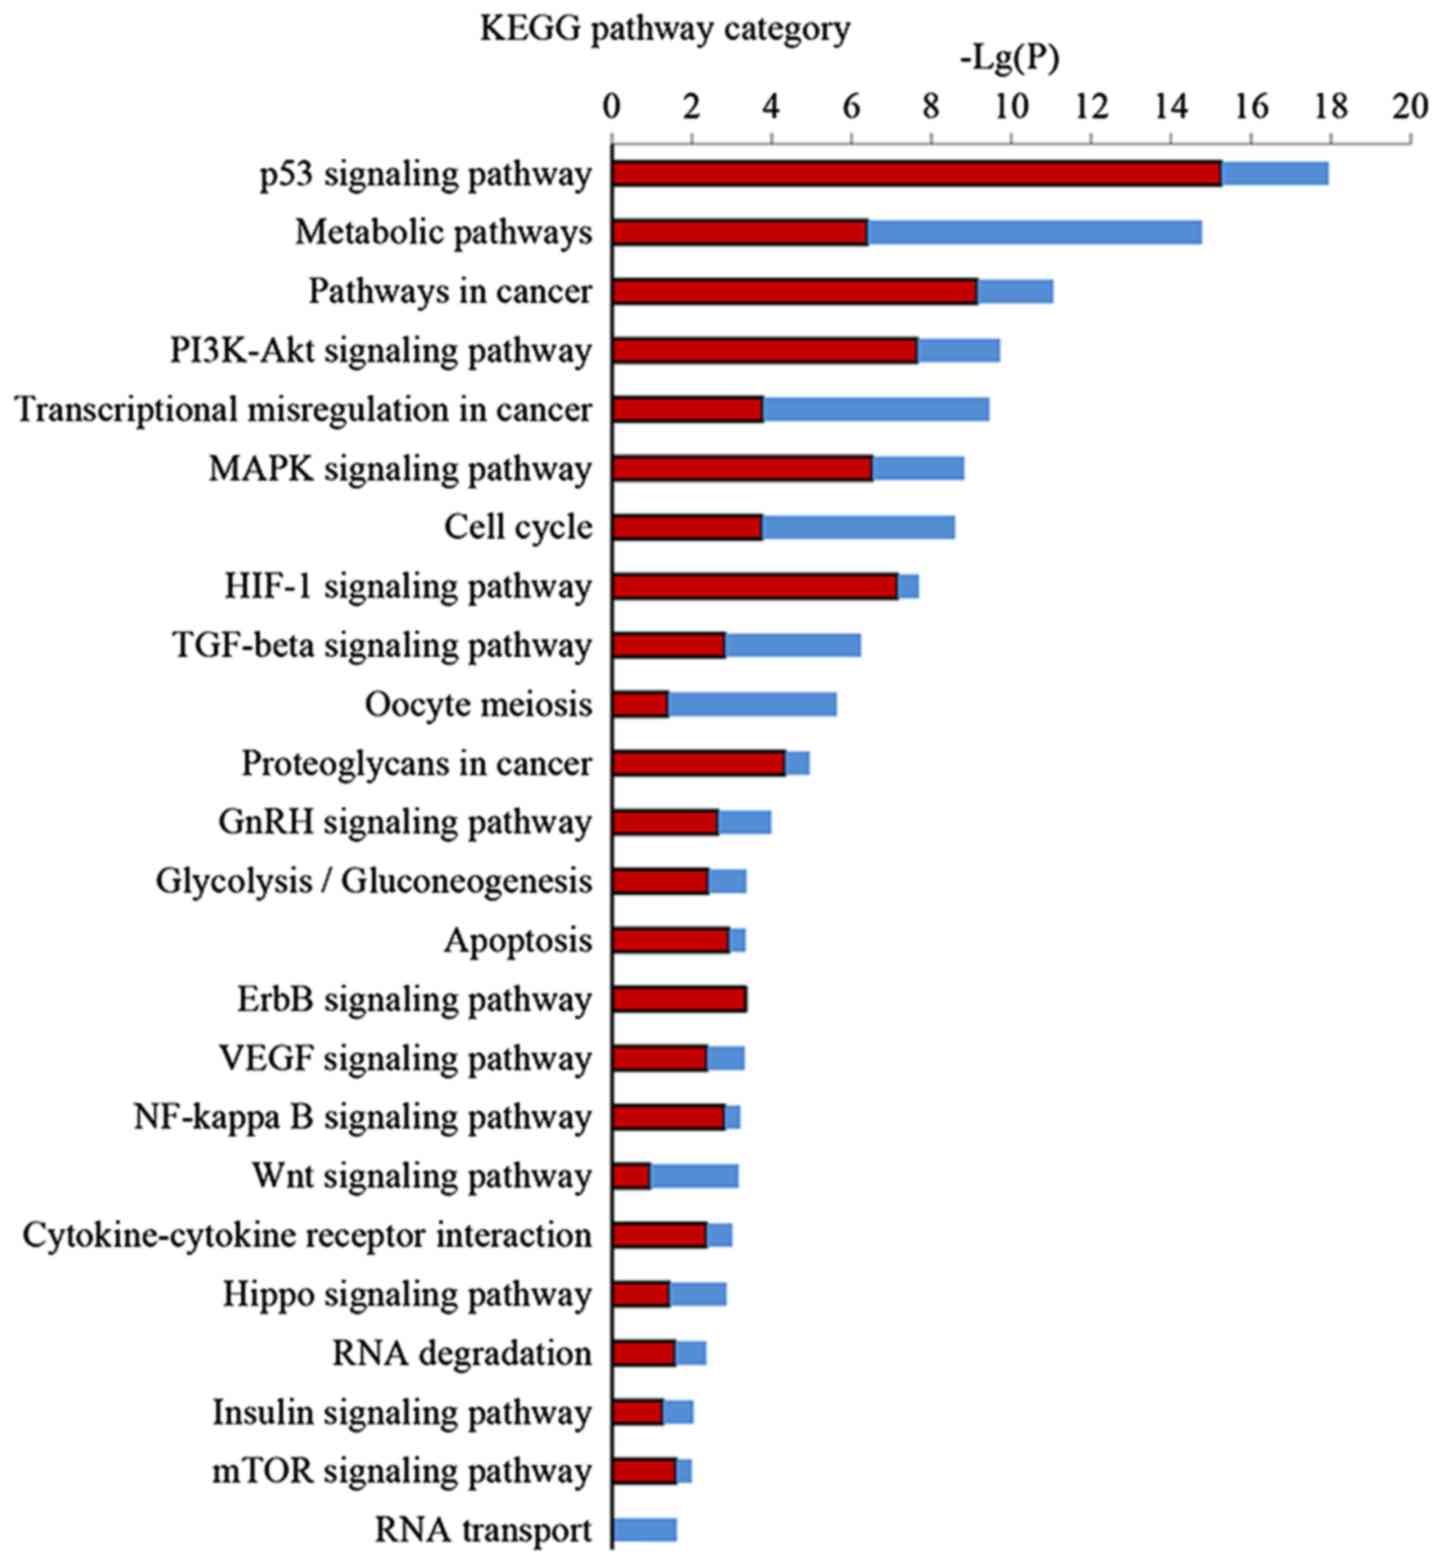
KEGG pathway analysis was performed to further
investigate the key pathways associated with DEGs. Significant
pathway categories (P<0.05) for the 857 DEGs linked to EA are
presented in Fig. 4. Larger-Lg
(P-values) indicate that the function was more strongly regulated
in response to treatment with EA. Treatment with EA clearly
affected 24 significant pathways, including the p53 signaling
pathway, metabolic pathways, the PI3K-Akt signaling pathway, the
MAPK signaling pathway, the TGF-β signaling pathway and the cell
cycle and transcriptional misregulation in cancer.
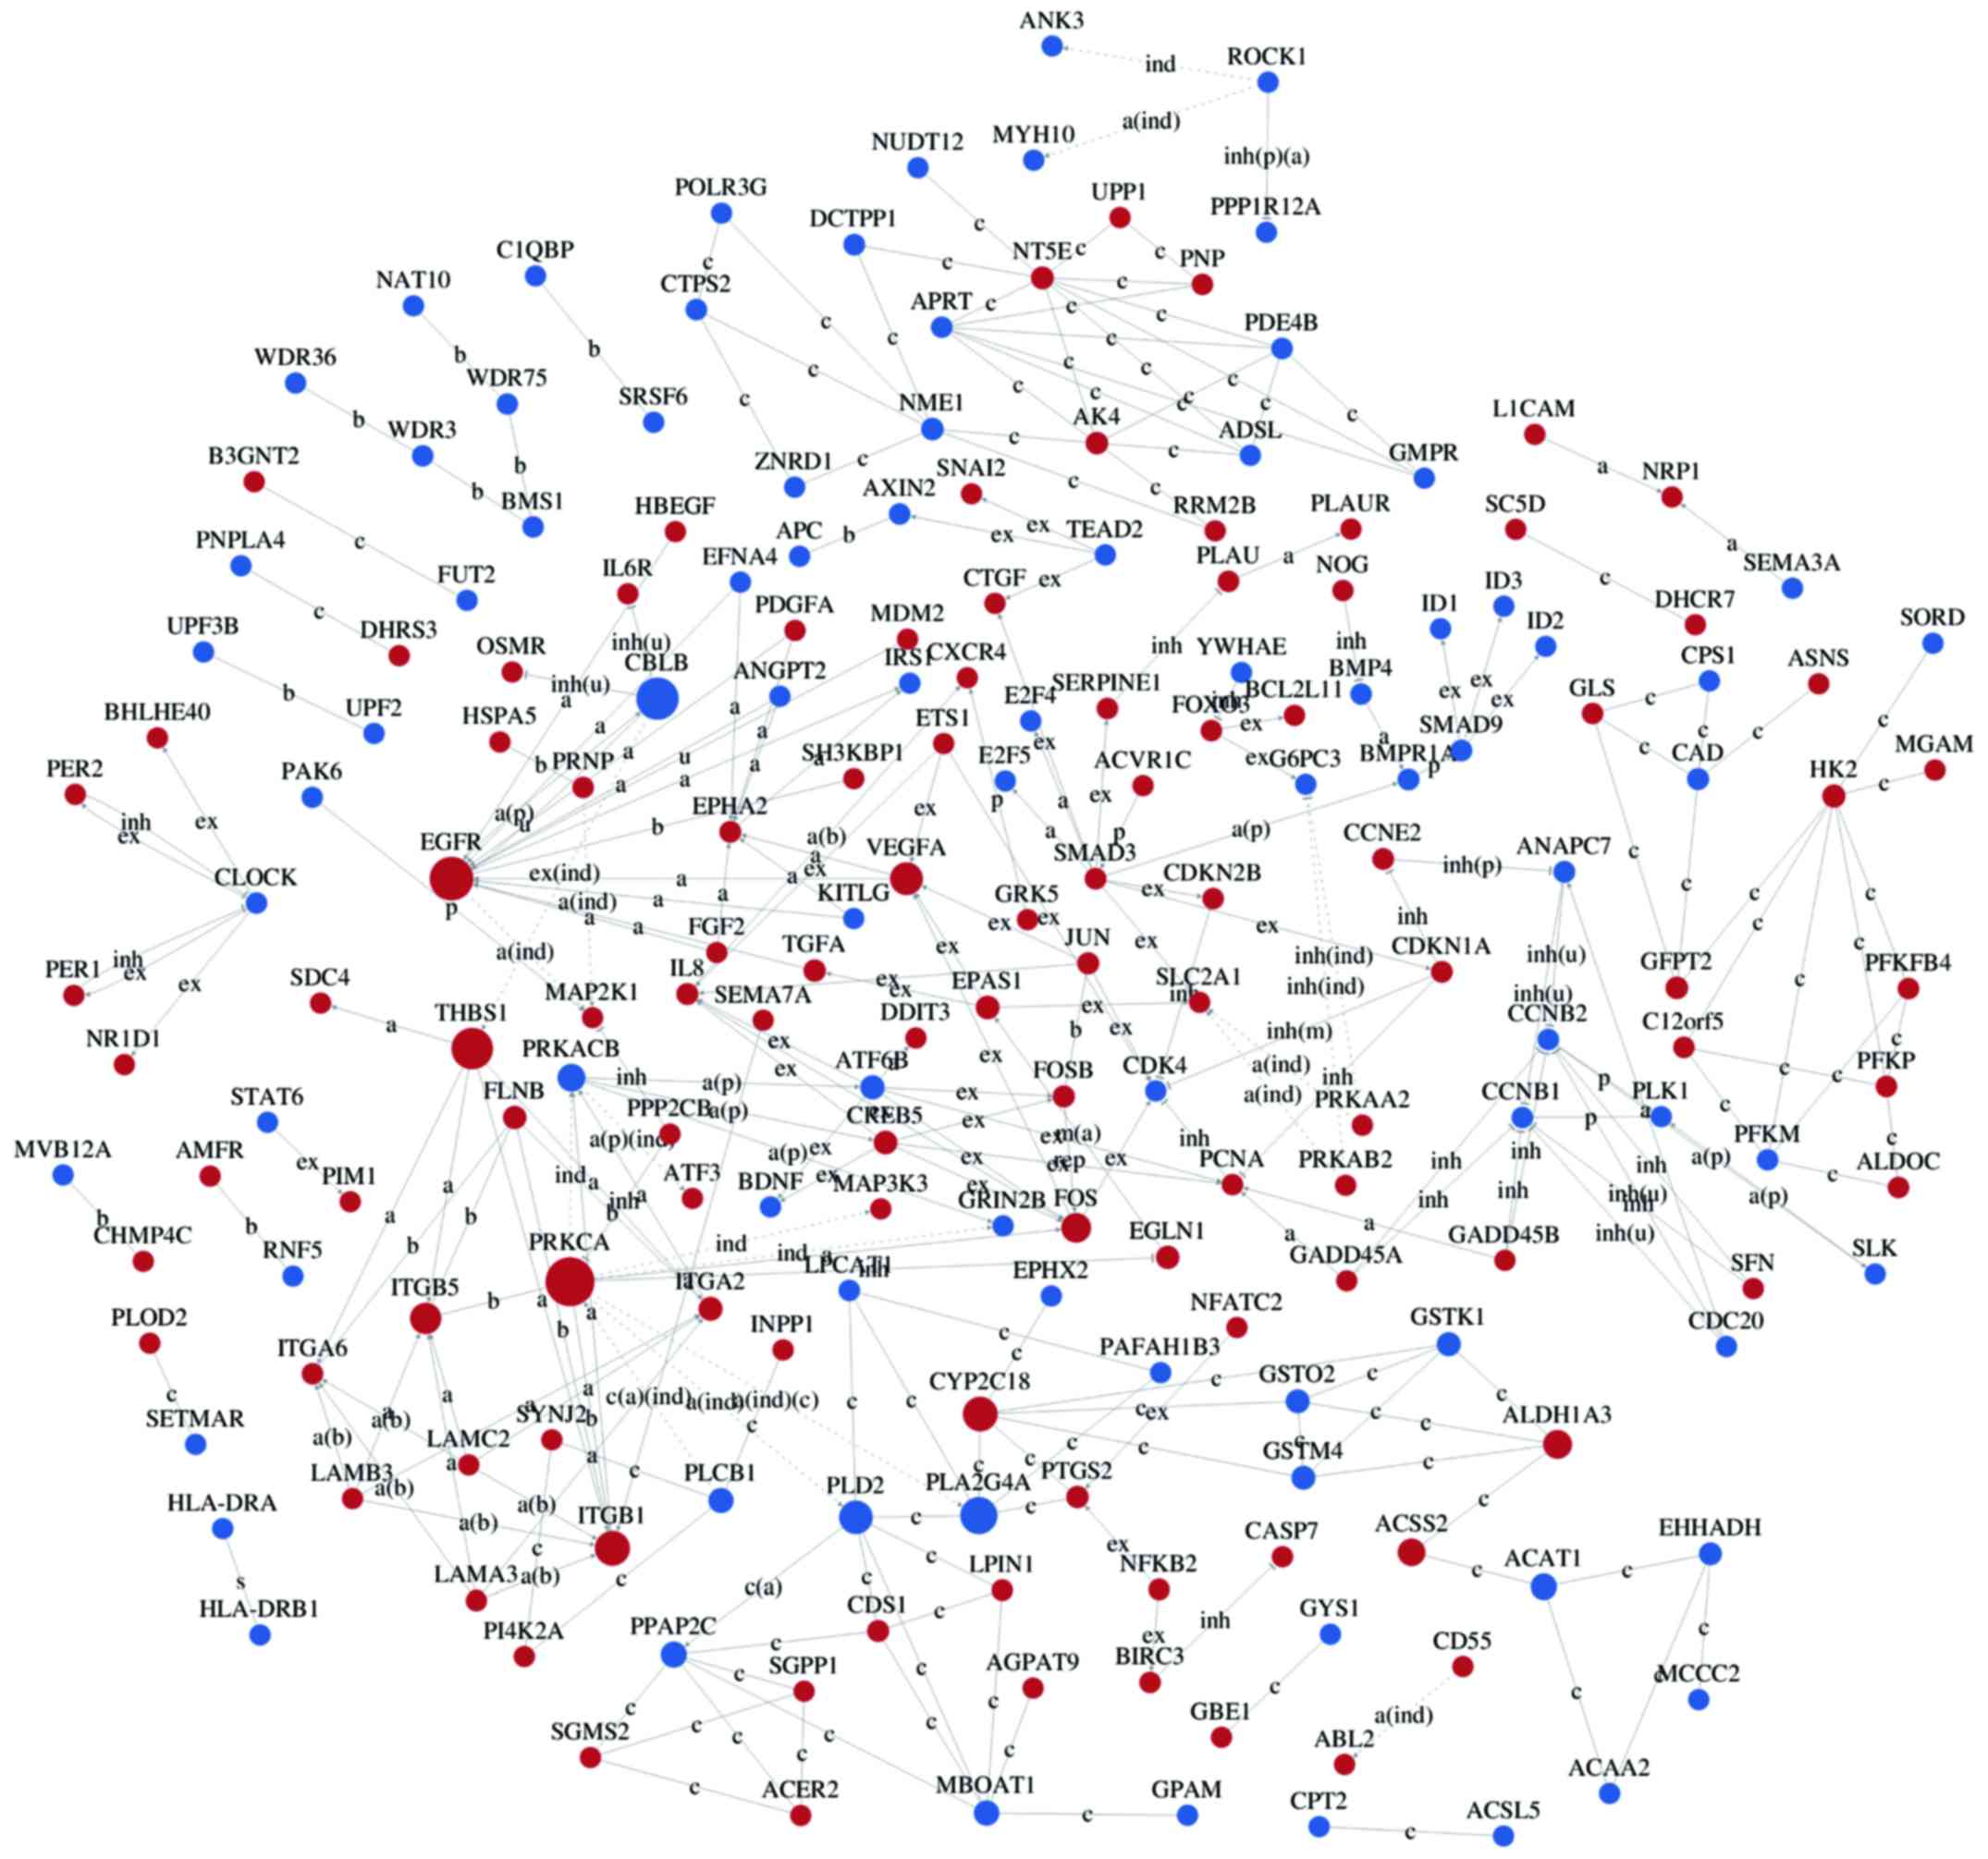
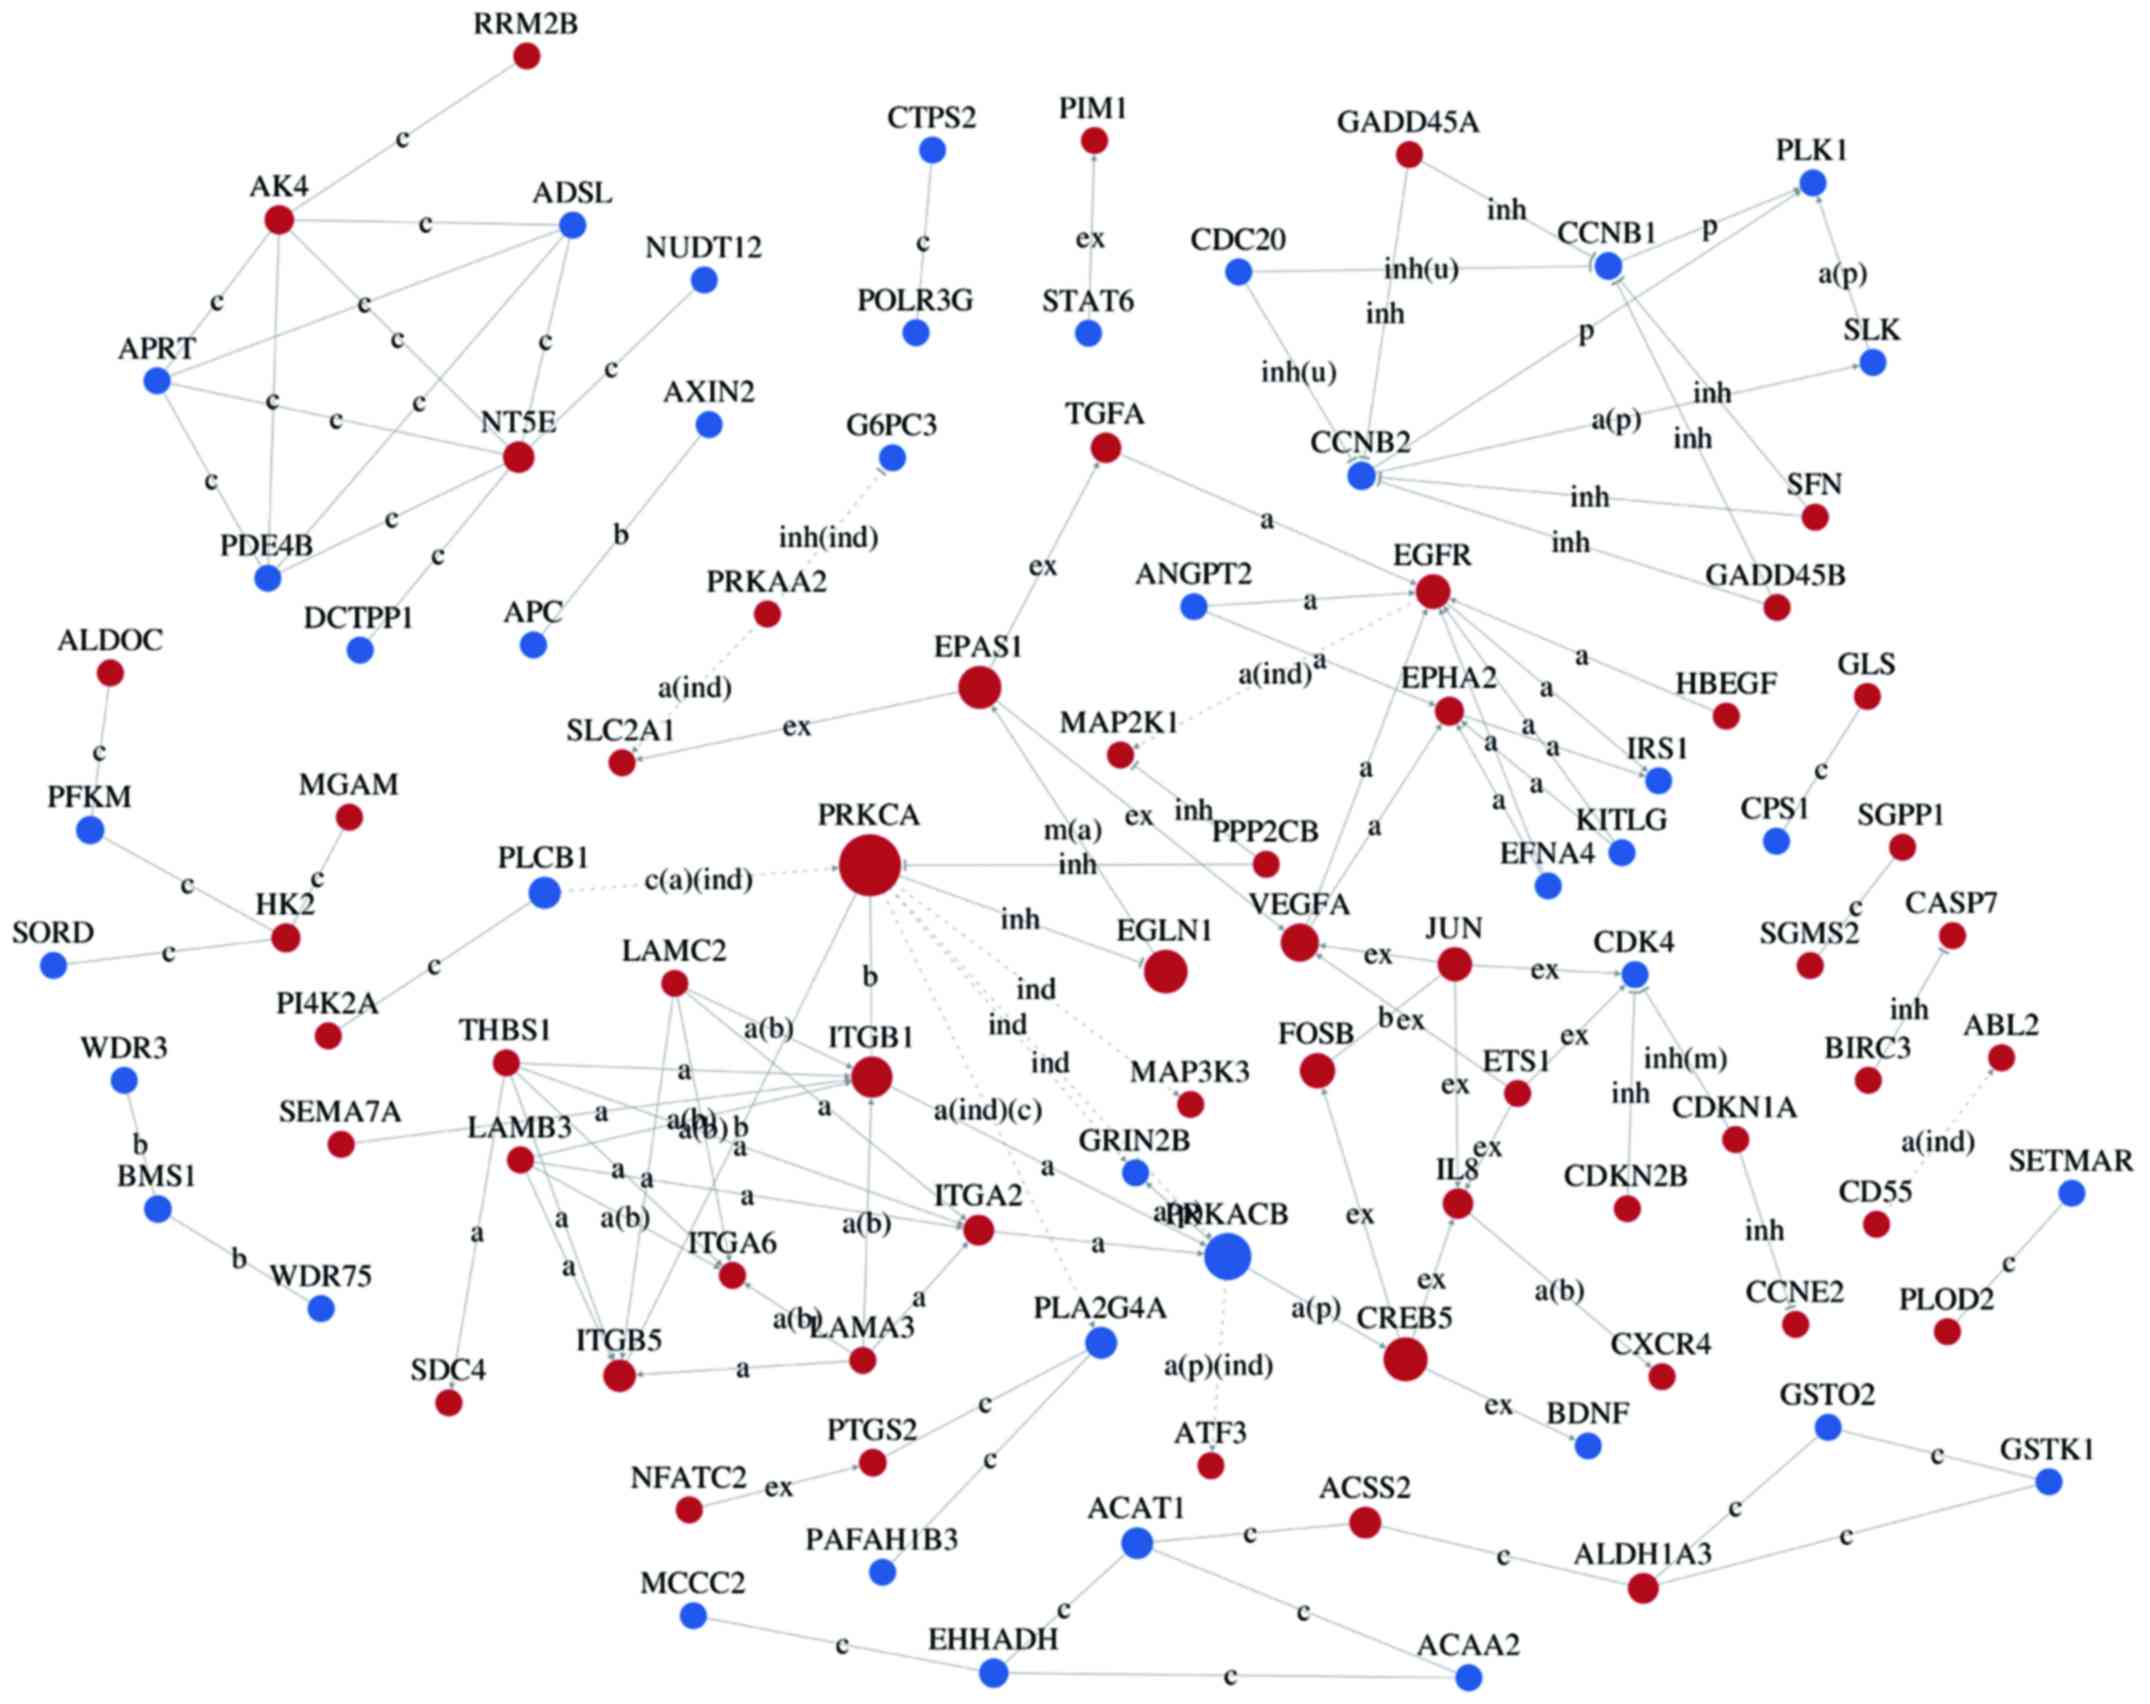
Interaction networks of DEG
Interaction-relationship networks of DEGs were
constructed and are shown in Figs.
5 and 6. DEGs of interest were
closely connected, and the majority of them were located in the
center of the network. Betweenness centrality indicated the
intermediary ability of each gene, and a larger value indicates a
greater ability to regulate genes. Fig. 6 shows the interaction network of
DEGs related to proliferation, apoptosis, angiogenesis and cell
cycle. These DEGs include a number of important functional genes
such as PRKACB, IL8, JUN, CDC20 and CCNB1.
Real-time reverse transcription-PCR
analysis
The next step was to confirm the changes of genes in
microarray analysis by the real-time RT-PCR analysis. We selected
10 genes (3 upregulated, 6 downregulated and 1 no change by
microarray data) which were related to proliferation, apoptosis or
cell cycle. Nine out of the ten gene expression levels were
verified by the real-time RT-PCR. This represents a success rate of
90% in microarray analysis. However, when the relative ratio of
change for genes in microarray exceeded 2, the success rate became
100% (7 out of 7). The results are shown in Table III.
| Table IIIRelative changes in expression (ratio
treated/control cells) of selected 10 genes involved in
proliferation, apoptosis and cell cycle in HCT-116 cells after
exposure to EA for 72 h as determined by Affymetrix microarray vs.
RT-PCR. |
Table III
Relative changes in expression (ratio
treated/control cells) of selected 10 genes involved in
proliferation, apoptosis and cell cycle in HCT-116 cells after
exposure to EA for 72 h as determined by Affymetrix microarray vs.
RT-PCR.
| Gene symbol | Gene
description | Main functions | Main related
pathways | Fold
change
(microarray) | P-value
(microarray) | Fold
change
(RT-PCR) | P-value
(RT-PCR) |
|---|
| IL8 | Interleukin 8 | Negative regulation
of cell proliferation | Pathways in
cancer | 2.89283 | 8E-05 |
10.3243 | 8E-04 |
| JUN | Jun
proto-oncogene | Negative regulation
of cell proliferation | MAPK signaling
pathway |
2.499311 | 0.0003 | 2.72681 | 0.087 |
| BCL2 | B-cell CLL/lymphoma
2 | Apoptosis | Apoptosis |
1.327642 | 0.0074 | 1.66086 | 0.019 |
| BAD | BCL2-associated
agonist of cell death | Apoptosis | Apoptosis |
1.034194 | 0.5627 | 1.05139 | 0.628 |
| MYC | Myelocytomatosis
viral oncogene homolog (avian) | Cell
cycle/apoptosis | Cell cycle | −1.26086 | 0.0211 | 1.32975 | 0.008 |
| CDC20 | Cell division cycle
20 | Mitotic cell
cycle | Cell cycle/viral
carcinogenesis | −2.011034 | 0.0007 | −1.87441 | 0.011 |
| IRS1 | Insulin receptor
substrate 1 | Positive regulation
of cell proliferation | PI3K-Akt signaling
pathway | −2.107854 | 0.0016 | −3.15826 | 0.002 |
| CCNB1 | Cyclin B1 | Mitotic cell
cycle/cell division | p53 signaling
pathway/cell cycle | −2.149418 | 0.0004 | −3.40518 | 0.004 |
| SMC3 | Structural
maintenance of chromosomes 3 | Mitotic cell
cycle | Cell cycle | −2.16975 | 0.0012 | −3.58037 | 0.006 |
| PLK1 | Polo-like kinase
1 | Negative regulation
of apoptotic process | Cell cycle | −2.413056 | 0.0004 | −2.63428 | 0.018 |
Discussion
Chemoprevention is emerging as an effective method
for inhibiting cancer cells. Many plant polyphenols exhibit
substantial inhibitory activity against the growth of colon cancer
cells in vitro and against colon carcinogenesis in animal
models (29). EA is regarded as
one of the most promising and practical chemopreventive agents
against various cancers (30). A
previous study showed that the cytotoxicity and anti-proliferative
activity of EA against cancer cells was detected at a concentration
range that did not affect normal cell viability (31). In vitro and in vivo
experiments have revealed that EA elicits substantial inhibitory
effects against CRC, which suggests that edible EA may be of value
in treatment or prevention of CRC (32–34).
However, the molecular mechanisms at the protein and
transcriptional levels involved in the cellular response to EA are
not yet completely understood. Therefore, it is important to reveal
the targets and molecular mechanisms of EA induced inhibition of
CRC cell growth. To this end, we used microarray profiling, which
has provided remarkable insights in many areas of modern medical
research (35). The colon
adenocarcinoma cell HCT-116 is widely investigated as a reliable
model to check their anti-proliferative properties for various
drugs (36,37). The growth inhibitory effects of EA
on colon cancer cells have been previously reported at
concentrations ≥100 µM in vitro studies (36). The present study showed that
IC50 of EA on HCT-116 cells was 90.20 µM (data
not shown). Thus, we chose 100 µM as the treatment
concentration. In addition, based on literature, 72 h after the
treatment is the time-point often used for microarray experiment of
antitumor drugs, including the EA, by evidence of significant
changes of gene expression and morphology (35,38).
Preliminary screening for DEGs identified 857 genes (494
upregulated and 363 downregulated) in HCT-116 cells after 72 h of
exposure to EA, which are the colon adenocarcinoma cells widely
investigated as a reliable model to check their anti-proliferative
properties for various drugs. Among the top 10 DEGs in HCT-116
(Table II), Carboxypeptidase 4
(CPA4) is a zinc-dependent metallocarboxypeptidase on chromosome
7q32 in a region linked to prostate cancer aggressiveness. CPA4 is
involved in the histone hyperacetylation pathway and may affect the
growth and regulation of prostate epithelial cells (39). Centrosome-associated protein E
(CENPE), a kinesin-like motor protein that accumulates in the G2
phase of the cell cycle, selectively leads to proliferation
inhibition of basal-like breast cancer cell lines when inhibited. A
study suggested that CENPE may be an effective therapeutic target
for patients with triple-negative/basal breast cancer (40). At present, the relationships
between the top 10 DEGs and the other common DEGs in the KEGG
pathway database are rarely reported. Thus, they are not emerging
from the results of the DEG interaction networks, making these
genes important targets for our future research.
GO category analysis (Fig. 3) is becoming a standard procedure
following many high throughput experimental studies, and it
suggests novel hypothesis for follow-up works (41). Many key targets in CRC development
and progression were identified as significantly regulated by EA.
According to the P-values of each GO category, we found that the
three most important functions regulated by EA were apoptotic
process, cell proliferation and cell cycle arrest.
KEGG pathway analysis is the significant analysis of
pathways in which these DEGs participate. Our results demonstrated
24 regulated pathways by EA, most of which are related to the
apoptotic process, cell proliferation, or cell cycle arrest. EA can
activate the PI3K/Akt pathway, which modulates Bcl-2 family
proteins leading to an induction of apoptosis (42). EA also arrests the cell cycle of
Caco-2 cells at the S- and G2/M-phases through regulation of key
genes in the MAPK pathways including EGFR, KRAS, MYC, FOS and CCNB1
(42).
According to the results described above, we
constructed gene-gene interaction networks (Figs. 5 and 6) to investigate the relationships among
the groups of genes. The results indicate that some established key
genes play important roles in the mediation of the effects of EA
treatment, including IL8, ETS1, JUN and CCNB1, which are involved
in cell cycle arrest (43). IL8 is
a chemokine which acts on a common receptor, CXCR3, to increase
cell migration (44). EA also
reduced the levels of CCNB1 protein, which is involved in the
control of the G2/M transition and mitosis in CRC cells (42,45).
Moreover, EA can inhibit cell proliferation in bladder cancer by
downregulation of c-Jun, a subunit of activation protein 1
(46). However, since signaling
pathways are interactive and complex, modulation of a single target
is not always effective in cancer prevention and multi-targeted
therapy is expected to improve treatment effectiveness. Further
detailed analyses demonstrate that EA suppression of colon cancer
HCT-116 cells is through simultaneous regulation of the expression
of functional cancer target genes, including PRKACB, CCNB1, CDC20,
JUN, MEF2C and IL8. Most of them are interacting and involved in
the apoptotic process, cell proliferation or cell cycle arrest.
Protein kinase C (PKC) is critical to cell proliferation, and the
anti-carcinogenic action of EA has been confirmed to downregulate
PKC (47). EA also inhibits the
expression of markers of angiogenesis, including IL-8, VEGF and
VEGFR, in mouse xenografts of the human pancreatic cancer cell
line, PANC-1 (48). Moreover, the
relative expression changes (ratio treated/control) of some
functional genes were confirmed by RT-PCR (Table III). It is highly likely that
these are the most important key targets of EA in HCT-116
cells.
These results showed that EA may play important
roles in inhibiting CRC by regulating multiple targets and
modulating key signaling pathways and fundamental cell processes.
The results of the microarray analysis also implicate the immune
response, DNA replication, and metabolism in responding to EA. A
recent study found that EA induced cancer cell death by blocking
energy metabolism (49). EA also
significantly reduced the proliferation of human osteogenic sarcoma
(HOS) cells by degrading chromosomal DNA (50). These altered functions will be the
subject of our future research.
In conclusion, this study provided preliminary
evidence of the antitumor effects of EA treatment on CRC cells.
Microarray profiling demonstrated multiple effects of EA and
provided a number of avenues for further research. Based on the
results of microarray, further studies are needed to validate the
multiple functions of EA and provide evidence to support its
application in prevention and therapies for human CRC.
Acknowledgments
The present study was supported by the National
Natural Science Foundation of China (nos. 81372612 and 81302059),
the Foundation of Heilongjiang Educational Committee (no. 12541300)
and the Study Abroad Returnees Science Foundation of Heilongjiang
(no. LC2013C35).
References
|
1
|
World Cancer Research Fund International:
Worldwide data. <http://www.wcrf.Org/int/cancer-facts-figures/worldwide-data>.
2012
|
|
2
|
Reddy BS and Cohen LA: Diet and colon
cancer: evidence from human and animal model studies. CRC Press;
Boca Raton, FL: pp. 47–65. 1986
|
|
3
|
Cragg GM and Newman DJ: Plants as a source
of anti-cancer agents. J Ethnopharmacol. 100:72–79. 2005.
View Article : Google Scholar : PubMed/NCBI
|
|
4
|
Potter JD: Cancer prevention: Epidemiology
and experiment. Cancer Lett. 114:7–9. 1997. View Article : Google Scholar : PubMed/NCBI
|
|
5
|
Potter JD and Steinmetz K: Vegetables,
fruit and phytoestrogens as preventive agents. IARC Sci Publ.
139:61–90. 1996.
|
|
6
|
Girish C and Pradhan SC: Drug development
for liver diseases: Focus on picroliv, ellagic acid and curcumin.
Fundam Clin Pharmacol. 22:623–632. 2008. View Article : Google Scholar : PubMed/NCBI
|
|
7
|
Heber D: Multitargeted therapy of cancer
by ellagitannins. Cancer Lett. 269:262–268. 2008. View Article : Google Scholar : PubMed/NCBI
|
|
8
|
Zhang T, Chen HS, Wang LF, Bai MH, Wang
YC, Jiang XF and Liu M: Ellagic acid exerts anti-proliferation
effects via modulation of Tgf-β/Smad3 signaling in MCF-7 breast
cancer cells. Asian Pac J Cancer Prev. 15:273–276. 2014. View Article : Google Scholar
|
|
9
|
Dai Z, Nair V, Khan M and Ciolino HP:
Pomegranate extract inhibits the proliferation and viability of
MMTV-Wnt-1 mouse mammary cancer stem cells in vitro. Oncol Rep.
24:1087–1091. 2010.PubMed/NCBI
|
|
10
|
Wang N, Wang ZY, Mo SL, Loo TY, Wang DM,
Luo HB, Yang DP, Chen YL, Shen JG and Chen JP: Ellagic acid, a
phenolic compound, exerts anti-angiogenesis effects via VEGFR-2
signaling pathway in breast cancer. Breast Cancer Res Treat.
134:943–955. 2012. View Article : Google Scholar : PubMed/NCBI
|
|
11
|
Pitchakarn P, Chewonarin T, Ogawa K,
Suzuki S, Asamoto M, Takahashi S, Shirai T and Limtrakul P: Ellagic
acid inhibits migration and invasion by prostate cancer cell lines.
Asian Pac J Cancer Prev. 14:2859–2863. 2013. View Article : Google Scholar : PubMed/NCBI
|
|
12
|
Huang ST, Wang CY, Yang RC, Chu CJ, Wu HT
and Pang JH: Phyllanthus urinaria increases apoptosis and reduces
telomerase activity in human nasopharyngeal carcinoma cells. Forsch
Komplement Med. 16:34–40. 2009. View Article : Google Scholar
|
|
13
|
Chen HS, Bai MH, Zhang T, Li GD and Liu M:
Ellagic acid induces cell cycle arrest and apoptosis through
TGF-β/Smad3 signaling pathway in human breast cancer MCF-7 cells.
Int J Oncol. 46:1730–1738. 2015.PubMed/NCBI
|
|
14
|
Wright GW and Simon RM: A random variance
model for detection of differential gene expression in small
microarray experiments. Bioinformatics. 19:2448–2455. 2003.
View Article : Google Scholar : PubMed/NCBI
|
|
15
|
Yang H, Crawford N, Lukes L, Finney R,
Lancaster M and Hunter KW: Metastasis predictive signature profiles
pre-exist in normal tissues. Clin Exp Metastasis. 22:593–603. 2005.
View Article : Google Scholar
|
|
16
|
Clarke R, Ressom HW, Wang A, Xuan J, Liu
MC, Gehan EA and Wang Y: The properties of high-dimensional data
spaces: Implications for exploring gene and protein expression
data. Nat Rev Cancer. 8:37–49. 2008. View
Article : Google Scholar :
|
|
17
|
Gene Ontology Consortium: The Gene
Ontology (GO) project in 2006. Nucleic Acids Res. 34:D322–D326.
2006. View Article : Google Scholar :
|
|
18
|
Ashburner M, Ball CA, Blake JA, Botstein
D, Butler H, Cherry JM, Davis AP, Dolinski K, Dwight SS, Eppig JT,
et al: Gene ontology: tool for the unification of biology. The Gene
Ontology Consortium. Nat Genet. 25:25–29. 2000. View Article : Google Scholar : PubMed/NCBI
|
|
19
|
Dupuy D, Bertin N, Hidalgo CA, Venkatesan
K, Tu D, Lee D, Rosenberg J, Svrzikapa N, Blanc A, Carnec A, et al:
Genome-scale analysis of in vivo spatiotemporal promoter activity
in Caenorhabditis elegans. Nat Biotechnol. 25:663–668. 2007.
View Article : Google Scholar : PubMed/NCBI
|
|
20
|
Schlitt T, Palin K, Rung J, Dietmann S,
Lappe M, Ukkonen E and Brazma A: From gene networks to gene
function. Genome Res. 13:2568–2576. 2003. View Article : Google Scholar : PubMed/NCBI
|
|
21
|
Kanehisa M, Goto S, Kawashima S, Okuno Y
and Hattori M: The KEGG resource for deciphering the genome.
Nucleic Acids Res. 32:D277–D280. 2004. View Article : Google Scholar :
|
|
22
|
Yi M, Horton JD, Cohen JC, Hobbs HH and
Stephens RM: WholePathwayScope: A comprehensive pathway-based
analysis tool for high-throughput data. BMC Bioinformatics.
7:302006. View Article : Google Scholar : PubMed/NCBI
|
|
23
|
Draghici S, Khatri P, Tarca AL, Amin K,
Done A, Voichita C, Georgescu C and Romero R: A systems biology
approach for pathway level analysis. Genome Res. 17:1537–1545.
2007. View Article : Google Scholar : PubMed/NCBI
|
|
24
|
Jansen R, Greenbaum D and Gerstein M:
Relating whole-genome expression data with protein-protein
interactions. Genome Res. 12:37–46. 2002. View Article : Google Scholar : PubMed/NCBI
|
|
25
|
Li C and Li H: Network-constrained
regularization and variable selection for analysis of genomic data.
Bioinformatics. 24:1175–1182. 2008. View Article : Google Scholar : PubMed/NCBI
|
|
26
|
Wei Z and Li H: A Markov random field
model for network-based analysis of genomic data. Bioinformatics.
23:1537–1544. 2007. View Article : Google Scholar : PubMed/NCBI
|
|
27
|
Zhang JD and Wiemann S: KEGGgraph: A graph
approach to KEGG PATHWAY in R and bioconductor. Bioinformatics.
25:1470–1471. 2009. View Article : Google Scholar : PubMed/NCBI
|
|
28
|
Spirin V and Mirny LA: Protein complexes
and functional modules in molecular networks. Proc Natl Acad Sci
USA. 100:12123–12128. 2003. View Article : Google Scholar : PubMed/NCBI
|
|
29
|
Rudolf E, Andelová H and Cervinka M:
Polyphenolic compounds in chemoprevention of colon cancer - targets
and signaling pathways. Anticancer Agents Med Chem. 7:559–575.
2007. View Article : Google Scholar : PubMed/NCBI
|
|
30
|
Whitley AC, Stoner GD, Darby MV and Walle
T: Intestinal epithelial cell accumulation of the cancer preventive
polyphenol ellagic acid - extensive binding to protein and DNA.
Biochem Pharmacol. 66:907–915. 2003. View Article : Google Scholar : PubMed/NCBI
|
|
31
|
Losso JN, Bansode RR, Trappey A II, Bawadi
HA and Truax R: In vitro anti-proliferative activities of ellagic
acid. J Nutr Biochem. 15:672–678. 2004. View Article : Google Scholar : PubMed/NCBI
|
|
32
|
Cho H, Jung H, Lee H, Yi HC, Kwak HK and
Hwang KT: Chemopreventive activity of ellagitannins and their
derivatives from black raspberry seeds on HT-29 colon cancer cells.
Food Funct. 6:1675–1683. 2015. View Article : Google Scholar : PubMed/NCBI
|
|
33
|
Mertens-Talcott SU, Lee JH, Percival SS
and Talcott ST: Induction of cell death in Caco-2 human colon
carcinoma cells by ellagic acid rich fractions from muscadine
grapes (Vitis rotundifolia). J Agric Food Chem. 54:5336–5343. 2006.
View Article : Google Scholar : PubMed/NCBI
|
|
34
|
Umesalma S and Sudhandiran G: Differential
inhibitory effects of the polyphenol ellagic acid on inflammatory
mediators NF-kappaB, iNOS, COX-2, TNF-alpha, and IL-6 in
1,2-dimethylhydrazine-induced rat colon carcinogenesis. Basic Clin
Pharmacol Toxicol. 107:650–655. 2010. View Article : Google Scholar : PubMed/NCBI
|
|
35
|
Kong X, Ding X and Yang Q: Identification
of multi-target effects of Huaier aqueous extract via microarray
profiling in triple-negative breast cancer cells. Int J Oncol.
46:2047–2056. 2015.PubMed/NCBI
|
|
36
|
Seeram NP, Adams LS, Henning SM, Niu Y,
Zhang Y, Nair MG and Heber D: In vitro antiproliferative, apoptotic
and antioxidant activities of punicalagin, ellagic acid and a total
pomegranate tannin extract are enhanced in combination with other
polyphenols as found in pomegranate juice. J Nutr Biochem.
16:360–367. 2005. View Article : Google Scholar : PubMed/NCBI
|
|
37
|
Kang K, Oh SH, Yun JH, Jho EH, Kang JH,
Batsuren D, Tunsag J, Park KH, Kim M and Nho CW: A novel
topoisomerase inhibitor, daurinol, suppresses growth of HCT116
cells with low hematological toxicity compared to etoposide.
Neoplasia. 13:1043–1057. 2011. View Article : Google Scholar : PubMed/NCBI
|
|
38
|
González-Sarrías A, Espín JC,
Tomás-Barberán FA and García-Conesa MT: Gene expression, cell cycle
arrest and MAPK signalling regulation in Caco-2 cells exposed to
ellagic acid and its metabolites, urolithins. Mol Nutr Food Res.
53:686–698. 2009. View Article : Google Scholar : PubMed/NCBI
|
|
39
|
Ross PL, Cheng I, Liu X, Cicek MS, Carroll
PR, Casey G and Witte JS: Carboxypeptidase 4 gene variants and
early-onset intermediate-to-high risk prostate cancer. BMC Cancer.
9:692009. View Article : Google Scholar : PubMed/NCBI
|
|
40
|
Kung PP, Martinez R, Zhu Z, Zager M,
Blasina A, Rymer I, Hallin J, Xu M, Carroll C, Chionis J, et al:
Chemogenetic evaluation of the mitotic kinesin CENP-E reveals a
critical role in triple-negative breast cancer. Mol Cancer Ther.
13:2104–2115. 2014. View Article : Google Scholar : PubMed/NCBI
|
|
41
|
Ihmels J, Friedlander G, Bergmann S, Sarig
O, Ziv Y and Barkai N: Revealing modular organization in the yeast
transcriptional network. Nat Genet. 31:370–377. 2002.PubMed/NCBI
|
|
42
|
Umesalma S, Nagendraprabhu P and
Sudhandiran G: Ellagic acid inhibits proliferation and induced
apoptosis via the Akt signaling pathway in HCT-15 colon
adenocarcinoma cells. Mol Cell Biochem. 399:303–313. 2015.
View Article : Google Scholar
|
|
43
|
Viallard JF, Lacombe F, Belloc F,
Pellegrin JL and Reiffers J: Molecular mechanisms controlling the
cell cycle: Fundamental aspects and implications for oncology.
Cancer Radiother. 5:109–129. 2001.In French. View Article : Google Scholar : PubMed/NCBI
|
|
44
|
Billottet C, Quemener C and Bikfalvi A:
CXCR3, a double-edged sword in tumor progression and angiogenesis.
Biochim Biophys Acta. 1836:287–295. 2013.PubMed/NCBI
|
|
45
|
Larrosa M, Tomás-Barberán FA and Espín JC:
The dietary hydrolysable tannin punicalagin releases ellagic acid
that induces apoptosis in human colon adenocarcinoma Caco-2 cells
by using the mitochondrial pathway. J Nutr Biochem. 17:611–625.
2006. View Article : Google Scholar : PubMed/NCBI
|
|
46
|
Qiu Z, Zhou B, Jin L, Yu H, Liu L, Liu Y,
Qin C, Xie S and Zhu F: In vitro antioxidant and antiproliferative
effects of ellagic acid and its colonic metabolite, urolithins, on
human bladder cancer T24 cells. Food Chem Toxicol. 59:428–437.
2013. View Article : Google Scholar : PubMed/NCBI
|
|
47
|
Mishra S and Vinayak M: Ellagic acid
checks lymphoma promotion via regulation of PKC signaling pathway.
Mol Biol Rep. 40:1417–1428. 2013. View Article : Google Scholar
|
|
48
|
Zhao M, Tang SN, Marsh JL, Shankar S and
Srivastava RK: Ellagic acid inhibits human pancreatic cancer growth
in Balb c nude mice. Cancer Lett. 337:210–217. 2013. View Article : Google Scholar : PubMed/NCBI
|
|
49
|
Mishra S and Vinayak M: Ellagic acid
induces novel and atypical PKC isoforms and promotes caspase-3
dependent apoptosis by blocking energy metabolism. Nutr Cancer.
66:675–681. 2014. View Article : Google Scholar : PubMed/NCBI
|
|
50
|
Han DH, Lee MJ and Kim JH: Antioxidant and
apoptosis-inducing activities of ellagic acid. Anticancer Res.
26(5A): 3601–3606. 2006.PubMed/NCBI
|