Introduction
Glycans differentially modified with fucose residues
consist of glycosylated proteins or lipids. Glycoproteins on the
cell surface play important roles in the interaction with other
cell types, extracellular matrices or with pathogenic
microorganisms, and in the binding of growth factors on the cell
surface. Fucose moieties of glycans are removed by α-L-fucosidases
(FUCA)1 and 2 and added by fucosyl transferases (FUT1-11), thereby
modulating these interactions (1-4).
Cell to cell interactions are essential phenomena in the metastatic
process of cancer cells, which involves dislodging of cancer cells
from a primary tumor site to target organs through intravasation
and extravasation, eventually leading to the establishment of
metastatic foci (5,6). It has been reported previously that
α-L-fucosidase activity may prevent cancer progression, since in
vitro removal of α-L-fucose residues from glycoproteins present
on the surface of breast cancer cells with the bovine
α-L-fucosidase enzyme, modulated the adhesion-motility of a breast
cancer cell line, as examined in in vitro models (7,8). On
the other hand, core-fucosylation by FUT8 has been reported to be
crucial for EGF binding and the subsequent EGFR activation by
dimerization, followed by phosphorylation (9). Thus, cell surface fucose residues
play important roles in cancer cell growth and progression
(2).
p53 is a transcription factor that activates genes
involved in cell growth regulation (10). We have previously constructed in
vitro a human temperature-sensitive (ts) mutant
substituting alanine for valine at codon 138 of the p53
(11).
When this mutant gene was expressed in p53-negative
Saos-2 osteosarcoma cells, the ts-p53 construct induced
growth arrest in Saos-2 cells by transactivating p21 CDK2 inhibitor
at the permissive temperature (32.5°C) (12). By differential display analysis of
Saos-2 cells expressing this ts-p53 mutant, in the present
study we identified human FUCA1 as a p53 target gene.
Further, we analyzed FUCA1 expression in thyroid cancers and
thyroid cancer-derived cell lines. We chose two different
histotypes of thyroid cancers, since the majority of anaplastic
thyroid cancers (ATCs) usually carry mutated p53, while less
aggressive, papillary thyroid cancers (PTCs) carry mostly the
wild-type p53 (13). Since
it has been previously shown that fucosylation of cell surface
glycans plays an important role in the metastatic spread of thyroid
cancer (14), we examined the
expression levels of both FUCA1 and FUT8 in the same
set of tissue microarrays consisting of samples of ATCs, PTCs and
normal thyroid tissues. The results reported here strongly suggest
that the differences of p53 gene status in the two different
sets of thyroid cancers examined and the differences in the
expression levels of the two above-mentioned genes may be
responsible for modulating the cell surface fucosylation in the two
types of thyroid cancers and may contribute to their different
clinical behavior. Preliminary results concerning the observation
that FUCA1 is a p53-target gene were presented in the
16th International Symposium on Molecular Medicine in Crete,
Greece, 2013 (15). During the
preparation of this study, Ezawa et al (16) and Baudot et al (17) reported that FUCA1 is a downstream
target of p53.
Materials and methods
Cells and culture
Human osteosarcoma cells expressing exogenously a
temperature-sensitive (ts) p53-alanine138valine
(ts-p53A138V) mutant gene (S/ts-p53) and the corresponding cell
clones transfected with empty vector (S/neo) were previously
described (12). When the cells
were cultured in Dulbecco's modified MEM medium with 10% fetal
bovine serum (FBS), the growth was arrested in G1 or G2/M phase at
32.5°C. The normal human thyroid cell line NTHY, consists of normal
thyroid cells immortalized with SV40 ori-DNA (18), TPC1 is a cell line established from
a papillary thyroid cancer (PTC) (19) and CAL62 is a cell line (20) established from a human anaplastic
thyroid cancer (ATC). These cells were grown in RPMI-1640
(Gibco/Invitrogen; Thermo Fisher Scientific Co., Tokyo, Japan)
containing 10% FBS.
Preparation of cell RNA
Cellular RNAs were prepared from cell clones of
S/ts-p53, which had been cultured at 37.5°C and then shifted
to 32.5°C for various lengths of time. RNAs were prepared, using an
Isogen kit (Nippon Gene, Toyama, Japan), as described in the kit
instructions (12).
Differential display
An mRNA fingerprinting kit from Nippon Gene was
used. Total cell RNA prepared was further purified by treating with
RNase-free DNase (Nippon Gene), as described in the kit
instructions. cDNAs corresponding to 3′ terminal regions of mRNAs
were amplified by PCR, using one of 3 different anchor primers
(GT15G, CT15G, and AT15G), and one of 50 different 5′ arbitrary
primers, included in the kit. After PCR amplification, portions
were run on a 12% polyacrylamide gel (PAGE) with MspI-digested
pBR322 DNA fragments (New England Biolabs, Ipswich, MA, USA) as
size markers. DNA fragments were visualized under a 300 nm UV light
after staining with ethidium bromide (0.5 μg/ml). A band,
the intensity of which showed an increment after temperature
shift-down, was excised from the gel and the DNA present in the
band (B4 fragment) was extracted, purified, and ligated to a T/A
cloning vector, pCR2.1 (Invitrogen Life Technologies, Tokyo, Japan)
(21). The insert of pCR2.1 vector
was sequenced with M13 forward and reverse primers as per the
instructions provided in the Invitrogen manual.
Northern hybridization
Northern hybridization was performed as previously
described (12). After the
transfer of RNA to a nylon membrane filter (Millipore Co., Tokyo,
Japan), it was exposed to a UV light. During this fixation,
integrity and equal loading of RNAs were confirmed (data not
shown). 32P-dCTP-labeled DNA probe was prepared from the
cloned B4 fragment, and used to hybridize Northern filters. The
hybridized filters were washed, and exposed to an image plate,
which was analyzed by a Fuji image analyzer (Fuji Film Co., Tokyo,
Japan) (12).
Western blot analysis
Cellular proteins were prepared from cells with or
without the temperature shift-down, by lysing on plates, with RIPA
buffer (Nacalai Tesk, Kyoto, Japan), as previously described
(22). The protein lysates were
run on a 5–20% precast polyacrylamide gel (Ato-kabushikieyashiro
Inc., Tokyo, Japan) and the proteins were transferred to a membrane
filter (Immobilon, Millipore Co.). For the integrity and equal
loading of protein lysates, membranes were stained with Ponceau S
and destained as described (23).
The membranes were then blocked with 5% skim milk and probed with
anti-FUCA1 antibody (AV54293, polyclonal antibody made with an
immunogen consisting of FUCA1 amino acids 144–193, Sigma-Aldrich,
Tokyo, Japan). The filter was incubated with a secondary
anti-rabbit antibody conjugated with peroxidase, and the protein
bands were visualized by the use of an ECL illumination kit
(Amersham, Tokyo Japan), as previously described (22). The gel images were captured by a
LAS-4000 image analyzer (GE Healthcare, Tokyo, Japan).
Microarray analysis of FUCA1 and FUT8
gene expression in thyroid cancer tissues
Tumor and normal tissues from thyroid cancer
patients were collected. RNA preparation from tissues, cDNA
synthesis, hybridization to microarray plates, data collection, and
data analyses have been previously described (24). The data collected by cDNA
microarray analyses were used to determine the expression levels of
FUCA1 and FUT8 gene in 8, 4, and 4 biopsy samples
derived from PTC, ATC, and normal tissues, respectively.
Colony forming efficiency of thyroid
cells
DDK-MYC-tagged FUCA1 DNA, DDK-MYC-tagged
FUCA2 DNA, and the empty vector DNA, all carrying the
neomycin resistance gene (OriGene, Rockville, MD, USA) or
H2O instead of plasmid DNA, were transfected with a
transfection kit (Roche Diagnostics, Germany) in Opti-MEM
(Gibco/Invitrogen; Thermo Fisher Scientific Co.) to 70% confluent
thyroid normal or cancer cells grown in 60-mm plates. The next day
the medium was replaced with Dulbecco's modified MEM containing 10%
FBS and 600 μg/ml G418 (Invitrogen; Thermo Fisher Scientific
Co.). Thereafter, the medium was changed twice a week and colonies
appearing 4 weeks later were stained with Giemsa. Colony formation
of thyroid normal or cancer cells were compared between cells
transfected with FUCA1 or 2 plasmid DNA or with empty
plasmid vector.
Results
Differential display to identify
p53-target gene
To search for p53 target genes by
differential display, we took advantage of the use of S/ts-p53
cells that expressed a ts-p53 mutant gene
(ts-p53A138V). Total cellular RNAs from S/ts-p53 cells were
prepared at different times after temperature shift-down to the
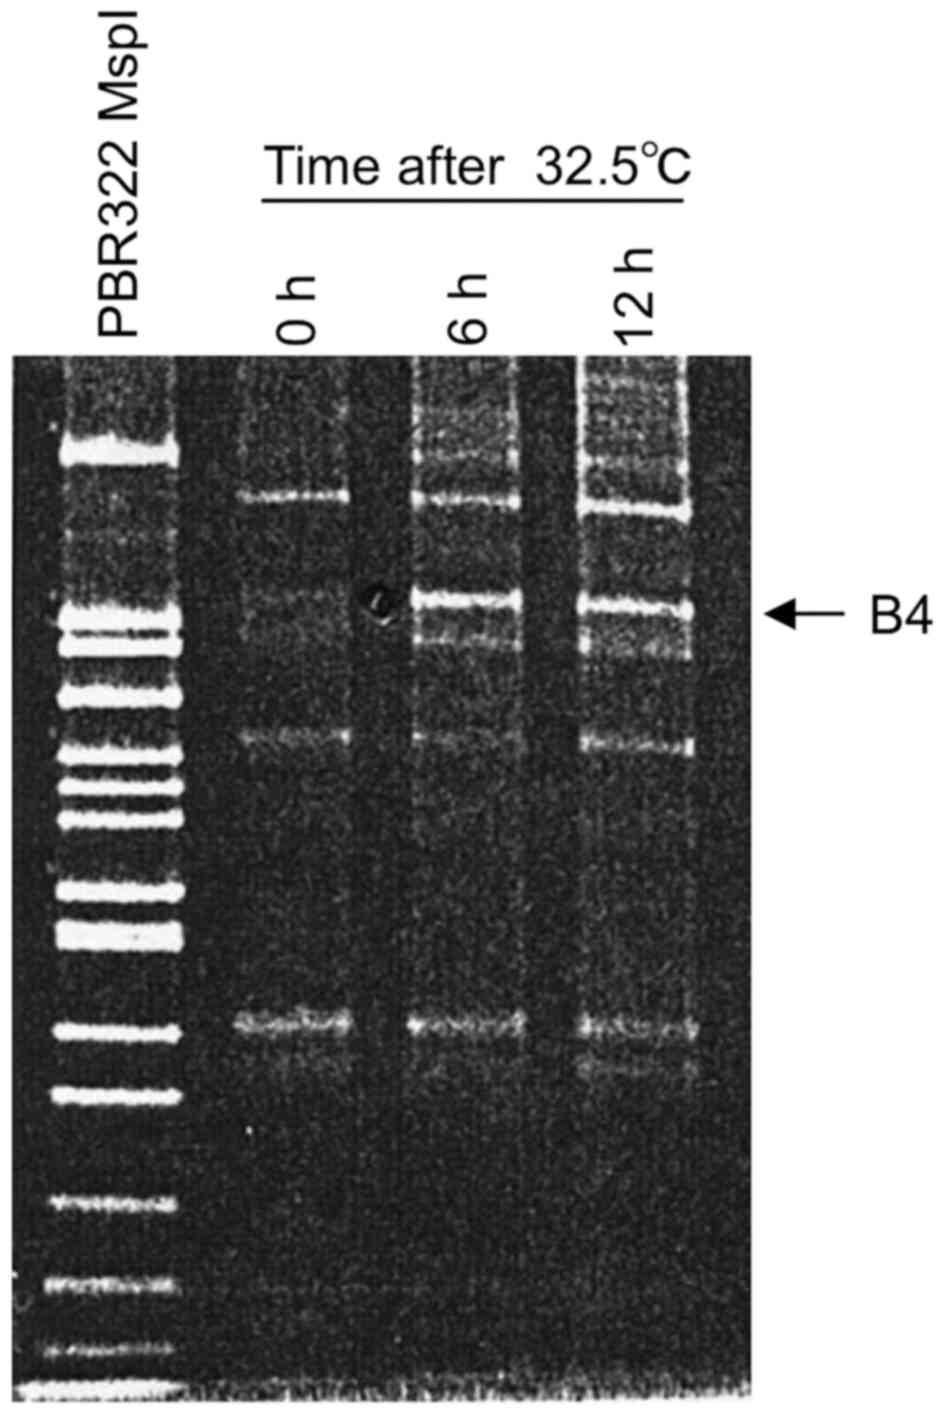
permissive temperature (32.5°C). When B4 was used as a 5′ arbitrary
primer (5′-CGTCTTTCTG-3′) and 5′-GT15G-3′ as a 3′ anchor primer, a
wild-type p53-induced fragment was detected as a prominent band
having around 240 bp in length, designated B4 fragment in a 12%
PAGE (Fig. 1). This band was
readily detected in a sample prepared at 6 h after the temperature
shift-down and its level was similar at 12 h, suggesting that the
B4 fragment sequence represents an RNA species induced by the
wild-type p53. Consequently, the induced B4 fragment was
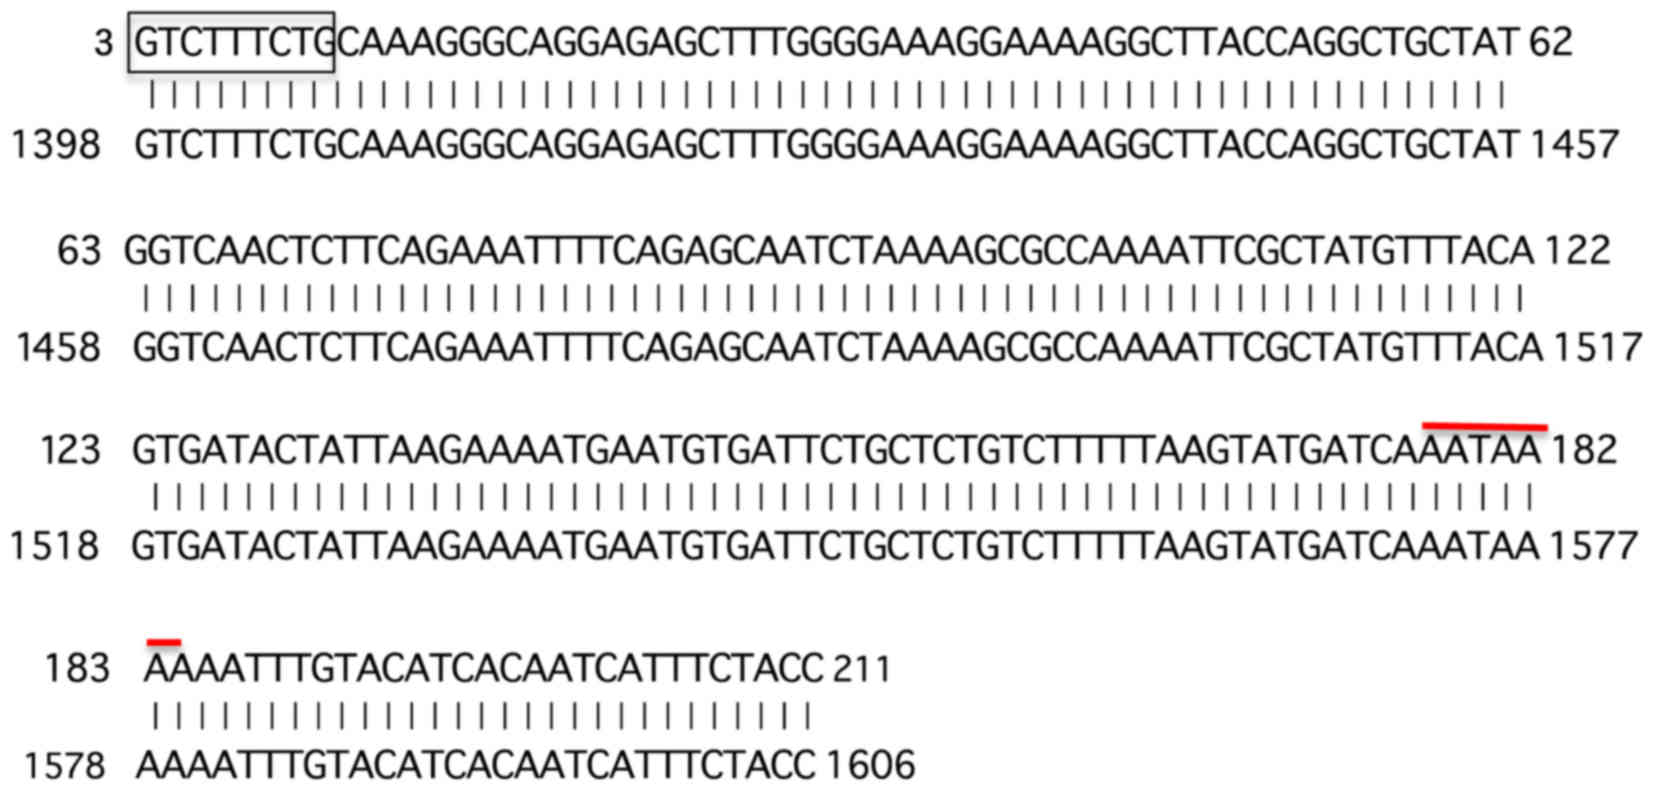
cloned into a T/A cloning vector and the insert was sequenced. The
sequence obtained was blasted to the NCBI data base (URL:
www.ncbi.nih.gov) (Fig. 2). As expected, the 5′ end of the
determined B4 fragment contained the 3′ side 9-base sequence
(5′-GTCTTTCTG-3′) out of the upstream 5′ arbitrary 10 base primer
sequence (5′-CGTCTTTCTG-3′) except for the 5′ most C residue.
In addition, the B4 fragment contained the poly(A)
addition signal near the 3′ end. Further, the obtained sequence was
found to match exactly with the 3′ end region within the non-coding
sequence of the exon 8 of human α-L-fucosidase-I (FUCA1)
mRNA (gene bank: KR710572). To confirm that FUCA1 mRNA was
transcriptionally induced in cells by the wild-type activity of
ts-p53A138V, we performed Northern hybridization using
32P-labeled B4 fragment as a probe for RNAs prepared
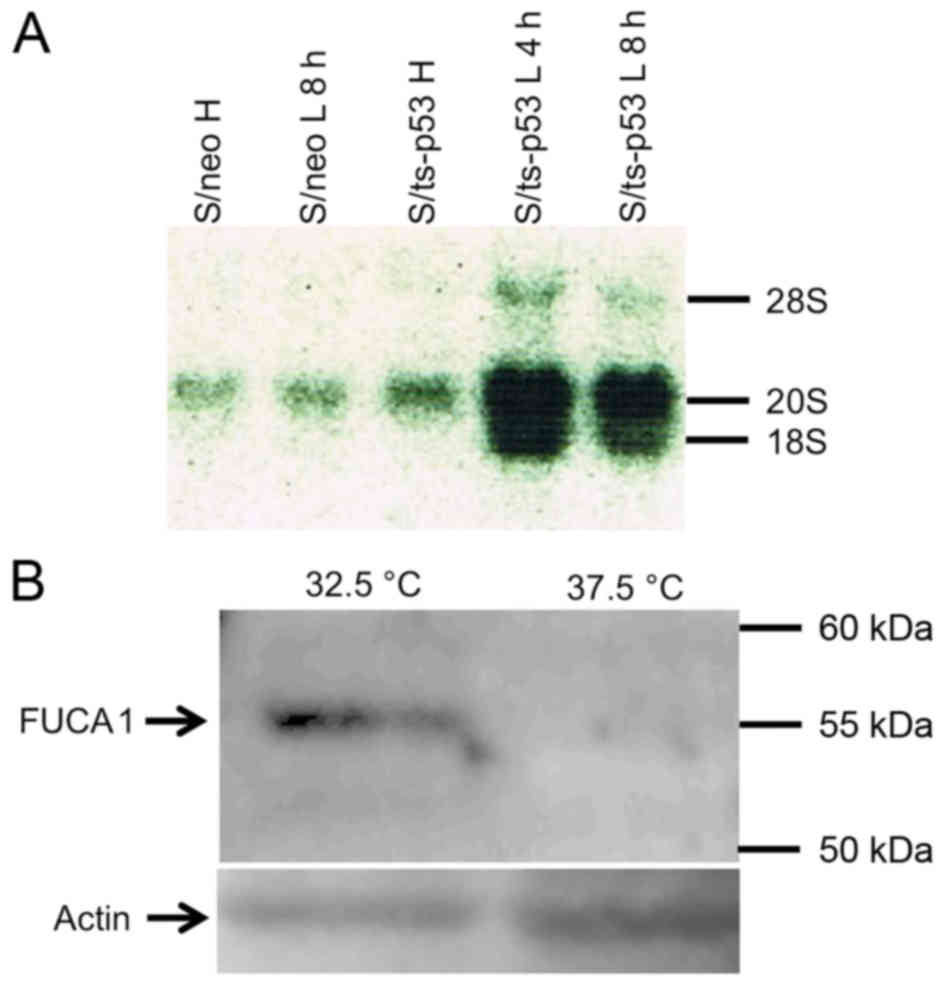
from S/ts-p53 cells that were incubated at 32.5°C. Fig. 3A shows that FUCA1 mRNA
species having approximately 20S and 18S sizes, were induced in
S/ts-p53 cells 4 h after incubation at 32.5°C. On the contrary, low
levels of 20S RNA species and no detectable 18S RNA were
synthesized in S/neo cells prepared either before or after the
temperature shift to 32.5°C, thus suggesting that both RNA species
were p53-inducible in S/ts-p53 cells. In agreement with the results
of upregulation of the FUCA1 mRNA, Fig. 3B shows that also a 55 kD FUCA1
protein band was detected in lysates of S/ts-p53 cells prepared
after incubation at the permissive temperature (32.5°C) but was
hardly detected at significant levels in the same cells incubated
at the non-permissive temperature (37.5°C).
FUCA1 expression levels are high in
papillary thyroid cancers but low in anaplastic thyroid
cancers
As most PTCs carry the wild-type p53, while
most ATCs carry mutant p53 (13), we analyzed FUCA1 RNA
expression levels by microarray analysis of papillary and
anaplastic thyroid cancers versus normal thyroid tissues. Average
levels of FUCA1 mRNA were low in ATCs while expression
levels in PTC samples were comparable or slightly higher than those
present in normal thyroid tissues (Fig. 4). Even though we have not studied
the p53 status of the samples analyzed, it is reasonable to assume
that the FUCA1 expression levels may be related to the
p53 status in the two different thyroid cancer
histotypes.
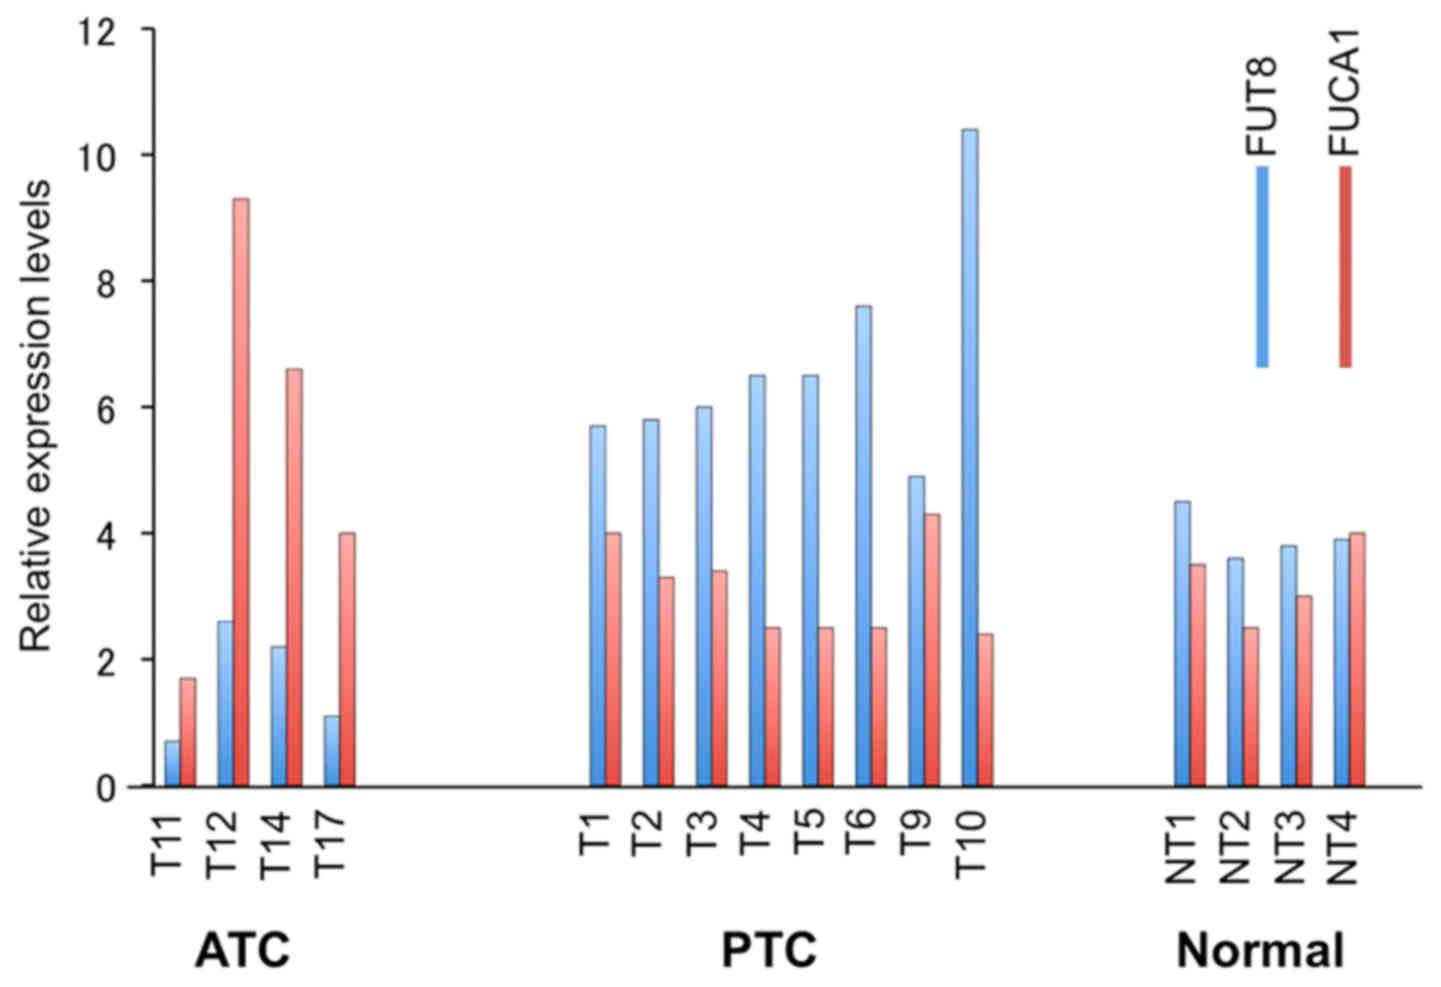 | Figure 4Microarray analyses of FUT8
(blue) and FUCA1 (red) expression. Four ATC samples (T11,
T12, T14, T17), 8 PTCs samples (T1, T2, T3, T4, T5, T6, T9, T10),
and 4 normal thyroid tissues (NT1, NT2, NT3, NT4) are shown. |
Overexpression of FUCA1 does not affect
the clonogenic potential of thyroid cancer and normal cells
Since we found that FUCA1 was expressed at
low levels in ATCs, compared with PTCs and normal thyroids we have
used a set of normal, ATC- and PTC-derived cancer cell lines to
investigate whether the enforced expression of
α-L-fucosidase genes in these cell lines could have an
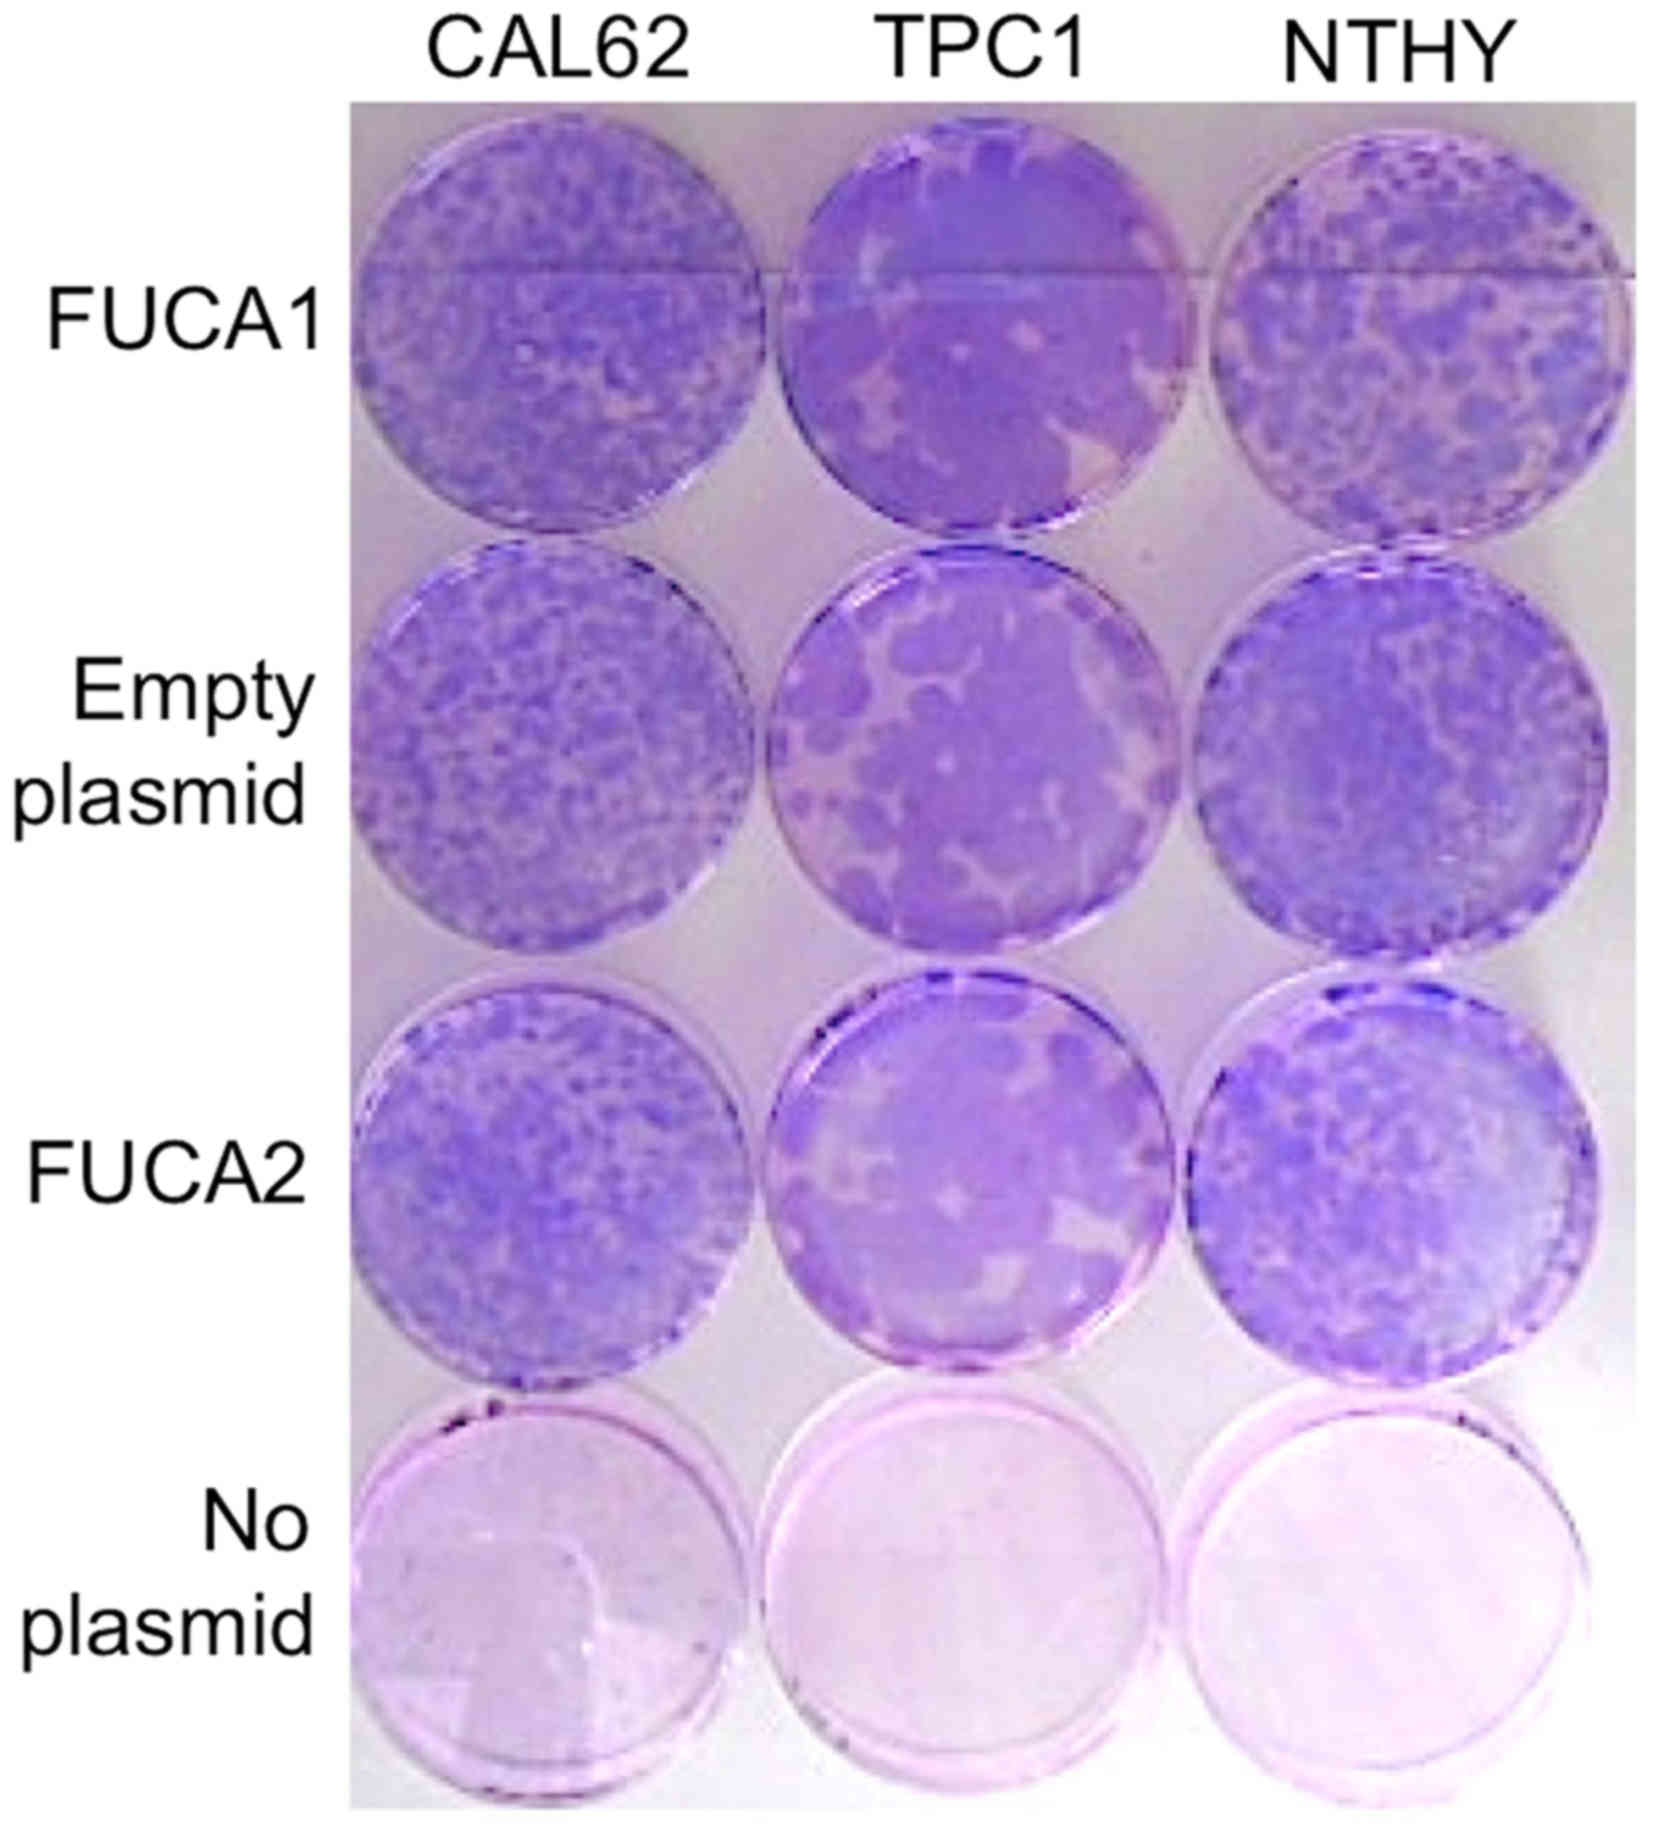
inhibitory growth effect on any of the cell lines tested. To this
aim, we analyzed the colony forming efficiencies of an ATC-derived
cell line (CAL62), of a PTC-derived cell line (TPC1) and a normal
thyroid cell line (NTHY) after transfection with FUCA1 or
FUCA2 containing plasmids or with the empty plasmid vector.
As shown in Fig. 5, there were no
significant differences in colony forming efficiencies between
α-L-fucosidases-transfected, and empty vector-transfected
cells for normal NTHY, papillary TPC1, and anaplastic CAL62 tumor
cell lines. This result suggests that the enforced expression of
α-L-fucosidases did not significantly affect the clonogenic
potential of the thyroid cancer or normal cells.
FUT8 RNA expression levels are inversely
related to those of FUCA1 RNA
Since fucose levels of cell surface glycoproteins is
enhanced by fucosyltransferases (FUTs), we also analyzed
FUT8 mRNA levels in the same thyroid cancer and normal
biopsies samples by microarray analysis. As shown in Fig. 4, Fut8 expression was higher
in ATC but lower in PTC samples, thus showing the existence of an
inverse relationship between the expression levels of FUCA1
and FUT8 RNA in the two different thyroid cancer histotypes
analyzed. We have also analyzed the expression levels of FUT1,
FUT3, FUT4, and FUT6, however, we did not detect such
drastic changes as observed for FUCA1 and FUT8 (data
not shown).
Discussion
FUCA1 is transcriptionally induced by
p53
In the present study we showed that FUCA1 is
transcriptionally activated by the wild-type activity of
p53, as evidenced by the result that 18S and 20S FUCA1 RNA
species were induced in the Saos-2/ts-p53A138V cells. Accordingly,
the induced FUCA1 protein was detected in the Saos-2 cells at the
permissive temperature and was hardly detected at significant
levels at the non-permissive temperature. Further, we analyzed
microarrays of samples obtained from ATC- or PTC-bearing patients
and from normal thyroid tissues. We found that the ATC specimens
displayed low levels of FUCA1 expression compared with
either PTC or normal thyroid tissue specimens. Since most ATCs are
reported to harbor a mutated p53, while PTCs generally
harbor the wild-type p53 (13), it is reasonable to conclude that
the levels of FUCA1 expression are related to the p53
status, i.e., in ATC samples low levels of FUCA1 are related
to the presence of a mutated p53, whereas PTC samples, which
contain the wild-type p53, display relatively high levels of
FUCA1, as the normal thyroids. In fact we confirmed these
differences at protein level in cell lines derived from the two
different cancer histotypes (25).
In addition to anaplastic thyroid cancer,
FUCA1 expression is downregulated in aggressive forms of
colorectal cancers (26), breast
cancers (27), and neuroblastomas
(28). It should be noted that a
gradual decrease in FUCA1 expression was observed with
progression of disease from earlier to advanced stages in
colorectal cancer (26). Also in
the case of thyroid cancer, as shown previously (25) less aggressive thyroid PTCs
expressed higher levels of FUCA1, compared with the more aggressive
ATCs, which displayed lower levels of FUCA1 expression. It is
interesting to note that it has been reported that ATCs derive from
progression of more differentiated PTCs and of follicular thyroid
cancers (FTCs) (29). It is
therefore speculated that one of the steps in progression of
thyroid cancer may be related to the loss of FUCA1 expression which
is consequent to the loss of the wild-type p53 status. In both
cases (thyroid and colon cancers) therefore, p53 mutations
are likely to be associated with the more aggressive phenotype and
with progression (29,30).
As described above, it was suggested that low levels
of FUCA1 are related to the aggressiveness of the cancer
type, rather than to the tumor cell growth per se. Using a
different cancer cell system, Ezawa et al (16) recently reported that transfection
of FUCA1 induced apoptosis. It is likely that this is not
the case with the thyroid cell system used by us since the results
obtained by us and reported here regarding the clonogenic potential
of FUCA1 transfected TPC1 and CAL-62 cells suggested that
enforced FUCA1 expression did not interfere with the
clonogenic potential of normal thyroid and PTC- and ATC-derived
cancer cell lines, nor, as reported previously (25), enforced expression of FUCA1
interfered with the cell growth potential of another ATC-derived
cell line, 8505c. Our finding is thus consistent with that reported
by Baudot et al (17), who
showed that the wild-type FUCA1 did not interfere with the
clonogenic potential of Saos-2 cell growth, nor affected directly
apoptosis. Besides, FUCA1 interfered with the capacity of
the transfected anaplastic cell line to grow in agar or penetration
through Matrigel and to adhere to various matrices (25). Taken together with the result that
higher levels of FUCA1 were expressed in PTCs, it is
conceivable, thus, that removal of fucose residues by FUCA1
from cell surface molecules, might decrease the binding of cancer
cells to endothelium or to extracellular matrix molecules, which is
considered as a necessary step leading to the metastatic process of
breast cancer cells (7,8) and thyroid cancer cells (25).
Roles of upregulation of FUT8 in
carcinogenesis
We found also that fucosyltransferase 8 (FUT8), but
not FUT1, FUT3, FUT4, and FUT6 were aberrantly upregulated in
aggressive ATCs and downregulated in less aggressive PTCs.
Upregulation of FUT8 has been reported for several other types of
cancer: hepatocellular carcinoma, lung cancer, breast and prostate
cancers (31). In addition, we
found an inverse relationship in the relative expression levels of
FUCA1 and FUT8, in PTCs and ATCs. As described above,
FUT8 is involved in core-fucosylation. Increased core-fucosylation
of growth factor receptor (GFR) was reported to be associated with
increased GFR-mediated signaling and with tumor cell growth and
malignancy (2,31,32).
Consequently, ATCs displaying lower levels of FUCA1 and higher
levels of FUT8, may have gained a more aggressive phenotype, also
as a consequence of the increased fucose levels present on their
surface glycoproteins, while PTCs, displaying higher levels of
FUCA1 mRNA and lower levels of FUT8 mRNA show a less
aggressive phenotype, also as a consequence of the decreased fucose
levels present on their surface glycoproteins. Further experiments
are needed in the direction of ascertaining which are the important
target molecules present on the cell surface of these two cancer
histotypes.
Acknowledgments
We are highly indebted to Giuliana Salvatore for
providing the thyroid cancer microarray data set and to Giuliana
Salvatore, Massimo Santoro, Mikko O. Laukkanen, Shinjiro Kanazawa,
Kei Fujinaga, and Alfredo Fusco, for the constructive suggestions
and comments received during the course of this work. We are also
indebted to Yuichi Murakami, Mayumi Ono, Michihiko Kuwano, for the
help received with western blot analysis, and to Kazuhiko Kaji, to
Kouji Yoshida for supplying cultured cells, and to A.K. Munirajan
for the helpful suggestions received during the course of
differential display analysis. The excellent technical and
administrative assistance of Akio Iritani is also gratefully
acknowledged This work was partly supported by Progetto PON
01_02782, entitled 'Novel nanotech strategies for development of
drugs and diagnostics for targeting of circulating cancer cells',
of the Ministero dell'Istruzione, Università e Ricerca (Italy) to
the Istituto Superiore di Oncologia (ISO) and by research grants
from the Ministry of Education, Culture, Sports, Science, and
Technology, Japan.
References
|
1
|
Potapenko IO, Haakensen VD, Lüders T,
Helland A, Bukholm I, Sørlie T, Kristensen VN, Lingjaerde OC and
Børresen-Dale AL: Glycan gene expression signatures in normal and
malignant breast tissue; possible role in diagnosis and
progression. Mol Oncol. 4:98–118. 2010. View Article : Google Scholar : PubMed/NCBI
|
|
2
|
Pinho SS and Reis CA: Glycosylation in
cancer: Mechanisms and clinical implications. Nat Rev Cancer.
15:540–555. 2015. View
Article : Google Scholar : PubMed/NCBI
|
|
3
|
Munkley J and Elliott DJ: Hallmarks of
glycosylation in cancer. Oncotarget. 7:35478–35489. 2016.PubMed/NCBI
|
|
4
|
Intra J, Perotti ME, Pavesi G and Horner
D: Comparative and phylogenetic analysis of alpha-L-fucosidase
genes. Gene. 392:34–46. 2007. View Article : Google Scholar
|
|
5
|
Fidler IJ: The pathogenesis of cancer
metastasis: The 'seed and soil' hypothesis revisited. Nat Rev
Cancer. 3:453–458. 2003. View
Article : Google Scholar : PubMed/NCBI
|
|
6
|
Valastyan S and Weinberg RA: Tumor
metastasis: Molecular insights and evolving paradigms. Cell.
147:275–292. 2011. View Article : Google Scholar : PubMed/NCBI
|
|
7
|
Yuan K, Kucik D, Singh RK, Listinsky CM,
Listinsky JJ and Siegal GP: Alterations in human breast cancer
adhesion-motility in response to changes in cell surface
glycoproteins displaying α-L-fucose moieties. Int J Oncol.
32:797–807. 2008.PubMed/NCBI
|
|
8
|
Yuan K, Listinsky CM, Singh RK, Listinsky
JJ and Siegal GP: Cell surface associated alpha-L-fucose moieties
modulate human breast cancer neoplastic progression. Pathol Oncol
Res. 14:145–156. 2008. View Article : Google Scholar : PubMed/NCBI
|
|
9
|
Wang X, Gu J, Ihara H, Miyoshi E, Honke K
and Taniguchi N: Core fucosylation regulates epidermal growth
factor receptor-mediated intracellular signaling. J Biol Chem.
281:2572–2577. 2006. View Article : Google Scholar
|
|
10
|
Beckerman R and Prives C: Transcriptional
regulation by p53. Cold Spring Harb Perspect Biol. 2:a0009352010.
View Article : Google Scholar : PubMed/NCBI
|
|
11
|
Tsutsumi-Ishii Y, Tadokoro K, Hanaoka F
and Tsuchida N: Response of heat shock element within the human
HSP70 promoter to mutated p53 genes. Cell Growth Differ. 6:1–8.
1995.PubMed/NCBI
|
|
12
|
Yamato K, Yamamoto M, Hirano Y and
Tsuchida N: A human temperature-sensitive p53 mutant p53Val-138:
Modulation of the cell cycle, viability and expression of
p53-responsive genes. Oncogene. 11:1–6. 1995.PubMed/NCBI
|
|
13
|
Ito T, Seyama T, Mizuno T, Tsuyama N,
Hayashi T, Hayashi Y, Dohi K, Nakamura N and Akiyama M: Unique
association of p53 mutations with undifferentiated but not with
differentiated carcinomas of the thyroid gland. Cancer Res.
52:1369–1371. 1992.PubMed/NCBI
|
|
14
|
Mackinnon WB, Delbridge L, Russell P, Lean
CL, May GL, Doran S, Dowd S and Mountford CE: Two-dimensional
proton magnetic resonance spectroscopy for tissue characterization
of thyroid neoplasms. World J Surg. 20:841–847. 1996. View Article : Google Scholar : PubMed/NCBI
|
|
15
|
Tsuchida N, Ikeda MA, Kanazawa S, Ishino
Y, Kaji K, Salvatore G and Vecchio G: Alpha-L-fucosidase (FUCA1) is
a p53 target gene, and is expressed at low levels in anaplastic
thyroid carcinomas. Int J Mol Med. 32(Suppl 1): S362013.
|
|
16
|
Ezawa I, Sawai Y, Kawase T, Okabe A,
Tsutsumi S, Ichikawa H, Kobayashi Y, Tashiro F, Namiki H, Kondo T,
et al: Novel p53 target gene FUCA1 encodes a fucosidase and
regulates growth and survival of cancer cells. Cancer Sci.
107:734–745. 2016. View Article : Google Scholar : PubMed/NCBI
|
|
17
|
Baudot AD, Crighton D, O'Prey J, Somers J,
Sierra Gonzalez P and Ryan KM: p53 directly regulates the
glycosidase FUCA1 to promote chemotherapy-induced cell death. Cell
Cycle. 15:2299–2308. 2016. View Article : Google Scholar : PubMed/NCBI
|
|
18
|
Sunde M, McGrath KC, Young L, Matthews JM,
Chua EL, Mackay JP and Death AK: TC-1 is a novel tumorigenic and
natively disordered protein associated with thyroid cancer. Cancer
Res. 64:2766–2773. 2004. View Article : Google Scholar : PubMed/NCBI
|
|
19
|
Tanaka J, Ogura T, Sato H and Hatano M:
Establishment and biological characterization of an in vitro human
cytomegalovirus latency model. Virology. 161:62–72. 1987.
View Article : Google Scholar : PubMed/NCBI
|
|
20
|
Gioanni J, Zanghellini E, Mazeau C, Zhang
D, Courdi A, Farges M, Lambert JC, Duplay H and Schneider M:
Characterization of a human cell line from an anaplastic carcinoma
of the thyroid gland. Bull Cancer. 78:1053–1062. 1991.In French.
PubMed/NCBI
|
|
21
|
Murugan AK, Hong NT, Fukui Y, Munirajan AK
and Tsuchida N: Oncogenic mutations of the PIK3CA gene in head and
neck squamous cell carcinomas. Int J Oncol. 32:101–111. 2008.
|
|
22
|
Liu J, Uematsu H, Tsuchida N and Ikeda MA:
Essential role of caspase-8 in p53/p73-dependent apoptosis induced
by etoposide in head and neck carcinoma cells. Mol Cancer.
10:952011. View Article : Google Scholar : PubMed/NCBI
|
|
23
|
Romero-Calvo I, Ocón B, Martínez-Moya P,
Suárez MD, Zarzuelo A, Martínez-Augustin O and de Medina FS:
Reversible Ponceau staining as a loading control alternative to
actin in western blots. Anal Biochem. 401:318–320. 2010. View Article : Google Scholar : PubMed/NCBI
|
|
24
|
Salvatore G, Nappi TC, Salerno P, Jiang Y,
Garbi C, Ugolini C, Miccoli P, Basolo F, Castellone MD, Cirafici
AM, et al: A cell proliferation and chromosomal instability
signature in anaplastic thyroid carcinoma. Cancer Res.
67:10148–10158. 2007. View Article : Google Scholar : PubMed/NCBI
|
|
25
|
Vecchio G, Parascandolo A, Allocca C,
Ugolini C, Basolo F, Moracci M, Strazzulli A, Cobucci-Ponzano B,
Laukkanen MO, Castellone MD and Tsuchida N: Human α-L-fucosidase-1
attenuates the invasive properties of thyroid cancer. Oncotarget.
View Article : Google Scholar : 2017.
|
|
26
|
Otero-Estévez O, Martínez-Fernández M,
Vázquez-Iglesias L, Páez de la Cadena M, Rodríguez-Berrocal FJ and
Martínez-Zorzano VS: Decreased expression of alpha-L-fucosidase
gene FUCA1 in human colorectal tumors. Int J Mol Sci.
14:16986–16998. 2013. View Article : Google Scholar : PubMed/NCBI
|
|
27
|
Cheng TC, Tu SH, Chen LC, Chen MY, Chen
WY, Lin YK, Ho CT, Lin SY, Wu CH and Ho YS: Down-regulation of
α-L-fucosidase 1 expression confers inferior survival for
triple-negative breast cancer patients by modulating the
glycosylation status of the tumor cell surface. Oncotarget.
6:21283–21300. 2015. View Article : Google Scholar : PubMed/NCBI
|
|
28
|
Krause A, Combaret V, Iacono I, Lacroix B,
Compagnon C, Bergeron C, Valsesia-Wittmann S, Leissner P, Mougin B
and Puisieux A: Genome-wide analysis of gene expression in
neuroblastomas detected by mass screening. Cancer Lett.
225:111–120. 2005. View Article : Google Scholar : PubMed/NCBI
|
|
29
|
Castellone MD and Vecchio G: RET and
Thyroid Carcinomas. Chromosomal Translocations and Genome
Rearrangements. Springer Publisher; pp. 357–380. 2015, View Article : Google Scholar
|
|
30
|
Fearon ER and Vogelstein B: A genetic
model for colorectal tumorigenesis. Cell. 61:759–767. 1990.
View Article : Google Scholar : PubMed/NCBI
|
|
31
|
Takahashi M, Kuroki Y, Ohtsubo K and
Taniguchi N: Core fucose and bisecting GlcNAc, the direct modifiers
of the N-glycan core: Their functions and target proteins.
Carbohydr Res. 344:1387–1390. 2009. View Article : Google Scholar : PubMed/NCBI
|
|
32
|
Kizuka Y and Taniguchi N: Enzymes for
N-Glycan branching and their genetic and nongenetic regulation in
cancer. Biomolecules. 6:pii: E25. 2016. View Article : Google Scholar : PubMed/NCBI
|