Introduction
Cholangiocarcinoma (CCA), an aggressive malignancy,
is derived from the epithelial cells of bile duct. It is a
relatively rare cancer associated with poor outcomes; however, its
incidence and mortality rates are progressively increasing
worldwide (1). CCA occurs with a
relatively high incidence in the Northeast Thailand and is often
associated with liver fluke (Opisthorchis viverrini)
infestation and nitrosamine intake (2). Early diagnosis is still difficult due
to lack of the specific biomarkers. Thus far, serum biomarkers of
CCA include carbohydrate antigen 19-9 (CA19-9) and carcinoembryonic
agent (CEA), but these proteins are also present in other diseases
like cholangitis and pancreatitis (3,4).
Novel biomarkers for CCA have been investigated, including matrix
metalloproteinase-7 (5), miRNAs
(6), interleukin-6 (7), and sperm-specific protein 411
(SSP411) (8) but none have been
used with the patients yet.
Biomarker discovery using secretomes, containing the
secreted macromolecules from cells, has yielded interesting results
(9). Our previous study on the
secretomes of cholangiocarcinoma cells in comparison to 4 other
hepatocellular carcinoma cells revealed that lipocalin-2 (NGAL) and
49 other proteins were present only in the secretion of the
cholangiocarcinoma cell, and NGAL was proposed to be a potential
biomarker (10). Three-dimensional
(3D) cell culture is now receiving more interest, since it mimics
the in vivo condition. Our group reported the use of
scaffold-based 3D culture and hollow fiber bioreactor (HFB), a 3D
culture system based on hollow fiber cartridges, for preparing
secretomes (11,12). Comparison of the secretome proteins
from a 3D culture system with those from conditioned media of
monolayer culture (MNC) system indicated effective enrichment of
secretomes from the HFB system compared to those from MNC in terms
of both quality and quantity (12). At that time, using a cartridge with
a 20 kDa molecular weight cut-off (MWCO), C19orf10 and cystatin B
proteins were found to be present only in the HFB system, and the
expression level of 75 protein spots was significantly increased
compared to the MNC system.
The 20S proteasome is a proteolytic core of the
proteasome complex, which is involved in the degradation of
misfolded and damaged proteins. It is a barrel-like structure in
which the 28 subunits are assembled into four stacked heptametrical
ring: two outer rings composed of seven α-subunits (α1–α7) and two
inner rings composed of seven β-subunits (β1–β7) (13). Accumulating evidence suggests that
proteasome activity is elevated in various types of cancer cells
(14–16). This agrees with the fact that
cancer cells are more sensitive to proteasome inhibitor than normal
cells. Of note, the 20S proteasome is also detectable in human
plasma and designated as a circulating proteasome (17). Interestingly, the concentration of
circulating proteasome has been reported to be increased and
associated with the stage of cancer (18).
In this report, the HFB system with a 5 kDa MWCO was
studied. With this 5 kDa MWCO cartridge, most secreted proteins
were retained and harvested for proteomic analysis. The secreted
proteins from conditioned media of HFB and MNC systems were
compared by two-dimensional gel electrophoresis (2DE) and
identified by liquid chromatography mass spectrometry (LC/MS/MS).
The different expression levels of interesting proteins were
quantitatively-analyzed and confirmed by immune detection.
Moreover, a candidate protein, proteasome subunit α type-3 (PSMA3),
was validated in plasma samples from normal, liver cancer and
cholangiocarcinoma patients.
Materials and methods
Plasma collection
Specimens were collected at Sappasitthiprasong
Hospital, Ubon Ratchathani, Thailand. The definitive diagnosis of
cholangiocarcinoma and hepatocellular carcinoma was based on the
histopathological examination of biopsy or surgical specimens.
Detailed information of patients (n=7; 4 cholangiocarcinoma and 3
hepatocellular carcinoma) including sex, age, the definitive
diagnosis and staging are shown in Table I. Blood specimens were collected at
the first patient visit when there was clinical suspicion of
cholangiocarcinoma, because of signs and symptoms of obstructive
jaundice and presence in a population at risk in the high
prevalence area. Control blood group (n=5; 3 males, 2 females, with
average age of 53.8±2.7) was defined as healthy individuals who
presented for an annual checkup. Plasma-EDTA samples were retrieved
as left-over specimens within 30 min after routine complete blood
counting and then kept aliquots at −80°C until used. The study was
approved by the local ethics committee of Faculty of Medicine
Ramathibodi Hospital, Mahidol University and Sappasitthiprasong
Hospital (protocol ID 03-58-68) and written informed consent was
waived due to use of left-over specimens.
 | Table IDetailed characteristics of
patients. |
Table I
Detailed characteristics of
patients.
| Sample ID | Male/Female | Age | Diagnosis | Staging |
|---|
| C1 | M | 55 | Cholangiocarcinoma,
intrahepatic | 4A |
| C2 | M | 67 | Cholangiocarcinoma,
intrahepatic | 3 |
| C3 | F | 55 | Cholangiocarcinoma,
intrahepatic | 3 |
| C4 | M | 46 | Cholangiocarcinoma,
perihilar | 1 |
| C5 | F | 72 | Hepatocellular
carcinoma with chronic cholangitis | 3C |
| C6 | M | 52 | Hepatocellular
carcinoma with cirrhosis | 3A |
| C7 | F | 61 | Hepatocellular
carcinoma | 1 |
Monolayer culture system
Human cholangiocarcinoma cell line (HuCCA-1)
originating from a Thai patient (19) was cultured in Ham's F-12 (Gibco;
Thermo Fisher Scientific, Inc., Waltham, MA, USA) with 10% fetal
bovine serum (FBS, Hyclone; GE Healthcare Life Sciences, Chicago,
IL, USA) and 1% antibiotic-antimycotic (Gibco). Hepatocellular
carcinoma cell line (HCC-S102) established from a Thai patient
(20) was grown in RPMI-1640
(Gibco; Thermo Fisher Scientific, Inc.) containing 10% FBS
(Hyclone) and 1% antibiotic-antimycotic. After the cells reached
~70% confluence, culture medium was replaced with serum-free
medium. The culture was further incubated for 24 h before the
entire conditioned medium was harvested. For experiments comparing
MNC and HFB systems, HuCCA-1 cells were cultured in the serum-free
media with a CDM-HD serum replacement (FiberCell®
Systems Inc., Frederick, MD, USA) as described in our previous
study (12). The conditioned media
were collected daily and replaced with fresh media. The collected
media were harvested by sequential centrifugation at 480 × g at 4°C
for 5 min and 2,000 × g for 10 min to remove contaminated cells and
cell debris, respectively. After centrifugation, the conditioned
media were kept at −80°C until use.
Hollow fiber bioreactor culture
system
Approximately 1×10⁸ CDM-adapted HuCCA-1
cells were inoculated into the hollow fiber bioreactor with a 5 kDa
MWCO cartridge (#C2008, FiberCell Systems Inc.) according to the
manufacturer's instructions. The entire conditioned media were
collected daily and the fresh new media were replaced. The
collected media were harvested using the same protocol performed in
the MNC system as described previously.
Measurement of glucose consumption
The growth of cells cultured in the HFB and MNC
systems was indirectly monitored by glucose consumption. The
depletion rate of glucose in the media was determined using a blood
glucose meter (Medisafe-mini GR-102, Terumo Co., Tokyo, Japan) as
previously described (12).
Measurement of lactate dehydrogenase
release
The lactate dehydrogenase (LDH) cytotoxicity
detection kit (Takara Bio USA, Inc., Mountain View, CA, USA) was
used to determine the extent of cell leakage. Briefly, 100
µl of conditioned media was mixed with an equal volume of
the assay mixture (catalyst, dye, and reaction mixture). The
reaction mixtures were incubated at room temperature for 30 min in
the dark and stopped by adding 1/10 volume of 1 N HCl. End product
was measured by a microplate reader (Molecular Devices, LLC.,
Sunnyvale, CA, USA) with the absorbance at 450 and 690 nm.
Two-dimensional gel electrophoresis and
image analysis
The conditioned media were concentrated by an
Amicon® Ultra Centrifugal Filter Unit with 3 kDa MWCO
(Merck KGaA, Darmstadt, Germany). Then trace contaminants were
removed using a 2-D Clean-Up kit (GE Healthcare Life Sciences). The
sample was then resuspended in 2D lysis buffer containing 7 M urea,
2 M thiourea, 130 mM DTT, 4% CHAPS, 2% ampholine pH 3.0–10.0
Iso-Dalt (Servalyt), 30 µM Tris buffer, and cOmplete™ Mini
protease inhibitor cocktail (Roche Molecular Systems, Inc.,
Pleasanton, CA, USA) and incubated at room temperature for 30 min.
The protein concentration was determined using Bio-Rad protein
assay (Bio-Rad Laboratories, Hercules, CA, USA). Protein samples
(100 µg) were adjusted to 50 µl with 2D lysis buffer
and mixed with 75 µl of rehydration buffer containing 8 M
urea, 18 mM DTT, 2% CHAPS, and 2% Ipg buffer pH 3.0–10.0 NL (GE
Healthcare Life Sciences). The sample was left at room temperature
for another 30 min before applied to Ipg strips, 7 cm, pH 3.0–10.0
non-linear (GE Healthcare Life Sciences) for 16 h. The first
dimension separation was performed at 20°C with 50 µA per
strip with Ettan IPGphor 3 (GE Healthcare Life Sciences) according
to the manufacturer's instructions. The IPG strip was equilibrated
and separated by 12.5% SDS polyacrylamide gel electrophoresis
(SDS-PAGE) using a SE600 Ruby apparatus (GE Healthcare Life
Sciences) at a current of 25 mA per gel, as previously described
(21). The gel was stained using
Sypro® Ruby (Molecular Probes; Thermo Fisher Scientific,
Inc.) and scanned using an Ettan DIGE Imager (GE Healthcare Life
Sciences). The gel image was analyzed by ImageMaster 2D Platinum
7.0 software (GE Healthcare Life Sciences).
Protein identification by mass
spectrometry
The protein spots were excised and subjected for
in-gel digestion as described (10). The digested peptides were
identified by a nanoflow liquid chromatography system using a C18
Easy-nLC™ (75 µm id × 100 mm) column (Thermo Fisher
Scientific, Inc.) coupled with the amaZon speed ion trap mass
spectrometer (Bruker, Billerica, MA, USA). Protein identification
was interpreted using a MASCOT search engine (www.matrixscience.com) with the SwissProt database,
limited to Homo sapiens only, with default settings except
for the following parameters: 0.3 Da for peptide tolerance and
MS/MS tolerance; 1+, 2+, and 3+ for peptide charge; and ESI-TRAP
for Instrument.
Bioinformatics analysis
The STRING software version 9.1 (http://string-db.org/) was used to predict the
potential protein-protein interactions and the clusters of the
function were grouped. The proteins with 2-fold higher expression
in HFB in comparison to MNC with statistical difference (p<0.05)
were selected.
Validation of proteins by western
blotting
Protein samples (15 µg) were separated by
12.5% SDS-PAGE and transferred onto Immobilon-P membrane
(Millipore, Merck KGaA). The membrane was blocked with 0.1%
Tween-20 in Tris-buffer saline (TBS/T) containing 5% BSA for 1 h at
room temperature, followed by probing overnight at 4°C with
monoclonal antibodies against human neutrophil
gelatinase-associated lipocalin (NGAL) (1:200, Abcam Cambridge,
UK), L-plastin (LCP1) (1:400, Abcam), protein deglycase DJ-1 (DJ-1)
(1:2,000, Abcam), α-enolase (ENO1) (1:2,000, Abcam), topoisomerase
(TPI) (1:4,000, Abcam), proteasome subunit α type-3 (PSMA3)
(1:5,000, Cell Signaling Technology, Inc., Danvers, MA, USA),
proteasome subunit α type-6 (PSMA6) (1:5,000, Abcam), and
proteasome subunit β type-6 (PSMB6) (1:2,000, Abcam). The membrane
was incubated with the corresponding secondary antibodies (Dako;
Agilent Technologies, Santa Clara, CA, USA). Protein signal was
detected by a WesternBright ECL (Advansta, Inc., Menlo Park, CA,
USA) using an ImageQuant LAS 4000 mini digital imaging system (GE
Healthcare Life Sciences).
Depletion of high abundance plasma
proteins and western blot analysis
High abundance proteins were removed from human
plasma samples using the Pierce™ Top 2 Abundant Protein Depletion
Spin Columns (Thermo Fisher Scientific, Inc.) according to the
manufacturer's instructions. Briefly, 10 µl of each sample
was applied to the column and rotated gently end over end at room
temperature for 30 min. The columns were spun down at 1,000 × g for
2 min. The depleted samples were collected and then concentrated
using an Amicon Ultra-0.5 Centrifugal Filter, with 3 kDa MWCO
(Merck KGaA). Samples were centrifuged at 14,000 × g for 60 min at
4°C and the filtrate was discarded. The filter devices were then
placed upside down in a new tube and spun down at 1,000 × g for 2
min in order to collect the remaining concentrated sample. Total
protein concentrations of samples were determined by Bradford
protein assay (Bio-Rad Laboratories). Protein samples (20
µg) were separated and immunoblotted with an antibody
against PSMA3as described above.
Proteasome activity assay
Secreted proteins from each condition were
buffer-exchanged into 1X PBS using Bio-Spin 6 columns (Bio-Rad
Laboratories), followed by determination of proteasomal activity
using a Proteasome Activity Fluorometric assay kit (BioVision,
Inc., Milpitas, CA, USA) according to the manufacturer's
instructions. Briefly, 10 µg of each sample was adjusted to
50 µl with PBS, mixed with 50 µl of assay buffer, 1
µl of substrate, and 1 µl of inhibitor or assay
buffer. The reaction was monitored every 10 min using a
fluorescentmicroplate reader with the excitation at 350 nm and the
emission at 440 nm. The specific activity of proteasome was then
calculated as the difference of relative fluorescence units divided
time per micrograms of protein used.
Statistical analysis
The difference between mean values between groups
was analyzed by using one-way ANOVA with post hoc Tukey HSD
analysis. Values were considered statistically significant at
p<0.05.
Results
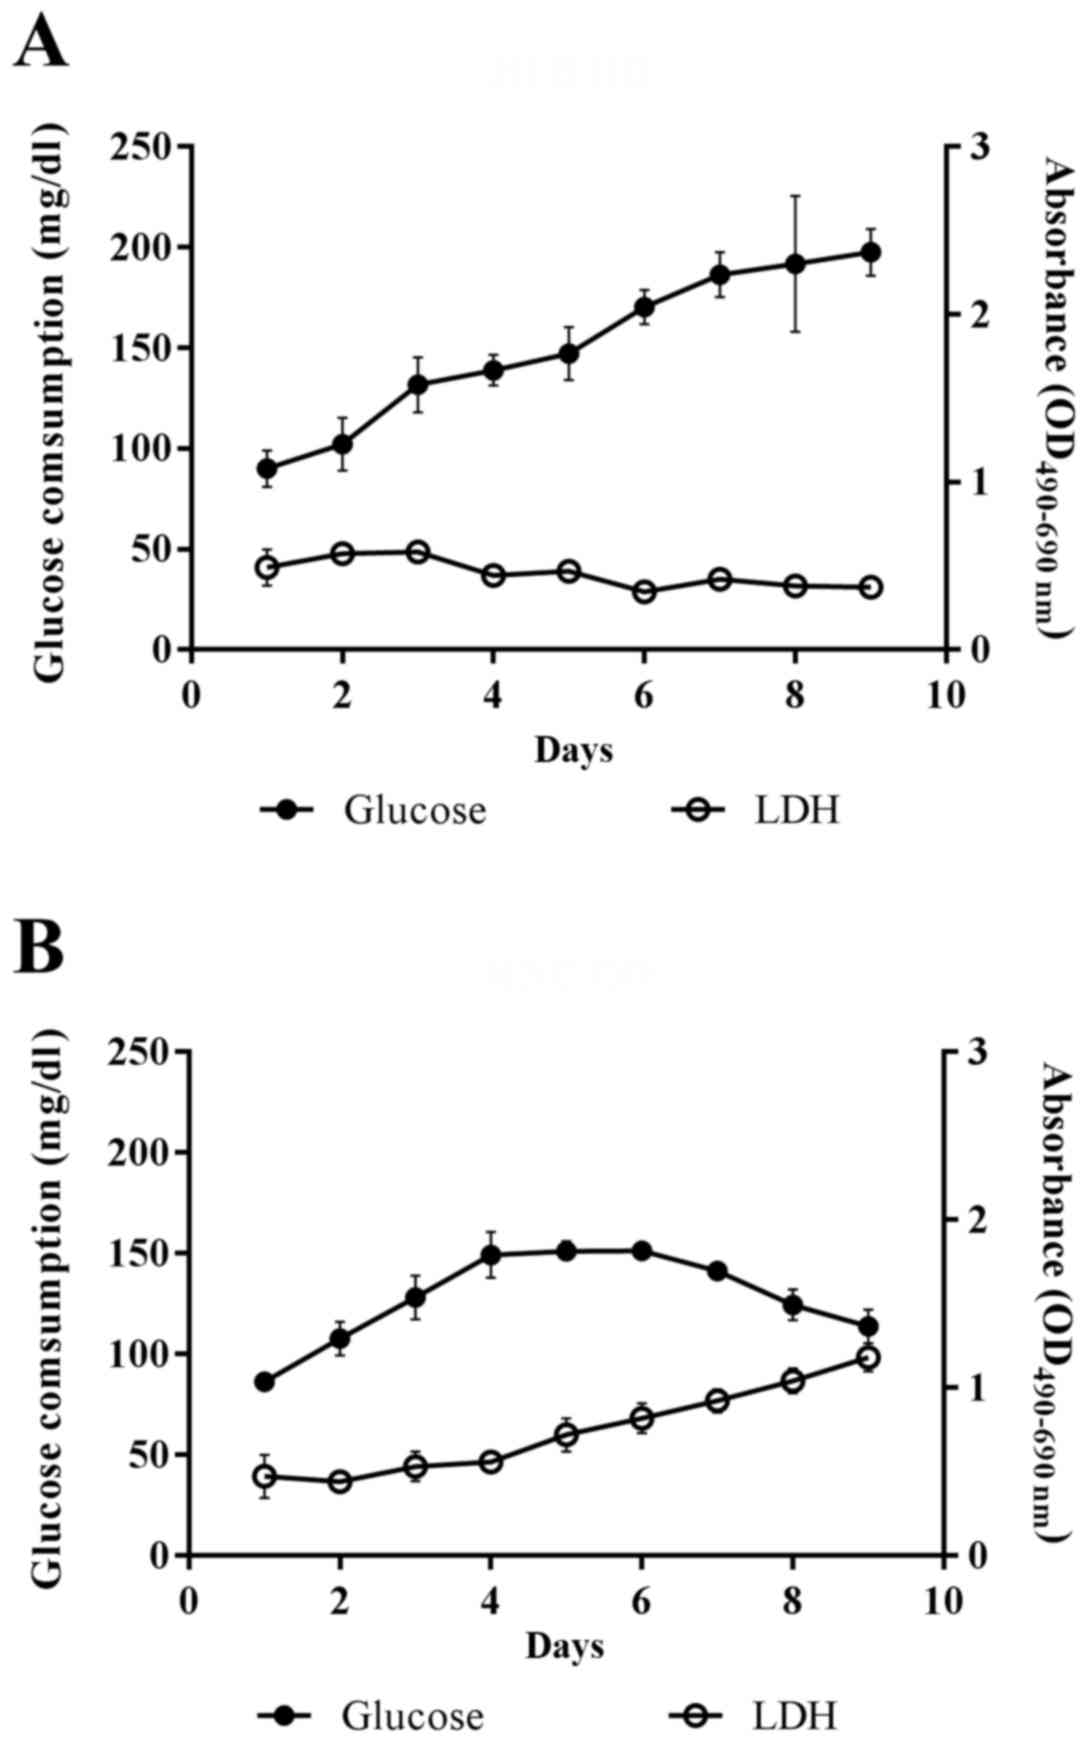
Cell viability in HFB and MNC
Since the viability of cells cultured in HFB could
not be directly determined, the glucose consumption and the
cellular release of lactate dehydrogenase were measured to observe
the cell growth and cellular cytotoxicity, respectively. Glucose
consumption of the cells grown in HFB was increased until the end
of the observation period at day 9, while cell leakage as detected
by lactate dehydrogenase release showed a slight decrease with the
observation period (Fig. 1A). On
the other hand, the glucose consumption of the cells cultured in
MNC increased continuously until day 4 before entering into a
stationary phase on day 5 and 6 and then decreasing afterwards,
while the lactate dehydrogenase release was stable during the first
4 days and increased from day 5 onwards (Fig. 1B). These results suggested that the
cells cultured in HFB were in good condition and kept growing
throughout the experiment, while the growth of cells in MNC was
limited to the first 5 days. Therefore, the conditioned media were
collected at day 4 for each experiment for further analysis.
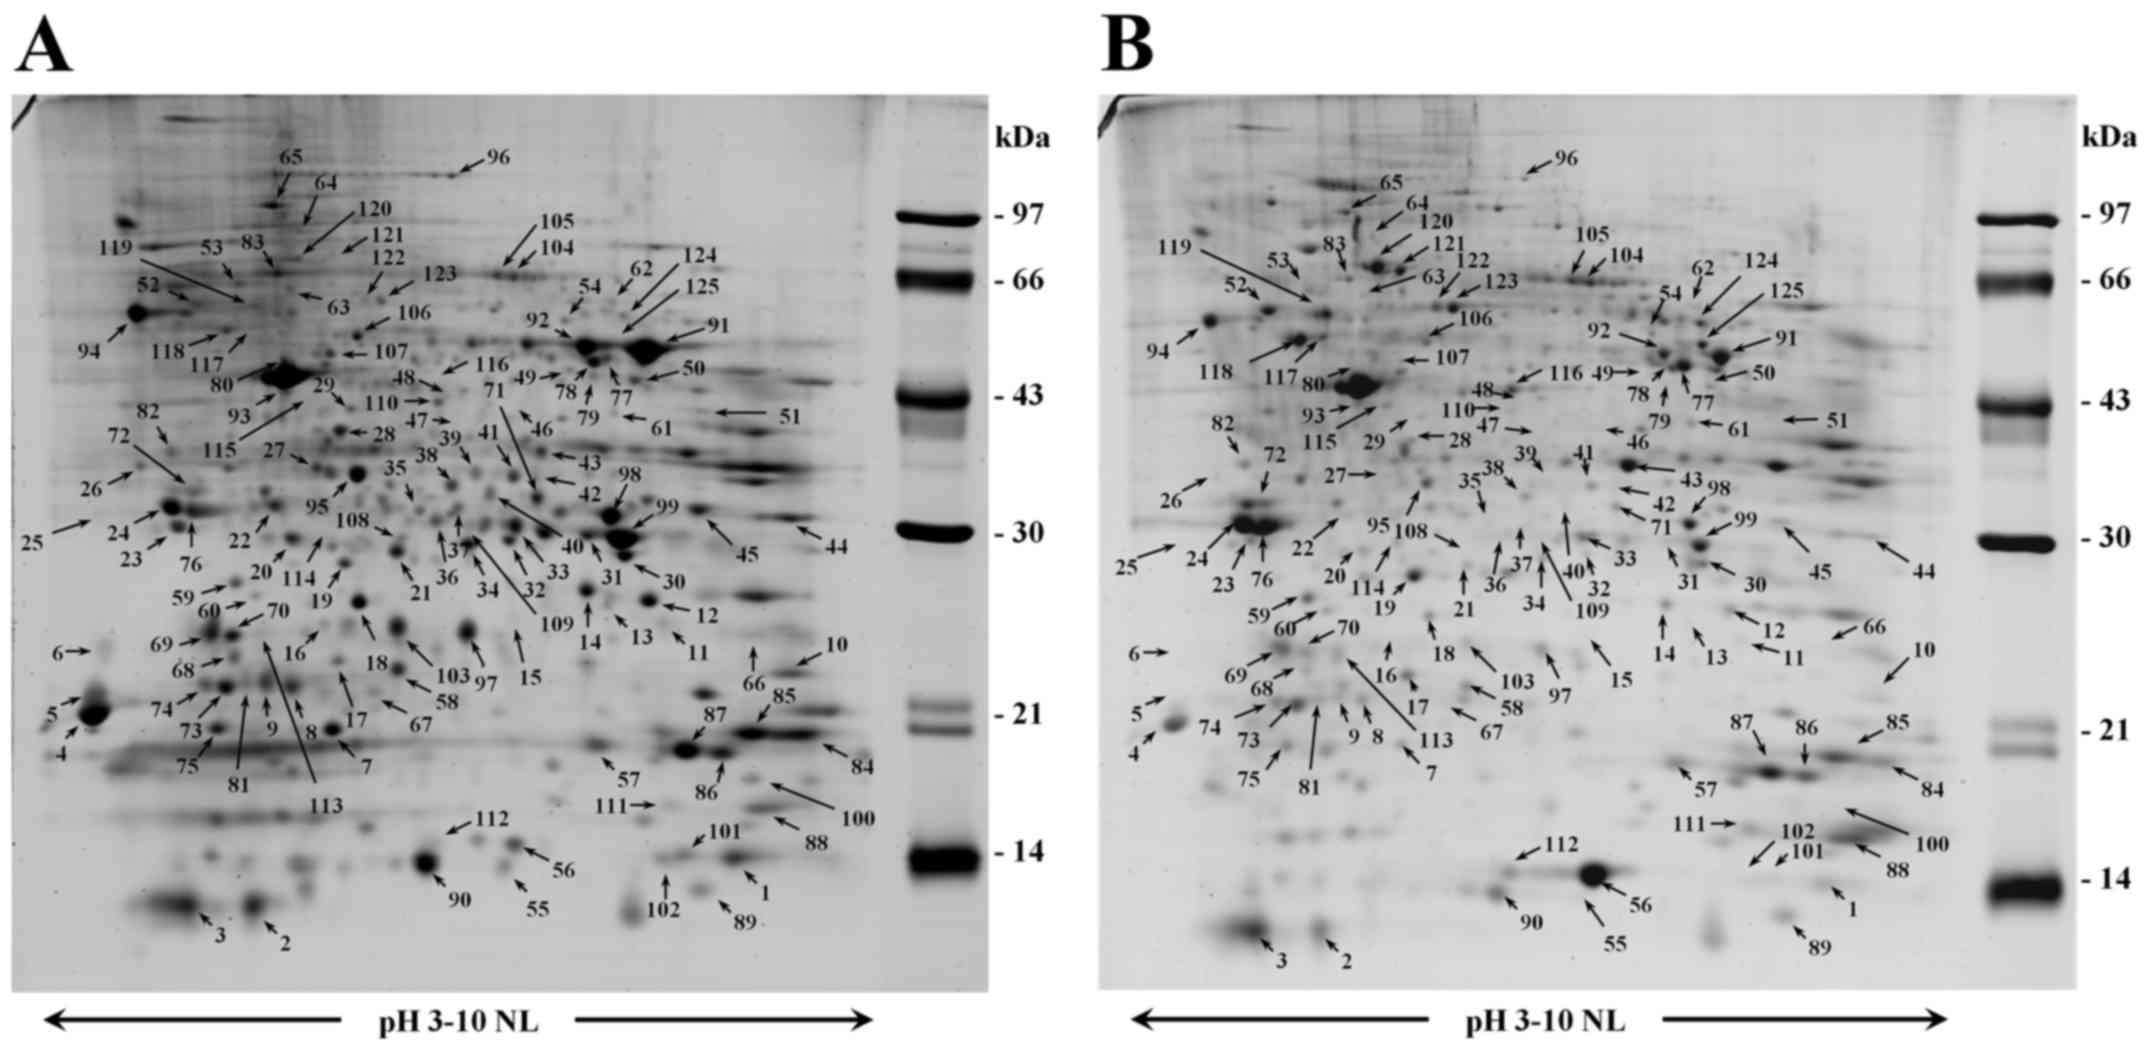
Comparison of the expression of CCA
secretomes between HFB and MNC systems
The conditioned media of cholangiocarcinoma cells
from HFB and MNC systems were collected separately and analyzed
using 2DE (Fig. 2). The
ImageMaster software version 7.0 was employed to analyze the
protein spots. The results showed that 1,003 spots were detected in
HFB, while 977 spots were found in MNC. Significantly different
expression of 138 protein spots were identified by LC/MS/MS.
Ninety-five secretory proteins in conditioned media of HFB culture
system showed a significant 2-fold increase as compared to those of
MNC system. These proteins could be mainly categorized into 6
groups according to their function namely cell cycle, cytoskeleton
structure, immune system, metabolic pathway, signaling transduction
and ubiquitin-proteasome pathway (Table II). Among these proteins,
neutrophil gelatinase-associated lipocalin (NGAL or lipocalin-2)
(spot no. 6), pterin-4-α-carbinolamine dehydratase (spot no. 55),
proteasome subunit β type-7 (spot no. 108) and triose phosphate
isomerase (spot no. 109) were expressed only in conditioned media
of HFB system. Eight interesting proteins showed increased
expression by >10-fold, while 27 proteins were expressed between
5- and 10-fold higher and 20 proteins were expressed between 2- and
5-fold higher. NGAL or lipocalin-2 (spot nos. 11 and 66) were found
to show the greatest increase in expression by 19.93-fold and
18.79-fold, and 2 more spots also belong to the same protein (spot
nos. 6 and 15) at different pI. Ferritin light chain, ferritin
heavy chain, proteasome subunit α type-3, Annexin A3, triose
phosphate isomerase and mitochondrial enoyl-CoA Δ isomerase 1
showed >10-fold higher expression. Proteins with 5-10-fold
increased expression include macrophage migration inhibitory
factor, calmodulin, 60S ribosomal protein L12, proteasome subunit β
type-5, superoxide dismutase (Mn), proteasome subunit β type-1,
proteasome subunit β type-7, NGAL, proteasome subunit β type-4,
NAD(P)H-hydrate epimerase, proteasome subunit β type-7, proteasome
subunit α type-5, complement component 1 Q,
N(G),N(G)-dimethylarginine dimethylaminohydrolase 1. Interestingly,
the expression levels of all 20S proteasome subunits including
proteasome subunit α type-1 to type-7 and β type-1 to type-7 were
all increased in HFB compared to those in the MNC, with the-fold
changes ranging between 2.92 and 12.13 (except for spot no. 108
which was only present in the HFB).
| Table IIIdentification of upregulated
secretory proteins from HFB culture system by LC-MS/MS. |
Table II
Identification of upregulated
secretory proteins from HFB culture system by LC-MS/MS.
| Spot no. | Accession no. | Protein
description | Score | Peptide match | MW/pI | Fold changea |
|---|
| Cell cycle | | | | | | |
| 72 | Q7M4R4 | 14-3-3 protein
ε | 119 | 12 | 29.3/4.64 | 2.75 |
| 72 | Q7M4R4 | 14-3-3 protein
ε | 119 | 12 | 29.3/4.64 |
| 72 | Q7M4R4 | 14-3-3 protein
ε | 119 | 12 | 29.3/4.64 |
| 72 | Q7M4R4 | 14-3-3 protein
ε | 119 | 12 | 29.3/4.64 |
| 72 | Q7M4R4 | 14-3-3 protein
ε | 119 | 12 | 29.3/4.64 |
| 72 | Q7M4R4 | 14-3-3 protein
ε | 119 | 12 | 29.3/4.64 |
| 72 | Q7M4R4 | 14-3-3 protein
ε | 119 | 12 | 29.3/4.64 |
| Cytoskeleton
structure | | | | | | |
| 27 | Q9HC38 | Glyoxalase
domain-containing protein 4 | 79 | 2 | 35.2/5.40 | 14.24 |
| 35 | Q5TCJ2 | Prelamin-A/C | 82 | 2 | 74.4/6.57 | 2.00 |
| 72 | Q9UCS3 | Tropomyosin α-4
chain | 100 | 4 | 29.3/4.63 | 2.75 |
| Q5VU72 | Tropomyosin α-3
chain | 98 | 5 | 28.6/4.67 | 2.75 |
| P07951 | Tropomyosin β
chain | 75 | 2 | 33.0/4.68 | 2.75 |
| Q6DV90 | Tropomyosin α-1
chain | 67 | 3 | 33.0/4.66 | 2.75 |
| 83 | P13796 | Plastin-2 | 794 | 17 | 70.8/5.29 | 4.46 |
| P60709 | Actin, cytoplasmic
1 | 86 | 2 | 42.1/5.29 | 4.46 |
| 84 | P23528 | Cofilin-1b | – | – | 18.5/8.22 | 4.68 |
| 85 | P23528 | Cofilin-1b | – | – | 18.5/8.22 | 2.10 |
| 96 | P18206 | Vinculin | 683 | 25 | 124.3/5.50 | 4.87 |
| 101 | P07737 | Profilin-1b | – | – | 15.05/8.44 | 11.76 |
| Immune system | | | | | | |
| 6 | Q92683 | Neutrophil
gelatinase-associated lipocalin | 81 | 1 | 22.7/9.02 | INF |
| 11 | Q92683 | Neutrophil
gelatinase-associated lipocalin | 77 | 1 | 22.7/9.02 | 18.79 |
| 15 | Q92683 | Neutrophil
gelatinase-associated lipocalin | 71 | 1 | 22.7/9.02 | 6.36 |
| 26 | Q07021 | Complement
component 1 Q | 148 | 2 | 31.7/4.74 | 7.11 |
| 66 | Q92683 | Neutrophil
gelatinase-associated lipocalin | 124 | 4 | 22.7/9.02 | 19.93 |
| 72 | P04083 | Annexin A1 | 61 | 2 | 32.7/4.69 | 2.75 |
| Metabolic
pathway | | | | | | |
| 1 | P14174 | Macrophage
migration inhibitory factor | 116 | 3 | 12.6/7.74 | 7.69 |
| 20 | Q8NCW5 | NAD(P)H-hydrate
epimerase | 92 | 2 | 32.0/7.56 | 7.94 |
| 26 | P40925 | Malate
dehydrogenase, cytoplasmic | 63 | 1 | 36.6/6.91 | 7.11 |
| 28 | O94760 |
N(G),N(G)-dimethylarginine
dimethylaminohydrolase 1 | 283 | 6 | 31.4/5.53 | 7.54 |
| P07195 | L-lactate
dehydrogenase B chain | 53 | 1 | 36.9/5.71 | 7.54 |
| 29 | O95861 |
3′(2′),5′-bisphosphate nucleotidase 1 | 172 | 2 | 33.7/5.46 | 6.26 |
| 31 | P60174 | Triosephosphate
isomerase | 306 | 6 | 31.1/5.65 | 14.04 |
| 32 | P00492 |
Hypoxanthine-guanine
phosphoribosyltransferase | 195 | 4 | 24.8/6.21 | 7.93 |
| 37 | P42126 | Enoyl-CoA Δ
isomerase 1, mitochondrial | 177 | 3 | 33.1/8.8 | 13.34 |
| 38 | P78417 | Glutathione
S-transferase ω-1 | 166 | 5 | 27.8/6.23 | 3.70 |
| 40 | P00491 | Purine nucleoside
phosphorylase | 50 | 1 | 32.3/6.45 | 8.75 |
| 46 | P09972 |
Fructose-bisphosphate aldolase C | 90 | 2 | 39.8/6.41 | 7.78 |
| 49 | P16930 |
Fumarylacetoacetase | 131 | 4 | 46.7/6.46 | 6.92 |
| 50 | P17174 | Aspartate
aminotransferase, cytoplasmic | 58 | 1 | 46.4/6.52 | 6.82 |
| 50 | Q9Y617 | Phosphoserine
aminotransferase | 66 | 1 | 40.8/7.56 | 6.82 |
| 54 | P28838 | Cytosol
aminopeptidase | 246 | 3 | 56.5/8.03 | 6.33 |
| 55 | P61457 |
Pterin-4-α-carbinolamine dehydratase | 53 | 1 | 12.0/6.28 | INF |
| 58 | P15531 | Nucleoside
diphosphate kinase A | 80 | 2 | 17.3/5.83 | 3.96 |
| 62 | P09622 | Dihydrolipoyl
dehydrogenase, mitochondrial | 303 | 5 | 54.7/7.95 | 5.61 |
| 67 | Q6NR85 | Superoxide
dismutase (Cu-Zn) | 71 | 1 | 16.2/5.7 | 9.04 |
| 68 | O75223 |
γ-glutamylcyclotransferase | 139 | 3 | 21.2/5.07 | 3.07 |
| 69 | Q04760 | Lactoylglutathione
lyase | 54 | 1 | 21.0/5.12 | 2.92 |
| 70 | Q04760 | Lactoylglutathione
lyase | 93 | 5 | 21.0/5.12 | 3.53 |
| 71 | P00491 | Purine nucleoside
phosphorylase | 234 | 5 | 32.3/6.45 | 7.29 |
| 78 | O75874 | Isocitrate
dehydrogenase (NADp), cytoplasmic | 206 | 5 | 46.9/6.53 | 5.92 |
| P48735 | Isocitrate
dehydrogenase (NADp), mitochondrial | 78 | 3 | 51.3/8.88 | 5.92 |
| P06733 | α-enolase | 72 | 1 | 47.5/7.01 | 5.92 |
| 79 | P17174 | Aspartate
aminotransferase, cytoplasmic | 288 | 9 | 46.4/6.52 | 9.76 |
| 83 | P29401 | Transketolase | 64 | 2 | 68.5/7.58 | 4.46 |
| 91 | P06733 | α-enolaseb | – | – | 47.5/7.01 | 7.73 |
| 92 | P06733 | α-enolaseb | – | – | 47.5/7.01 | 7.07 |
| 98 | P60174 | Triosephosphate
isomeraseb | – | – | 31.1/5.65 | 6.18 |
| 99 | P18669 | Phosphoglycerate
mutase 1b | – | – | 28.8/6.67 | 11.46 |
| 106 | P48637 | Glutathione
synthetase | 504 | 10 | 52.5/5.67 | 5.01 |
| 107 | Q9Y2T3 | Guanine
deaminase | 467 | 8 | 51.5/5.44 | 8.47 |
| 109 | P60174 | Triosephosphate
isomerase | 411 | 7 | 31.1/5.65 | INF |
| 110 | P06733 | α-enolase | 277 | 7 | 47.5/7.01 | INF |
| 90 | P31949 | Protein
S100-A11 | 148 | 3 | 11.8/6.56 | 2.49 |
| 101 | P04080 | Cystatin-Bb | – | – | 11.13/6.96 | 11.76 |
| 102 | P04080 | Cystatin-Bb | – | – | 11.13/6.96 | 10.08 |
| Peroxisome | | | | | | |
| 12 | Q5TCM1 | Superoxide
dismutase (Mn), mitochondrial | 83 | 3 | 24.9/8.35 | 5.97 |
| 13 | Q5TCM1 | Superoxide
dismutase (Mn), mitochondrial | 77 | 3 | 24.9/8.35 | 6.55 |
| 14 | Q5TCM1 | Superoxide
dismutase (Mn), mitochondrial | 53 | 1 | 24.9/8.35 | 8.50 |
| 39 | Q13011 | Δ(3,5)-Δ(2,4)-dienoyl-CoA isomerase,
mitochondrial | 140 | 2 | 36.1/8.16 | 4.97 |
| 42 | Q13011 | Δ(3,5)-Δ(2,4)-dienoyl-CoA isomerase,
mitochondrial | 181 | 2 | 36.1/8.16 | 7.67 |
| Signal
transduction | | | | | | |
| 2 | P06703 | Protein
S100-A6 | 76 | 2 | 10.2/5.53 | 3.25 |
| 3 | P06703 | Protein
S100-A6 | 75 | 2 | 11.3/4.68 | 2.62 |
| P29034 | Protein
S100-A2 | 58 | 2 | 11.3/4.68 | 2.62 |
| 4 | Q96HK3 | Calmodulin | 54 | 1 | 16.8/4.09 | 4.10 |
| 5 | Q96HK3 | Calmodulin | 53 | 1 | 16.8/4.09 | 6.19 |
| 12 | p43487 | Ran-specific
gTpase-activating protein | 63 | 1 | 23.5/5.19 | 5.97 |
| 26 | P07355 | Annexin A2 | 53 | 1 | 38.8/7.57 | 7.11 |
| 27 | P12429 | Annexin A3 | 91 | 2 | 36.5/5.63 | 14.24 |
| 95 | P12429 | Annexin A3b | – | – | 36.6/5.76 | 3.62 |
| 89 | P60903 | Protein
S100-A10b | – | – | 11.2/6.82 | 3.65 |
| 97 | P04792 | Heat shock protein
β-1b | – | – | 22.8/5.98 | 5.71 |
| 106 | P07339 | Cathepsin D | 113 | 3 | 45.0/6.10 | 5.01 |
|
Ubiquitin-proteasome pathway | | | | | | |
| 10 | P28074 | Proteasome subunit
β type-5 | 146 | 4 | 28.6/6.43 | 7.07 |
| 12 | P20618 | Proteasome subunit
β type-1 | 71 | 1 | 26.7/8.27 | 5.97 |
| 13 | P49721 | Proteasome subunit
β type-2 | 51 | 1 | 23.0/6.51 | 6.55 |
| 14 | P49721 | Proteasome subunit
β type-2 | 329 | 8 | 23.0/6.51 | 8.50 |
| Q99436 | Proteasome subunit
β type-7 | 70 | 1 | 30.3/7.57 | 8.50 |
| P20618 | Proteasome subunit
β type-1 | 68 | 1 | 26.7/8.27 | 8.50 |
| 18 | P28070 | Proteasome subunit
β type-4 | 231 | 3 | 29.2/5.72 | 7.22 |
| 21 | Q99436 | Proteasome subunit
β type-7 | 108 | 3 | 30.3/7.57 | 8.61 |
| 22 | P25788 | Proteasome subunit
α type-3 | 149 | 2 | 28.6/5.19 | 12.13 |
| 23 | P28066 | Proteasome subunit
α type-5 | 324 | 8 | 26.6/4.74 | 5.27 |
| 30 | P25787 | Proteasome subunit
α type-2 | 109 | 2 | 26.0/6.92 | 4.91 |
| 33 | P60900 | Proteasome subunit
α type-6 | 91 | 2 | 27.8/6.34 | 3.08 |
| 34 | P49720 | Proteasome subunit
β type-3 | 150 | 2 | 23.2/6.14 | 8.54 |
| 36 | P60900 | Proteasome subunit
α type-6 | 110 | 3 | 27.8/6.34 | 7.65 |
| 39 | P25786 | Proteasome subunit
α type-1 | 159 | 3 | 29.8/6.15 | 4.97 |
| 41 | P25786 | Proteasome subunit
α type-1 | 119 | 4 | 29.8/6.15 | 5.66 |
| 44 | O14818 | Proteasome subunit
α type-7 | 201 | 3 | 28.0/8.60 | 7.36 |
| 45 | P25789 | Proteasome subunit
α type-4 | 194 | 4 | 29.8/7.57 | 6.33 |
| 65 | P55072 | Transitional
endoplasmic reticulum ATPase | 236 | 5 | 90.0/5.14 | 4.16 |
| 69 | P28072 | Proteasome subunit
β type-6 | 131 | 2 | 25.6/4.80 | 2.92 |
| 101 | P05161 | Ubiquitin-like
protein ISG15 | 346 | 7 | 17.88/8.64 | 11.76 |
| 108 | Q99436 | Proteasome subunit
β type-7 | 164 | 3 | 30.3/7.57 | INF |
| Others | | | | | | |
| 4 | P37108 | Signal recognition
particle 14 kDa protein | 54 | 2 | 14.7/10.05 | 4.10 |
| 5 | P30050 | 60S ribosomal
protein L12 | 63 | 2 | 18.0/9.4 | 6.19 |
| 7 | Q9BTZ8 | Ferritin light
chain | 84 | 2 | 20.1/5.51 | 10.74 |
| 8 | P02794 | Ferritin heavy
chain | 102 | 2 | 21.4/5.30 | 9.13 |
| Q8NBP7 | Proprotein
convertase subtilisin/kexin type 9 | 52 | 1 | 75.7/6.14 | 9.13 |
| 9 | P02794 | Ferritin heavy
chain | 119 | 7 | 21.4/5.30 | 1.50 |
| 16 | Q99497 | Protein deglycase
DJ-1 | 51 | 2 | 20.0/6.33 | 3.85 |
| 48 | Q9UC56 | Stress-70 protein,
mitochondrial | 163 | 3 | 73.9/5.87 | 8.72 |
| 64 | P13798 |
Acylamino-acid-releasing enzyme | 67 | 1 | 82.1/5.29 | 3.81 |
| 75 | O75340 | Programmed cell
death protein 6 | 120 | 4 | 21.9/5.16 | 2.11 |
| 81 | P02794 | Ferritin heavy
chain | 59 | 2 | 21.4/5.30 | 2.44 |
| 83 | P02768 | Serum albumin | 277 | 8 | 71.3/5.92 | 4.46 |
| 94 | P27797 |
Calreticulinb | – | – | 48.1/4.29 | 5.46 |
| 96 | P00738 | Haptoglobin | 50 | 3 | 45.9/6.13 | 4.87 |
| 100 | Q04837 | Single-stranded
DNA-binding protein, mitochondrial | 179 | 4 | 17.2/9.59 | 4.83 |
| 102 | O60739 | Eukaryotic
translation initiation factor 1bb | – | – | 12.82/6.82 | 10.08 |
| 103 | Q99497 | Protein deglycase
DJ-1 | 265 | 7 | 20.1/6.33 | 10.69 |
| 107 | P68871 | Hemoglobin subunit
β | 137 | 4 | 16.1/6.75 | 8.47 |
| 108 | P16083 |
Ribosyldihydronicotinamide dehydrogenase
(quinone) | 103 | 2 | 26.1/5.88 | INF |
Protein-protein interaction prediction of
the proteins from HFB system compared to MNC system
The potential protein interactions were predicted by
a bioinformatics program (STRING). The analysis was performed on 95
proteins with 2-fold higher expression in the HFB system when
compared to those in the MNC system. Upregulated proteins were
selected for this analysis because they should be more suitable as
for potential biomarkers (22).
The upregulated proteins could form at least three clusters of the
interaction networks as shown in Fig.
3. The first cluster (purple background) belongs to the 20S
proteasome subunits including proteasome subunit α type-1 to type-7
(PSMA1-7) and β type-1 to type-7 (PSMB1-7) which, according to the
KEGG pathway (23), is involved in
the regulation of various functions. The proteins associated in
cell cycle pathway are the 14-3-3 protein family including 14-3-3
protein ε (YWHAE), 14-3-3 protein σ (SFN), 14-3-3 protein β/α
(YWHAB), 14-3-3 protein γ (YWHAG), 14-3-3 protein η (YWHAH), 14-3-3
protein θ (YWHAQ) are shown in the second cluster (red background).
The third cluster (green background) are proteins involved in
metabolism including glycolysis/gluconeogenesis, citrate cycle (TCA
cycle), pyruvate metabolism, 2-oxocarboxylic acid metabolism,
cysteine and methionine metabolism, tyrosine metabolism, glycine,
serine and threonine metabolism, and phenylalanine metabolism.
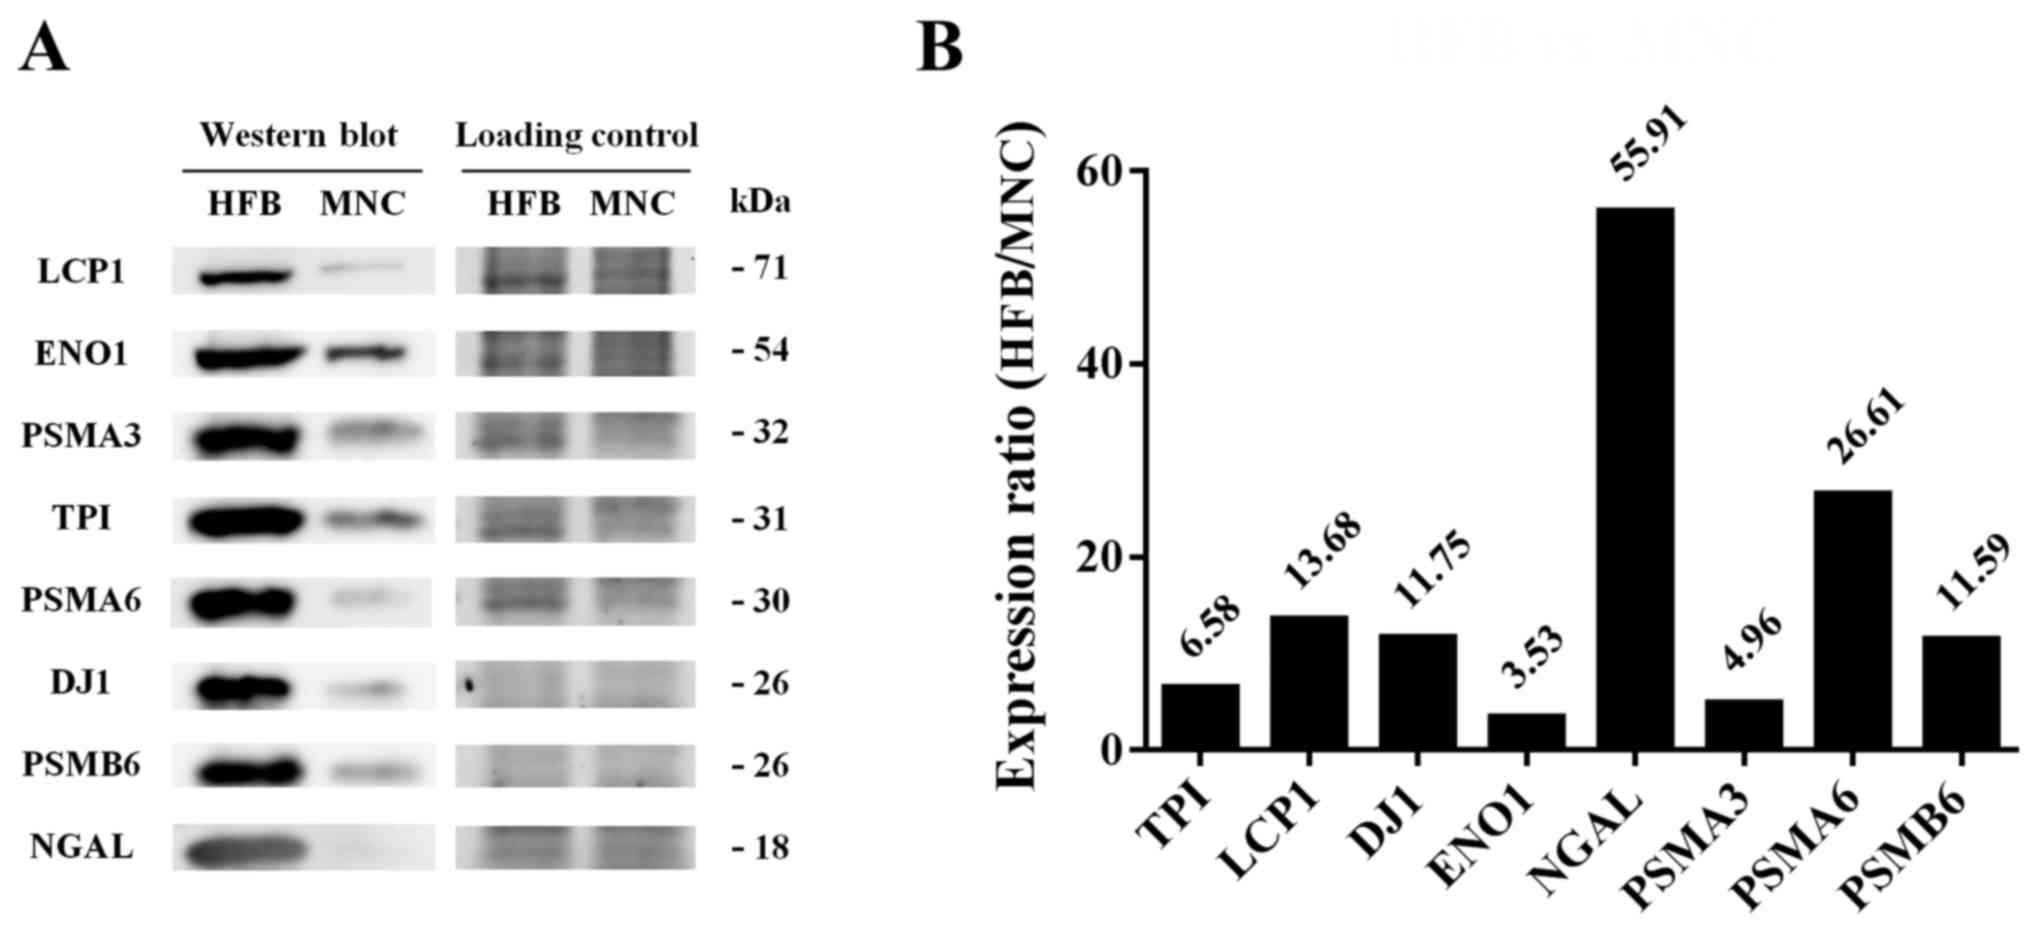
Validation of identified proteins by
western blotting
According to the results from 2DE and prediction of
protein-protein interactions, 95 secretory proteins from HFB system
were significantly increased and can be clustered as a functional
relationship into 3 groups as compared with MNC system.
Immunodetection was further used to validate some distinct secreted
proteins that may be useful for cancer biomarker study including
NGAL, PSMA6, PSMB6, PSMA3, LCP1, DJ-1, TPI, and ENO1 as shown in
Fig. 4. In agreement with 2DE
results, western blot analyses revealed that the expression levels
of these proteins were significantly increased in the HFB system
compared to those in the MNC system. Interestingly, among of these
secreted proteins, only 20S proteasome has never been proposed as a
potential biomarker for early detection in cholangiocarcinoma.
Proteasome activity assay
Proteasomes function mainly inside the cells,
therefore, we next studied whether the identified 20S proteasome
subunits present in the extracellular compartment had active
functions. The activity of the 20S proteasome was therefore studied
in conditioned media from both HFB and MNC systems. Cumulative
fluorescent signals from the proteasomal-related proteolytic
activity were detected in conditioned media from both HFB and MNC
systems (Fig. 5A). This indicated
the 20S proteasome subunits secreted from cells were still active
in function. Consistent with the immunodetection results, higher
proteasome activity was observed in conditioned media of HFB system
in comparison to that of MNC system. Proteasomal specific activity
of HFB and MNC samples were 38.63 and 17.22 U/µg,
respectively (Fig. 5A). In
addition, the proteasome activities were also investigated in the
conditioned media from HuCCA-1 and HCC-S102, with the result that
the proteasome activity of HuCCA-1 secretome was higher than that
of HCC-S102 secretome (42.63 and 30.78 U/µg, respectively)
(Fig. 5B).
Confirmation of proteasome subunit α
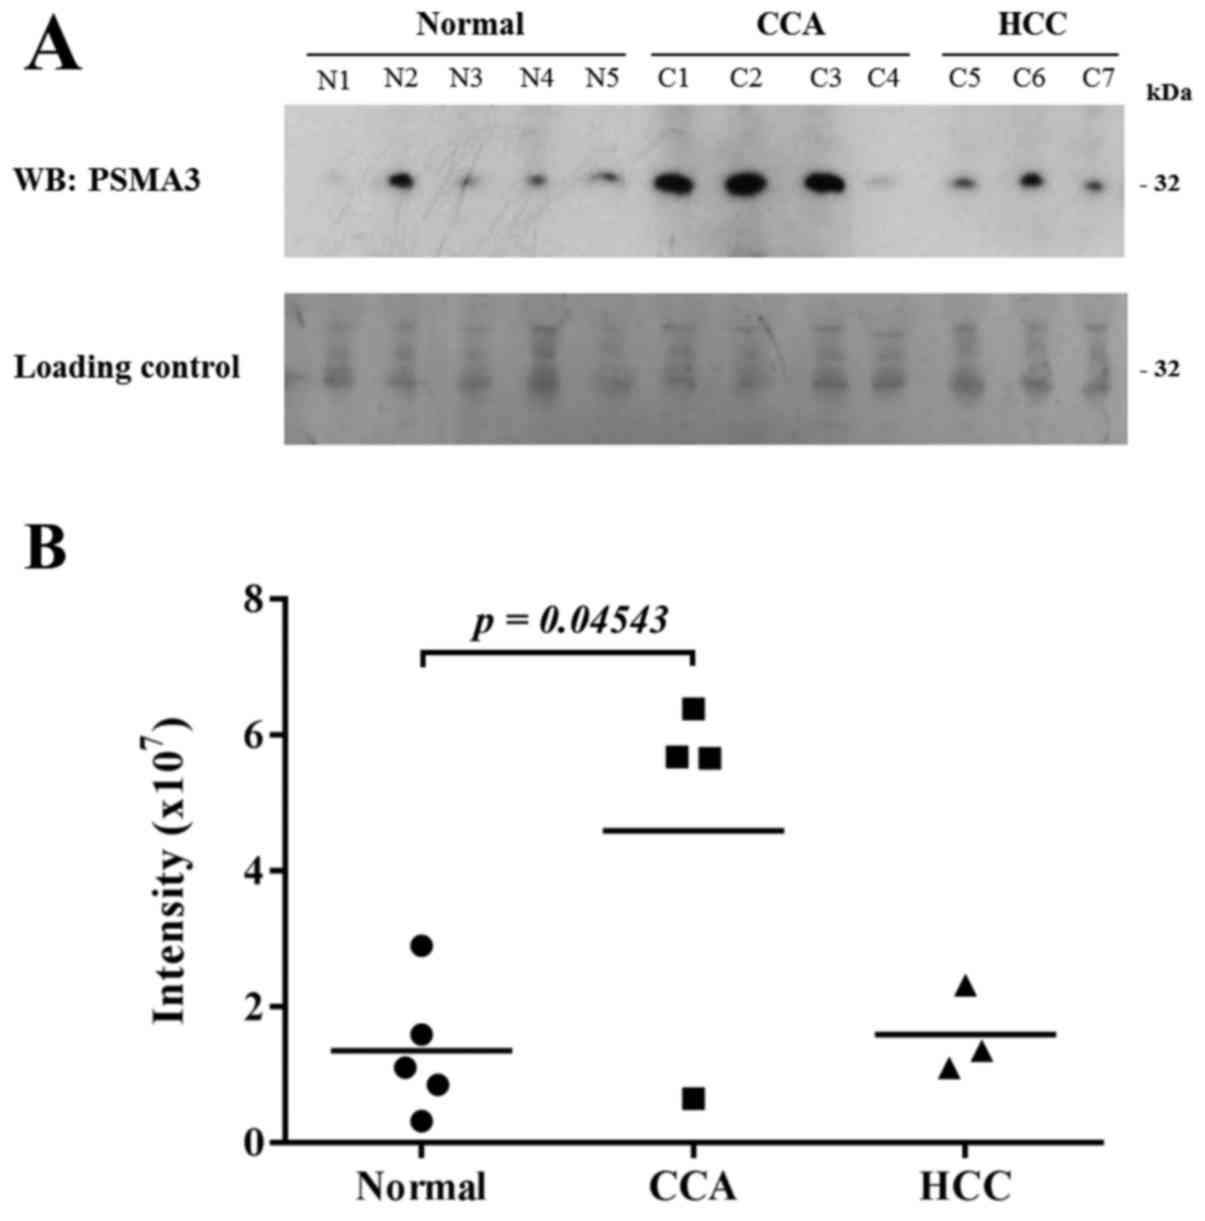
type-3 on cholangiocarcinoma plasma samples
To validate 20S proteasome as potential biomarker
for CCA, the level of plasma PSMA3 was measured using western blot
analysis in normal donor (n=5), in CCA patients with stage I (n=1),
stage III (n=2), stage IV (n=1), in HCC patients with stage I (n=1)
and stage III (n=2). To enrich low-abundance proteins, human plasma
albumin and IgG was removed prior to immunodetection. PSMA3 were
detected in blood plasma from normal subjects, CCA and HCC patients
(Fig. 6A). Interestingly, plasma
PSMA3 of CCA patients were significantly increased as compared to
normal subjects. The levels of PSMA3 were obviously increased in
the plasma of CCA patients as compared to HCC patients (Fig. 6B). Moreover, the levels of plasma
PSMA3 were significantly elevated in cancer patients with stage III
and IV compared to normal subjects (Fig. 6B).
Discussion
The secretome is a useful source to identify novel
circulating biomarkers in blood secreted from cancer cells. The
main challenges in secretomic analysis are the complexity of sample
preparation, serum proteins and importantly cell lysate
contamination. In this study, we have developed the hollow fiber
bioreactor system for 3-D culture of cholangiocarcinoma cells by
using a 5-kDa MWCO instead of a 20-kDa MWCO cartridge. In agreement
with our previous study (12), the
HFB culture system (5 kDa MWCO cartridge) also provides enrichment
of low-abundance secretory proteins by reducing the level of
cellular protein contamination. The protein expression from HFB
system was compared to that from the monolayer system. The most
highly expressed protein was NGAL or lipocalin-2, which was
previously reported by us (10).
NGAL is a secreted protein, a member of the lipocalin superfamily
involved in various functions, such as a factor in the innate
immune system, transport of hydrophobic substances, iron delivery
and apoptosis-dependent deprivation of trophic factor. It was also
reported to be a potential biomarker for many cancers, such as
pancreatic, ovarian and colorectal cancer (24–26).
We also reported the possibility of using NGAL as a potential
biomarker for cholangiocarcinoma by immunoblotting of the tissues
from cancer patients. We have also used western blot analysis to
validate the NGAL from conditioned media and to confirm its
presence in plasma of cancer patients (unpublished data). Our
result corresponds to a recent report on lipocalin-2 as a potential
biomarker for CCA (27).
The number of proteins associated with metabolic
pathways, especially TPI and ENO1, was also increased in
conditioned media from HFB culture system in comparison with that
from the MNC system. TPI is a glycolytic enzyme that catalyzes the
reversible conversion of dihydroxyacetone phosphate (DHAP) into
D-glyceraldehyde 3-phosphate (G3P), which maintains the equilibrium
between these two triose phosphates (28). Upregulation of TPI have been found
in metastatic tissues of various cancers, such as breast cancer
(29), brain metastases from
endometrial and ovarian cancer (30). Another elevated secretory
glycolytic enzyme in the HFB culture system is ENO1 that converts
2-phosphoglycerate (2-PG) to phosphoenolpyruvate (PEP) in the
glycolysis pathway (31). Growing
evidence suggests that, apart from its majority role in glycolysis,
ENO1 can also function as an oncogenic protein by promoting the
proliferation, invasion and metastasis of tumor cells (32–35).
Therefore, the expression of ENO1 is frequently increased in
diverse tumors (36) including CCA
(37).
Additionally, the levels of secretory 14-3-3 protein
were significantly increased in the HFB system compared to the MNC
system. The 14-3-3 protein is an intracellular
phosphoserine/threonine binding protein that is involved in many
biological processes including cell cycle regulation, protein
trafficking, metabolic regulation, cell proliferation, and
apoptosis. Not surprisingly, significant roles of 14-3-3 have also
been found in various cancer types including CCA (38). In colorectal carcinoma, 14-3-3σ
expression is reported to be increased during carcinoma
progression. Moreover, the overexpression of 14-3-3σ is associated
with significantly reduced survival duration in these patients
(39). Increasing number of
studies suggest that 14-3-3 play a critical role during cancer
metastasis in HCC (40). We
recently reported the upregulation of 14-3-3σ protein that plays an
important role in anoikis resistance of human CCA cells (41). In addition, the secretory 14-3-3σ
protein in the conditioned media of 3D culture systems is
significantly increased compared to those of MNC culture system
(11,12).
A major finding using the 5-kDa MWCO cartridge with
the HFB system was the expression of the 20S proteasome, a
catalytic portion of 26S proteasome (13), including proteasome subunit α
type-1 to type-7 and β type-1 to type-7. The proteasome activity
results indicated that all of these subunits were secreted and
still active. The 20S proteasome plays important roles in
degradation of proteins that no longer are needed, or fail to fold
correctly (42). Accumulating
evidence suggests that increase of proteasome activity and the high
expression of proteasome subunits can be observed in various types
of cancer (14–16). A high concentration of
extracellular proteasome was also found in blood plasma of several
cancer patients (18,43,44).
Cell damage and hemolysis are considered as the major sources of
the elevated extracellular proteasome (17). However, our LDH release results
with the HFB system would suggest that cell damage might not be a
major source of extracellular 20S proteasome. In addition, the
level of circulating 20S proteasome subunits in serum may be
related to the stage of malignancy. Thus, Stoebner et al
reported that the proteasome level was increased by up to 4.5 times
in serum of patients with metastatic malignant melanoma (stage III
and IV) compared to the control group, while proteasome levels in
stage I and II patients were not significantly different from
healthy subjects (18). In
agreement with this, our results showed that the levels of PSMA3
were significantly increased in the plasma of CCA patients at
advanced stage as compared to healthy subjects. Moreover, plasma
PSMA3 levels were significantly elevated in CCA patients in
comparison with HCC patients.
In conclusion, we have demonstrated that the HFB
culture system provides improved enrichment of the low-abundance
secreted proteins from CCA cells, compared to conventional
monolayer culture, and reduces the cellular protein contamination.
This enrichment of low-abundance secreted proteins opens up the
discovery of a novel biomarker PSMA3 for CCA. Elevated levels of
plasma PSMA3 were detected in patients with metastatic cancer,
especially at advanced stage, as compared to healthy subjects.
Moreover, PSMA3 was found at high levels in plasma of CCA patients,
as compared to normal subjects and HCC patients. These finding
indicated that plasma PSMA3 might represent a novel biomarker for
CCA.
Acknowledgments
This study was supported by the Chulabhorn Research
Institute (grant no. BC 2008-02). We would like to thank Dr Vichien
Chaousrikul for his work on histopathologic diagnosis of
cholangiocarcinoma, and Mr. Thongsuk Pobboon, Ms. Nittaya
Therawattanakul and Ms. Sirimon Damri for their technical
assistance.
References
|
1
|
Ghouri YA, Mian I and Blechacz B: Cancer
review: Cholangiocarcinoma. J Carcinog. 14:12015. View Article : Google Scholar : PubMed/NCBI
|
|
2
|
Sonakul D, Koompirochana C, Chinda K and
Stitnimakarn T: Hepatic carcinoma with opisthorchiasis. Southeast
Asian J Trop Med Public Health. 9:215–219. 1978.PubMed/NCBI
|
|
3
|
Björnsson E, Kilander A and Olsson R: CA
19-9 and CEA are unreliable markers for cholangiocarcinoma in
patients with primary sclerosing cholangitis. Liver. 19:501–508.
1999. View Article : Google Scholar
|
|
4
|
Qin XL, Wang ZR, Shi JS, Lu M, Wang L and
He QR: Utility of serum CA19-9 in diagnosis of cholangiocarcinoma:
In comparison with CEA. World J Gastroenterol. 10:427–432.
2004.PubMed/NCBI
|
|
5
|
Lumachi F, Lo Re G, Tozzoli R, D'Aurizio
F, Facomer F, Chiara GB and Basso SM: Measurement of serum
carcinoembryonic antigen, carbohydrate antigen 19-9, cytokeratin-19
fragment and matrix metalloproteinase-7 for detecting
cholangiocarcinoma: A preliminary case-control study. Anticancer
Res. 34:6663–6667. 2014.PubMed/NCBI
|
|
6
|
Shigehara K, Yokomuro S, Ishibashi O,
Mizuguchi Y, Arima Y, Kawahigashi Y, Kanda T, Akagi I, Tajiri T,
Yoshida H, et al: Real-time PCR-based analysis of the human bile
microRNAome identifies miR-9 as a potential diagnostic biomarker
for biliary tract cancer. PLoS One. 6:e235842011. View Article : Google Scholar : PubMed/NCBI
|
|
7
|
Mott JL and Gores GJ: Targeting IL-6 in
cholangiocarcinoma therapy. Am J Gastroenterol. 102:2171–2172.
2007. View Article : Google Scholar : PubMed/NCBI
|
|
8
|
Shen J, Wang W, Wu J, Feng B, Chen W, Wang
M, Tang J, Wang F, Cheng F, Pu L, et al: Comparative proteomic
profiling of human bile reveals SSP411 as a novel biomarker of
cholangiocarcinoma. PLoS One. 7:e474762012. View Article : Google Scholar : PubMed/NCBI
|
|
9
|
Chang YH, Wu CC, Chang KP, Yu JS, Chang YC
and Liao PC: Cell secretome analysis using hollow fiber culture
system leads to the discovery of CLIC1 protein as a novel plasma
marker for nasopharyngeal carcinoma. J Proteome Res. 8:5465–5474.
2009. View Article : Google Scholar : PubMed/NCBI
|
|
10
|
Srisomsap C, Sawangareetrakul P,
Subhasitanont P, Chokchaichamnankit D, Chiablaem K, Bhudhisawasdi
V, Wongkham S and Svasti J: Proteomic studies of cholangiocarcinoma
and hepatocellular carcinoma cell secretomes. J Biomed Biotechnol.
2010:4371432010. View Article : Google Scholar : PubMed/NCBI
|
|
11
|
Tit-Oon P, Chokchaichamnankit D,
Khongmanee A, Sawangareetrakul P, Svasti J and Srisomsap C:
Comparative secretome analysis of cholangiocarcinoma cell line in
three-dimensional culture. Int J Oncol. 45:2108–2116.
2014.PubMed/NCBI
|
|
12
|
Weeraphan C, Diskul-Na-Ayudthaya P,
Chiablaem K, Khongmanee A, Chokchaichamnankit D, Subhasitanont P,
Svasti J and Srisomsap C: Effective enrichment of
cholangiocarcinoma secretomes using the hollow fiber bioreactor
culture system. Talanta. 99:294–301. 2012. View Article : Google Scholar : PubMed/NCBI
|
|
13
|
Unno M, Mizushima T, Morimoto Y, Tomisugi
Y, Tanaka K, Yasuoka N and Tsukihara T: The structure of the
mammalian 20S proteasome at 2.75 A resolution. Structure.
10:609–618. 2002. View Article : Google Scholar : PubMed/NCBI
|
|
14
|
Vangala JR, Dudem S, Jain N and Kalivendi
SV: Regulation of PSMB5 protein and β subunits of mammalian
proteasome by constitutively activated signal transducer and
activator of transcription 3 (STAT3): Potential role in
bortezomib-mediated anticancer therapy. J Biol Chem.
289:12612–12622. 2014. View Article : Google Scholar : PubMed/NCBI
|
|
15
|
Chen L and Madura K: Increased proteasome
activity, ubiquitin-conjugating enzymes, and eEF1A translation
factor detected in breast cancer tissue. Cancer Res. 65:5599–5606.
2005. View Article : Google Scholar : PubMed/NCBI
|
|
16
|
Bazzaro M, Lee MK, Zoso A, Stirling WL,
Santillan A, Shih IeM and Roden RB: Ubiquitin-proteasome system
stress sensitizes ovarian cancer to proteasome inhibitor-induced
apoptosis. Cancer Res. 66:3754–3763. 2006. View Article : Google Scholar : PubMed/NCBI
|
|
17
|
Sixt SU and Dahlmann B: Extracellular,
circulating proteasomes and ubiquitin - incidence and relevance.
Biochim Biophys Acta. 1782:817–823. 2008. View Article : Google Scholar : PubMed/NCBI
|
|
18
|
Stoebner PE, Lavabre-Bertrand T, Henry L,
Guiraud I, Carillo S, Dandurand M, Joujoux JM, Bureau JP and
Meunier L: High plasma proteasome levels are detected in patients
with metastatic malignant melanoma. Br J Dermatol. 152:948–953.
2005. View Article : Google Scholar : PubMed/NCBI
|
|
19
|
Sirisinha S, Tengchaisri T, Boonpucknavig
S, Prempracha N, Ratanarapee S and Pausawasdi A: Establishment and
characterization of a cholangiocarcinoma cell line from a Thai
patient with intrahepatic bile duct cancer. Asian Pac J Allergy
Immunol. 9:153–157. 1991.PubMed/NCBI
|
|
20
|
Laohathai K and Bhamarapravati N:
Culturing of human hepatocellular carcinoma. A simple and
reproducible method Am J Pathol. 118:203–208. 1985.
|
|
21
|
Srisomsap C, Sawangareetrakul P,
Subhasitanont P, Panichakul T, Keeratichamroen S, Lirdprapamongkol
K, Chokchaichamnankit D, Sirisinha S and Svasti J: Proteomic
analysis of cholangiocarcinoma cell line. Proteomics. 4:1135–1144.
2004. View Article : Google Scholar : PubMed/NCBI
|
|
22
|
Iuga C, Seicean A, Iancu C, Buiga R, Sappa
PK, Völker U and Hammer E: Proteomic identification of potential
prognostic biomarkers in resectable pancreatic ductal
adenocarcinoma. Proteomics. 14:945–955. 2014. View Article : Google Scholar : PubMed/NCBI
|
|
23
|
Kanehisa M, Sato Y, Kawashima M, Furumichi
M and Tanabe M: KEGG as a reference resource for gene and protein
annotation. Nucleic Acids Res. 44D:D457–D462. 2016. View Article : Google Scholar
|
|
24
|
Tong Z, Kunnumakkara AB, Wang H, Matsuo Y,
Diagaradjane P, Harikumar KB, Ramachandran V, Sung B, Chakraborty
A, Bresalier RS, et al: Neutrophil gelatinase-associated lipocalin:
A novel suppressor of invasion and angiogenesis in pancreatic
cancer. Cancer Res. 68:6100–6108. 2008. View Article : Google Scholar : PubMed/NCBI
|
|
25
|
Lim R, Ahmed N, Borregaard N, Riley C,
Wafai R, Thompson EW, Quinn MA and Rice GE: Neutrophil
gelatinase-associated lipocalin (NGAL) an early-screening biomarker
for ovarian cancer: NGAL is associated with epidermal growth
factor-induced epithelia-mesenchymal transition. Int J Cancer.
120:2426–2434. 2007. View Article : Google Scholar : PubMed/NCBI
|
|
26
|
Fung KY, Priebe I, Purins L, Tabor B,
Brierley GV, Lockett T, Nice E, Gibbs P, Tie J, McMurrick P, et al:
Performance of serum lipocalin 2 as a diagnostic marker for
colorectal cancer. Cancer Biomark. 13:75–79. 2013. View Article : Google Scholar : PubMed/NCBI
|
|
27
|
Chiang KC, Yeh TS, Wu RC, Pang JS, Cheng
CT, Wang SY, Juang HH and Yeh CN: Lipocalin 2 (LCN2) is a promising
target for cholangiocarcinoma treatment and bile LCN2 level is a
potential cholangiocarcinoma diagnostic marker. Sci Rep.
6:361382016. View Article : Google Scholar : PubMed/NCBI
|
|
28
|
Mukai C, Gao L, Bergkvist M, Nelson JL,
Hinchman MM and Travis AJ: Biomimicry enhances sequential reactions
of tethered glycolytic enzymes, TPI and GAPDHS. PLoS One.
8:e614342013. View Article : Google Scholar : PubMed/NCBI
|
|
29
|
Thongwatchara P, Promwikor n W, Srisomsap
C, Chokchaichamnankit D, Boonyaphiphat P and Thongsuksai P:
Differential protein expression in primary breast cancer and
matched axillary node metastasis. Oncol Rep. 26:185–191.
2011.PubMed/NCBI
|
|
30
|
Yoshida A, Okamoto N, Tozawa-Ono A,
Koizumi H, Kiguchi K, Ishizuka B, Kumai T and Suzuki N: Proteomic
analysis of differential protein expression by brain metastases of
gynecological malignancies. Hum Cell. 26:56–66. 2013. View Article : Google Scholar : PubMed/NCBI
|
|
31
|
Kang HJ, Jung SK, Kim SJ and Chung SJ:
Structure of human alpha-enolase (hENO1), a multifunctional
glycolytic enzyme. Acta Crystallogr D Biol Crystallogr. 64:651–657.
2008. View Article : Google Scholar : PubMed/NCBI
|
|
32
|
He P, Naka T, Serada S, Fujimoto M, Tanaka
T, Hashimoto S, Shima Y, Yamadori T, Suzuki H, Hirashima T, et al:
Proteomics-based identification of alpha-enolase as a tumor antigen
in non-small lung cancer. Cancer Sci. 98:1234–1240. 2007.
View Article : Google Scholar : PubMed/NCBI
|
|
33
|
Cappello P, Rolla S, Chiarle R, Principe
M, Cavallo F, Perconti G, Feo S, Giovarelli M and Novelli F:
Vaccination with ENO1 DNA prolongs survival of genetically
engineered mice with pancreatic cancer. Gastroenterology.
144:1098–1106. 2013. View Article : Google Scholar : PubMed/NCBI
|
|
34
|
Wygrecka M, Marsh LM, Morty RE, Henneke I,
Guenther A, Lohmeyer J, Markart P and Preissner KT: Enolase-1
promotes plasminogen-mediated recruitment of monocytes to the
acutely inflamed lung. Blood. 113:5588–5598. 2009. View Article : Google Scholar : PubMed/NCBI
|
|
35
|
Fu QF, Liu Y, Fan Y, Hua SN, Qu HY, Dong
SW, Li RL, Zhao MY, Zhen Y, Yu XL, et al: Alpha-enolase promotes
cell glycolysis, growth, migration, and invasion in non-small cell
lung cancer through FAK-mediated PI3K/AKT pathway. J Hematol Oncol.
8:222015. View Article : Google Scholar : PubMed/NCBI
|
|
36
|
Capello M, Ferri-Borgogno S, Cappello P
and Novelli F: α-Enolase: A promising therapeutic and diagnostic
tumor target. FEBS J. 278:1064–1074. 2011. View Article : Google Scholar : PubMed/NCBI
|
|
37
|
Yonglitthipagon P, Pairojkul C,
Bhudhisawasdi V, Mulvenna J, Loukas A and Sripa B: Proteomics-based
identification of α-enolase as a potential prognostic marker in
cholangiocarcinoma. Clin Biochem. 45:827–834. 2012. View Article : Google Scholar : PubMed/NCBI
|
|
38
|
Freeman AK and Morrison DK: 14-3-3
Proteins: Diverse functions in cell proliferation and cancer
progression. Semin Cell Dev Biol. 22:681–687. 2011. View Article : Google Scholar : PubMed/NCBI
|
|
39
|
Perathoner A, Pirkebner D, Brandacher G,
Spizzo G, Stadlmann S, Obrist P, Margreiter R and Amberger A:
14-3-3sigma expression is an independent prognostic parameter for
poor survival in colorectal carcinoma patients. Clin Cancer Res.
11:3274–3279. 2005. View Article : Google Scholar : PubMed/NCBI
|
|
40
|
Wu YJ, Jan YJ, Ko BS, Liang SM and Liou
JY: Involvement of 14-3-3 proteins in regulating tumor progression
of hepatocellular carcinoma. Cancers (Basel). 7:1022–1036. 2015.
View Article : Google Scholar
|
|
41
|
Khongmanee A, Lirdprapamongkol K, Tit-oon
P, Chokchaichamnankit D, Svasti J and Srisomsap C: Proteomic
analysis reveals important role of 14-3-3σ in anoikis resistance of
cholangiocarcinoma cells. Proteomics. 13:3157–3166. 2013.
View Article : Google Scholar : PubMed/NCBI
|
|
42
|
Latham MP, Sekhar A and Kay LE:
Understanding the mechanism of proteasome 20S core particle gating.
Proc Natl Acad Sci USA. 111:5532–5537. 2014. View Article : Google Scholar : PubMed/NCBI
|
|
43
|
Lavabre-Bertrand T, Henry L, Carillo S,
Guiraud I, Ouali A, Dutaud D, Aubry L, Rossi JF and Bureau JP:
Plasma proteasome level is a potential marker in patients with
solid tumors and hemopoietic malignancies. Cancer. 92:2493–2500.
2001. View Article : Google Scholar : PubMed/NCBI
|
|
44
|
Jakob C, Egerer K, Liebisch P, Türkmen S,
Zavrski I, Kuckelkorn U, Heider U, Kaiser M, Fleissner C, Sterz J,
et al: Circulating proteasome levels are an independent prognostic
factor for survival in multiple myeloma. Blood. 109:2100–2105.
2007. View Article : Google Scholar
|