Introduction
Approximately 70% of the breast cancers are estrogen
receptor positive (ER+) and are responsive to endocrine
therapy (1). The hormonal drugs
used to treat ER+ breast cancers have been designed to
antagonize the mitogenic effects of estrogens, which include
selective estrogen receptor modulators (SERMs) such as tamoxifen
and raloxifene that bind to the ER and act as antagonists in the
breast; selective estrogen receptor downregulators (SERDs) such as
fulvestrant that bind to and target ER for degradation; and
aromatase inhibitors (AIs) that inhibit the activity of aromatase,
an enzyme that catalyzes the synthesis of estrogens from androgenic
precursors (2). Currently, AIs are
the first-line therapy used to prevent breast cancer progression in
postmenopausal women following primary therapy (2,3).
Breast cancer therapies that reduce estrogen levels (e.g.,
oophorectomy, chemotherapy, and AIs) increase bone resorption
without a corresponding increase in bone formation (4,5). The
loss of bone mineral density in cancer-associated bone diseases
result from the direct or systemic effects of the tumor in addition
to the therapies used to treat the primary disease. It may be
related to the local effects of metastatic deposits in bone and/or
to the generalized bone loss from tumor-produced, systemically
circulating, bone-resorbing hormones or cytokines. These comprise
parathyroid hormone-related protein (PTHrP) or tumor stimulated
secretion by the osteoblast of local bone resorbing factors such as
receptor activator of nuclear factor κB ligand (RANKL), interleukin
(IL)-6, or IL-3. In some tumors, more than one mechanism may be
involved (6). To overcome the
problems with failed calcium homeostasis, several issues have been
proposed. One of them is the addition of bisphosphonates to mammary
gland cancer treatment protocols (7,8).
Another is the use of vitamin D during treatment. Many researchers
during preclinical studies and clinical observations hypothesized
that the addition of vitamin D or its analogs in the breast cancer
treatment based on SERMs or AIs improves the efficacy of
chemotherapy, among others alleviating patients from the
musculoskeletal and joint pain (9–11).
Low vitamin D status, measured in terms of the
biomarker 25-hydroxyvitamin D (25-OH-D3), is often
considered as the risk factor for breast cancer and has prognostic
significance as it is involved in the development of cancer and in
interactions with breast cancer treatments (12). The relationship between vitamin D
deficiency and breast cancer is rather common and correlated with
all clinical parameters such as incidence of tumor, tumor biology,
prognosis, and antineoplastic treatment tolerance (13). Vitamin D deficiency increases after
adjuvant cancer therapy, which alters bone metabolism in patients
with breast cancer thereby increasing the risk of osteoporosis
(14,15). Moreover, some studies have
demonstrated a high prevalence of vitamin D deficiency in women
with ER-negative, progesterone receptor-negative (PR), and human
epidermal growth factor receptor 2 (HER2)-negative breast cancers.
It is postulated that correction of vitamin D deficiency in these
women represents a reasonable but as yet, untested, strategy to
delay recurrence and extend survival (16,17).
Vitamin D receptor (VDR) is present in almost all
tissues and cells in the human body. Calcitriol, a hormonally
active form of vitamin D3 (1,25-dihydroxyvitamin
D3; 1,25(OH)2D3), is primarily
known for its role in bone mineralization and calcium homeostasis.
In addition, several studies have revealed that calcitriol is
important in immunomodulation, regulation of inflammation and
cytokines, cell proliferation, cell differentiation, apoptosis, and
angiogenesis (reviewed in refs. 12,13,18).
However, calcemic activity and subsequent risk of hypercalcemia
caused by calcitriol treatment has limited its usage in anticancer
therapy; therefore, currently, many researchers are focusing on the
synthesis of new analogs with balanced calcemic effect and
antiproliferative activities. Vitamin D3 metabolite used
in this study, (24R)-1,24-dihydroxyvitamin D3
(tacalcitol; 1,24(OH)2D3; PRI-2191), is
physiologically formed via microsomal C-24 hydroxylation process.
This process is alternative to C-25 hydroxylation, which leads to
the formation of calcitriol. Both calcitriol and tacalcitol are
hydroxylated to the less active metabolite
1,24,25(OH)3D3. Tacalcitol inhibits
proliferation and induces differentiation of epidermal mouse and
human keratinocytes. It also binds to the VDR with the affinity
higher or similar to that of calcitriol but shows weaker induction
of hypercalcemia than calcitriol (19–21).
However, the geometric analogs of vitamin D with the reversed
(5E,7E) geometry of the triene system were reported
by our (22–24) and other laboratories (25) to show the enhanced biological
activity when compared to the natural (5Z,7E) vitamin
D. We demonstrated a higher antiproliferative activity of synthetic
tacalcitol, PRI-2191, when compared to calcitriol against various
cancer cell lines, and we showed that this effect is attributed to
the induction of cancer cell differentiation. We also showed the
in vitro and in vivo improvement of the activity of a
range of anticancer drugs against human and murine cancer cells
with concomitant use of vitamin D (20–23,26–31).
For the vast majority of cancer-related deaths, drug
resistance and irremovable metastatic lesions are responsible.
Metastasis results from the numerous interactions between cancer
cells, hematopoietic stem cells, and normal cells within the
microenvironment of the primary tumor and metastasis target organ.
These interactions are in turn influenced by multiple endocrine,
paracrine, and physical factors (32). Bone-targeted treatments may modify
the course of the disease via both direct and indirect effects on
this 'vicious cycle' of growth factor and cytokine signaling
between tumor and normal cells (5,8).
Therefore, in this study, we aimed to evaluate the
impact of calcitriol and its low-calcemic analogs on the mammary
gland tumor growth and metastasis. To this purpose, we used 4T1
mouse metastatic mammary gland cancer cells because the in
vitro proliferation of these cells is not affected by
calcitriol or its analogs. We hypothesized that the enhancement of
metastatic process by calcitriol and its analogs is related to the
impact on tumor microenvironment including tumor vasculature.
Materials and methods
Compounds
Calcitriol (1,25(OH)2D3) and
its analogs, namely, PRI-2191 and PRI-2205 are certified synthetic
materials obtained from the Pharmaceutical Research Institute,
Warsaw, Poland. Samples of the compounds were stored in amber
ampoules under argon at −20°C. Prior to usage, in case of in
vitro studies, compounds were dissolved in 99.8% ethanol to a
concentration of 10−4 M and subsequently diluted in
culture medium to reach appropriate concentration. For animal
experiments, compounds were dissolved in 99.8% ethanol and then
diluted in 80% propylene glycol (PEG) to reach the required
concentrations. All compounds were freshly prepared each day prior
to administration. The preparation and storage of the tested
compounds was performed according to the manufacturer's
instructions (the Pharmaceutical Research Institute) and literature
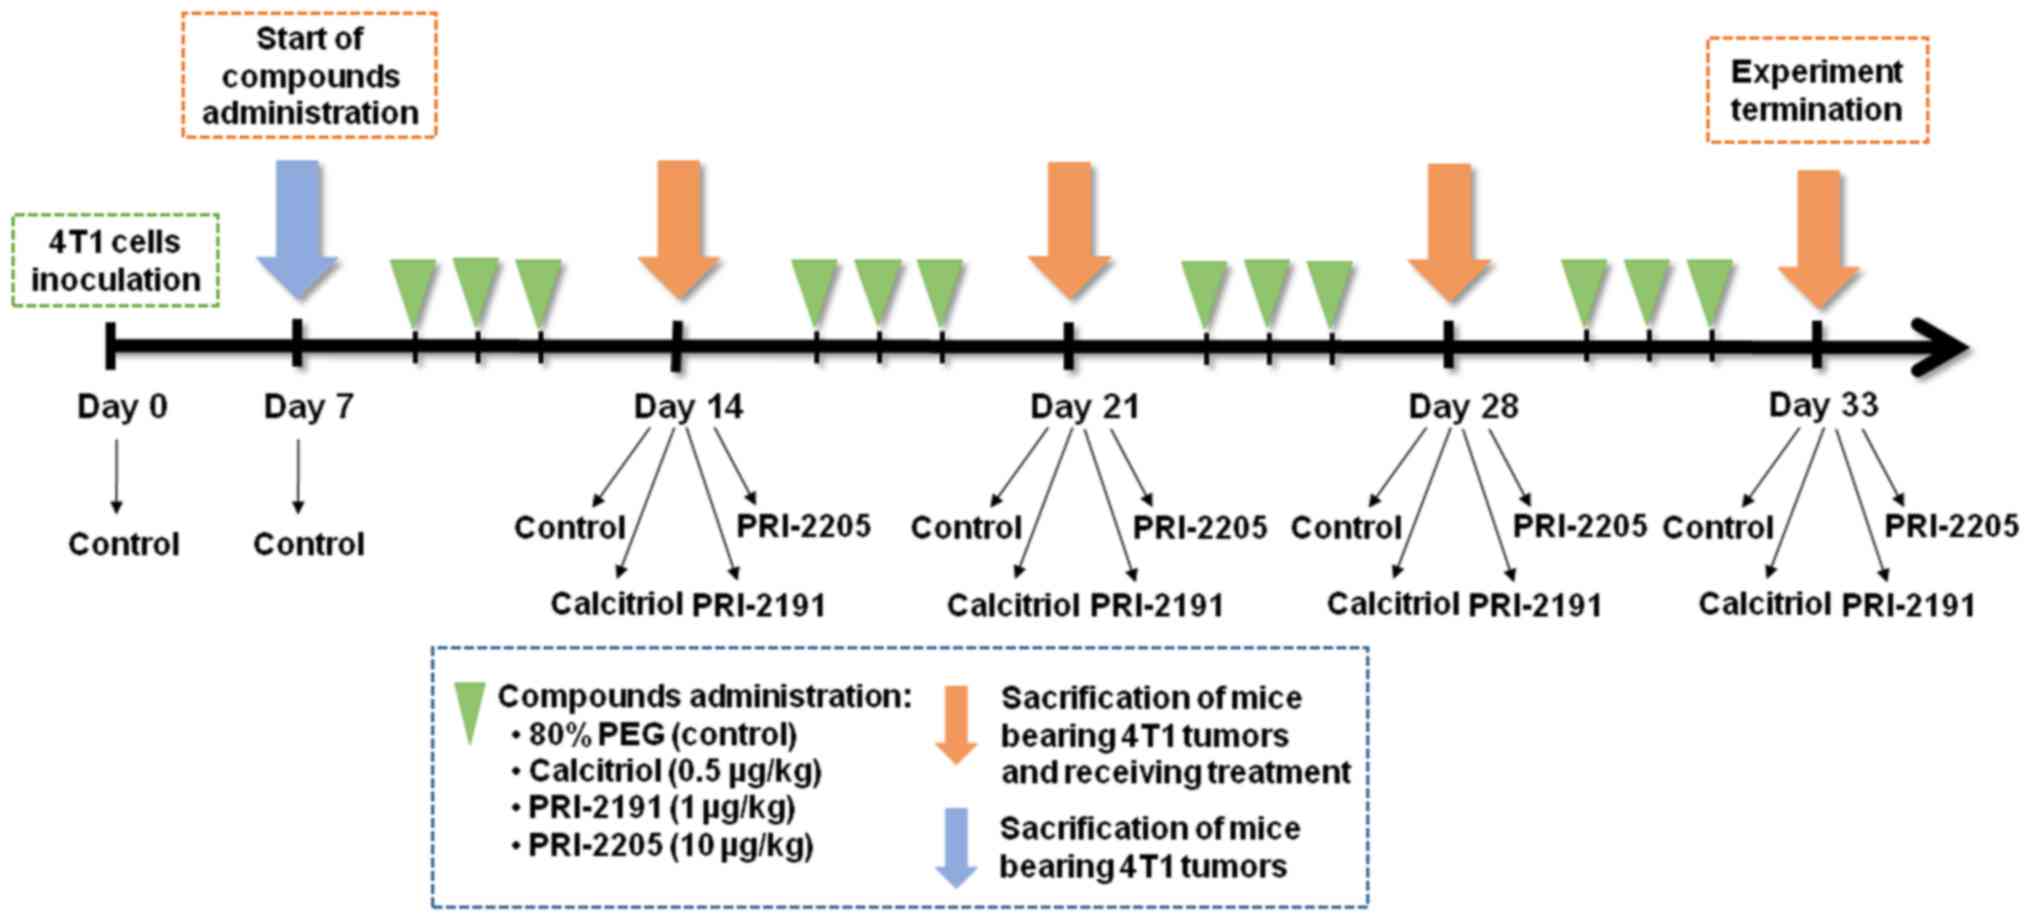
data (23,33). Tested compounds were administered
subcutaneously (s.c.) to mice in a volume of 5 µl/g body
weight (Fig. 1).
Cells and cell line culture
The mouse mammary adenocarcinoma 4T1 cells were
obtained from American Type Culture Collection (ATCC, Rockville,
MD, USA) and the 67NR (non-metastatic counterparts of 4T1) cells
were received from Barbara Ann Karmanos Cancer Institute, Detroit,
MI, USA. The cells were used in experiments immediately after
obtaining.
The 4T1 cell line was maintained in a mixture of
RPMI-1640 and Opti-MEM medium (1:1, Gibco, Scotland, UK) adjusted
to contain 3.5 g/l glucose, 2 mM L-glutamine and 0.5 mM sodium
pyruvate (Sigma-Aldrich Chemie GmbH, Steinheim, Germany) with 5%
fetal bovine serum (Hyclone, GE Healthcare, UK). The 67NR cells
were cultured in Dulbecco's modified Eagle's medium (DMEM; Gibco)
with 10% calf bovine serum (CBS; ATCC), 1% amino acid, and 2 mM
L-glutamine (Sigma-Aldrich Chemie GmbH). Both culture media were
supplemented with 100 U/ml penicillin (Polfa Tarchomin S.A.,
Warsaw, Poland) and 100 µg/ml streptomycin (Sigma-Aldrich
Chemie GmbH). The cells were grown at 37°C in a humid atmosphere
saturated with 5% CO2.
Mice
BALB/c female, 6–8-week old mice, weighing 20–25 g,
obtained from the Center of Experimental Medicine of the Medical
University of Bialystok (Bialystok, Poland), were maintained in
specific pathogen-free conditions.
All experiments were performed according to EU
Directive 2010/63/EU on the protection of animals used for
scientific purposes and were approved by the first Local Committee
for Experiments with the Use of Laboratory Animals, Wroclaw, Poland
(no of permission: 40/2014).
Design of the in vivo experiments
BALB/c female mice were orthotopically inoculated
into the right mammary fat pad with 1×10⁴ viable 4T1
tumor cells per mouse in 0.05 ml Hanks solution and then randomly
divided into groups receiving appropriate treatment. Vitamin D
analogs were administered subcutaneously (s.c.) thrice a week
starting from day 7 after tumor cell inoculation. The single dose
of compounds was as follows: calcitriol, 0.5 µg/kg;
PRI-2191, 1.0 µg/kg; and PRI-2205, 10.0 µg/kg.
Blood was harvested on the days 0 (before tumor
inoculation), 7 (before treatment), 14 (micro-metastases observed
(34), 21, 28, and 33 after the
inoculation of 4T1 cells (day of tumor inoculation assigned as day
0). The mice were anesthetized with 3–5% (v/v) mixture of
isoflurane (Aerrane isofluranum; Baxter, Canada) in synthetic air
(200 ml/min) prior to sacrificing the animals. The tumors, lungs,
and thoracic aortas were harvested for further analyzes (Fig. 1). Following additional controls
were also used: healthy mice (assigned as day 0) and mice with
implanted tumors euthanized on the day when the vitamin D
derivatives began to be administered (day 7). The control group
from day 7 was included to monitor the condition of the body at the
start of the treatment. Some of analyses were performed on two
different days: 14 or 21 (as an early stage of tumor progression)
and 28 or 33 (as a late stage of tumor progression).
Evaluation of the therapeutic effect
Tumor volume was calculated using the formula
(a2×b)/2, where a = shorter tumor
diameter in mm and b = longer tumor diameter in mm. Tumors
were measured thrice a week. Mice were sacrificed when the tumor
volume exceeded 2,000 mm3. Multiple tumors were not
observed in our study. Metastases were counted in the lungs fixed
in 4% buffered formalin by two independent examiners and mean value
of those counts from two independent experiments is presented.
Body weight change (BWC)
The average BWC in all groups was calculated based
on the following formula: BWC = (ABWn/ABW1) ×
100 – 100%, where ABWn is the average body weight on the
nth day of the experiment (during treatment) and
ABW1 is the average body weight on the first day of
treatment. The body weight of experimental animals was measured
thrice per week throughout the study. We considered the treatment
to be toxic if the BWC was found to be decreased by ~20% in two
successive measurements. However, the experiments were terminated
when body weight loss did not reach 20% in any of the mice.
Calcemic activity
Calcium level was measured in each individual plasma
sample using the Cobas c 111 z ISE (Roche Diagnostics Ltd.,
Rotkreuz, Switzerland) device.
Evaluation of tumor angiogenesis
The influence of calcitriol and its analogs on tumor
angiogenesis was evaluated by means of ultrasound imaging of tumor
perfusion.
For the ultrasound imaging MicroMarker™ Contrast
Agent (VisualSonics, Ontario, Canada) was prepared according to the
manufacturer's instructions. Animals were anesthetized with a 2–3%
(v/v) mixture of isoflurane (Aerrane isofluranum; Baxter) in
synthetic air (200 ml/min) and placed on the animal handling
station equipped with an individual mask providing 1.5–2% (v/v)
mixture of isoflurane and synthetic air. The position of the
handling station was adjusted so that the central section of the
tumor was being visualized and contrast agent was injected into the
tail vein of the animal. Signal of the contrast marker accumulating
in the tumor tissue was recorded using the probe of 13–24 MHz
frequency (MS250, VisualSonics). Next, the peak-enhancement
[contrast mean power as l.a.u. (linear arbitrary units)] and
time-to-peak (sec) parameters were calculated using the Vevo LAB
1.7.1 Software (Visualsonics).
Immunohistochemical staining of aorta
sections
For the double immunohistochemistry sequential
staining of thoracic aorta (isolated from mice on the days 7, 14,
21, 28 or 33 and from healthy, non-treated animals) sections were
fixed in buffered formalin and then cut into 4-µm thick
slices that were subsequently dewaxed and rehydrated through
gradient of Unyhol and Unyhol Plus (Bio-Optica, Mediolan, Italy).
Antigen retrieval was performed by heating in Tris-EDTA, pH 9.0
(Institute of Immunology and Experimental Therapy PAN, Wrocław,
Poland) at 96°C for 45 min. Endogenous peroxidase and phosphatase
activity was quenched by incubating with Dako Dual Endogenous
systems (Dako Cytomation Poland, Gdynia, Poland) for 10 min.
Subsequently, sections of aorta were incubated with primary
antibodies described in Table
I.
 | Table IAntibodies and detection systems used
for aorta immunohistochemistry. |
Table I
Antibodies and detection systems used
for aorta immunohistochemistry.
| Antibody
(source) | Antigen | Antibody
dilution/duration of incubation |
|---|
| Rabbit polyclonal
(Abcam, Cambridge, UK) | CD31 (PECAM) | 1:50/1 h |
| CD105
(endoglin) | 1:1,000/1 h |
| vWF | 1:100/1 h |
| αSMA | 1:100/1 h |
Antigen-antibody binding was detected using Dako
Real EnVision Detection Systems Peroxidase or by Dako Real
Detection Alkaline Phosphatase both from Dako Cytomation Poland,
according to the manufacturer's instructions. Counterstaining was
performed using Gill's III hematoxylin (Merck Millipore, Darmstadt,
Germany), and the specimen was secured with a coverslip using Dako
Faramount Aqueous Mounting Medium (Dako Cytomation Poland).
Microscopic examination and photographs were
captured using a bright field microscope (Olympus CX41) connected
with a camera equipped with Olympus Stream Image Analysis Software
(Olympus Europe Holding GmBH, Hamburg, Germany). Blinded
microscopic examination was performed at magnifications (×10 and
×100) and described according to the below scheme: 0, no staining;
1+, delicate staining; 2+, average color staining; 3+, intense
color staining; 4+, bright color staining.
Masson's trichrome staining for collagen
fibers of tumor and lung tissue
Tissues that were dewaxed and rehydrated in a
descending alcohol series were incubated with Weigert's iron
hematoxylin nuclear staining solution for 5 min (Merck Millipore,
Darmstadt, Germany). After 5 min of flushing in tap water, slides
were submerged in 1% acetic acid for 3 min. Subsequently, the
sections were immersed respectively in Azoploxine solution for
cytoplasm dyeing (5 min), Tungstophosphoric acid orange G solution
for erythrocytes staining (1 min), and Light green SF solution for
collagen and connective tissue visualization (5 min). The slides
were washed in 1% acetic acid between each staining procedure for 3
min (Masson-Goldner staining kit, Merck Millipore, Darmstadt,
Germany). In the last step, slides were washed in 1% acetic acid
for an additional 5 min and left to dry. Afterwards histological
slides were covered with non-aqueous mounting agent (Neo-Mount
anhydrous mounting medium; Merck KGaA, Germany) and a cover glass
for further analysis.
Microscopic examination and photographs were made
using a bright field microscope (Olympus CX41) connected with
camera equipped with Olympus Stream Image Analysis Software
(Olympus Europe Holding GmBH). Blinded microscopic examination was
performed at 2 magnifications (×10 and ×40) and described according
to the scoring described in Table
II and figure legends.
| Table IIScoring of staining for collagen in
lung tissue. |
Table II
Scoring of staining for collagen in
lung tissue.
| Day after tumor
transplantation | Score for collagen
staining
|
|---|
| Control | Calcitriol | PRI-2191 | PRI-2205 |
|---|
| Day 0 | +++ | | | |
| Day 7 | +++ | | | |
| Day 14 | ++ | +++ | ++ | +/++ |
| Day 21 | ++ | +/++ | ++ | ++ |
| Day 28 | ++ | +++/++++ | +/++ | ++ |
Mouse tumor invasion/metastasis PCR
array
Total RNA of tumor tissue was extracted using TRIzol
(TRI reagent; Sigma-Aldrich) according to the manufacturer's
instructions. RNA quantity and purity were determined
spectrophotometrically at 260 nm using NanoDrop 2000 (Thermo Fisher
Scientific, Waltham, MA, USA) and the quality of RNA was verified
by agarose electrophoresis. Reverse transcription was performed
using iScript cDNA Synthesis kit (Bio-Rad, Hercules, CA, USA).
Real-time quantitative PCR of total cDNA was executed by ViiA™ 7
Real-Time PCR system (Thermo Fisher Scientific) with SYBR green
chemistry (Qiagen, Hilden, Germany). Mouse Tumor
Invasion/Metastasis PCR Array Library (MTIM-1) was purchased from
Real-Time Primers (Elkins Park, PA, USA). The array contained 88
primers for genes associated with the invasion or metastasis
process and eight control genes. All genes available within this
PCR array are listed in Table
III. All PCR amplification cycles were performed at 95°C for 10
sec and 58°C for 45 sec (50 cycles). We used 25 ng of cDNA (pooled
from 4–5 mice within group) for a single reaction, and each test
was performed in duplicate. Fold-change (RQ) of target cDNA was
determined by calculating the differences in ΔΔCT values in
reference to phosphoglycerate kinase 1 (Pgk1) by DataAssist
3.01 software (freeware by Applied Biosystems, Foster, CA,
USA).
| Table IIIList of genes evaluated using mouse
tumor invasion/metastasis PCR array library (MTIM-1). |
Table III
List of genes evaluated using mouse
tumor invasion/metastasis PCR array library (MTIM-1).
| Symbol | Name |
|---|
| Adamts1 | ADAM
metallopeptidase |
| Aldh3a1 | Aldehyde
dehydrogenase 3 family, member A1 |
| Angpt1 | Angiopoietin 1 |
| Angptl4 | Angiopoietin-like
4 |
| Casp8 | Caspase 8,
apoptosis-related cysteine peptidase |
| Ccne2 | Cyclin E2 |
| Ccr7 | Chemokine (C-C
motif) receptor 7 |
| Cd44 | CD44 molecule
(Indian blood group) |
| Cd82 | CD82 antigen |
| Cdh1 | Cadherin 1, type 1,
E-cadherin (epithelial) |
| Cdh11 | Cadherin 11, type
2, OB-cadherin (osteoblast) |
| Cdh2 | Cadherin 2, type 1,
N-cadherin |
| Cdh6 | Cadherin 6 |
| Cldn7 | Claudin 7 |
| Col1a1 | Collagen, type I,
α1 |
| Col4a2 | Collagen, type IV,
α2 |
| Col6a1 | Collagen, type VI,
α1 |
| Csf1 | Colony stimulating
factor 1 |
| Csf2 | Colony stimulating
factor 2 |
| Csf3 | Colony stimulating
factor 3 |
| Cst7 | Cystatin F
(leukocystatin) |
| Ctgf | Connective tissue
growth factor |
| Ctsb | Cathepsin B |
| Ctsd | Cathepsin D |
| Ctsk | Cathepsin K |
| Ctsl1 | Cathepsin L-like
3 |
| Cxcl1 | Chemokine (C-X-C
motif) ligand 1 |
| Cxcl13 | Chemokine (C-X-C
motif) ligand 13 |
| Cxcr4 | Chemokine (C-X-C
motif) receptor 4 |
| Cxcr6 | Chemokine (C-X-C
motif) receptor 6 |
| Drg1 | Developmentally
regulated GTP binding protein 1 |
| Ereg | Epiregulin |
| Fgf8 | Fibroblast growth
factor 8 (androgen-induced) |
| Flt1 | Fms-related
tyrosine kinase |
| Flt4 | Fms-related
tyrosine kinase 4 |
| Gpi | Glucose phosphate
isomerase |
| Gsn | Gelsolin
(amyloidosis, Finnish type) |
| Hgf | Hepatocyte growth
factor (hepapoietin A; scatter factor) |
| Hif1a | Hypoxia inducible
factor 1, α subunit |
| Hmgb1 | High-mobility group
box 1 |
| Id1 | Inhibitor of DNA
binding 1 |
| Il13ra2 | Interleukin 13
receptor, α2 |
| Isg20 | Interferon
stimulated exonuclease gene 20 kDa |
| Jag1 | Jagged 1 (Alagille
syndrome) |
| Kiss1 | KiSS-1
metastasis-suppressor |
| Klrc2 | Killer cell
lectin-like receptor subfamily C, member 2 |
| Kynu | Kynureninase
(L-kynurenine hydrolase) |
| Ltbp1 | Latent transforming
growth factor β binding protein 1 |
| Map2k4 | Mitogen-activated
protein kinase kinase 4 |
| Map2k5 | Mitogen-activated
protein kinase kinase 5 |
| Map2k7 | Mitogen-activated
protein kinase kinase 7 |
| Mcam | Melanoma cell
adhesion molecule |
| Met | Met proto-oncogene
(hepatocyte growth factor receptor) |
| Metap2 | Methionyl
aminopeptidase 2 |
| Mmp1 | Matrix
metallopeptidase 1 (interstitial collagenase) |
| Mmp10 | Matrix
metallopeptidase 10 (stromelysin 2) |
| Mmp11 | Matrix
metallopeptidase 11 (stromelysin 3) |
| Mmp13 | Matrix
metallopeptidase 13 (collagenase 3) |
| Mmp14 | Matrix
metallopeptidase 14 (membrane-inserted) |
| Mmp2 | Matrix
metallopeptidase 2 |
| Mmp7 | Matrix
metallopeptidase 7 (matrilysin, uterine) |
| Myc | V-myc
myelocytomatosis viral oncogene homolog |
| Nedd9 | Neural precursor
cell expressed, dev. downregulated 9 |
| Nf2 | Neurofibromin 2
(merlin) |
| Nme1 | Non-metastatic
cells 1, protein (NM23A) |
| Nme2 | Non-metastatic
cells 2, protein |
| Nme4 | Non-metastatic
cells 4, protein |
| Pax5 | Paired box 5 |
| Pdgfa | Platelet-derived
growth factor α polypeptide |
| Plaur | Plasminogen
activator, urokinase receptor |
| Ptgs2 |
Prostaglandin-endoperoxide synthase 2 |
| Runx1 | Runt-related
transcription factor 1 |
|
Serpine1 | Serpin peptidase
inhibitor, clade E |
|
Serpinb5 | Serpin peptidase
inhibitor, clade B5 |
| Sox4 | SRY (sex
determining region Y)-box 4 |
| Sparc | Secreted protein,
acidic, cysteine-rich (osteonectin) |
| Spp1 | Secreted
phosphoprotein 1 |
| Src | V-src sarcoma viral
oncogene homolog (avian) |
| Tff1 | Trefoil factor
1 |
| Tgfb1 | Transforming growth
factor, β1 |
| Timp1 | TIMP
metallopeptidase inhibitor 1 |
| Timp2 | TIMP
metallopeptidase inhibitor 2 |
| Timp3 | TIMP
metallopeptidase inhibitor 3 |
| Timp4 | TIMP
metallopeptidase inhibitor 4 |
| Tnc | Tenascin C
(hexabrachion) |
| Tp53 | Tumor protein
p53 |
| Vegfa | Vascular
endothelial growth factor A |
| Vegfb | Vascular
endothelial growth factor B |
| Actb | Actin, β |
| B2m |
β-2-microglobulin |
| Gapd |
Glyceraldehyde-3-phosphate
dehydrogenase |
| Gusb | Glucuronidase,
β |
| Hprt1 | Hypoxanthine
phosphoribosyltransferase 1 |
| Pgk | Phosphoglycerate
kinase 1 |
| Ppia | Peptidylprolyl
isomerase A |
| Rpl13a | Ribosomal protein
L13a |
Real-time PCR
Isolation of RNA and synthesis of cDNA was performed
as described above. All PCR amplification cycles were performed at
95°C for 15 sec and 60°C for 1 min (40 cycles) using primers
specific for following genes: Drg1 (Mm00492246_m1),
Nf2 (Mm00477771_m1), Nedd9 (Mm01324843_m1),
Mmp13 (Mm00439491_m1), Mmp14 (Mm00485054_m1),
Spp1 (Mm00436767_m1), Flt1 (Mm00438980_m1),
Plaur (Mm01149438_m1), Tgfb1 (Mm01178820_m1),
pgk1 (Mm00435617_m1) with TaqMan chemistry (all from Life
Technologies, Carlsbad, CA, USA). We used 25 ng of cDNA for a
single reaction, and each sample was performed in triplicate in a
single experiment (3 experiments were performed). Fold-change (RQ)
of target cDNA was determined by calculating the differences in
ΔΔCT values in reference to phosphoglycerate kinase 1 (Pgk1)
by DataAssist 3.01 software (freeware by Applied Biosystems).
Western blotting
Tissue preparation
Tumor tissue specimens were collected in liquid
nitrogen and stored at −80°C. To determine the protein expression
via western blotting, frozen tumors were mechanically homogenized
(Rotilabo, Carl Roth, Karlsruhe, Germany) in RIPA buffer
(Sigma-Aldrich Chemie GmbH) supplemented with a complete mixture of
phosphatase and protease inhibitors (Sigma-Aldrich Chemie GmbH) and
kept on ice for 25 min. Lysates were purified via
microcentrifugation at 14,000 × g for 10 min at 4°C.
Preparation of cells from in vitro
culture
Cultured 4T1 or 67NR cells were seeded at a density
of 3×10⁵ cells/4 ml in suitable culture medium on a
tissue culture dish. After 2 h of attachment, cells were exposed to
calcitriol or its analogs at a concentration of 100 nM for 72 h.
Next, cultures were rinsed with RIPA buffer and a mixture of
phosphatase and protease inhibitors. Cells were scraped using cell
scrapers and lysates were collected. Cell lysates were incubated on
ice for 25 min and then were microcentrifuged at 10,000 × g for 15
min at 4°C.
Protein concentration was determined using a protein
assay (DC Protein assay; Bio-Rad Laboratories). Equal amounts of
protein (50 µg of cell culture lysates, 100 µg of
tumor lysates) were mixed with 4X Laemmli sample buffer (Bio-Rad
Laboratories). Then, the samples were separated in a 10% sodium
dodecyl sulfate (SDS) polyacrylamide gel and transferred to a
polyvinylidene difluoride (PVDF) membrane (0.45 µm; Merck
Millipore, USA). Membranes were blocked for 1 h at room temperature
in 5% non-fat dry milk in 0.1% PBS/Tween-20 (PBST). Next, the
membranes were washed (3×10 min) with 0.1% PBST and then incubated
overnight at 4°C with a primary antibody: rabbit anti-VDR,
anti-ERα, anti-ERβ, anti-NFκB, anti-IκBα, anti-SNAI, anti-PTEN,
anti-CYP24A1, anti-CYP27B1, anti-RXRα, anti-β-catenin polyclonal
antibody (Santa Cruz Biotechnology Inc., Santa Cruz, CA, USA), or
rabbit anti-E-cadherin and anti-N-cadherin polyclonal antibody
(ProteinTech, Manchester, UK). After incubation, membranes were
washed (3×10 min) with 0.1% PBST and incubated for 1 h with the
secondary mouse anti-rabbit immunoglobulin G (IgG)-horseradish
peroxidase (HRP) antibody (Santa Cruz Biotechnology Inc.). The
membranes were finally washed thrice with 0.1% PBST and detected by
ECL method. Next, to determine the expression of β-actin, the same
membranes (for each tested protein) were incubated with mouse
anti-β-actin-HRP monoclonal antibody for 1 h at room temperature,
washed (3×10 min 0.1% PBST), and detected by ECL system.
Chemiluminescence was visualized using Image station 4000
(Carestream Health, Rochester, NY, USA). Densitometry analysis of
the western blots was performed using Carestream MI Software
5.0.6.20 (Carestream Health). All blots were normalized to that of
β-actin, and the fold-change protein level expression is reported
in comparison to that of the β-actin.
ELISA
For the quantitative determination of
17-β-estradiol, osteopontin (OPN), TGFβ, VEGF, thrombospondin, and
25-OH vitamin D, ELISA kits were used according to the
manufacturer's instructions (Demeditec Diagnostics GmbH, Germany;
R&D Systems, Inc., Minneapolis, MN, USA; eBioscience, Vienna,
Austria; Thermo Fisher Scientific; Bioassay Technology Laboratory,
Shanghai, China; Eagle Biosciences, Nashua, NH, USA,
respectively).
Mouse cytokine and protein expression was detected
in mouse plasma, tumor homogenates, and in vitro from
4T1/67NR cells culture supernatants. Tumor lysates were prepared as
described above (in western blotting methodology).
For in vitro analysis, 4T1 or 67NR cells were
seeded in a tissue culture dish at a density of 3×10⁵
cells/4 ml or in a 6-well plate at a density 3×10⁵
cells/2 ml. Next, after 2 h, the attached cells were exposed to the
calcitriol, PRI-2191, or PRI-2205 at a concentration of 100 nM for
6, 24, 48 and 72 h. Next, the supernatants were collected and
frozen at −20°C until use.
In vitro antiproliferative assay
Antiproliferative tests were performed as previously
described (22). Briefly, 24 h
prior to the addition of the tested compounds, 4T1 and 67NR cells
were plated in 96-well plates (Sarstedt, Germany) at a density of
1.5×10⁴/ml. To determine the in vitro
cytotoxicity of test compounds, the assays were performed after
72-h exposure of the cultured cells to the varying concentrations
of tested compounds (total plate incubation time: 96 h) using
sulforhodamine B (SRB) assay. Both cell lines were exposed to each
tested vitamin D compound at four different concentrations in the
range of 1,000-1 nM. The activity of tested agents was compared to
the activity of cisplatin, doxorubicin, docetaxel, 5-fluorouracil
(all Accord Healthcare Poland, Warsaw, Poland), camptothecin, and
tamoxifen (Sigma-Aldrich Chemie GmbH). In addition, control wells
loaded with either ethanol or DMSO based on the solubility of the
tested agents were maintained. Absorbance of each solution was read
using Synergy H4 (BioTek Instruments USA) at a wavelength of 540
nm. Entire washing procedure was performed on Biotek EL-406 washing
station. The results were calculated as IC50 value
(inhibitory concentration 50%) - the dose (nM or µg/ml) of
tested agent which inhibits proliferation of 50% of the cancer cell
population. IC50 values were calculated in Prolab-3
system based on Cheburator 0.4, Dmitry Nevozhay software for each
experiment (35). Each compound in
each concentration was tested in triplicate in a single experiment,
which was repeated at least thrice.
Statistical evaluation
Statistical analysis was performed using Statistica
version 10 (StatSoft Inc., USA) or GraphPad Prism 7.01 (GraphPad
Software Inc., USA). The assumptions of analysis of variance
(ANOVA) were checked using Shapiro-Wilk's normality test and
Bartlett's test. Specific tests used for data analysis are
indicated in figure legends. P<0.05 was considered to be
statistically significant.
Results
The animal experiments were planned to investigate
the effect of calcitriol and its analogs on the growth and
metastasis of mammary gland cancer at various stages of its
progression. Besides control healthy mice used for comparisons in
selected experiments (assigned as day 0), mice were euthanized on
day 7 after tumor cells transplantation to monitor the condition of
the body at the start of treatment. To analyze the treatment
results during tumor progression, we selected the following
time-points of observation: day 14 after cells inoculation (7th day
of treatment) as the day, when according to the literature data
first micro-metastases can be observed in 4T1 tumor model (34). Next observation points were every
week until the first signs of health problems: days 21, 28 and 33.
The last observation time was shortened because of the observed
body weight loss described below.
Calcitriol and its analogs stimulated
metastatic spread of 4T1 mammary gland cancer
In two independent experiments, neither calcitriol
nor its analogs (PRI-2191 and PRI-2205) influenced primary 4T1
tumor growth significantly (Fig.
2A). However, in both experiments, the stimulation of lung
metastases resulting from the treatment was observed (Fig. 2B). Metastatic foci in lungs were
first macroscopically visible on day 21 after inoculation of the
tumor cells. On this day, the number of metastases in mice treated
with PRI-2205 (P<0.05) was almost twice as high as in control
animals. On day 28, the influence of calcitriol on metastasis
formation was not observed; however, PRI-2191 and PRI-2205
significantly enhanced the formation of metastases in 127%
(P<0.05) and 54%, respectively, as compared to the control mice.
On day 33, the tendency to stimulate the formation of lung
metastasis was observed in mice treated with calcitriol, PRI-2191,
and PRI-2205 (50, 54 and 58% over control, respectively; not
significant because of high differences between mice). Histological
examination of lung tissue from one of the two conducted
experiments showed single metastatic foci on day 14 (in 2 out of 6
in the control group, 0 out of 6 in calcitriol treated, 3 out of 6
in PRI-2191, and 2 out of 6 in PRI-2205 treated mice). On day 33,
statistically significant increase of the number of metastatic foci
in mice treated with all compounds was observed (Fig. 2C and D).
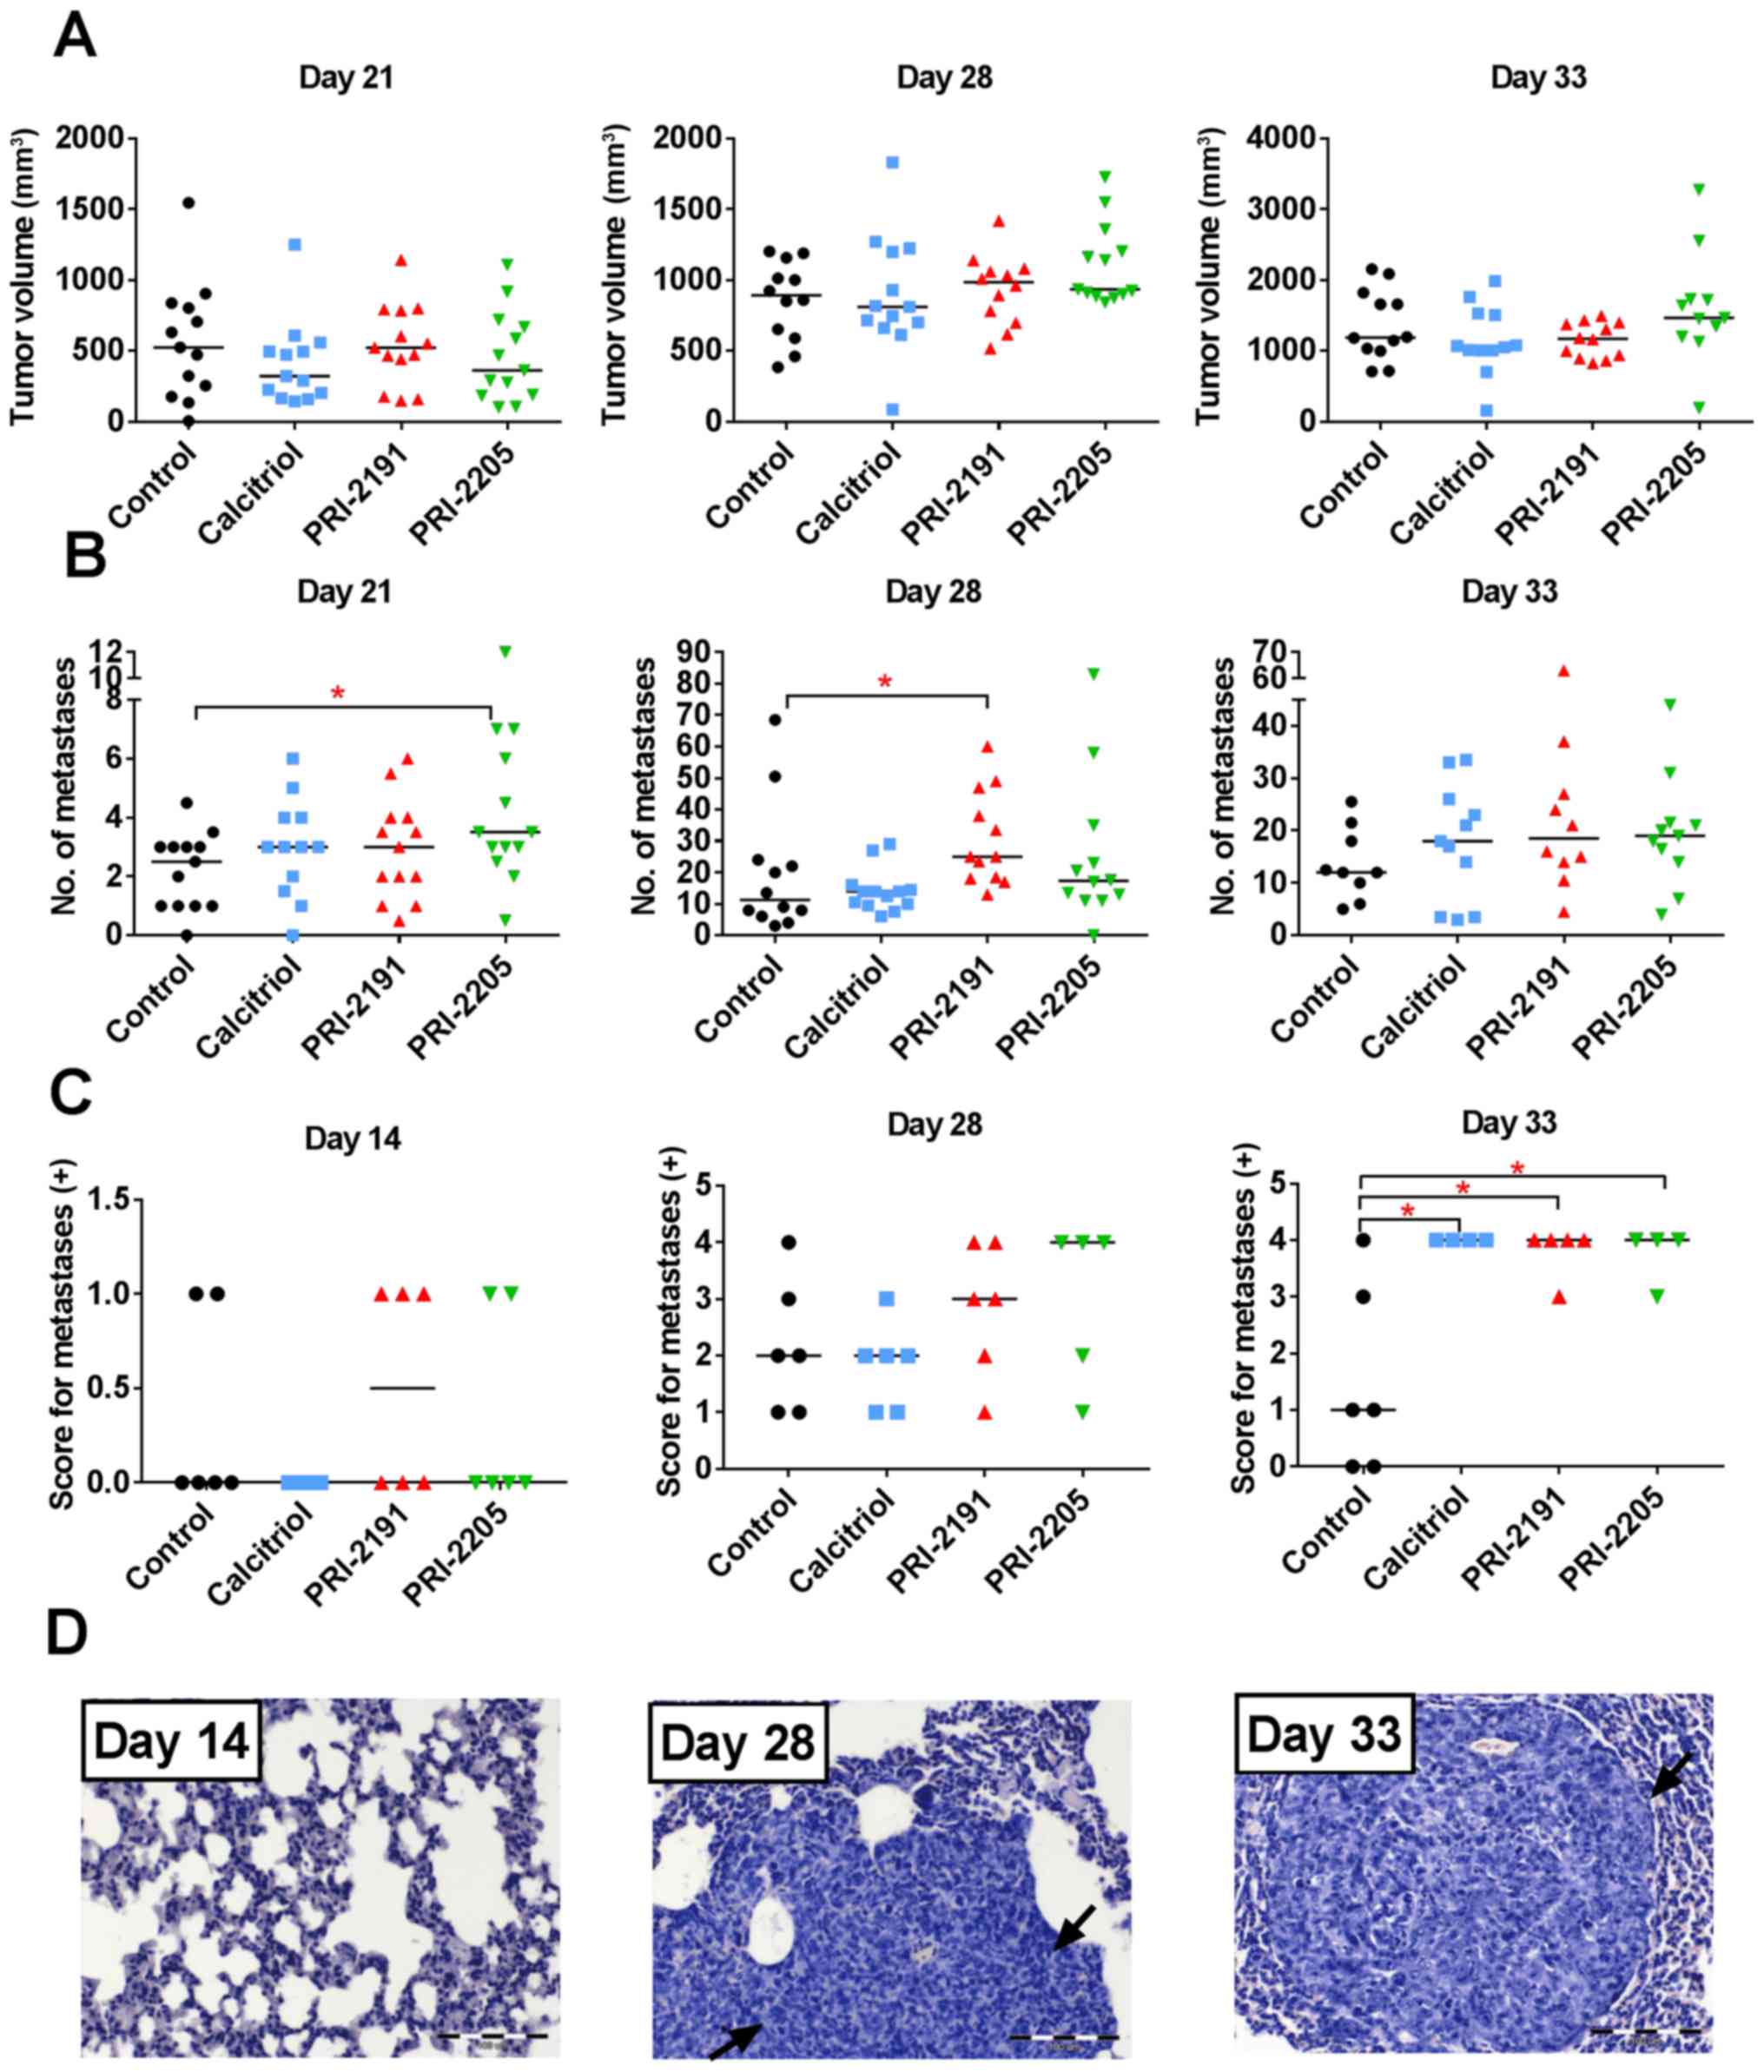 | Figure 2Tumor volume and number of lung
metastases in mice bearing 4T1 tumors treated with calcitriol,
PRI-2191, and PRI-2205. (A) Tumor volume measured on day 21, 28 and
33 of experiment. (B) Number of lung metastases counted in lungs
from two independent experiments. (C) Score for metastases in
H&E stained lungs, days 14, 28 and 33: 0, no metastasis
detected; +, 1–3 metastatic foci; ++, 4–7 foci; +++, 8–10 foci;
++++, >10 metastatic foci in lungs. (D) An example of H&E
stained lungs on various stages of tumor progression from mice
treated with calcitriol. Black arrows indicated tumor nodules.
Magnification, ×20, scale bar, 100 µm. Mice were inoculated
orthotopically with 4T1 cells on day 0. From day 7 (7 days after
tumor inoculation), vitamin D analogs were administered
subcutaneously (s.c.) thrice a week. The single dose of compounds
were as follows: calcitriol, 0.5 µg/kg; PRI-2191, 1.0
µg/kg; and PRI-2205, 10.0 µg/kg. Number of mice were
9–13 per group. Data were collected from two independent
experiments. Data for individual animals are presented with median
lines. Statistical analysis: Kruskal-Wallis multiple comparison
test. *P<0.05. |
BWC and blood calcium level were measured throughout
the experiment to estimate the toxicity of the treatments used
(Fig. 3). The body weight of mice
remained unchanged significantly till day 22 in all experimental
groups. The kinetics of BWC in control and mice treated with
PRI-2191 and PRI-2205 was similar till the end of the experiment.
However, from day 24 until the last day of measurements, toxicity
of calcitriol was observed in terms of BWC, which decreased in ~10%
of the control mice (Fig. 3A).
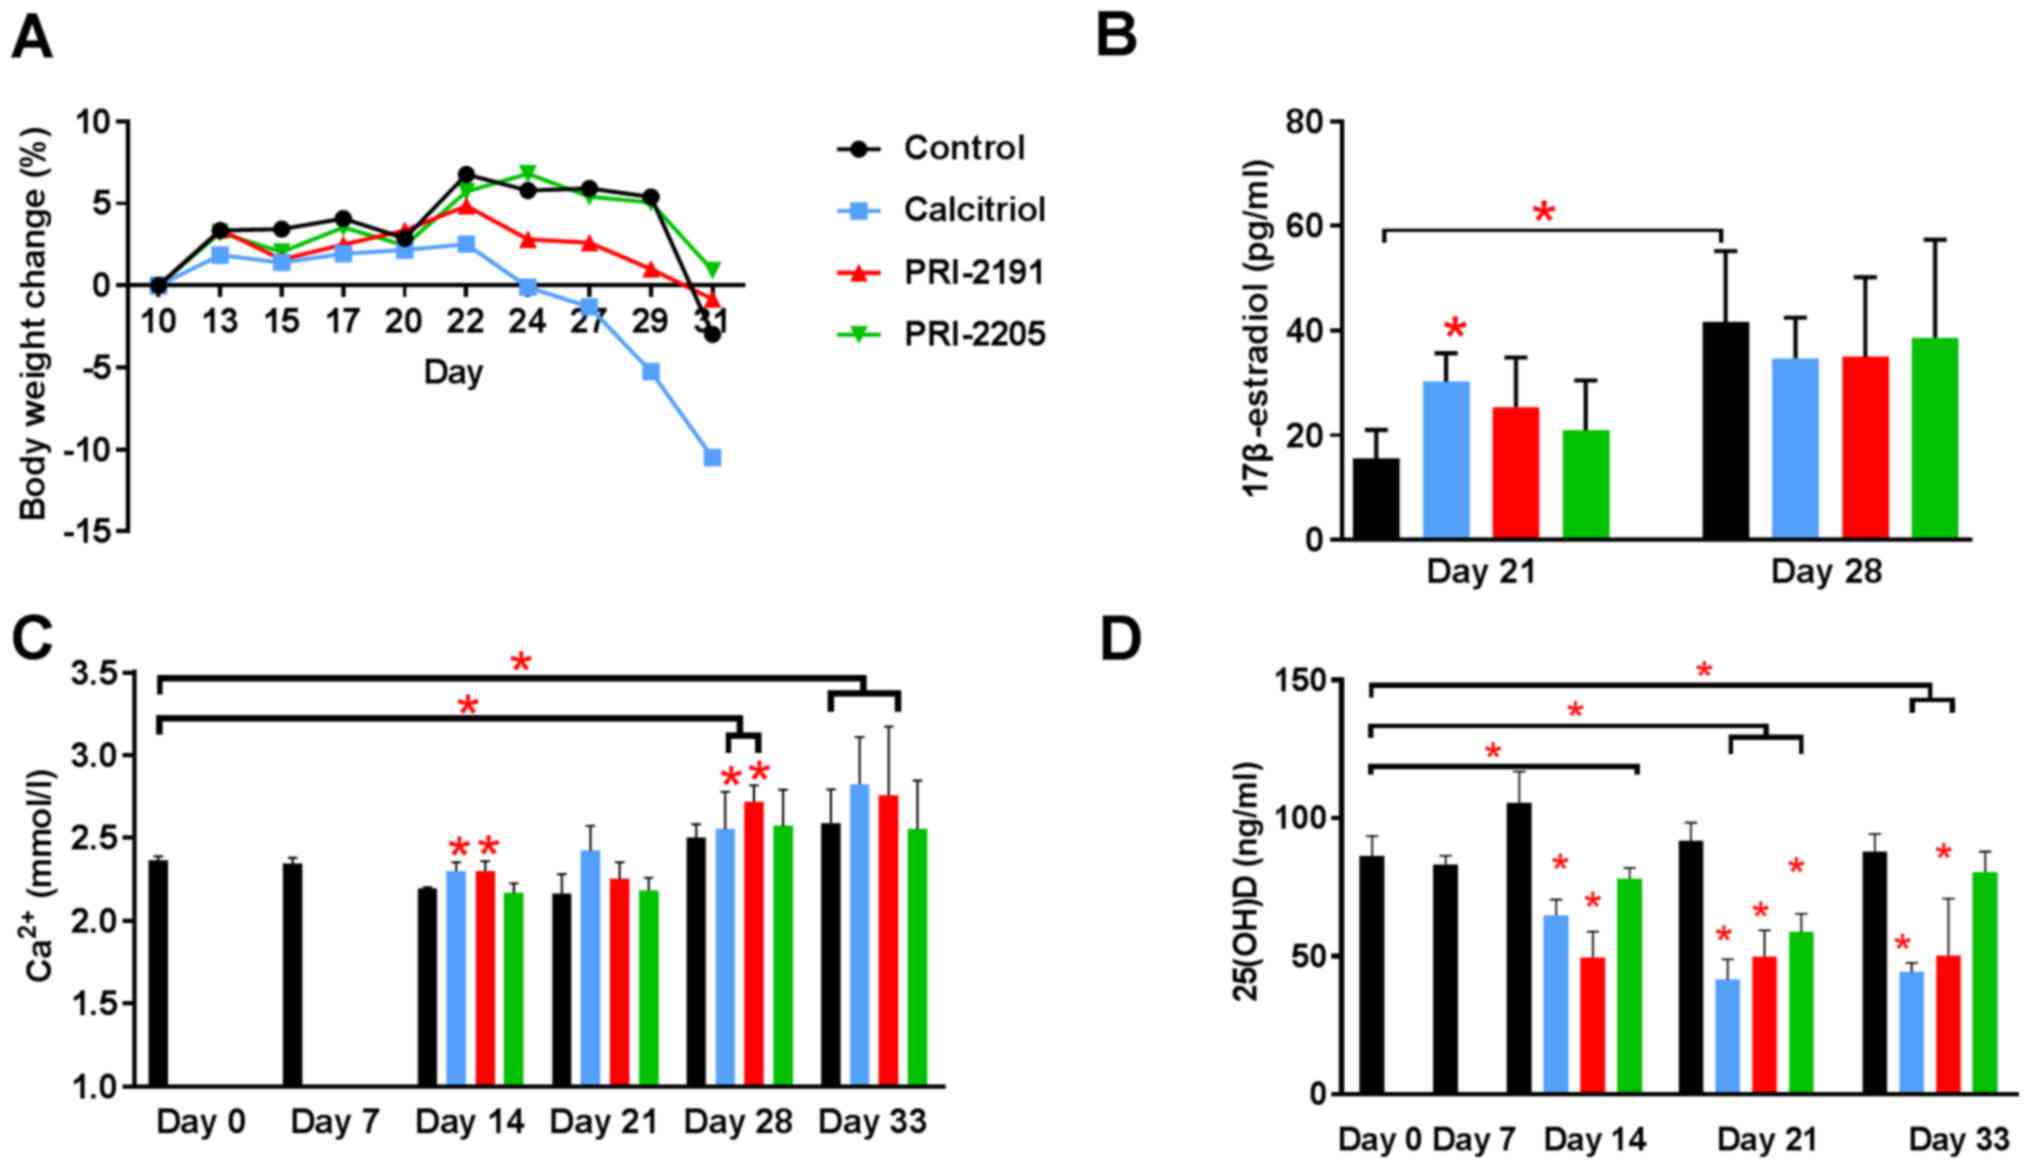 | Figure 3Body weight changes and blood
calcium, 17β-estradiol, and 25(OH)D level in 4T1 tumor-bearing
mice. (A) Body weight changes (BWCs) and (B) 17β-estradiol, (C)
blood calcium, and (D) 25(OH)D level in mouse plasma. Mice were
inoculated orthotopically with 4T1 cells on day 0. From day 7 (7
days after tumor inoculation), vitamin D analogs were administered
subcutaneously (s.c.) thrice a week. The single dose of compounds
was as follows: calcitriol, 0.5 µg/kg; PRI-2191, 1.0
µg/kg; and PRI-2205, 10.0 µg/kg. Number of mice were
5–7 per group. D0, control, healthy mice; D7, 4T1 tumor-bearing
non-treated mice 7 days after tumor transplantation. Mean values
with standard deviation (SD) are presented. Color bars, black,
control animals; blue, calcitriol; red, PRI-2191; green, PRI-2205.
Statistical analysis: (B) Mann-Whitney U test. (C and D) Dunnett's
multiple comparisons test; significant differences are marked on
the figure: *P<0.05 as compared to control animals on
the relevant day of treatment, or as indicated by fastener. The
decrease in BWC observed in (A) from day 24 until the last day of
measurements is caused by the calcitriol toxicity (blue line). The
mean body weight decreased in ~10.5% when compared to control mice
(A). We considered the treatment to be toxic if the BWC decreased
by ~20% in two successive measurements. |
From day 28, an increase in calcium level was
observed in both control (as a result of tumor progression) and
treated mice. On day 33, serum calcium level was found to be
significantly higher in control tumor-bearing mice than in healthy
mice (day 0; Fig. 3C). Calcitriol
and PRI-2191 significantly increased calcium level on days 14 and
28 when compared to relevant control tumor-bearing mice
(P<0.05). The elevation of calcium level was also significant in
mice treated with these compounds on days 28 and 33 when compared
to healthy animals. In parallel, measurements of 25(OH)D in plasma
showed significant decrease of 25(OH)D in mice treated with all
agents (day 21) or in mice treated with calcitriol or PRI-2191 at
all days of measurements (Fig.
3D).
The plasma concentration of 17β-estradiol was found
to be significantly increased in control mice from days 21 to 28.
Calcitriol on day 21 caused increase in plasma 17β-estradiol level
when compared to control mice (P<0.05). Both analogs showed
similar tendency (Fig. 3B).
Calcitriol and its analogs normalized
tumor vasculature of 4T1 mammary gland cancer
We estimated the influence of calcitriol and its
analogs on tumor angiogenesis. The results of the intravital
ultrasound imaging of blood flow in tumor tissue as reflected by
peak-enhancement and time-to-peak parameter values indicate that
all compounds enhanced tumor blood perfusion (Fig. 4A–C). Calcitriol and its analogs
significantly enhanced the time-to-peak parameter (mean value for
control mice was 11.59 sec and mean value for mice treated with
calcitriol, PRI-2191, and PRI-2205 was 13.76, 13.62 and 13.81 sec,
respectively, P<0.05; Fig. 4A).
After treatment with calcitriol, we observed statistically
significant increase in case of values of peak-enhancement
parameter when compared to the control group of animals [8.49
l.a.u. (linear arbitrary units) vs. 2.84 l.a.u.; Fig. 4B].
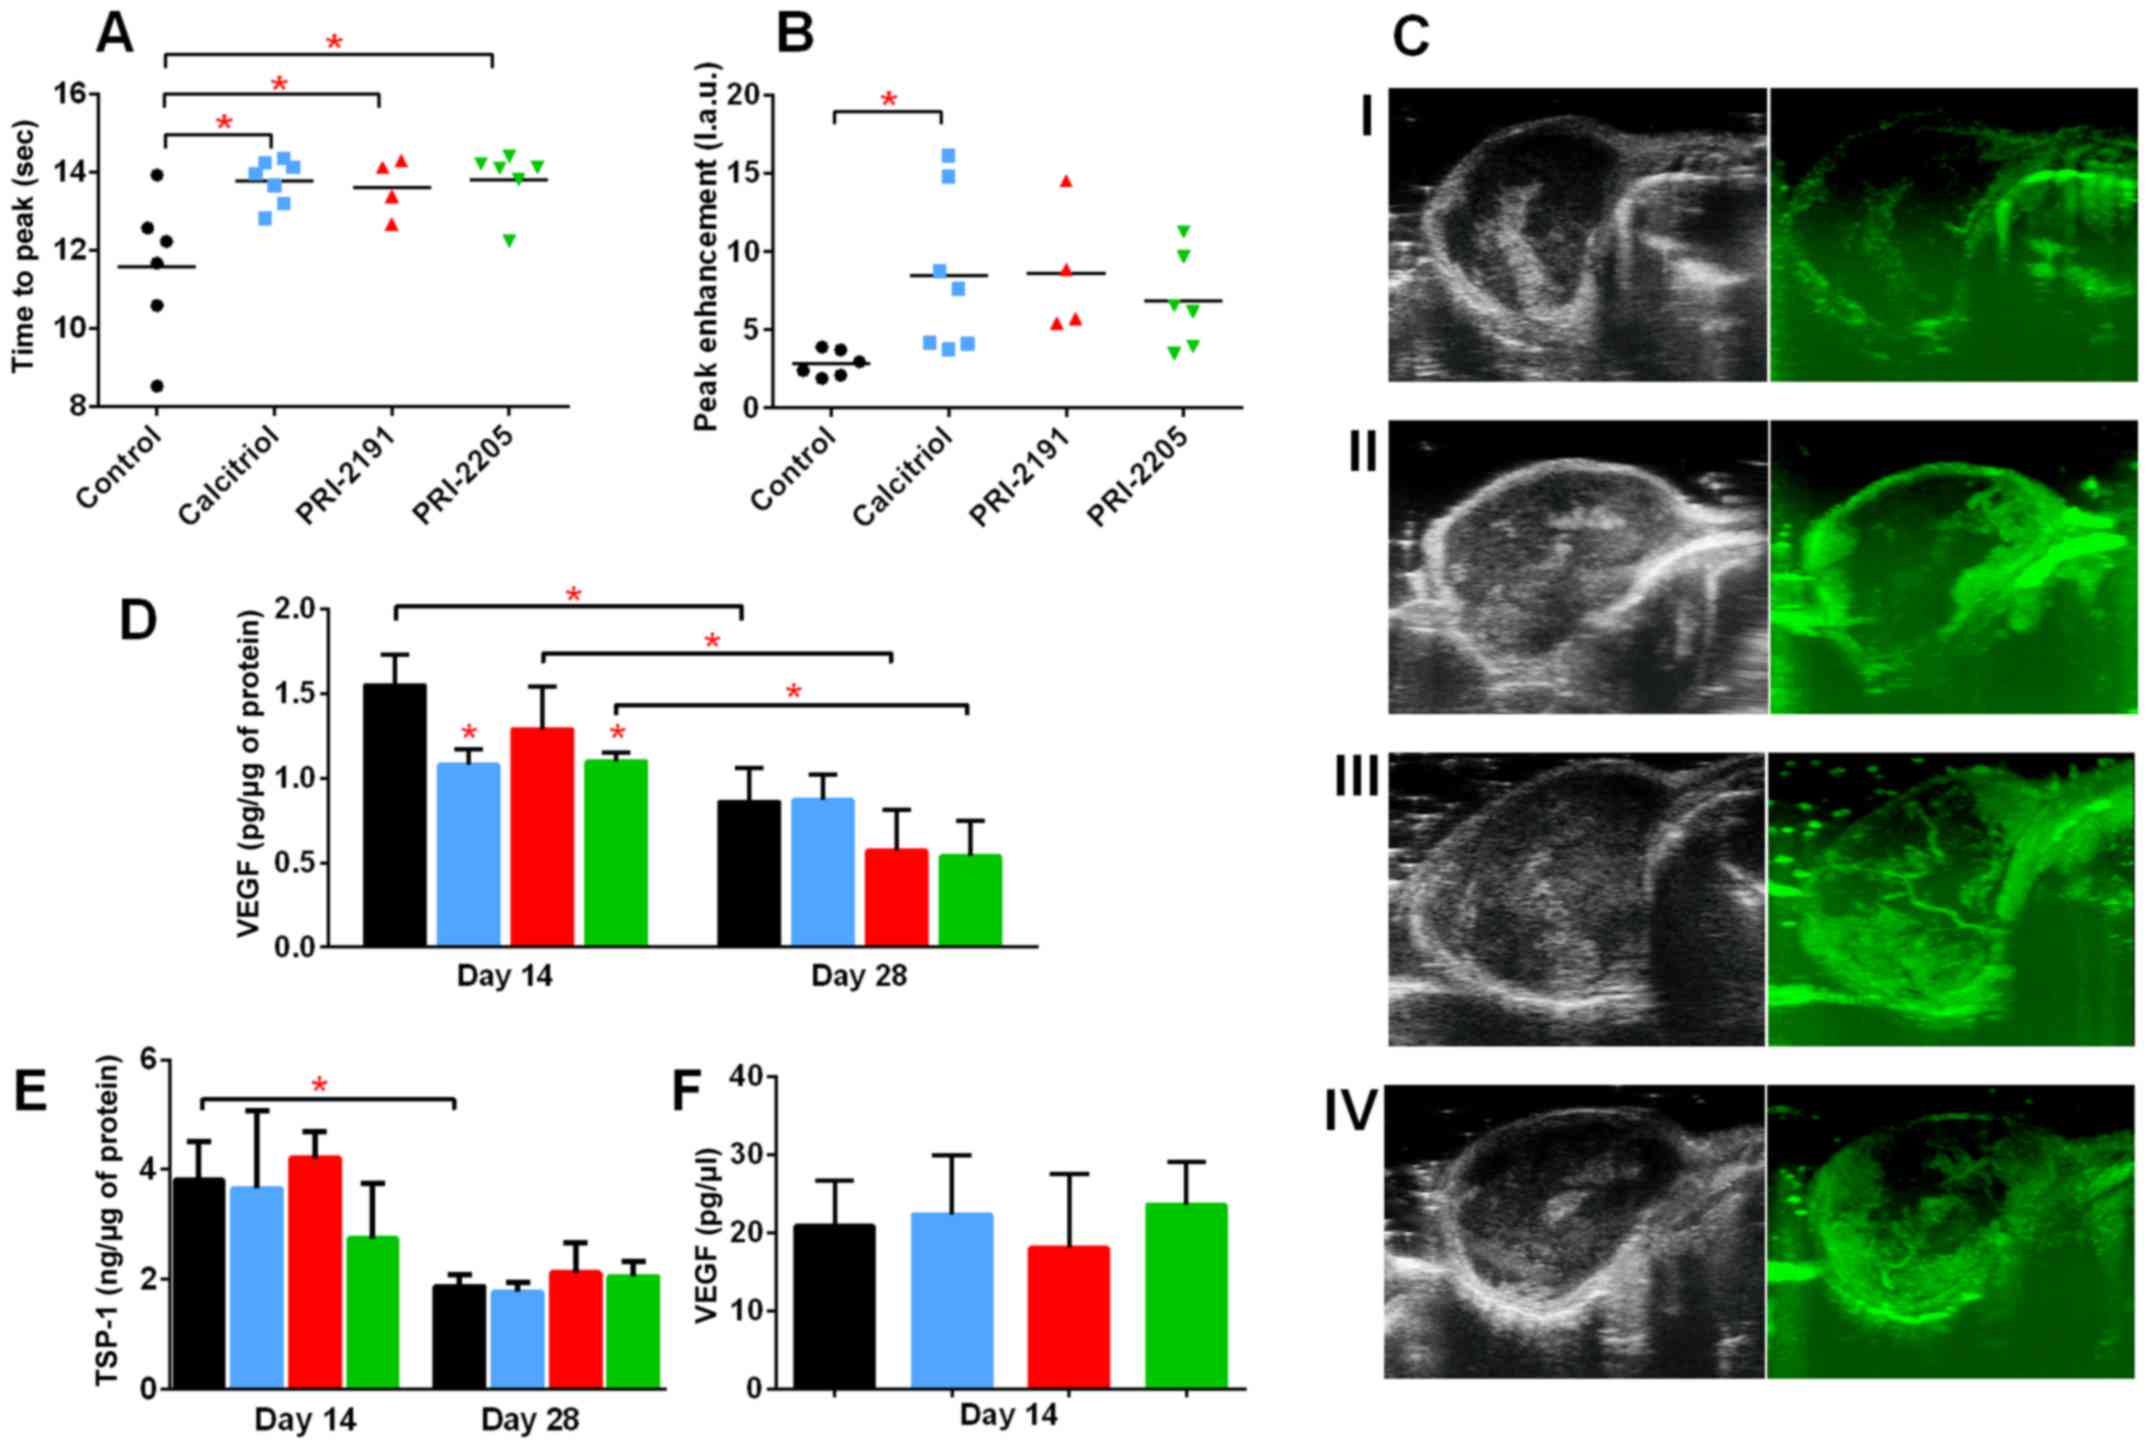 | Figure 4Influence of calcitriol, PRI-2191,
and PRI-2205 on angiogenesis of 4T1 tumor. Tumor blood perfusion
estimated by ultrasound imaging as (A) time to peak and (B)
peak-enhancement values measured on day 24 after 4T1 mammary gland
cancer inoculation. (C) Representative images of tumor perfusion
taken for (I) control group, (II) mice treated with calcitriol,
(III) PRI-2191, and (IV) mice treated with PRI-2205. (D) VEGF level
in tumor tissue. (E) Thrombospondin 1 (TSP-1) tumor tissue level.
(F) VEGF plasma level measured on day 14. Mice were inoculated
orthotopically with 4T1 cells on day 0. From day 7 (7 days after
tumor inoculation), vitamin D analogs were administered
subcutaneously (s.c.) thrice a week. The single dose of compounds
were as follows: calcitriol, 0.5 µg/kg; PRI-2191, 1.0
µg/kg; and PRI-2205, 10.0 µg/kg. Number of mice
evaluated were 4–7 per group. Color bars, black, control animals;
blue, calcitriol; red, PRI-2191; green, PRI-2205. Data
presentation: (A and B) Data for individual animals with median
line. (C) Representative ultrasound images: left panel, before;
right panel, after contrast inoculation. (D and E) Mean ± standard
deviation. Statistical analysis: (A and B) Dunnett's multiple
comparisons test. (D) Tukey's multiple comparison test. (E) Sidak's
multiple comparison test. *P<0.05 as compared to
control animals on the relevant day of treatment. |
Simultaneously, we observed a significant decrease
in VEGF levels in tumor tissue after treatment with calcitriol
(1.08 pg/µg) and PRI-2205 (1.10 pg/µg) on day 14 when
compared to the control mice (1.55 pg/µg; P<0.05). On day
28, we observed statistically significant decrease in VEGF levels
in tumor tissue of control mice when compared to day 14. A further
decrease in VEGF levels was observed after treatment with PRI-2191
and PRI-2205 on day 28 (Fig. 4D).
The levels of thrombospondin 1 (TSP-1), an antiangiogenic factor,
in tumor tissue decreased from days 14 to 28; however, its levels
were not affected by treatment with calcitriol or its analogs
(Fig. 4E). VEGF level in plasma on
day 14 was not influenced by the treatments used in this study
(Fig. 4F).
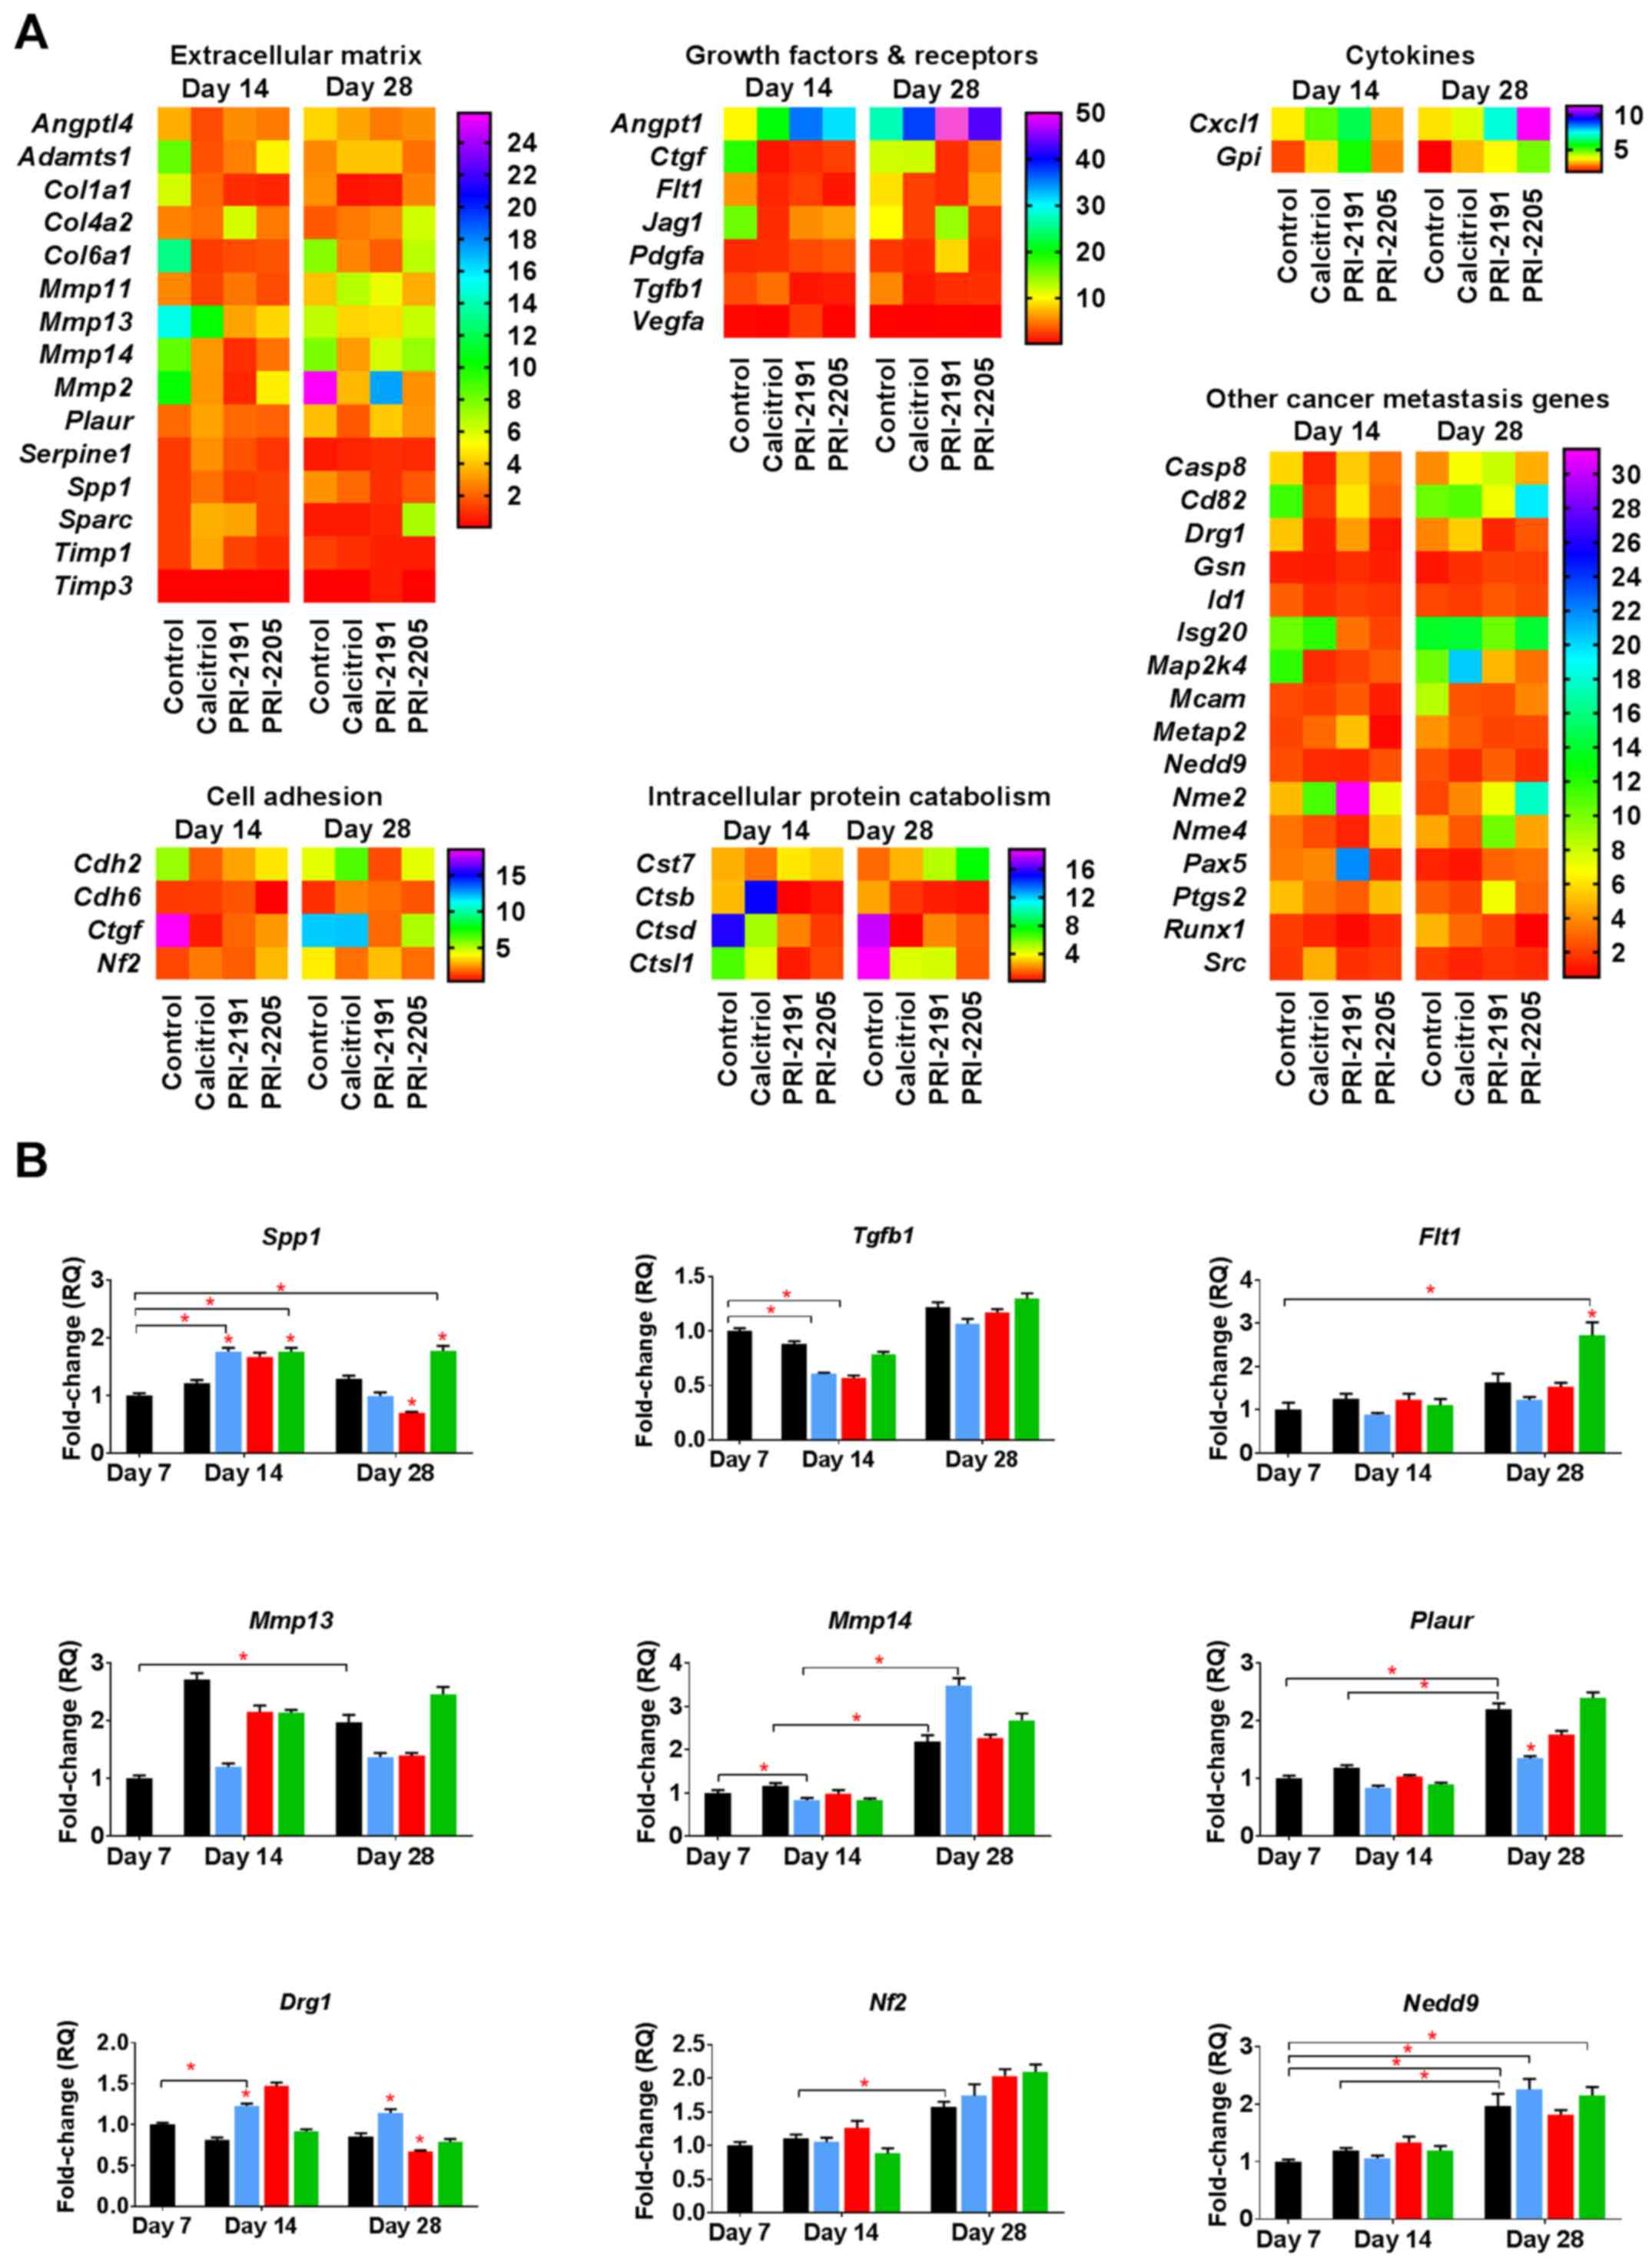
Induction of OPN mRNA (Spp1) by
calcitriol and its analogs during the early phase of tumor
progression
To identify the candidate genes that might be
regulated by calcitriol and its analogs in the process of enhanced
metastatic dissemination of 4T1 cells, polymerase chain reaction
(PCR) array screening was performed (88 tested genes listed in
Table III). Data were analyzed
for transcripts from tumors taken from mice at two time points: on
day 14 and on day 28 after 4T1 tumor inoculation. We observed the
expression of 46 out of 88 genes screened. The candidate genes were
selected for further examination based on fold change compared to
its expression in non-treated tumors [day 7, relative
quantification (RQ) values presented in Table IV]. The expression of selected
genes in tumor tissues was confirmed by real-time PCR analysis.
| Table IVThe expression of genes associated
with tumor invasion or metastasis evaluated in 4T1 tumor tissue
after treatment with calcitriol or its analogs. |
Table IV
The expression of genes associated
with tumor invasion or metastasis evaluated in 4T1 tumor tissue
after treatment with calcitriol or its analogs.
| Gene | Control
| Calcitriol
| PRI-2191
| PRI-2205
|
|---|
| D14 | D28 | D14 | D28 | D14 | D28 | D14 | D28 |
|---|
| Adamts1 | 8.300 | 2.754 | 1.653 | 3.996 | 2.534 | 4.028 | 4.959 | 2.247 |
| Angpt14 | 3.526 | 4.325 | 1.528 | 3.342 | 2.861 | 2.468 | 2.500 | 2.897 |
| Casp8 | 5.738 | 3.931 | 1.368 | 6.865 | 5.412 | 8.016 | 3.174 | 4.734 |
| Cd82 | 11.476 | 10.293 | 1.929 | 10.865 | 6.052 | 7.078 | 2.786 | 19.504 |
| Cdh2 | 5.481 | 4.407 | 1.680 | 6.547 | 2.697 | 1.434 | 3.685 | 4.377 |
| Cdh6 | 1.201 | 1.030 | 1.249 | 2.244 | 1.588 | 1.928 | 0.394 | 1.578 |
| Col1a1 | 6.035 | 2.921 | 2.069 | 0.362 | 0.899 | 0.486 | 0.750 | 2.647 |
| Col4a2 | 2.637 | 1.809 | 2.193 | 2.434 | 6.010 | 2.839 | 2.444 | 6.133 |
| Col6a1 | 13.012 | 7.619 | 1.252 | 2.712 | 1.534 | 1.842 | 1.714 | 6.557 |
| Cst7 | 2.669 | 1.666 | 1.801 | 2.727 | 3.533 | 4.933 | 3.064 | 7.574 |
| Ctgf | 18.556 | 12.008 | 0.763 | 12.120 | 1.835 | 1.888 | 2.538 | 5.185 |
| Ctsb | 2.843 | 2.500 | 15.140 | 0.892 | 0.122 | 0.555 | 0.445 | 0.363 |
| Ctsd | 15.520 | 18.011 | 5.140 | 0.107 | 1.989 | 2.080 | 0.928 | 1.434 |
| Ctsl1 | 6.498 | 18.792 | 4.327 | 4.351 | 0.483 | 4.482 | 1.148 | 1.396 |
| Cxcl1 | 3.566 | 3.480 | 4.935 | 3.949 | 6.191 | 7.234 | 3.045 | 11.300 |
| Drg1 | 5.292 | 3.740 | 1.290 | 5.493 | 4.317 | 1.452 | 1.086 | 2.584 |
| Flt1 | 5.872 | 8.900 | 1.615 | 2.505 | 2.509 | 1.831 | 0.917 | 6.456 |
| Gpi | 2.334 | 1.812 | 3.471 | 3.173 | 5.454 | 3.675 | 2.774 | 4.742 |
| Gsn | 1.297 | 1.001 | 1.154 | 1.683 | 1.628 | 2.128 | 1.282 | 2.010 |
| Id1 | 2.855 | 2.186 | 1.637 | 1.940 | 2.016 | 2.671 | 1.800 | 2.287 |
| Isg20 | 10.271 | 13.785 | 11.894 | 14.061 | 3.263 | 10.219 | 2.158 | 14.053 |
| Jag1 | 15.663 | 10.047 | 1.784 | 2.597 | 5.598 | 14.129 | 6.377 | 2.102 |
| Map2k4 | 11.770 | 10.176 | 1.522 | 20.272 | 2.063 | 4.953 | 2.779 | 3.258 |
| Mcam | 2.307 | 8.493 | 1.969 | 2.567 | 2.687 | 2.396 | 1.241 | 3.739 |
| Metap2 | 2.103 | 4.064 | 3.050 | 2.800 | 5.150 | 2.149 | 0.694 | 2.286 |
| Mmp11 | 2.748 | 3.962 | 1.375 | 6.656 | 2.389 | 5.574 | 1.547 | 3.540 |
| Mmp13 | 15.092 | 6.512 | 10.286 | 4.299 | 3.337 | 4.448 | 4.385 | 6.341 |
| Mmp14 | 8.438 | 7.808 | 3.079 | 3.122 | 0.959 | 6.057 | 2.347 | 7.366 |
| Mmp2 | 10.257 | 25.839 | 3.043 | 3.718 | 0.801 | 17.339 | 4.869 | 2.932 |
| Nedd9 | 2.397 | 2.421 | 1.531 | 1.521 | 1.444 | 2.846 | 2.414 | 1.673 |
| Nf2 | 1.385 | 3.778 | 2.141 | 1.982 | 1.685 | 3.101 | 3.024 | 1.919 |
| Nme2 | 5.052 | 2.180 | 11.167 | 3.796 | 31.448 | 7.117 | 7.194 | 17.671 |
| Nme4 | 3.300 | 4.548 | 2.309 | 2.692 | 1.340 | 10.143 | 5.289 | 4.507 |
| Pax5 | 3.510 | 1.350 | 3.781 | 1.025 | 21.864 | 2.887 | 1.547 | 3.213 |
| Pdgfa | 1.667 | 2.270 | 2.002 | 1.580 | 2.965 | 8.540 | 3.473 | 1.574 |
| Plaur | 2.109 | 3.874 | 3.297 | 1.785 | 2.146 | 4.060 | 1.998 | 3.030 |
| Ptgs2 | 5.118 | 2.797 | 3.370 | 2.149 | 2.776 | 7.053 | 5.086 | 2.962 |
| Runx1 | 1.982 | 4.925 | 1.420 | 3.090 | 0.747 | 2.129 | 1.540 | 0.521 |
|
Serpine1 | 1.164 | 0.524 | 2.918 | 0.733 | 1.662 | 0.931 | 1.091 | 0.830 |
| Sparc | 1.237 | 0.486 | 3.572 | 0.545 | 3.355 | 0.798 | 1.319 | 6.911 |
| Spp1 | 1.198 | 2.990 | 2.287 | 2.118 | 1.227 | 0.982 | 1.367 | 1.744 |
| Src | 1.846 | 1.898 | 4.773 | 1.321 | 1.676 | 1.769 | 1.927 | 1.547 |
| Tgfb1 | 3.058 | 5.330 | 4.415 | 1.100 | 0.940 | 1.817 | 1.187 | 2.014 |
| Timp1 | 1.248 | 1.303 | 3.395 | 0.987 | 1.362 | 0.655 | 0.891 | 0.583 |
| Timp3 | 0.068 | 0.019 | 0.054 | 0.037 | 0.095 | 0.602 | 0.043 | 0.064 |
| Vegfa | 0.307 | 0.155 | 0.224 | 0.092 | 2.461 | 0.150 | 0.208 | 0.100 |
Calcitriol and its analogs downregulated the
expression of some genes coding growth factors and their receptors
involved in tumor angiogenesis, the expression of which increased
during 4T1 tumor progression [vascular endothelial growth factor
receptor 1 (Flt1), transforming growth factor β1
(Tgfb1)]. However, the expression of connective tissue
growth factor (Ctgf) and platelet-derived growth factor α
(Pdgfa) was increased after treatment with calcitriol and
its analogs (Fig. 5A). The
expression of type VI collagen α1 (Col6a1) and matrix
metallopeptidases 13 and 14 (Mmp13 and Mmp14)
decreased, whereas the expression of Mmp2 increased in
control tumor tissue between days 14 and 28 of tumor growth.
Calcitriol and its analogs showed tendency to reduce the
aforementioned gene mRNA levels when compared to control (Fig. 5A). Calcitriol and its analogs also
decreased the expression of angiopoietin-like 4 gene
(Angptl4; on both days 14 and 28 of measurement) and
secreted phosphoprotein 1 (OPN; Spp1; on day 28). Increased
expression of non-metastatic cells 2 (Nme2), chemokine
(C-X-C motif) ligand 1 (Cxcl1), and cystatin F
(leukocystatin; Cst7) in tumors from mice treated with all
compounds was observed. However, developmentally regulated GTP
binding protein 1 (Drg1), cathepsins B and D (Ctsb
and Ctsd), and Ctgf were downregulated by the
administration of calcitriol and its analogs (except Ctsb
after calcitriol treatment on day 14) (Fig. 5A).
We performed real-time PCR analysis of the following
nine selected mRNAs: Drg1, Flt1, Spp1, neurofibromin 2
(merlin; Nf2), neural precursor cell expressed, dev.
downregulated 9 (Nedd9), Mmp13, Mmp14, Tgfb and
plasminogen activator, urokinase receptor (Plaur). The
expression of Nf2, Nedd9, Mmp13, Mmp14 and Plaur
significantly increased during tumor progression; however,
calcitriol or its analogs (with the exception of upregulation of
Flt1 by PRI-2205 and downregulation of Plaur by
calcitriol) did not influence the expression of aforementioned
mRNAs significantly. The mRNAs that were significantly influenced
by calcitriol and its analogs were Spp1 and Drg1. The
expression of Spp1 was significantly upregulated in tumor
tissue by calcitriol and PRI-2205 on day 14 and by PRI-2205 on day
28. PRI-2191 downregulated Spp1 on day 28 (Fig. 5B). The expression of Drg1
(also known as Nedd3) was increased after treatment with
calcitriol on days 14 and 28, but it decreased after treatment with
PRI-2191 on day 28. In addition, significant decrease in the
expression of Tgfb was observed in mice treated with
calcitriol and PRI-2191 on day 14 when compared to control mice
bearing tumors on day 7 (Fig.
5B).
Selected protein expression in tumors
harvested from the mice treated with calcitriol and its
analogs
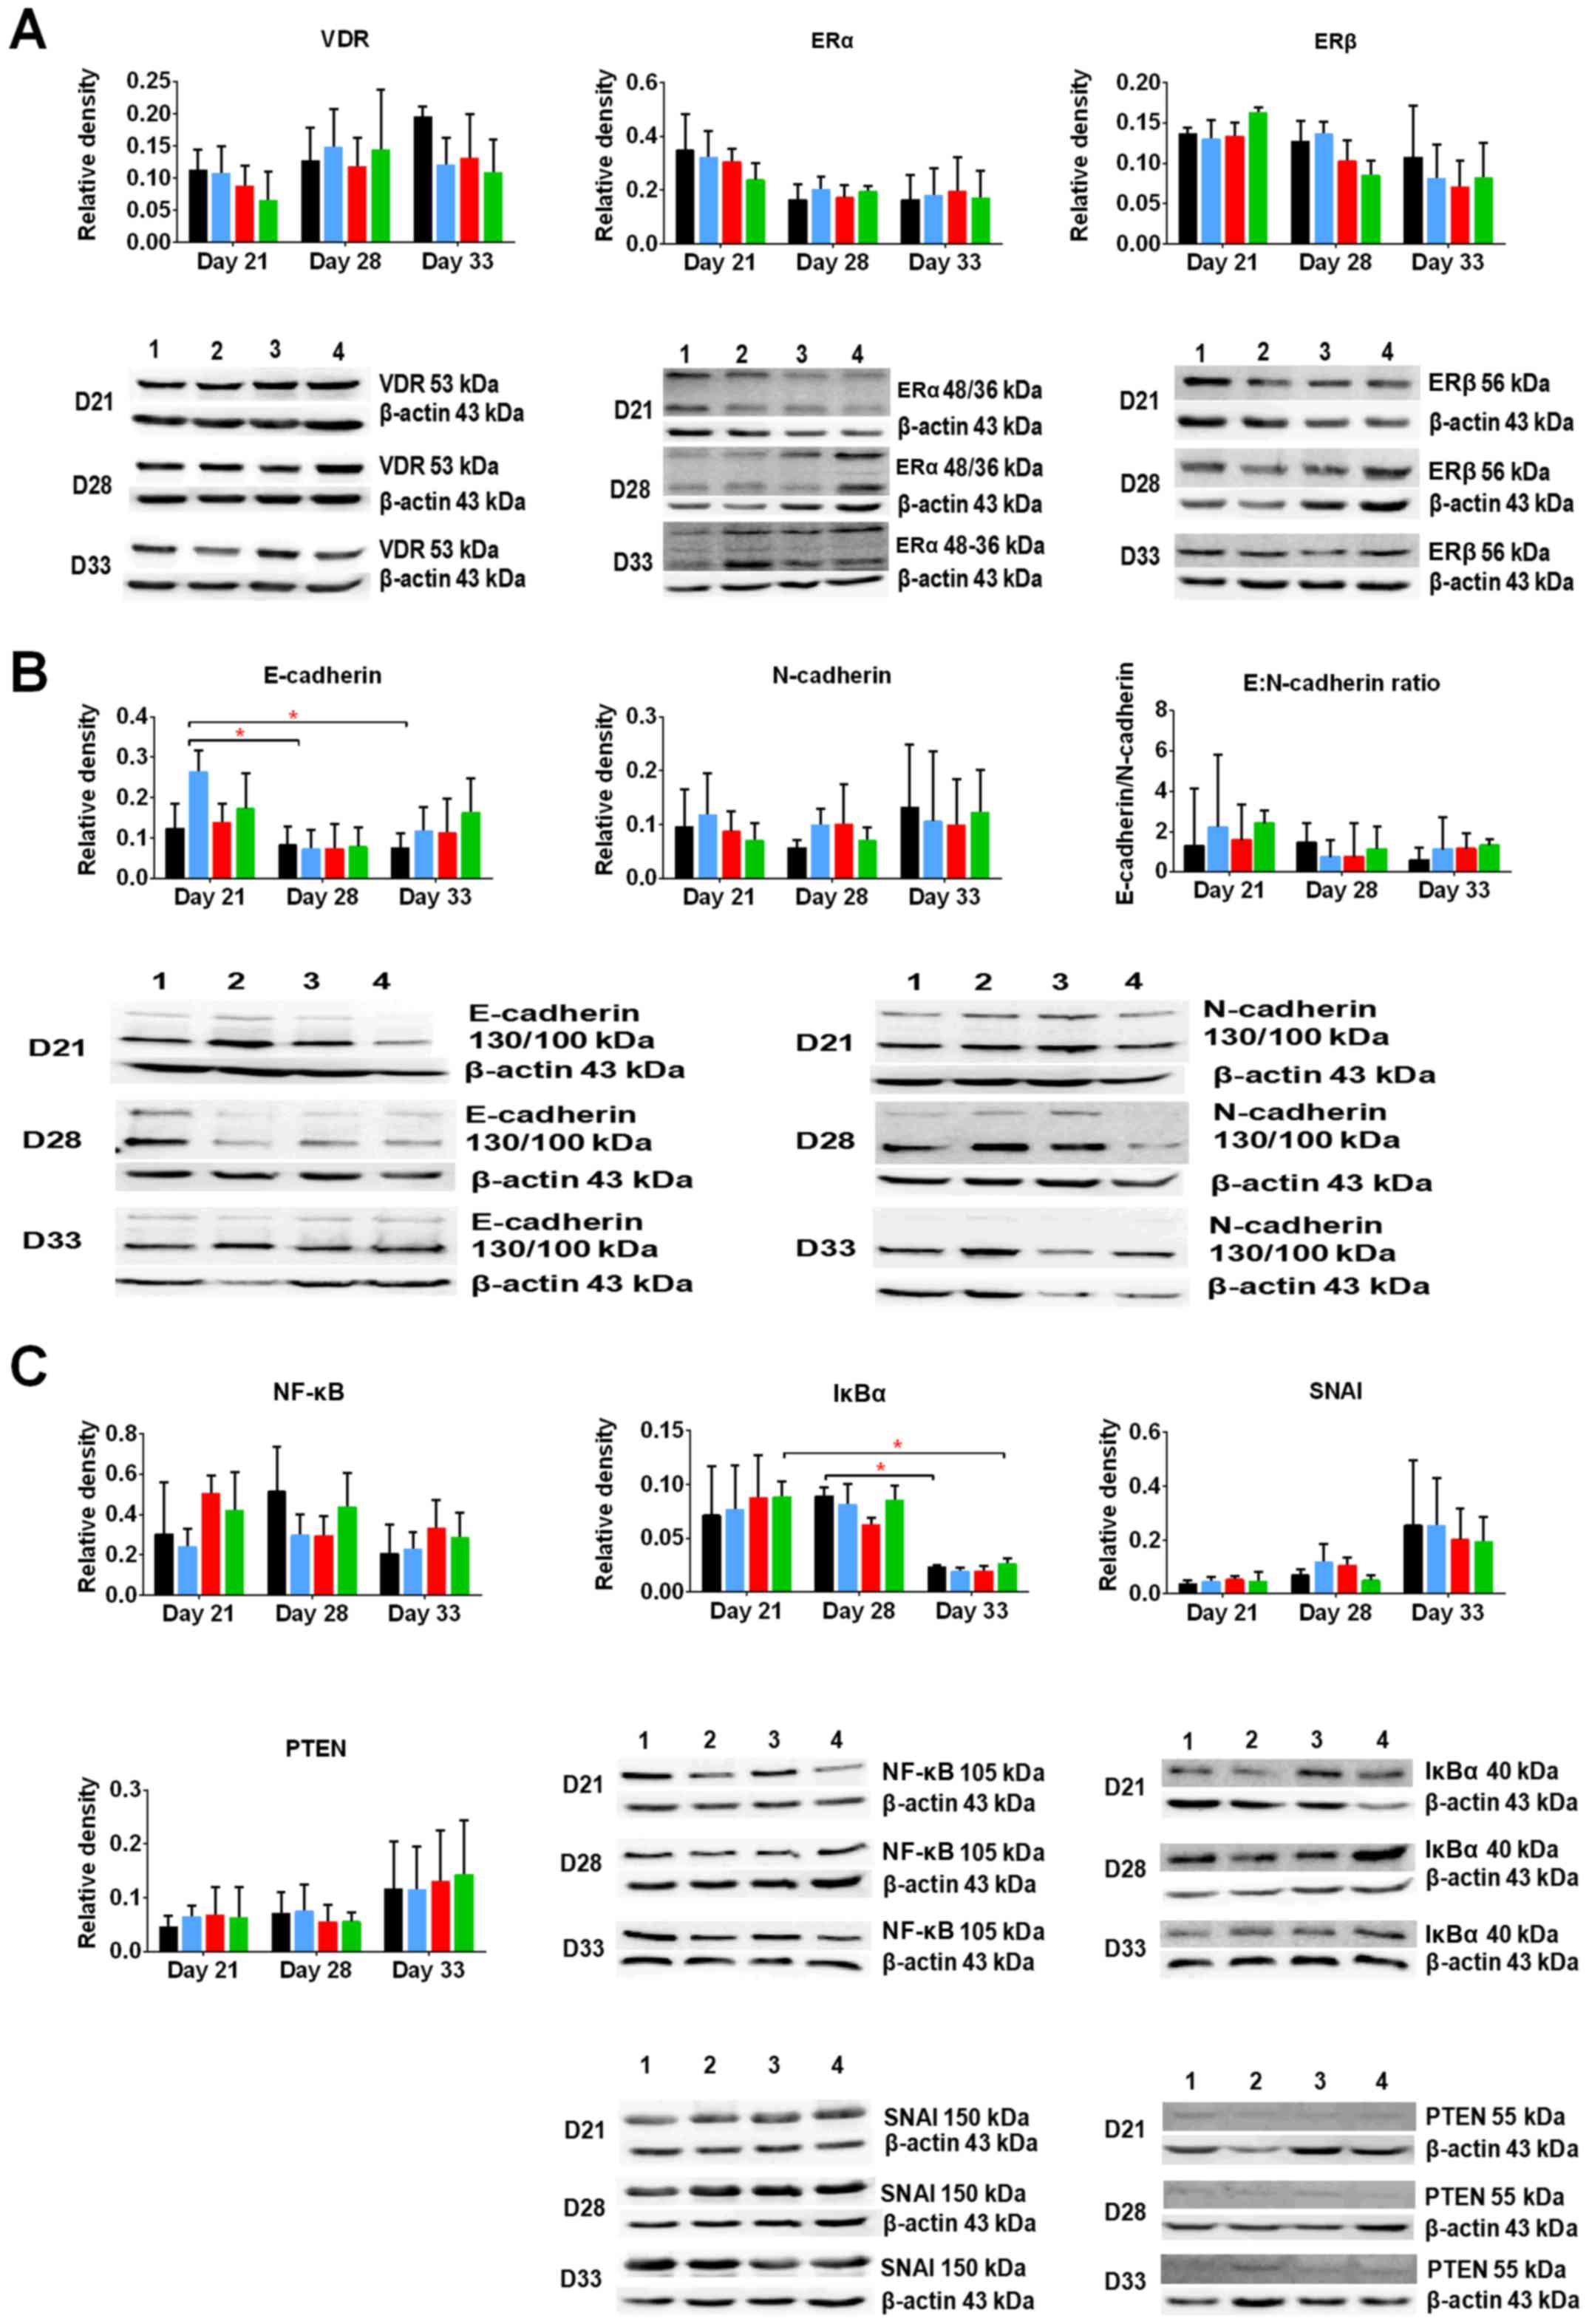
First, we estimated the expression of the following
receptors and transcription factors known as typical for calcitriol
and/or typical for mammary gland cancer: VDR and retinoid X
receptor (RXR), estrogen receptors ERα and β, nuclear factor κB
(NFκB), inhibitor of κB (IκB), phosphatase and tensin homolog
(PTEN), snail family transcriptional repressor 1 (SNAI1), as well
as E- and N-cadherin - markers of epithelial to mesenchymal
transition (EMT).
VDR level increased during 4T1 tumor progression. In
this study, calcitriol and its analogs decreased the levels of VDR
(Fig. 6A). ERα level was decreased
during 4T1 progression, whereas ERβ level remained unchanged.
Furthermore, calcitriol and its analogs decreased the levels of ERβ
on days 28 and 33 (Fig. 6A).
On day 21, a 2.5-fold increase in the ratio of
E:N-cadherin in tumor tissues of mice administered with calcitriol
and its analogs was observed. In control tumors, this ratio was ~1.
However, during tumor growth progression, the ability of calcitriol
and its analogs to increase the ratio of E:N-cadherin was not
observed (Fig. 6B).
In this study, we evaluated also the protein levels
of transcription factors, namely, SNAI1 and PTEN. We found that
their levels increased at the end of the experiment, whereas the
levels of NFκB and IκB increased on day 28 and then rapidly
decreased on day 33. Calcitriol and its analogs did not influence
the levels of SNAI1, PTEN, and IκB, whereas on days 21 and 33,
PRI-2191 and PRI-2205 caused increase in their levels. On day 28,
all studied compounds decreased the levels of NFκB (Fig. 6C).
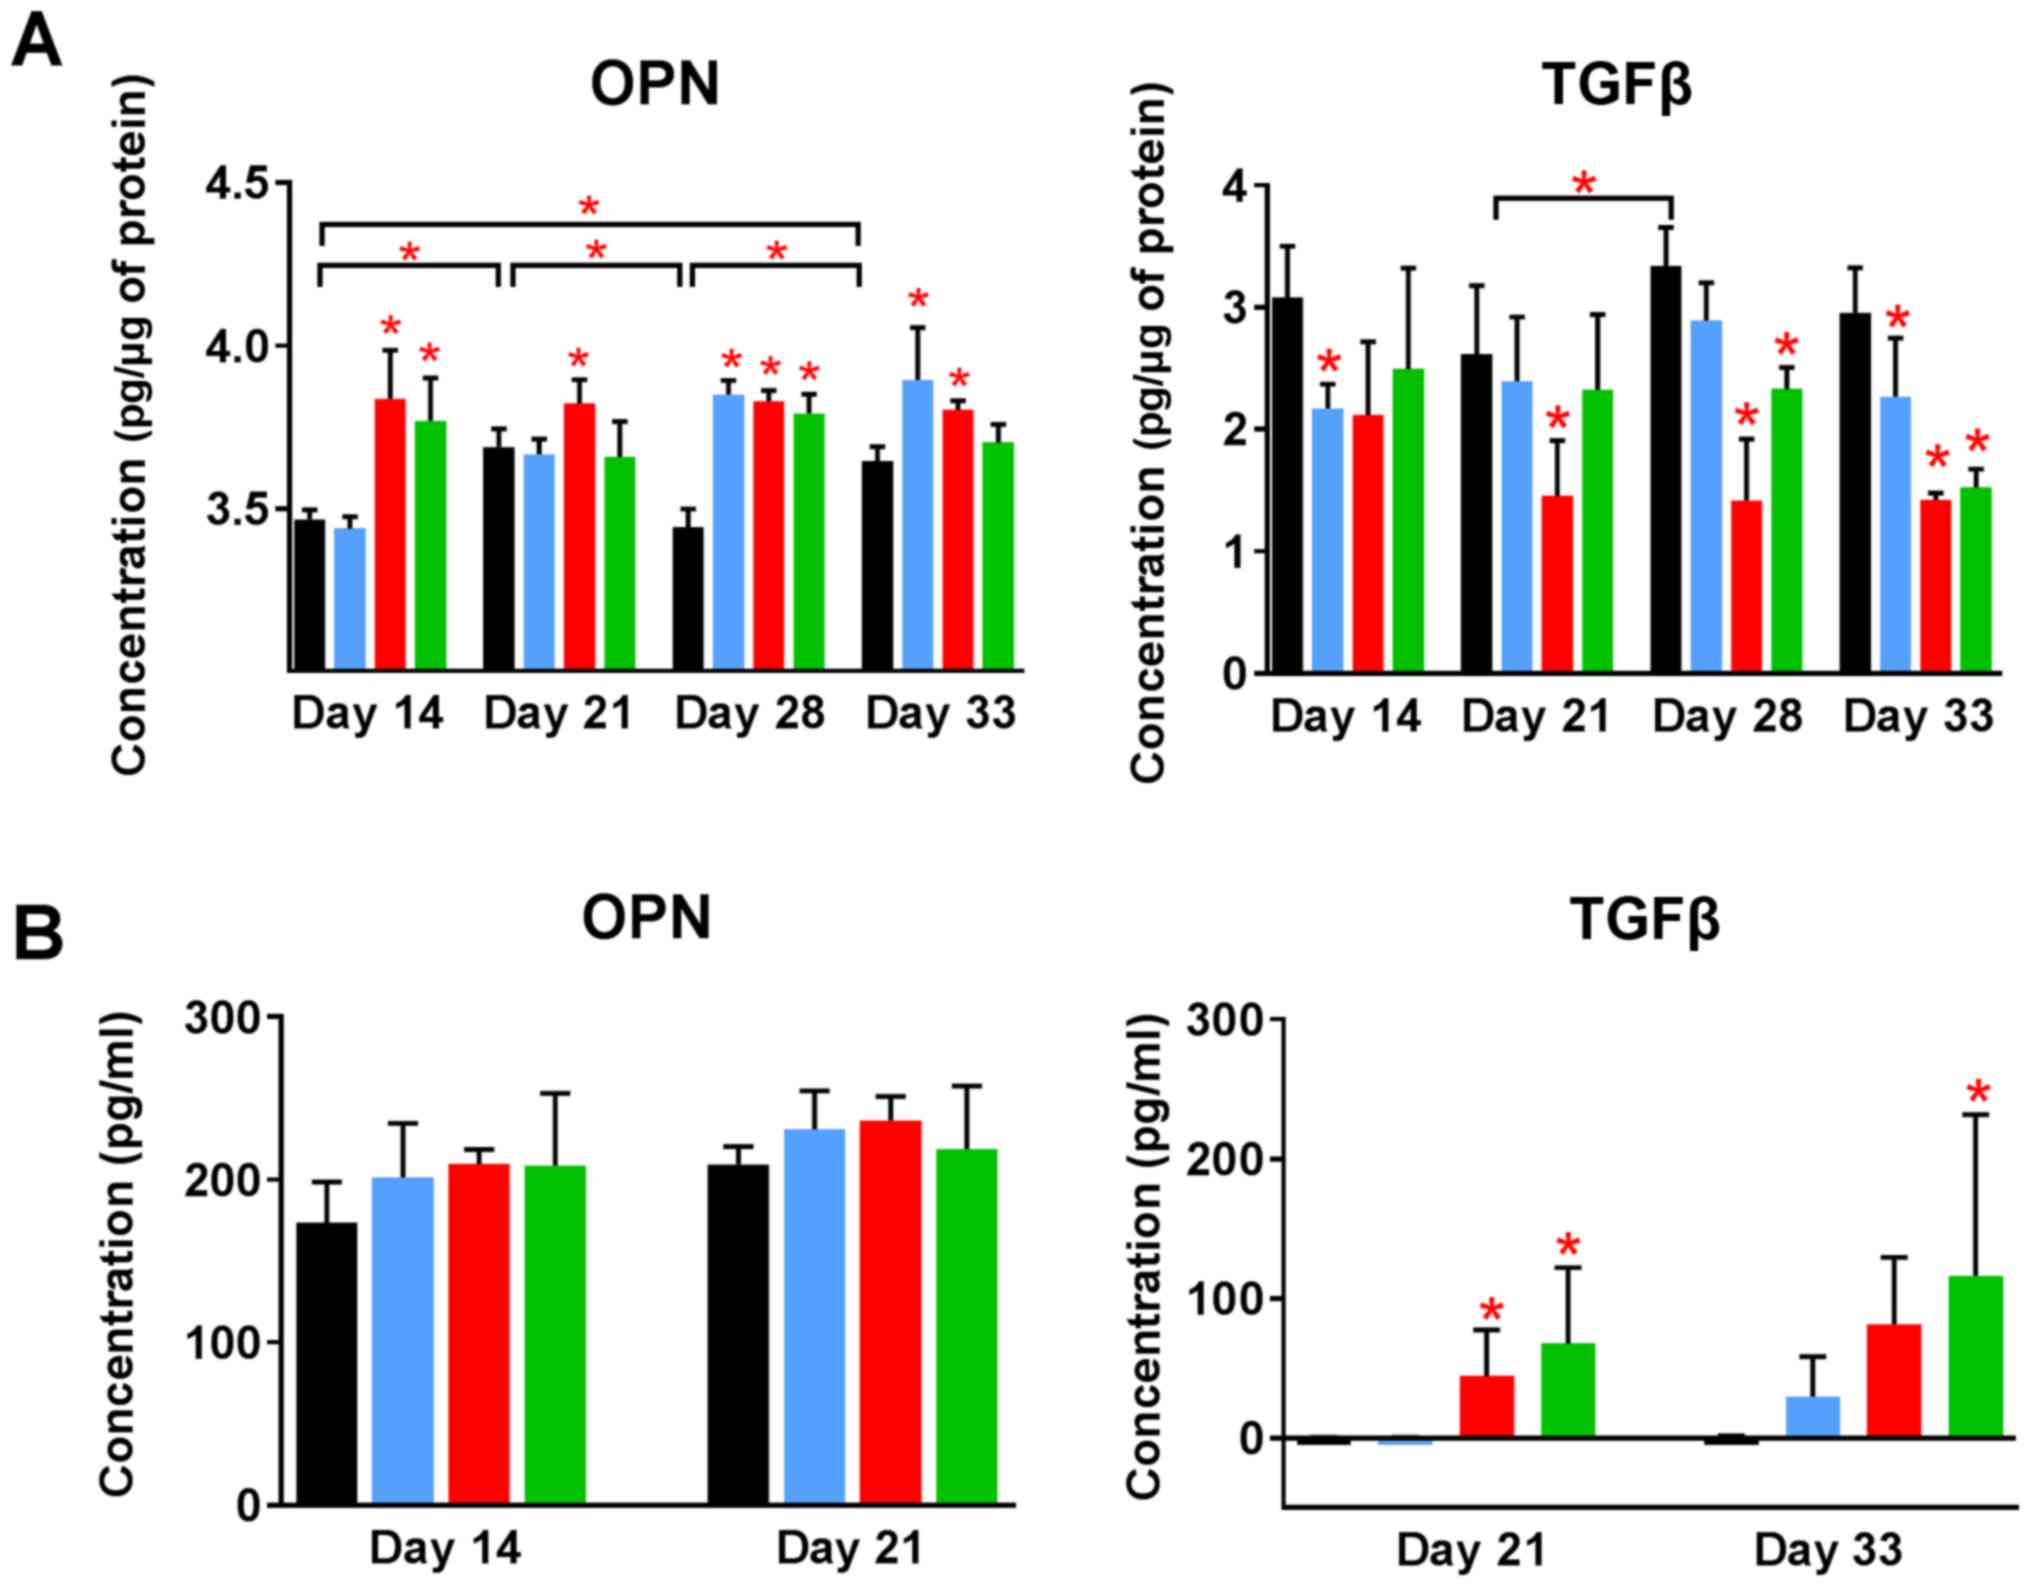
Increased levels of OPN and decreased
levels of transforming growth factor β (TGFβ) in tumor tissue
resulting from the treatment
The level of other proteins in tumor tissue was
analyzed using enzyme-linked immunosorbent assay (ELISA). OPN
levels in control tumors increased significantly during 4T1 tumor
progression. Calcitriol and its analogs further increased its
level. Both analogs elevated OPN level from day 14. Calcitriol
showed some delay in this activity but significantly increased the
levels of OPN from day 28 (Fig.
7A). TGFβ level in tumor tissue was significantly lowered by
treatment using calcitriol and its analogs when compared to control
(Fig. 7A).
Plasma OPN level measured on selected days of
treatment was found to be increased by calcitriol and its analogs,
however, opposite effect was seen in case of TGFβ levels in plasma.
TGFβ was undetected in control tumor-bearing mice on days 21 and 33
of treatment, as well as in mice treated with calcitriol on day 21.
PRI-2191 and PRI-2205 increased TGFβ level significantly. TGFβ
level also increased in mice treated with calcitriol (from
undetectable levels in control mice to 30 pg/ml in mice treated
with calcitriol on day 33) (Fig.
7B).
Modulating effect of calcitriol and its
analogs on collagen deposits in tumor and lung tissue
Histochemical analysis of tumors collected from
control mice showed increased collagen deposits in tumor tissue
during neoplastic progression as showed by Masson's trichrome
staining. Treatment with calcitriol and its analogs on day 21
further increased the collagen deposits but the content was
significantly low on day 28 (Fig.
8).
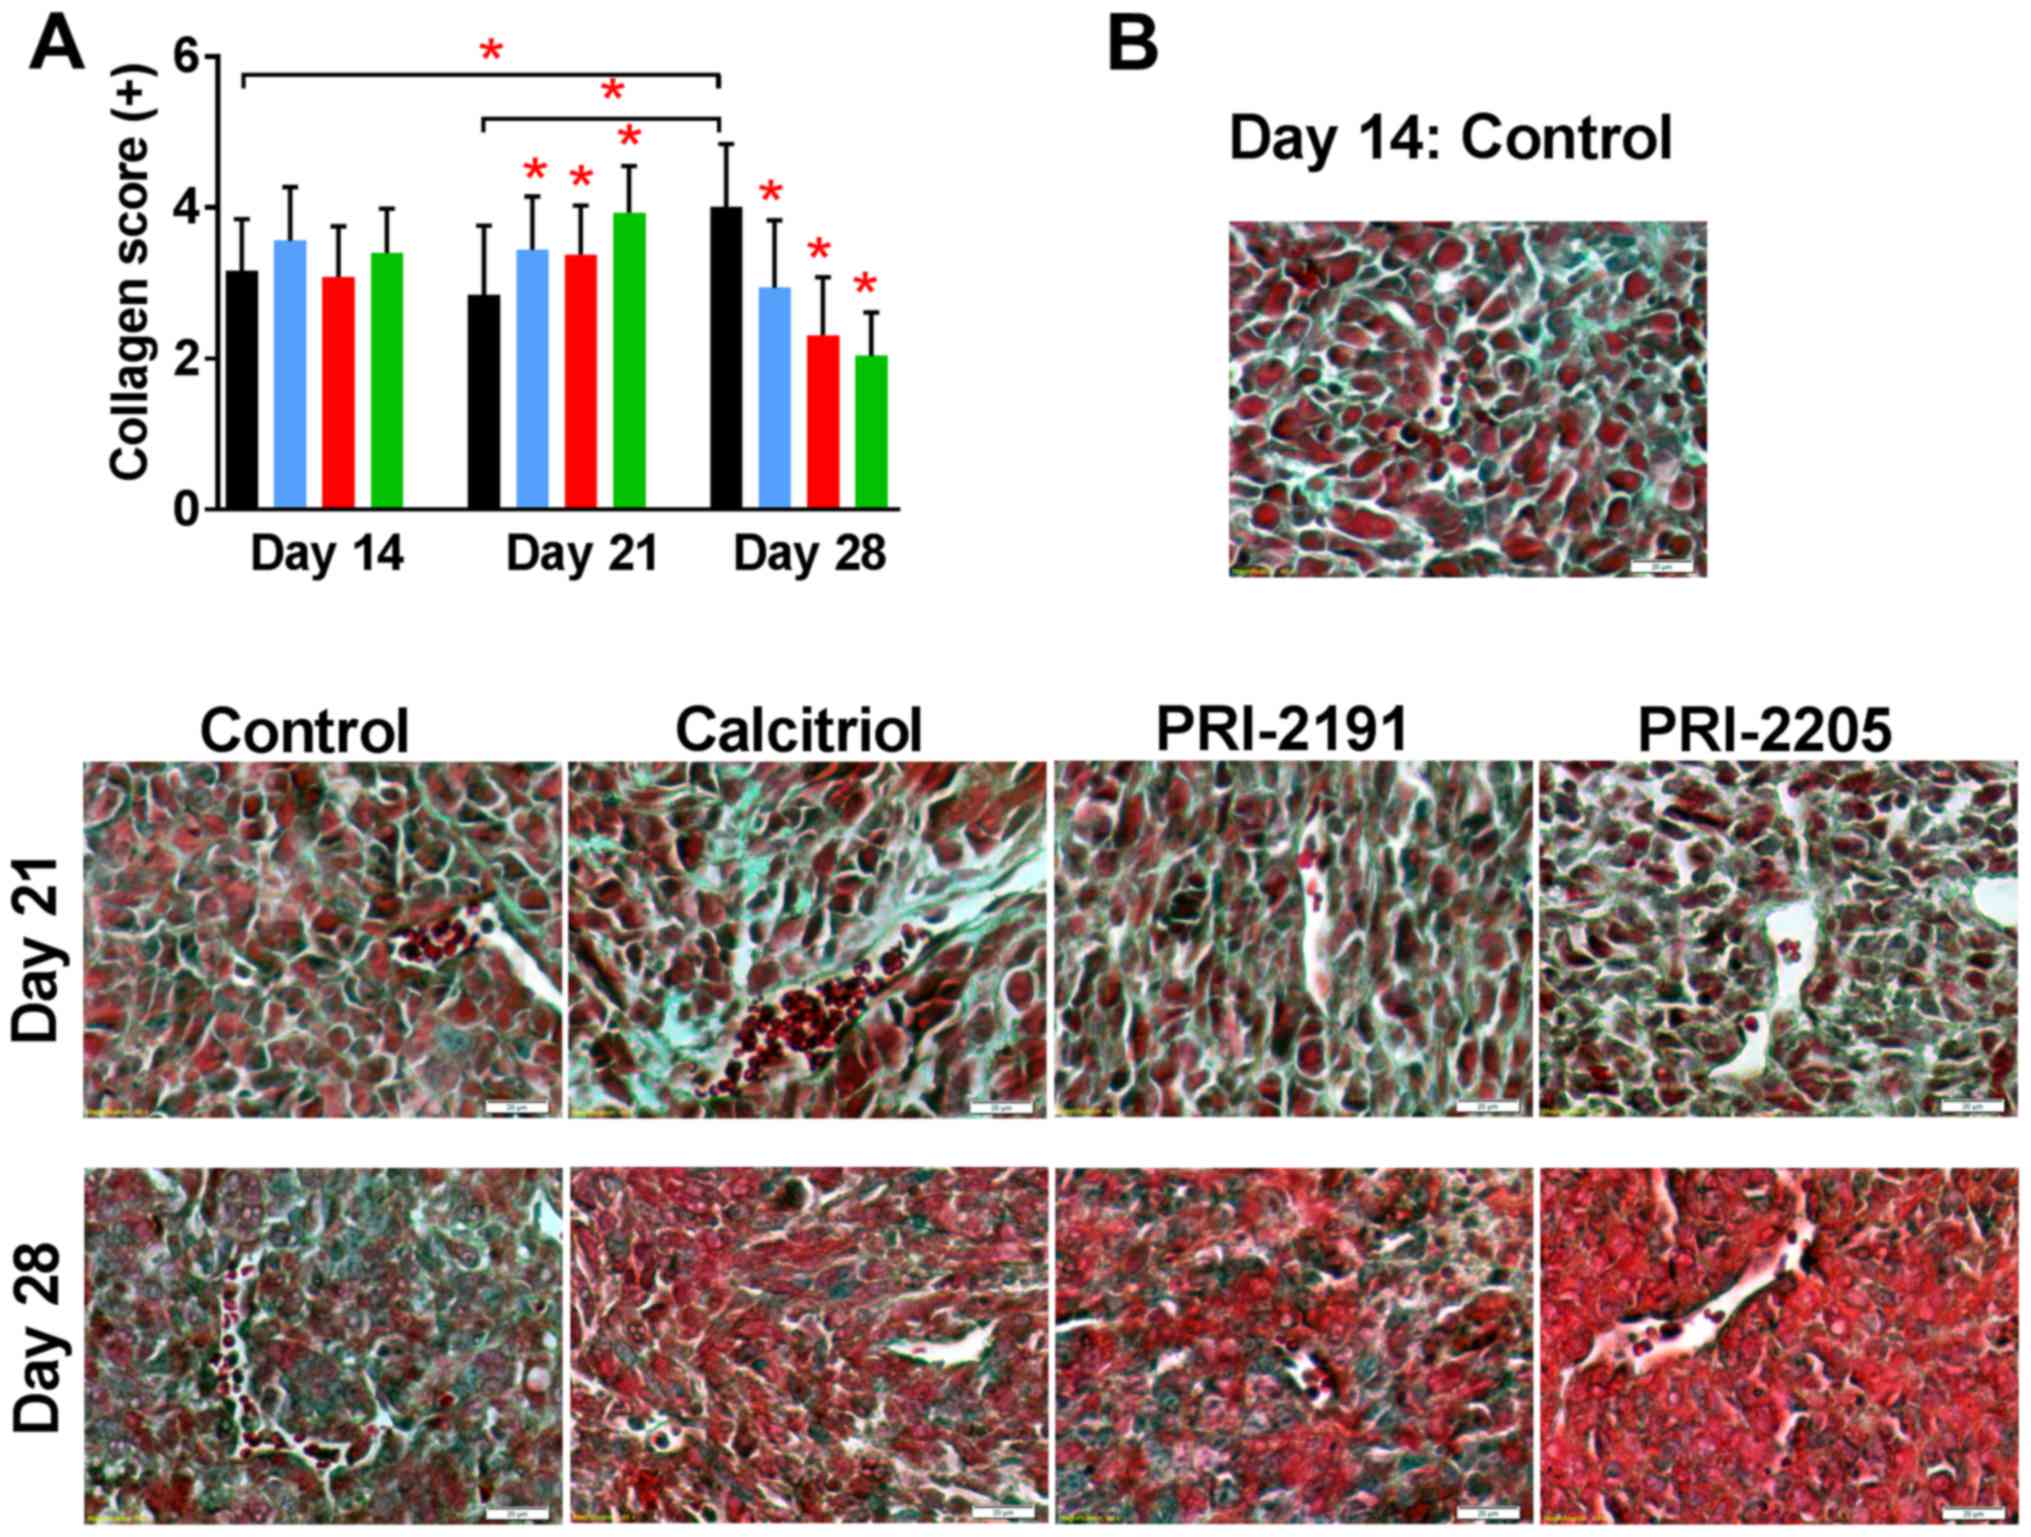 | Figure 8Collagen staining in tumor tissue
from mice treated with calcitriol or its analogs. Color bars,
black, control animals; blue, calcitriol; red, PRI-2191; green,
PRI-2205. Number of mice evaluated were 6 per group. (A) Data are
presented as mean ± standard deviation. Statistical analysis:
Kruskal-Wallis multiple comparison test. *P<0.05 as
compared to control animals on the relevant day of treatment or as
indicated. (B) Representative photographs. Magnification, ×40;
scale bar, 20 µm. The sections were immersed respectively in
azoploxine solution for cytoplasm dyeing, Tungstophosphoric acid
orange G solution for erythrocytes staining, and Light green SF
solution for collagen and connective tissue visualization.
Semiquantitative evaluation of collagen was based on the presence
of single collagen fibers around single cells (+), single collagen
fibers around all cells (++), the medium (+++), significant (++++)
and very abundant (+++++) collagen deposits in sight. |
In most specimens of lungs, connective tissue
(collagen fibers) was seen as a green staining of fibers around the
bronchi and bronchioles, large vessels, and alveolar elements.
During tumor progression, we found a slight decrease in staining
intensity in control mice; however, PRI-2191 as PRI-2205 did not
show a difference in staining intensity when compared with control
mice. Calcitriol treatment seem to increase collagen fiber deposits
in lungs, primarily on days 14 and 28 (from ++ to even ++++)
(Table II).
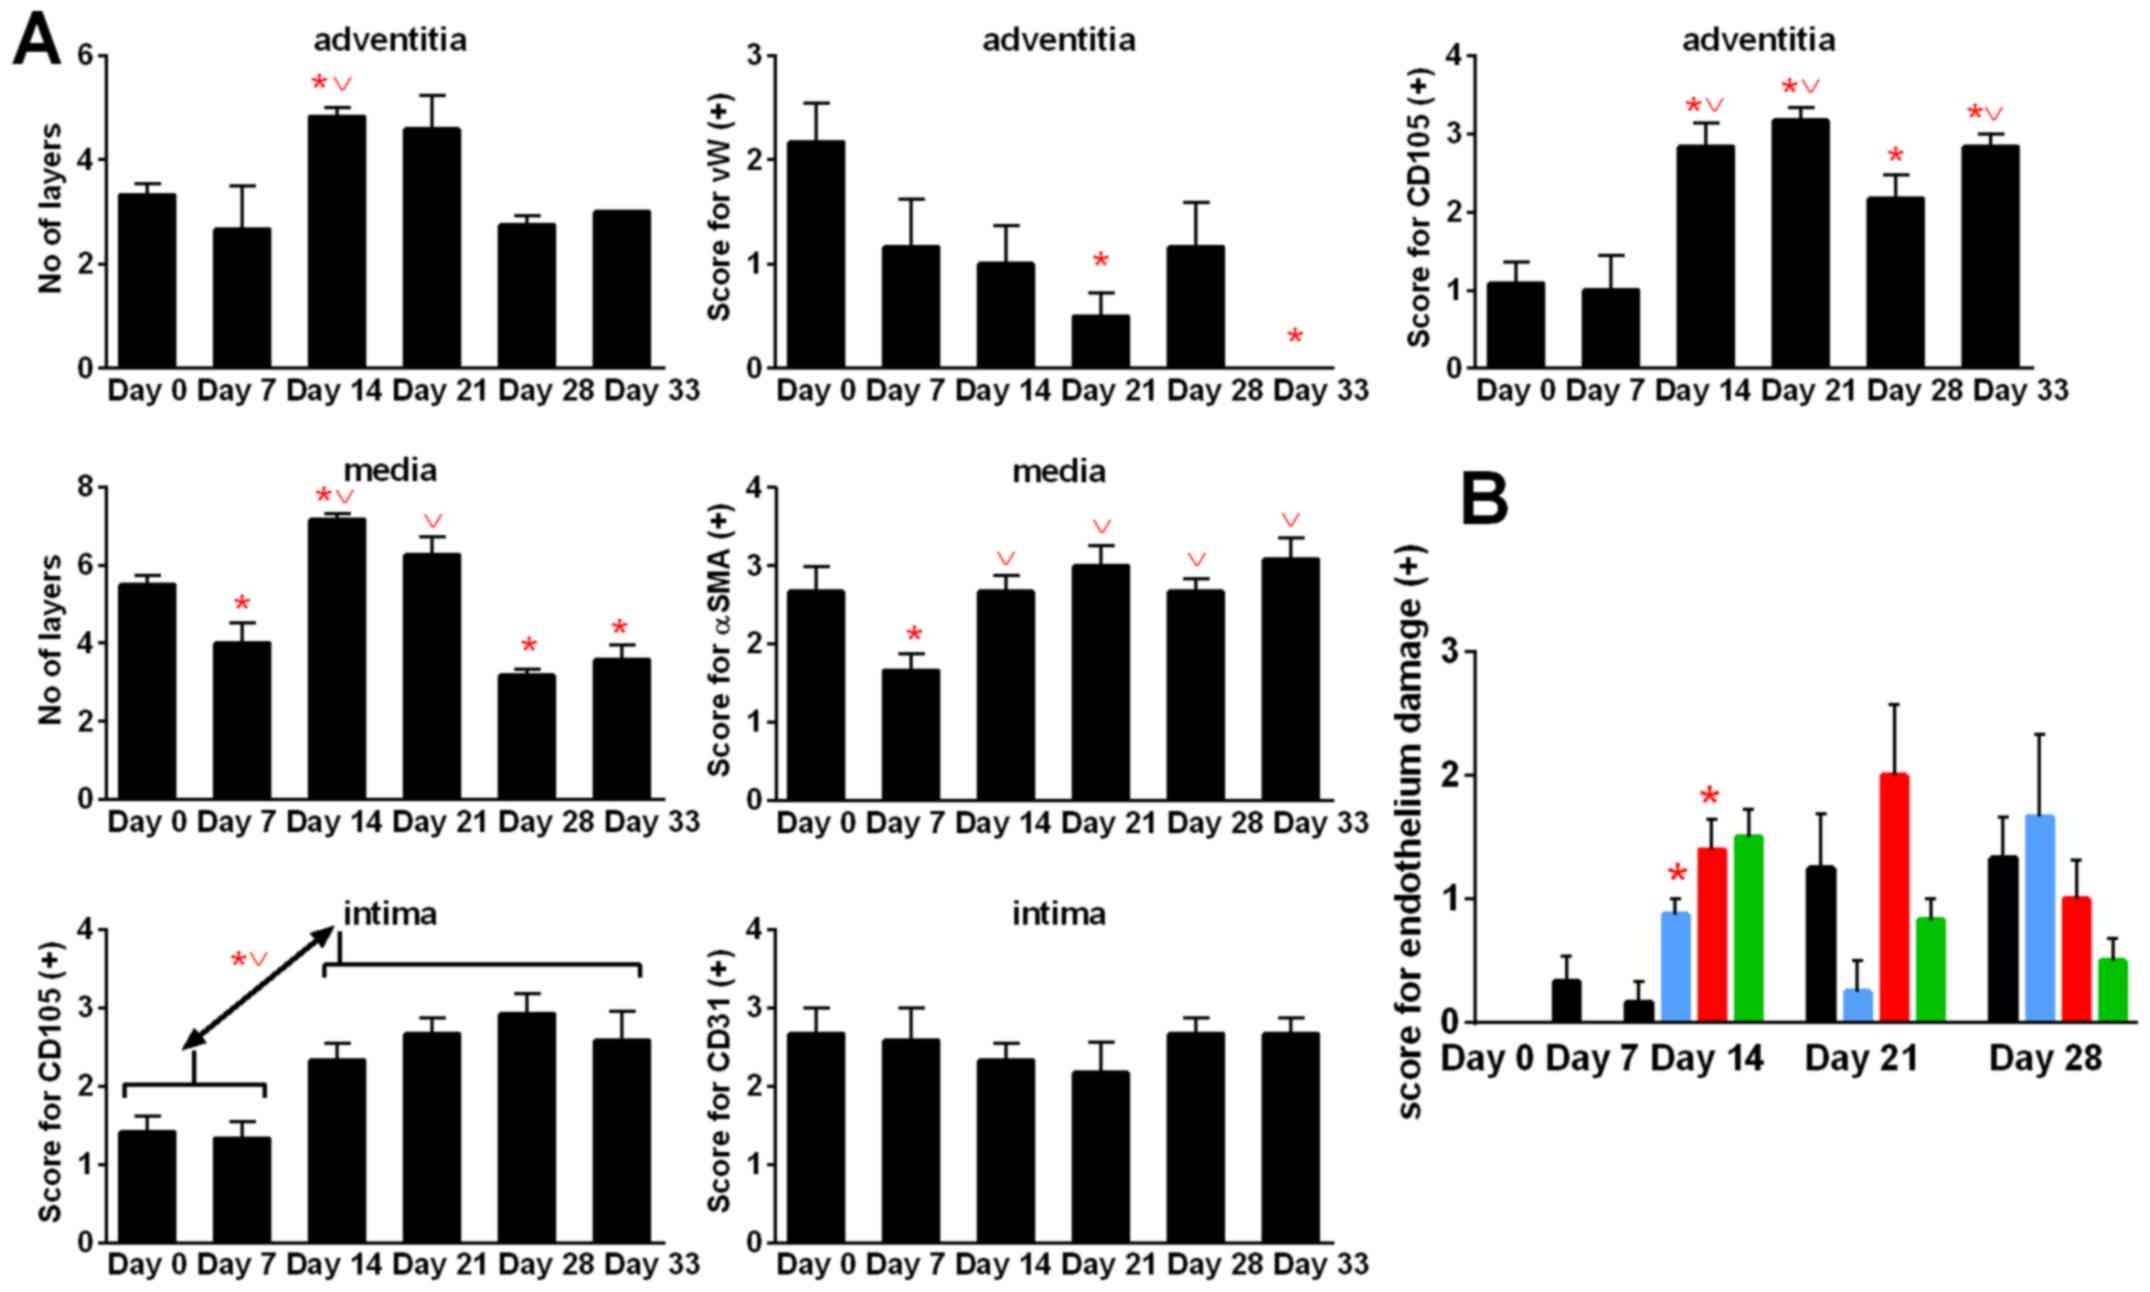
Aortic remodeling during tumor
progression and treatment with calcitriol and its analogs
During 4T1 tumor progression, we observed changes in
the structure of aorta. When tumor became palpable (day 7), the
number of cell layers of tunica media (P<0.05) and
tunica adventitia decreased when compared to healthy (day 0)
mice. Next, on day 14, the number of tunica media and
tunica adventitia layers in control tumor-bearing mice
increased significantly when compared to healthy (D0) and/or
tumor-bearing mice on day 7. On day 21, the number of tunica
media and tunica adventitia layers did not change
significantly. However, on the two last days of observation (days
28 and 33), the number of layers of tunica adventitia and
tunica media decreased. In case of tunica media, the
decrease in cell layers was greater and statistically significant
(days 28 and 33) than that of healthy mice (day 0). The α-smooth
muscle actin (αSMA) staining decreased at the beginning of tumor
growth (day 7) and then increased to the values similar to the
healthy mice. Stained with von Willebrand factor (vWF), vasa
vasorum endothelial cells decreased during 4T1 tumor
progression and were not detectable on day 33. However, staining
with anti-endoglin (CD105) antibody showed increased intensity on
day 14 when compared to healthy (day 0) and tumor-bearing mice on
day 7 (P<0.05). CD31 antigen of intima endothelial cells
was unchanged during tumor growth in control tumor-bearing mice;
however, endoglin significantly increased starting from day 7
(Fig. 9A).
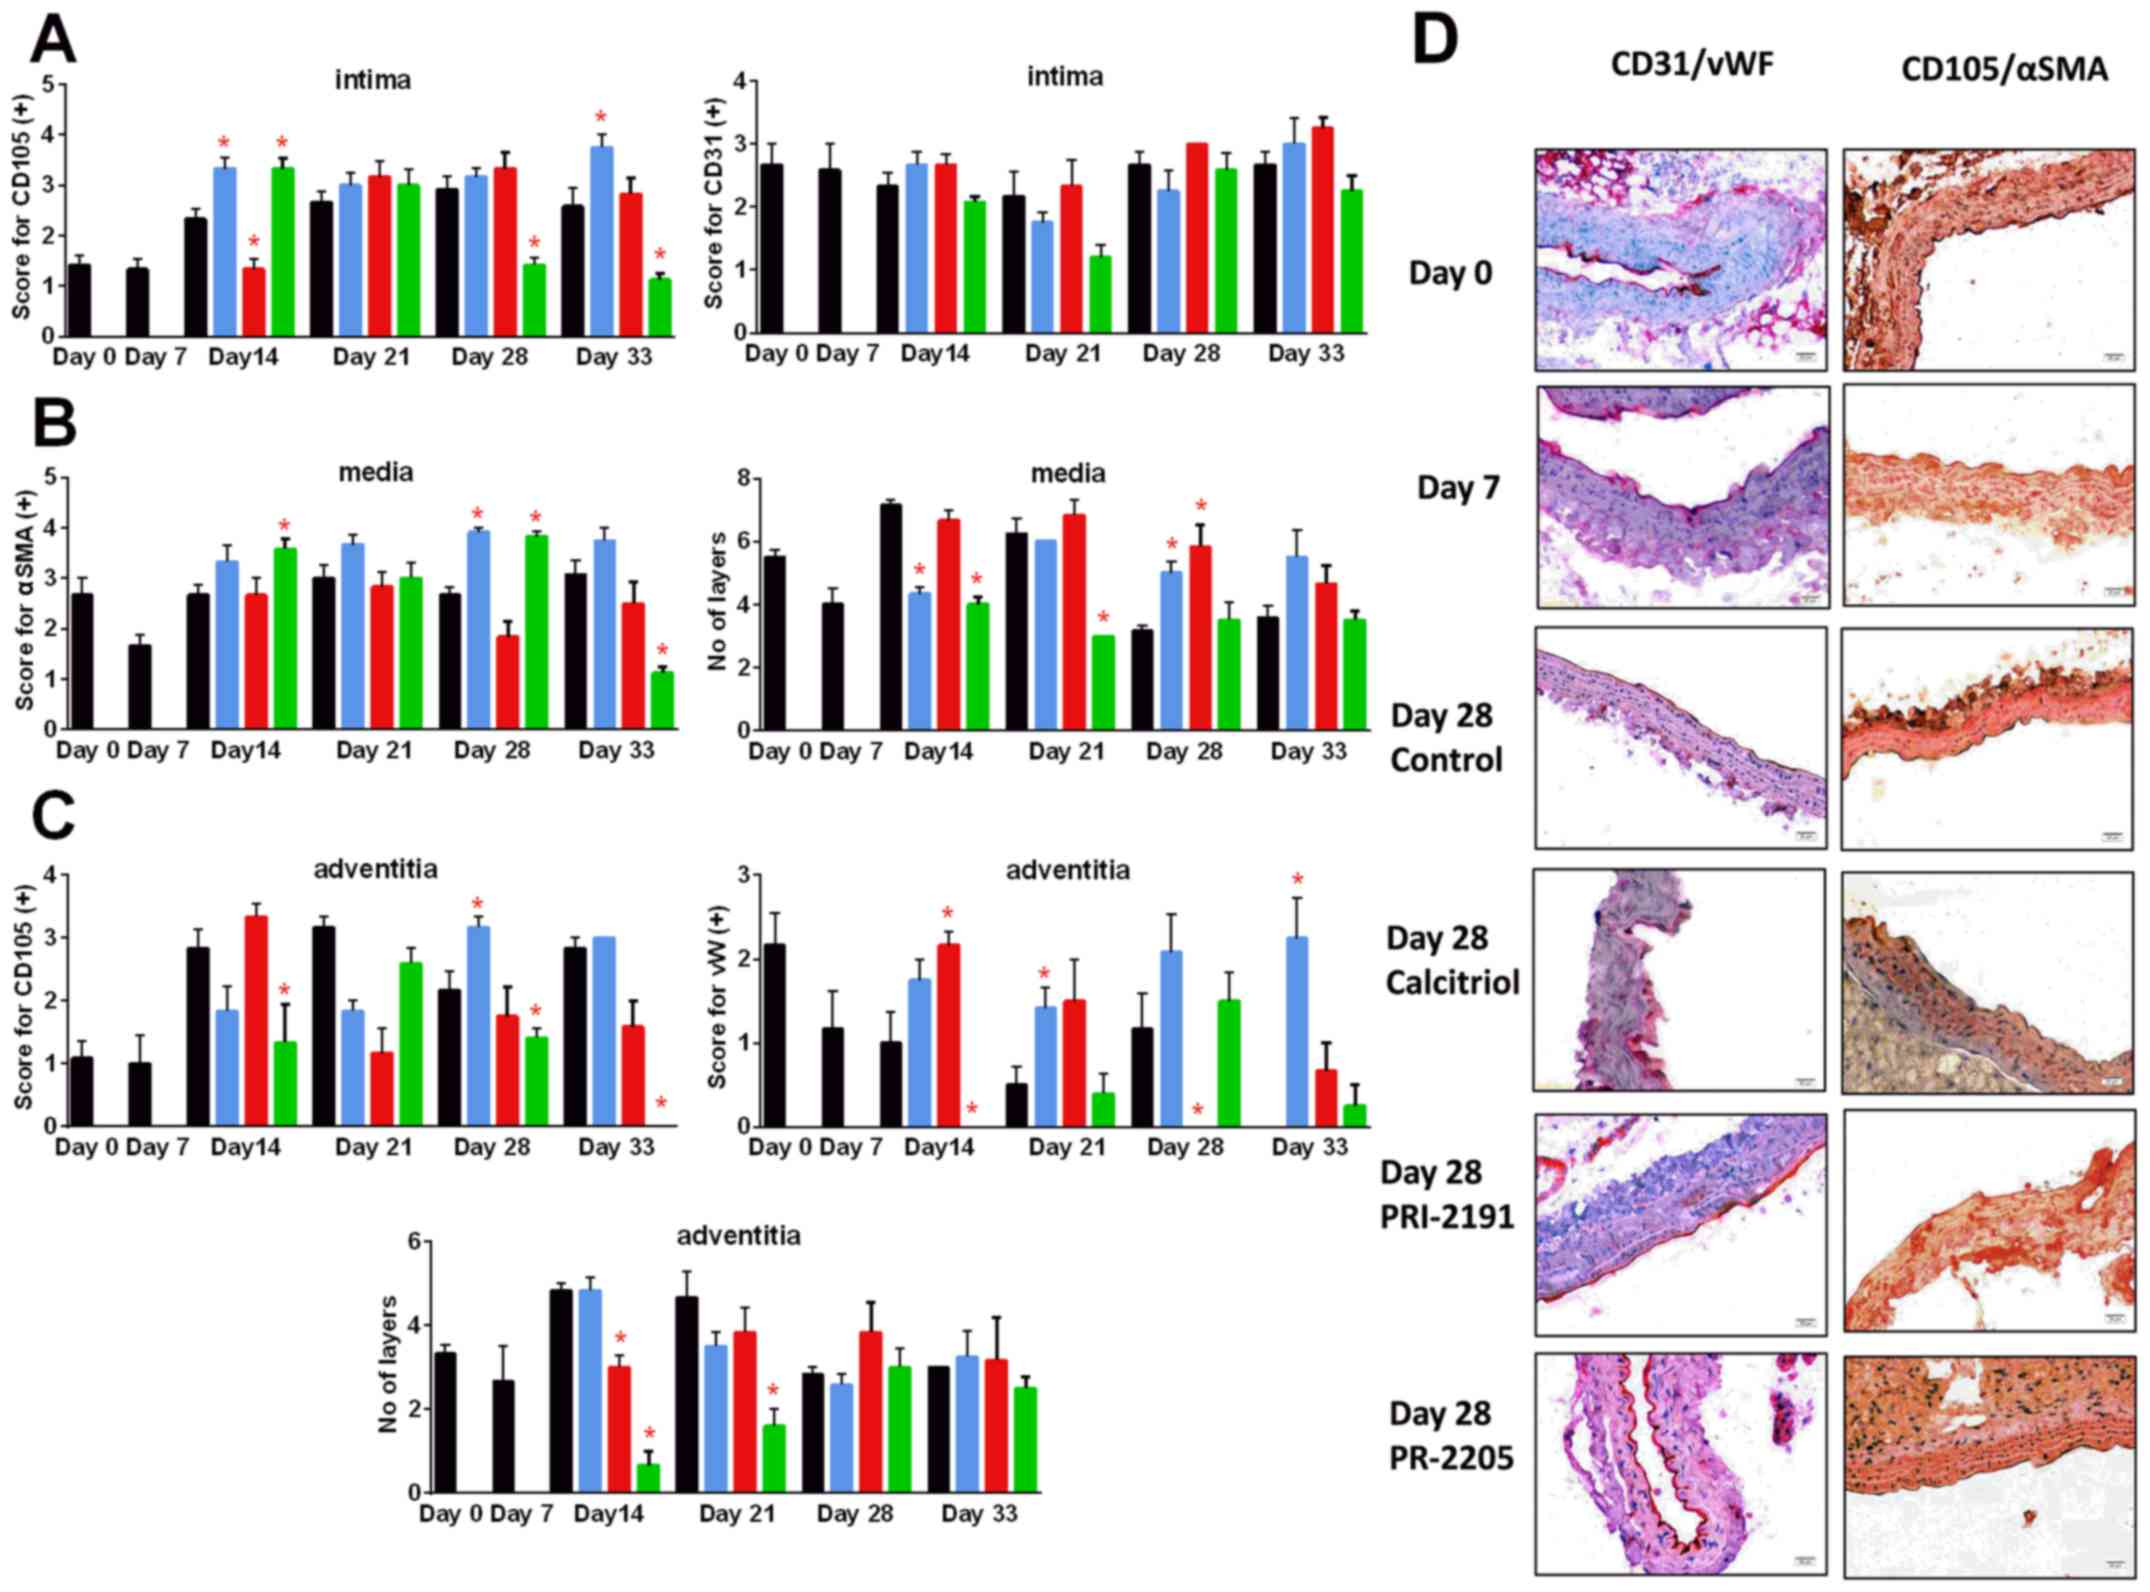
Calcitriol and PRI-2205 decreased the number of
tunica media layers on day 14 and PRI-2205 on day 21
(P<0.05). In the advanced stages of tumor development (days 28
and 33), both calcitriol and PRI-2191 increased the CD105 score. In
mice treated with PRI-2205, the number of tunica media
layers remained on the lower level similar to tumor-bearing mice on
day 7. The number of tunica adventitia layers was affected
by the tested compounds only in the earlier stages of tumor
development. PRI-2205 significantly decreased the number of layers
on days 14 and 21. The tendency to decrease the thickness of
tunica adventitia of aorta was also observed in
PRI-2191-treated mice. PRI-2205 tended to decrease CD31 (day 21)
and CD105 intima-positive cells (days 28 and 33 with an
exception on day 14, where significant increase was observed). A
similar tendency was observed according to CD105 and vWF-positive
cells in tunica adventitia. However, calcitriol and PRI-2191
increased the number of vWF stained adventitia cells. During
the course of treatment, calcitriol increased the staining
intensity of CD105 intima (days 14 and 33: P<0.05).
PRI-2191 on day 14 significantly decreased CD105 staining of intima
cells (Fig. 10).
The damage to endothelium observed in hematoxylin
and eosin-stained aorta slices in general respond to changes in
intima endoglin (CD105) staining (Fig. 9B). During this examination, the
aortas showed no change (0) or a number of changes observed in
terms of damage to the individual endothelial cells (marked +) or
lying next to each other in a small space in a number of such
locations (++), or endothelial cells invaded by erythrocytes and/or
dissection (+++). Calcitriol and its analogs increased endothelium
damage on day 14 (Fig. 9B).
Calcitriol and its analogs exert
different action against metastatic 4T1 cells and its
non-metastatic counterparts 67NR in vitro
This part of the study was performed to evaluate
the direct influence of calcitriol and its analogs on 4T1
metastatic cells in vitro and compare the results with
non-metastatic subline 67NR.
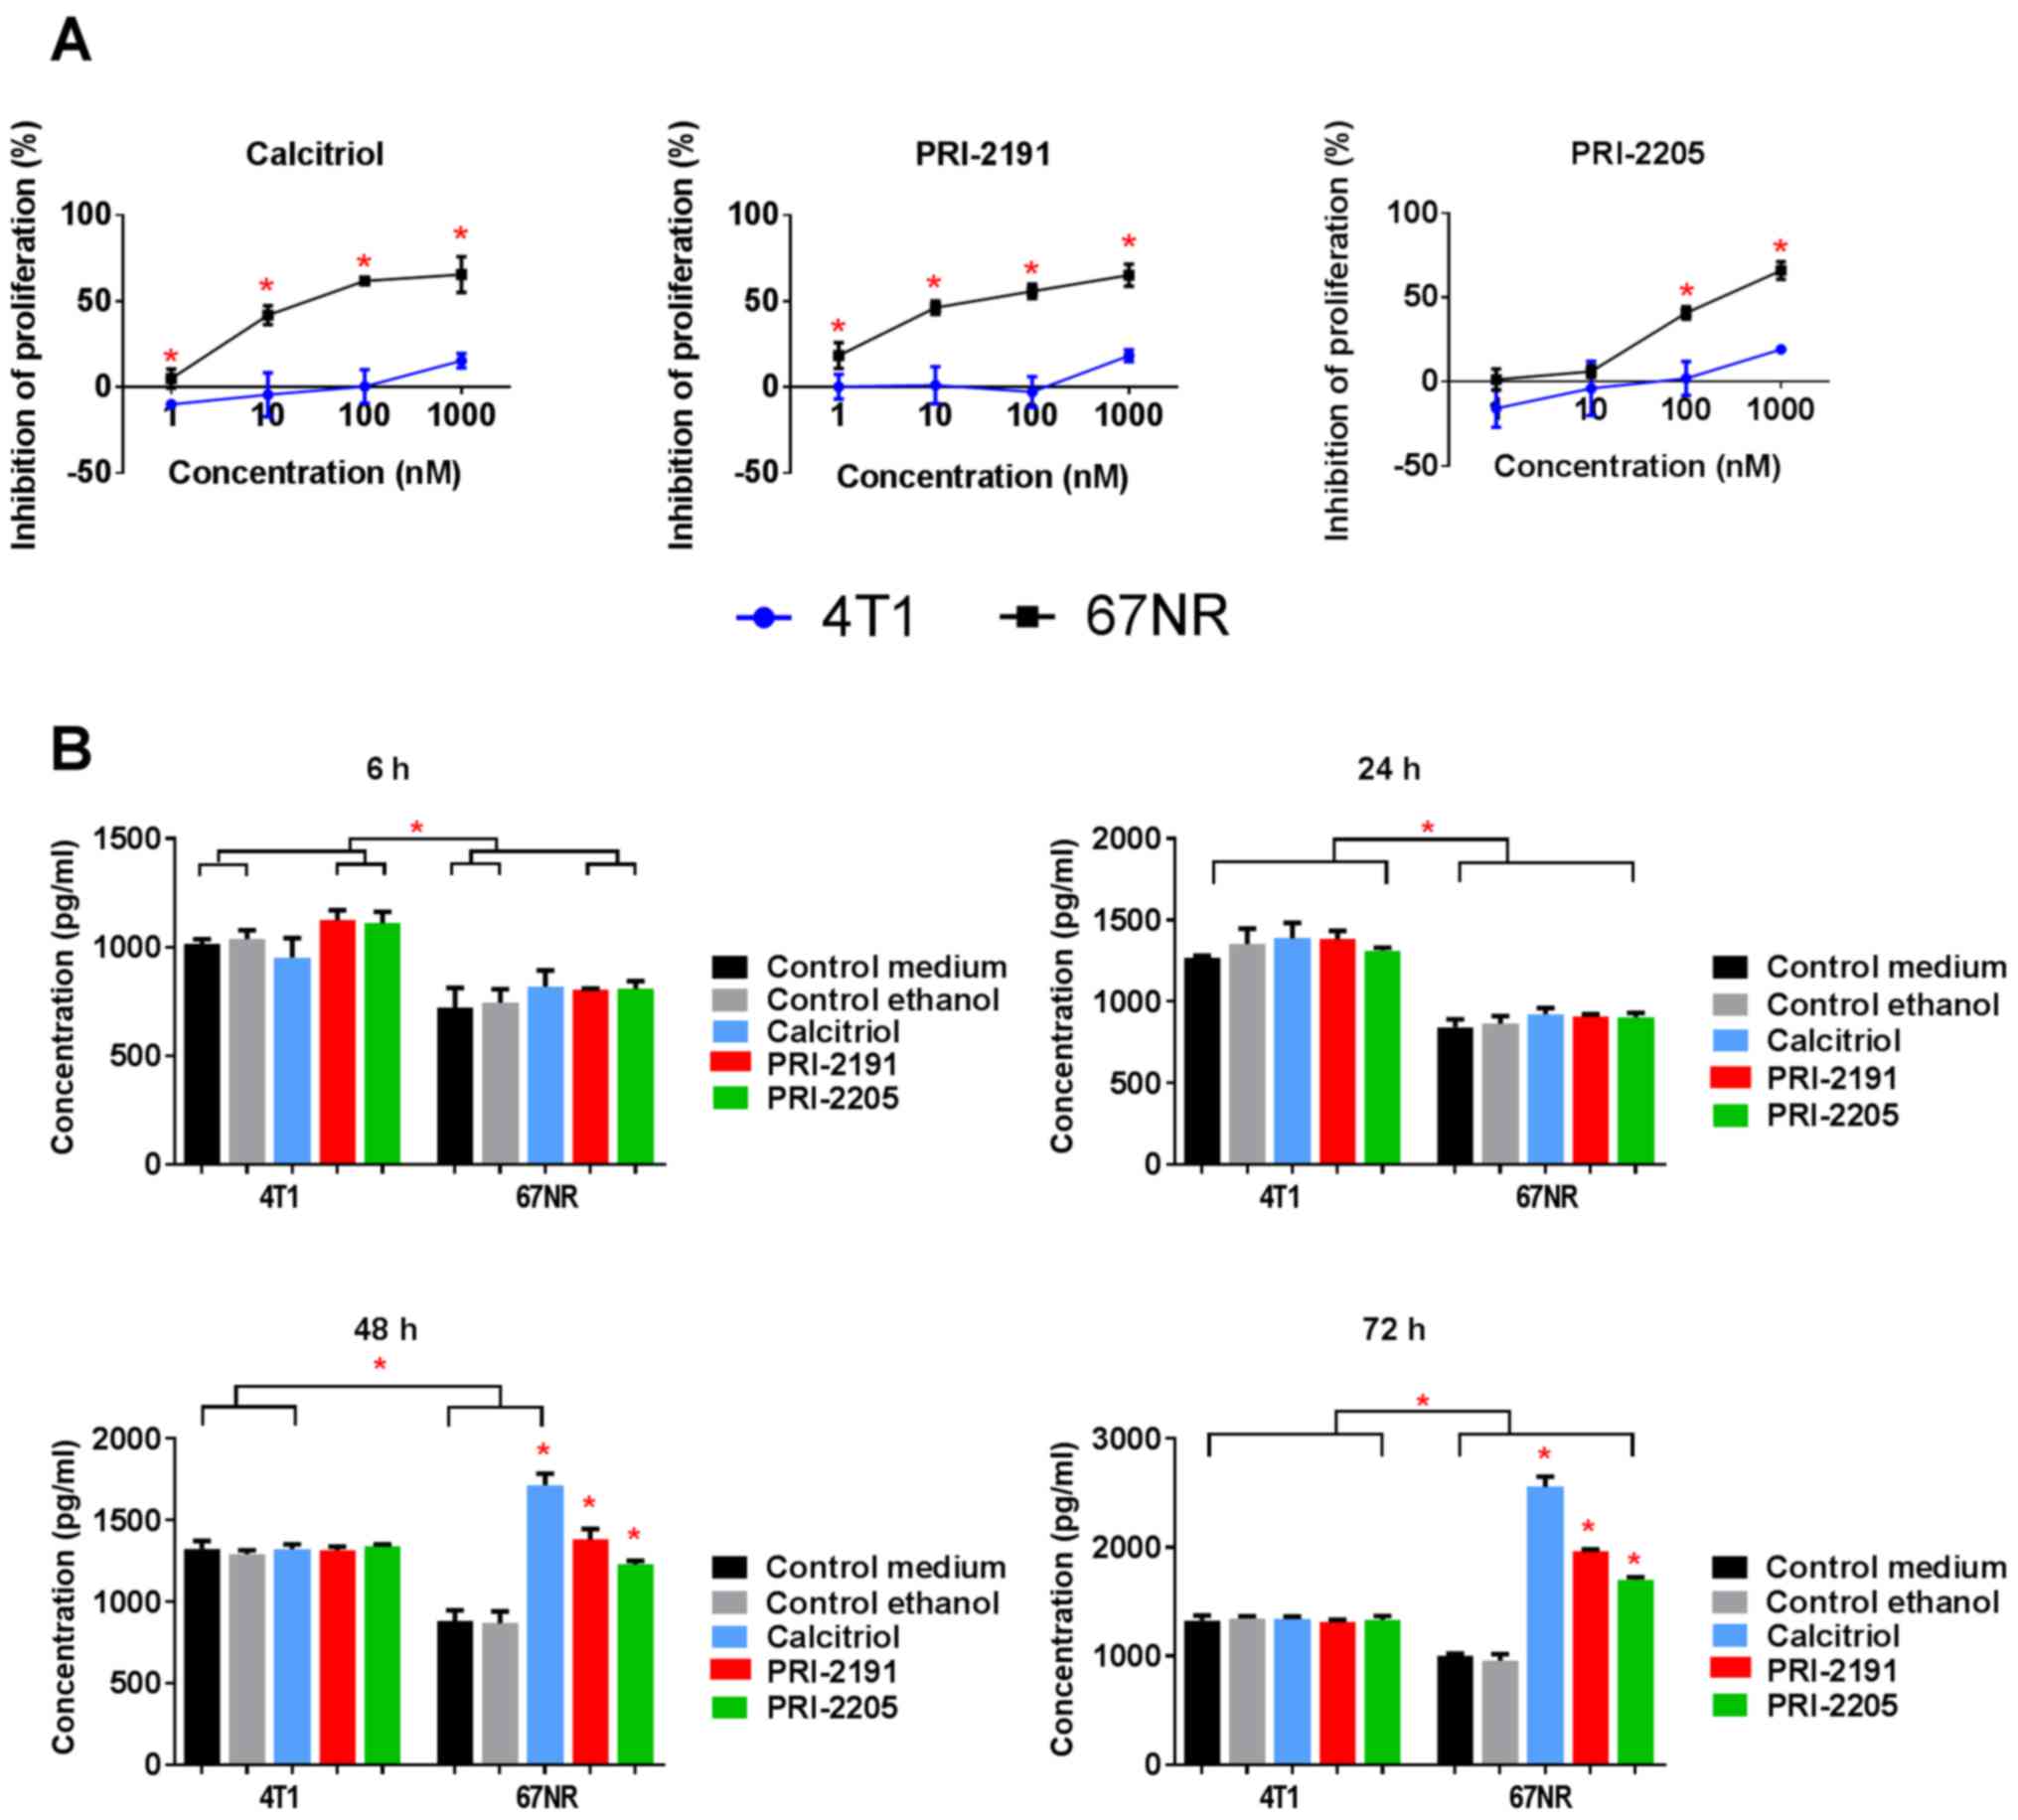
Calcitriol and its analogs inhibited proliferation
of non-metastatic 67NR cells but did not influence 4T1 cell
proliferation significantly (Fig.
11A and Table V). We used
cisplatin, doxorubicin, docetaxel, 5-fluorouracil, tamoxifen, and
camptothecin as the control anticancer drugs, to show the
sensitivity of 4T1 cells for in vitro anticancer drugs in
the same experimental condition as used for calcitriol and its
analogs. Similar antiproliferative activities of most anticancer
drugs were observed for both cell sublines. However, 4T1 cells
revealed less sensitivity to tamoxifen and 5-fluorouracil when
compared to 67NR cells (Table
V).
| Table VAntiproliferative activity of tested
compounds and positive controls against mammary gland cancer
sublines: metastatic 4T1 and non-metastatic 67NR cells. |
Table V
Antiproliferative activity of tested
compounds and positive controls against mammary gland cancer
sublines: metastatic 4T1 and non-metastatic 67NR cells.
| Compound | 4T1 cells | 67NR cells |
|---|
|
|---|
| IC50
(nM) |
|---|
| Calcitriol | – | 25.04±9.30 |
| PRI-2191 | – | 23.52±5.93 |
| PRI-2205 | – | 230.73±12.14 |
|
| IC50
(µg/ml) |
|
| Cisplatin | 0.38±0.090 | 0.30±0.050 |
| Doxorubicin | 0.04±0.002 | 0.05±0.012 |
| Docetaxel | 0.01±0.000 | 1.20±0.990 |
| Camptothecin | 0.03±0.003 | 0.04±0.036 |
| 5-fluorouracil | 0.46±0.044 | 0.11±0.079a |
| Tamoxifen | 3.05±0.237 | 1.46±0.164a |
According to our results, 67NR cells secreted OPN
into the culture medium and it increased significantly during the
time of incubation. However, in case of 4T1 cells, OPN secretion
increased up to 48 h of incubation and the level was maintained up
to 72 h (Fig. 11B). Furthermore,
4T1 cells secreted significantly higher levels of OPN than that of
67NR cells, and calcitriol and its analogs (100 nM) did not alter
its levels (Fig. 11B). Starting
from 48 h of incubation, calcitriol and both analogs significantly
increased the secretion of OPN by 67NR cells (Fig. 11B, right graph). After 72 h of
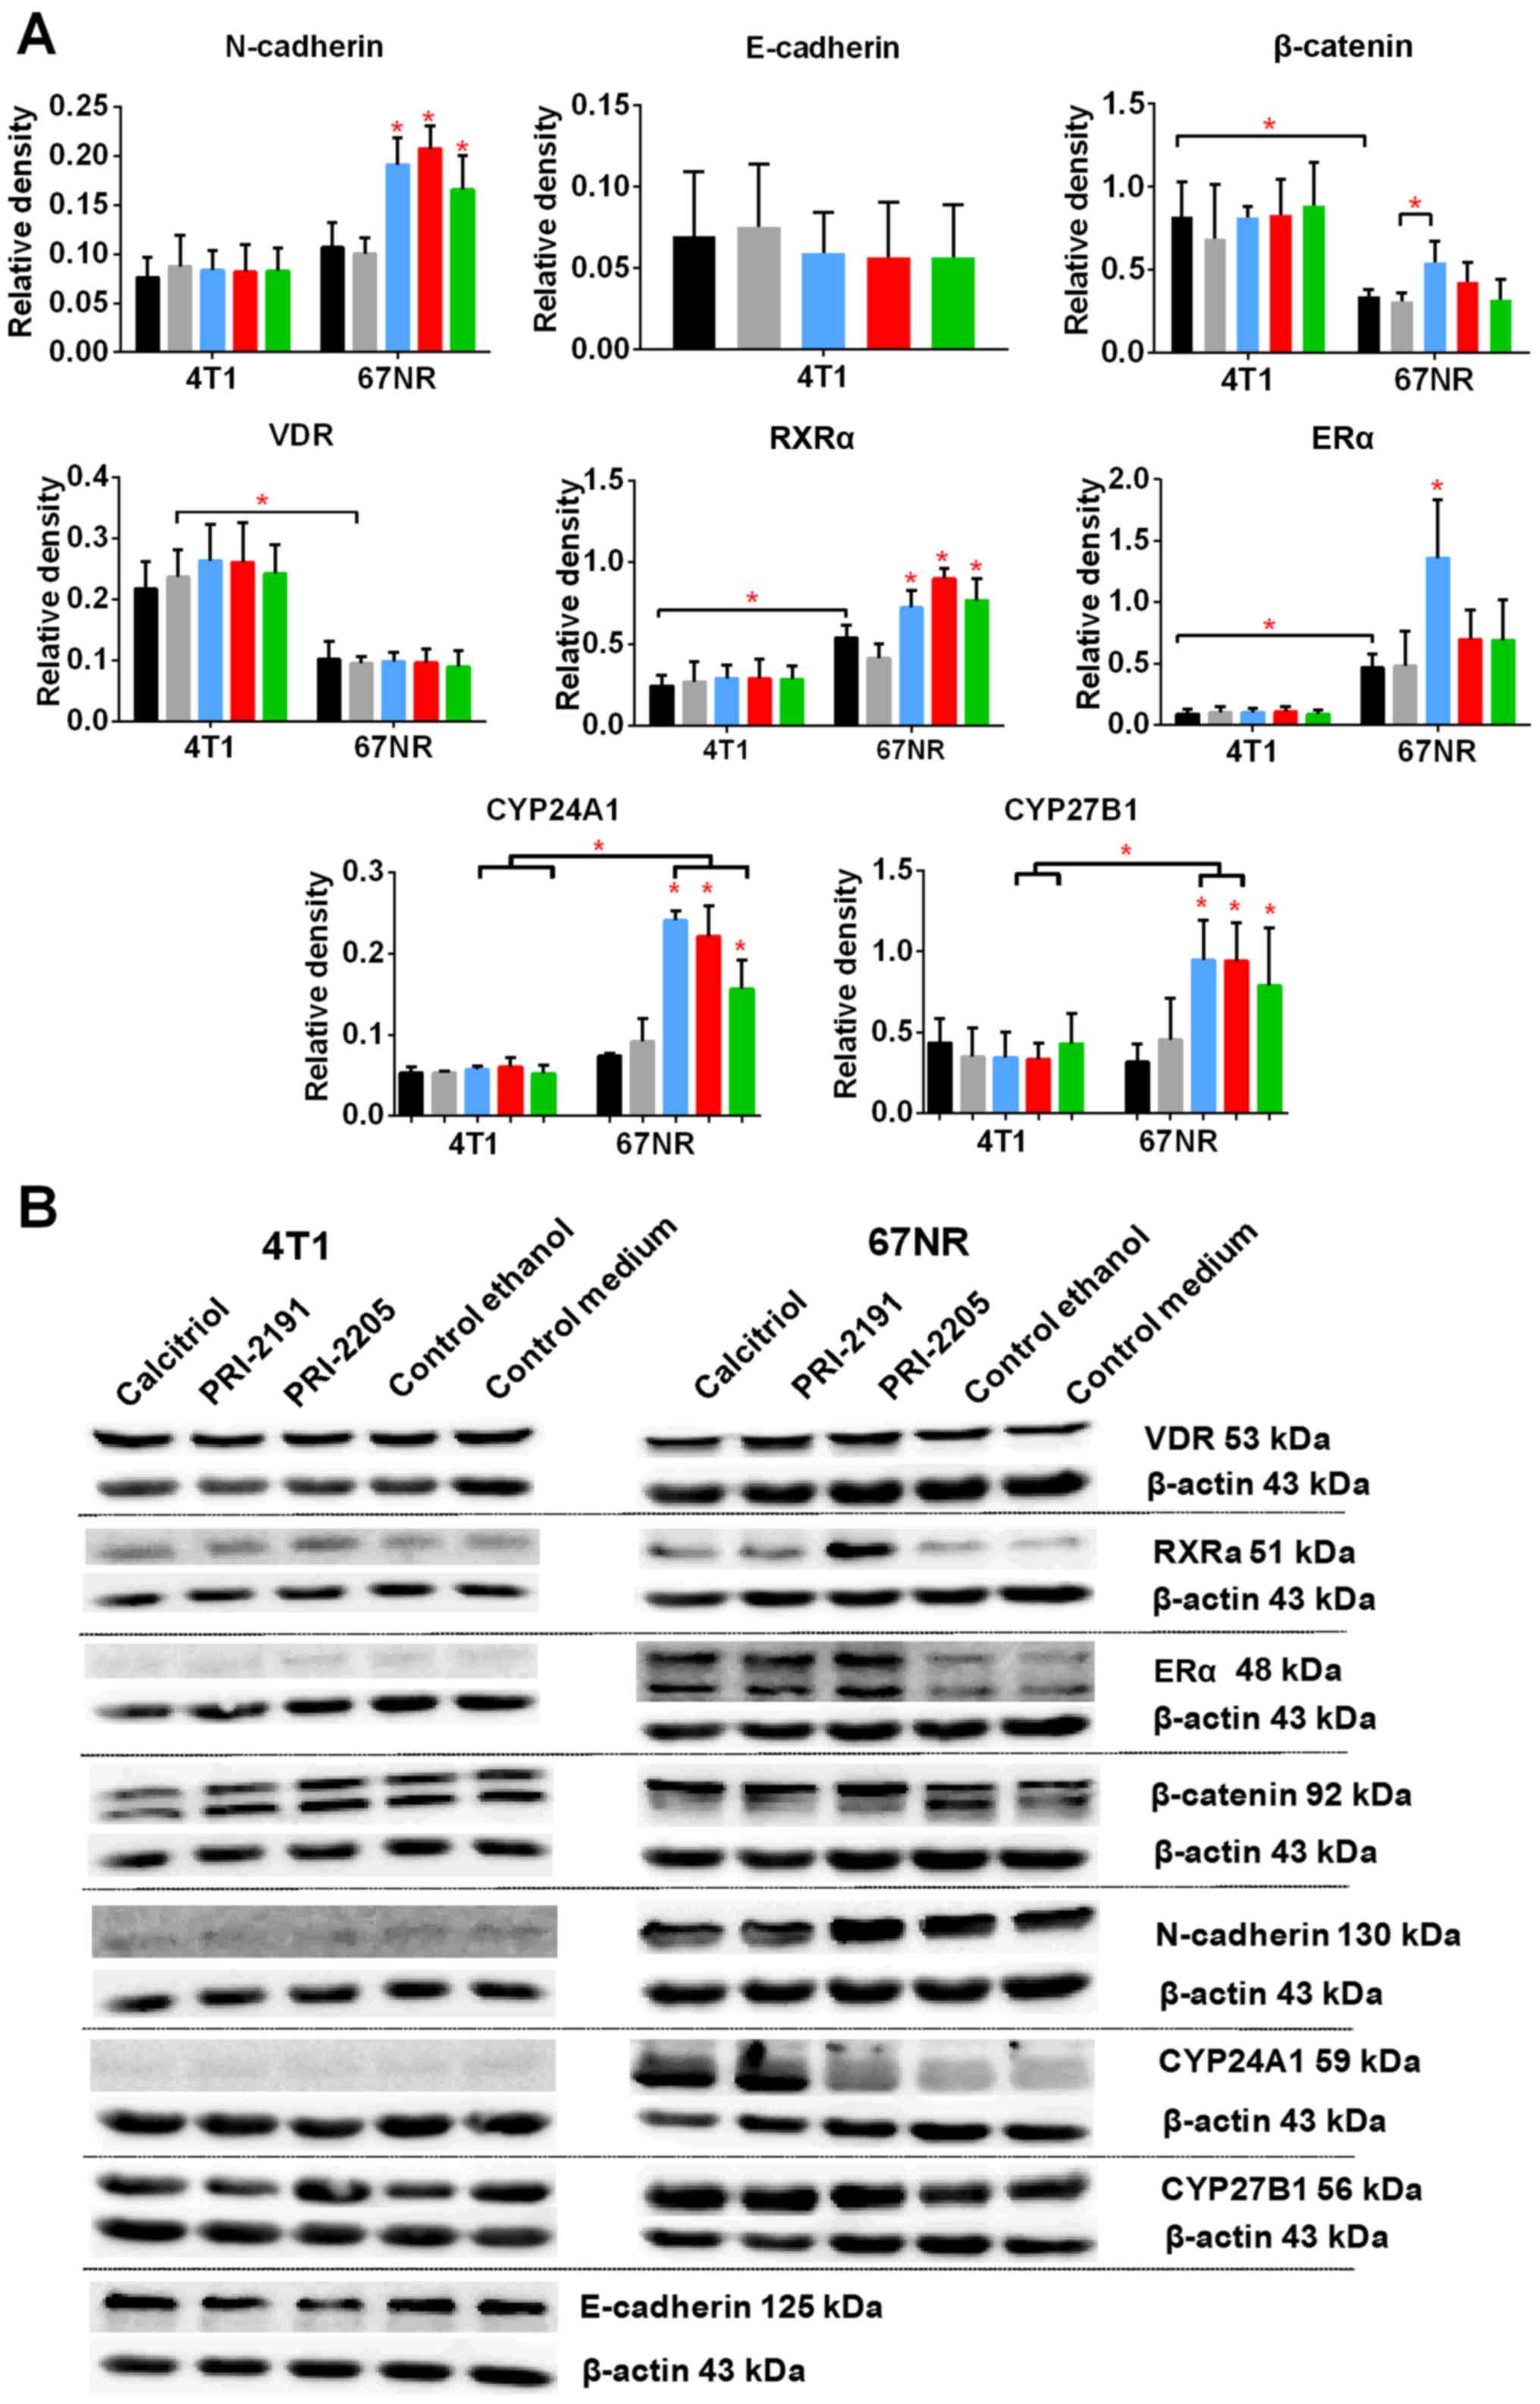
incubation with 100 nM calcitriol and its analogs, the levels of E-
and N-cadherin, β-catenin, VDR, RXRα, and ERα were measured. The
results are presented in Fig. 12.
Calcitriol and its analogs did not affect the expression of
aforementioned proteins in 4T1 cells. The results also show that
4T1 and 67NR cells expressed similar level of N-cadherin, and this
expression was increased significantly in 67NR cells by calcitriol
or its analogs. The 67NR cells did not express E-cadherin. The
expression of β-catenin, and VDR proteins were higher in 4T1 than
in 67NR cells. Calcitriol increases significantly the expression of
β-catenin in 67NR cells. On the other hand, the expression of RXRα
and ERα was significantly lower in 4T1 than 67NR cells. Calcitriol
(ERα) or calcitriol and its analogs (RXRα) increased the expression
of these proteins significantly only in 67NR cells. The expression
of vitamin D metabolizing enzymes namely, CYP27B1 and CYP24A1 were
unchanged in 4T1 cells after treatment with the tested compounds.
However, in case of 67NR cells, the expression of both the enzymes
increased significantly after incubation with calcitriol or its
analogs (Fig. 12).
Discussion
In this study, we conducted experiments on the
mouse 4T1 mammary gland cancer cells transplanted into the mammary
fat pad of the immune-competent BALB/c female mice. This research
model is commonly used for late-stage (IV) basal-like human breast
cancer model because similar to that observed in humans 4T1 cells
spontaneously metastasize via hematogenous route into lungs, brain,
liver or bones (34). Moreover,
4T1 tumor progression is accompanied by the activation of the
platelets (36) and of host immune
cells (37), thus it provides a
model for the studies on a broad range of metastatic features.
Banka et al (38) showed that the expression of
endogenous ERα was not detected in 4T1 breast carcinoma cells.
Moreover, estrogens did not induce proliferation or Erk1/2
phosphorylation of 4T1 cells in vitro. However, estrogens
can stimulate metastasis of such ER-negative tumors (39,40).
Our study, similarly to other research (41), revealed that 4T1 tumors express ERα
and β, and according to our results, the level of ERα decreased
throughout tumor progression, whereas the level of ERβ remained
unchanged. In cell culture studies, 4T1 cells did not show
sensitivity to antiproliferative activity of calcitriol or its
analogs (PRI-2191 and PRI-2205) as presented in this study and
previously (27). Moreover, the
in vivo experiment conducted on mice bearing 4T1 tumors
transplanted orthotopically have shown that PRI-2205 did not affect
the growth of primary tumors significantly, but enhanced the
metastatic potential of 4T1 cells when used alone. However, when
combined with cyclophosphamide, PRI-2205 improved its effectiveness
(27). Now, in two independent
experiments, we have shown that calcitriol and its analogs
(PRI-2191 and PRI-2205) did not influence the primary tumor growth
but increased the metastatic potential of 4T1 cells. Although
calcitriol was used in lower dose (0.5 µg/kg) than other
analogs, its toxicity was visible and manifested as a reduction in
body weight and a rise in serum calcium level.
The significance of OPN (encoded by the
Spp1) as a key molecule in the progression and metastasis of
4T1 cancer cells has been previously described (42,43).
Moreover, OPN is correlated with advanced stage and metastasis of
breast (44) and other (45–47)
tumors and with resistance to chemotherapy (48). OPN revealed its activity using a
number of receptors, including the integrins αv
β1, β3, or β5 and α4,
α5, α8, or α9 β1, and
it may also be a ligand for CD44 receptor (49–52).
Directly through activation of these receptors or indirectly, OPN
acts as a chemotactic agent for macrophages and stimulates
proinflammatory activity of macrophages, fibroblasts, natural
killer (NK) cells, and endothelial cells, thereby inducing
angiogenesis and collagen deposits (50,53,54).
Furthermore, vitamin D responsive element (VDRE) in the promoter
region of Spp1 has been reported (55), and the enhancement of OPN levels
was found in various cells treated with calcitriol and its analogs
(55–61).
In this study, in control tumor-bearing mice, the
tumor OPN level increased, but tumor VEGF level decreased with
progression of neoplasia. This is inconsistent with the data
suggesting that exogenous, as well as tumor-derived OPN augments
both VEGF mRNA and VEGF protein levels in breast cancer
(54,62). However, in our tumor model, similar
to other studies (63,64), the expression of mesenchymal
markers such as SNAI1 and N-cadherin increased in subsequent days
of tumor growth, whereas the expression of E-cadherin, typical for
epithelial phenotype, decreased.
In the in vitro studies by Xu et al
on rat mammary gland cancer cells, OPN levels were found to be
increased by calcitriol and its analogs. Nevertheless, suppression
of β-catenin and upregulation of E-cadherin signaling was also
noted, as authors suggest this can neutralize such adverse effect
of calcitriol inducing OPN secretion (56). In our research model, calcitriol
and its analogs did not influence the secretion of OPN into the
culture medium of 4T1 cells and did not influence the levels of
β-catenin, E-cadherin or N-cadherin in vitro. 67NR cell
subline has been described as less invasive (65) and despite a lower level of VDR than
in 4T1 cells, 67NR cells are sensitive to the induction of OPN
secretion, as well as, for example, upregulation of N-cadherin
expression by calcitriol and its analogs (our studies). Moreover,
in this study, non-treated 67NR cells secreted lower levels of OPN
into the culture medium than that of 4T1 cells as described in the
literature related to a less invasive phenotype (42).
However, in in vivo experiments, we observed
induction of OPN in 4T1 tumor tissue after treatment with
calcitriol and its analogs. Therefore, in our in vivo 4T1
tumor model, OPN induction by calcitriol and its analogs is not
cancer cell-derived but rather host-cell derived. This is also
supported by the fact that only a weak tendency to upregulate the
ratio of E:N cadherins at the beginning and at the end of
experiment by calcitriol and its analogs were observed, despite
decreased tumor TGFβ [known cytokine driving epithelial to
mesenchymal transition (66)]
level by the treatment used.
With the increase in OPN levels in tumor tissue,
after treatment with vitamin D compounds, we observed a decrease in
tumor VEGF level. In parallel, the tumor blood perfusion was
improved by all compounds, which could mean tumor vasculature
normalization via VEGF depletion (67,68).
However, in this study, we found an increased activation of aortal
endothelium (increase of endoglin staining) during tumor growth and
remodeling of tunica media and adventitia. Calcitriol
further increased the activation of endothelial cells as measured
by endoglin expression (PRI-2191 showed similar trend, but PRI-2205
was the opposite at the end of the experiment) and increased
vascularization in tunica adventitia (increased vWF
staining). These changes in the activity of endothelial cells
outside the tumor tissue correlated with plasma 17β-estrogen and
TGFβ level. OPN is known for its ability to enhance the migration,
homing, and differentiation of endothelial progenitor cells (EPCs)
(69). According to a study, the
activity of estrogens as accelerators of the endothelial repair
requires OPN, both for bone marrow-derived cell recruitment and for
endothelial cell migration and proliferation (70). Apart from the localized action of
OPN in tumor tissue, it has been documented that tumor or
host-produced OPN influences metastatic niche establishment
significantly. Sangaletti et al have shown that the
host-derived OPN, primarily from myeloid cells, form the
immunosuppressive environment in metastatic niche in the lungs
facilitating lung metastatic foci formation (43). Moreover, low concentrations of TGFβ
(decreased tumor concentration of TGFβ was observed in our studies)
can promote blood vessel formation. However, higher amounts can be
antiangiogenic (71–73). TGFβ also revealed direct effects on
endothelial cell growth and migration and also on the regulation of
the activation state of the endothelium (74,75).
Therefore, normalized tumor blood vasculature with activated
endothelium (as we showed in aorta sections) driven by tumor OPN,
plasma estrogens, and TGFβ overexpression may lead to the induction
of metastasis by calcitriol and its analogs.
TGFβ is a cytokine that acts as a tumor suppressor
when directed to normal cells, whereas it acts as a tumor promoting
factor when directed to cancer cells. The action of TGFβ on tumor
cells can be direct, inducing invasive phenotype in these cells or
indirect conducing tumor-permissive micro-environment (76). Stromal collagenous extracellular
matrix, primarily produced by cancer-associated fibroblasts (CAFs),
is associated with increased risk of metastasis; TGFβ produced by
cancer cells and/or CAFs promotes its accumulation. Inhibition of
fibrosis using TGFβ antagonist can support inhibition of tumor
growth and metastasis (77). In
addition, OPN is identified as molecule reprogramming fibroblasts
to tumor-promoting, proinflammatory CAFs in breast tumor tissue
(78). Furthermore, Weber et
al proved that the transformation of mesenchymal stem cells to
CAFs initialized by OPN is mediated via TGFβ pathway (79). This OPN-TGFβ relationship may
explain the initial increase in collagen deposits in tumor tissue
by tested compounds, probably stimulated by OPN activity with
enough TGFβ level in tumor microenvironment contributing to
increased metastasis observed in our studies. In more advanced
cancer stage, tumor collagen deposits were decreased by vitamin D
compound treatments probably via tumor TGFβ downregulation, despite
the high levels of OPN. In addition, in vitro experiments of
others showed that calcitriol and its analogs induce TGFβ mRNA and
protein level in an ER-negative breast cancer cell line (80). However, calcitriol is known to
repress collagen synthesis in a number of cells by the interference
with the TGFβ-activated pathway (reviewed in refs. 81,82).
Therefore, this potentially positive tumor TGFβ downregulating
activity of calcitriol and its analogs is probably predominated by
the impact of OPN on CAFs. It led to collagen prometastatic action
in earlier steps of tumor progression as well as increased plasma
TGFβ levels in later stages. Elevated TGFβ plasma level is proposed
as a marker of metastatic breast cancer with poor prognosis
(83). Moreover, TGFβ is known to
modulate regulatory T-cell (Treg) differentiation, which suppress
antitumor T cell response (84).
TGFβ also promotes the differentiation of tumor-promoting
tumor-associated macrophages (M2), and tumor-associated neutrophils
(N2) (85,86). Wculek and Malanchi have also shown
that in the mouse 4T1 mammary gland cancer model neutrophils in
lung premetastatic niche support metastatic potential of cancer
cells (87). In the same tumor
model, the co-injection of M2 macrophages into the mammary fat pads
of mice increased solid tumor growth and lung metastasis (88).
Similarly, the tendency to decrease nuclear
factor-ĸB (NFκB) transcription factor, observed in this study on
day 28 and an increase observed on day 33, probably is the result
of action of calcitriol and its analogs on tumor-associated cells
as CAFs or immune cells. Adams and Teegarden have shown that
calcitriol inhibits apoptosis in C3H10T1/2 murine fibroblast cells
through activation of NFκB (89),
whereas Cohen-Lahav et al have demonstrated that calcitriol
inhibits the expression of tumor necrosis factor α (TNFα) in
macrophages by increasing inhibitory protein IĸBα and decreasing
the activity of NFĸB (90).
Therefore, further studies on isolated tumor macrophages and
fibroblasts are highly warranted in order to explain the impact of
calcitriol and its analogs on NFĸB transcription factor in tumor
tissue.
In this study, we observed that during the 4T1
tumor progression, VDR levels increased and the highest level was
observed on the last day of the experiment. Calcitriol and its
analogs tend to decrease the level of VDR, especially at the end of
the experiment. Williams et al showed that VDR knockdown in
168FARN tumor cells as well as diet-induced vitamin D deficiency
accelerates tumor growth and metastasis. Moreover, VDR signaling
suppressed inhibitor of DNA binding 1 gene (Id1) expression,
and there was a negative association between circulating 25(OH)D
levels and the expression of ID1 in primary tumors from breast
cancer patients (91). The 168FARN
cell line is derived from the same single mouse mammary tumor as
4T1 or 67NR used in our studies and is non-metastatic (92). Because Williams et al
concluded that the loss of VDR signaling is sufficient to convert
the cells from non-metastatic to metastatic state (91), therefore, even slight decrease in
VDR level after treatment with calcitriol or its analogs observed
in our studies could contribute to the observed elevation of
metastases in the lungs of mice. However, this decrease may concern
tumor stromal cells and therefore does not appear to be correlated
with Id1 expression, which remained almost unchanged in
tumor tissue taken from mice treated with tested compounds in our
PCR screening studies. Moreover, as we have shown in in
vitro studies, 4T1 cells expressed greater amount of VDR than
67NR cells, the isogenic cell line derived from the same primary
breast cancer but non-metastatic (92,93).
However, VDR in 4T1 cell line does not respond to calcitriol or its
analogs in vitro. This is emphasized by lack of changes even
in the expression of vitamin D metabolizing enzymes such as CYP27B1
(which converts the precursor form of vitamin D metabolite,
25-OH-D, to the active metabolite, calcitriol) and CYP24A1 (which
degrades calcitriol). Expression of these enzymes is directly
regulated by calcitriol (94,95).
The insensitivity of cancer cells to the action of calcitriol or
its analogs despite the presence of VDR can be explained by various
epigenetic mechanisms such as promoter hypermethylation (96), elevated nuclear receptor
co-repressor 1 (NCoR1) (97),
silencing mediator of retinoic acid and thyroid hormone receptors
(SMRT) (98), and histone
deacetylase (HDAC) enzymes (97).
Moreover, Zhi et al have shown that the tyrosine phosphatase
PTPH1 stimulates breast cancer growth through regulating VDR
expression/localization. PTPH1 binds to VDR and increases its
cytoplasmic accumulation leading to their stabilization. Deficiency
of a nuclear located VDR abolishes the growth-inhibitory activity
of the receptor (99).
Nevertheless, further studies are needed to determine whether this
mechanism is responsible for the insensitivity of 4T1 cells to
calcitriol despite the presence of the receptor and how these
mechanisms may be associated with increased metastasis under the
influence of calcitriol.
However, in our previous studies using the human
and mouse colon cancer model transplanted subcutaneously or
orthotopically, we observed that both calcitriol analogs increased
VDR level in colon tumor tissue, and when used with 5-fluorouracil,
PRI-2191 decreased the number of lymph node metastases (21,30).
We also correlated these observations with the increased E-cadherin
levels after calcitriol or PRI-2191 treatment (30). It seems that the use of strategies
that can 'activate' VDR should be tested to sensitize 4T1 cells to
calcitriol. It can lead to direct influence of calcitriol on cancer
cells [inhibitory effect, as in 67NR, 168FARN (91), or our colon cancer models (21,30)]
and to predominance of direct tumor-suppressive effects over
indirect, host related tumor-conducive ones.
Our results for the first time indicated that the
treatment with calcitriol or its analogs may lead to the
acceleration of metastatic process. There are published data
proving that calcitriol or its analogs inhibit growth of breast
cancer xenografts (100,101) or transplantable mouse mammary
gland cancer (23,102). Moreover studies by Williams et
al showed accelerated primary mammary gland tumor (MMTV-wt)
growth upon vitamin D deficient diet (91). Rossdeutsher et al, using
non-immunodeficient model of spontaneous mammary gland cancer
MMTV-PyMT, showed that exogenous 25(OH)D delays neoplasia, tumor
growth, and metastasis (103). On
the other hand, Ooi et al proved in experimental bone
metastasis model of human breast cancer cell xenotransplantation,
that vitamin D deficiency promotes the growth of human breast
cancer cells in the bones of nude mice (104). However, both cancer cell lines
used in these studies were sensitive to vitamin D action (103,104). The 4T1 cells, although expressing
VDR, are not sensitive to calcitriol: cell proliferation in
vitro and tumor growth in vivo was not affected upon
treatment. Therefore, calcitriol or its analogs in the body milieu
modified by 4T1 cells exerts its specific action on sensitive host
cells and by such indirect way accelerate metastatic process.
In conclusion, we have shown that calcitriol and
its analogs enhance the metastatic potential of 4T1 mouse mammary
gland cancer inducing OPN secretion by host cells (macrophages,
endothelial cells, or CAFs) in tumor tissue. Overexpression of OPN
in tumor tissue prevailed over the decreased tumor TGFβ level and
blood vessel normalization via tumor VEGF deprivation induced by
calcitriol or its analogs. Furthermore, induced plasma TGFβ and
17β-estradiol levels can contribute to the facilitation of
metastatic process via promoting metastatic niche formation
(Fig. 13). Collectively these
data indicate that caution should be taken with the use of vitamin
D in breast cancer therapy. However, further studies are needed to
show what characteristics of tumor cells modulating tumor
microenvironment are responsible for the predominance of vitamin D
prometastatic effects.
Acknowledgments
This study was supported by the National Science
Center granted on the basis of the decision number
DEC-2013/11/B/NZ5/00162. This study was also supported by Wroclaw
Center of Biotechnology within a program - The Leading National
Research Center (KNOW) for years 2014-2018.
References
|
1
|
Cossetti RJD, Tyldesley SK, Speers CH,
Zheng Y and Gelmon KA: Comparison of breast cancer recurrence and
outcome patterns between patients treated from 1986 to 1992 and
from 2004 to 2008. J Clin Oncol. 33:65–73. 2015. View Article : Google Scholar
|
|
2
|
Riemsma R, Forbes CA, Kessels A,
Lykopoulos K, Amonkar MM, Rea DW and Kleijnen J: Systematic review
of aromatase inhibitors in the first-line treatment for hormone
sensitive advanced or metastatic breast cancer. Breast Cancer Res
Treat. 123:9–24. 2010. View Article : Google Scholar : PubMed/NCBI
|
|
3
|
Dutta U and Pant K: Aromatase inhibitors:
Past, present and future in breast cancer therapy. Med Oncol.
25:113–124. 2008. View Article : Google Scholar
|
|
4
|
Brown SA and Guise TA: Cancer
treatment-related bone disease. Crit Rev Eukaryot Gene Expr.
19:47–60. 2009. View Article : Google Scholar : PubMed/NCBI
|
|
5
|
Datta M and Schwartz GG: Calcium and
Vitamin D supplementation and loss of bone mineral density in women
undergoing breast cancer therapy. Crit Rev Oncol Hematol.
88:613–624. 2013. View Article : Google Scholar : PubMed/NCBI
|
|
6
|
Rizzoli R, Body JJ, Brandi ML,
Cannata-Andia J, Chappard D, El Maghraoui A, Glüer CC, Kendler D,
Napoli N, Papaioannou A, et al International Osteoporosis
Foundation Committee of Scientific Advisors Working Group on
Cancer-Induced Bone Disease: Cancer-associated bone disease.
Osteoporos Int. 24:2929–2953. 2013. View Article : Google Scholar : PubMed/NCBI
|
|
7
|
Coleman R, Body JJ, Aapro M and Hadji P:
Bone health in cancer patients: ESMO Clinical Practice Guidelines.
Ann Oncol. 25(Suppl 3): iii124–iii137. 2014. View Article : Google Scholar : PubMed/NCBI
|
|
8
|
Coleman RE, Rathbone E and Brown JE:
Management of cancer treatment-induced bone loss. Nat Rev
Rheumatol. 9:365–374. 2013. View Article : Google Scholar : PubMed/NCBI
|
|
9
|
Cepa M and Vaz C: Management of bone loss
in postmenopausal breast cancer patients treated with aromatase
inhibitors. Acta Reumatol Port. 40:323–330. 2015.
|
|
10
|
Hant FN and Bolster MB: Drugs that may
harm bone: Mitigating the risk. Cleve Clin J Med. 83:281–288. 2016.
View Article : Google Scholar : PubMed/NCBI
|
|
11
|
Brant J: Vitamin D in the prevention of
aromatase inhibitor-induced musculoskeletal symptoms: Is it ready
for practice? J Adv Pract Oncol. 3:245–248. 2012.PubMed/NCBI
|
|
12
|
Jacobs ET, Kohler LN, Kunihiro AG and
Jurutka PW: Vitamin D and colorectal, breast, and prostate cancers:
A review of the epidemiological evidence. J Cancer. 7:232–240.
2016. View Article : Google Scholar : PubMed/NCBI
|
|
13
|
Feldman D, Krishnan AV, Swami S,
Giovannucci E and Feldman BJ: The role of vitamin D in reducing
cancer risk and progression. Nat Rev Cancer. 14:342–357. 2014.
View Article : Google Scholar : PubMed/NCBI
|
|
14
|
Jacot W, Pouderoux S, Thezenas S, Chapelle
A, Bleuse JP, Romieu G and Lamy PJ: Increased prevalence of vitamin
D insufficiency in patients with breast cancer after neoadjuvant
chemotherapy. Breast Cancer Res Treat. 134:709–717. 2012.
View Article : Google Scholar : PubMed/NCBI
|
|
15
|
Singer O, Cigler T, Moore AB, Levine AB,
Do HT and Mandl LA: Hypovitaminosis D is a predictor of aromatase
inhibitor musculoskeletal symptoms. Breast J. 20:174–179. 2014.
View Article : Google Scholar : PubMed/NCBI
|
|
16
|
LaPorta E and Welsh J: Modeling vitamin D
actions in triple negative/basal-like breast cancer. J Steroid
Biochem Mol Biol. 144A:65–73. 2014. View Article : Google Scholar
|
|
17
|
Peppone LJ, Rickles AS, Janelsins MC,
Insalaco MR and Skinner KA: The association between breast cancer
prognostic indicators and serum 25-OH vitamin D levels. Ann Surg
Oncol. 19:2590–2599. 2012. View Article : Google Scholar : PubMed/NCBI
|
|
18
|
Ness RA, Miller DD and Li W: The role of
vitamin D in cancer prevention. Chin J Nat Med. 13:481–497.
2015.PubMed/NCBI
|
|
19
|
Horst R, Prapong S, Reinhardt T, Koszewski
N, Knutson J and Bishop C: Comparison of the relative effects of
1,24-dihydroxyvitamin D(2) [1,24-(OH)(2)D(2)],
1,24-dihydroxyvitamin D(3) [1,24-(OH)(2)D(3)], and
1,25-dihydroxyvitamin D(3) [1,25-(OH) (2)D(3)] on selected vitamin
D-regulated events in the rat. Biochem Pharmacol. 60:701–708. 2000.
View Article : Google Scholar : PubMed/NCBI
|
|
20
|
Wietrzyk J, Pełczyńska M, Madej J, Dzimira
S, Kuśnierczyk H, Kutner A, Szelejewski W and Opolski A: Toxicity
and antineoplastic effect of (24R)-1,24-dihydroxyvitamin D3
(PRI-2191). Steroids. 69:629–635. 2004. View Article : Google Scholar : PubMed/NCBI
|
|
21
|
Milczarek M, Filip-Psurska B, Swiętnicki
W, Kutner A and Wietrzyk J: Vitamin D analogs combined with
5-fluorouracil in human HT-29 colon cancer treatment. Oncol Rep.
32:491–504. 2014. View Article : Google Scholar : PubMed/NCBI
|
|
22
|
Wietrzyk J, Chodyński M, Fitak H, Wojdat
E, Kutner A and Opolski A: Antitumor properties of diastereomeric
and geometric analogs of vitamin D3. Anticancer Drugs. 18:447–457.
2007. View Article : Google Scholar : PubMed/NCBI
|
|
23
|
Milczarek M, Chodyński M, Filip-Psurska B,
Martowicz A, Krupa M, Krajewski K, Kutner A and Wietrzyk J:
Synthesis and biological activity of diastereomeric and geometric
analogs of calcipotriol, PRI-2202 and PRI-2205, against human HL-60
leukemia and MCF-7 breast cancer cells. Cancers (Basel).
5:1355–1378. 2013. View Article : Google Scholar
|
|
24
|
Filip B, Milczarek M, Wietrzyk J,
Chodyński M and Kutner A: Antitumor properties of (5e,7e) analogs
of vitamin D3. J Steroid Biochem Mol Biol. 121:399–402. 2010.
View Article : Google Scholar : PubMed/NCBI
|
|
25
|
Hisatake J, Kubota T, Hisatake Y,
Uskokovic M, Tomoyasu S and Koeffler HP: 5,6-trans-16-ene-vitamin
D3: A new class of potent inhibitors of proliferation of prostate,
breast, and myeloid leukemic cells. Cancer Res. 59:4023–4029.
1999.PubMed/NCBI
|
|
26
|
Opolski A, Wietrzyk J, Siwinska A,
Marcinkowska E, Chrobak A, Radzikowski C and Kutner A: Biological
activity in vitro of side-chain modified analogues of calcitriol.
Curr Pharm Des. 6:755–765. 2000. View Article : Google Scholar : PubMed/NCBI
|
|
27
|
Wietrzyk J, Nevozhay D, Filip B, Milczarek
M and Kutner A: The antitumor effect of lowered doses of
cytostatics combined with new analogs of vitamin D in mice.
Anticancer Res. 27A:3387–3398. 2007.
|
|
28
|
Wietrzyk J, Milczarek M and Kutner A: The
effect of combined treatment on head and neck human cancer cell
lines with novel analogs of calcitriol and cytostatics. Oncol Res.
16:517–525. 2007. View Article : Google Scholar
|
|
29
|
Wietrzyk J, Nevozhay D, Milczarek M, Filip
B and Kutner A: Toxicity and antitumor activity of the vitamin D
analogs PRI-1906 and PRI-1907 in combined treatment with
cyclophosphamide in a mouse mammary cancer model. Cancer Chemother
Pharmacol. 62:787–797. 2008. View Article : Google Scholar : PubMed/NCBI
|
|
30
|
Milczarek M, Psurski M, Kutner A and
Wietrzyk J: Vitamin D analogs enhance the anticancer activity of
5-fluorouracil in an in vivo mouse colon cancer model. BMC Cancer.
13:2942013. View Article : Google Scholar : PubMed/NCBI
|
|
31
|
Maj E, Filip-Psurska B, Świtalska M,
Kutner A and Wietrzyk J: Vitamin D analogs potentiate the antitumor
effect of imatinib mesylate in a human A549 lung tumor model. Int J
Mol Sci. 16:27191–27207. 2015. View Article : Google Scholar : PubMed/NCBI
|
|
32
|
Blazejczyk A, Papiernik D, Porshneva K,
Sadowska J and Wietrzyk J: Endothelium and cancer metastasis:
Perspectives for antimetastatic therapy. Pharmacol Rep. 67:711–718.
2015. View Article : Google Scholar : PubMed/NCBI
|
|
33
|
Chodyński M, Wietrzyk J, Marcinkowska E,
Opolski A, Szelejewski W and Kutner A: Synthesis and
antiproliferative activity of side-chain unsaturated and
homologated analogs of 1,25-dihydroxyvitamin D(2).
(24E)-(1s)-24-Dehydro-24a-homo-1,25-dihydroxyergocalciferol and
congeners. Steroids. 67:789–798. 2002. View Article : Google Scholar
|
|
34
|
DuPré SA, Redelman D and Hunter KW Jr: The
mouse mammary carcinoma 4T1: Characterization of the cellular
landscape of primary tumours and metastatic tumour foci. Int J Exp
Pathol. 88:351–360. 2007. View Article : Google Scholar : PubMed/NCBI
|
|
35
|
Nevozhay D: Cheburator software for
automatically calculating drug inhibitory concentrations from in
vitro screening assays. PLoS One. 9:e1061862014. View Article : Google Scholar : PubMed/NCBI
|
|
36
|
Wenzel J, Zeisig R and Fichtner I:
Inhibition of metastasis in a murine 4T1 breast cancer model by
liposomes preventing tumor cell-platelet interactions. Clin Exp
Metastasis. 27:25–34. 2010. View Article : Google Scholar
|
|
37
|
DuPre' SA and Hunter KW Jr: Murine mammary
carcinoma 4T1 induces a leukemoid reaction with splenomegaly:
Association with tumor-derived growth factors. Exp Mol Pathol.
82:12–24. 2007. View Article : Google Scholar
|
|
38
|
Banka CL, Lund CV, Nguyen MTN, Pakchoian
AJ, Mueller BM and Eliceiri BP: Estrogen induces lung metastasis
through a host compartment-specific response. Cancer Res.
66:3667–3672. 2006. View Article : Google Scholar : PubMed/NCBI
|
|
39
|
MacRitchie AN, Jun SS, Chen Z, German Z,
Yuhanna IS, Sherman TS and Shaul PW: Estrogen upregulates
endothelial nitric oxide synthase gene expression in fetal
pulmonary artery endothelium. Circ Res. 81:355–362. 1997.
View Article : Google Scholar : PubMed/NCBI
|
|
40
|
Yang X, Belosay A, Du M, Fan TM, Turner
RT, Iwaniec UT and Helferich WG: Estradiol increases ER-negative
breast cancer metastasis in an experimental model. Clin Exp
Metastasis. 30:711–721. 2013. View Article : Google Scholar : PubMed/NCBI
|
|
41
|
Garcia CM de S, de Araújo MR, Lopes MTP,
Ferreira MAND and Cassali GD: Morphological and immunophenotipical
characterization of murine mammary carcinoma 4t1. Braz J Vet
Pathol. 7:158–165. 2014.
|
|
42
|
Mi Z, Guo H, Wai PY, Gao C, Wei J and Kuo
PC: Differential osteopontin expression in phenotypically distinct
subclones of murine breast cancer cells mediates metastatic
behavior. J Biol Chem. 279:46659–46667. 2004. View Article : Google Scholar : PubMed/NCBI
|
|
43
|
Sangaletti S, Tripodo C, Sandri S,
Torselli I, Vitali C, Ratti C, Botti L, Burocchi A, Porcasi R,
Tomirotti A, et al: Osteopontin shapes immunosuppression in the
metastatic niche. Cancer Res. 74:4706–4719. 2014. View Article : Google Scholar : PubMed/NCBI
|
|
44
|
Pang H, Lu H, Song H, Meng Q, Zhao Y, Liu
N, Lan F, Liu Y, Yan S, Dong X, et al: Prognostic values of
osteopontin-c, E-cadherin and β-catenin in breast cancer. Cancer
Epidemiol. 37:985–992. 2013. View Article : Google Scholar : PubMed/NCBI
|
|
45
|
Chang P-L, Harkins L, Hsieh Y-H, Hicks P,
Sappayatosok K, Yodsanga S, Swasdison S, Chambers AF, Elmets CA and
Ho KJ: Osteopontin expression in normal skin and non-melanoma skin
tumors. J Histochem Cytochem. 56:57–66. 2008. View Article : Google Scholar
|
|
46
|
Yin M, Soikkeli J, Jahkola T, Virolainen
S, Saksela O and Hölttä E: Osteopontin promotes the invasive growth
of melanoma cells by activating integrin αvβ3 and down-regulating
tetraspanin CD9. Am J Pathol. 184:842–858. 2014. View Article : Google Scholar : PubMed/NCBI
|
|
47
|
Sulpice L, Rayar M, Desille M, Turlin B,
Fautrel A, Boucher E, Llamas-Gutierrez F, Meunier B, Boudjema K,
Clément B, et al: Molecular profiling of stroma identifies
osteopontin as an independent predictor of poor prognosis in
intrahepatic cholangiocarcinoma. Hepatology. 58:1992–2000. 2013.
View Article : Google Scholar : PubMed/NCBI
|
|
48
|
Pang H, Cai L, Yang Y, Chen X, Sui G and
Zhao C: Knockdown of osteopontin chemosensitizes MDA-MB-231 cells
to cyclophosphamide by enhancing apoptosis through activating p38
MAPK pathway. Cancer Biother Radiopharm. 26:165–173. 2011.
View Article : Google Scholar : PubMed/NCBI
|
|
49
|
Denhardt DT, Noda M, O'Regan AW, Pavlin D
and Berman JS: Osteopontin as a means to cope with environmental
insults: Regulation of inflammation, tissue remodeling, and cell
survival. J Clin Invest. 107:1055–1061. 2001. View Article : Google Scholar : PubMed/NCBI
|
|
50
|
Kon S, Nakayama Y, Matsumoto N, Ito K,
Kanayama M, Kimura C, Kouro H, Ashitomi D, Matsuda T and Uede T: A
novel cryptic binding motif, LRSKSRSFQVSDEQY, in the C-terminal
fragment of MMP-3/7-cleaved osteopontin as a novel ligand for α9β1
integrin is involved in the anti-type II collagen antibody-induced
arthritis. PLoS One. 9:e1162102014. View Article : Google Scholar
|
|
51
|
Barry ST, Ludbrook SB, Murrison E and
Horgan CM: A regulated interaction between alpha5beta1 integrin and
osteopontin. Biochem Biophys Res Commun. 267:764–769. 2000.
View Article : Google Scholar : PubMed/NCBI
|
|
52
|
Helluin O, Chan C, Vilaire G, Mousa S,
DeGrado WF and Bennett JS: The activation state of alphavbeta 3
regulates platelet and lymphocyte adhesion to intact and
thrombin-cleaved osteopontin. J Biol Chem. 275:18337–18343. 2000.
View Article : Google Scholar : PubMed/NCBI
|
|
53
|
Kale S, Raja R, Thorat D, Soundararajan G,
Patil TV and Kundu GC: Osteopontin signaling upregulates
cyclooxy-genase-2 expression in tumor-associated macrophages
leading to enhanced angiogenesis and melanoma growth via α9β1
integrin. Oncogene. 33:2295–2306. 2014. View Article : Google Scholar
|
|
54
|
Raja R, Kale S, Thorat D, Soundararajan G,
Lohite K, Mane A, Karnik S and Kundu GC: Hypoxia-driven osteopontin
contributes to breast tumor growth through modulation of
HIF1α-mediated VEGF-dependent angiogenesis. Oncogene. 33:2053–2064.
2014. View Article : Google Scholar
|
|
55
|
Noda M, Vogel RL, Craig AM, Prahl J,
DeLuca HF and Denhardt DT: Identification of a DNA sequence
responsible for binding of the 1,25-dihydroxyvitamin D3 receptor
and 1,25-dihydroxyvitamin D3 enhancement of mouse secreted
phosphoprotein 1 (SPP-1 or osteopontin) gene expression. Proc Natl
Acad Sci USA. 87:9995–9999. 1990. View Article : Google Scholar : PubMed/NCBI
|
|
56
|
Xu H, McCann M, Zhang Z, Posner GH,
Bingham V, El-Tanani M and Campbell FC: Vitamin D receptor
modulates the neoplastic phenotype through antagonistic growth
regulatory signals. Mol Carcinog. 48:758–772. 2009. View Article : Google Scholar : PubMed/NCBI
|
|
57
|
Lau WL, Leaf EM, Hu MC, Takeno MM, Kuro-o
M, Moe OW and Giachelli CM: Vitamin D receptor agonists increase
klotho and osteopontin while decreasing aortic calcification in
mice with chronic kidney disease fed a high phosphate diet. Kidney
Int. 82:1261–1270. 2012. View Article : Google Scholar : PubMed/NCBI
|
|
58
|
Hu B, Zhou H, Gao H, Liu Y, Yan T, Zou L
and Chen L: IFN-γ inhibits osteopontin expression in human decidual
stromal cells and can be attenuated by 1α,25-dihydroxyvitamin D3.
Am J Reprod Immunol. 68:353–361. 2012. View Article : Google Scholar : PubMed/NCBI
|
|
59
|
Chang PL, Ridall AL and Prince CW:
Calcitriol regulation of osteopontin expression in mouse epidermal
cells. Endocrinology. 135:863–869. 1994. View Article : Google Scholar : PubMed/NCBI
|
|
60
|
Chang PL and Prince CW:
1α,25-dihydroxyvitamin D3 stimulates synthesis and secretion of
nonphosphorylated osteopontin (secreted phosphoprotein 1) in mouse
JB6 epidermal cells. Cancer Res. 51:2144–2150. 1991.PubMed/NCBI
|
|
61
|
Blomberg Jensen M, Jørgensen A, Nielsen
JE, Steinmeyer A, Leffers H, Juul A and Rajpert-De Meyts E: Vitamin
D metabolism and effects on pluripotency genes and cell
differentiation in testicular germ cell tumors in vitro and in
vivo. Neoplasia. 14:952–963. 2012. View Article : Google Scholar : PubMed/NCBI
|
|
62
|
Chakraborty G, Jain S and Kundu GC:
Osteopontin promotes vascular endothelial growth factor-dependent
breast tumor growth and angiogenesis via autocrine and paracrine
mechanisms. Cancer Res. 68:152–161. 2008. View Article : Google Scholar : PubMed/NCBI
|
|
63
|
Das S, Samant RS and Shevde LA:
Nonclassical activation of Hedgehog signaling enhances multidrug
resistance and makes cancer cells refractory to
smoothened-targeting Hedgehog inhibition. J Biol Chem.
288:11824–11833. 2013. View Article : Google Scholar : PubMed/NCBI
|
|
64
|
Shevde LA and Samant RS: Role of
osteopontin in the pathophysiology of cancer. Matrix Biol.
37:131–141. 2014. View Article : Google Scholar : PubMed/NCBI
|
|
65
|
Johnstone CN, Smith YE, Cao Y, Burrows AD,
Cross RS, Ling X, Redvers RP, Doherty JP, Eckhardt BL, Natoli AL,
et al: Functional and molecular characterisation of EO771.LMB
tumours, a new C57BL/6-mouse-derived model of spontaneously
metastatic mammary cancer. Dis Model Mech. 8:237–251. 2015.
View Article : Google Scholar : PubMed/NCBI
|
|
66
|
Yu Y, Xiao C-H, Tan L-D, Wang Q-S, Li X-Q
and Feng Y-M: Cancer-associated fibroblasts induce
epithelial-mesenchymal transition of breast cancer cells through
paracrine TGF-β signalling. Br J Cancer. 110:724–732. 2014.
View Article : Google Scholar
|
|
67
|
Inai T, Mancuso M, Hashizume H, Baffert F,
Haskell A, Baluk P, Hu-Lowe DD, Shalinsky DR, Thurston G,
Yancopoulos GD, et al: Inhibition of vascular endothelial growth
factor (VEGF) signaling in cancer causes loss of endothelial
fenestrations, regression of tumor vessels, and appearance of
basement membrane ghosts. Am J Pathol. 165:35–52. 2004. View Article : Google Scholar : PubMed/NCBI
|
|
68
|
Maj E, Papiernik D and Wietrzyk J:
Antiangiogenic cancer treatment: The great discovery and greater
complexity (Review). Int J Oncol. 49:1773–1784. 2016.PubMed/NCBI
|
|
69
|
Molin DGM, van den Akker NM and Post MJ:
Affirmative action of osteopontin on endothelial progenitors.
Arterioscler Thromb Vasc Biol. 28:2099–2100. 2008. View Article : Google Scholar : PubMed/NCBI
|
|
70
|
Leen LLS, Filipe C, Billon A, Garmy-Susini
B, Jalvy S, Robbesyn F, Daret D, Allières C, Rittling SR, Werner N,
et al: Estrogen-stimulated endothelial repair requires osteopontin.
Arterioscler Thromb Vasc Biol. 28:2131–2136. 2008. View Article : Google Scholar : PubMed/NCBI
|
|
71
|
Pepper MS: Transforming growth
factor-beta: Vasculogenesis, angiogenesis, and vessel wall
integrity. Cytokine Growth Factor Rev. 8:21–43. 1997. View Article : Google Scholar : PubMed/NCBI
|
|
72
|
Costanza B, Umelo IA, Bellier J,
Castronovo V and Turtoi A: Stromal modulators of TGF-β in cancer. J
Clin Med. 6:72017. View Article : Google Scholar
|
|
73
|
Nakagawa T, Li JH, Garcia G, Mu W, Piek E,
Böttinger EP, Chen Y, Zhu HJ, Kang DH, Schreiner GF, et al: TGF-β
induces proangiogenic and antiangiogenic factors via parallel but
distinct Smad pathways. Kidney Int. 66:605–613. 2004. View Article : Google Scholar : PubMed/NCBI
|
|
74
|
Orlova VV, Liu Z, Goumans M-J and ten
Dijke P: Controlling angiogenesis by two unique TGF-β type I
receptor signaling pathways. Histol Histopathol. 26:1219–1230.
2011.PubMed/NCBI
|
|
75
|
Goumans M-J, Valdimarsdottir G, Itoh S,
Rosendahl A, Sideras P and ten Dijke P: Balancing the activation
state of the endothelium via two distinct TGF-beta type I
receptors. EMBO J. 21:1743–1753. 2002. View Article : Google Scholar : PubMed/NCBI
|
|
76
|
Khan Z and Marshall JF: The role of
integrins in TGFβ activation in the tumour stroma. Cell Tissue Res.
365:657–673. 2016. View Article : Google Scholar : PubMed/NCBI
|
|
77
|
Takai K, Le A, Weaver VM and Werb Z:
Targeting the cancer-associated fibroblasts as a treatment in
triple-negative breast cancer. Oncotarget. 7:82889–82901.
2016.PubMed/NCBI
|
|
78
|
Sharon Y, Raz Y, Cohen N, Ben-Shmuel A,
Schwartz H, Geiger T and Erez N: Tumor-derived osteopontin
reprograms normal mammary fibroblasts to promote inflammation and
tumor growth in breast cancer. Cancer Res. 75:963–973. 2015.
View Article : Google Scholar : PubMed/NCBI
|
|
79
|
Weber CE, Kothari AN, Wai PY, Li NY,
Driver J, Zapf MA, Franzen CA, Gupta GN, Osipo C, Zlobin A, et al:
Osteopontin mediates an MzF1-TGF-β1-dependent transformation of
mesenchymal stem cells into cancer-associated fibroblasts in breast
cancer. Oncogene. 34:4821–4833. 2015. View Article : Google Scholar
|
|
80
|
Koli K and Keski-Oja J:
1,25-Dihydroxyvitamin D3 enhances the expression of transforming
growth factor beta 1 and its latent form binding protein in
cultured breast carcinoma cells. Cancer Res. 55:1540–1546.
1995.PubMed/NCBI
|
|
81
|
Shany S, Sigal-Batikoff I and Lamprecht S:
Vitamin D and myofibroblasts in fibrosis and cancer: At
cross-purposes with TGF-β/SMAD signaling. Anticancer Res.
36:6225–6234. 2016. View Article : Google Scholar : PubMed/NCBI
|
|
82
|
Tao Q, Wang B, Zheng Y, Jiang X, Pan Z and
Ren J: Vitamin D prevents the intestinal fibrosis via induction of
vitamin D receptor and inhibition of transforming growth
factor-beta1/Smad3 pathway. Dig Dis Sci. 60:868–875. 2015.
View Article : Google Scholar
|
|
83
|
Ivanović V, Demajo M, Krtolica K,
Krajnović M, Konstantinović M, Baltić V, Prtenjak G, Stojiljković
B, Breberina M, Nesković-Konstantinović Z, et al: Elevated plasma
TGF-β1 levels correlate with decreased survival of metastatic
breast cancer patients. Clin Chim Acta. 371:191–193. 2006.
View Article : Google Scholar
|
|
84
|
Moo-Young TA, Larson JW, Belt BA, Tan MC,
Hawkins WG, Eberlein TJ, Goedegebuure PS and Linehan DC:
Tumor-derived TGF-beta mediates conversion of
CD4+Foxp3+ regulatory T cells in a murine
model of pancreas cancer. J Immunother. 32:12–21. 2009. View Article : Google Scholar : PubMed/NCBI
|
|
85
|
Gong D, Shi W, Yi SJ, Chen H, Groffen J
and Heisterkamp N: TGFβ signaling plays a critical role in
promoting alternative macrophage activation. BMC Immunol.
13:312012. View Article : Google Scholar
|
|
86
|
Fridlender ZG, Sun J, Kim S, Kapoor V,
Cheng G, Ling L, Worthen GS and Albelda SM: Polarization of
tumor-associated neutrophil phenotype by TGF-beta: 'N1' versus 'N2'
TAN. Cancer Cell. 16:183–194. 2009. View Article : Google Scholar : PubMed/NCBI
|
|
87
|
Wculek SK and Malanchi I: Neutrophils
support lung colonization of metastasis-initiating breast cancer
cells. Nature. 528:413–417. 2015. View Article : Google Scholar : PubMed/NCBI
|
|
88
|
Cho HJ, Jung JI, Lim DY, Kwon GT, Her S,
Park JH and Park JHY: Bone marrow-derived, alternatively activated
macrophages enhance solid tumor growth and lung metastasis of
mammary carcinoma cells in a Balb/C mouse orthotopic model. Breast
Cancer Res. 14:R812012. View Article : Google Scholar : PubMed/NCBI
|
|
89
|
Adams LS and Teegarden D:
1,25-dihydroxycholecalciferol inhibits apoptosis in C3H10T1/2
murine fibroblast cells through activation of nuclear factor
kappaB. J Nutr. 134:2948–2952. 2004.PubMed/NCBI
|
|
90
|
Cohen-Lahav M, Shany S, Tobvin D,
Chaimovitz C and Douvdevani A: Vitamin D decreases NFkappaB
activity by increasing IkappaBalpha levels. Nephrol Dial
Transplant. 21:889–897. 2006. View Article : Google Scholar : PubMed/NCBI
|
|
91
|
Williams JD, Aggarwal A, Swami S, Krishnan
AV, Ji L, Albertelli MA and Feldman BJ: Tumor autonomous effects of
Vitamin D deficiency promote breast cancer metastasis.
Endocrinology. 157:1341–1347. 2016. View Article : Google Scholar : PubMed/NCBI
|
|
92
|
Aslakson CJ and Miller FR: Selective
events in the metastatic process defined by analysis of the
sequential dissemination of subpopulations of a mouse mammary
tumor. Cancer Res. 52:1399–1405. 1992.PubMed/NCBI
|
|
93
|
Simões RV, Serganova IS, Kruchevsky N,
Leftin A, Shestov AA, Thaler HT, Sukenick G, Locasale JW, Blasberg
RG, Koutcher JA, et al: Metabolic plasticity of metastatic breast
cancer cells: Adaptation to changes in the microenvironment.
Neoplasia. 17:671–684. 2015. View Article : Google Scholar : PubMed/NCBI
|
|
94
|
Meyer MB, Benkusky NA, Kaufmann M, Lee SM,
Onal M, Jones G and Pike JW: A Kidney-specific genetic control
module in mice governs endocrine regulation of the cytochrome P450
gene Cyp27b1 essential for vitamin D 3 activation. J Biol Chem.
2017 Aug 14–2017.Epub ahead of print. View Article : Google Scholar
|
|
95
|
Anderson PH: Vitamin D activity and
metabolism in bone. Curr Osteoporos Rep. 15:443–449. 2017.
View Article : Google Scholar : PubMed/NCBI
|
|
96
|
Marik R, Fackler M, Gabrielson E, Zeiger
MA, Sukumar S, Stearns V and Umbricht CB: DNA methylation-related
vitamin D receptor insensitivity in breast cancer. Cancer Biol
Ther. 10:44–53. 2010. View Article : Google Scholar : PubMed/NCBI
|
|
97
|
Banwell CM, O'Neill LP, Uskokovic MR and
Campbell MJ: Targeting 1α,25-dihydroxyvitamin D3 antiproliferative
insensitivity in breast cancer cells by co-treatment with histone
deacetylation inhibitors. J Steroid Biochem Mol Biol.
89–90:245–249. 2004. View Article : Google Scholar
|
|
98
|
Khanim FL, Gommersall LM, Wood VHJ, Smith
KL, Montalvo L, O'Neill LP, Xu Y, Peehl DM, Stewart PM, Turner BM,
et al: Altered SMRT levels disrupt vitamin D3 receptor signalling
in prostate cancer cells. Oncogene. 23:6712–6725. 2004. View Article : Google Scholar : PubMed/NCBI
|
|
99
|
Zhi H-Y, Hou S-W, Li R-S, Basir Z, Xiang
Q, Szabo A and Chen G: PTPH1 cooperates with vitamin D receptor to
stimulate breast cancer growth through their mutual stabilization.
Oncogene. 30:1706–1715. 2011. View Article : Google Scholar :
|
|
100
|
Krishnan AV, Swami S and Feldman D:
Equivalent anticancer activities of dietary vitamin D and
calcitriol in an animal model of breast cancer: Importance of
mammary CYP27B1 for treatment and prevention. J Steroid Biochem Mol
Biol. 136:289–295. 2013. View Article : Google Scholar :
|
|
101
|
Swami S, Krishnan AV, Wang JY, Jensen K,
Horst R, Albertelli MA and Feldman D: Dietary vitamin D3 and
1,25-dihydroxyvitamin D3 (calcitriol) exhibit equivalent anticancer
activity in mouse xenograft models of breast and prostate cancer.
Endocrinology. 153:2576–2587. 2012. View Article : Google Scholar : PubMed/NCBI
|
|
102
|
Jeong Y, Swami S, Krishnan AV, Williams
JD, Martin S, Horst RL, Albertelli MA, Feldman BJ, Feldman D and
Diehn M: Inhibition of mouse breast tumor-initiating cells by
calcitriol and dietary vitamin D. Mol Cancer Ther. 14:1951–1961.
2015. View Article : Google Scholar : PubMed/NCBI
|
|
103
|
Rossdeutscher L, Li J, Luco A-L, Fadhil I,
Ochietti B, Camirand A, Huang DC, Reinhardt TA, Muller W and Kremer
R: Chemoprevention activity of 25-hydroxyvitamin D in the MMTV-PYMT
mouse model of breast cancer. Cancer Prev Res (Phila). 8:120–128.
2015. View Article : Google Scholar
|
|
104
|
Ooi LL, Zhou H, Kalak R, Zheng Y,
Conigrave AD, Seibel MJ and Dunstan CR: Vitamin D deficiency
promotes human breast cancer growth in a murine model of bone
metastasis. Cancer Res. 70:1835–1844. 2010. View Article : Google Scholar : PubMed/NCBI
|