Introduction
Prostate cancer (PCa) is the most commonly diagnosed
cancer in males and the second leading cause of cancer-related
mortality in the United States (1). Although the 5-year survival rate for
patients with PCa exceeds 95% for localized tumors, patients with
metastatic disease have an overall 5-year survival of <30%. The
measurement of the levels of secreted prostate-specific antigen
(PSA) has provided a valuable metric for PCa detection; however,
the reliability of PSA as a surrogate biomarker for disease
progression has recently been questioned (2). The crucial importance of measuring
biomarkers in tumor sections themselves is thus being emphasized,
and several of these have progressed into the clinical laboratory
(3–5). However, although PCa antigen-3
(PCA3), a long non-coding RNA (lncRNA), is often overexpressed in
tumor samples, PCA3 levels alone have failed to distinguish between
indolent and aggressive PCa (3).
Furthermore, although the transmembrane protease, serine 2
(TMPRSS2)-ETS-related gene (ERG) gene fusion is documented in
40–70% of patients with PCa (4,5),
both tumor heterogeneity and the lack of knowledge of its
functional gene product, render it unlikely that TMPRSS2-ERG
screening alone would be sufficient for ascertaining tumor
aggressiveness (6). Therefore,
there is an urgent need to identify more effective tumor biomarkers
whose expression is directly associated with the aggressive and
metastatic function of PCa cells.
Phosphatase of regenerating liver-3 [PRL-3; also
known as protein pyrosine phosphatase type IVA, member 3 (PTP4A3)]
is a protein tyrosine phosphatase frequently upregulated in tumor
cells undergoing epithelial to mesenchymal transition (EMT) and in
those with increased proliferative and metastatic ability (7,8). The
unique COOH-terminal prenylation motif of PRL-3 determines the
function of this protein and its location within the cell. Several
studies have also demonstrated that PRL-3 regulates the function of
p53, a crucial tumor suppressor protein that dictates cell cycle
progression, genomic stability and apoptosis (9–11).
However, although the increased PRL-3 expression, both at the mRNA
and protein level, has been reported in several solid tumors,
including breast and colorectal carcinomas (12,13),
its potential as a reliable biomarker of aggressive PCa and its
ability to predict disease progression has not yet been thoroughly
investigated, at least to the best of our knowledge.
In the present study, by using a high-density PCa
tumor microarray (TMA) and computer-aided image analysis software
(ImageJ™) we measured the PRL-3 protein levels in tumor sections
stratified according to the Gleason score (GS), Gleason grade (GG)
and tumor stage (T-stage). We aimed to determine whether the total
and subcellular levels of PRL-3 may be used to predict the
aggressive phenotype of prostate tumors. In addition, in
vitro experiments were carried out using PCa cell lines to
investigate the function of PRL-3 in PCa cells, under both basal
and androgen-stimulated conditions. Exposure to the androgen
agonist (R1881) increased the nuclear localization of PRL-3. The
overexpression of PRL-3 increased both the proliferative and
invasive potential of PCa cells. Our novel findings indicate that
PRL-3 is an effective biomarker of high-grade PCa and its
nuclear/cytoplasmic ratio may be used to distinguish between
indolent vs. aggressive tumors.
Materials and methods
Reagents
Cell culture media and antibiotics were purchased
from CellGro (Manassas, VA, USA). Fetal bovine serum (FBS) was
obtained from Atlanta Biologicals (Lawrenceville, GA, USA) and
charcoal-stripped FBS (CS-FBS) was from Invitrogen (Carlsbad, CA,
USA). The synthetic androgen, R1881, was purchased from
Sigma-Aldrich (St. Louis, MO, USA). The subcellular fractionation
kit was from Thermo Scientific (Rockford, IL, USA). Primary
antibody against AR (cat. no. 06680) was from Millipore (Billerica,
MA, USA) and antibody against PRL-3 (cat. no. ab50276) was from
Abcam (Cambridge, MA, USA). The secondary antibody, TX-Red
conjugated goat anti-rabbit IgG (cat. no. T-2767) was from Life
Technologies (Carlsbad, CA, USA). Vectashield™ mounting medium
containing DAPI was purchased from Vector Laboratories (Burlingame,
CA, USA). The PRL-3 expression plasmid (pMLV-PRL-3) and the empty
vector (pBabe-puro) were kind gifts from Dr Y. Jiang (14). Transient transfection was performed
using a Lipofectamine LTX Plus kit from Invitrogen, and carried out
according to manufacturer's instructions. Vector-transfected cells
were harvested 24 h post-transfection and used in proliferation,
migration and invasion assays.
Oncomine database analysis
Oncomine is a web-based data-mining platform
(http://www.oncomine.org). Oncomine's gene search
function was used to locate microarray studies for which gene
expression data were publicly available. PRL-3 (also known
as PTP4A3) gene expression was queried between normal gland
and prostate adenocarcinoma. Data from large-scale microarray
studies were processed by Oncomine and results obtained were
presented in box plots, along with P-values, fold change and gene
rank. Query results from multiple studies showed significant
increases in PRL-3 gene expression in prostate
adenocarcinomas.
Tumor microarray
A high-density PCa TMA (cat. no. PR2085B) from
BioMax™ (Rockville, MD, USA) containing 208 tumor cores from 114
patients was used for our immunostaining and digital image analysis
(DIA). These 114 tissue cores included 8 normal samples and 106
tumor samples, which were represented by 2 transitional cell
carcinomas, 12 tumor-adjacent normal tissue samples and 92 prostate
adenocarcinomas. Furthermore, these 106 tumor samples consisted of
15 non-malignant cores and 91 malignant cores. In the TMA, the
prostate tumor cores were also stratified by their pathological
landscapes, i.e., GS, GG and T-stage.
Cell culture
The LNCaP, PC3, DU-145 and CWR22Rv1 cells were
purchased from the American Type Culture Collection (ATCC,
Rockville, MD, USA). The LNCaP-SF cell line was generated in Dr
Iwasa's laboratory (15) and the
LAPC4 cell line was developed in Dr van Bokhoven's laboratory
(16). All PCa cell lines were
maintained in RPMI-1640 medium containing antibiotics
(penicillin/streptomycin) and supplemented with 10% FBS. The cells
were grown at 37°C in a humidified incubator containing 5%
CO2. In specific experiments, to mimic steroid hormone
deprived conditions, experiments were carried out in media
supplemented with 10% CS-FBS. The cells were cultured at 37°C in a
humidified incubator containing 5% CO2.
Cell proliferation assay
MTT assays were performed to determine cell
proliferation in both the control vector- and PRL-3
vector-transduced cells. Briefly, the cells were seeded in a
96-well plate (5×10³/well) and proliferation was
measured at 24–72 h. At the indicated time points, MTT dye (20
μl) (Sigma-Aldrich) was added to each well and incubation
was carried out for 3–4 h at 37°C. The formazan crystals were
solubilized in DMSO and optical density (OD) was measured at 540 nm
using a μQuant spectrophotometric plate reader from Bio-Tek
(Seattle, WA, USA). Differences in cell proliferation between the
empty vector-transduced (control) and PRL-3 transduced cells
(experimental) are expressed as a percentage of the control.
Invasion assay
Boyden chambers were used to measure the effect of
PRL-3 overexpression on PCa cell invasion through Matrigel coated
inserts (8-μm pore). Matrigel (cat. no. 356230) was
purchased from BD Biosciences (San Jose, CA, USA). Both the control
and treated cells were suspended in medium containing 1% FBS and
added to the upper compartment, and medium containing 10% FBS was
added to the lower chamber. The cells (2×10⁵) were
placed on inserts coated with 30 μl Matrigel and invasion
was measured after 20 h of incubation at 37°C. Filters were fixed
with methanol for 30 min and then stained with 0.2% crystal violet
in 20% methanol for a further 30 min. The inserts were washed 4
times with distilled water, dried overnight, cells counted in 5
fields, and representative images were captured. Cells were counted
at ×10 magnification using an Olympus IX71 microscope with a DP71
digital camera (Olympus, Tokyo, Japan).
Migration assay
Wound healing assays were carried out to examine the
effects of PRL-3 overexpression on the migratory phenotype of PCa
cells. Briefly, the cells were grown in 6-well Petri-plates to
80–90% confluency, and a 1-ml pipette tip was used to scratch the
cell monolayer. At different time points (24–72 h) images of the
wound were captured using a Olympus IX71 microscope with a DP71
digital camera. Wound widths were calculated by measuring the
distance between 4–5 random points within the wound edges. Changes
in wound widths were calculated by dividing the average wound
widths observed at 12, 24 and 48 h by the average initial wound
widths at the 0–h time point.
Immunoblot analysis
The cells were seeded in 10-cm dishes and grown
until 80–90% confluent. For androgen stimulation experiments, the
cells were rinsed with 1X PBS, the medium was replaced with
phenol-red free RPMI-1640 with 10% CS-FBS for 24 h, following which
the cells were treated with the AR-agonist, R1881 (1 nM) for 2–48
h. Cytoplasmic and nuclear extracts were obtained using a
subcellular fractionation kit (cat. no. 78840; Thermo Scientific).
Cell lysates were electrophoresed using 4–20% Tris/glycine SDS-PAGE
gels. Resolved proteins were then transferred onto PVDF membranes
(Millipore) and non-specific binding blocked with 3% BSA in 1X
TBST. The blots were incubated overnight at 4°C with 1:500
dilutions of the primary antibodies against either AR or PRL-3.
Subsequently, the blots were washed and incubated with the
secondary antibody for 1 h. Blots were developed using enzyme
chemiluminescence (ECL) and visualized with a Fujifilm LAS-400
Luminescence Imager.
Immunostaining
The TMA sections first underwent heat-antigen
retrieval using Borg decloaker buffer (cat. no. BD100) from Biocare
Medical (Concord, CA, USA). Subsequently, the sections were
dehydrated with xylene and then rehydrated by sequential incubation
with 100, 95 and 70% ethanol, and then washed with PBS. The samples
were rinsed with 0.05% saponin in PBS. Cell permeabilization was
carried out by incubating the slides in 100% methanol at −20°C for
10 min. The sections were then rinsed with 0.05% saponin washing
buffer and blocked with normal goat serum containing blocking
buffer (cat. no. PCN500; Life Technologies). The sections were then
incubated with the primary antibody at 4°C overnight and then
incubated with the secondary antibody for 1 h at room temperature
and then treated with the Vectashield mounting medium.
Image acquisition and analysis
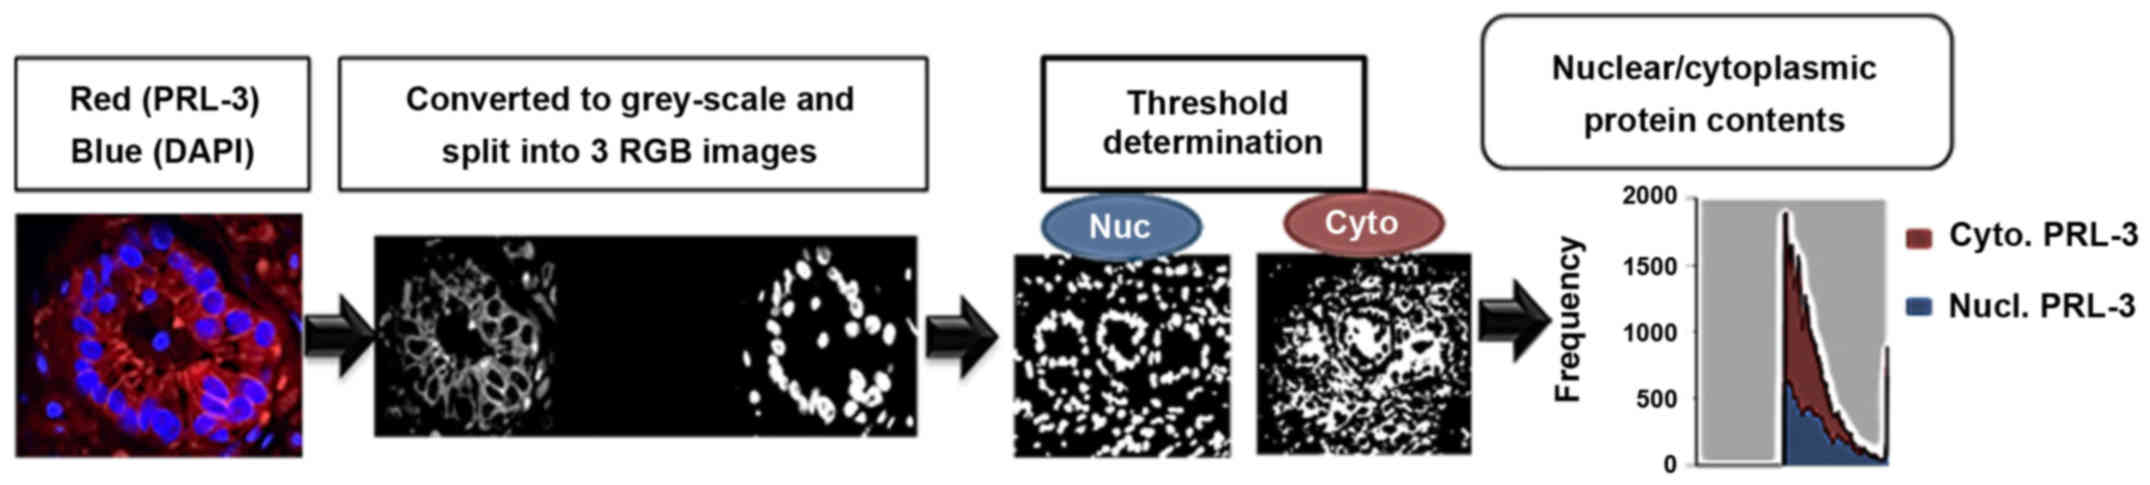
A schematic for image acquisition and analysis is
provided in Fig. 1. Briefly,
immunostained images were captured using a Nikon A1 Confocal
Microscope (Nikon, Melville, NY, USA) and visualized under ×60
magnification under oil immersion. An A1 Airy pinhole with a
Galvano scanner and 2 frames averaging was used to capture all
images in z-field planes and an auto-gain filter calibration was
used to process the sub-saturated images. For each core, 5 regions
of interest (ROI) were selected to represent the tumor pattern.
Both DAPI (nuclei) and TX-Red (PRL-3) staining were viewed
simultaneously.
Digital quantification of PRL-3 staining intensity
and its subcellular localization (cytoplasm vs. nuclear) were
determined by using ImageJ software with a ND2 Reader plug-in (NIH,
Bethesda, MD, USA), as previously described (17). Briefly, images were analyzed in
split channels for DAPI and TX-Red, and a median filter was applied
(3×3 pixels radius) to control for the background. Original images
were converted into binary masks, based on image thresholds. The
binary image of DAPI staining was subtracted from the TX-Red binary
image using the ImageJ image calculator. Subsequently, two binary
overlay images, representing 'true' cytoplasmic and nuclear
staining, were acquired and applied to the original PRL-3-stained
images to normalize the background. Five different ROIs were
assessed for their integrative density values (IDV). In each core,
total PRL-3 was quantified by taking the total TX-Red IDV divided
by the total DAPI IDV. In addition, to determine its subcellular
levels, nuclear staining intensity IDVs were divided by the IDV of
cytoplasmic staining, which provided a nuclear/cytoplasmic
(Nuc:Cyto) ratio (Fig. 1).
Ki67 staining
Ki67 staining of the tumor sections was carried out
to determine the proliferative index of ROIs. Briefly, the slides
were incubated for 1 h with blocking buffer in normal goat serum
(5% goat serum, 0.3% Triton X-100 in PBS) and MOM™ solution from
Vector Laboratories. The slides were then incubated overnight at
4°C with a 1:500 dilution of Ki67 antibody (cat. no. sc-23900;
Santa Cruz Biotechnology, Inc., Santa Cruz, CA, USA). Subsequently,
the slides were incubated for 45 min with 1:500 dilution of the
biotin-conjugated secondary antibody (cat. no. BP-9200; Vector
Laboratories), washed and then incubated with horseradish
peroxidase (HRP)-conjugated streptavidin (Vector Laboratories) for
25 min. The slides were then incubated with diamino benzidine (DAB;
Vector Laboratories) and images captured. Images were captured
using a Nikon Eclipse Ci microscope with a DS-U3 digital camera
(Nikon, Tokyo, Japan).
Statistical analysis
All measurement data were exported to an Excel
spreadsheet for further statistical analysis, as previously
described (18,19). Groups containing <4
representations (n<4) were not considered for statistical
analysis. The IDV values were averaged for each core and were
grouped according to the GS, GG and primary T-stage. Groups, where
continuous variables did not follow a normal distribution curve,
were assessed using the non-parametric rank testing. The
Mann-Whitney U test was used to compare staining differences
between the malignant and non-malignant cores. The Kruskal-Wallis H
test was used to compare PRL-3 staining intensities among different
GS and T-stage. Analyses were performed using GraphPad Prism and
SPSS statistical software packages.
Results
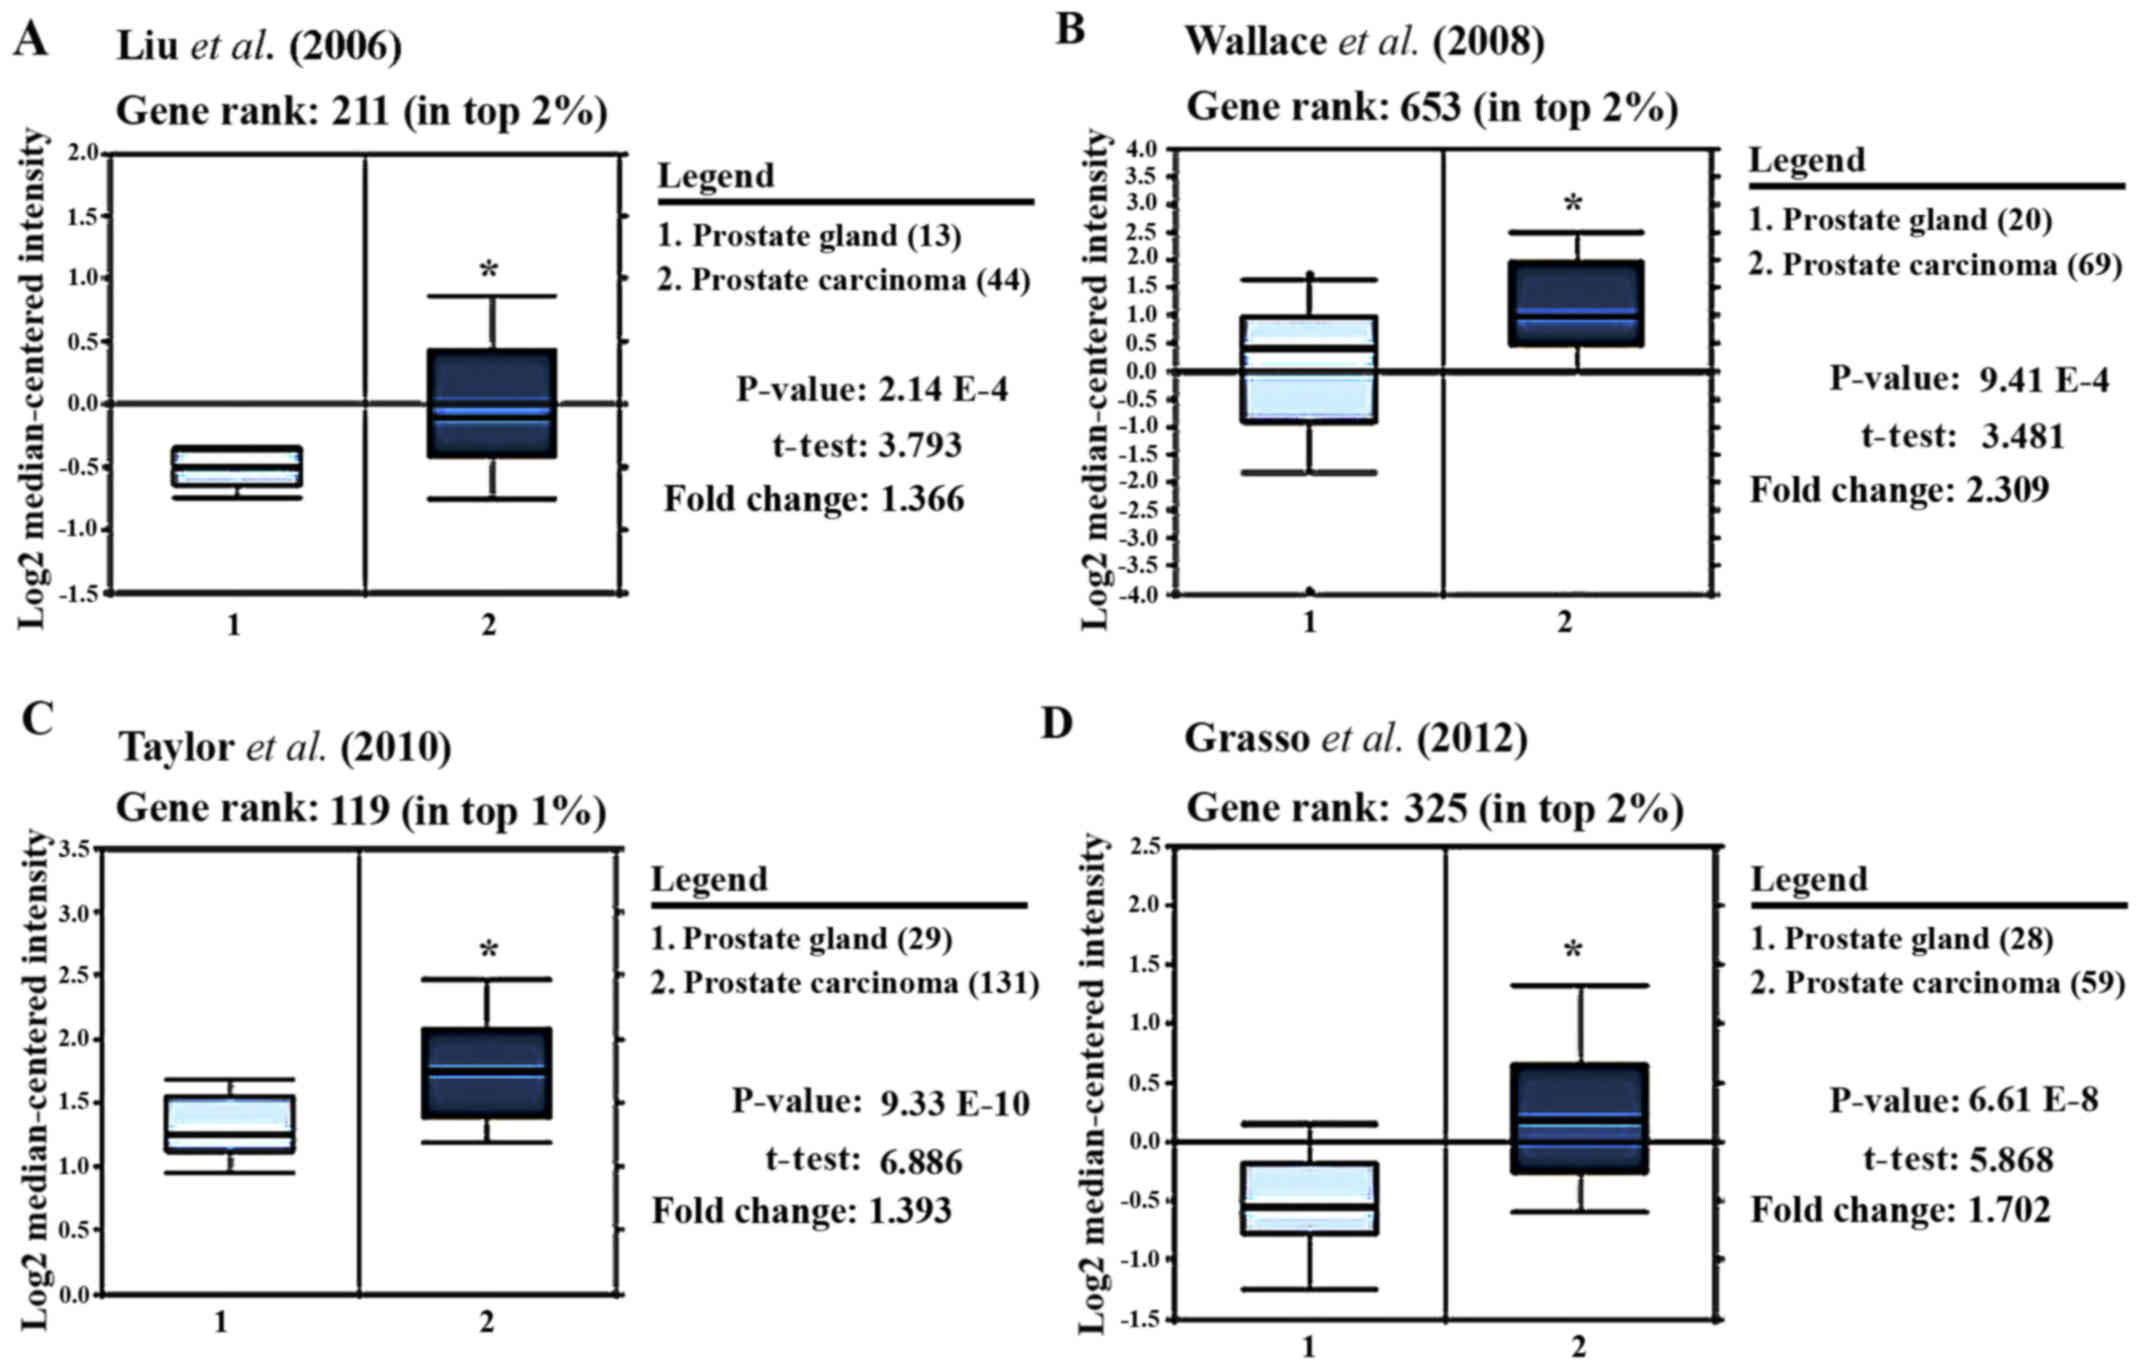
PRL-3 gene is overexpressed in prostate
adenocarcinomas
To determine whether PRL-3 gene expression is
associated with aggressive prostate tumors, we carried out an
Oncomine™ based database query (20). The analysis of the data from 4
previous reports is shown in Fig.
2. Liu et al was the first to clearly document
(P<0.0001) that PRL-3 gene expression was markedly higher
in tumor cores than in normal stromal areas (Fig. 2A) (21). In a later study, in which samples
were analyzed on an Affymetrix microarray, Wallace et al
demonstrated (P<0.0001) a >2-fold higher PRL-3
expression in tumor samples vs. normal stromal areas (Fig. 2B) (22). By comparing a large number of
prostate carcinoma and normal adjacent prostate tissue specimens,
Taylor et al also showed that PRL-3 was amongst the top 1%
of genes upregulated in prostate tumor cells (t=6.89, P<0.0001)
(Fig. 2C) (23). In a more recent study, PRL-3
expression was measured in both castrate-resistant metastatic PCa
and localized prostate carcinoma, and compared with benign prostate
tissue specimens (Fig. 2D). Grasso
et al clearly demonstrated that PRL-3 mRNA levels
were 1.7-fold higher in tumors vs. normal cores and ranked amongst
the top 2% of overexpressed genes in tumor cells (t=5.9,
P<0.0001) (24). Therefore,
PRL-3 gene expression is strongly associated with prostate
adenocarcinoma and is amongst the top 1–3% of overexpressed genes.
However, little is known about the expression of PRL-3 protein in
prostate tumors.
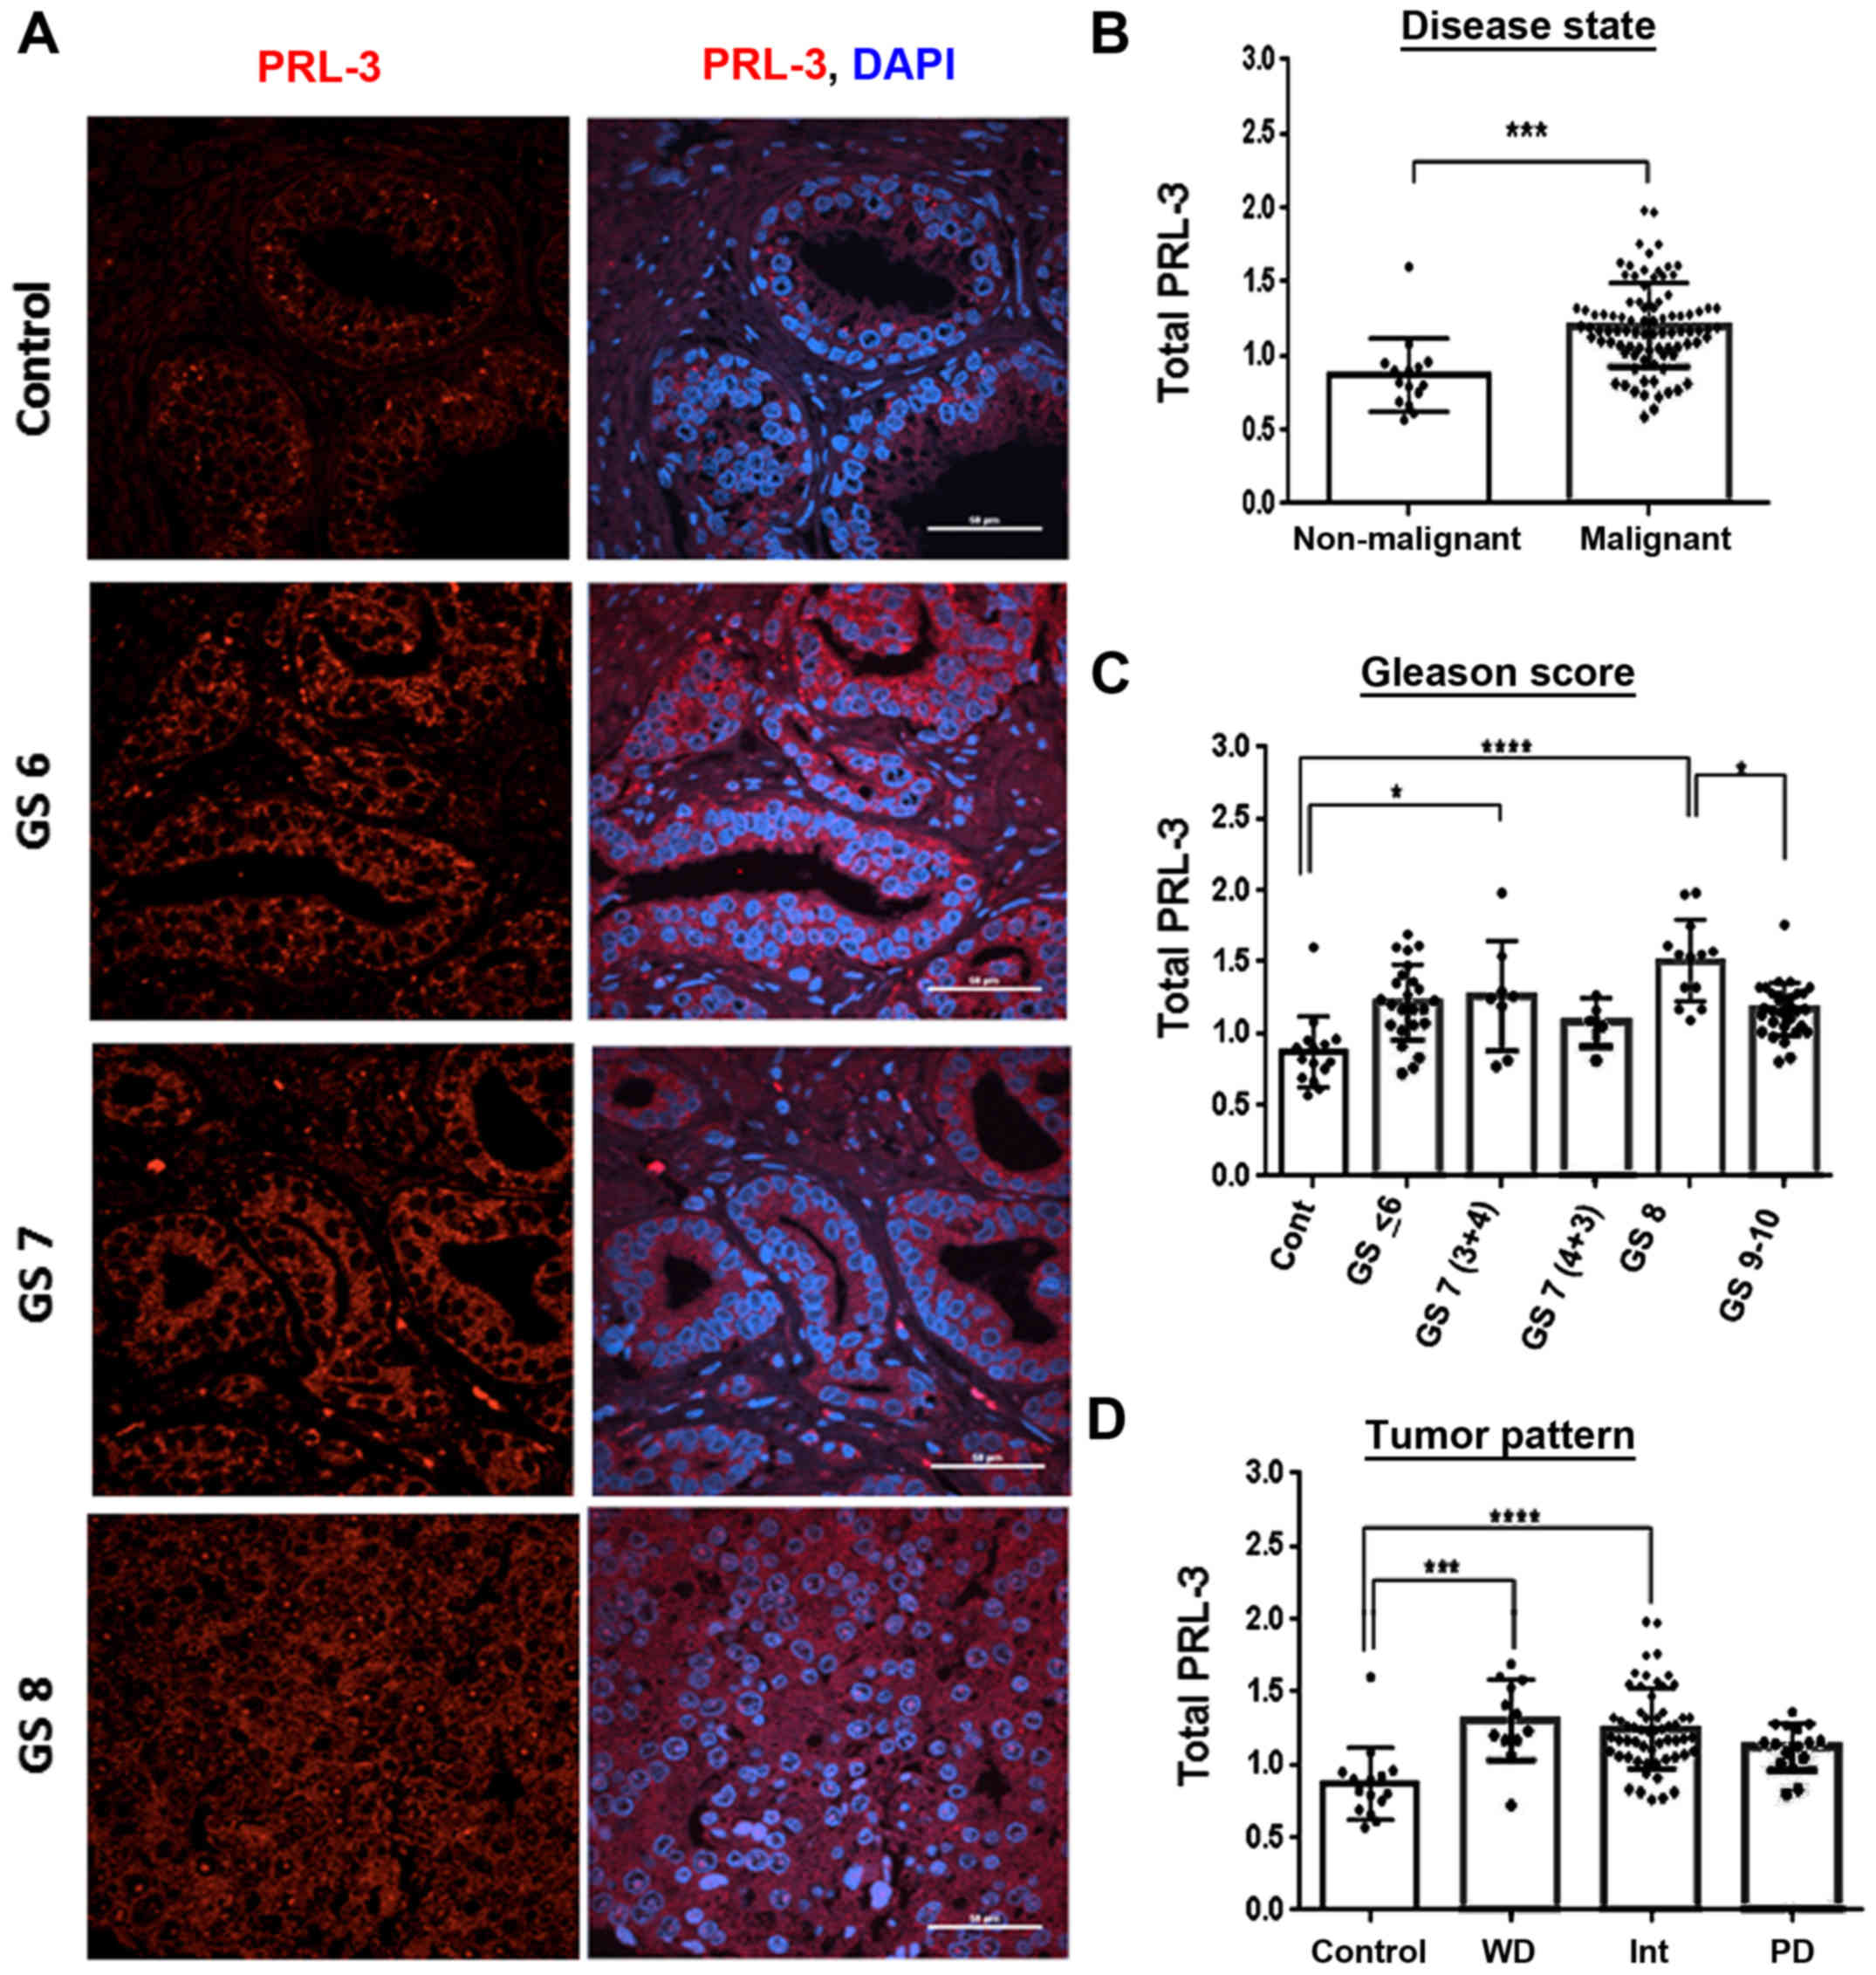
PRL-3 protein levels correlate with
aggressive prostate tumors
Using a validated PRL-3 antibody, we first
quantified PRL-3 staining intensity in both stromal areas and tumor
nodes. Confocal immunofluorescence microscopy was used to examine
the PRL-3 protein levels in PCa using a TMA containing prostate
tumor cores stratified by GS, GG and tumor, node and metastasis
(TNM) staging. The results obtained with the GS and GG
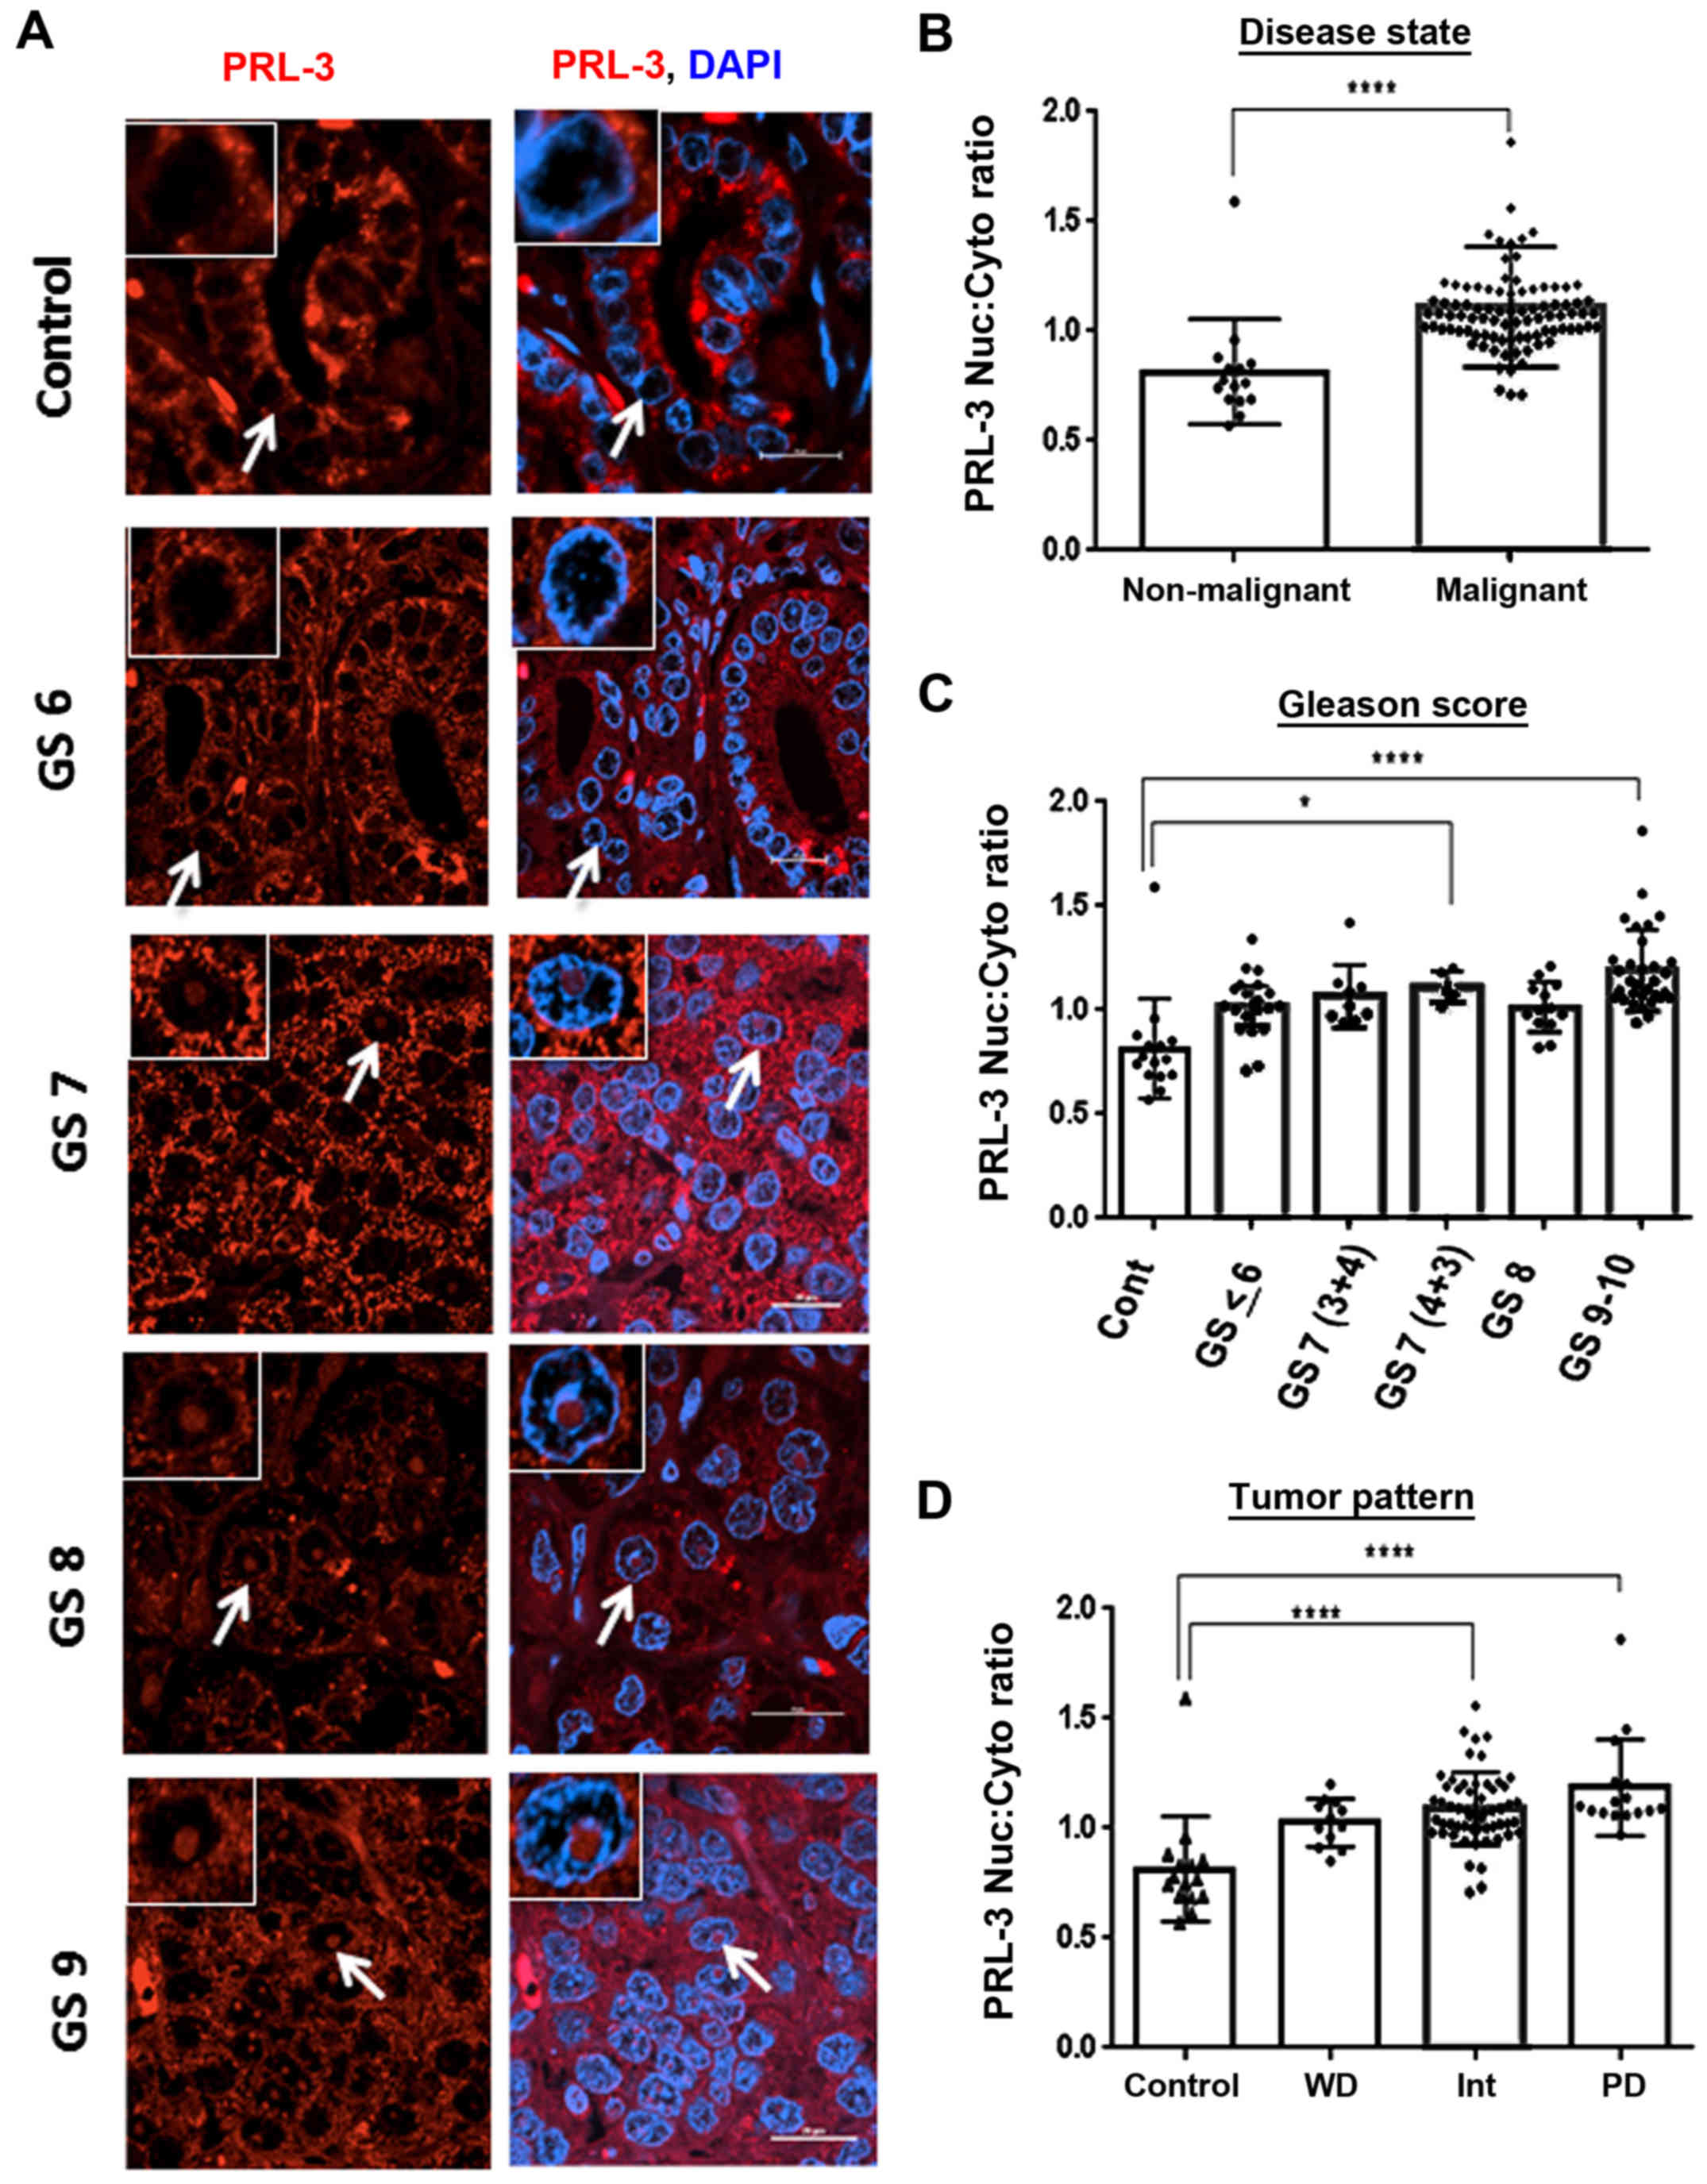
stratification are discussed herein (Fig. 3) and those correlating with TNM
classifications are presented later (Fig. 6). As compared to areas containing
normal glands (control), PRL-3-specific staining was increased in
aggressive tumor cores (GS6, GS7 and GS8) (Fig. 3A). In the tumor cores graded as GS6
and GS7, PRL-3 overexpression was primarily observed in the
cytoplasm, and the GS8-graded cores exhibited diffuse staining with
both nuclear and cytoplasmic PRL-3 detection (Fig. 3A). Furthermore, as compared to the
non-malignant cores (n=15), PRL-3 expression was significantly
higher in the malignant tissues (n=91) (U=212, P<0.0001)
(Fig. 3B). Of note, although total
PRL-3 expression was not directly associated with a lower GS,
several of the higher pathological cores exhibited a clearly
elevated PRL-3 expression (Fig. 3C
and Table I). In all malignant
tissues, the mean rank analysis demonstrated a 2.65-fold increase
in total PRL-3 expression, and the highest increase was observed in
GS8 cores (P<0.0001). Furthermore, although both the GS9-and
GS10-graded cores exhibited a higher PRL-3 expression compared to
the non-malignant cores, these aggressive tumor cores consistently
exhibited lower total PRL-3 levels than the GS8 cores (P<0.05).
The upregulation of total PRL-3 expression also correlated well
with increasing GG tumor cores. This was evident in both GG2- and
GG3-graded cores (P<0.001) and particularly in the GG4 cores
(P<0.0001) (Fig. 3D and
Table I). Importantly, although
the GS7 cores exhibited slight increases in total PRL-3 expression
(primarily cytoplasmic staining) this increase was mostly
associated with the less aggressive GS7 (3+4) cores (P<0.05),
but not with the more aggressive GS7 (4+3) cores, which showed
evidence of nuclear PRL-3 staining.
 | Table IDescriptive statistical analysis of
total PRL3 expression. |
Table I
Descriptive statistical analysis of
total PRL3 expression.
| N (%) | Median (IQR) | Mean rank | P-value |
|---|
| Disease state | | | | |
| Non-malignant | 15 (14.2) | 0.82 (0.69,
0.95) | 22.13 | |
| Malignant | 91 (85.8) | 1.18 (1.05,
1.32) | 58.67 | <0.0001 |
| Total | 106 (100) | | | |
| Gleason grade | | | | |
| Control | 15 (15) | 0.82 (0.69,
0.95) | 18.5 | |
| 1 | 4 (4.0) | 1.2 (0.83,
1.32) | 48.38 | |
| 2 | 8 (8) | 1.47 (1.18,
1.59) | 73.25 | <0.001 |
| 3 | 22 (22) | 1.18 (0.99,
1.31) | 52.09 | <0.01 |
| 4 | 35 (35) | 1.25 (1.09,
1.54) | 60.76 | <0.0001 |
| 5 | 16 (16) | 1.15 (1.02,
1.26) | 45.03 | |
| Total | 100 (100) | | | |
| Gleason score | | | | |
| Control | 15 (15.3) | 0.82 (0.69,
0.95) | 18.3 | |
| GS < 6 | 25 (25.5) | 1.23 (1.06,
1.44) | 55.3 | <0.01 |
| GS 3+4 | 8 (8.2) | 1.25 (0.90,
1.48) | 55.6 | <0.05 |
| GS 4+3 | 5 (5.1) | 1.09 (0.93,
1.21) | 37.6 | |
| GS 8 | 13 (13.3) | 1.55 (1.25,
1.68) | 77 | <0.0001 |
| GS 9–10 | 32 (32.6) | 1.16 (1.05,
1.28) | 48.75 | <0.01 |
| Total | 98 (100) | | | |
| Tumor stage | | | | |
| Control | 15 (14.7) | 0.82 (0.69,
0.95) | 19.3 | |
| T2 | 74 (72.5) | 1.23 (1.09,
1.36) | 60.1 | <0.0001 |
| T3 | 6 (5.9) | 1.21 (1.02,
1.49) | 56.92 | |
| T4 | 7 (6.9) | 0.81 (0.77,
1.20) | 25.1 | |
| Total | 102 (100) | | | |
PRL-3 expression correlates with the
aggressive function of PCa cell lines
A functional role for nuclear PRL-3 has been
implicated in previous studies (25,26).
Thus, in this study, to further corroborate our observations on
PRL-3 overexpression in clinical samples, we carried out in
vitro experiments to examine PRL-3 expression and function in
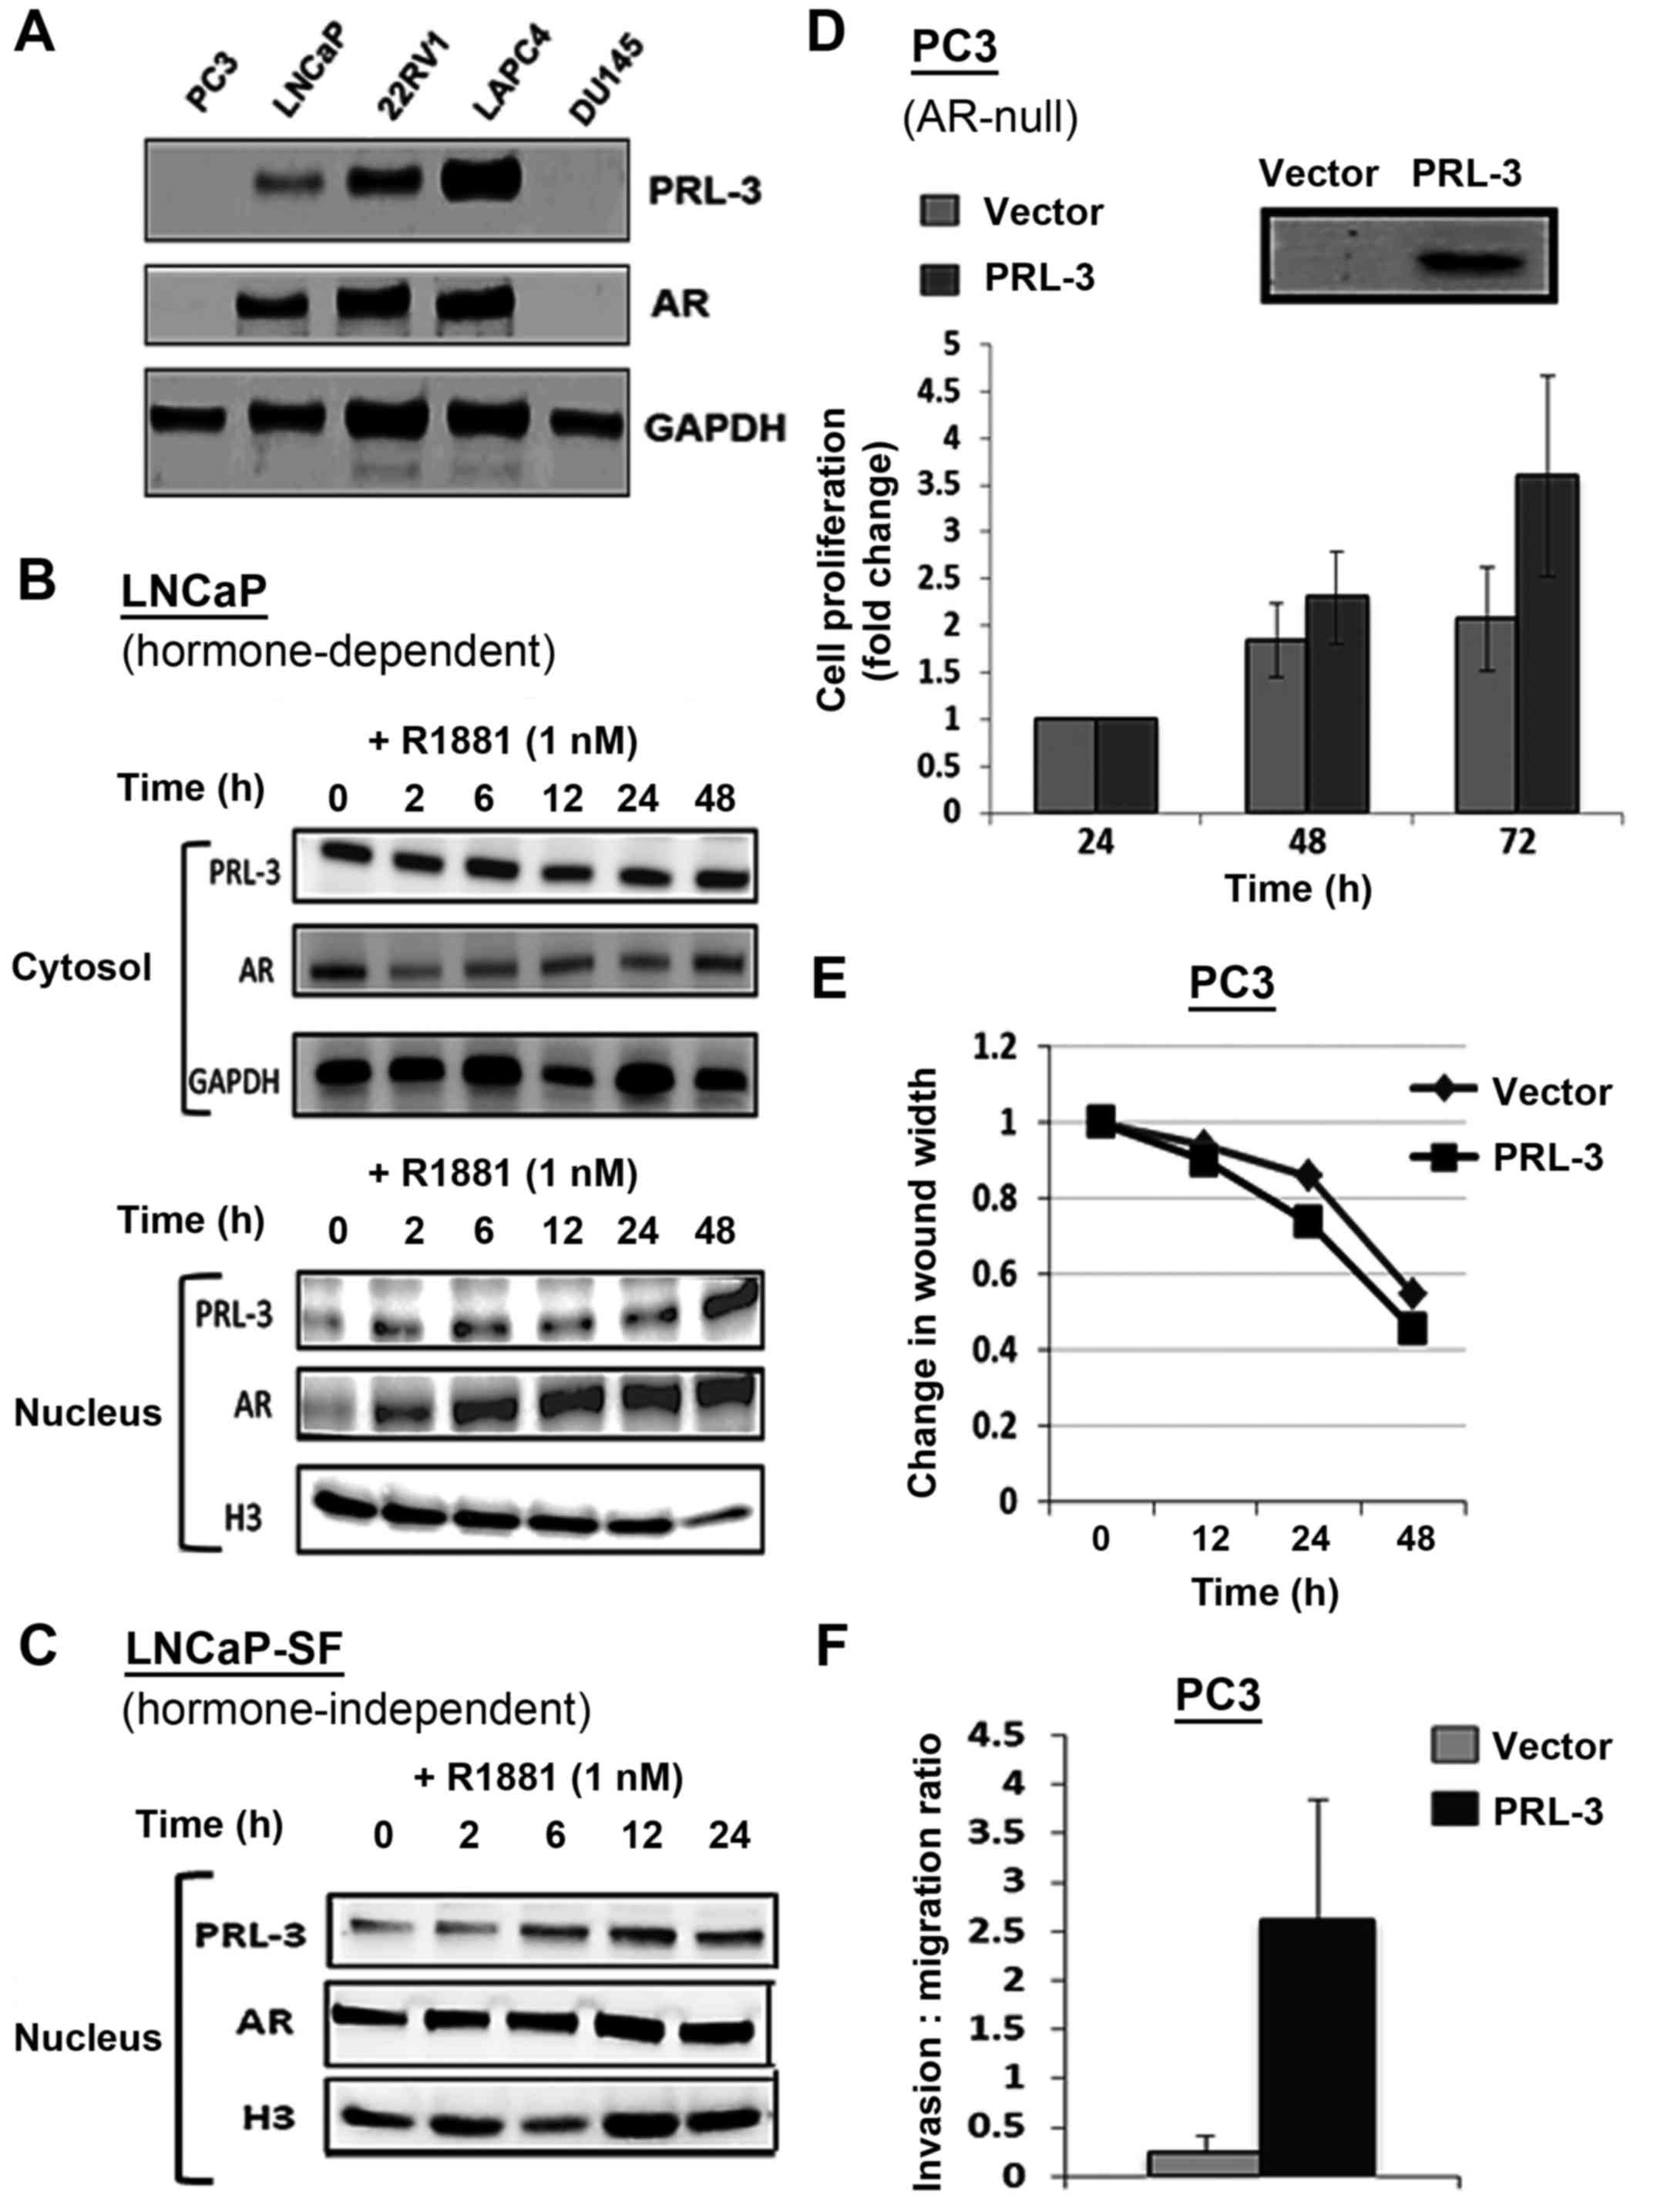
different PCa cell lines (Fig. 4).
Immunoblot analysis documented both the PRL-3 and androgen receptor
(AR) protein levels in the androgen-dependent cell line, LNCaP, as
well as in four castration resistant PCa (CRPC) cell lines, which
consisted of both AR-positive CRPC lines (i.e., CWR22Rv1 and LAPC4)
and AR-negative CRPC lines (i.e., PC3 and DU145) (Fig. 4A). Of note, the expression of PRL-3
directly correlated with the AR expression status of the PCa cell
lines, LNCaP, 22Rv1 and LAPC4. Negligible PRL3 expression was
observed in the AR-negative PC3 and DU145 cells (Fig. 4A). We then examined whether
androgen (R1881) stimulation alters PRL3 levels in PCa cells. In
the LNCaP cells, both AR and PRL-3 were sequestered in the
cytosolic fraction (Fig. 4B, top
panel) and stimulation with the AR agonist, R1881 (1 nM), caused a
rapid increase in nuclear AR levels within 2 h post-stimulation. Of
note, R1881 stimulation similarly increased the nuclear levels of
PRL-3 in the LNCaP cells (Fig. 4B,
bottom panel). The CRPC cell line, LNCaP-SF, exhibited constitutive
nuclear AR levels and R1881 stimulation only slightly increased the
nuclear AR levels in these cells (Fig.
4C). This clearly indicated that PRL-3 expression correlated
with the AR status of PCa cell lines and that PRL-3 translocated to
the nucleus following R1881 stimulation. Most interestingly,
similar to AR, the aggressive CRPC cells exhibited constitutive
nuclear PRL-3 levels.
We also examined whether PRL-3 overexpression alters
cellular functions associated with aggressive PCa. For these
experiments, the AR-null and PRL-3-null cell line, PC3, was
transfected with a PRL-3 expression vector and the resultant
effects on cell growth, invasion and migration were measured. Data
from MTT assays revealed that, as compared to the vector controls,
the PRL-3-overexpressing PC3 cells exhibited an enhanced rate of
proliferation at both 48 and 72 h post-transfection (Fig. 4D). Almost a 2-fold increase in cell
numbers was evident at 72 h in the PRL-3-overexpressing cells. In
addition, the effects of PRL-3 overexpression on the migratory
(Fig. 4E) and invasive (Fig. 4F) potential of the PC3 cells were
assessed by scratch wound and Boyden chamber assays, respectively.
The ectopic expression of PRL-3 did not affect the migratory
behavior of the PC3 cells (Fig.
4E); however, it profoundly increased the invasive potential of
these cells. As compared to the cells transfected with the control
vector, the PRL-3 vector-transfected cells exhibited a 2-3-fold
higher invasive potential through Matrigel-coated membrane inserts
(Fig. 4F). Thus, PRL-3
overexpression may play a direct role in both the proliferation and
invasion of PCa cells. These findings also suggested that the
androgen-stimulated nuclear localization of PRL-3 may be associated
with the aggressive phenotype of PCa cell lines.
Nuclear PRL-3 is associated with
high-grade tumors in patients
By the digital quantification of immunostained tumor
cores (Fig. 1), we evaluated the
differences in cytoplasmic and nuclear PRL-3 staining (Fig. 5). The nuclear/cytoplasmic ratios
for PRL-3 (Nuc:Cyto) were digitally quantified and compared with
different pathological states (Table
II). The GS6 tumor cores exhibited a very sparse number of
cells with nuclear PRL-3, and the more aggressive tumors,
particularly the GS8-and GS9-graded cores, clearly demonstrated a
larger population of cells with intense nuclear PRL-3 staining
(Fig. 5A). Of note, in the GS7-
and GS8-graded cores, we also noted that nuclear PRL-3 was
primarily localized in the central part of the nucleus. However, in
the GS9-graded cores, nuclear PRL-3 was more frequently associated
with the periphery of the nucleus rather than within the central
regions. The analysis of both non-malignant (n=15) vs. malignant
cores (n=91) clearly revealed that nuclear PRL-3 was positively
associated with prostate adeno-carcinoma (U=136.5, P<0.0001).
Importantly, the nuclear/cytoplasmic ratio assessments demonstrated
increased (P<0.05) nuclear PRL-3 in the highly aggressive GS7
(4+3)-graded cores compared to the less aggressive GS7 (3+4)-graded
cores (Fig. 5C and Table II). Similarly, despite decreases
in total PRL-3 in both the GS9- and GS10-graded cores (Fig. 3C and Table I), the number of cells containing
nuclear PRL-3 was significantly (P<0.0001) higher in the highly
aggressive tumor cores (Fig. 5C
and Table II). When grouped
according to tumor grade, mean rank analysis also revealed the
increased nuclear accumulation of PRL-3 in the GG4- and GG5-graded
cores (P<0.0001). Nuclear PRL-3 expression exhibited a strong
association with both intermediate (int) and poorly differentiated
(PD) tumor patterns, as compared to well-differentiated (WD) tumors
(P<0.0001) where PRL-3 was primarily localized in the cytoplasm
of WD tumors (GS ≤6); however, both the intermediate (GS7) and
poorly-differentiated (GS >7) tumors exhibited a higher nuclear
PRL3 expression (Fig. 5D). Thus,
the Nuc:Cyto ratio of PRL-3 may be used to distinguish between
indolent and aggressive disease.
| Table IIDescriptive statistical analysis of
nuclear PRL-3 expression. |
Table II
Descriptive statistical analysis of
nuclear PRL-3 expression.
| N (%) | Median (IQR) | Mean rank | P-value |
|---|
| Disease state | | | | |
| Non-malignant | 15 (14.2) | 0.76 (0.69,
0.85) | 17.1 | |
| Malignant | 91 (85.8) | 1.07 (1.0,
1.2) | 59.5 | <0.0001 |
| Total | 106 (100) | | | |
| Gleason grade | | | | |
| Control | 15 (15) | 0.76 (0.69,
0.85) | 16 | |
| 1 | 4 (4.0) | 1.00 (0.89,
1.1) | 40 | |
| 2 | 8 (8) | 1.06 (0.92,
1.1) | 48.44 | |
| 3 | 22 (22) | 1.01 (0.97,
1.11) | 45.6 | <0.05 |
| 4 | 35 (35) | 1.1 (1.02,
1.21) | 62.19 | <0.0001 |
| 5 | 16 (16) | 1.1 (1.07,
1.21) | 67.59 | <0.0001 |
| Total | 100 (100) | | | |
| Gleason score | | | | |
| Control | 15 (15.3) | 0.76 (0.69,
0.85) | 16.07 | |
| GS <6 | 25 (25.5) | 1.23 (1.06,
1.44) | 45.2 | <0.05 |
| GS 3+4 | 8 (8.2) | 1.25 (0.90,
1.48) | 50.67 | |
| GS 4+3 | 5 (5.1) | 1.09 (0.93,
1.21) | 64.9 | <0.05 |
| GS 8 | 13 (13.3) | 1.55 (1.24,
1.68) | 43.81 | |
| GS 9–10 | 32 (32.6) | 1.16 (1.05,
1.28) | 69.66 | <0.0001 |
| Total | 98 (100) | | | |
| Tumor stage | | | | |
| Control | 15 (14.7) | 0.76 (0.68,
0.95) | 16.93 | |
| T2 | 74 (72.5) | 1.08 (1.00,
1.19) | 59.63 | <0.0001 |
| T3 | 6 (5.9) | 0.99 (0.86,
1.07) | 37 | |
| T4 | 7 (6.9) | 1.07 (0.92,
1.4) | 58.44 | <0.001 |
| Total | 102 (100) | | | |
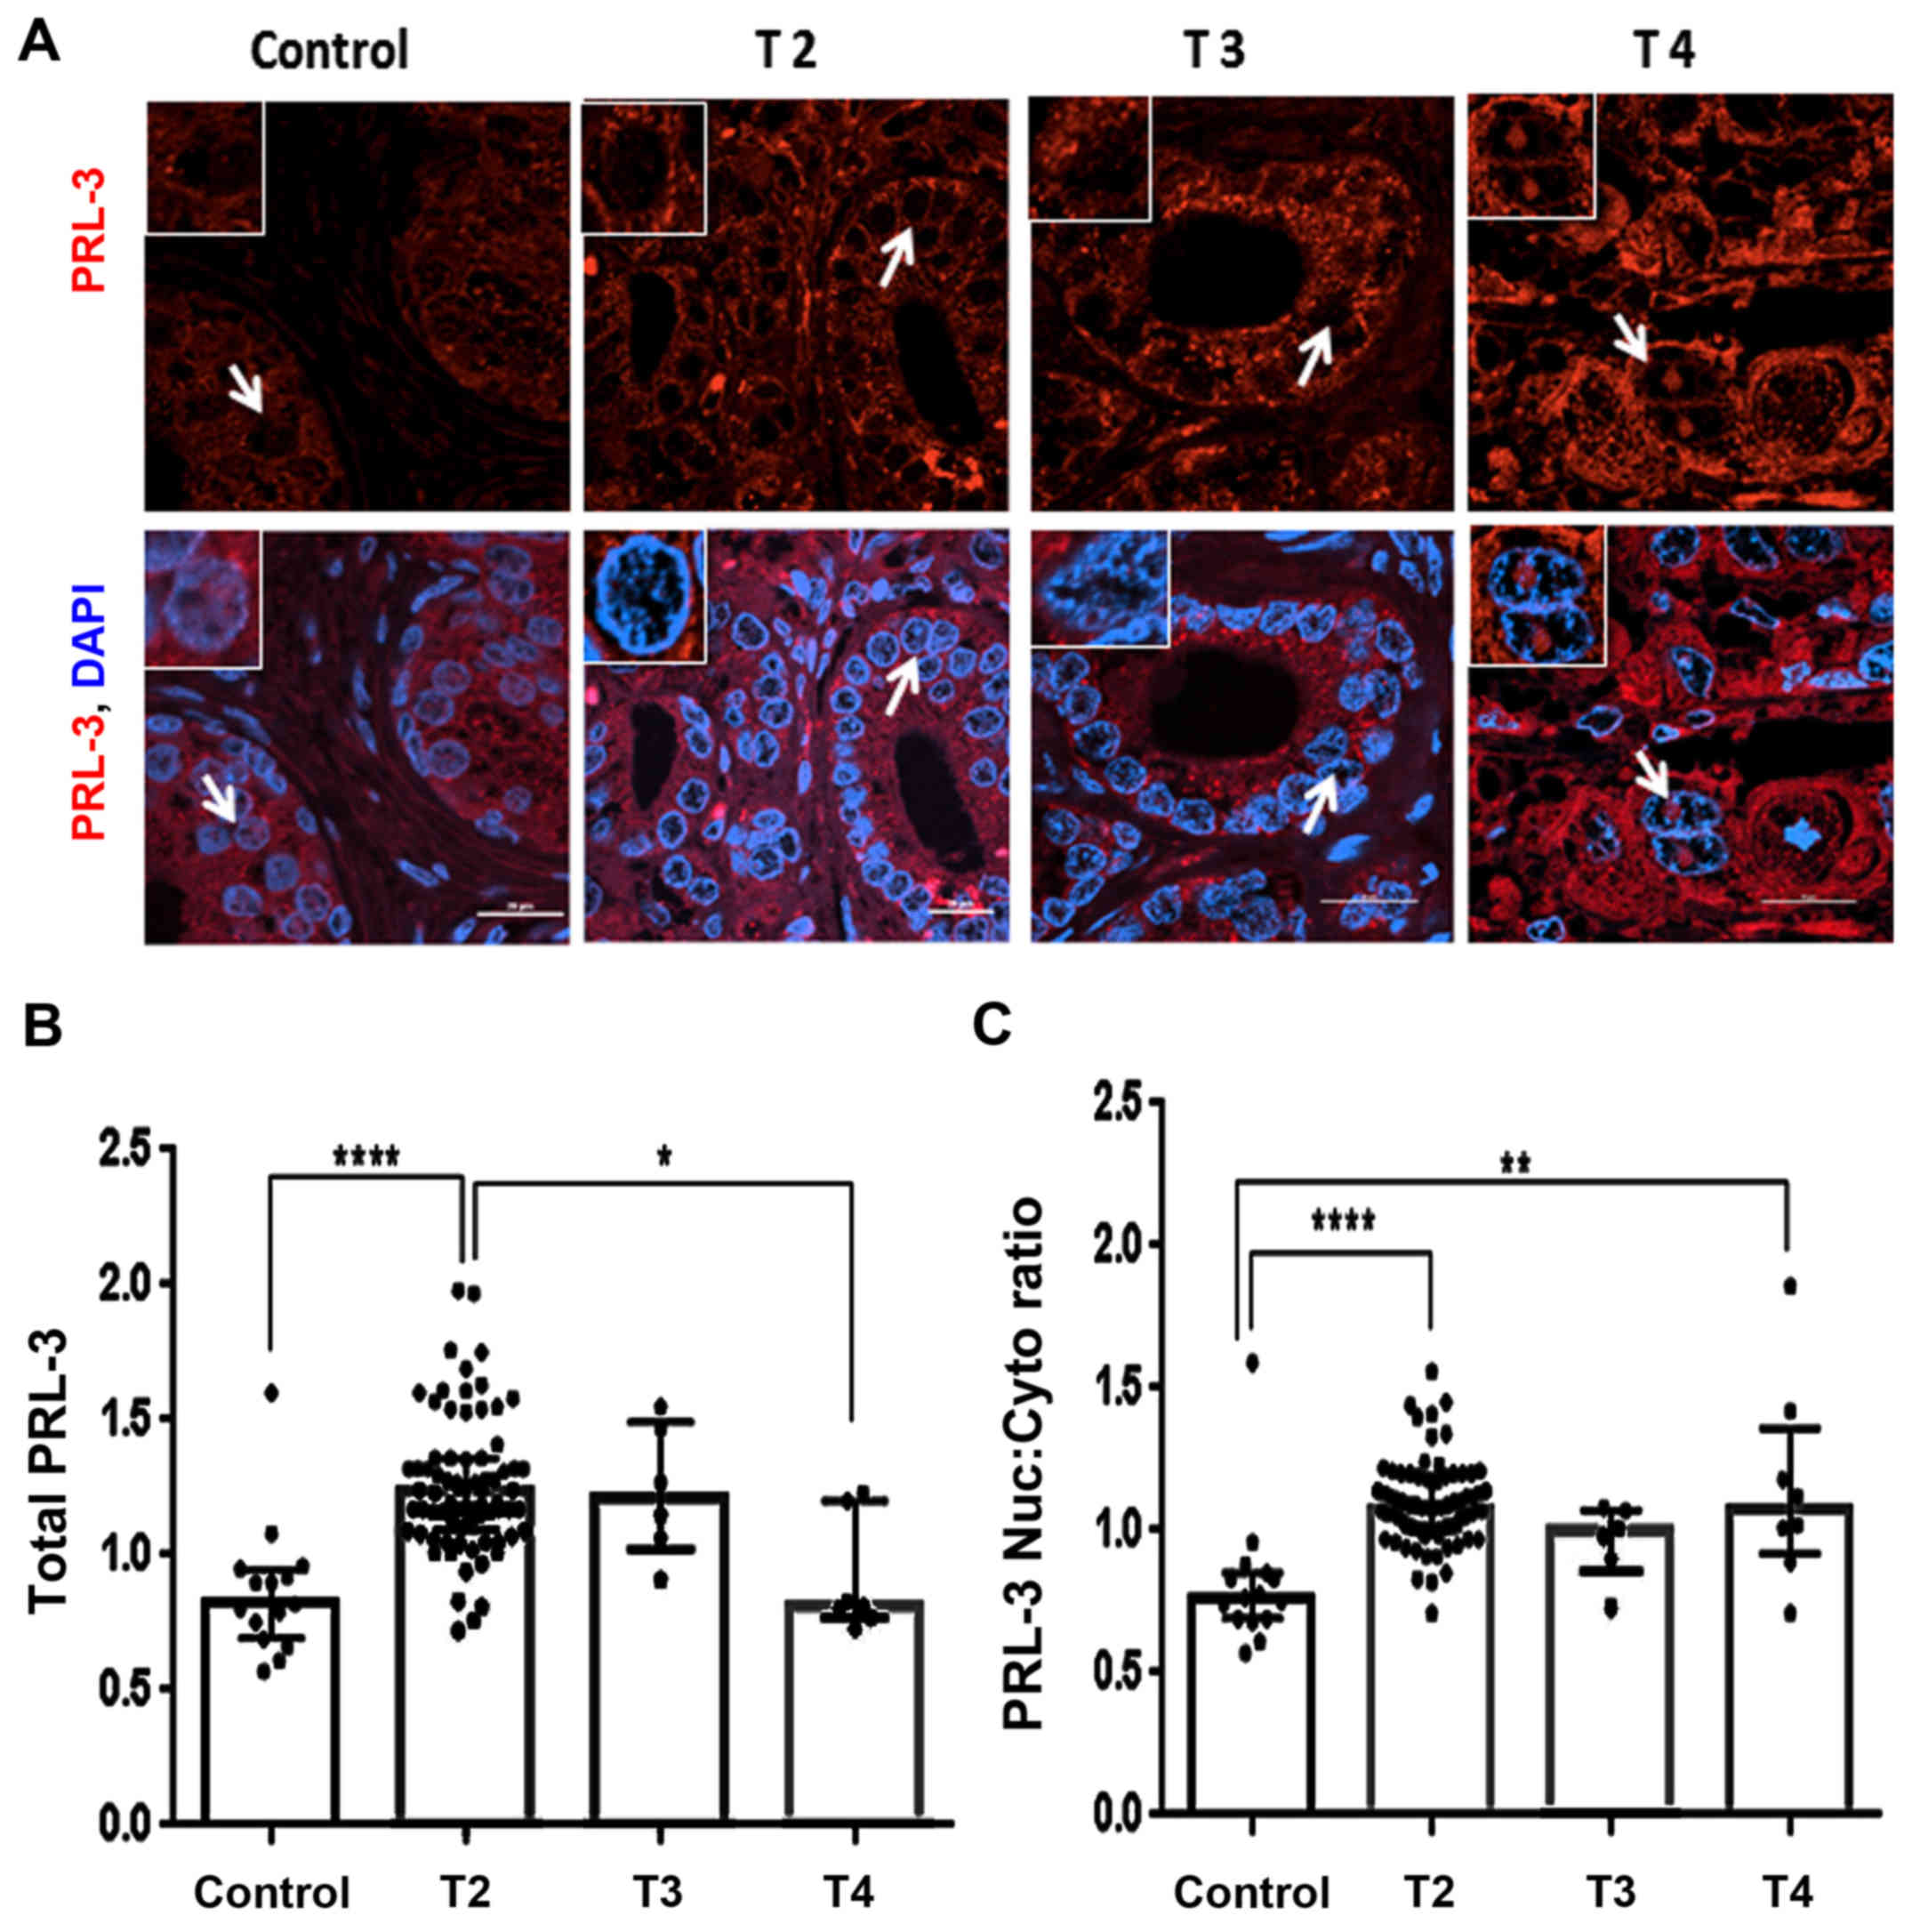
Clinicopathological association of
nuclear PRL-3 with T-stage
T-staging in the PCa specimens allows clinicians to
estimate the extension of tumor burden (27,28).
In this study, the TMA cohort was largely composed of T2-stage
tumors and not T3-and T4-stage tumors, which made the statistical
correlation more difficult. However, a trend that distinguishes the
aggressive phenotype was clearly documented (Fig. 6). A significant difference in PRL-3
protein levels between non-malignant areas and the T2 cores was
observed (P<0.0001). Although the T2-stage cores exhibited
detectable PRL-3 expression, much stronger expression was observed
in specific areas within the T3- and T4-stage tumor cores (Fig. 6A). Of note, these
PRL-3-overexpressed areas were also found to contain higher levels
of nuclear PRL-3 expression, and this phenomenon was particularly
striking in the T4-stage tumor cores. Furthermore, as compared to
the T2-stage cores, total PRL-3 expression was decreased
(P<0.05) in the T4-stage cores (Fig. 6B). When comparing cores stratified
by their primary tumor staging, distinct differences in both global
and nuclear PRL-3 expressions were also documented. The T2-stage
cores consistently exhibited a higher total PRL-3 expression as
compared to the control sections (Fig.
6B and Table I). In addition,
the nuclear:cytoplasmic mean ranks were significantly (P<0.0001)
higher in both the T2- and T4-stage (P<0.01) cores, as compared
to the control sections (Fig. 6C
and Table II). Thus, nuclear
PRL-3 is a reliable biomarker of clinically relevant disease and
correlate with TNM classifications.
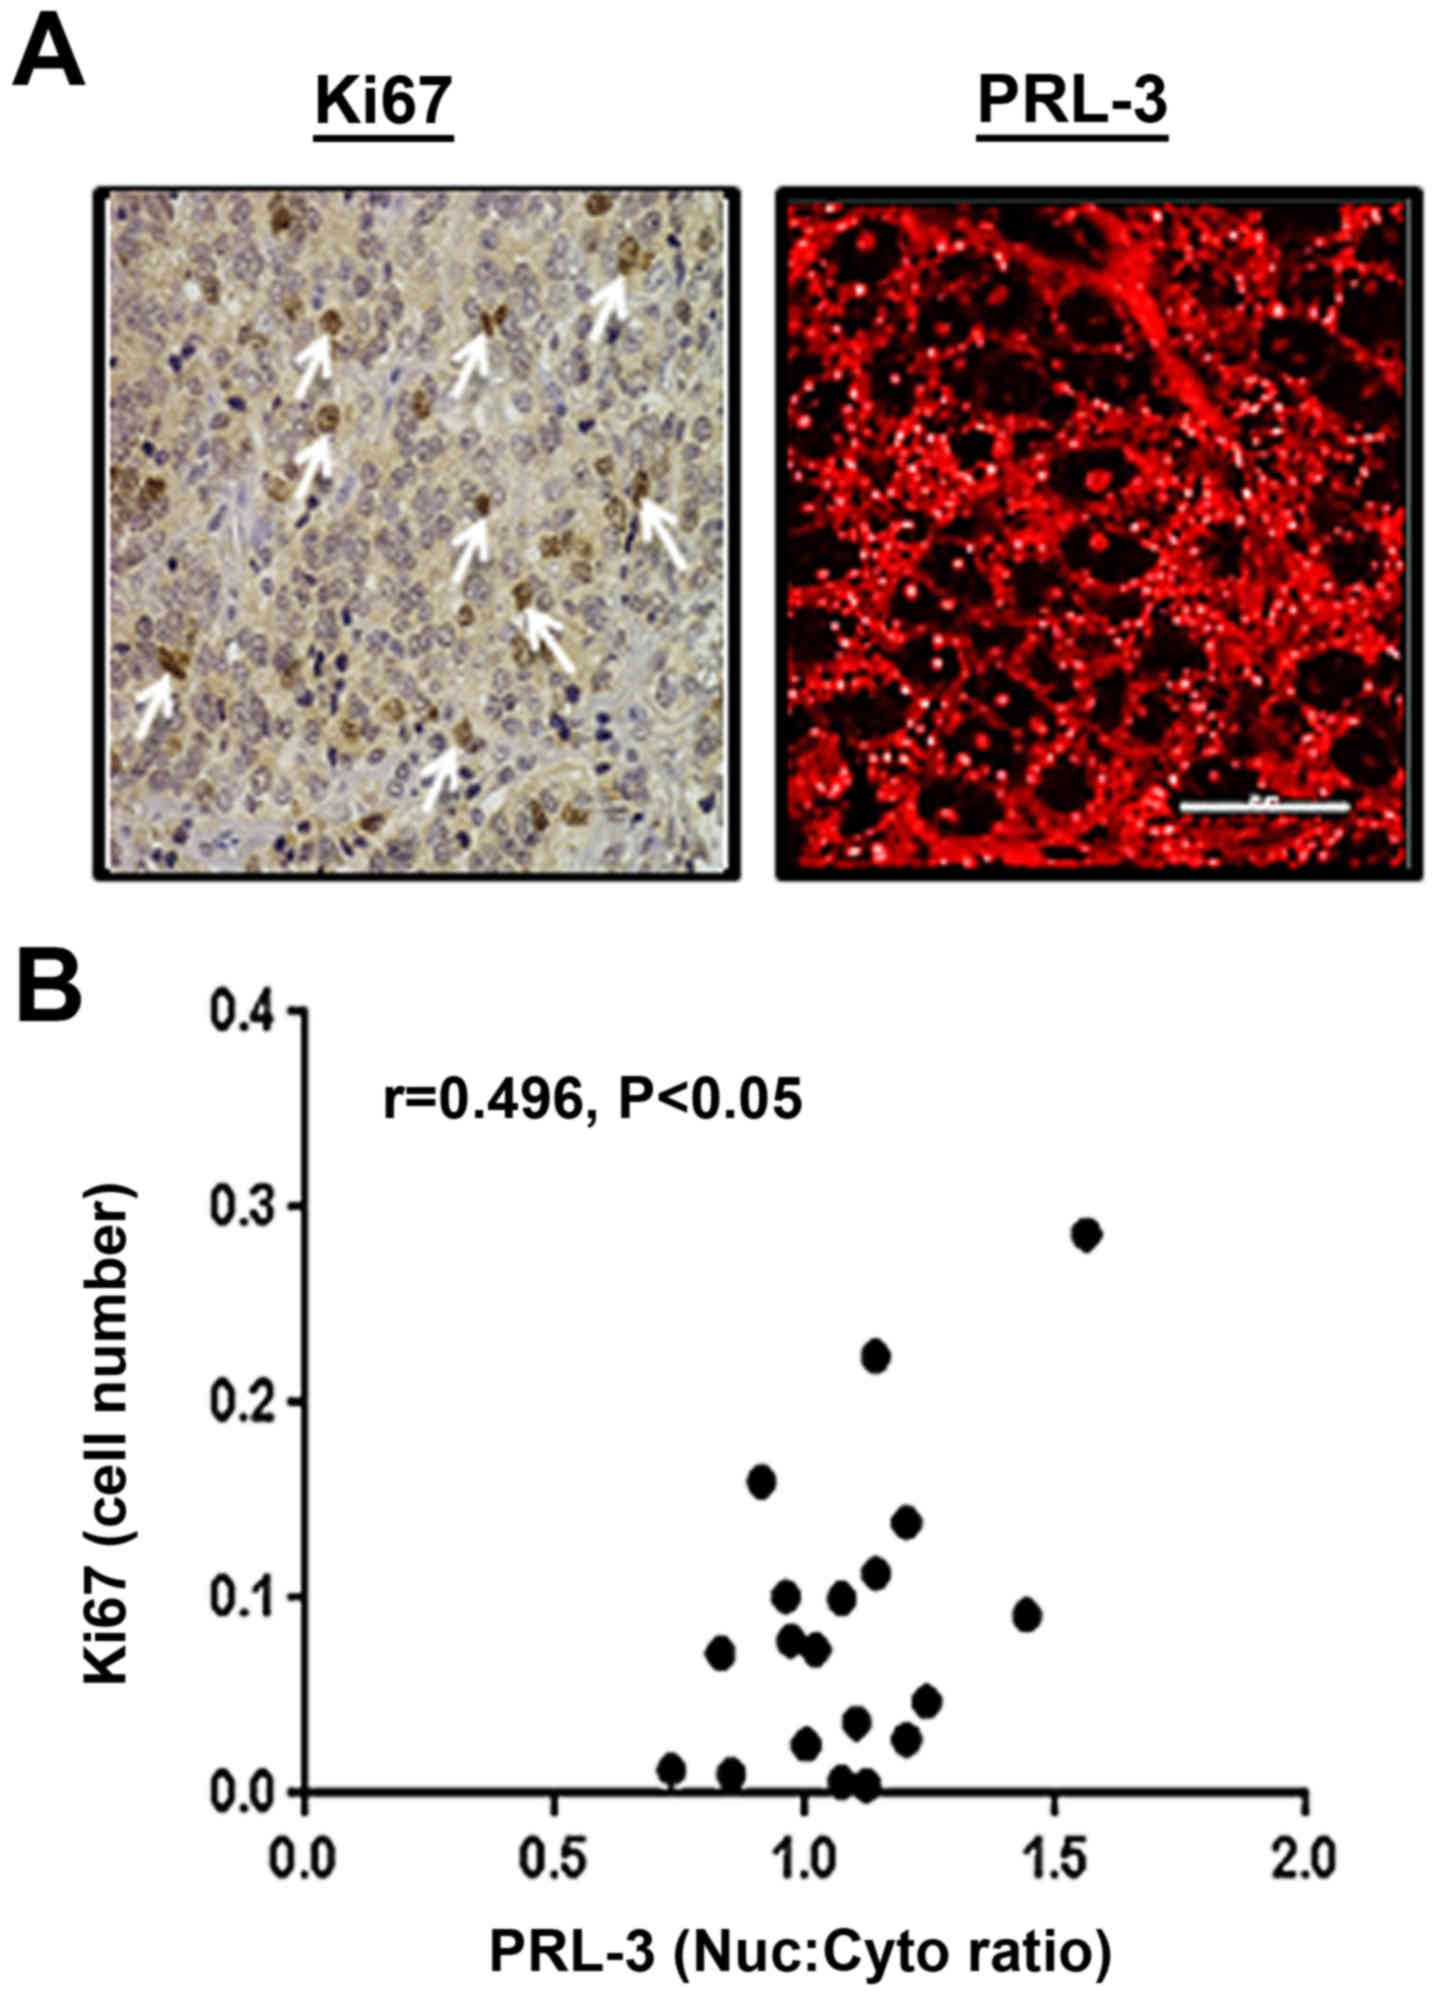
Nuclear PRL-3 levels correlate with Ki67
expression in tumor sections
Our in vitro experiments on
PRL-3-overexpressing PCa cells indicated its role in increasing
cell proliferation (Fig. 4).
Therefore, in prostate tumor sections, we wished to determine
whether tumor cores with a high PRL-3 expression and increased
nuclear PRL-3 levels are similarly associated with the
proliferation marker, Ki67 (Fig.
7). Tumor cores were immunostained for both Ki67 and PRL-3,
followed by DIA and comparison of the proliferative index.
Pearson's r correlation analysis indicated that tumor sections with
a higher nuclear PRL-3 expression were positively associated with
increased Ki67-labeled cells (r=0.496, P<0.05). Similar to our
findings of the total and Nuc:Cyto levels of PRL-3 in the GS-, GG-
and TNM-stratified TMA cores, it was suggested that nuclear PRL-3
was directly associated with aggressively increasing areas of the
prostate tumors.
Discussion
An increased PRL-3 expression is associated with a
poor prognosis of several solid tumors, e.g., breast (12,29),
colorectal (13,26), gastric (30,31)
and ovarian cancer (32). However,
the potential for PRL-3 as a biomarker for PCa has not yet been
thoroughly evaluated, at least to the best of our knowledge.
Through integrative genomic profiling of the Oncomine database
provided in 4 different reports (21–24),
PRL-3 gene expression was found to be significantly
associated with PCa (Fig. 2). An
increased PRL-3 expression was associated with a poor clinical
outcome, as demonstrated by its mRNA levels in the 75th percentile
of genes overexpressed in patients with a higher mortality rate.
Although previous studies have suggested that PRL-3 may play a
major role in the aggressive and metastatic phenotype of tumors
(33,34), only one previous study assessed
PRL-3 protein in PCa patient tumor samples (35). Also, the present study, to the best
of our knowedge, illustrates for the first time that the nuclear
localization of PRL-3 may be an indicator of aggressive tumors.
The study by Vandsemb et al demonstrated that
both PRL-3 mRNA and protein levels were higher in primary prostate
tumors and in the corresponding lymph node metastases (35). Furthermore, in vitro assays
suggested that PRL-3 promoted both the growth and migration of PCa
cells. However, the subcellular localization of PRL-3 and its
implications in regulating PCa cell function were not evaluated in
this previous study (35). The
current study used a large number of prostate tumor cores and
clearly provided evidence that PRL-3 protein levels were
significantly higher in tumor nodes as compared to the normal
prostate stroma (Fig. 3 and
Table I). In addition, our
findings also implicated that nuclear PRL-3 may be positively
associated with high-grade tumors (Fig. 5 and Table II). Importantly, a differential
subcellular localization of PRL-3 was documented in the two
subtypes of GS7-graded tumors, where the 3+4 tumor cores (less
aggressive) exhibited lower nuclear PRL-3 expression than the 4+3
tumor cores (more aggressive). Clinicopathological association
analysis also revealed that PRL-3 overexpression was associated
with early clinical disease and nuclear PRL-3 was directly linked
to the advanced clinical stages (T4-stage) (Fig. 6). Therefore, both the total and
nuclear PRL-3 protein levels may help to identify aggressive tumor
phenotypes.
Recent studies have suggested a nuclear regulatory
function of PRL-3 in cancer cells (36,37).
Furthermore, Fagerli et al implicated a cell cycle-dependent
nuclear/cytoplasmic shuttling of PRL-3 in human myeloma cells
(38). These findings implicated
differential functions of this phosphatase in both the cytoplasmic
and nuclear compartments. Preliminary in vitro experiments
in our laboratory, using the androgen-dependent PCa line (LNCaP)
clearly revealed that stimulation with the AR agonist, R1881,
rapidly increased the nuclear translocation of PRL-3 (Fig. 4B). Furthermore, in the LNCaP-SF
cells, a CRPC subline of LNCaP, we observed constitutive nuclear
localization of both AR and PRL-3 (Fig. 4C). These data in the PCa cell lines
are in concordance with our observations in prostate tumor cores,
particularly those with a hormone-refractory (CRPC) phenotype. Of
note, Vandsemb et al demonstrated that the inhibition of
PRL-3 reduced migration, growth arrest and the apoptosis of PCa
cell lines (35), clearly implying
a direct role for PRL-3 in aggressive PCa cells. Our preliminary
findings suggested that PRL-3 may be co-chaperoned with AR
following androgen (R1881) stimulation, and may be critical in
several tumor inductive pathways. However, further studies are
required in order to evaluate the functional association between AR
and PRL-3 in both the cytoplasm and in the nucleus of PCa
cells.
Of note, the accumulation of PRL-3 appeared within
the central nuclear regions (Figs.
5 and 6). The nucleolar
accumulation of the tumor suppressor, p53 has previously been
demonstrated (36). The promotion
of p53 degradation by mouse double minute 2 homolog (MDM2) is also
known to occur within the nucleoli (37). Indeed, Basak et al, had
previously documented that PRL-3 was a p53 target (9) and Min et al, documented that
PRL-3 suppressed p53 levels by regulating MDM2 function (10). Therefore, our findings on the AR
signaling-mediated nuclear accumulation of PRL-3 implicate its
novel role in regulating the mitogenic functions of p53. Our
preliminary findings with Ki67 immunostaining of tumor cores
further corroborated that nuclear PRL-3 may indeed be associated
with aggressively growing PCa cells (Fig. 7). Regions of high nuclear PRL-3
positively correlated with increased Ki67 staining (r=0.496,
P<0.05). Therefore, it would be interesting to determine whether
these same cells also have increased nuclear AR levels.
Ultimately, the combined utility of nuclear AR and
PRL-3 as biomarkers of PCa progression may be useful in accurately
identifying aggressive tumors (9,14,30,39).
Indeed, the lack of biomarkers of PCa progression, i.e., from
indolent (GS7, 3+4) to aggressive (GS7, 4+3) disease, has been a
major obstacle in deciding treatment guidelines (40). Although both PCA3 (3) and TMPRSS2-ERG (4,5) are
overexpressed in prostate tumors, their use alone may not be
sufficient in distinguishing between indolent vs. aggressive
disease in all patients. Therefore, other functional biomarkers,
such as PRL-3 may be employed at the biopsy level to decide whether
to follow with active surveillance or prescribe aggressive therapy
in patients (41).
In conclusion, our preliminary findings on a large
number of tumor cores suggest that PRL-3 may be a reliable
biomarker for early PCa detection and may provide a predictive
indicator of tumor progression. In this respect, our protocol of
computer aided image analysis (DIA) of immunostained tumor sections
(Fig. 1) to measure both the total
expression and subcellular localization of PRL-3, may offer
significant advances in recognizing the aggressive PCa cells by
digital pathology (42). However,
although we present evidence that both total and nuclear PRL-3 can
predict disease progression, further prospective large cohort
studies are warranted to unequivocally determine whether its
expression and/or subcellular localization is associated with poor
clinical outcomes. In addition, diverse functions of this
phosphatase in different subcellular locations may provide insight
into its mechanism/s and implicate novel therapeutic strategies. In
this respect, our novel observations that androgen (R1881)
stimulation increases nuclear PRL-3 levels implicates the potential
of suppressing AR-signaling to downregulate the deleterious
functions of nuclear PRL-3. Indeed, our recent findings showed that
the phytochemical agent, Sulforaphane (43) as well as the potent pharmaceutical
drug, Bardoxolonemethyl (44) can
decrease AR expression. Therefore, studies to suppress PRL-3 levels
and decrease the metastatic potential of PCa cells may be of
significant translational value.
Acknowledgments
The present study was supported by funds from the
Louisiana Cancer Research Consortium (LCRC), Tulane Biomedical
Sciences (BMS) and Southern Regional Education Board (SREB).
References
|
1
|
Howlader N, Noone AM, Krapcho M, Garshell
J, Miller D, Altekruse SF, Kosary CL, Yu M, Ruhl J, Tatalovich Z,
Mariotto A, Lewis DR, Chen HS, Feuer EJ and Cronin KA: SEER Cancer
Statistics Review 1975–2011. National Cancer Institute; Bethesda,
MD: https://seer.cancer.gov/archive/csr/1975_2011/.
Accessed December 17, 2014.
|
|
2
|
Hayes JH and Barry MJ: Screening for
prostate cancer with the prostate-specific antigen test: A review
of current evidence. JAMA. 311:1143–1149. 2014. View Article : Google Scholar : PubMed/NCBI
|
|
3
|
Bussemakers MJ, van Bokhoven A, Verhaegh
GW, Smit FP, Karthaus HF, Schalken JA, Debruyne FM, Ru N and Isaacs
WB: DD3: A new prostate-specific gene, highly overexpressed in
prostate cancer. Cancer Res. 59:5975–5979. 1999.PubMed/NCBI
|
|
4
|
Tomlins SA, Laxman B, Varambally S, Cao X,
Yu J, Helgeson BE, Cao Q, Prensner JR, Rubin MA, Shah RB, et al:
Role of the TMPRSS2-ERG gene fusion in prostate cancer. Neoplasia.
10:177–188. 2008. View Article : Google Scholar : PubMed/NCBI
|
|
5
|
Font-Tello A, Juanpere N, de Muga S,
Lorenzo M, Lorente JA, Fumado L, Serrano L, Serrano S, Lloreta J
and Hernández S: Association of ERG and TMPRSS2-ERG with grade,
stage, and prognosis of prostate cancer is dependent on their
expression levels. Prostate. 75:1216–1226. 2015. View Article : Google Scholar : PubMed/NCBI
|
|
6
|
Penney KL, Pettersson A, Shui IM, Graff
RE, Kraft P, Lis RT, Sesso HD, Loda M and Mucci LA: Association of
prostate cancer risk variants with TMPRSS2:ERG status: Evidence for
distinct molecular subtypes. Cancer Epidemiol Biomarkers Prev.
25:745–749. 2016. View Article : Google Scholar : PubMed/NCBI
|
|
7
|
Al-Aidaroos AQ and Zeng Q: PRL-3
phosphatase and cancer metastasis. J Cell Biochem. 111:1087–1098.
2010. View Article : Google Scholar : PubMed/NCBI
|
|
8
|
Liu Y, Zhou J, Chen J, Gao W, Le Y, Ding Y
and Li J: PRL-3 promotes epithelial mesenchymal transition by
regulating cadherin directly. Cancer Biol Ther. 8:1352–1359. 2009.
View Article : Google Scholar : PubMed/NCBI
|
|
9
|
Basak S, Jacobs SB, Krieg AJ, Pathak N,
Zeng Q, Kaldis P, Giaccia AJ and Attardi LD: The
metastasis-associated gene Prl-3 is a p53 target involved in
cell-cycle regulation. Mol Cell. 30:303–314. 2008. View Article : Google Scholar : PubMed/NCBI
|
|
10
|
Min SH, Kim DM, Heo YS, Kim HM, Kim IC and
Yoo OJ: Downregulation of p53 by phosphatase of regenerating liver
3 is mediated by MDM2 and IRH2. Life Sci. 86:66–72. 2010.
View Article : Google Scholar
|
|
11
|
Wang H, Quah SY, Dong JM, Manser E, Tang
JP and Zeng Q: PRL-3 down-regulates PTEN expression and signals
through PI3K to promote epithelial-mesenchymal transition. Cancer
Res. 67:2922–2926. 2007. View Article : Google Scholar : PubMed/NCBI
|
|
12
|
den Hollander P, Rawls K, Tsimelzon A,
Shepherd J, Mazumdar A, Hill J, Fuqua SA, Chang JC, Osborne CK,
Hilsenbeck SG, et al: Phosphatase PTP4A3 promotes triple-negative
breast cancer growth and predicts poor patient survival. Cancer
Res. 76:1942–1953. 2016. View Article : Google Scholar : PubMed/NCBI
|
|
13
|
Xu H, Zeng Y, Liu L, Gao Q, Jin S, Lan Q,
Lai W, Luo X, Wu H, Huang Y, et al: PRL-3 improves colorectal
cancer cell proliferation and invasion through IL-8 mediated
glycolysis metabolism. Int J Oncol. 51:1271–1279. 2017.PubMed/NCBI
|
|
14
|
Jiang Y, Liu XQ, Rajput A, Geng L, Ongchin
M, Zeng Q, Taylor GS and Wang J: Phosphatase PRL-3 is a direct
regulatory target of TGFbeta in colon cancer metastasis. Cancer
Res. 71:234–244. 2011. View Article : Google Scholar
|
|
15
|
Iwasa Y, Mizokami A, Miwa S, Koshida K and
Namiki M: Establishment and characterization of
androgen-independent human prostate cancer cell lines, LN-REC4 and
LNCaP-SF, from LNCaP. Int J Urol. 14:233–239. 2007. View Article : Google Scholar : PubMed/NCBI
|
|
16
|
van Bokhoven A, Varella-Garcia M, Korch C,
Johannes WU, Smith EE, Miller HL, Nordeen SK, Miller GJ and Lucia
MS: Molecular characterization of human prostate carcinoma cell
lines. Prostate. 57:205–225. 2003. View Article : Google Scholar : PubMed/NCBI
|
|
17
|
Noursadeghi M, Tsang J, Haustein T, Miller
RF, Chain BM and Katz DR: Quantitative imaging assay for NF-kappaB
nuclear translocation in primary human macrophages. J Immunol
Methods. 329:194–200. 2008. View Article : Google Scholar :
|
|
18
|
Rubin MA, Mucci NR, Figurski J, Fecko A,
Pienta KJ and Day ML: E-cadherin expression in prostate cancer: A
broad survey using high-density tissue microarray technology. Hum
Pathol. 32:690–697. 2001. View Article : Google Scholar : PubMed/NCBI
|
|
19
|
McMenamin ME, Soung P, Perera S, Kaplan I,
Loda M and Sellers WR: Loss of PTEN expression in paraffin-embedded
primary prostate cancer correlates with high Gleason score and
advanced stage. Cancer Res. 59:4291–4296. 1999.PubMed/NCBI
|
|
20
|
Rhodes DR, Yu J, Shanker K, Deshpande N,
Varambally R, Ghosh D, Barrette T, Pandey A and Chinnaiyan AM:
ONCOMINE: A cancer microarray database and integrated data-mining
platform. Neoplasia. 6:1–6. 2004. View Article : Google Scholar : PubMed/NCBI
|
|
21
|
Liu P, Ramachandran S, Ali Seyed M,
Scharer CD, Laycock N, Dalton WB, Williams H, Karanam S, Datta MW,
Jaye DL, et al: Sex-determining region Y box 4 is a transforming
oncogene in human prostate cancer cells. Cancer Res. 66:4011–4019.
2006. View Article : Google Scholar : PubMed/NCBI
|
|
22
|
Wallace TA, Prueitt RL, Yi M, Howe TM,
Gillespie JW, Yfantis HG, Stephens RM, Caporaso NE, Loffredo CA and
Ambs S: Tumor immunobiological differences in prostate cancer
between African-American and European-American men. Cancer Res.
68:927–936. 2008. View Article : Google Scholar : PubMed/NCBI
|
|
23
|
Taylor BS, Schultz N, Hieronymus H,
Gopalan A, Xiao Y, Carver BS, Arora VK, Kaushik P, Cerami E, Reva
B, et al: Integrative genomic profiling of human prostate cancer.
Cancer Cell. 18:11–22. 2010. View Article : Google Scholar : PubMed/NCBI
|
|
24
|
Grasso CS, Wu YM, Robinson DR, Cao X,
Dhanasekaran SM, Khan AP, Quist MJ, Jing X, Lonigro RJ, Brenner JC,
et al: The mutational landscape of lethal castration-resistant
prostate cancer. Nature. 487:239–243. 2012. View Article : Google Scholar : PubMed/NCBI
|
|
25
|
Chong PS, Zhou J, Cheong LL, Liu SC, Qian
J, Guo T, Sze SK, Zeng Q and Chng WJ: LEO1 is regulated by PRL-3
and mediates its oncogenic properties in acute myelogenous
leukemia. Cancer Res. 74:3043–3053. 2014. View Article : Google Scholar : PubMed/NCBI
|
|
26
|
Liu Y, Zheng P, Liu Y, Ji T, Liu X, Yao S,
Cheng X, Li Y, Chen L, Xiao Z, et al: An epigenetic role for PRL-3
as a regulator of H3K9 methylation in colorectal cancer. Gut.
62:571–581. 2013. View Article : Google Scholar
|
|
27
|
van Oort IM, Witjes JA, Kok DE, Kiemeney
LA and Hulsbergen-Van De Kaa CA: The prognostic role of the
pathological T2 subclassification for prostate cancer in the 2002
Tumour-Nodes-Metastasis staging system. BJU Int. 102:438–441. 2008.
View Article : Google Scholar : PubMed/NCBI
|
|
28
|
Caso JR, Tsivian M, Mouraviev V, Polascik
TJ and Moul JW: Pathological T2 sub-divisions as a prognostic
factor in the biochemical recurrence of prostate cancer. BJU Int.
106:1623–1627. 2010. View Article : Google Scholar : PubMed/NCBI
|
|
29
|
Wang L, Peng L, Dong B, Kong L, Meng L,
Yan L, Xie Y and Shou C: Overexpression of phosphatase of
regenerating liver-3 in breast cancer: Association with a poor
clinical outcome. Ann Oncol. 17:1517–1522. 2006. View Article : Google Scholar : PubMed/NCBI
|
|
30
|
Ooki A, Yamashita K, Kikuchi S, Sakuramoto
S, Katada N, Waraya M, Kawamata H, Nishimiya H, Nakamura K and
Watanabe M: Therapeutic potential of PRL-3 targeting and clinical
significance of PRL-3 genomic amplification in gastric cancer. BMC
Cancer. 11:1222011. View Article : Google Scholar : PubMed/NCBI
|
|
31
|
Xing X, Lian S, Hu Y, Li Z, Zhang L, Wen
X, Du H, Jia Y, Zheng Z, Meng L, et al: Phosphatase of regenerating
liver-3 (PRL-3) is associated with metastasis and poor prognosis in
gastric carcinoma. J Transl Med. 11:3092013. View Article : Google Scholar : PubMed/NCBI
|
|
32
|
Polato F, Codegoni A, Fruscio R, Perego P,
Mangioni C, Saha S, Bardelli A and Broggini M: PRL-3 phosphatase is
implicated in ovarian cancer growth. Clin Cancer Res. 11:6835–6839.
2005. View Article : Google Scholar : PubMed/NCBI
|
|
33
|
Liang F, Liang J, Wang WQ, Sun JP, Udho E
and Zhang ZY: PRL3 promotes cell invasion and proliferation by
down-regulation of Csk leading to Src activation. J Biol Chem.
282:5413–5419. 2007. View Article : Google Scholar
|
|
34
|
Ming J, Liu N, Gu Y, Qiu X and Wang EH:
PRL-3 facilitates angiogenesis and metastasis by increasing ERK
phosphorylation and up-regulating the levels and activities of
Rho-A/C in lung cancer. Pathology. 41:118–126. 2009. View Article : Google Scholar : PubMed/NCBI
|
|
35
|
Vandsemb EN, Bertilsson H, Abdollahi P,
Størkersen Ø, Våtsveen TK, Rye MB, Rø TB, Børset M and Slørdahl TS:
Phosphatase of regenerating liver 3 (PRL-3) is overexpressed in
human prostate cancer tissue and promotes growth and migration. J
Transl Med. 14:712016. View Article : Google Scholar : PubMed/NCBI
|
|
36
|
Burk U, Selter H, Zwergel T, Wullich B,
Montenarh M and Unteregger G: Different subnuclear localization of
wild-type and mutant p53 in human prostate-cancer cells. Int J
Oncol. 7:1355–1360. 1995.PubMed/NCBI
|
|
37
|
Vlatković N, Boyd MT and Rubbi CP:
Nucleolar control of p53: A cellular Achilles' heel and a target
for cancer therapy. Cell Mol Life Sci. 71:771–791. 2014. View Article : Google Scholar
|
|
38
|
Fagerli UM, Holt RU, Holien T, Vaatsveen
TK, Zhan F, Egeberg KW, Barlogie B, Waage A, Aarset H, Dai HY, et
al: Overexpression and involvement in migration by the
metastasis-associated phosphatase PRL-3 in human myeloma cells.
Blood. 111:806–815. 2008. View Article : Google Scholar
|
|
39
|
Hein N, Hannan KM, George AJ, Sanij E and
Hannan RD: The nucleolus: An emerging target for cancer therapy.
Trends Mol Med. 19:643–654. 2013. View Article : Google Scholar : PubMed/NCBI
|
|
40
|
Romero Otero J, Garcia Gomez B, Campos
Juanatey F and Touijer KA: Prostate cancer biomarkers: An update.
Urol Oncol. 32:252–260. 2014. View Article : Google Scholar : PubMed/NCBI
|
|
41
|
Donovan MJ and Cordon-Cardo C: Predicting
high-risk disease using tissue biomarkers. Curr Opin Urol.
23:245–251. 2013.PubMed/NCBI
|
|
42
|
Stålhammar G, Fuentes Martinez N, Lippert
M, Tobin NP, Mølholm I, Kis L, Rosin G, Rantalainen M, Pedersen L,
Bergh J, et al: Digital image analysis outperforms manual biomarker
assessment in breast cancer. Mod Pathol. 29:318–329. 2016.
View Article : Google Scholar : PubMed/NCBI
|
|
43
|
Khurana N, Talwar S, Chandra PK, Sharma P,
Abdel-Mageed AB, Mondal D and Sikka SC: Sulforaphane increases the
efficacy of anti-androgens by rapidly decreasing androgen receptor
levels in prostate cancer cells. Int J Oncol. 49:1609–1619. 2016.
View Article : Google Scholar : PubMed/NCBI
|
|
44
|
Khurana N, Kim H, Chandra PK, Talwar S,
Sharma P, Abdel-Mageed AB, Sikka SC and Mondal D: Multimodal
actions of the phytochemical sulforaphane suppress both AR and
AR-V7 in 22Rv1 cells: Advocating a potent pharmaceutical
combination against castration-resistant prostate cancer. Oncol
Rep. 38:2774–2786. 2017.PubMed/NCBI
|