Introduction
Neuroblastoma is a malignancy caused by the
hyperplasia of naive neural crest cells (1). It is the most common solid tumor
affecting children <5 years of age, and the third most common
cause of pediatric cancer-related mortality (2), accounting for 7% of childhood
malignancies and 15% of childhood cancer-related mortalities
(3). The disease is known for its
broad range of clinical behavior and variable responses to
treatment (4). This clinical
heterogeneity is elucidated by the fact that some neuroblastomas
can spontaneously regress or differentiate into a benign form,
ganglioneuroma, while others are not responsive to current
therapies (5). Even though the
prognosis for children with neuroblastoma is generally good, the
survival rates for children with high-risk neuroblastomas are still
poor, despite advanced therapeutic strategies (6).
Several transcription factors have been shown to be
involved in the pathogenesis of neuroblastoma by enhancing cancer
cell proliferation (7).
MYCN proto-oncogene, bHLH transcription factor
(MYCN), one of these transcription factors, is a
phosphoprotein in the MYC family of transcription factors, encoded
by the MYCN oncogene (7).
The amplification of MYCN is one of the first most important
genetic signatures of neuroblastoma (8). Patients with neuroblastoma carrying a
MYCN amplification are classified in the high-risk group,
and their 5-year overall survival rate following diagnosis does not
exceed 50% (9). An amplification
leading to the aberrant expression of MYCN has been
associated with tumor aggressiveness, resistance to chemotherapy
and the inability to differentiate (10). In fact, MYCN amplification
confers cell resistance to apoptosis induced by the tumor necrosis
factor-related apoptosis-inducing ligand system (11), whereas MYCN silencing
promotes proliferation arrest, differentiation and the apoptosis of
human neuroblastoma cells (12).
In the present study, we conducted a pilot
proteomics analysis to compare the proteomic signature of the
MYCN-amplified IMR-32 cells to that of the
non-MYCN-amplified SK-N-SH human neuroblastoma cells using
stable isotope labeling by amino acids in cell culture (SILAC)
strategy (13). Of the
differentially expressed proteins (based on expression value and
fold change) between the IMR-32 and SK-N-SH cells, we were
particularly interested in proteins upregulated in the IMR-32
compared to the SK-N-SH cells that mapped to upstream regulators
[MYCN, MYC, hypoxia-inducible factor-1α
(HIF-1α), E2F transcription factor 1 (E2F1), Sp1
transcription factor (SP1), KIT ligand (KITLG),
interleukin 3 (IL3), amyloid precursor protein (APP),
insulin receptor (INSR) and sterol regulatory element
binding transcription factor 1 or 2 (SREBF1/2)] predicted by
Ingenuity Pathway Analysis (IPA; Ingenuity Systems, Inc., Redwood
City, CA, USA; 2000–2014) to be activated in the IMR-32 cells.
These included: L1 cell adhesion molecule (L1-CAM); high
mobility group protein A1 (HMGA1); fatty acid-binding
protein 5 (FABP5); and baculoviral IAP repeat containing 5
[BIRC5 (survivin)].
In the present study, we aimed to determine the
interaction between the above-mentioned molecules and MYCN
in the IMR-32 cells and the effect of transcriptional knockdown
(KD) of these targets on cellular proliferation, migration and
apoptosis. We also wished to determine the cellular bio-function
after single-target versus double-target transcriptional KD of the
said proteins and whether an added effect would be observed. In
addition, we were interested in examining whether a crosstalk
exists between these proteins as determined by differential protein
expression levels of one target after transcriptional KD of each of
the other targets.
Materials and methods
Reagents and human cell lines
The IMR-32 (MYCN-amplified) and SK-N-SH
(non-MYCN-amplified) cells are human neuroblastoma/neuroepthelioma
cell lines purchased from the American Type Culture Collection
(ATCC, Manassas, VA, USA) where routine STR testing was conducted
and the cells were confirmed to derive from human species. In
addition, the cells were routinely tested for mycoplasma, aerobic
and anaerobic bacteria, and human pathogenic viruses including
human immunodeficiency virus (HIV), hepatitis B (HepB), human
papilloma virus (HPV), Epstein-Barr virus (EBV) and cytomegalovirus
(CMV), all of which our cells tested negative for and were used
within 6 months of purchase from ATCC. The cells were cultured in
minimal essential Eagle's medium (EMEM; cat. no. M2279)
supplemented with 2 mM L-glutamine (cat. no. 7513; Sigma, St.
Louis, MO, USA), 2% penicillin streptomycin (cat. no. P4333SIGMA),
1 mM sodium pyruvate (cat. no. S8636), 2% non-essential amino acids
(cat. no. M7145) and 10% fetal bovine serum (cat. no. F9665) (all
from Sigma). The cells were cultured to 80% confluence in T25
flasks at 5% CO2 and 37°C. The medium was replenished
every 48 h. After 8 days, the cells covering 80% of the flask were
collected and transferred into a 15 ml falcon tube to be
centrifuged at 200 × g for 10 min at 4°C. The old medium was
discarded and the cells were re-suspended in 10 ml of fresh medium
and transferred into a T75 flask. The cells harvested from T75
flasks were frozen in Corning® Cryotubes (Corning Inc.,
New York, NY, USA) using 50% fetal bovine serum (FBS), 40% EMEM and
10% DMSO (D2650; Sigma) to a final volume of 1 ml. The cryotubes
were frozen first at −80°C for 24 h in isopropanol to provide a
gradual decrease in temperature. They were then transferred to
liquid nitrogen for long term storage.
SILAC proteomics sample preparation
The IMR-32 and SK-N-SH neuroblastoma cells were
grown in the standard culture conditions until they reached
confluency after which they were washed 6 times with serum-free
medium and then cultured in serum-free medium supplemented with
'heavy' isotopes where arginine and lysine were replaced with
13C6-Arg and 13C6,
15N2-Lys (Cambridge Isotopes, Andover, MA, USA) for 6
doublings to ensure incorporation of the isotopes into the entire
cellular population. After 6 doublings, the cells were collected,
lysed, quantified and mixed together into one SuperSILAC mastermix
cocktail and saved at −80°C. The cells were then cultured in
serum-free growth medium supplemented with 'light' isotopes where
arginine and lysine were replaced with 12C6
-Arg and 12C6, 14N2-Lys
until they reached ~80% confluency. The cells were lysed at that
point and quantified, and a 'spike-in' strategy used to spike-in
the 'heavy' labeled cellular lysates into the 'light' labeled
cellular lysates at a 1:1 ratio. Approximately 100 μg of
total protein mixture (50:50 μg of cell lysate:SuperSILAC
cocktail) was loaded onto a 4–12% polyacrylamide gel and
electrophoresed until the proteins were well-separated. The gel was
fixed and stained with Commassie Blue (Bio-Rad, Hercules, CA, USA)
then de-stained overnight in H2O at 4°C. The gels were
then sliced into ~35–40 bands which underwent in-gel digestion with
trypsin (Promega, Madison, WI, USA) using a previously documented
protocol (14) and the resultant
peptides derived from each band were dried by vacuum centrifugation
(240 × g) at room temperature, and re-suspended in 6 μl of
0.1% TFA for analysis by mass spectrometry and proteomics analysis
as previously described (15).
Mass spectrometry analysis and protein
identification and quantification
The methods used to conduct the mass spectrometry
and protein identification and quantification were exactly as
described in the study by Formolo et al (15).
IPA, STRING protein networks and Enrichr
analysis tool
Ingenuity Systems, Inc. 2000–2014 (content version,
18030641; release date, December 6, 2013) was used to derive the
target molecules within the data set, upstream regulators, molecule
type, predicted activation status with activation z-score and
P-values of the proteins differentially expressed between the
IMR-32 and SK-N-SH cells based on expression of and number of
peptides detected per protein, where anything >2-fold is
considered upregulated and anything below 0.5-fold is considered
downregulated. The Enrichr (16,17)
tool was used to annotate the differentially expressed proteins
between the IMR-32 and SK-N-SH cells. Proteins in the network that
were differentially expressed in the IMR-32 cells were mapped to
the top diseases and bio-functions. Differential expression was
determined as either upregulated (>2-fold) or downregulated
(<0.5-fold) in the IMR-32 compared to the SK-N-SH cells. The
STRING protein network tool was used to determine any interactions
(experimentally determined, from curated databases and text-mining)
between our proteins of interest.
Protein extraction for validation by
western blot analysis
The IMR32 and SK-N-SH cells were collected into
15-ml falcon tubes and centrifuged at 200 × g for 10 min at 4°C.
The medium was discarded and the pellet was washed twice with
Dulbecco's phosphate-buffered saline (PBS; D8537; Sigma). PBS was
then discarded and the cells were incubated on ice for 40 min with
120 μl of lysis buffer (for a confluent T75 flaks) composed
of 50 Mm tris-HCl (pH 7.5), 1 mM EDTA, 250 mM NaCl, 50 mM NaF, 0.1
mM Na3VO4, 0.5% Titron X-100 and 1X protease
inhibitor cocktail (cat no. 11697498001; Roche, Indianapolis, IN,
USA). The lysates were transferred to Eppendorf tubes where they
were centrifuged at 4°C for 20 min at 8,000 × g to eliminate
cellular debris. The supernatants were then transferred to new
Eppendorf tubes where they were mixed with 60 μl of the 3X
sample buffer (0.5 M tris-HCl, glycerol, 10% SDS, β-mercaptoethanol
and 0.05% bromophenol blue) in preparation for western blot
analysis.
Western blot analysis
Protein expression was confirmed by western blot
analysis as previously described (18). Briefly, For L1-CAM, glyceraldehyde
3-phosphate dehydrogenase (GAPDH) and HMGA1
detection, a 10% polyacrylamide (cat. no. 161-0156; Bio-Rad) gel
was used; however, for FABP5 and MYCN detection a 12%
polyacrylamide gel was used. A 5% stacking gel was used to form the
wells. The extracted proteins were separated on gels using a
current of 150 mV. Proteins were then transferred to a PVDF
membrane (cat. no. 1620177; Bio-Rad) for 90 min at 100 mV which was
then blocked using 5% BSA (cat. no. A2153-100G; Sigma) diluted in
1X TBS with 1% Tween-20 (cat. no. 9005-64-5).
The blots were incubated with rabbit monoclonal
L1-CAM (cat. no. ab20148), HMGA1 (cat. no. ab129153),
FABP5 (cat. no. ab84028), survivin (cat. no. ab469) (all
from Abcam, Cambridge MA, USA) and MYCN antibodies (cat. no.
9405; Cell Signaling Technology, Danvers, MA, USA) and with mouse
monoclonal GAPDH antibody (cat. no. ab9484) (Abcam)
overnight (all diluted 1:1,000 in TBS-T +5% BSA blocking solution).
The blots were washed 5 times for 5 min with TBST and then
incubated with secondary antibodies [goat anti-rabbit (cat. no.
170-5046) or goat anti-mouse (cat. no. 170-5047) HRP-conjugated
secondary antibodies from Bio-Rad] for 1 h. After washing, the
blots were incubated with Clarity Western ECL substrate (cat. no.
1705060; Bio-Rad) for 3 min and imaged using the
Bio-Rad© ChemiDoc system and analyzed using
ImageLab® software. The bands obtained were normalized
to GAPDH.
Transcriptional KD of target
proteins
The 4 siRNA oligonucleotides for L1-CAM (Hs
L1-CAM_4 SI00009296, Hs L1-CAM_3 SI00009289, Hs
L1-CAM_2 SI00009282 and Hs L1-CAM_1 SI00009275;
Qiagen, Valencia, CA, USA), HMGA1 (D-004597-01 HMGA1,
D-004597-02 HMGA1, D-004597-03 HMGA1 and D-004597-18
HMGA1; Dharmacon, Lafayette, CO, USA), MYCN
(Hs_MYCN_7 SI03113670, Hs_MYCN_6 SI03087518,
Hs_MYCN_5 SI03078222 and Hs_MYCN_3 SI00076300;
Qiagen) and FABP5 (Hs_FABP5_10 SI04277553, Hs_FABP5_9
SI04210948, Hs_FABP5_8 SI04210941 and Hs_FABP5_5
SI03145835; Qiagen) were reconstituted in RNAase-free water to a
final concentration of 10 μM. A total of 5×10⁵
cells were seeded in each well of a 6-well plate in a final volume
of 2 ml of antibiotics-free medium. The cells were transfected with
the siRNA using the fast-forward Hiperfect transfection protocol
following the manufacturer's instructions (cat. no. 301705;
Qiagen). A final concentration of 100 nM of each siRNA was achieved
by mixing 10 μl of the 10 μM siRNA with 10 μl
of Hiperfect (cat. no. 301705; Qiagen) and 370 μl of OptiMEM
(cat. no. 31985-062; Life Technologies, Carlsbad, CA, USA). The
mixture was incubated at room temperature for 20 min, and added in
a drop-wise manner to the corresponding wells. The negative control
was prepared by treating the cells with 90 μl of OptiMEM and
10 μl of Hiperfect. The cells were then incubated with the
siRNAs for 48 h, lysed and processed for western blot analysis.
WST-1 cell proliferation assay
In order to examine the effects of KD on cellular
proliferation, a WST-1 cell proliferation assay was conducted. A
total of 5×10⁴ cells were cultured in each well of a
96-well plate in a final volume of 100 μl. Duplicates of
each condition were prepared. The cells were transfected with
L1-CAM, HMGA1, MYCN, FABP5 or scrambled
siRNAs in a final concentration of 100 nM. The cells were incubated
in 100 μl growth medium for 24, 48 and 72 h and treated with
10 μl of WST-1 reagent (cat. no. ab155902; Abcam) per well
prior to reading. The absorbance was detected after 3 h using an
Epoch™ Microplate Spectrophotometer at 450 nm (BioTek, Winooski,
VT, USA).
Annexin V-FITC/propidium iodide (PI)
apoptosis detection assay
The IMR32 cells were cultured in a 6-well plate
(5×10⁵ cells/well), and transfected with the various
siRNA constructs as described above. Negative control cells were
either unlabeled/untreated or Annexin V-FITC- and PI-labeled and
untreated. Positive control cells were transfected with 100 nM
siRNA of our target constructs and labeled with Annexin V-FITC and
PI or Annexin V-FITC alone. The cells were then collected at 48 h
using accutase (cat. no. A11105-01; Thermo Fisher Scientific,
Waltham, MA, USA) and centrifuged at 200 × g for 5 min at 4°C. They
were then re-suspended in 500 μl of 1X binding buffer,
treated with 5 μl of Annexin V-FITC or PI from Abcam (cat.
no. ab14085) and incubated in the dark for 5 min prior to flow
cytometric analysis using FACSCalibur flow cytometer (BD
Biosciences, San Jose, CA, USA). Data were analyzed using IQuest
Pro software (version 5.1) (BD Biosciences). IMR32 cells were
identified by their forward-scatter (FSC) and side-scatter (SSC)
characteristics. Viable, early apoptotic, late apoptotic and dead
cell populations were identified as Annexin
V−/PI−, Annexin V+/PI−,
Annexin V+/PI+ and Annexin
V−/PI+, respectively. Cells stained with
Annexin V-FITC or PI alone were used to adjust color compensation
settings on flow cytometer. A minimum of 20,000 cell events were
recorded for each sample.
Wound healing migration assay
The IMR-32 cells were grown to ~70% confluency in
triplicates of 12-well plates in standard culture medium and
conditions. FABP5 or HMGA1 siRNA transfection was
conducted as described above and after 24 h, the cells were scraped
down the midline of the plate to resemble a 'wound'. The cells
which were scraped off were washed 2X with serum-free medium and
fresh medium replenished and the cells were then imaged (0 h
time-point) and cultured under standard growth culture conditions
for 24 h. The cells were then imaged at several random fields down
the scratched 'wound' area and the area (μM2) of
'wound-closure' after 24 h in siRNA KD-compared to control
siRNA-transfected cells was measured using AxioVision Systems
software (Zeiss, Oberkochen, Germany). The average of the areas of
multiple random fields was represented as a fold change compared to
untransfected controls and graphed using Microsoft Excel
software.
Statistical analysis
Experiments were conducted in triplicate, repeated 3
independent times and the means ± the standard error of the means
(SEM) of all 3 experiments was calculated and plotted. A two-sided
Student's t-test was used to determine statistically significant
differences between groups. A one-way analysis of variance (ANOVA)
test was used followed by a post hoc Fisher's least significant
difference (LSD) test to determine the significance among the means
of multiple groups obtained from ≥3 independent experiments. The
means ± SEM of 3 or more experiments was derived and graphed using
Microsoft Excel software. Statistical significance was set at a
P-value <0.05.
Results
Top networks, diseases and bio-functions
to which overexpressed proteins in IMR-32 cells are mapped
We conducted preliminary proteomics analysis of the
MYCN-amplified IMR-32 compared to the
non-MYCN-amplified SK-N-SH human neuroblastoma cell lines
using a highly quantitative SILAC methodology. The significant,
differentially expressed proteins were then annotated using IPA in
order to predict the upstream regulators of highly tumorigenic
proteins in the IMR-32 compared to the SK-N-SH cells. The total
numbers of differentially expressed proteins were found to be 875
out of 4,960 proteins (either >2-fold upregulated or
<0.5-fold down-regulated) in the IMR-32 compared to the SK-N-SH
cells. These proteins were affiliated with upstream regulators that
IPA predicted to be activated in the IMR-32 compared to the SK-N-SH
cells based on the molecules identified in our dataset (data not
shown).
Table I lists the
top diseases and disorders, molecular and cellular bio-functions,
as well as physiological system development and function categories
that proteins significantly overexpressed in the IMR-32 cells are
mapped to; the fold change cut-off was set at ≥2-fold. Renal and
urological, neurological, hereditary and infectious diseases, as
well as organismal injury and abnormalities, were among the top
disease categories that the proteins were mapped to Table IA. RNA post-transcriptional
modification, molecular transport, RNA trafficking, cellular
compromise and gene expression were among the top molecular and
cellular functions that the overexpressed proteins in the IMR-32
cells were mapped to Table IB. The
physiological system development and function categories that
proteins belonged to included tissue development, nervous system
development and function, connective tissue development and
function and embryonic development (Table IC).
 | Table IFunctional annotation of proteins
upregulated in the IMR-32 compared to the SK-N-SH human
neuroblastoma cell lines. |
Table I
Functional annotation of proteins
upregulated in the IMR-32 compared to the SK-N-SH human
neuroblastoma cell lines.
| A, Diseases and
disorders |
|---|
|
|---|
| Name | P-value | No. of
molecules |
|---|
| Infectious
disease |
2.02E-09-1.69E-02 | 135 |
| Organismal injury
and abnormalities |
2.02E-09-1.89E-02 | 164 |
| Renal and
urological disease |
4.93E-09-1.69E-02 | 70 |
| Hereditary
disorder |
8.90e-07-1.89e-02 | 41 |
| Neurological
disease |
8.90E-07-1.75E-02 | 98 |
| B, Molecular and
cellular functions |
|---|
|
|---|
| Name | P-value | No. of
molecules |
|---|
| RNA
post-transcriptional modification |
2.54E-33-1.73E-02 | 75 |
| Molecular
transport |
4.20E-11-1.73E-02 | 75 |
| RNA
trafficking |
4.20E-11-1.97E-02 | 23 |
| Cellular
compromise |
1.45E-10-1.90E-02 | 38 |
| Gene
expression |
1.19E-07-1.07E-02 | 180 |
|
| Associated network
function | Score | |
|
| RNA
post-transcriptional modification, molecular transport, RNA
trafficking | 45 | |
| Gene expression,
RNA damage and repair, RNA post-translational modification | 45 | |
| Cellular assembly
and organization, cellular function and maintenance, tissue
development | 40 | |
| Cellular movement,
developmental disorder, hereditary disorder | 38 | |
| Cellular
compromise, cell cycle, cellular assembly and organization | 38 | |
| C, Physiological
system development and function |
|---|
|
|---|
| Name | P-value | No. of
molecules |
|---|
| Tissue
development |
8.61E-06-1.57E-02 | 70 |
| Nervous system
development and function |
6.52E-05-1.73E-02 | 75 |
| Connective tissue
development and function |
7.68E-04-1.89E-02 | 55 |
| Embryonic
development |
7.68E-04-1.73E-02 | 66 |
Fold change and predicted activated
up-stream regulators of proteins overexpressed in IMR-32 compared
to SK-N-SH cells
IPA was used to predict the activation status of the
upstream regulators of the differentially expressed proteins
between the IMR-32 and SK-N-SH cells. Table II lists the top molecules and the
fold change of upregulated proteins which included, CaM kinase like
vesicle associated (CAMKV), tumor protein D52
(TPD52), argininosuccinate synthetase 1 (ASS1),
FABP6, L1-CAM, FABP5, DNA polymerase γ,
catalytic subunit (POLG), collapsin response mediator
protein 1 (CRMP1), ribonuclease H2 subunit B
(RNASEH2B) and G protein subunit αO1 (GNAO1). MYCN,
hepatocyte nuclear factor 4α (HNF4A), microtubule associated
protein Tau (MAPT), APP and E2F were predicted
to be activated upstream regulators of the proteins in this
dataset, as determined by IPA (based on the target molecules that
were found to be >2-fold upregulated in the IMR-32 compared to
the SK-N-SH cells). In addition to the top upstream regulators,
Table III lists additional
upstream regulators predicted to be activated or inhibited in the
IMR-32 compared to the SK-N-SH cells. Of note, is the activation of
cancer-promoting, angiogenic and cancer stemness players, such as
MYC, HIF-1α, eukaryotic translation initiation factor
4γ1 (EIF4G1), IL3, angiopoietin 2 (ANGPT2) and
SREBF in the IMR-32 cells. Molecules predicted to be
inhibited in the IMR-32 compared to the SK-N-SH cells included
Aly/REF export factor (ALYREF), Ankyrin (ANK)2, autophagy
related 7 (ATG7), coiled-coil domain containing 88A
(CCDC88A), chromatin target of PRMT1 (CHTOP),
cleavage and polyadenylation specific factor 1 (CPSF1),
CPSF2 and CPSF3 among others, primarily involved in
RNA post-transcriptional modification, molecular transport and RNA
trafficking.
| Table IIFold change of top 10 proteins
upregulated in the IMR-32 versus the SK-N-SH human neuroblastoma
cells. |
Table II
Fold change of top 10 proteins
upregulated in the IMR-32 versus the SK-N-SH human neuroblastoma
cells.
| Molecules | | Fold change |
|---|
| CAMKV | | 103.800 |
| TPD52 | | 39.976 |
| ASS1 | | 24.995 |
| FABP5 | | 18.000 |
| POLG | | 16.726 |
| L1-CAM | | 16.708 |
| CRMP1 | | 15.295 |
| FABP6 | | 15.268 |
|
RNASEH2B | | 15.250 |
| GNAO1 | | 14.943 |
|
| Upstream
regulator | P-value of overlap
predicted | Activation
state |
|
| MYC | 1.52E-18 | Activated |
| HNF4A | 2.15E-15 | |
| MAPT | 7.36E-12 | |
| APP | 1.10E-11 | |
| E2F | 1.37E-11 | |
| Table IIIUpstream regulators predicted to be
either activated (in addition to the above top 5 upstream
regulators), or inhibited in the IMR-32 compared to the SK-N-SH
cells based on the statistically significant over- or
underexpression of molecules within the IPA-derived dataset. |
Table III
Upstream regulators predicted to be
either activated (in addition to the above top 5 upstream
regulators), or inhibited in the IMR-32 compared to the SK-N-SH
cells based on the statistically significant over- or
underexpression of molecules within the IPA-derived dataset.
| Predicted to be
activated | MYC,
ESRRA, MYCN, INSR, HIST1H1T,
HIST1H1A, HIF1A, EIF4E, EIF4G1,
SREBF2, ANGPT2, FLI1, IL3,
SREBF1, SCAP, RUVBL1, SP1,
CD40LG, EPAS1, KITLG, ADORA2A,
PGR, KAT5, PSEN1 |
| Predicted to be
inhibited | ALYREF,
ANK2, ATG7, CCDC88A, CHTOP,
CPSF1, CPSF2, CPSF3, CSTF1,
DDX39A, DDX39B, DENR |
Proteins overexpressed in the IMR-32
cells belong to tumorigenic pathways
The proteins overexpressed in the IMR-32 compared to
the SK-N-SH cells that belonged to the upstream regulators
predicted to be activated by IPA (SREBF1, SP1,
SCAP, SREBF2, IL3, KITLG, FLI1,
INSR, HIF-1α, MYC, EIF4E and
ANGPT2 among others), mapped to signaling pathways that
drive cancer stem cell maintenance and propagation (Notch)
(19), invasion and metastasis
[Rac1/Pak1/p38/MMP-2 (20)
and the leptin signaling pathway (21)], cancer malignancy [SREBP
signaling (22) and the
AGE/RAGE pathway (23)] and
proliferation [AMPK pathways (24)]. Table
IV lists the upstream regulators predicted to be activated by
IPA, with adjusted P-values for the overexpression level in the
IMR-32 cells and the pathways in which these regulators have been
demonstrated to play pivotal roles.
| Table IVFunctional annotation of upstream
regulators of the overexpressed proteins in the IMR-32 cells and
the signaling pathways they are affiliate witha. |
Table IV
Functional annotation of upstream
regulators of the overexpressed proteins in the IMR-32 cells and
the signaling pathways they are affiliate witha.
| Pathways | Adjusted
P-value | Genes
overexpressed |
|---|
| SREBP
signaling_WP1982 | 8.04E-05 | SREBF1, SP1,
SCAP, SREBF2 |
|
Adipogenesis_WP236 | 4.00E-04 | SREBF1, EPAS1,
SP1, HIF1A |
| Hematopoietic stem
cell differentiation | 4.55E-04 | IL3, KITLG,
FLI1 |
| AGE/RAGE
pathway_WP2324 | 9.50E-04 | SP1, INSR,
HIF1A |
| SREBF and miR-33 in
cholesterol and lipid homeostasis_WP2011 | 2.79E-03 | SREBF1,
SREBF2 |
| Mitochondrial gene
expression_WP391 | 3.11E-03 | ESRRA,
SP1 |
| Nuclear
receptors_WP170 | 9.47E-03 | ESRRA,
PGR |
| Integrated
pancreatic cancer pathway_WP2377 | 1.20E-02 | IL3, SP1,
MYC |
| Differentiation
pathway_WP2848 | 1.20E-02 | IL3,
KITLG |
| Translation
factors_WP107 | 1.20E-02 | EIF4E,
EIF4G1 |
| Notch signaling
pathway_WP61 | 1.67E-02 | MYC,
HIF1A |
| Rac1/Pak1/p38/MMP-2
pathway_WP3303 | 1.84E-02 | ANPGPT2,
MYC |
| AMPK signaling_
WP1403 | 1.85E-02 | SREBF1,
INSR |
| Leptin signaling
pathway_WP2034 | 2.08E-02 | SP1,
EIF4E |
| Androgen receptor
signaling pathway_WP138 | 2.78E-02 | KAT5,
SP1 |
| DNA damage response
(only ATM dependent)_WP710 | 4.08E-02 | MYC,
INSR |
|
miR-148/miR-31/FIH1/HIF1? - Notch
signaling in glioblastoma_WP3593 | 5.00E-02 | HIF1A |
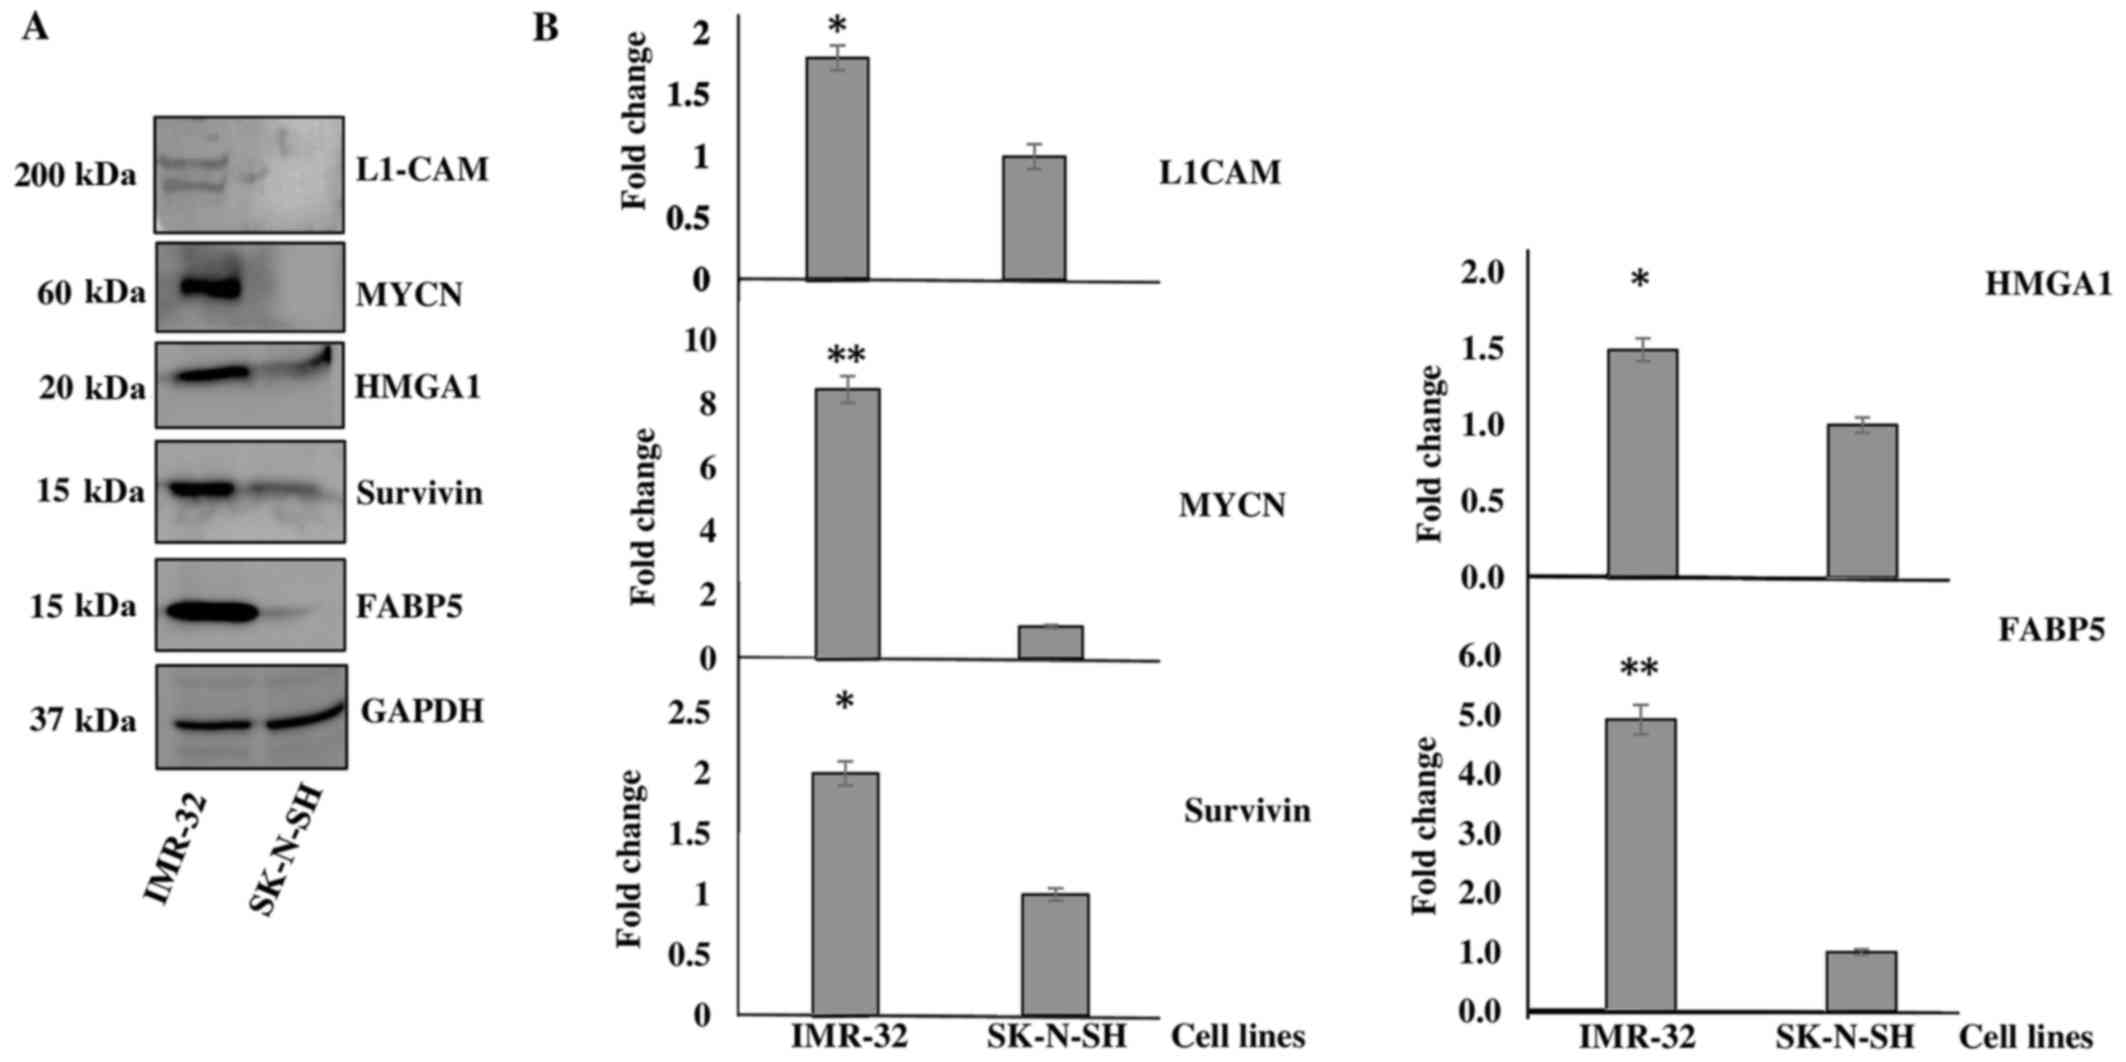
IMR-32 cells significantly overexpress
the tumorigenic proteins, HMGA1, L1-CAM, FABP5 and BIRC5
Of the highly tumorigenic proteins identified to be
upregulated in the IMR-32 compared to the SK-N-SH cells, we decided
to focus our investigation on L1-CAM, HMGA1,
FABP5, BIRC5 and MYCN as they mapped to
several of the activated upstream regulators, as predicted by IPA
and due to their tumorigenic roles played in various types of
cancer as elaborated below in the 'Discussion'. Western blot
analysis was used to determine the levels of HMGA1,
FABP5, BIRC5 and L1-CAM, as well as
MYCN protein expression between the IMR-32 and SK-N-SH
cells. As expected, we found all these targets to be significantly
overexpressed in the IMR-32 compared to the SK-N-SH neuroblastoma
cells. Fig. 1A is a representative
demonstration of multiple western blotting experiments verifying
the upregulation of these targets, as indicated by the SILAC
proteomics data. Densitometric analysis revealed a significant
upregulation of the protein expression of L1-CAM (~1-fold
overexpressed), MYCN (~7-fold overexpressed), HMGA1
(~0.5-fold overexpressed), BIRC5 (~1-fold overexpressed) and
FABP5 (~4-fold overexpressed) in the IMR-32 compared to the
SK-N-SH cells (Fig. 1B).
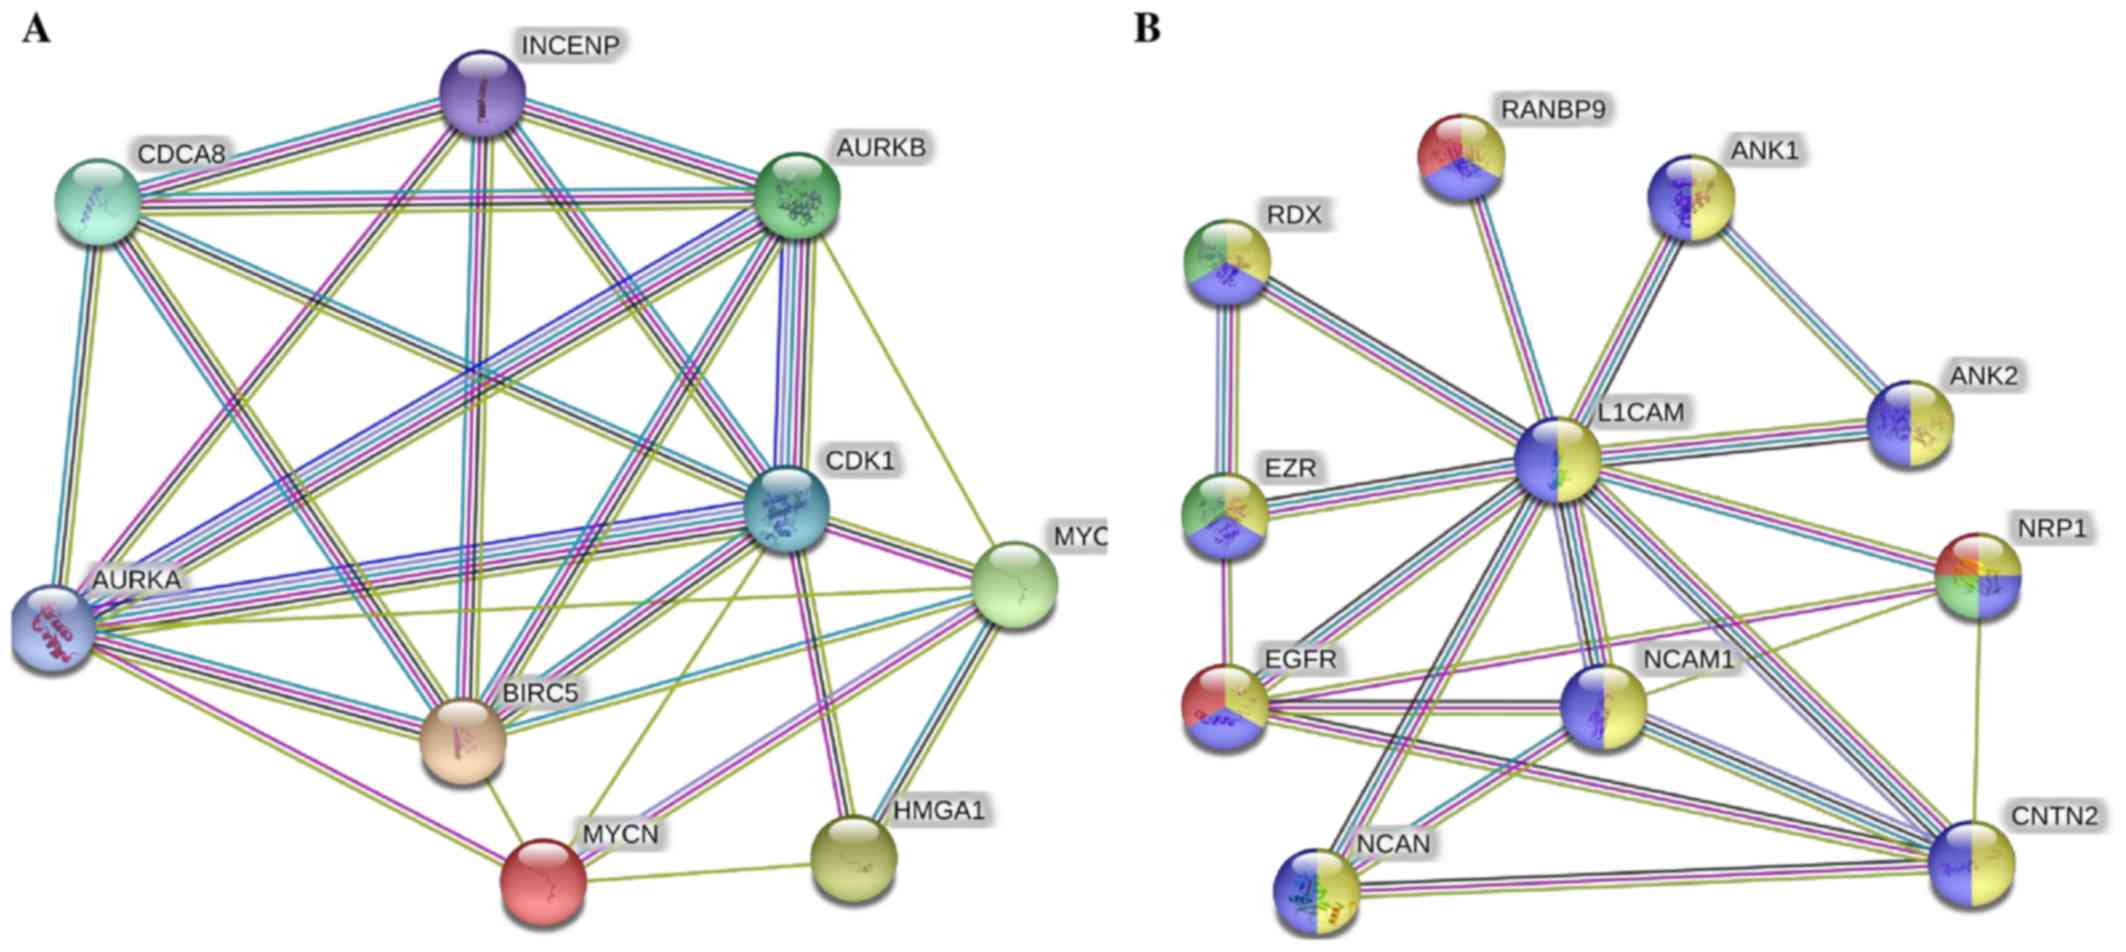
Upregulated proteins in IMR-32 cells
mapped to the highly tumorigenic MYCN pathway
The STRING protein network database was used to
analyze the interactions (experimentally determined and from
curated databases) between the activated upstream regulators of the
overexpressed proteins in the IMR-32 cells (HMGA1,
L1-CAM, BIRC5, FABP5, MYC, INSR,
SP1, HIF1A and SREBF1/2 among others) and
MYCN (Fig. 2A). In
addition, we used STRING protein network analysis to focus on the
interactions between the activated upstream regulators, which our
validated proteins (by western blot analysis; HMGA1,
L1-CAM, FABP5 and BIRC5) mapped to Fig. 2B). Of particular interest, are the
various hubs (proteins with multiple edges) identified, including
INSR, SP1, HIF-1α, MYC, MYCN,
HMGA1 and SREBF that show strong interactions
(experimentally-determined, from curated databases and text-mining)
with many other tumorigenic proteins (Fig. 2A). We further highlight the
important interactions (experimentally determined, from curated
databases and text-mining) between our validated targets (by
western blot analysis; HMGA1, BIRC5 and MYCN)
and the activated upstream regulators, SP1, SREBF1,
MYC, KITLG, IL3, INSR and HIF-1α
(Fig. 2B). KEGG pathway analysis
mapped the number of molecules to various pathways, most of which
are known tumorigenic drivers, including PI3K/Akt,
Ras, Rap1, Wnt, HIF-1α, transforming
growth factor-β (TGF-β) and mammalian target of rapamycin
(mTOR) and insulin signaling pathways (Table V). This intricate network of
interplay between these highly tumorigenic proteins warrants
further investigation, particularly in pre-clinical, animal models,
whereby multiple targeting of more than one of these players may
yield beneficial, antitumor effects and improve therapeutic
outcomes.
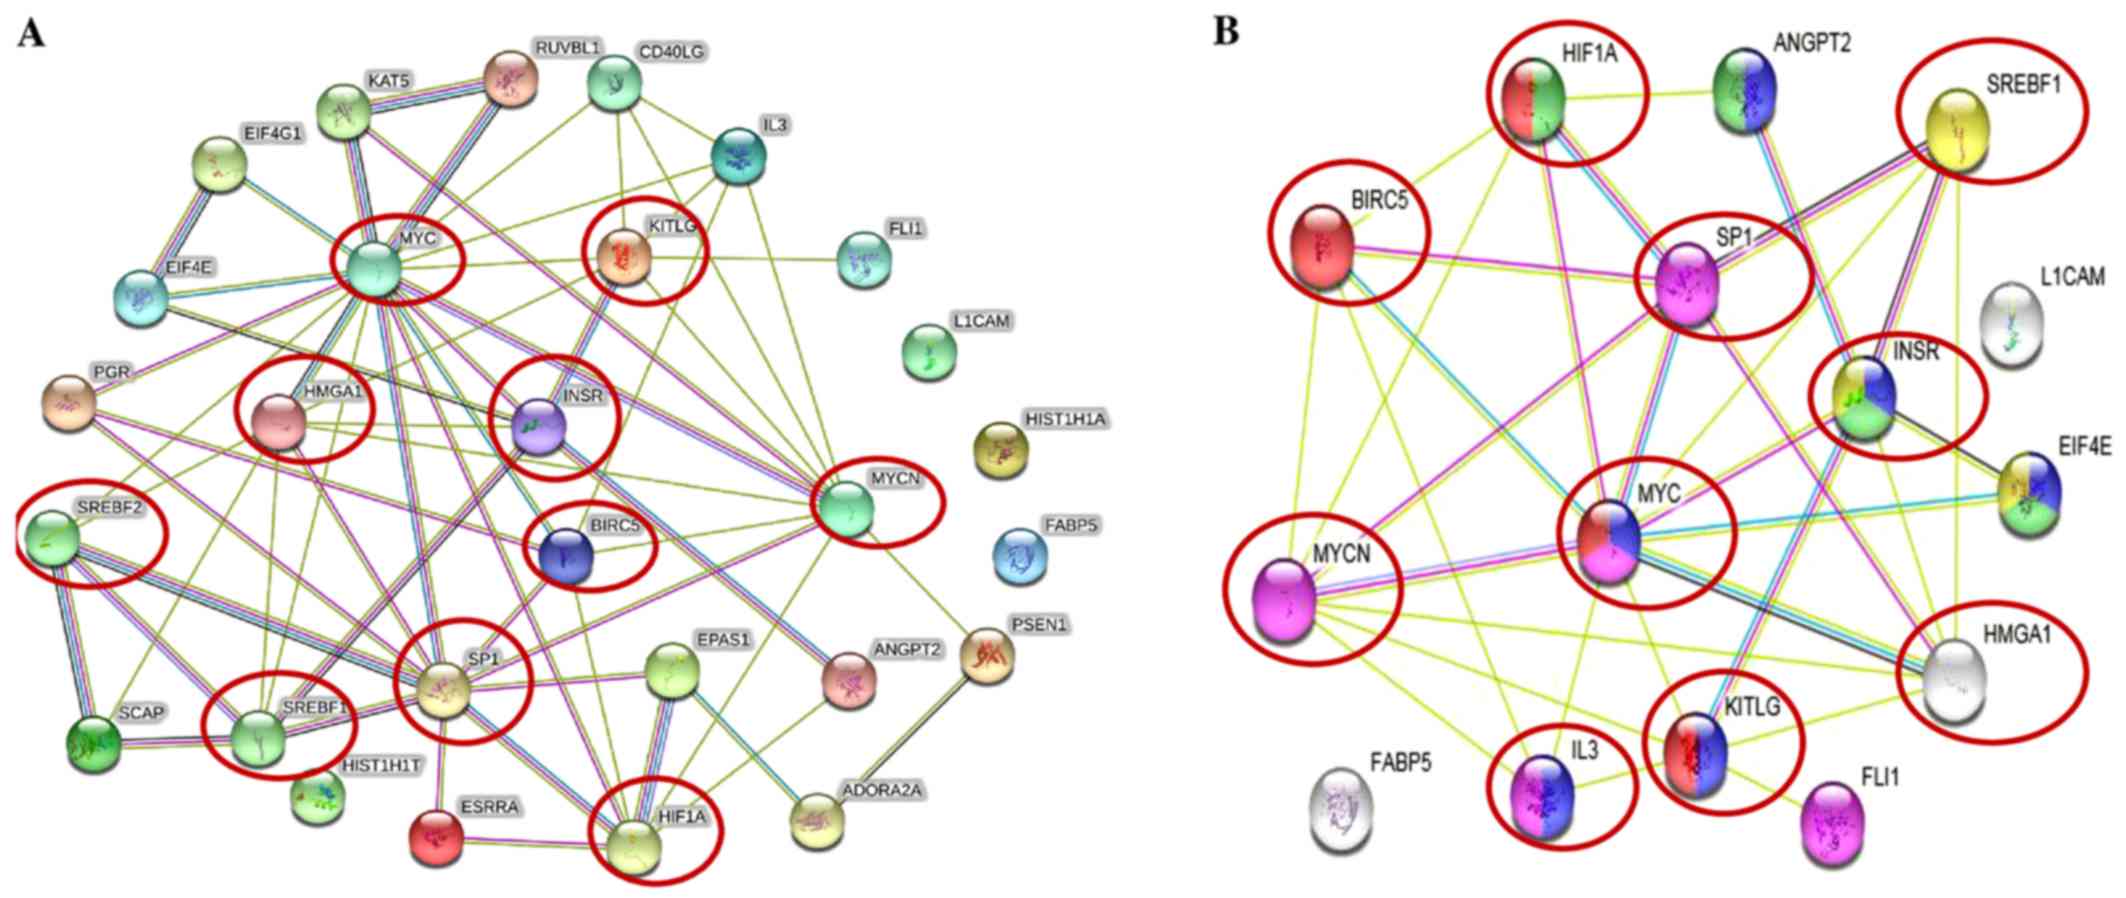 | Figure 2Tumorigenic proteins significantly
upregulated in the IMR-32 cells mapped to the MYCN proto-oncogene,
bHLH transcription factor (MYCN) pathway. (A) STRING pathway
analysis revealed interactions between molecules of activated
upstream regulators in IMR-32 cells as predicted by IPA. Of
importance are the various proteins with hubs (multiple edges, red
circles), including Sp1 transcription factor (SP1), MYC, MYCN,
hypoxia-inducible factor-1α (HIF-1α), high mobility group protein
A1 (HMGA1), INSR, KIT ligand (KITLG), sterol regulatory element
binding transcription factor 2 (SREBF2) and SREBF1. (B) STRING
pathway analysis also focused on the strong interactions between
the activated upstream regulators which HMGA1, MYCN and BIRC5
mapped to. Of particular interest are the hubs, including MYCN,
MYC, SP1, HIF-1α, SREBF1, BIRC5, HMGA1 and INSR that affiliated
with one or more of our validated targets. |
| Table VCommon tumorigenic pathways that
MYCN, BIRC5 and the activated upstream regulators mapped to. |
Table V
Common tumorigenic pathways that
MYCN, BIRC5 and the activated upstream regulators mapped to.
| Pathway ID no. | Pathway
description | Observed gene
count | False discovery
rate | Matching proteins
in your network (labels) |
|---|
| 4151 | PI3K-Akt signaling
pathway | 6 | 1.26E-05 | ANGPT2,
EIF4E, IL3, INSR, KITLG,
MYC |
| 5202 | Transcriptional
misregulation in cancer | 5 | 1.26E-05 | FLI1,
IL3, MYC, MYCN, SP1 |
| 4066 | HIF-1 signaling
pathway | 4 | 7.58E-05 | ANGPT2,
EIF4E, HIF1A, INSR |
| 5200 | Pathways in
cancer | 5 | 5.02E-03 | BIRC5,
HIF1A, KITLG, MYC, EPAS1 |
| 4910 | Insulin signaling
pathway | 3 | 6.48E-03 | EIF4E,
INSR, SREBF1 |
| 4015 | Rap1 signaling
pathway | 4 | 1.95E-02 | ADORA2A,
ANGPT2, INSR, KITLG |
| 4014 | Ras signaling
pathway | 3 | 2.05E-02 | ANGPT2,
INSR, KITLG |
| 4310 | Wnt signaling
pathway | 3 | 1.84E-02 | MYC,
PSEN1, RUVBL1 |
| 4150 | mTOR signaling
pathway | 2 | 2.67E-02 | EIF4E,
HIF1A |
| 5210 | Colorectal
cancer | 2 | 2.67E-02 | BIRC5,
MYC |
| 4350 | TGF-β signaling
pathway | 2 | 4.08E-02 | MYC,
SP1 |
| 4640 | Hematopoietic cell
lineage | 2 | 4.51E-02 | IL3,
KITLG |
Novel pathways link the MYCN-affected
proteins in the IMR-32 cells to cancer malignancy
In addition to the above-mentioned pathways, when
we combined only MYC, MYCN and our validated targets
in the STRING protein network analysis (Fig. 3A), we found very strong
interactions between MYC, MYCN, BIRC5 and
HMGA1 with Aurora kinase (AURK)A/B,
cyclin-dependent kinase 1 (CDK1), cell division cycle
associated 8 (CDCA8) and INCENP. These players were
mapped to cellular functions highly affiliated with mitosis and
cellular division and proliferation (Table VI). Lastly, L1-CAM focused
network analysis revealed its strong interaction with neural cell
adhesion molecule 1 (NCAM1), neurocan (NCAN), ezrin
(EZR), RDX, ANK1, ANK2, contactin 2
(CNTN2), neuropilin 1 (NRP1), epidermal growth factor
receptor (EGFR) and RAN binding protein 9 (RANBP9)
(Fig. 3B), most of which drive
angiogenic and migratory processes to fuel cellular invasion,
migration and metastatic spread.
| Table VICommon tumorigenic pathways that MYC
and our validated targets (BIRC5, HMGA1 and MYCN) mapped to. |
Table VI
Common tumorigenic pathways that MYC
and our validated targets (BIRC5, HMGA1 and MYCN) mapped to.
| Pathway ID no. | Pathway
description | Observed gene
count | False discovery
rate | Matching proteins
in your network (labels) |
|---|
| GO.0051301 | Cell division | 6 | 0.000118 | AURKA,
AURKB, BIRC5, CDCA8, CDK1,
INCENP |
| GO.0007067 | Mitotic nuclear
division | 5 | 0.000834 | AURKB,
BIRC5, CDCA8, CDK1, INCENP |
| GO.0007052 | Mitotic spindle
organization | 3 | 0.0017 | AURKA,
AURKB, BIRC5 |
| GO.0007059 | Chromosome
segregation | 4 | 0.0017 | AURKB,
BIRC5, CDCA8, INCENP |
| GO.0043146 | Spindle
stabilization | 2 | 0.00178 | AURKA,
AURKB |
| GO.0051225 | Spindle
assembly | 3 | 0.00178 | AURKA,
AURKB, BIRC5 |
| GO.0051302 | Regulation of cell
division | 4 | 0.00382 | AURKA,
AURKB, BIRC5, MYC |
| GO.0007264 | Small
GTPase-mediated signal transduction | 5 | 0.00405 | AURKB,
BIRC5, CDCA8, CDK1, INCENP |
| GO.0000910 | Cytokinesis | 3 | 0.00568 | AURKB,
BIRC5, INCENP |
| GO.0031145 | Anaphase-promoting
complex-dependent proteasomal ubiquitin-dependent protein catabolic
process | 3 | 0.00568 | AURKA,
AURKB, CDK1 |
| GO.0010941 | Regulation of cell
death | 6 | 0.00604 | AURKA,
AURKB, BIRC5, CDK1, MYC,
MYCN |
| GO.0006468 | Protein
phosphorylation | 5 | 0.00685 | AURKA,
AURKB, BIRC5, CDK1, MYC |
| GO.0018105 | Peptidyl-serine
phosphorylation | 3 | 0.00685 | AURKA,
AURKB, CDK1 |
| GO.0034501 | Protein
localization to kinetochore | 2 | 0.00685 | AURKB,
CDK1 |
| GO.0035404 | Histone-serine
phosphorylation | 2 | 0.00685 | AURKA,
AURKB |
| GO.0043066 | Negative regulation
of apoptotic process | 5 | 0.00685 | AURKA,
AURKB, BIRC5, CDK1, MYC |
| GO.0051276 | Chromosome
organization | 5 | 0.00736 | AURKA,
AURKB, CDCA8, HMGA1, MYC |
| GO.0006996 | Organelle
organization | 7 | 0.00837 | AURKB,
BIRC5, CDCA8, CDK1, HMGA1,
INCENP, MYC |
| GO.0051781 | Positive regulation
of cell division | 3 | 0.0103 | AURKA,
AURKB, BIRC5 |
| GO.0035556 | Intracellular
signal transduction | 6 | 0.0104 | AURKB,
BIRC5, CDCA8, CDK1, INCENP,
MYC |
| GO.0000086 | G2/M transition of
mitotic cell cycle | 3 | 0.0122 | AURKA,
BIRC5, CDK1 |
| GO.0022402 | Cell cycle
process | 5 | 0.0122 | AURKB,
BIRC5, CDCA8, INCENP, MYC |
| GO.1902589 | Single-organism
organelle organization | 6 | 0.0131 | AURKB,
BIRC5, CDCA8, CDK1, HMGA1,
INCENP |
| GO.0033043 | Regulation of
organelle organization | 5 | 0.0134 | AURKA,
AURKB, BIRC5, HMGA1, MYC |
| GO.0090307 | Mitotic spindle
assembly | 2 | 0.0136 | AURKB,
BIRC5 |
| GO.0016568 | Chromatin
modification | 4 | 0.0151 | AURKA,
AURKB, HMGA1, MYC |
| GO.0007049 | Cell cycle | 5 | 0.026 | AURKB,
BIRC5, CDCA8, INCENP, MYC |
| GO.0000075 | Cell cycle
checkpoint | 3 | 0.0275 | AURKB,
BIRC5, CDK1 |
| GO.0002053 | Positive regulation
of mesenchymal cell proliferation | 2 | 0.0275 | MYC,
MYCN |
| GO.0007098 | Centrosome
cycle | 2 | 0.0275 | AURKA,
CDK1 |
| GO.0090068 | Positive regulation
of cell cycle process | 3 | 0.0338 | AURKA,
AURKB, BIRC5 |
| GO.0031577 | Spindle
checkpoint | 2 | 0.0342 | AURKB,
BIRC5 |
| GO.1903047 | Mitotic cell cycle
process | 4 | 0.0372 | AURKB,
BIRC5, CDCA8, INCENP |
| GO.0030162 | Regulation of
proteolysis | 4 | 0.0399 | AURKA,
BIRC5, CDK1, MYC |
| GO.0045840 | Positive regulation
of mitotic nuclear division | 2 | 0.0412 | AURKA,
BIRC5 |
| GO.0051303 | Establishment of
chromosome localization | 2 | 0.0434 | BIRC5,
CDCA8 |
| GO.0010639 | Negative regulation
of organelle organization | 3 | 0.0455 | AURKA,
AURKB, HMGA1 |
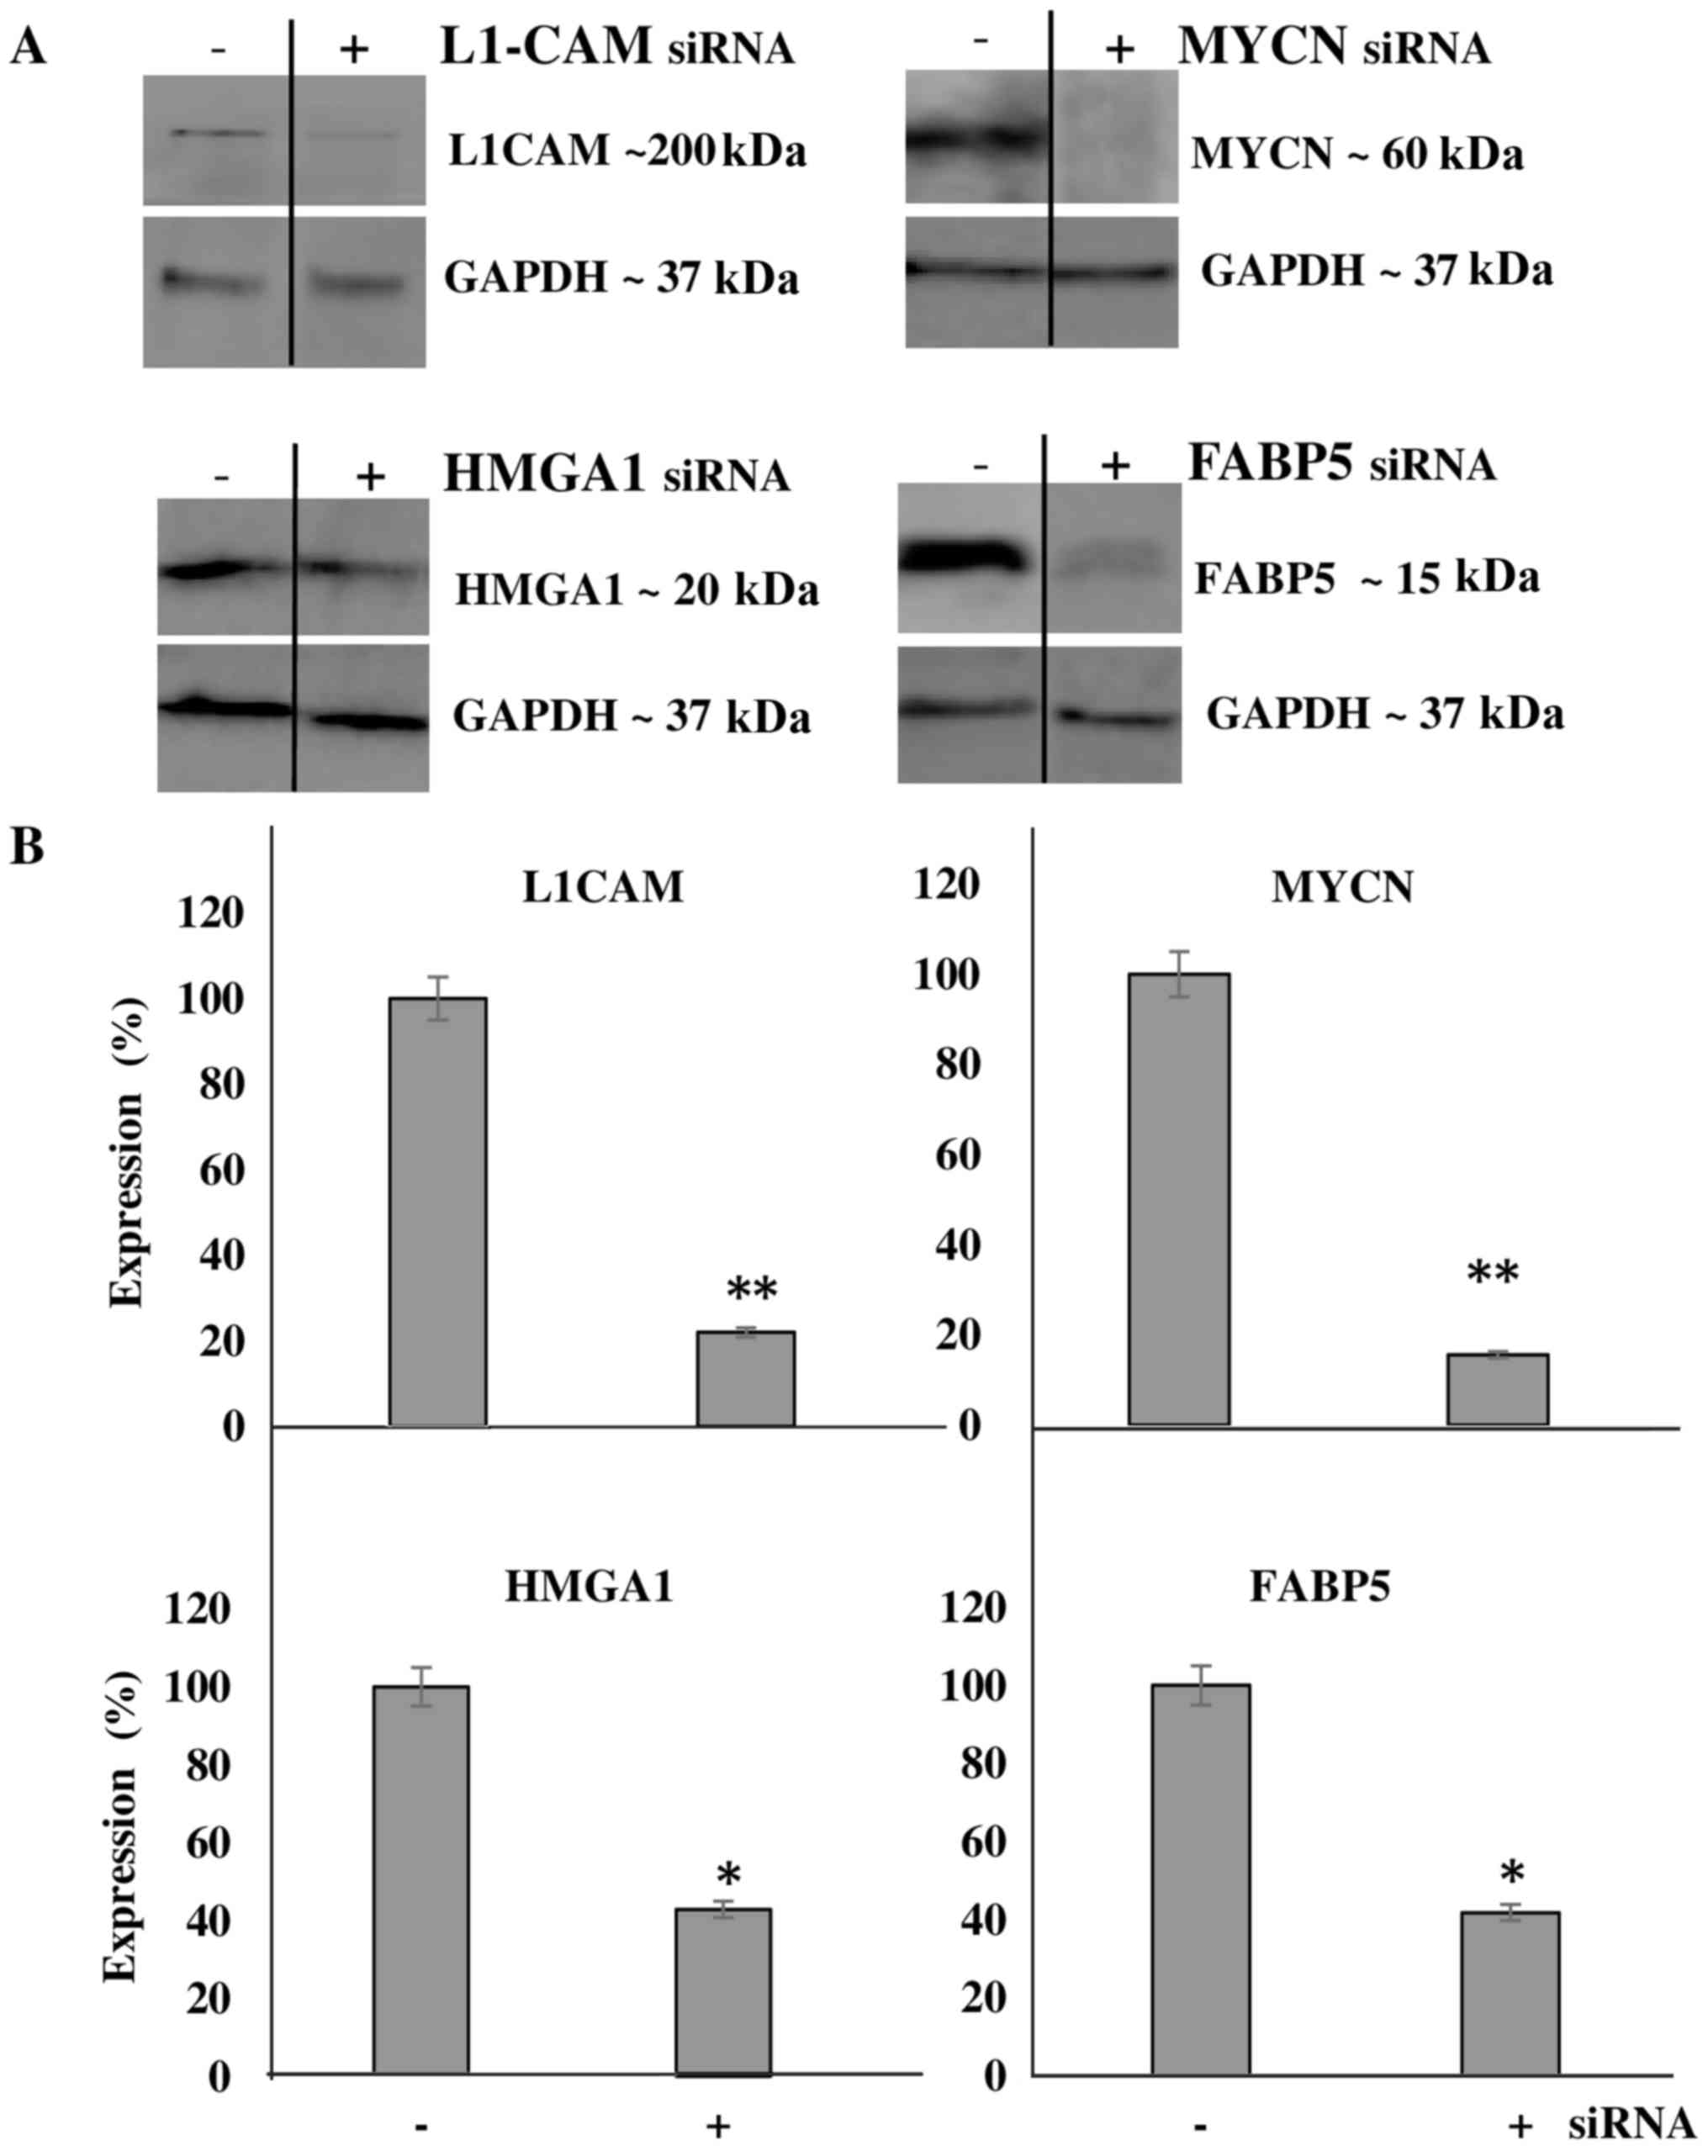
Transcriptional KD experiments reveal
interplay between tumorigenic proteins upregulated in IMR-32
cells
We then aimed to transcriptionally KD the protein
expression of these molecules and determine the effects of this KD
on cellular bio-function. Additionally, we wished to determine
whether the downregulation of one protein would affect the
expression level of the other targets, thereby implicating a
potential interplay between the proteins. Using transient siRNA
transfection, we successfully downregulated the protein expression
(Fig. 4A) of MYCN (~85%),
HMGA1 (~60%), FABP5 (~60%) and L1-CAM (~80%)
as determined by western blot analysis at 48 h after siRNA
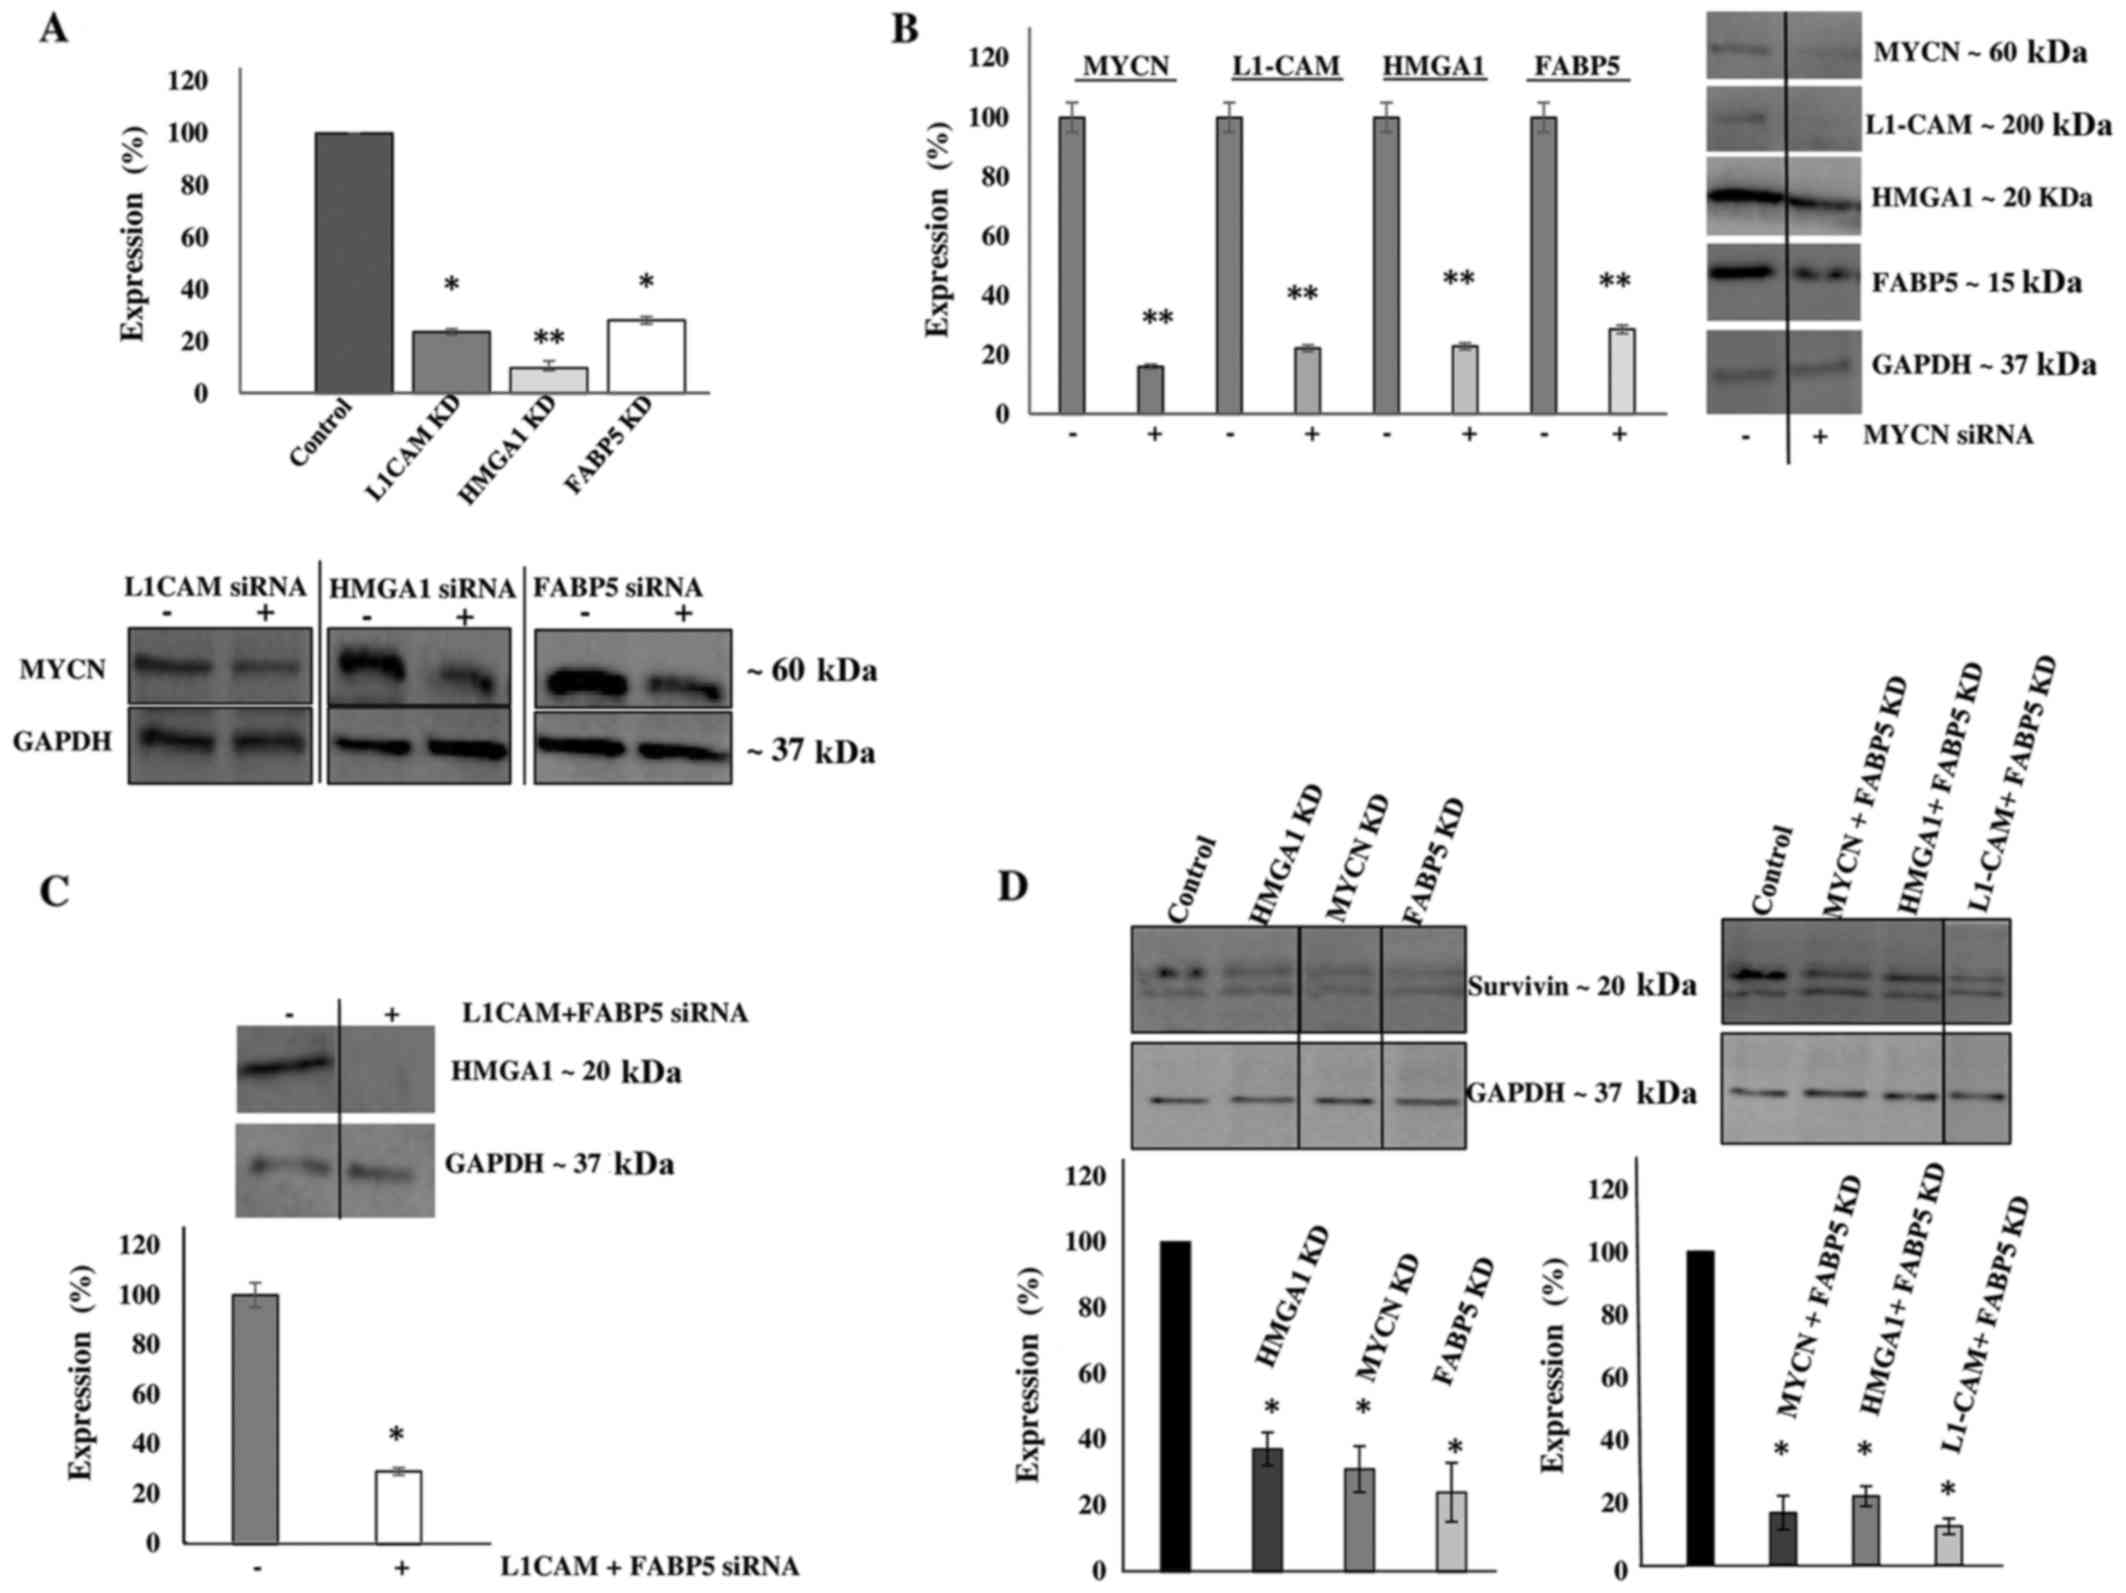
transfection (Fig. 4B). Of note,
L1-CAM, HMGA1 and FABP5 transcriptional KD led
to the significant concomitant downregulation of MYCN protein
expression by ~80, 90 and 75%, respectively (Fig. 5A). In addition, MYCN
transcriptional KD led to the significant concomitant
downregulation of L1-CAM, HMGA1 and FABP5
protein expression by ~77, 75 and 70, respectively (Fig. 5B). Moreover, the combined
transcriptional KD of L1-CAM and FABP5 led to the
significant concomitant downregulation of HMGA1 protein
expression by ~70% (Fig. 5C),
while survivin protein expression was abrogated following the
transcriptional KD of MYCN, HMGA1 and FABP5
(Fig. 5D). This interplay between
these tumorigenic proteins is extremely interesting and warrants
further investigation into the mechanisms utilized by this network
to drive cancerous progression and malignant, treatment-evasive
recurrence in high-risk, MYCN-amplified pediatric
neuroblastomas.
Transcriptional KD of tumorigenic
proteins inhibits the proliferation and migration of IMR-32
cells
To determine the cellular bio-functional effects of
the transcriptional downregulation of our protein targets, we
examined the rate of proliferation of the IMR-32 cells over 5 days
following the transcriptional KD of these tumorigenic proteins. We
observed no significant differences in the rate of the
proliferation of IMR-32 cells at 0 and 24 h following the
transcriptional KD of all the above-mentioned siRNA-targeted,
tumorigenic proteins compared to the controls. However, there was a
statistically significant reduction in the rate of cellular
proliferation between the MYCN, L1-CAM, HMGA1
and FABP5 siRNA-transfected cells and the controls at 48, 72
and 96 h post-siRNA transfection (Fig.
6A), implicating the role of these proteins in highly
proliferative signaling pathways. The rate of the proliferation of
cells targeted with double-target siRNA transfection (MYCN +
L1-CAM, MYCN + HMGA1, MYCN +
FABP5, HMGA1 + L1-CAM, HMGA1 +
FABP5 and FAB5 + L1-CAM) was also
significantly decreased from 48 to 96 h post-transfection compared
to the controls (Fig. 6B).
Double-target siRNA transfection did not exert an additive effect
on the rate of cell proliferation compared to the single-target
siRNA-transfected cells (data not shown); thus, we speculate on the
possible redundancy of the proliferative signaling pathways of
these proteins. We then sought to examine the effects of
FABP5 and HMGA1 transcriptional KD on the migration
of IMR-32 cells, since L1-CAM (25) and MYCN (26,27)
have been previously reported to affect neuroblastoma cell
migration. Using the 'wound healing' scratch assay (Fig. 6C) we observed a significant
decrease in the migratory capacity of the IMR-32 cells subjected to
FABP5 or HMGA1 transcriptional KD at 24 h after
'wound induction' (Fig. 6D).
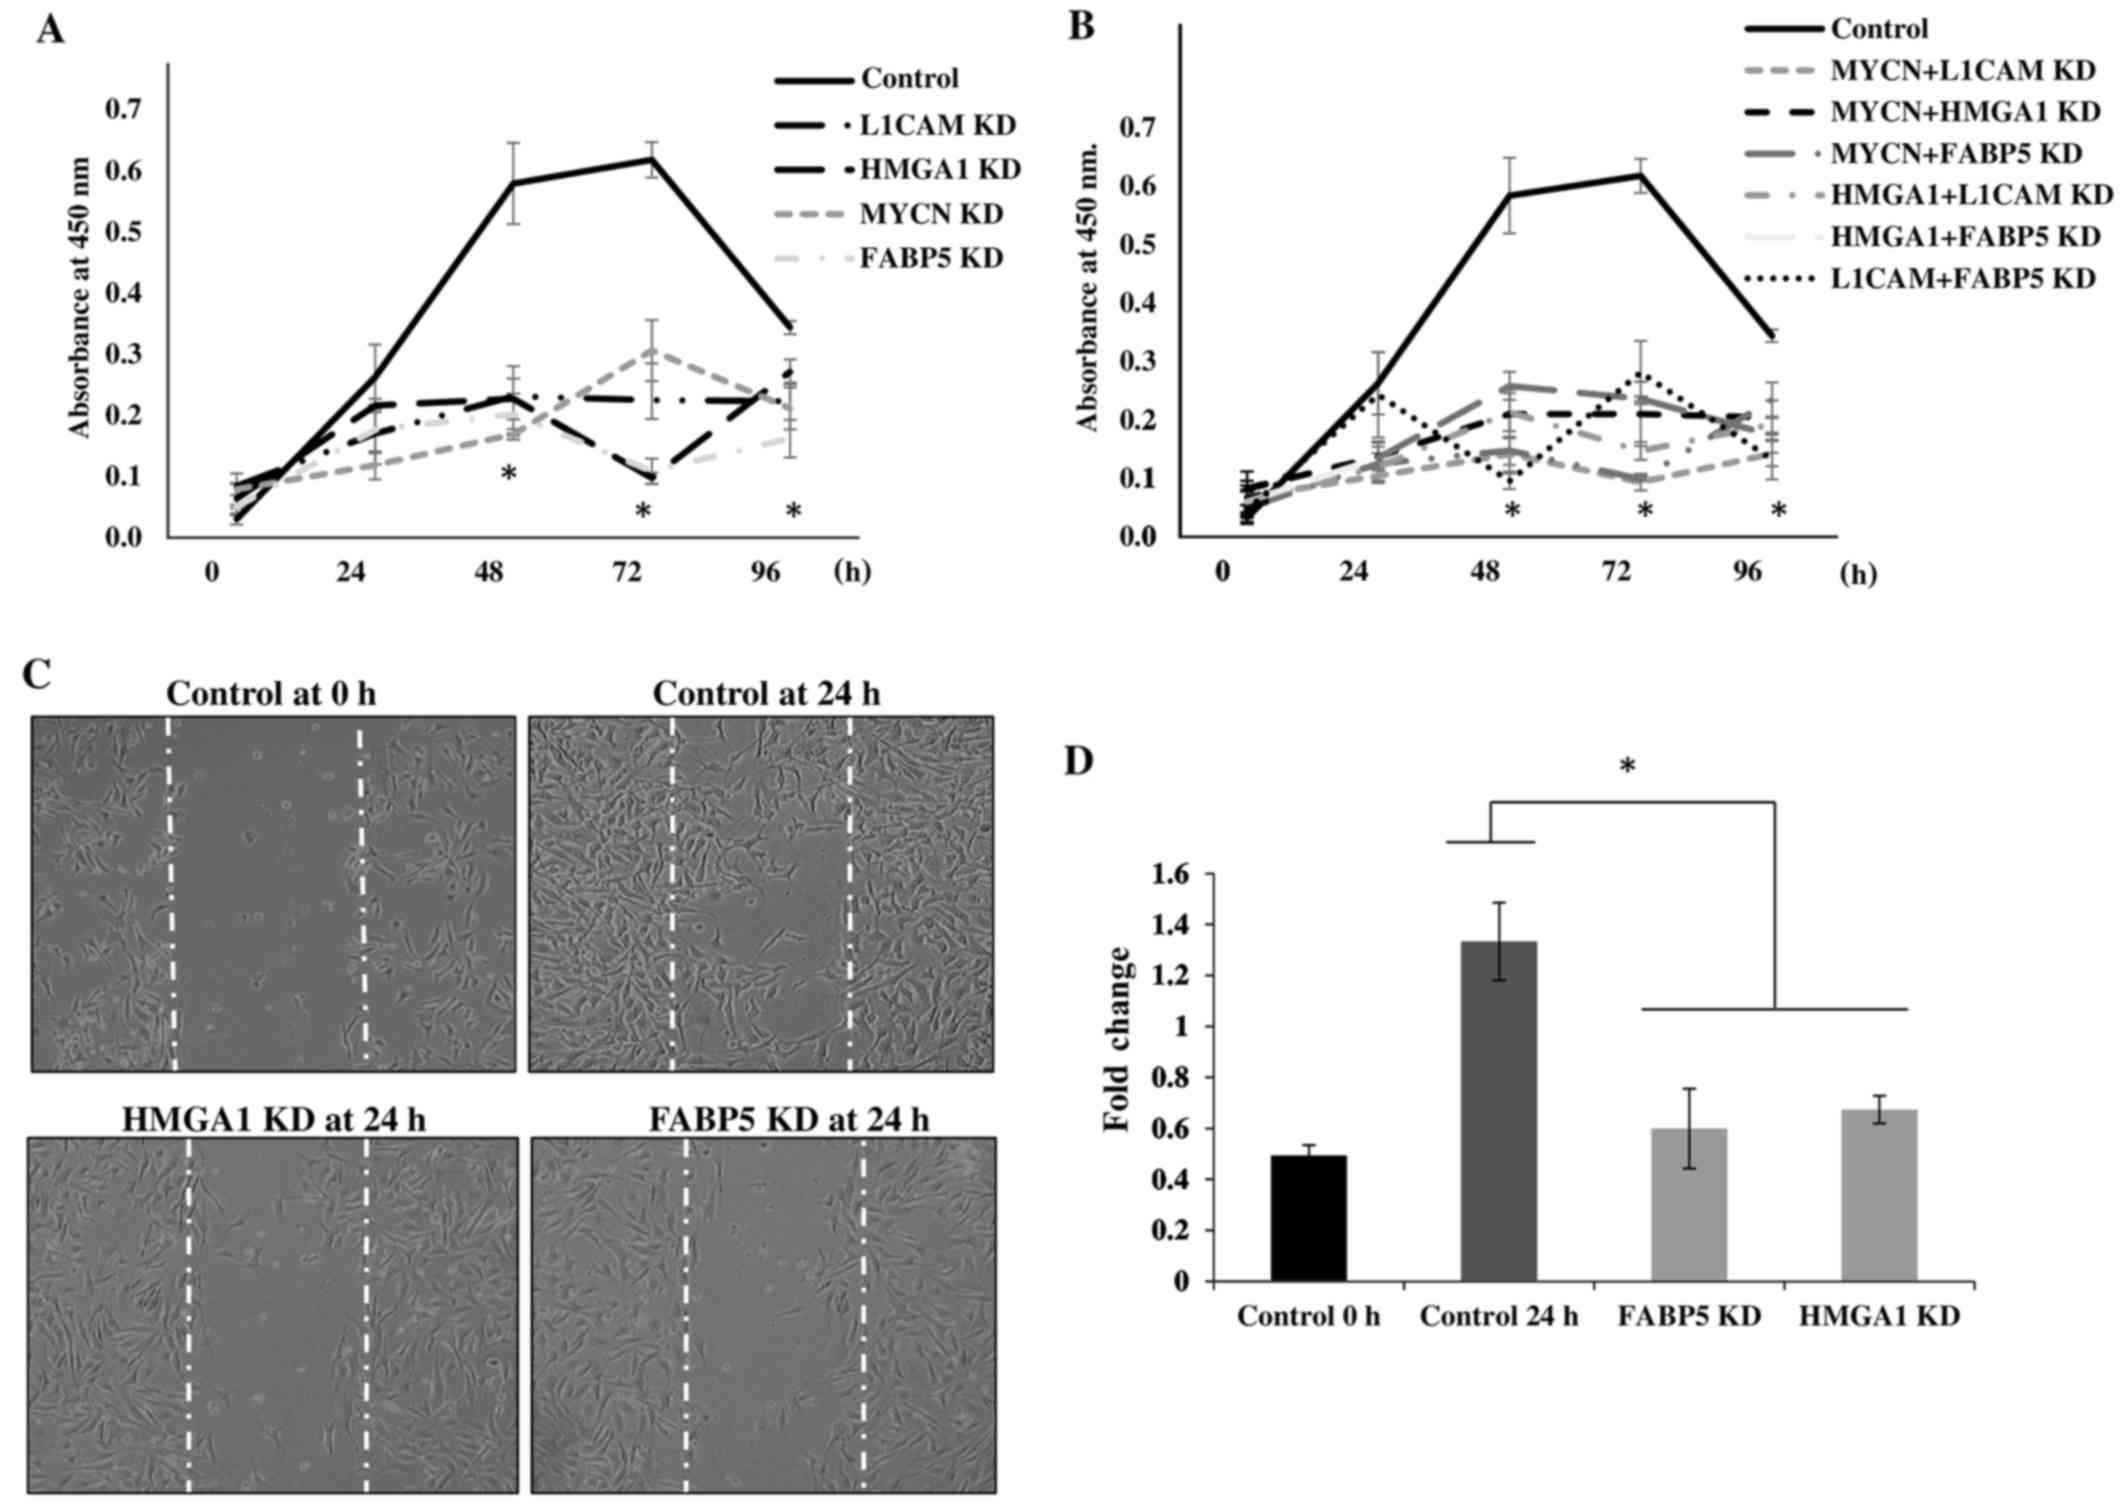 | Figure 6Transcriptional knockdown of
tumorigenic proteins inhibits the proliferation and migration of
IMR-32 cells. (A) Transient siRNA transfection and knockdown of
MYCN proto-oncogene, bHLH transcription factor (MYCN), L1-cell
adhesion molecule (L1-CAM), high mobility group protein A1 (HMGA1)
and fatty-acid binding protein 5 (FABP5) protein expression led to
a significant decrease in IMR-32 cell proliferation from 48–96 h
compared to the controls, as determined using a WST-1 cell
proliferation assay. (B) Double-siRNA targeted knockdown (MYCN +
L1-CAM, MYCN + HMGA1, MYCN + FABP5, L1-CAM + HMGA1, L1-CAM + FABP5
and HMGA1 + FABP5) also led to significant decrease in the IMR-32
cellular proliferation rate from 48–96 h compared to the controls.
(C) Representative images of 'wound closure' illustrate a reduction
in the migratory capacity of the IMR-32 cells subjected to FABP5
and HMGA1 siRNA knockdown. (D) The average area of 'wound closure'
in multiple random fields, measured using AxioVision Systems
software, revealed a statistically significant decrease in IMR-32
cell migration compared to the controls. Experiments were run in
triplicate and repeated >3 times. Results represent the means ±
SEM; *P<0.05. |
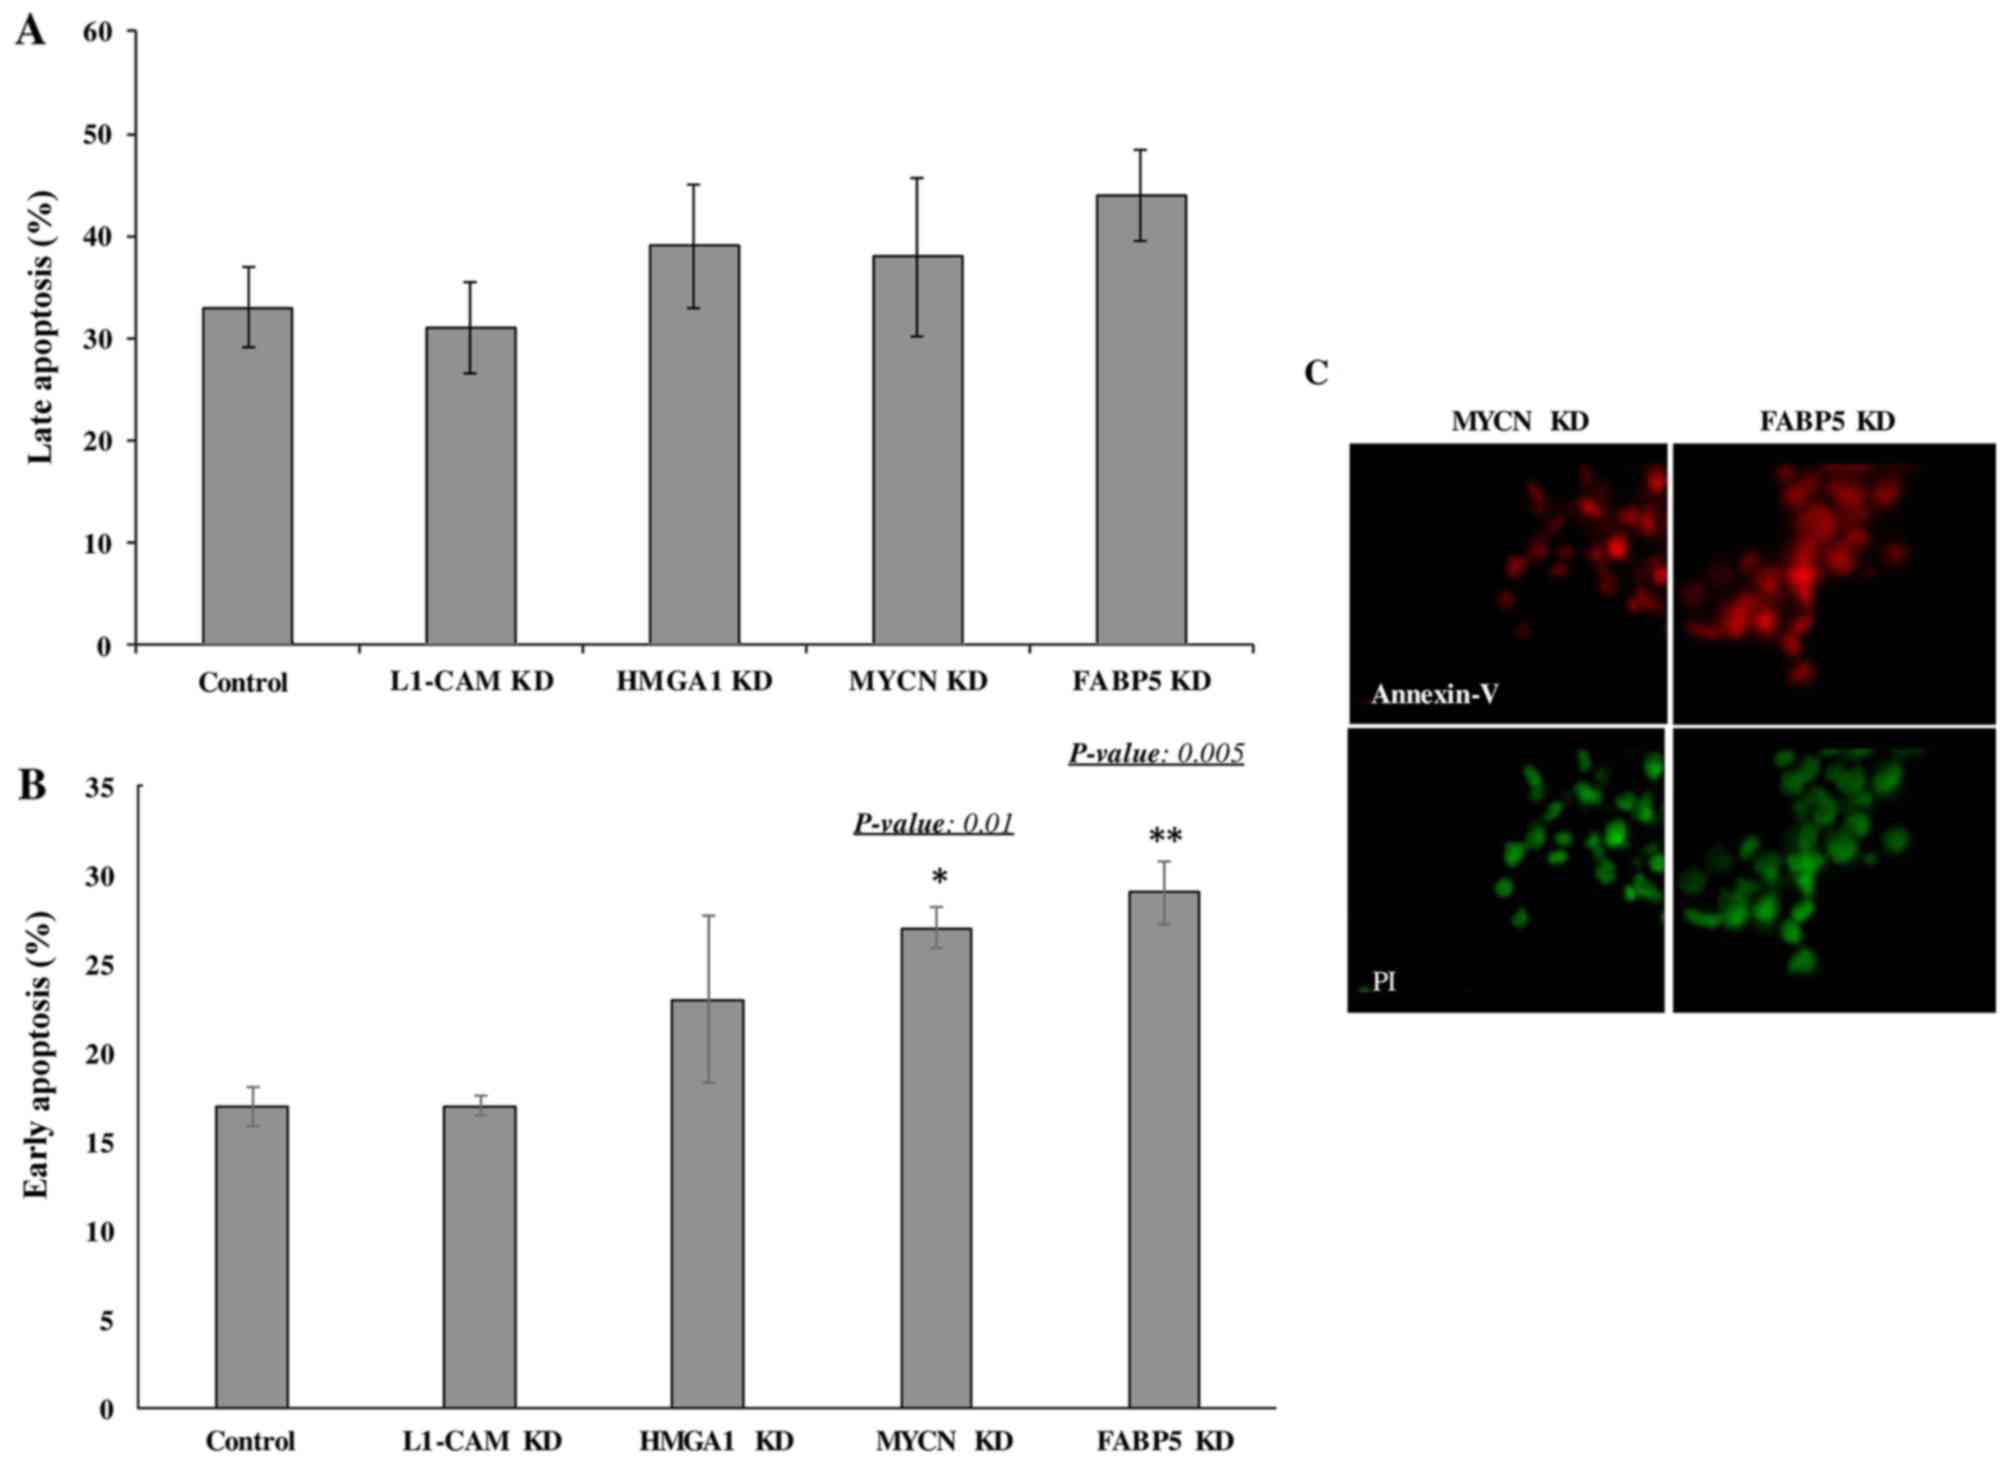
Transcriptional KD of FABP5 and MYCN
induces the early apoptosis of IMR-32 cells
Lastly we wished to determine whether the
transcriptional KD of the tumorigenic proteins would affect the
rate of apoptosis of IMR-32 cells. The late apoptotic rate was not
observed to differ significantly between the controls and
siRNA-transfected cells of any target at 48 h following
transcriptional KD (Fig. 7A).
However, early apoptosis was significantly higher in the cells
subjected to FABP5 and MYCN transcriptional siRNA KD at 48 h, as
determined by Annexin V/PI staining and FACS analysis (Fig. 7B). This was confirmed by
immunofluorescence staining of the cells with Annexin V and PI
(Fig. 7C). Perhaps a difference in
the rate of late apoptosis would be observed had we conducted the
apoptosis assay at 72 or 96 h post-transcriptional KD.
Discussion
Neuroblastoma is a devastating childhood cancer
with a dismal prognosis if presented in the high-risk group at
diagnosis. IMR-32 is a MYCN-amplified, highly malignant
human neuroblastoma cell line. On the contrary, SK-N-SH, while a
metastatic human neuroblastoma cell line derived from an epithelial
origin (28), is
non-MYCN-amplified (29),
and hence, is considered less invasive than the IMR-32 cells and a
good cell line to use in comparison to IMR-32. In addition to the
well-established pathways known to affiliate with MYCN in
tumorigenic processes, we sought to discover whether other
tumorigenic proteins and/or pathways are also 'accomplices' of the
main 'culprit' MYCN, in its pursuit of
cancerous-progression, malignancy, anti-apoptosis and resistance to
treatment in high-risk neuroblastoma.
Our preliminary analysis of the proteomic
signatures in the MYCN-amplified IMR-32 compared to the
non-MYCN-amplified SK-N-SH cells revealed some noteworthy,
upregulated tumorigenic proteins in the IMR-32 compared to the
SK-N-SH cells. Enrichr mapped these proteins to highly cancerous
pathways, including leptin signaling, AGE/RAGE signaling,
AMPK signaling, Notch, SREBP and
Rac1/Pak1/p38/MMP-2 signaling pathways, among others. The
leptin signaling pathway is highly affiliated with cancer migration
and invasion (30), whereas
SREBP, AGE/RAGE, Notch, Rac and
AMPK have all been implicated in the tumorigenesis of
various nervous system cancers, as well as other solid tumors
(19–24). IMR-32 cells represent a highly
malignant, invasive, treatment-resistant form of neuroblastoma and
the identification of these activated pathways within them has shed
some light on the understanding of their malignant mechanisms.
Of the SILAC identified upregulated proteins, we
selected to verify with western blot analysis, the protein
expression of several that mapped to more than one activated
tumorigenic pathways including, L1-CAM (mapped to upstream
regulators APP and HIF-1α), HMGA1 (mapped to activated
upstream regulators MYC, APP, E2F1,
MYCN and SP1), FABP5 (mapped to activated
upstream regulators MYC, SREBF2, SREBF1 and
KITLG) and survivin or BIRC5 (mapped to activated
upstream regulators IL3, MYCN and MYC) to
determine their interaction with MYCN in the IMR-32 cells.
As shown in Table V, there is
intriguing overlap between these upstream regulators in highly
tumorigenic pathways including, pathways in cancer, transcriptional
misregulation in cancer, PI3K/AKT, Ras, Rap1,
TGF-β, HIF-1α, Wnt, insulin and mTOR
signaling pathways. The mTOR pathway, one of the most potent
signaling pathways involved in cellular proliferation and protein
synthesis, is highly activated in MYCN-amplified cell lines
(31). Moreover, when
MYCN-amplified IMR-32 cells are treated with SU11657 (SUGEN), a
selective multi-targeted tyrosine kinase inhibitor with antitumor
and anti-angiogenic activity, their growth is significantly
inhibited (32).
L1-CAM is a neural cell adhesion molecule L1
found to be expressed in numerous tumors, such as neuroblastomas
(25), glioblastomas, melanomas,
lymphomas, as well as breast, colon, small cell lung carcinomas and
gastrointestinal stromal tumors (33,34).
L1-CAM plays a significant role in tumor progression and
metastatic behavior (35), and the
expression profile analysis in multiple human tumors has identified
L1-CAM as a molecular marker for differential diagnosis and
targeted therapy (36). Of note,
various studies have recently implicated L1-CAM in cancer
stem-cell maintenance and propagation (37), the activation of DNA damage
checkpoint response that confers resistant to radiation therapy
(38) and cancer cell migration
and malignancy (39) in
glioblastoma and neuroblastoma (40). Moreover, the strong interactions
between L1-CAM and EGFR, RANBP9 and
NCAM1 (which affiliates with TGF-β) (41) and NRP1 (Fig. 3), may enhance IMR-32 cell invasion
and metastasis via an angiogenesis-driven, migratory mechanism.
HMGA1 belongs to a large family of
non-histone DNA-binding factors that play important architectural
functions in the organization of active chromatin (42). In addition to its role in
physiologic processes, a deregulated HMGA1 expression is
described in most tumors of epithelial and mesenchymal origin, and
is considered a hallmark of cancer (43). Particularly, higher levels of
HMGA1 expression are associated with more malignant and
metastatic phenotypes in epithelial cancers (44,45).
Furthermore, HMGA1 regulation may be controlled by
MYCN, which upregulates HMGA1 expression in neuroblastoma
cells and in neuroblastoma-like tumors arising in MYCN
transgenic mice. Moreover, HMGA1 has been shown to be a
direct MYCN transcriptional target, suggesting that
HMGA1 is a biologically relevant MYCN target gene
(46).
STRING protein network analysis mapped HMGA1
to MYCN, SP1, E2F1 and SREBP1 [a
transcription factor with an important role in lipid metabolism,
previously found to be highly activated in malignancies (47)], SREBP-cleavage-activating
protein [SCAP which plays a role in trafficking
SREBP1 from the ER to the Golgi apparatus and recently found
to play a role in tumorigenesis (48)], insulin-like growth factor receptor
1 [IGF1R or INSR, a known driver of HIF-2α
transcription via PI3K signaling (49)] and the gene KITLG [which
codes for the ligand of the tyrosine-kinase receptor c-KIT,
STAT1 and STAT4 and implicated in the susceptibility
of germ cell tumors such as testicular cancer (50,51)]. Furthermore, when we examined the
networks linking only HMGA1, BIRC5 and MYCN,
we identified very strong interactions with the highly tumorigenic
AURKA/B, CDK1, CDCA8 (52) and INCENP (53). As strong cell proliferation
players, we speculate that the IMR-32 cells overexpressing
HMGA1 and MYCN have an enhanced mitotic and cell
division capacity that favors tumor cell proliferation and the
evasion of apoptosis. With HMGA1 being a common player in
the above-mentioned tumorigenic pathways, including HIF-1α,
SREBP1, KITLG, AURKA/B, CDK1 and
CDCA8, it is no surprise that MYCN-amplified IMR-32
cells or high-risk, MYCN-amplified neuroblastomas are highly
malignant cancers.
FABP5 binds with a strong affinity to medium
and long chain fatty acids, and translocates them into the nucleus
where they stimulate their nuclear receptor PPARγ, which in
turn stimulates other targets that lead to cancer expansion and
progression by enhanced angiogenesis and reduced apoptosis
(54). Based on previous studies
that have shown FABP5 upregulation in various tumors, its
association with cancer malignancy and invasiveness (55) and the demonstrated antitumor
activity of the FABP5 chemical inhibitor SBFI26 (56), we decided to evaluate its role in
the IMR-32 neuroblastoma cells. We were particularly interested in
FABP5 as there are limited studies exploring its role in the
aggressive, MYCN-amplified neuroblastoma cells. We were very
intrigued by the observation that FABP5 mapped to the highly
tumorigenic MYC, SREBF1, SREBF2 and
KITLG pathways further explaining the malignant nature of
the IMR-32 cells.
Survivin or BIRC5 expression is strongly
upregulated in aggressive, high-risk neuroblastoma compared to
normal tissues, adult malignancies and non-malignant fetal adrenal
neuroblasts (57). This
upregulation correlates with an unfavorable prognosis in patients
with neuroblastoma (58,59). BIRC5 is a key regulator of
mitosis and programmed cell death or apoptosis (60) and the smallest member of the family
of inhibitor-of-apoptosis proteins (IAPs) (61,62).
Thus, it is an ideal target for killing tumor cells specifically,
while sparing healthy normal cells. We found BIRC5 to be
highly affiliated with HMGA1, MYC and MYCN in
the AURKA/B pathways, which may be critical interactions
that fuel IMR-32 cell proliferation and malignancy. In addition,
STRING network analysis identified interactions between
BIRC5 and IL3 [a stimulator of STATs and
AKT pathways (63)] and
HIF-1α [an angiogenic driver in oxygen-deprived solid tumors
(64) previously reported to
protect neuroblastoma cells from hypoxia-induced apoptosis
(63)]. The common denominator
here is MYC, our validated targets affiliated either
directly or indirectly (for example via MYCN) with
MYC. Moreover, the intricate network between MYC,
MYCN, AURKA/B and NCAM1, and our targets
L1-CAM, HMGA1, BIRC5 and FABP5 links
them to highly proliferative, angiogenic and metastatic tumorigenic
pathways.
The transcriptional KD of all our proteins
significantly inhibited the proliferation of IMR-32 cells and FABP5
and MYCN KD inhibited early apoptosis, while FABP5 or HMGA1 KD
inhibited cellular migration. The double-target transcriptional KD
did not yield an additive effect on cell proliferation compared to
single-target KD, implying that these proteins may signal through
redundant proliferative pathways. In fact, HMGA1 and MYCN have been
found to co-interact and HMGA1 was identified as a direct MYCN
transcriptional regulator (46),
which would explain the lack of an additive effect with combined,
siRNA transcriptional KD of both targets, compared to single-target
KD in our cells. Others have demonstrated the interplay between
L1-CAM and EGFR in promoting cancer proliferation via ERK
activation (65). ERK is a protein
downstream of EGFR, platelet-derived growth factor receptor (PDGFR)
and vascular endothelial growth factor (VEGFR) signaling, which are
receptor tyrosine kinases that our validated proteins may signal
through. For example, the FABP5-PPARγ-VEGF signaling transduction
axis has been reported to be the pivotal tumorigenic pathway in
prostate cancer progression and malignancy (54). Furthermore, L1-CAM (66), HMGA1 (67) and MYCN (68), have all been reported to inhibit
p53, thereby affecting cellular proliferation; in addition, L1-CAM
(69), FABP5 (54) and MYCN all signal through the mTOR
pathway via PI3K/AKT activation, and this may therefor explain the
lack of an additive effect between single-target versus
double-target KD on cell proliferation.
The fact that FABP5 and MYCN KD were able to
induce early apoptosis of our IMR-32 cells at 48 h
post-transfection implies that these proteins are crucial for
cellular survival and thus early apoptotic rates were observed 48 h
following their transcriptional KD. In support of our findings,
Kawaguchi et al demonstrated the interaction of FABP5
with SP-1 and c-MYC (both determined by IPA to be upregulated in
the IMR-32 compared to SK-N-SH cells) to enhance cellular
proliferation in cancer cells and the anti-proliferative effects of
FABP5, SP1 or c-MYC silencing in prostate cancer
cells (70). We have previously
demonstrated the interplay between MYCN and L1-CAM in
conferring the radioresistance of IMR-32 cells (25) and L1-CAM has been previously
reported to sustain ERK, FAK and PAK
phosphorylation in apoptosis-resistant ovarian cancers, whereas its
transcriptional KD sensitized ovarian carcinoma cells to apoptotic
stimuli (71). We speculate that
the interplay between L1-CAM, FABP5 and MYCN
in this aggressive neuroblastoma cell line may be driving its
malignant, apoptosis-resistant behavior. Of note, a recent study
demonstrated the efficacy and safety of using the CE7 monoclonal
antibody to target L1-CAM in a (CAR)-redirected T-cell
mediated immuno-therapy for children with neuroblastoma (72), which has shown promise in providing
both in vitro and in vivo antitumor activity in
primary, metastatic and recurrent neuroblastoma.
Our proteins validated by western blot analysis
mapped to highly tumorigenic, activated upstream regulators which
may help explain the aggressive nature of these malignant
MYCN-amplified cells. Seeing all these tumorigenic players
highly expressed in the IMR-32 neuroblastoma cells and of
particular interest, their mapping to the activated upstream
regulator, MYCN is quite intriguing and highlights the
possible mechanisms responsible for the aggressive, malignant
nature of these cells. For instance, ISNR, SP1,
SREBF1, IL3 and HIF-1α, which enhance tumor
cell survival under stress-hypoxic conditions that favor
proliferative processes and angiogenesis, may function as strong
'accomplices' of the main 'culprit', MYCN, in driving the
malignant, tumorigenic behaviors of the IMR-32 cell line. In
addition, AURKA/B with its strong interaction with
HMGA1, BIRC5, MYC and MYCN, as well as
the strong interaction between L1-CAM and the migratory and
angiogenic players, including EGFR, RANBP1,
NCAM1 and NRP1, may further be fueling the malignant
propensity of the MYCN-amplified IMR-32 cells and the
high-risk childhood neuroblastomas.
In conclusion, neuroblastoma that presents at
diagnosis with high-risk disease is extremely difficult to cure and
long-term survival is rarely documented. It is of utmost importance
to target the highly malignant, treatment evasive form of this
disease with multi-modality therapeutic approaches. As demonstrated
in the present study, the MYCN-amplified IMR-32 cells
express highly tumorigenic proteins that belong to pathways that
govern metastasis, invasion and migration of cancer cells; cancer
stem cell propagation and maintenance; cancer angiogenesis,
proliferation and evasion of apoptosis. In addition, our
observation that the transcriptional KD of one target
simultaneously downregulated another tumorigenic target indicates
that an important network of interplay exists between highly
tumorigenic proteins in these malignant cancer cells.
To the best of our knowledge, we are the first to
illustrate the molecular crosstalk between these tumorigenic
proteins and their affiliation with highly tumorigenic pathways in
the MYCN-amplified IMR-32 neuroblastoma cells. Future studies are
warranted to explore these interactions and to elucidate the exact
mechanisms of this crosstalk, both at the cellular level and in
pre-clinical models. Multi-modality targeted therapy against
several non-redundant tumorigenic pathways may cripple this
devastating disease and hinder malignant recurrence that almost
always resists therapy, leading to mortality in affected
children.
Abbreviations:
|
APP
|
amyloid precursor protein
|
|
ANK1 and ANK2
|
Ankyrin 1 and 2
|
|
AURKA/B
|
Aurora kinase A and B
|
|
BIRC
|
baculoviral IAP repeat containing 5
(survivin)
|
|
CDK1
|
cyclin-dependent kinase 1
|
|
CDCA8
|
cell division cycle associated 8
|
|
CNTN2
|
contactin 2
|
|
EGFR
|
epidermal growth factor receptor
|
|
E2F1
|
E2F transcription factor 1
|
|
EZR
|
Ezrin
|
|
FABP5
|
fatty-acid binding protein 5
|
|
HIF-1α
|
hypoxiainducible factor-1α
|
|
HMGA1
|
high mobility group protein A1
|
|
IL3
|
interleukin 3
|
|
IPA
|
Ingenuity Pathway Analysis
|
|
KITLG
|
KIT ligand
|
|
L1-CAM
|
L1-cell adhesion molecule
|
|
MYCN
|
MYCN proto-oncogene, bHLH
transcription factor
|
|
NCAM1
|
neural cell adhesion molecule 1
|
|
NCAN
|
neurocan
|
|
NRP1
|
neuropilin-1
|
|
RANBP9
|
RAN binding protein 9
|
|
RDX
|
radixin
|
|
SP1
|
Sp1 transcription factor
|
|
SREBF1 or 2
|
sterol regulatory element binding
transcription factor 1 or 2
|
Acknowledgments
This study was supported in part by the Sheik Zayed
Institute for Pediatric Surgical Innovation and the Michael Sandler
Cancer Research Fund and by grants from the National Center for
Scientific Research in Lebanon (grant no. CNRS632). In addition,
partial funding in support of this study was provided by the
Lebanese American University School of Pharmacy Faculty Research
and Development Award, as well as the University of Balamand,
Department of Biology, Faculty Research funds. The authors would
like to thank Dr Kristy Brown, former Assistant Professor at the
Children's national Medical Center, Center for Genetic Medicine
Research (Washington, DC, USA) and currently Principle Scientist at
Solid Biosciences (Cambridge, MA, USA) for her assistance with the
SILAC proteomics analysis. The authors would also like to thank Mr.
Samer Bazzi, Research Assistant at the Faculty of Medicine,
University of Balamand, for conducting the apoptosis assays and
analysis using flow cytometry.
Notes
[1] Competing
interests
The authors declare that they have no competing
interests.
References
|
1
|
Louis CU and Shohet JM: Neuroblastoma:
Molecular pathogenesis and therapy. Annu Rev Med. 66:49–63. 2015.
View Article : Google Scholar :
|
|
2
|
Smith MA, Seibel L, Altekruse SF, Ries LA,
Melbert DL, O'Leary M, Smith FO and Reaman GH: Outcomes for
children and adolescents with cancer: Challenges for the
twenty-first century. J Clin Oncol. 28:2625–2634. 2010. View Article : Google Scholar : PubMed/NCBI
|
|
3
|
Maris JM, Hogarty MD, Bagatell R and Cohn
SL: Neuroblastoma. Lancet. 369:2106–2120. 2007. View Article : Google Scholar : PubMed/NCBI
|
|
4
|
Pinto NR, Applebaum MA, Volchenboum SL,
Matthay KK, London WB, Ambros PF, Nakagawara A, Berthold F,
Schleiermacher G, Park JR, et al: Advances in risk classification
and treatment strategies for neuroblastoma. J Clin Oncol.
33:3008–3017. 2015. View Article : Google Scholar : PubMed/NCBI
|
|
5
|
Chevrier L, Meunier AC, Cochaud S, Muller
JM and Chadéneau C: Vasoactive intestinal peptide decreases MYCN
expression and synergizes with retinoic acid in a human
MYCN-amplified neuroblastoma cell line. Int J Oncol. 33:1081–1089.
2008.PubMed/NCBI
|
|
6
|
Matthay KK, Villablanca JG, Seeger RC,
Stram DO, Harris RE, Ramsay NK, Swift P, Shimada H, Black CT,
Brodeur GM, et al: Children's Cancer Group: Treatment of high-risk
neuroblastoma with intensive chemotherapy, radiotherapy, autologous
bone marrow transplantation, and 13-cis-retinoic acid. N Engl J
Med. 341:1165–1173. 1999. View Article : Google Scholar : PubMed/NCBI
|
|
7
|
Stafman LL and Beierle EA: Cell
proliferation in neuroblastoma. Cancers (Basel). 8:E132016.
View Article : Google Scholar
|
|
8
|
Nicolai S, Pieraccioli M, Peschiaroli A,
Melino G and Raschellà G: Neuroblastoma: Oncogenic mechanisms and
therapeutic exploitation of necroptosis. Cell Death Dis.
6:e20102015. View Article : Google Scholar : PubMed/NCBI
|
|
9
|
Suita S, Tajiri T, Kaneko M, Hirai M,
Mugishima H, Sugimoto T and Tsuchida Y: Implications of MYCN
amplification in patients with stage 4 neuroblastoma who undergo
intensive chemotherapy. J Pediatr Surg. 42:489–493. 2007.
View Article : Google Scholar : PubMed/NCBI
|
|
10
|
Brodeur GM: Brodeur. Nat Rev Cancer.
3:203–216. 2003. View Article : Google Scholar : PubMed/NCBI
|
|
11
|
Goldsmith KC and Hogarty MD: Targeting
programmed cell death pathways with experimental therapeutics:
Opportunities in high-risk neuroblastoma. Cancer Lett. 228:133–141.
2005. View Article : Google Scholar : PubMed/NCBI
|
|
12
|
Kang JH, Rychahou PG, Ishola TA, Qiao J,
Evers BM and Chung DH: MYCN silencing induces differentiation and
apoptosis in human neuroblastoma cells. Biochem Biophys Res Commun.
351:192–197. 2006. View Article : Google Scholar : PubMed/NCBI
|
|
13
|
Ong SE, Blagoev B, Kratchmarova I,
Kristensen DB, Steen H, Pandey A and Mann M: Stable isotope
labeling by amino acids in cell culture, SILAC, as a simple and
accurate approach to expression proteomics. Mol Cell Proteomics.
1:376–386. 2002. View Article : Google Scholar : PubMed/NCBI
|
|
14
|
Jensen ON, Wilm M, Shevchenko A and Mann
M: Sample preparation methods for mass spectrometric peptide
mapping directly from 2-DE gels. Methods Mol Biol. 112:513–530.
1999.PubMed/NCBI
|
|
15
|
Formolo CA, Williams R, Gordish-Dressman
H, MacDonald TJ, Lee NH and Hathout Y: Secretome signature of
invasive glioblastoma multiforme. J Proteome Res. 10:3149–3159.
2011. View Article : Google Scholar : PubMed/NCBI
|
|
16
|
Chen EY, Tan CM, Kou Y, Duan Q, Wang Z,
Meirelles GV, Clark NR and Ma'ayan A: Enrichr: Interactive and
collaborative HTML5 gene list enrichment analysis tool. BMC
Bioinformatics. 14:1282013. View Article : Google Scholar : PubMed/NCBI
|
|
17
|
Kuleshov MV, Jones MR, Rouillard AD,
Fernandez NF, Duan Q, Wang Z, Koplev S, Jenkins SL, Jagodnik KM,
Lachmann A, et al: Enrichr: A comprehensive gene set enrichment
analysis web server 2016 update. Nucleic Acids Res. 44:W90–7. 2016.
View Article : Google Scholar : PubMed/NCBI
|
|
18
|
Abouantoun TJ, Castellino RC and MacDonald
TJ: Sunitinib induces PTEN expression and inhibits PDGFR signaling
and migration of medulloblastoma cells. J Neurooncol. 101:215–226.
2011. View Article : Google Scholar
|
|
19
|
Bayin NS, Frenster JD, Sen R, Si S, Modrek
AS, Galifianakis N, Dolgalev I, Ortenzi V, Illa-Bochaca I, Khahera
A, et al: Notch signaling regulates metabolic heterogeneity in
glioblastoma stem cells. Oncotarget. 8:64932–64953. 2017.
View Article : Google Scholar : PubMed/NCBI
|
|
20
|
Gonzalez-Villasana V, Fuentes-Mattei E,
Ivan C, Dalton HJ, Rodriguez-Aguayo C, Fernandez-de Thomas RJ,
Aslan B, Del C, Monroig P, Velazquez-Torres G, Previs RA, et al:
Rac1/Pak1/38/MMP-2 axis regulates angiogenesis in ovarian cancer.
Clin Cancer Res. 21:2127–2137. 2015. View Article : Google Scholar : PubMed/NCBI
|
|
21
|
Fan Y, Gan Y, Shen Y, Cai X, Song Y, Zhao
F, Yao M, Gu J and Tu H: Leptin signaling enhances cell invasion
and promotes the metastasis of human pancreatic cancer via
increasing MMP-P13 production. Oncotarget. 6:16120–16134. 2015.
View Article : Google Scholar : PubMed/NCBI
|
|
22
|
Li Y, Zhang J, He J, Zhou W, Xiang G and
Xu R: MicroRNA-132 cause apoptosis of glioma cells through blockade
of the SREBP-1c metabolic pathway related to SIRT1. Biomed
Pharmacother. 78:177–184. 2016. View Article : Google Scholar : PubMed/NCBI
|
|
23
|
Bao JM, He MY, Liu YW, Lu YJ, Hong YQ, Luo
HH, Ren ZL, Zhao SC and Jiang Y: AGE/RAGE/Akt pathway contributes
to prostate cancer cell proliferation by promoting Rb
phosphorylation and degradation. Am J Cancer Res. 5:1741–1750.
2015.PubMed/NCBI
|
|
24
|
Wang J, Qi Q, Feng Z, Zhang X, Huang B,
Chen A, Prestegarden L, Li X and Wang J: Berberine induces
autophagy in glioblastoma by targeting the AMPK/mTOR/ULK1-pathway.
Oncotarget. 7:66944–66958. 2016.PubMed/NCBI
|
|
25
|
Rached J, Nasr Z, Abdallah J and
Abou-Antoun T: L1-CAM knock-down radiosensitizes neuroblastoma
IMR-32 cells by simultaneously decreasing MycN, but increasing PTEN
protein expression. Int J Oncol. 49:1722–1730. 2016. View Article : Google Scholar : PubMed/NCBI
|
|
26
|
Fabian J, Opitz D, Althoff K, Lodrini M,
Hero B, Volland R, Beckers A, de Preter K, Decock A, Patil N, et
al: MYCN and HDAC5 transcriptionally repress CD9 to trigger
invasion and metastasis in neuroblastoma. Oncotarget.
7:66344–66359. 2016. View Article : Google Scholar : PubMed/NCBI
|
|
27
|
Gangoda L, Keerthikumar S, Fonseka P,
Edgington LE, Ang CS, Ozcitti C, Bogyo M, Parker BS and Mathivanan
S: Inhibition of cathepsin proteases attenuates migration and
sensitizes aggressive N-Myc amplified human neuroblastoma cells to
doxorubicin. Oncotarget. 6:11175–11190. 2015. View Article : Google Scholar : PubMed/NCBI
|
|
28
|
Preis PN, Saya H, Nádasdi L, Hochhaus G,
Levin V and Sadée W: Neuronal cell differentiation of human
neuroblastoma cells by retinoic acid plus herbimycin A. Cancer Res.
48:6530–6534. 1988.PubMed/NCBI
|
|
29
|
Schwab M, Alitalo K, Klempnauer KH, Varmus
HE, Bishop JM, Gilbert F, Brodeur G, Goldstein M and Trent J:
Amplified DNA with limited homology to myc cellular oncogene is
shared by human neuroblastoma cell lines and a neuroblastoma tumor.
Nature. 305:245–248. 1983. View Article : Google Scholar : PubMed/NCBI
|
|
30
|
Wang T, Zhang Z, Wang K, Wang J, Jiang Y,
Xia J, Gou L, Liu M, Zhou L, He T, et al: Inhibitory effects of
BMP9 on breast cancer cells by regulating their interaction with
pre-adipocytes/adipocytes. Oncotarget. 8:35890–35901.
2017.PubMed/NCBI
|
|
31
|
Segerström L, Baryawno N, Sveinbjörnsson
B, Wickström M, Elfman L, Kogner P and Johnsen JI: Effects of small
molecule inhibitors of PI3K/Akt/mTOR signaling on neuroblastoma
growth in vitro and in vivo. Int J Cancer. 129:2958–2965. 2011.
View Article : Google Scholar : PubMed/NCBI
|
|
32
|
Bäckman U and Christofferson R: The
selective class III/V receptor tyrosine kinase inhibitor SU11657
inhibits tumor growth and angiogenesis in experimental
neuroblastomas grown in mice. Pediatr Res. 57:690–695. 2005.
View Article : Google Scholar : PubMed/NCBI
|
|
33
|
Rawnaq T, Quaas A, Zander H, Gros SJ,
Reichelt U, Blessmann M, Wilzcak W, Schachner M, Sauter G, Izbicki
JR, et al: L1 is highly expressed in tumors of the nervous system:
A study of over 8000 human tissues. J Surg Res. 173:314–319. 2012.
View Article : Google Scholar
|
|
34
|
Gavert N, Ben-Shmuel A, Raveh S and
Ben-Ze'ev A: L1-CAM in cancerous tissues. Expert Opin Biol Ther.
8:1749–1757. 2008. View Article : Google Scholar : PubMed/NCBI
|
|
35
|
Raveh S, Gavert N and Ben-Ze'ev A: L1 cell
adhesion molecule (L1CAM) in invasive tumors. Cancer Lett.
282:137–145. 2009. View Article : Google Scholar : PubMed/NCBI
|
|
36
|
Ben-Arie A, Huszar M, Ben-Zvi N, Smirnov
A, Altevogt P and Fogel M: The role of L1-CAM immunohistochemial
staining in the diagnosis of abdominal-pelvic cancer of uncertain
primary site in women. Eur J Surg Oncol. 34:795–799. 2008.
View Article : Google Scholar
|
|
37
|
Bao S, Wu Q, Li Z, Sathornsumetee S, Wang
H, McLendon RE, Hjelmeland AB and Rich JN: Targeting cancer stem
cells through L1CAM suppresses glioma growth. Cancer Res.
68:6043–6048. 2008. View Article : Google Scholar : PubMed/NCBI
|
|
38
|
Cheng L, Wu Q, Huang Z, Guryanova OA,
Huang Q, Shou W, Rich JN and Bao S: L1CAM regulates DNA damage
checkpoint response of glioblastoma stem cells through NBS1. EMBO
J. 30:800–813. 2011. View Article : Google Scholar : PubMed/NCBI
|
|
39
|
Zhao WJ and Schachner M: Neuregulin 1
enhances cell adhesion molecule L1 expression in human glioma cells
and promotes their migration as a function of malignancy. J
Neuropathol Exp Neurol. 72:244–255. 2013. View Article : Google Scholar : PubMed/NCBI
|
|
40
|
Zhao W: Zhao. Oncol Lett. 4:812–816. 2012.
View Article : Google Scholar : PubMed/NCBI
|
|
41
|
Ackermann MA, Petrosino JM, Manring HR,
Wright P, Shettigar V, Kilic A, Janssen PML, Ziolo MT and Accornero
F: TGF-β1 affects cell-cell adhesion in the heart in an
NCAM1-dependent mechanism. J Mol Cell Cardiol. 112:49–57. 2017.
View Article : Google Scholar : PubMed/NCBI
|
|
42
|
Grosschedl R, Giese K and Pagel J: HMG
domain proteins: Architectural elements in the assembly of
nucleoprotein structures. Trends Genet. 10:94–100. 1994. View Article : Google Scholar : PubMed/NCBI
|
|
43
|
Tallini G and Dal Cin P: HMGI(Y) and
HMGI-C dysregulation: A common occurrence in human tumors. Adv Anat
Pathol. 6:237–246. 1999. View Article : Google Scholar : PubMed/NCBI
|
|
44
|
Chiappetta G, Tallini G, De Biasio MC,
Manfioletti G, Martinez-Tello FJ, Pentimalli F, de Nigris F, Mastro
A, Botti G, Fedele M, et al: Detection of high mobility group I
HMGI(Y) protein in the diagnosis of thyroid tumors: HMGI(Y)
expression represents a potential diagnostic indicator of
carcinoma. Cancer Res. 58:4193–4198. 1998.PubMed/NCBI
|
|
45
|
Abe N, Watanabe T, Sugiyama M, Uchimura H,
Chiappetta G, Fusco A and Atomi Y: Determination of high mobility
group I(Y) expression level in colorectal neoplasias: A potential
diagnostic marker. Cancer Res. 59:1169–1174. 1999.PubMed/NCBI
|
|
46
|
Giannini G, Cerignoli F, Mellone M,
Massimi I, Ambrosi C, Rinaldi C, Dominici C, Frati L, Screpanti I
and Gulino A: High mobility group A1 is a molecular target for MYCN
in human neuroblastoma. Cancer Res. 65:8308–8316. 2005. View Article : Google Scholar : PubMed/NCBI
|
|
47
|
Ru P, Hu P, Geng F, Mo X, Cheng C, Yoo JY,
Cheng X, Wu X, Guo JY, et al: Feedback loop regulation of
SCAP/SREBP-1 by miR-29 modulates EGFR signaling-driven glioblastoma
growth. Cell Reports. 16:1527–1535. 2016. View Article : Google Scholar : PubMed/NCBI
|
|
48
|
Guo D: SCAP links glucose to lipid
metabolism in cancer cells. Mol Cell Oncol. 3:e11321202016.
View Article : Google Scholar : PubMed/NCBI
|
|
49
|
Mohlin S, Hamidian A, von Stedingk K,
Bridges E, Wigerup C, Bexell D and Påhlman S: PI3K-mTORC2 but not
PI3K-mTORC1 regulates transcription of HIF2A/EPAS1 and
vascularization in neuroblastoma. Cancer Res. 75:4617–4628. 2015.
View Article : Google Scholar : PubMed/NCBI
|
|
50
|
Hanes R, Grad I, Lorenz S, Stratford EW,
Munthe E, Reddy CC, Meza-Zepeda LA and Myklebost O: Preclinical
evaluation of potential therapeutic targets in dedifferentiated
liposarcoma. Oncotarget. 7:54583–54595. 2016. View Article : Google Scholar : PubMed/NCBI
|
|
51
|
Poynter JN, Hooten AJ, Frazier AL and Ross
JA: Associations between variants in KITLG, SPRY4, BAK1, and DMRT1
and pediatric germ cell tumors. Genes Chromosomes Cancer.
51:266–271. 2012. View Article : Google Scholar
|
|
52
|
Jiao DC, Lu ZD, Qiao JH, Yan M, Cui SD and
Liu ZZ: Expression of CDCA8 correlates closely with FOXM1 in breast
cancer: public microarray data analysis and immunohistochemical
study. Neoplasma. 62:464–469. 2015. View Article : Google Scholar : PubMed/NCBI
|
|
53
|
Gohard FH, St-Cyr DJ, Tyers M and Earnshaw
WC: Targeting the INCENP IN-box-Aurora B interaction to inhibit CPC
activity in vivo. Open Biol. 4:1401632014. View Article : Google Scholar : PubMed/NCBI
|
|
54
|
Chamcheu JC, Chaves-Rodriquez MI, Adhami
VM, Siddiqui IA, Wood GS, Longley BJ and Mukhtar H: Upregulation of
PI3K/AKT/mTOR, FABP5 and PPARβ/δ in human psoriasis and
imiquimod-induced murine psoriasiform dermatitis model. Acta Derm
Venereol. 96:854–856. 2016.PubMed/NCBI
|
|
55
|
Connolly RM, Nguyen NK and Sukumar S:
Molecular pathways: Current role and future directions of the
retinoic acid pathway in cancer prevention and treatment. Clin
Cancer Res. 19:1651–1659. 2013. View Article : Google Scholar : PubMed/NCBI
|
|
56
|
Al-Jameel W, Gou X, Forootan SS, Al Fayi
MS, Rudland PS, Forootan FS, Zhang J, Cornford PA, Hussain SA and
Ke Y: Inhibitor SBFI26 suppresses the malignant progression of
castration-resistant PC3-M cells by competitively binding to
oncogenic FABP5. Oncotarget. 8:31041–31056. 2017. View Article : Google Scholar : PubMed/NCBI
|
|
57
|
Althoff K, Lindner S, Odersky A, Mestdagh
P, Beckers A, Karczewski S, Molenaar JJ, Bohrer A, Knauer S,
Speleman F, et al: miR-542 3p exerts tumor suppressive functions in
neuroblastoma by downregulating Survivin. Int J Cancer.
136:1308–1320. 2015. View Article : Google Scholar
|
|
58
|
Islam A, Kageyama H, Takada N, Kawamoto T,
Takayasu H, Isogai E, Ohira M, Hashizume K, Kobayashi H, Kaneko Y,
et al: High expression of Survivin, mapped to 17q25, is
significantly associated with poor prognostic factors and promotes
cell survival in human neuroblastoma. Oncogene. 19:617–623. 2000.
View Article : Google Scholar : PubMed/NCBI
|
|
59
|
Azuhata T, Scott D, Griffith TS, Miller M
and Sandler AD: Survivin inhibits apoptosis induced by TRAIL, and
the ratio between survivin and TRAIL receptors is predictive of
recurrent disease in neuroblastoma. J Pediatr Surg. 41:1431–1440.
2006. View Article : Google Scholar : PubMed/NCBI
|
|
60
|
Mita AC, Mita MM, Nawrocki ST and Giles
FJ: Survivin: Key regulator of mitosis and apoptosis and novel
target for cancer therapeutics. Clin Cancer Res. 14:5000–5005.
2008. View Article : Google Scholar : PubMed/NCBI
|
|
61
|
Adida C, Berrebi D, Peuchmaur M,
Reyes-Mugica M and Altieri DC: Anti-apoptosis gene, survivin, and
prognosis of neuroblastoma. Lancet. 351:882–883. 1998. View Article : Google Scholar : PubMed/NCBI
|
|
62
|
Hossain MM, Banik L and Ray SK: Survivin
knockdown increased anti-cancer effects of
(-)-epigallocatechin-3-gallate in human malignant neuroblastoma
SK-N-BE2 and SH-SY5Y cells. Exp Cell Res. 318:1597–1610. 2012.
View Article : Google Scholar : PubMed/NCBI
|
|
63
|
Han L, Jorgensen JL, Brooks C, Shi C,
Zhang Q, Nogueras González GM, Cavazos A, Pan R, Mu H, Wang SA, et
al: Antileukemia efficacy and mechanisms of action of SL-101, a
novel anti-CD123 antibody conjugate, in acute myeloid leukemia.
Clin Cancer Res. 23:3385–3395. 2017. View Article : Google Scholar : PubMed/NCBI
|
|
64
|
Yin CP, Guan SH, Zhang B, Wang XX and Yue
SW: Upregulation of HIF-1α protects neuroblastoma cells from
hypoxia-induced apoptosis in a RhoA-dependent manner. Mol Med Rep.
12:7123–7131. 2015. View Article : Google Scholar : PubMed/NCBI
|
|
65
|
Yoon H, Min JK, Lee DG, Kim DG, Koh SS and
Hong HJ: L1 cell adhesion molecule and epidermal growth factor
receptor activation confer cisplatin resistance in intrahepatic
cholangiocarcinoma cells. Cancer Lett. 316:70–76. 2012. View Article : Google Scholar
|
|
66
|
Wang Y and Schachner M: The intracellular
domain of L1CAM binds to casein kinase 2α and is neuroprotective
via inhibition of the tumor suppressors PTEN and p53. J Neurochem.
133:828–843. 2015. View Article : Google Scholar : PubMed/NCBI
|
|
67
|
Puca F, Colamaio M, Federico A, Gemei M,
Tosti N, Bastos AU, Del Vecchio L, Pece S, Battista S and Fusco A:
HMGA1 silencing restores normal stem cell characteristics in colon
cancer stem cells by increasing p53 levels. Oncotarget.
5:3234–3245. 2014. View Article : Google Scholar : PubMed/NCBI
|
|
68
|
Mazar J, Rosado A, Shelley J, Marchica J
and Westmoreland TJ: The long non-coding RNA GAS5 differentially
regulates cell cycle arrest and apoptosis through activation of
BRCA1 and p53 in human neuroblastoma. Oncotarget. 8:6589–6607.
2017. View Article : Google Scholar :
|
|
69
|
Doberstein K, Pfeilschifter J and Gutwein
P: The transcription factor AX2 regulates ADAM10 expression in
renal cell carcinoma. Carcinogenesis. 32:1713–1723. 2011.
View Article : Google Scholar : PubMed/NCBI
|
|
70
|
Kawaguchi K, Kinameri A, Suzuki S, Senga
S, Ke Y and Fujii H: The cancer-promoting gene fatty acid-binding
protein 5 (FABP5) is epigenetically regulated during human prostate
carcinogenesis. Biochem J. 473:449–461. 2016. View Article : Google Scholar
|
|
71
|
Stoeck A, Gast D, Sanderson MP, Issa Y,
Gutwein P and Altevogt P: L1-CAM in a membrane-bound or soluble
form augments protection from apoptosis in ovarian carcinoma cells.
Gynecol Oncol. 104:461–469. 2007. View Article : Google Scholar
|
|
72
|
Künkele A, Taraseviciute A, Finn LS,
Johnson AJ, Berger C, Finney O, Chang CA, Rolczynski LS, Brown C,
Mgebroff S, et al: Preclinical assessment of CD171-directed CAR
T-cell adoptive therapy for childhood neuroblastoma: CE7 epitope
target safety and product manufacturing feasibility. Clin Cancer
Res. 23:466–477. 2017. View Article : Google Scholar
|