Introduction
Thyroid carcinoma is the most common endocrine
malignancy. In 2008, ~212,000 new cases were diagnosed worldwide
(1). Thyroid carcinomas are
classified into three major morphological well-differentiated
types: papillary thyroid carcinoma (PTC), follicular thyroid
carcinoma (FTC) and medullary thyroid carcinoma (MTC) with overall
good prognosis (2). In contrast,
poorly differentiated thyroid carcinoma (PDTC) and undifferentiated
anaplastic thyroid carcinoma (ATC) carry a poor prognosis (2). PTC, FTC, PDTC and ATC are believed to
originate from follicular cells, whereas MTC is believed to be
derived from calcitonin-producing parafollicular cells (also called
C-cells). Multiple endocrine neoplasia type 2A (MEN2A) and 2B
(MEN2B) are caused by germ-line mutations in the proto-oncogene
rearranged during transfection (RET) and are also
associated with an increased incidence of MTC (3). The most common RET mutations
in MEN2A and MEN2B are C634R and M918T, respectively (4) (hereafter the correspondingly mutated
receptors are referred to as RET2A and RET2B, respectively).
Twenty-five to 30% of MTC cases are associated with heritable
RET mutations (5). In
sporadic MTC, somatic RET mutations, typically the M918T
mutation, are present in ~50% of cases (3). In PTC, genomic rearrangements
involving RET and different partner genes are common,
especially in radiation-induced cases (reviewed in ref. 5). Thus, the incidence of RET
rearrangements in PTC ranges from 87%, in a series of early cases
from the Chornobyl nuclear accident (6), to 20 and 7%, in two recent series of
sporadic cases (3,7,8). In
most cases, thyroid carcinomas are localized to the thyroid gland
and the treatment used for these patients includes surgery,
radiation therapy and radioiodine therapy. For patients with
metastatic disease, however, the treatment options are limited.
The human leucine-rich repeats and
immunoglobulin-like domains (LRIG) gene family includes three
genes: LRIG1, LRIG2 and LRIG3 (9–11).
Increasing evidence indicates that LRIG1 functions as a
tumor suppressor (reviewed in refs. 12 and 13) and the high expression of the LRIG1
mRNA or protein are associated with an increased survival in breast
cancer (14), ovarian cancer
(15), uterine cervical cancer
(16), cutaneous squamous cell
carcinoma (17), nasopharyngeal
and oropharyngeal cancer (18,19),
non-small cell lung cancer (20),
and hepatocellular carcinoma (21). Molecular studies have shown that
LRIG1 negatively regulates wild-type tyrosine kinase receptors of
the epidermal growth factor receptor (EGFR) family (22–25),
hepatocyte growth factor receptor (MET) (26), RET (27), platelet-derived growth factor
receptor α (PDGFRA) (28), and
neurotrophic tyrosine kinase receptor type 2 (NTRK2, also known as
TRKB) (29). However, it is not
known whether the MEN2- and thyroid cancer-associated mutant RET
receptors, RET2A and RET2B, are also LRIG1 targets.
The aim of the present study was to investigate the
possible role of LRIG1 in thyroid carcinoma. We investigated
whether LRIG1 regulates RET2A and RET2B at the molecular level,
analyzed the expression and possible prognostic value of LRIG1 in
three human thyroid carcinoma cohorts, and investigated the role of
Lrig1 in a transgenic RET2B-driven mouse MTC model.
Materials and methods
Cell culture, plasmids and
transfections
COS-7 cells (ATCC, Manassas, VA, USA) were grown in
Dulbecco's modified Eagle's medium supplemented with 10% fetal
bovine serum, as previously described (29). The cells were transiently
transfected with polyethylenimine-PEI (Polysciences, Inc.,
Warrington, PA, USA). Plasmid cDNA encoding full-length,
Flag-tagged LRIG1 has been described previously (30). The expression vector encoding RET2A
(C634R) was previously described (31). The cDNA expression vector encoding
RET2B (M918T) was kindly provided by Dr M. Santoro at University
Federico II (Naples, Italy) (32).
Immunoprecipitations and western
blotting
The cells were lysed at 4°C in TNE-buffer (50 mM
Tris pH 7.5, 150 mM NaCl and 2 mM EDTA) supplemented with 0.5%
Triton X-100, 1% octyl-β-glucoside, phosphatase inhibitors (50 mM
NaF, 2 mM Na3VO4), and complete EDTA-free
protease inhibitors (Roche). Cell lysates were clarified by
centrifugation and analyzed by immunoprecipitation and western
blotting using previously described methodologies (27). Ligand-independent RET
phosphorylation was examined at 48 h after transfection in COS-7
cells expressing RET2A or RET2B constructs together with either an
empty vector or Flag-LRIG1. The blots were scanned in a Storm 845
PhosphorImager and quantifications were conducted with ImageQuant
software (both from GE Healthcare Life Sciences, Capital Federal,
Argentina). The antibodies used were anti-phosphotyrosine (p-Tyr,
clone PY99, catalogue no. SC7020) at a 1:10,000 dilution, anti-Ret
(goat antibodies C20 and T20, catalogue no. SC-1290) (both from
Santa Cruz Biotechnology, Santa Cruz, CA, USA) at a 1:1,000
dilution, and anti-Flag M2 mouse monoclonal antibody (catalogue no.
F1804; Sigma-Aldrich, St. Louis, MO, USA) at a 1:1,500
dilution.
Patient cohorts
Three different patient cohorts were investigated.
The first cohort (Cohort1-TCGA) comprised the thyroid carcinoma
cases available at The Cancer Genome Atlas (TCGA), which included
502 PTC and 58 normal thyroid gland tissues (http://cancergenome.nih.gov/; December 15, 2016). The
RNAseq count data and patient survival data were downloaded from
TCGA (http://cancergenome.nih.gov/;
December 15, 2016). The samples were upper quartile normalized FPKM
(UQ-FPKM) and the samples were log-transformed to follow a normal
distribution.
The second cohort (Cohort2-MTC) has been described
previously (33) and included 39
MTC patient samples and 12 normal tissue controls collected with
informed consent and local ethical approval at the Karolinska
University Hospital. The clinical data, survival and mutation
status of the RET and RAS genes were as reported in a
previous study (33).
The third cohort (Cohort3-TMA) was collected with
the aim of including all patients diagnosed with thyroid carcinoma
in the county of Dalarna, Sweden, between the years 1980 and 2008.
The study was approved by the Regional Ethics Review Board in
Uppsala (dnr 2010/351), and the Swedish Cancer Registry was used to
identify the patients. Only patients who provided written informed
consent were included in the study. Paraformaldehyde-fixed and
paraffin-embedded tissues were retrieved from hospital archives and
used to assemble a tissue microarray (TMA). The diagnostic groups
PTC, FTC, MTC, PDTC and ATC were represented, and FTCs with or
without oncocytic features (so called Hurthle cell or oxyphilic)
were separately studied. All patients gave written informed consent
prior to their inclusion in the study. The clinical data were
collected from patient files, including histology, TNM stage, time
to relapse, and date and cause of death.
RNA extraction and quantitative real-time
RT-PCR
The RNA from Cohort2-MTC, which had been prepared
previously (33), was treated with
TURBO DNA-free kit (Life Technologies) according to the
manufacturer's instructions. Human LRIG1 and the reference
gene RN18S were analyzed in triplicate samples of 20 ng
total RNA through quantitative reverse transcription (RT)
polymerase chain reaction (PCR), essentially as previously
described (9). However, in
contrast to what was previously described (9), qScript 1-Step qRT-PCR Kit (Quanta
Biosciences, Gaithersburg, MD, USA) and a Bio-Rad CFX96 apparatus
(Bio-Rad Laboratories AB) were used. The RN18S-normalized
LRIG1 levels were divided by the corresponding level in the
QPCR Human Reference Total RNA (Agilent Technologies, Santa Clara,
CA, USA). Thus, the normalized LRIG1 level in the reference
RNA was set to the value of 1.
Antibodies and evaluation of
immunohistochemistry
Immunohistochemistry (IHC) was performed for
Cohort3-TMA. IHC was performed on 4-µm TMA sections using
the LRIG1-151 antibody (18,30)
at a dilution of 1:50. The antibody against human LRIG1 has been
previously described. The intensity and proportion of positive
cells were evaluated by an experienced pathologist (M.T.), who had
previously performed a similar evaluation using the same
semi-quantitative evaluation scale in another material (18). Briefly, the intensity was evaluated
as absent (0), weak (1+), intermediate (2+),
or strong (3+), and the fraction of positive cells were
evaluated and scored as 0%, 1–25%, 26–50%, 51–75% or 76–100%
positive cells.
Animal experiments
All mice were housed and maintained, and all
experiments were performed in accordance with the European
Communities Council Directive (86/609/EEC). The experimental
protocols were approved by the Regional Ethics Committee of Umeå
University in Umeå, Sweden (registration nos. A80-08 and A81-11).
The animals were housed under controlled conditions with a 12-h
day/night cycle and fed water and standard chow pellets (cat. no.
801730; Special Diets Services, NOVA-SCB Sweden, Sollentuna,
Sweden) ad libitum. The Lrig1-deficient allele has
been described previously (34)
and was bred onto a pure C57BL/6J genetic background for five
generations. Heterozygous Lrig1 mice were crossed with a
transgenic mouse strain that ectopically expresses the human
RET2B oncogene under the human calcitonin promoter
and develop MTC at a high frequency (35,36).
The RET2B mice were of a mixed genetic background
(C57BL/6J:DBA2, 1:1). The mouse genotypes were determined using
tail DNA, PCR, and standard molecular biology techniques. The PCR
primers that were used for the Lrig1 wild-type were:
5′-GCGAGCGTGTGTTGTGGAGAGGAT-3′ and
5′-CGATTGTCTGGTGATCAGGAGACTGC-3′, those used for the
Lrig1 knockout were:
5′-ACCTCAGGGAGCGAGCGCTCTTATGGGTTAGGACG-3′ and
5′-CCCGTGATATTGCTGAAGAGCTTGGCGGCGAATGG-3′, and those used
for the RET2B were: 5′-TGGAGACCCAAGACATCAAC-3′
and 5′-GGAGAAGAGGACAGCGGCT-3′. The PCR products (405
bp for the Lrig1 wild-type; 1,060 bp for the Lrig1
knockout; and 220 bp for the RET2B) were separated and
visualized using analytical agarose gel electrophoresis.
The plasma calcitonin levels of the mice were
measured every third month according to the methodology as
previously described (36). Plasma
calcitonin is an established marker of MTC and increased levels of
it are usually detectable long before general signs of the disease.
At 2 years of age or at signs of the disease, the mice were
sacrificed and their thyroid glands were dissected, fixed in 4%
phosphate-buffered formaldehyde, embedded in paraffin, and stained
with routine hematoxylin and eosin staining.
Statistical analyses
To analyze differential gene expression, the tumor
samples were compared with normal samples using a Student's t-test
in Cohort1-TCGA and a Mann-Whitney U test in Cohort2-MTC.
Associations between ordinal variables were tested using the
Wilcoxon rank sum test, χ2 test, one-way analysis of
variance (ANOVA) not assuming equal variances, or Fisher's exact
test, where appropriate. For survival analysis, the tumor samples
were divided into two groups of high and low LRIG1, with the
median as the cut-off, and the cumulative survival was then
analyzed in the two groups and compared using the log-rank test.
Survival was assessed in a Kaplan-Meier graph and a log-rank test
was used for comparing different groups. Progression-free survival
(PFS, the end-point date of relapse, censoring at the date of the
last follow-up), disease-specific survival (DSS, the end-point date
of death when thyroid cancer was specified as the cause of death,
censoring at the date of the last follow-up), and overall survival
(OS, the end-point date of death from any cause, censoring at the
date of the last follow-up) were all addressed. The groups that
were investigated included the expression of LRIG1, as well as
other known prognostic factors, including clinical stage and age.
All of the significance testing was performed at the 0.05 level and
only two-sided P-values were presented.
Results
Interactions between LRIG1 and mutant
RET2A and RET2B proteins
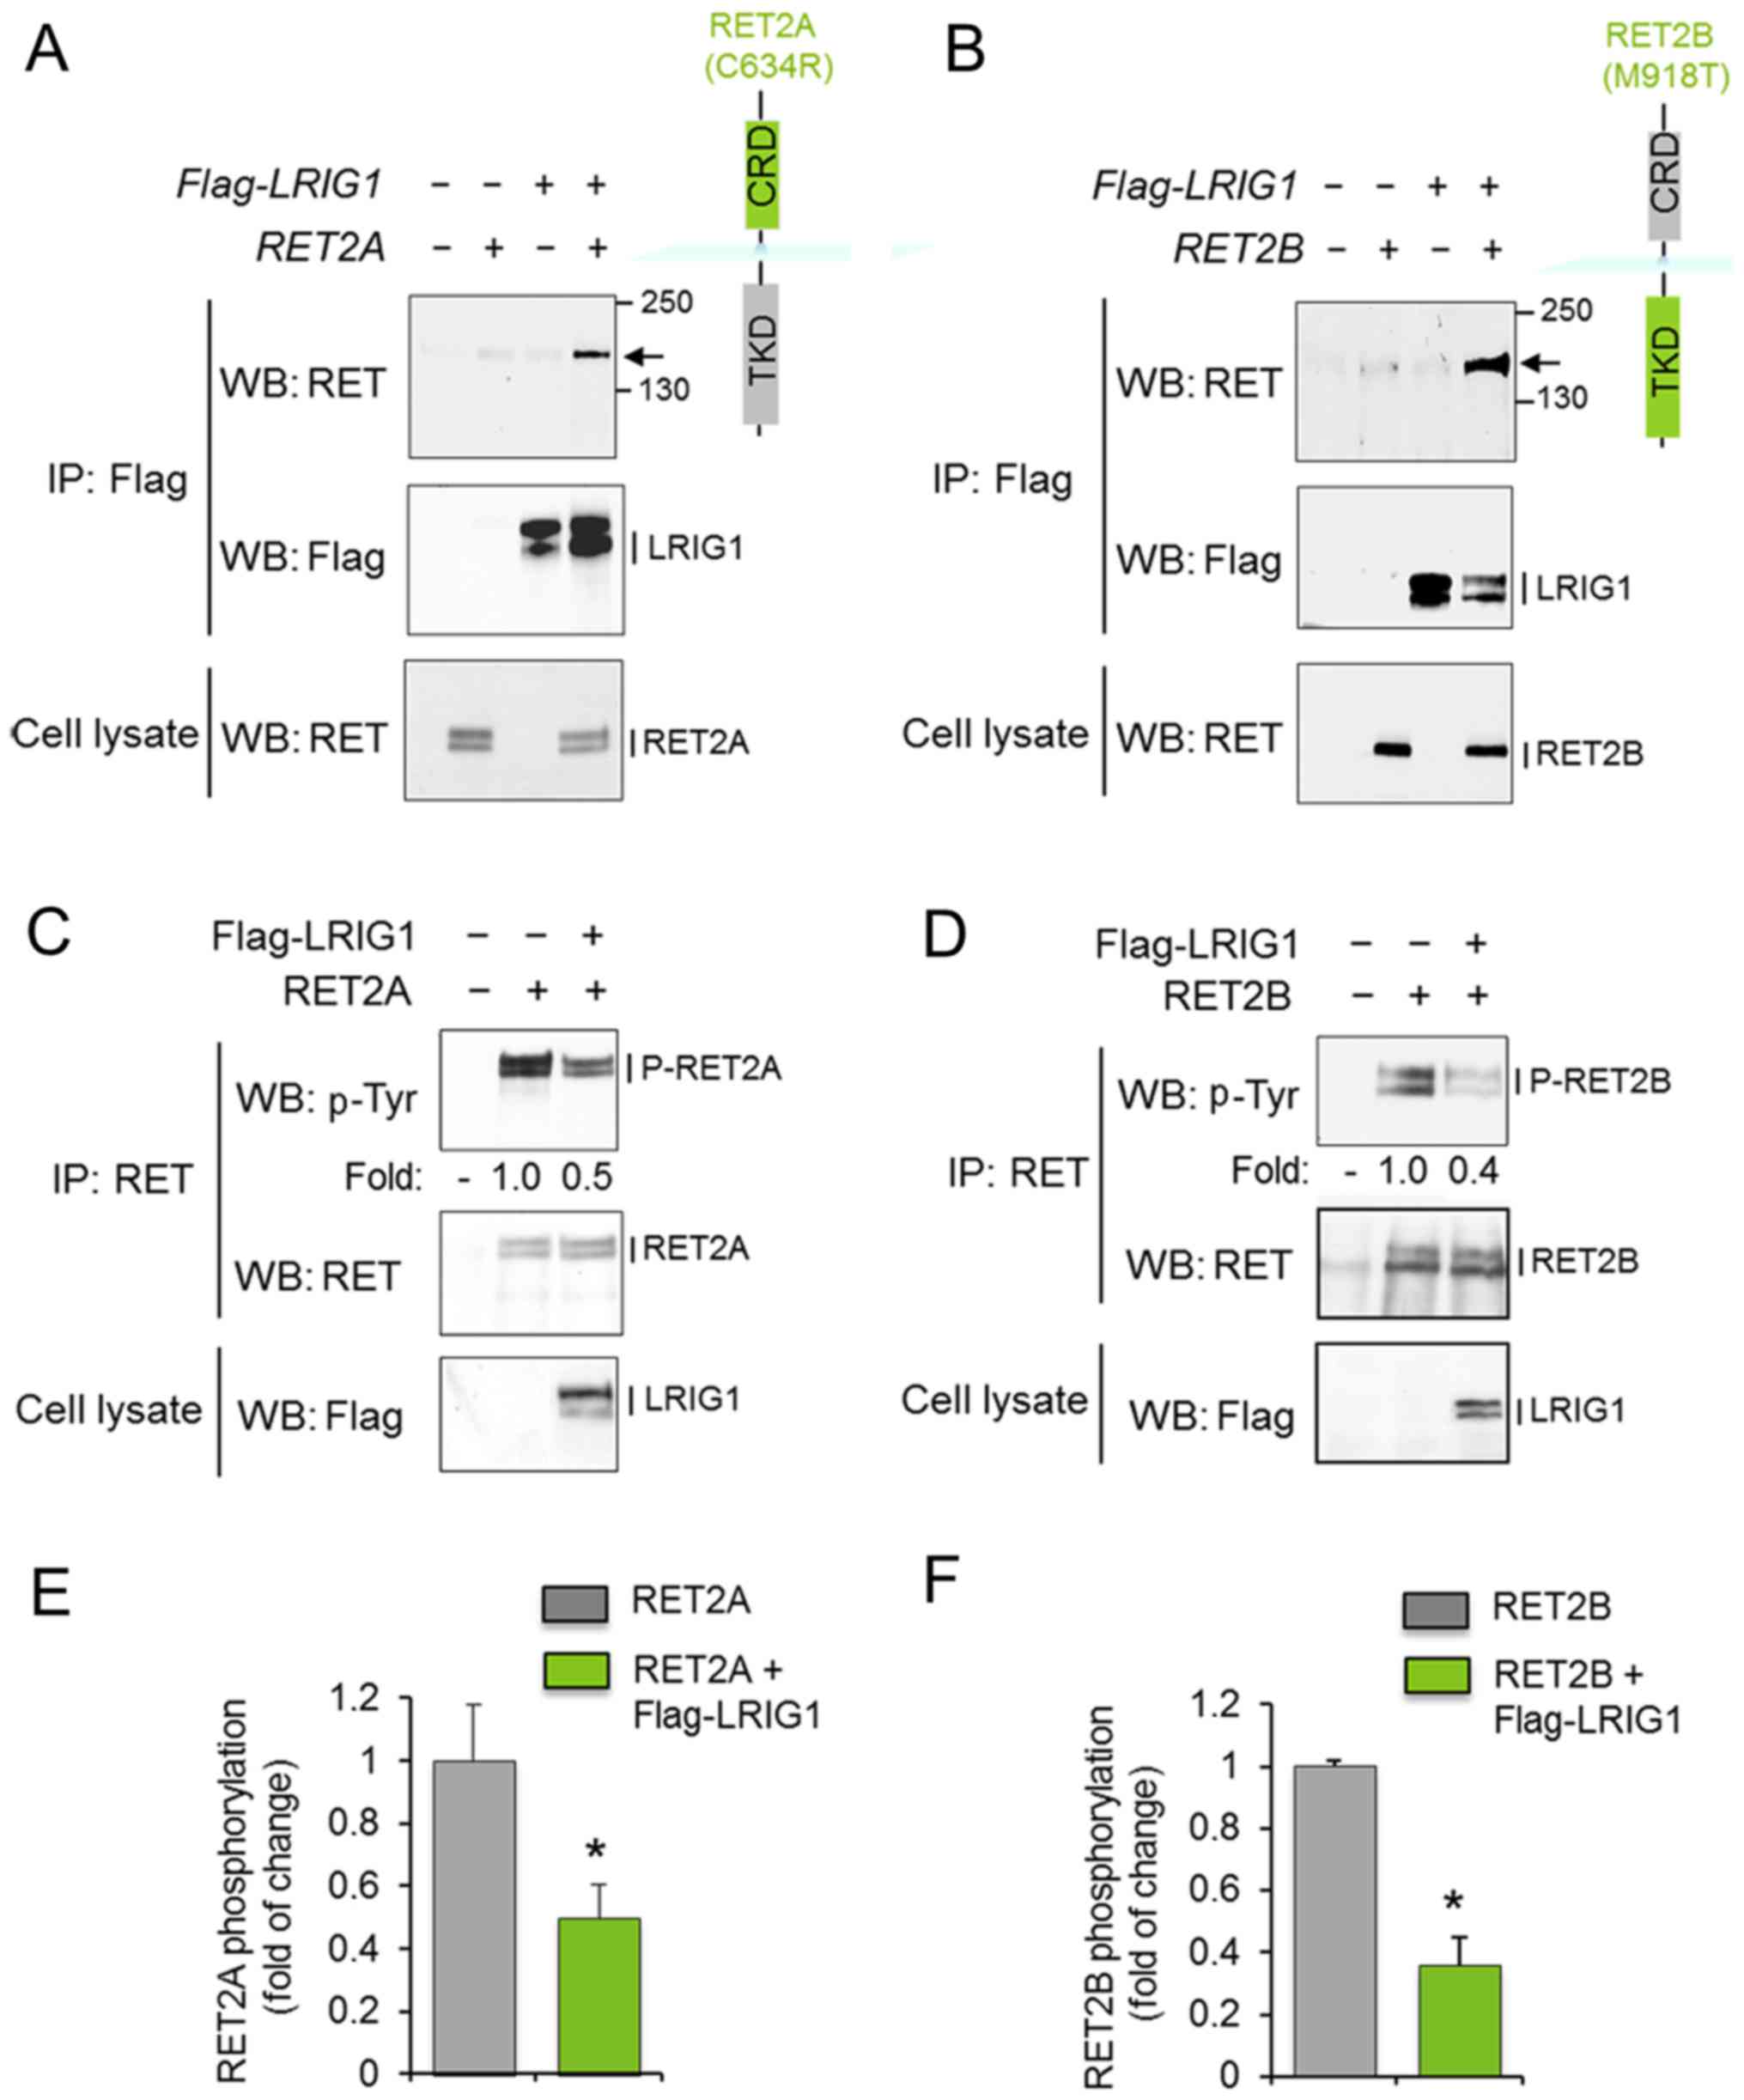
To investigate whether LRIG1 interacts with and
regulates the oncogenic RET2A and RET2B receptors, COS-7 cells were
co-transfected with LRIG1 and the respective RET
variant. After 48 h, cell lysates were prepared and subjected to
immunoprecipitation and western blot analysis. LRIG1 physically
interacted with both RET2A and RET2B, as shown by the
co-immunoprecipitation of LRIG1 and the RET2A and RET2B proteins
(Fig. 1A and B). Furthermore,
LRIG1 co-expression induced the downregulation of the
phosphorylation levels of RET2A and RET2B without significantly
affecting the corresponding total protein levels (Fig. 1C–F). Thus, LRIG1 physically
interacted with and inhibited the activation of both RET2A and
RET2B.
LRIG1 gene and protein expression levels
and comparison to clinical features
To investigate the importance of LRIG1 expression in
thyroid cancer, we i) analyzed the PTC expression data available at
TCGA (Cohort1-TCGA), ii) performed quantitative RT-PCR analysis of
a series of MTC samples (Cohort2-MTC), and iii) analyzed a thyroid
cancer TMA (Cohort3-TMA) through immunohistochemistry.
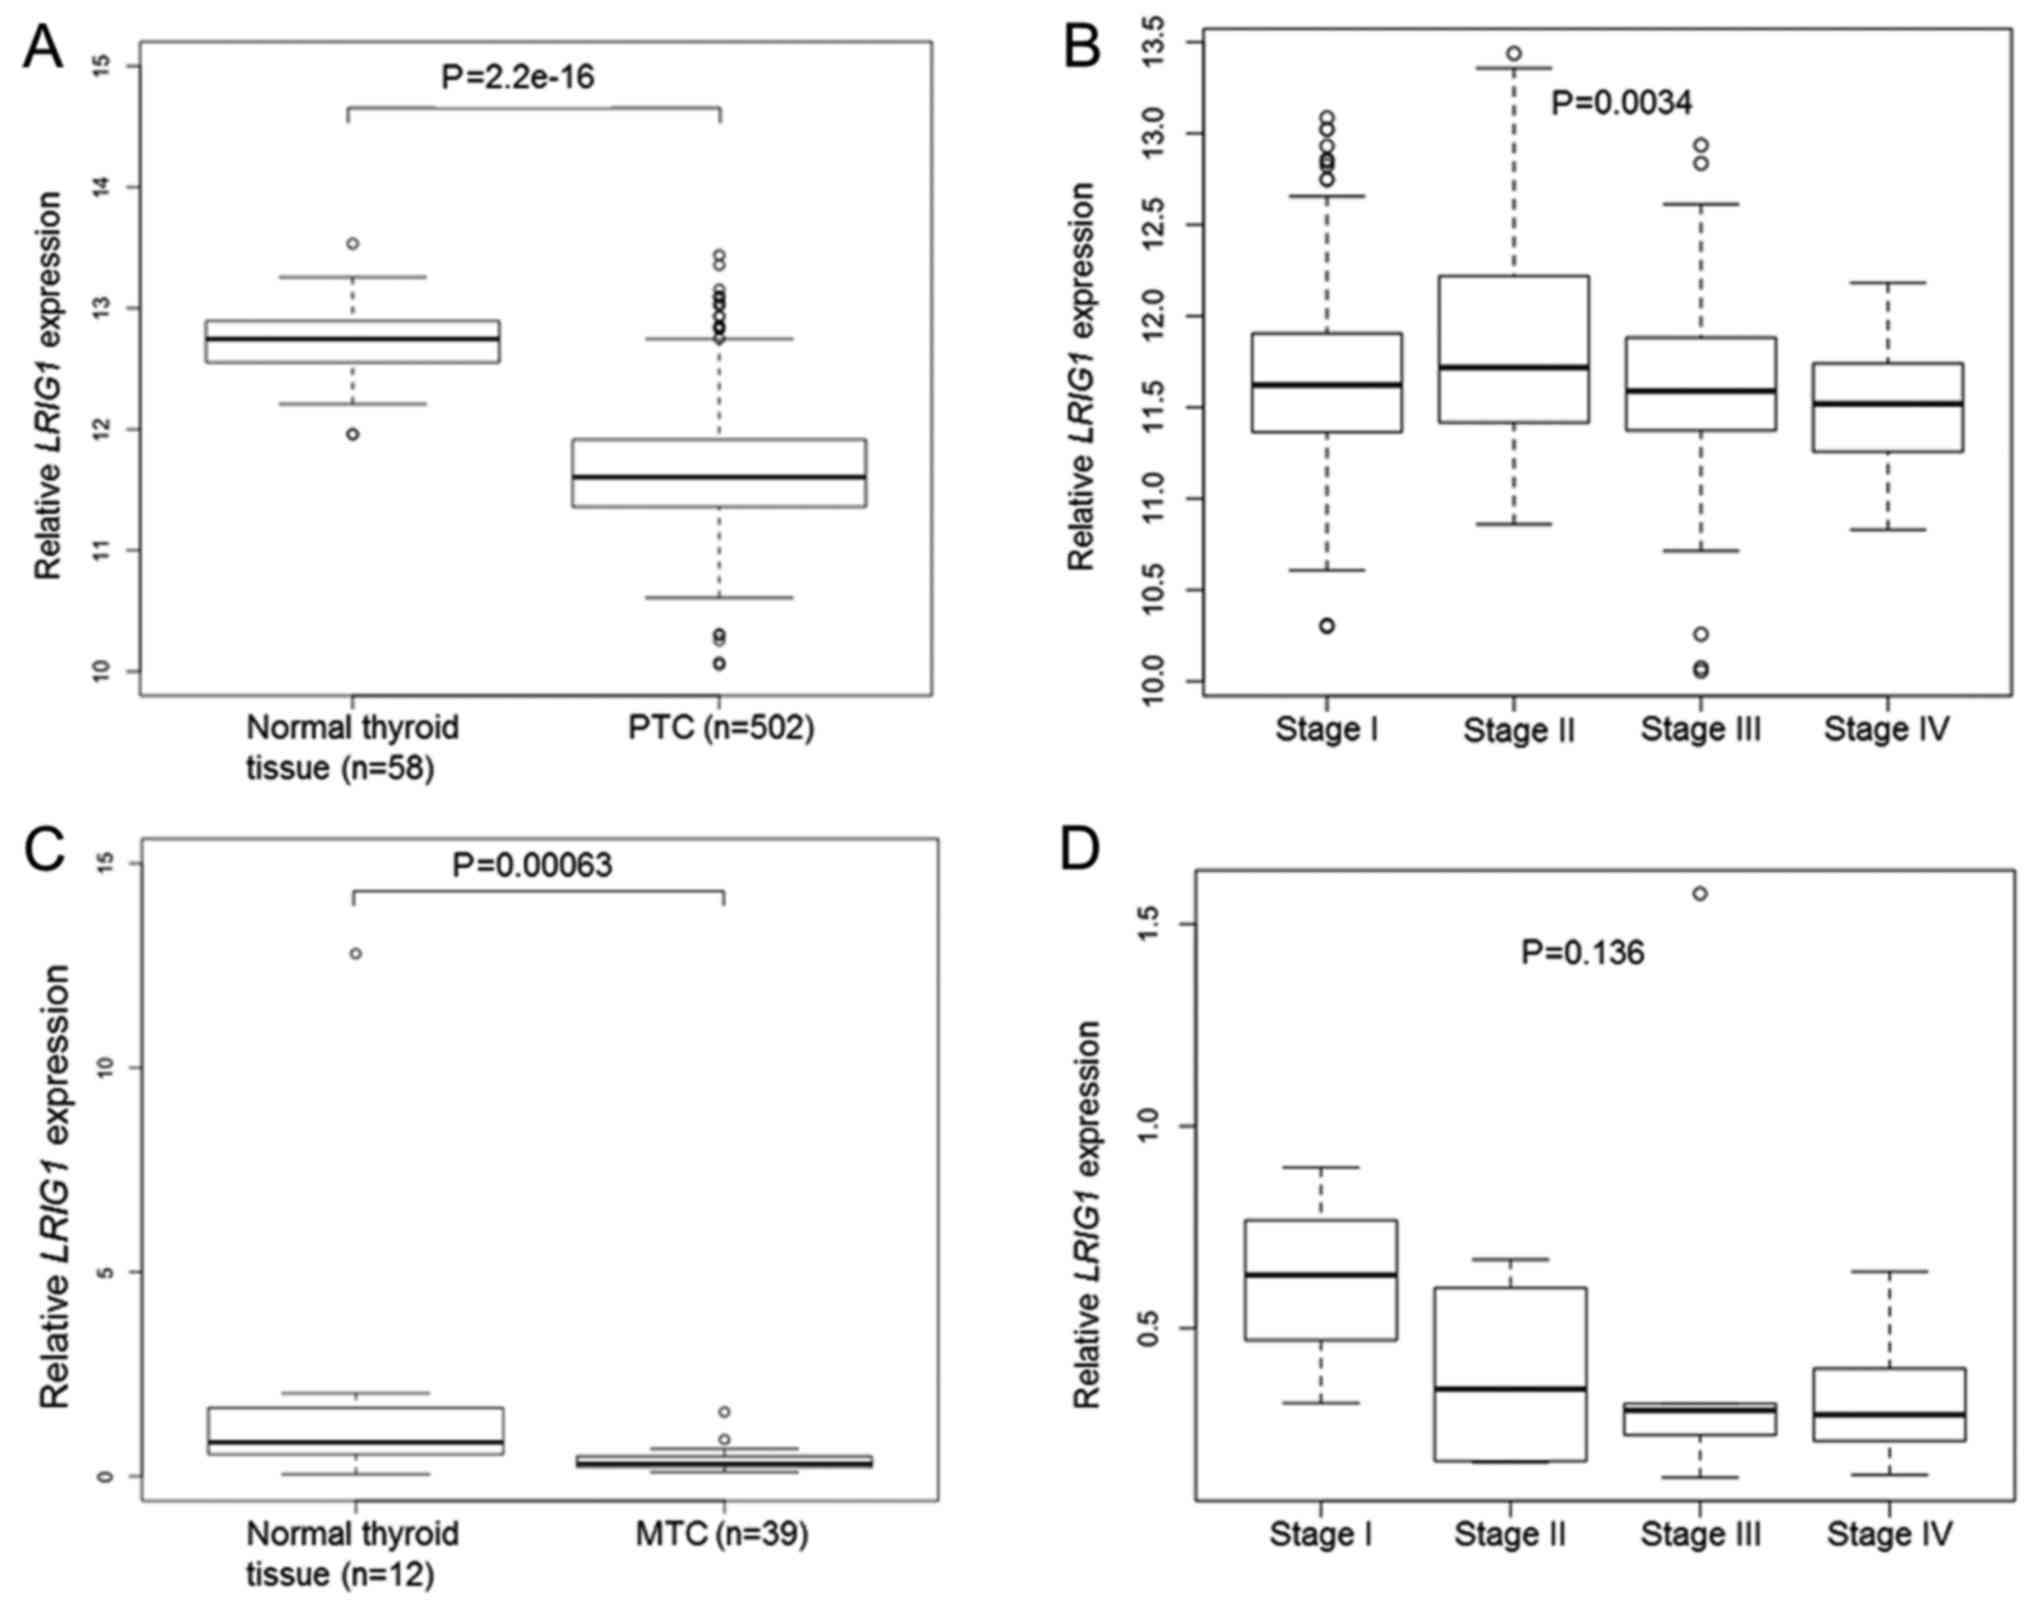
Cohort1-TCGA contained data from 502 PTC samples and
58 normal thyroid gland samples. In this material, the mean
LRIG1 expression level was lower in PTC than in the normal
thyroid gland (P=2.2×10⁻¹⁶, Student's t-test) (Fig. 2A). There was a significant
association between a higher PTC clinical stage and lower
LRIG1 expression (P=0.0034, one-way ANOVA) (Fig. 2B). There was no significant
association between the OS of patients and the LRIG1 expression
level in the TCGA data set (high versus low LRIG1 expression level,
median used as cut-off; P=0.435, log-rank test).
In Cohort2-MTC, the relative LRIG1 mRNA
levels were analyzed in 39 MTC and 12 normal thyroid glands through
quantitative RT-PCR. Twenty-two of the 39 (56%) MTC cases were
RET mutated, whereas six (15%) showed either HRAS or
KRAS mutations (33). The
intragroup variability of LRIG1 expression was relatively
high, as evidenced from the sample standard deviations from the
means that were 179 and 70% for the normal and MTC samples,
respectively. Nevertheless, the relative LRIG1 expression
level was significantly lower in MTC than in normal thyroid gland
(0.38, SD ±0.27 vs. 1.94, SD ±3.47; P=0.00063, Mann-Whitney U test)
(Fig. 2C). Both the RET
mutated and RET wild-type cases showed significantly lower
LRIG1 levels than the normal thyroid glands (0.41, SD ±0.33
and 0.34, SD ±0.15, respectively vs. 1.94, SD ±3.47; P=0.0036 and
P=0.0016, respectively). There was a statistically insignificant
association between a higher MTC clinical stage and lower
LRIG1 expression (P=0.136, Kruskal-Wallis test) (Fig. 2D). There was no significant
difference in LRIG1 levels between the RET-mutated,
RAS-mutated, or other MTCs.
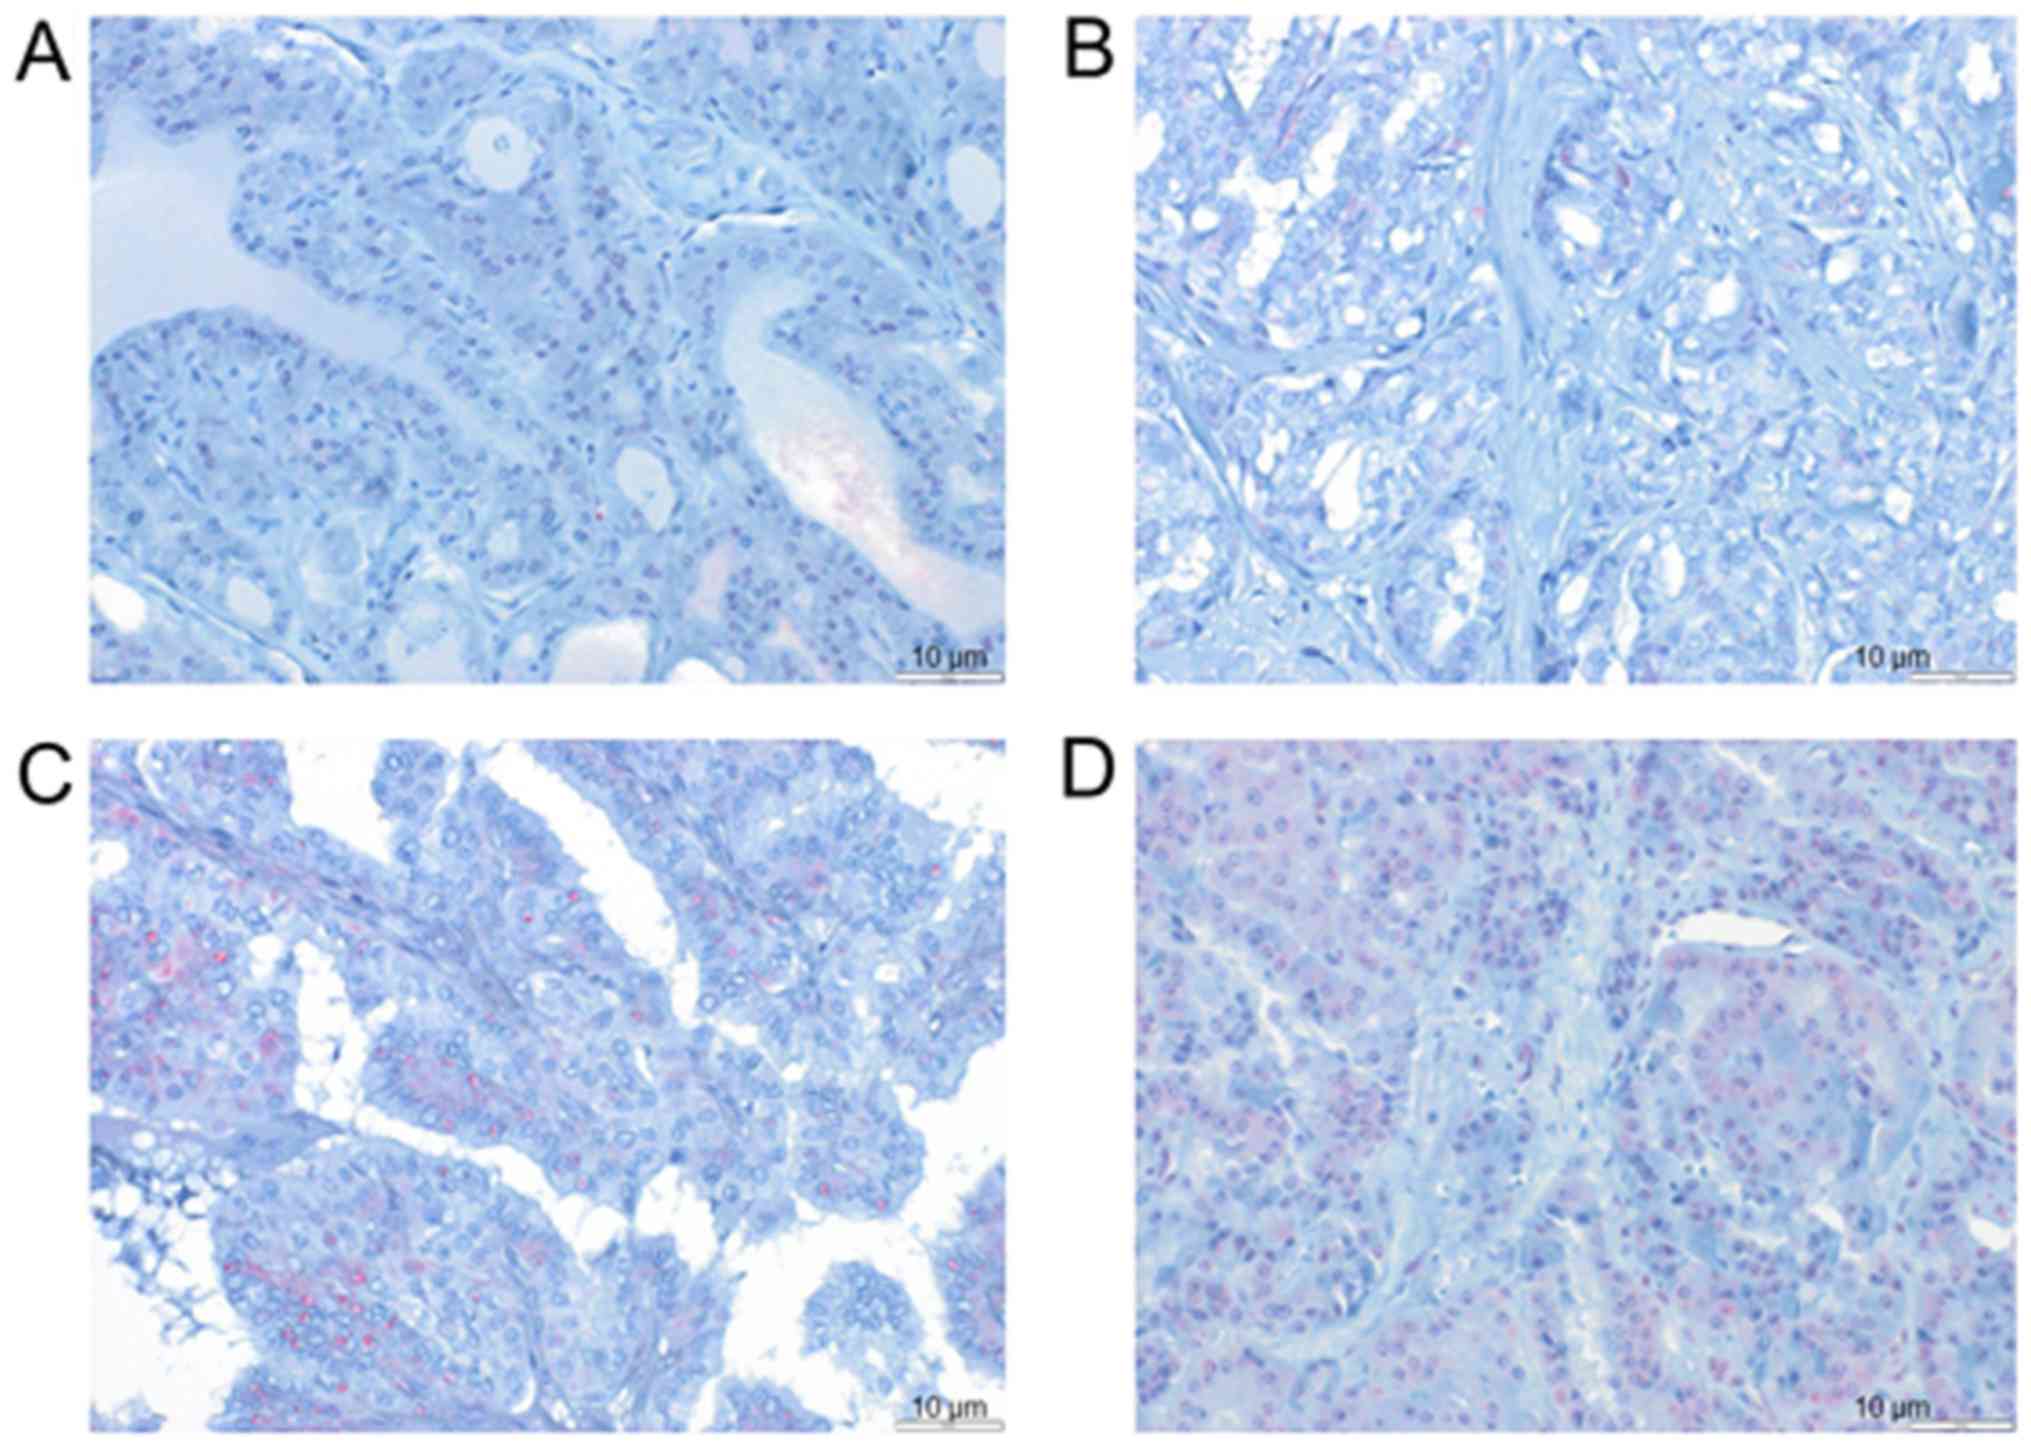
Cohort3-TMA was analyzed by immunohistochemistry
(IHC) using a TMA with 118 thyroid carcinomas (Table I). In this cohort, 125 patients
gave informed consent to participate (Table I) and it was possible to perform
IHC on samples from 118 patients, whereas for 7 patients, it was
not possible to perform this analysis because of the limited amount
of available tissue. Examples of cases with different LRIG1
staining intensities and proportions of positive cells are shown in
Fig. 3. Detailed data on the
clinical parameters and results of IHC for Cohort3-TMA are
presented in Table I. The possible
associations between LRIG1 immunoreactivity (proportion of positive
cells or intensity of staining) and histology, clinical stage, age,
sex, and clinical outcome were investigated. A significant
difference was found when histology was compared with the
percentage of LRIG1-positive cells (P=0.026, χ2 test)
and intensity of LRIG1 staining (P=0.033, χ2 test). This
showed that the distribution of LRIG1 immunoreactivities
(percentage or intensity) was different between the different
histological groups. However, because of the small sample sizes, it
was not possible to draw firm conclusions about the distributions
within individual groups. Both the fraction of LRIG1-positive cells
and the intensity of LRIG1 staining were associated with whether
the patients were dead or alive at the latest follow-up (P=0.036
and P=0.007, respectively, χ2 test). The patients who
died during the follow-up period were older at the time of
diagnosis than those still alive (P<0.001, Mann-Whitney U test),
but the age distribution was similar across all categories for the
fraction of LRIG1-positive cells and all of the intensities (P=0.15
and P=0.12, respectively, Kruskal-Wallis test). No other
significant associations were found between LRIG1 immunoreactivity
and the clinical parameters. The same analyses were performed
including only PTC and FTC, since these entities have a more
favorable clinical course. Both the percentage of positive cells
and intensity of staining were still associated with whether the
patients were dead or alive at the latest follow-up (P=0.014 and
P=0.002, respectively, χ2 test). The median follow-up
time was 86 months for PFS, 96 months for DSS, and 96 months for
OS. Survival analyses were performed for clinical stage, the
percentage of LRIG1-positive cells and the intensity of LRIG1
staining. As expected, the clinical stage was a strong prognostic
factor for OS, DSS and PFS, both when comparing all of the stages
and when comparing stages I and II with stages III and IV (data not
shown). No significant associations were found between LRIG1
immunoreactivity and the cumulative survival rates in Cohort3-TMA,
both when analysing the whole cohort as well as when analysing PTC
only (n=72). Performing additional sub-group analysis for smaller
groups was not relevant due to the limited size of each group.
 | Table IClinical features of the patients in
Cohort3-TMA. |
Table I
Clinical features of the patients in
Cohort3-TMA.
| Clinical
features | No. of cases |
|---|
| TNM stage | |
| I | 53 |
| II | 11 |
| III | 27 |
| IV | 27 |
| Histology | |
| PTC | 72 |
| FTC | 18 |
| MTC | 5 |
| ATC | 8 |
| PDTC | 4 |
| FTC-oncocytic
type | 12 |
| Deceased | |
| Yes | 65 |
| No | 60 |
| Deceased due to
thyroid cancer | |
| Yes | 25 |
| No | 100 |
| Relapse | |
| Yes | 37 |
| No | 88 |
| Intensity of LRIG1
staining | |
| Absent | 28 |
| Weak | 72 |
| Moderate | 18 |
| Intense | 0 |
| Percentage of
LRIG1-positive cells | |
| None | 28 |
| 1–25% | 18 |
| 26–50% | 17 |
| 51–75% | 25 |
| 76–100% | 30 |
| Sex | |
| Male | 40 |
| Female | 85 |
Animal experiments
To experimentally address the role of LRIG1 in
mutated RET-driven MTC, a mouse strain carrying a deficient
Lrig1 allele was crossed with a transgenic mouse strain that
expresses human RET2B in thyroid parafollicular cells (C-cells) and
is known to develop MTC or C-cell hyperplasia within 2-years and at
high frequencies (13 and 77%, respectively) (34,35).
The resulting offspring that were heterozygous for both the
Lrig1 and the RET2B alleles were crossed with
heterozygous Lrig1 mice to yield Lrig1 wild-type,
heterozygous, or knockout mice with or without the RET2B
transgene (Fig. 4A). Only mice
that were positive for the RET2B transgene were included in
the study. In total, 125 mice were included, of which 46 (37%) were
Lrig1 wild-type, 49 (39%) were Lrig1 heterozygous,
and 30 (24%) were Lrig1-deficient. The mice were followed up
for up to 2 years. Blood samples were obtained and calcitonin
levels were measured every third month beginning at 6 months of
age. Surprisingly, the plasma calcitonin levels were below the
detection limit of the assay in all of the samples that were
analyzed, except for four samples, which were calcitonin positive
and represented three different mice. Of the three mice with
elevated calcitonin levels, one was Lrig1 wild-type and two
were heterozygous for the Lrig1 allele. Eleven of the 46
wild-type mice (24%), 8 of the 49 heterozygous mice (16%), and 7 of
the 30 knockout mice (23%) died prematurely, that is, before the
planned termination at 24 months. For most of the prematurely dead
mice, the cause of death was undetermined; therefore, they were
excluded from further analysis. At 24 months of age, the remaining
mice were sacrificed and their thyroid glands were collected,
formaldehyde-fixed, paraffin embedded, sectioned and routinely
stained. Pre-invasive lesions were found in 13 of the 35 wild-type
glands (37%), 12 of the 41 heterozygous glands (29%), and in 11 of
the 23 Lrig1-deficient glands (48%) (Fig. 4B). The remaining 63 thyroid glands
showed no evidence of pathological changes. The difference in the
incidence of pre-invasive lesions between the wild-type and
Lrig1-deficient mice was not statistically significant
(P=0.42, χ2 test). Furthermore, no overt cancers were
observed.
Discussion
In this study, the importance of LRIG1 in thyroid
cancer was investigated. We showed that LRIG1 physically interacted
with and inhibited the activation of the MEN-associated and thyroid
cancer-associated mutant RET receptors RET2A and RET2B and was
downregulated in human PTC and MTC compared to normal thyroid gland
tissues. However, in our mouse model of RET2B-driven MTC, no
significant effect of Lrig1 gene ablation was observed.
The interaction between LRIG1 and tyrosine kinase
receptors has been described previously for normal RET (27), and here we showed similar
interactions between LRIG1 and the mutated and oncogenic RET
variants RET2A and RET2B. That is, LRIG1 physically interacted with
both RET2A and RET2B, as well as inhibited their constitutive
activation as monitored with receptor tyrosine phosphorylation
blots. This indicates that LRIG1 may play an important role in the
initiation or progression of thyroid cancer because mutated RET
receptors, including RET2A and RET2B, are established drivers of
the majority of MTCs and of some PTCs. However, the RET fusion
proteins found in PTC are cytosolic whereas LRIG1 is a
transmembrane protein, and whether they functionally interact was
not addressed in the present study. Nevertheless, altered signaling
pathways in PTC, particularly activation of the MAPK signaling
pathway, may be the result of other genetic events, such as
activating mutations in BRAF and RAS genes (reviewed in ref.
37). This activation may result
in the upregulation of other oncogenic proteins, including other
targets of LRIG1, such as the RTKs EGFR and MET. Thus, LRIG1 could
be important in PTC through interactions with other proteins as
well.
In Cohort1-TCGA, LRIG1 expression data were
available for 502 PTC cases but not for other thyroid cancer
subtypes; whereas in Cohort2-MTC, we determined the LRIG1
mRNA levels in 39 MTCs. Intriguingly, LRIG1 was
downregulated in both PTC and MTC compared to normal thyroid gland
tissue. Because many PTCs have been reported to have a RET
rearrangement and the majority of MTCs de facto showed a
mutated RET, the downregulation of LRIG1 expression
seen supports the notion that LRIG1 downregulation may play
a causative role in the etiologies of PTC and MTC. However, as
discussed above, this study does not provide evidence for a
functional interaction between LRIG1 and the RET fusion proteins
found in PTC; however, LRIG1 may possibly exert effects through
interactions with other RTKs as well. Another important point is
that the use of normal thyroid tissue as control for MTC may not be
optimal, but microdissection of parafollicular cells for control
was unfortunately not possible to obtain from this material. The
IHC analysis of Cohort3-TMA revealed no association between LRIG1
immunoreactivity and patient survival. However, known prognostic
factors, such as clinical stage and histological type, were
confirmed to be predictive of patient survival in this cohort.
Because the majority of cases in Cohort3-TMA (72/119) and all of
the cases in Cohort1-TCGA were of the PTC subtype, the data
indicate that neither the LRIG1 protein nor the LRIG1 mRNA
is prognostic in PTC. Although it could be argued that the material
used for the IHC analysis was rather small (118 cases, in total),
previous studies of similarly sized cohorts have shown significant
associations between LRIG immunoreactivity and patient survival for
other types of cancer (16,17,19,21,38–41).
Therefore, the importance of the LRIG1 protein and RNA expression
levels as prognostic markers in PTC may be of less interest for
further study. Because of the relative rarity of MTC, only 5 of the
111 evaluated patients in Cohort3-TMA represented MTC cases, it was
not possible to address the role of LRIG1 immunoreactivity as a
prognostic marker in MTC in this material. However, since
LRIG1 mRNA was downregulated in MTC, it may be of interest
to investigate the prognostic value of LRIG1 immunoreactivity in a
larger MTC cohort.
The deletion of Lrig1 did not affect the
apparent tumor incidence or malignancy grade in the mouse model of
RET2B-driven MTC. Our hypothesis was that Lrig1, through its
suppression of RET2B, would serve as a tumor suppressor in this
model system and, therefore, its deletion would enhance the
incidence, progression, or severity of the disease. However, no
such MTC promoting effects were observed in the
Lrig1-deficient mice. One possible explanation for the lack
of apparent effects of Lrig1 ablation could be that Lrig1
expression in the wild-type tumors was downregulated through
tumor-intrinsic mechanisms, thereby obviating the need for and
masking the effects of genetic ablation. This hypothesis is
consistent with the strong down-regulation of LRIG1
expression that was seen in the human MTC series. Regrettably, we
were unable to determine whether Lrig1 expression was
actually downregulated in the mouse tumors because the Lrig1
expression levels could not be determined in the pre-invasive
lesions in a reliable manner. Relatively, many of the mice (24%)
died or had to be sacrificed before the planned termination at 24
months of age. In most of these cases, the cause of premature death
was undetermined. We do not know if the RET2B transgene
caused an increased mortality rate among the experimental mice
because no RET2B-negative control colonies were maintained
in parallel with the RET2B transgenic experimental group.
However, the cause of premature deaths is not likely to have been
MTC because the plasma calcitonin levels were analyzed every third
month and none of the prematurely dead mice showed increased plasma
calcitonin levels prior to their death. In fact, detectable plasma
calcitonin levels were observed in only 3 of the 99 (3%) mice. This
is in contrast with a previous study, in which up to 90% of the
RET2B-positive mice showed detectable plasma calcitonin
levels by the age of 24 months (35). The reason for the observed
difference in MTC incidence between the present study and the
previous study is not known, but it could possibly be due to
differences in the calcitonin assay-sensitivity due to different
amounts of plasma available, animal housing conditions, or mouse
strain differences. In both studies, the genetic backgrounds of the
mice were mixed and thus, presumably not identical. Nevertheless,
pre-invasive thyroid gland lesions were found in 37% of wild-type
mice and in 48% of Lrig1-deficient mice. However, the
slightly higher incidence of pre-invasive lesions among the
Lrig1-deficient mice was not statistically significant.
Thus, no effect of Lrig1-ablation could be demonstrated in
our mouse model of RET2B-driven MTC.
In conclusion, our demonstration that LRIG1
negatively regulated the thyroid oncoproteins RET2A and RET2B and
was also downregulated in PTC and MTC suggests that LRIG1 plays
important roles in thyroid cancer. We believe that the possibility
that the downregulation of LRIG1 is a critical tumor-promoting
event during papillary and medullary thyroid carcinogenesis and
that LRIG1-based therapies could be effective in PTC, MTC and/or
other RET-driven cancers warrant further investigations. The
concept of possible LRIG1-based therapies has been described in
detail in a recent review, highlighting its possible role as a
therapeutic inhibitor of receptor tyrosine kinase signaling
(42). Further studies based on
our findings may initially include cellular and animal studies
testing the therapeutic potential of LRIG1 in cellular and animal
models of PTC and MTC.
Acknowledgments
We would like to thank Sjors Fens, Yvonne Jonsson,
Annika Holmberg, Charlotte Nordström, and Helena Hermelin for their
technical help.
Notes
[1]
Funding
This study was supported by grants from the Swedish
Society for Medical Research, the Swedish Cancer Society, the
Cancer Research Foundation in Northern Sweden, the F Olaison
Foundation, and through the regional agreement between Umeå
University and Västerbotten County Council in cooperation in the
fields of medicine, odontology and health.
[2] Availability
of data and materials
The materials included in the manuscript, including
all relevant raw data, will be made freely available to any
researchers who wish to use them for non-commercial purposes, while
preserving necessary confidentiality and anonymity.
[3] Authors'
contributions
DL, HH and RH coordinated the data collection, were
responsible for the animal experiments, the collection of clinical
data for cohort 3, carried out the statistical analyses, drafted
the manuscript, and provided final approval for the submission. FCA
and GP performed the cellular experiments, critically revised the
manuscript, and provided final approval for the submission. CH
collected the data for cohort 1, critically revised the manuscript,
and provided final approval for the submission. CL and NW collected
the data for cohort 2, critically revised the manuscript, and
provided final approval for the submission. JH performed all
cacitonin analyses and interpreted the data of these results,
critically revised the manuscript, and provided final approval for
the submission. MT and TT are senior pathologists and conducted the
immunohistochemidal evaluations, critically revised the manuscript,
and provided final approval for the submission.
[4] Ethics
approval and consent to participate
The study was approved by the Regional Ethics Review
Board in Uppsala (dnr 2010/351). Only patients who provided written
informed consent were included in the study.
[5] Consent for
publication
Publication of the clinical datasets in this study
does not compromise anonymity or confidentiality or breach local
data protection laws.
[6] Competing
interests
The authors declare that they have no competing
interests.
References
|
1
|
Ferlay J, Shin HR, Bray F, Forman D,
Mathers C and Parkin DM: Estimates of worldwide burden of cancer in
2008: GLOBOCAN 2008. Int J Cancer. 127:2893–2917. 2010. View Article : Google Scholar
|
|
2
|
DeLellis R and Williams ED: Tumours of the
thyroid and parathyroid. World Health Organization Classification
of Tumours. Pathology and Genetics of Tumours of Endocrine Organs.
DeLellis R and Williams ED: 8. IARC Press; pp. 51–56. 2004
|
|
3
|
Romei C, Fugazzola L, Puxeddu E, Frasca F,
Viola D, Muzza M, Moretti S, Nicolosi ML, Giani C, Cirello V, et
al: Modifications in the papillary thyroid cancer gene profile over
the last 15 years. J Clin Endocrinol Metab. 97:E1758–E1765. 2012.
View Article : Google Scholar : PubMed/NCBI
|
|
4
|
Romei C, Ciampi R and Elisei R: A
comprehensive overview of the role of the RET proto-oncogene in
thyroid carcinoma. Nat Rev Endocrinol. 12:192–202. 2016. View Article : Google Scholar : PubMed/NCBI
|
|
5
|
Kouvaraki MA, Shapiro SE, Perrier ND, Cote
GJ, Gagel RF, Hoff AO, Sherman SI, Lee JE and Evans DB: RET
proto-oncogene: A review and update of genotype-phenotype
correlations in hereditary medullary thyroid cancer and associated
endocrine tumors. Thyroid. 15:531–544. 2005. View Article : Google Scholar : PubMed/NCBI
|
|
6
|
Nikiforov YE, Rowland JM, Bove KE,
Monforte-Munoz H and Fagin JA: Distinct pattern of ret oncogene
rearrangements in morphological variants of radiation-induced and
sporadic thyroid papillary carcinomas in children. Cancer Res.
57:1690–1694. 1997.PubMed/NCBI
|
|
7
|
Agrawal N, A R, Aksoy BA, Ally A, Arachchi
H, Asa SL, Auman JT, Balasundaram M, Balu S, Baylin SB and Behera
M: Integrated genomic characterization of papillary thyroid
carcinoma. Cell. 159:676–690. 2014. View Article : Google Scholar :
|
|
8
|
Network CGAR; Cancer Genome Atlas Research
Network: Integrated genomic characterization of papillary thyroid
carcinoma. Cell. 159:676–690. 2014. View Article : Google Scholar : PubMed/NCBI
|
|
9
|
Guo D, Holmlund C, Henriksson R and Hedman
H: The LRIG gene family has three vertebrate paralogs widely
expressed in human and mouse tissues and a homolog in Ascidiacea.
Genomics. 84:157–165. 2004. View Article : Google Scholar : PubMed/NCBI
|
|
10
|
Holmlund C, Nilsson J, Guo D, Starefeldt
A, Golovleva I, Henriksson R and Hedman H: Characterization and
tissue-specific expression of human LRIG2. Gene. 332:35–43. 2004.
View Article : Google Scholar : PubMed/NCBI
|
|
11
|
Nilsson J, Vallbo C, Guo D, Golovleva I,
Hallberg B, Henriksson R and Hedman H: Cloning, characterization,
and expression of human LIG1. Biochem Biophys Res Commun.
284:1155–1161. 2001. View Article : Google Scholar : PubMed/NCBI
|
|
12
|
Wang Y, Poulin EJ and Coffey RJ: LRIG1 is
a triple threat: ERBB negative regulator, intestinal stem cell
marker and tumour suppressor. Br J Cancer. 108:1765–1770. 2013.
View Article : Google Scholar : PubMed/NCBI
|
|
13
|
Lindquist D, Kvarnbrink S, Henriksson R
and Hedman H: LRIG and cancer prognosis. Acta Oncol. 53:1135–1142.
2014. View Article : Google Scholar : PubMed/NCBI
|
|
14
|
Krig SR, Frietze S, Simion C, Miller JK,
Fry WH, Rafidi H, Kotelawala L, Qi L, Griffith OL, Gray JW, et al:
Lrig1 is an estrogen-regulated growth suppressor and correlates
with longer relapse-free survival in ERα-positive breast cancer.
Mol Cancer Res. 9:1406–1417. 2011. View Article : Google Scholar : PubMed/NCBI
|
|
15
|
Willis S, Villalobos VM, Gevaert O,
Abramovitz M, Williams C, Sikic BI and Leyland-Jones B: Single Gene
Prognostic Biomarkers in Ovarian Cancer: A Meta-Analysis. PLoS One.
11:e01491832016. View Article : Google Scholar : PubMed/NCBI
|
|
16
|
Lindström AK, Ekman K, Stendahl U, Tot T,
Henriksson R, Hedman H and Hellberg D: LRIG1 and squamous
epithelial uterine cervical cancer: Correlation to prognosis, other
tumor markers, sex steroid hormones, and smoking. Int J Gynecol
Cancer. 18:312–317. 2008. View Article : Google Scholar
|
|
17
|
Tanemura A, Nagasawa T, Inui S and Itami
S: LRIG-1 provides a novel prognostic predictor in squamous cell
carcinoma of the skin: Immunohistochemical analysis for 38 cases.
Dermatol Surg. 31:423–430. 2005. View Article : Google Scholar : PubMed/NCBI
|
|
18
|
Lindquist D, Näsman A, Tarján M,
Henriksson R, Tot T, Dalianis T and Hedman H: Expression of LRIG1
is associated with good prognosis and human papillomavirus status
in oropha-ryngeal cancer. Br J Cancer. 110:1793–1800. 2014.
View Article : Google Scholar : PubMed/NCBI
|
|
19
|
Sheu JJ, Lee CC, Hua CH, Li CI, Lai MT,
Lee SC, Cheng J, Chen CM, Chan C, Chao SC, et al: LRIG1 modulates
aggressiveness of head and neck cancers by regulating
EGFR-MAPK-SPHK1 signaling and extracellular matrix remodeling.
Oncogene. 33:1375–1384. 2014. View Article : Google Scholar
|
|
20
|
Kvarnbrink S, Karlsson T, Edlund K,
Botling J, Lindquist D, Jirström K, Micke P, Henriksson R,
Johansson M and Hedman H: LRIG1 is a prognostic biomarker in
non-small cell lung cancer. Acta Oncol. 54:1113–1119. 2015.
View Article : Google Scholar : PubMed/NCBI
|
|
21
|
Yang B, Dai C, Tan R, Zhang B, Meng X, Ye
J, Wang X, Wei L, He F and Chen Z: Lrig1 is a positive prognostic
marker in hepatocellular carcinoma. Onco Targets Ther. 9:7071–7079.
2016. View Article : Google Scholar : PubMed/NCBI
|
|
22
|
Gur G, Rubin C, Katz M, Amit I, Citri A,
Nilsson J, Amariglio N, Henriksson R, Rechavi G, Hedman H, et al:
LRIG1 restricts growth factor signaling by enhancing receptor
ubiquitylation and degradation. EMBO J. 23:3270–3281. 2004.
View Article : Google Scholar : PubMed/NCBI
|
|
23
|
Laederich MB, Funes-Duran M, Yen L,
Ingalla E, Wu X, Carraway KL III and Sweeney C: The leucine-rich
repeat protein LRIG1 is a negative regulator of ErbB family
receptor tyrosine kinases. J Biol Chem. 279:47050–47056. 2004.
View Article : Google Scholar : PubMed/NCBI
|
|
24
|
Miller JK, Shattuck DL, Ingalla EQ, Yen L,
Borowsky AD, Young LJ, Cardiff RD, Carraway KL III and Sweeney C:
Suppression of the negative regulator LRIG1 contributes to ErbB2
overexpression in breast cancer. Cancer Res. 68:8286–8294. 2008.
View Article : Google Scholar : PubMed/NCBI
|
|
25
|
Stutz MA, Shattuck DL, Laederich MB,
Carraway KL III and Sweeney C: LRIG1 negatively regulates the
oncogenic EGF receptor mutant EGFRvIII. Oncogene. 27:5741–5752.
2008. View Article : Google Scholar : PubMed/NCBI
|
|
26
|
Shattuck DL, Miller JK, Laederich M, Funes
M, Petersen H, Carraway KL III and Sweeney C: LRIG1 is a novel
negative regulator of the Met receptor and opposes Met and Her2
synergy. Mol Cell Biol. 27:1934–1946. 2007. View Article : Google Scholar :
|
|
27
|
Ledda F, Bieraugel O, Fard SS, Vilar M and
Paratcha G: Lrig1 is an endogenous inhibitor of Ret receptor
tyrosine kinase activation, downstream signaling, and biological
responses to GDNF. J Neurosci. 28:39–49. 2008. View Article : Google Scholar : PubMed/NCBI
|
|
28
|
Rondahl V, Holmlund C, Karlsson T, Wang B,
Faraz M, Henriksson R and Hedman H: Lrig2-deficient mice are
protected against PDGFB-induced glioma. PLoS One. 8:e736352013.
View Article : Google Scholar : PubMed/NCBI
|
|
29
|
Alsina FC, Hita FJ, Fontanet PA, Irala D,
Hedman H, Ledda F and Paratcha G: Lrig1 is a cell-intrinsic
modulator of hippocampal dendrite complexity and BDNF signaling.
EMBO Rep. 17:601–616. 2016. View Article : Google Scholar : PubMed/NCBI
|
|
30
|
Nilsson J, Starefeldt A, Henriksson R and
Hedman H: LRIG1 protein in human cells and tissues. Cell Tissue
Res. 312:65–71. 2003.PubMed/NCBI
|
|
31
|
Rossel M, Pasini A, Chappuis S, Geneste O,
Fournier L, Schuffenecker I, Takahashi M, van Grunsven LA, Urdiales
JL, Rudkin BB, et al: Distinct biological properties of two RET
isoforms activated by MEN 2A and MEN 2B mutations. Oncogene.
14:265–275. 1997. View Article : Google Scholar : PubMed/NCBI
|
|
32
|
Santoro M, Carlomagno F, Romano A, Bottaro
DP, Dathan NA, Grieco M, Fusco A, Vecchio G, Matoskova B, Kraus MH,
et al: Activation of RET as a dominant transforming gene by
germline mutations of MEN2A and MEN2B. Science. 267:381–383. 1995.
View Article : Google Scholar : PubMed/NCBI
|
|
33
|
Wang N, Kjellin H, Sofiadis A, Fotouhi O,
Juhlin CC, Bäckdahl M, Zedenius J, Xu D, Lehtiö J and Larsson C:
Genetic and epigenetic background and protein expression profiles
in relation to telomerase activation in medullary thyroid
carcinoma. Oncotarget. 7:21332–21346. 2016.PubMed/NCBI
|
|
34
|
Suzuki Y, Miura H, Tanemura A, Kobayashi
K, Kondoh G, Sano S, Ozawa K, Inui S, Nakata A, Takagi T, et al:
Targeted disruption of LIG-1 gene results in psoriasiform epidermal
hyperplasia. FEBS Lett. 521:67–71. 2002. View Article : Google Scholar : PubMed/NCBI
|
|
35
|
Acton DS, Velthuyzen D, Lips CJ and
Höppener JW: Multiple endocrine neoplasia type 2B mutation in human
RET oncogene induces medullary thyroid carcinoma in transgenic
mice. Oncogene. 19:3121–3125. 2000. View Article : Google Scholar : PubMed/NCBI
|
|
36
|
van Veelen W, van Gasteren CJ, Acton DS,
Franklin DS, Berger R, Lips CJ and Höppener JW: Synergistic effect
of oncogenic RET and loss of p18 on medullary thyroid carcinoma
development. Cancer Res. 68:1329–1337. 2008. View Article : Google Scholar : PubMed/NCBI
|
|
37
|
Xing M: Molecular pathogenesis and
mechanisms of thyroid cancer. Nat Rev Cancer. 13:184–199. 2013.
View Article : Google Scholar : PubMed/NCBI
|
|
38
|
Guo D, Nilsson J, Haapasalo H, Raheem O,
Bergenheim T, Hedman H and Henriksson R: Perinuclear leucine-rich
repeats and immunoglobulin-like domain proteins (LRIG1-3) as
prognostic indicators in astrocytic tumors. Acta Neuropathol.
111:238–246. 2006. View Article : Google Scholar : PubMed/NCBI
|
|
39
|
Hedman H, Lindström AK, Tot T, Stendahl U,
Henriksson R and Hellberg D: LRIG2 in contrast to LRIG1 predicts
poor survival in early-stage squamous cell carcinoma of the uterine
cervix. Acta Oncol. 49:812–815. 2010. View Article : Google Scholar : PubMed/NCBI
|
|
40
|
Holmlund C, Haapasalo H, Yi W, Raheem O,
Brännström T, Bragge H, Henriksson R and Hedman H: Cytoplasmic
LRIG2 expression is associated with poor oligodendroglioma patient
survival. Neuropathology. 29:242–247. 2009. View Article : Google Scholar
|
|
41
|
Muller S, Lindquist D, Kanter L,
Flores-Staino C, Henriksson R, Hedman H and Andersson S: Expression
of LRIG1 and LRIG3 correlates with human papillomavirus status and
patient survival in cervical adenocarcinoma. Int J Oncol.
42:247–252. 2013. View Article : Google Scholar
|
|
42
|
Neirinckx V, Hedman H and Niclou SP:
Harnessing LRIG1-mediated inhibition of receptor tyrosine kinases
for cancer therapy. Biochim Biophys Acta. 1868:109–116.
2017.PubMed/NCBI
|