Introduction
Pancreatic cancer (PC) is the fourth leading cause
of cancer-related mortality worldwide (1) and is associated with a poor prognosis
due to liver metastasis (2). PC
remains a challenging disease with limited treatment options; at
the time of diagnosis, almost 80% of patients have unresectable
tumors with either progressive metastatic growth or locally
advanced lesions (3). This
phenotypic switch in PC cells may occur due to
epithelial-mesenchymal transition (EMT) (4). EMT is a biological process in which
cells with a smooth morphology are converted and begin to exhibit
mesenchymal characteristics, including the loss of polarity,
minimal cell-cell contacts and increased cell projections (5–9). The
histological loss of cellular differentiation is a predictive
biomarker of poor outcomes in PC (10). Although advances have been made in
PC treatment methods, conventional treatments still have
undesirable outcomes and patient life expectancy remains poor
(11,12). A pattern of differentially
expressed microRNAs (miRNAs or miRs) has been developed for
gemcitabine-resistant PC cells, and the results have demonstrated
that miR-mRNA network-based analysis may provide insight into the
molecular mechanisms responsible for drug resistance (13).
miRs are short (~22 nt in length) non-coding RNAs
that regulate gene expression (14). Previous studies have reported that
they are involved in the regulation of cancer progression (15–17).
By modulating oncogenes or tumor suppressor genes, miRs can affect
tumor development (17). A
previous study reported that miR-494 was able to downregulate KIT
in gastrointestinal stromal tumors (GIST) and that miR-494
overexpression may be a promising treatment strategy for GIST
(18). miR-494 has also been shown
to suppress colony forming activity and the proliferation of A549
human lung cancer cells (19). The
association between miRNAs and syndecan-1 (SDC1) has previously
been explored by Parimon et al (20). SDC1 has been implicated in a number
of biological functions, and changes in its expression often
produce malignant phenotypes arising from elevated cell growth,
proliferation, invasion and metastasis (21). SDC1 is an important cell surface
adhesion biomolecule that is involved in the maintenance of cell
morphology, and its dysfunction contributes to cancer progression
(22). SDC1 expression is
dysregulated in various types of cancer, including head, neck,
breast, ovarian and colorectal carcinomas (23–27).
The aim of this study was to elucidate the mechanisms through which
miR-494 affects EMT and the invasion of PC cells by targeting
SDC1.
Materials and methods
Ethics statement
The present study was approved by the Institutional
Review Board of the First Affiliated Hospital of Dalian Medical
University in accordance with the Declaration of Helsinki. Written
informed consent was obtained from each participant. All
experimental protocols were in accordance with the International
Convention on the Ethics of Laboratory Animals and relevant
national regulations.
Study subjects
A total of 42 patients (25 male, 17 female; aged
31–77 years) who were pathologically diagnosed with PC and
underwent exairesis (28) between
November, 2013 and November, 2016 at the First Affiliated Hospital
of Dalian Medical University (Dalian, China) were included in this
study. The inclusion criteria were as follows: i) Patients who were
pathologically confirmed to suffer from PC with complete clinical
data; ii) patients who had no history of pancreatitis,
radiochemotherapy or pancreatic surgery prior to the exairesis;
iii) patients who successfully underwent surgery with no
complications. The exclusion criteria were as follows: i) Patients
who were not pathologically confirmed with PC; ii) patients who had
a history of pancreatic disease; iii) patients who exhibited
discomfort after surgery. Pancreatitis tissues were collected from
42 patients (22 male, 20 female; aged 30–75 years) with
pancreatitis who were treated at the First Affiliated Hospital of
Dalian Medical University as the controls. All the tissue samples
were obtained by puncture biopsy and R0 (or R1) excision, and no
frozen sections were made prior to RNA extraction. However,
histopathological examination was performed following surgery to
ensure that the tissues obtained were specifically tumor tissues.
Fresh specimens were stored in liquid nitrogen, and all cells were
cultured in high glucose Dulbecco's modified Eagle's medium (DMEM;
HyClone/GE Healthcare Life Sciences, Logan, UT, USA) containing
bovine serum albumin (BSA; Invitrogen/Thermo Fisher Scientific,
Inc., Waltham, MA, USA) and 1% streptomycin penicillin
(Sigma-Aldrich/Merck KGaA, Darmstadt, Germany) at 37°C with 5%
CO2. The medium was changed every 24 to 48 h. The cells
were detached with trypsin and passaged. Cells in the logarithmic
growth phase were selected for use in further experiments. No
patients had received radiochemotherapy prior to surgery and all
provided complete clinical data. Following exairesis, the PC
tissues and pancreatitis tissues were stored separately in
Eppendorf (EP) tubes in liquid nitrogen.
Immunohistochemistry
Tissues were fixed with formaldehyde, dehydrated,
embedded in paraffin and cut into serial 4-μm-thick
sections. All sections underwent normal dewaxing and antigen
retrieval in citrate buffer under high pressure for 2 min. To block
endogenous peroxidase activity, the sections were incubated with 3%
H2O2 at room temperature for 10 min. The
sections were then incubated with the primary monoclonal
mouse-anti-human SDC1 antibody (ab128936, 1:8,000; Abcam Inc.,
Cambridge, MA, USA) overnight at 4°C, washed 3 times at room
temperature and incubated with goat anti-mouse antibody FITC
(Johnson Lifescan Inc., Chesterbrook, PA, USA) for 30 min at 37°C.
Following 3 washes in phosphate buffered saline (PBS), the sections
were stained with diaminobenzidine (DAB) (Shanghai Reagent No. 1
Factory, Shanghai, China), redyed and sealed. Known positive
sections were used as positive controls and the primary antibody
was substituted with PBS as a negative control. Positive SDC1
expression was indicated by brownish-yellow particles in the
nucleus or cytoplasm. Scoring was performed using a double blind
method (a 13-point scoring method) (29). The amount of SDC1 staining was
scored based on the percentage of stained cells and the intensity
of staining. The percentage scoring system was as follows: 0
points, no cells stained positive for SDC1; 1 point, ≤10% cells
stained positive; 2 points, 11–50% positive cells; 3 points, 51–80%
positive cells; 4 points, >80% positive cells. Staining
intensity was scored as follows: 0 point, no staining; 1 point,
weak staining; 2 points, moderate staining; 3 points, strong
staining. A final score was product of the percentage score and
intensity score. To stratify patients for analysis, a score of
>4 was defined as high/positive SDC1 expression, while ≤4 was
low/negative SDC1 expression.
Reverse transcription-quantitative
polymerase chain reaction (RT-qPCR)
TRIzol reagent (Invitrogen, Carlsbad, CA, USA) was
used to extract total RNA from the tissues and also the RNA
concentration was determined using TRIzol. Subsequently, 1
μg RNA was reverse transcribed using a PrimeScript™ RT-PCR
kit (RR047A; Takara Bio, Inc., Otsu, Japan) to obtain cDNA, which
was used as a template for primer design with Primer Premier 5.0
software (amplified fragment size, 156 bp). Primers were
synthesized by Invitrogen. The purity and concentration of the RNA
were then detected using a micro-plate reader (168-1000XC, Model
680; Bio-Rad, Hercules, CA, USA). With β-actin as an internal
reference, the expression levels of SDC1, E-cadherin, Vimentin and
miR-494 were determined as previously described (30). The conditions for the reverse
transcription were as follows: 37°C for 60 min and 85°C for 5 min.
A TaqMan PCR assay (Bio-Rad Laboratories, Inc.) was performed, and
the thermocycling conditions were as follows: Pre-denaturation at
95°C for 3 min, followed by 40 cycles of denaturation at 95°C for
10 sec, annealing at 60°C for 20 sec and extension at 72°C for 30
sec. The 2−ΔΔCq method (31) was used to calculate mRNA
expression. The primer sequences are presented in Table I.
 | Table IThe primer sequences for the
RT-qPCR. |
Table I
The primer sequences for the
RT-qPCR.
| Primer | Sequences |
|---|
| miR-494 | F:
5′-TGACCTGAAACATACACGGA-3′ |
| R:
5′-TATCGTTGTACTCCACTCCTTGAC-3′ |
| SDC1 | F:
5′-GAGAGGAATCCGGCAGTAGA-3′ |
| R:
5′-GAGCCATCTTGATCTTCAGG-3′ |
| E-cadherin | F:
5′-AGACAGGGGTGGAGGAAGTT-3′ |
| R:
5′-GGGCAGGAGTCTAGCAGAAG-3′ |
| Vimentin | F:
5′-GACAATGCGTCTCTGGCACGTCTT-3′ |
| R:
5′-TCCTCCGCCTCCTGCAGGTTCTT-3′ |
| β-actin | F:
5′-CTCCTTAATGTCACGCAGGATTTC-3′ |
| R:
5′-GTGGGGCGCCCCAGGCACCA-3′ |
Cell culture and selection
The non-HPC cell line, HPDE6c7, and the pancreatic
ductal adenocarcinoma cell lines (PDACs), namely ASPC-1, SW1990,
BXPC-3, CFPAC-1 and PANC-1, were purchased from the Shanghai Cell
Bank of the Chinese Academy of Sciences (Shanghai, China) and
cultured in complete DMEM containing 10% BSA, 100 U/ml penicillin
and 100 μg/ml streptomycin at 37°C in 5% CO2 with
saturated humidity. The cell line with the highest SDC1 expression
was selected for subsequent experimentation.
Dual-luciferase reporter gene
The TIAN amp Genomic DNA kit (Tiangen Biotech Co.,
Beijing, China) was used for DNA extraction, and the target gene
prediction software TargetScan (http://www.targetscan.org/vert_71/) was used to obtain
the targets of miR-494. A PCR amplification primer was designed
based on the potential site of the 3′-UTR, and the SDC1 3′-UTR
segment containing a miR-494 response sequence was constructed. A
Dual-Luciferase Reporter Assay System (E1910; Promega, Madison, WI,
USA) was used to detect luciferase viability. The site directed
mutant sequence without binding site of miR-494 in SDC1 3′-UTR was
designed and inserted into the reporter vector. miR-494 mimic was
then co-transfected with the SDC1 wild-type sequence
(Wt-miR-494/SDC1) or mutant-type sequence (Mut-miR-494/SDC1) into
SW1990 cells. At 48 h following transfection, samples were washed
twice with PBS and the old medium was discarded. Subsequently, 100
μl passive lysis buffer (PLB) were added to each well and
shaken at room temperature for 15 min. The cell lysate was
collected and analyzed using the system, with program pre-reading
time of 2 sec, data reading for 10 sec, followed by the addition of
LARII Stop &Glo® Reagent (100 μl each time).
The prepared LARII Stop & Glo® Reagent and
luminotron or lighting slab (sample size, 20 μl) was palced
in a bioluminescence detector (Glomax 20/20; Promega). The program
was run and data were reserved after value readings. The experiment
was performed in triplicate with 3 duplicates for each
experiment.
Cell culture, grouping and
transfection
The PDAC cell line with the highest expression of
SDC1 was selected for use in further experiments. The PC cells in
the logarithmic growth phase were seeded in a 6-well plate
(1×10⁵ cells/well). When cell confluence reached 70%,
the culture solution was changed and the cells were washed with
serum- and antibiotic-free medium 3 times. A plasmid-liposome
mixture (Invitrogen) was added to culture the plates for
transfection, shaken for 30 sec and incubated in 5% CO2
at 37°C for 5 h. The medium was replaced with a culture solution
containing fresh serum and cultured for 48 h. Lipofectamine 2000
(Invitrogen) was used for transfection and the cells were divided
into the following groups: Blank (no transfection), miR-494 mimic
(transfected with miR-494 mimic), miR-494 inhibitor (transfected
with miR-494 inhibitor), negative control (NC, transfected with NC
plasmid), SDC1-siRNA (transfected with SDC1-siRNA) and miR-494
inhibitor + SDC1-siRNA (transfected with miR-494 inhibitors and
SDC1-siRNA). The miR-494 mimic, miR-494 inhibitor, NC plasmid and
SDC1-siRNA were all purchased from the Shanghai GenePharma Co.,
Ltd. (Shanghai, China). The siRNA sequences are presented in
Table II.
| Table IIThe sequences for the miR-494 mimic,
miR-494 inhibitor and NC plasmid. |
Table II
The sequences for the miR-494 mimic,
miR-494 inhibitor and NC plasmid.
| Plasmid | Sequence |
|---|
| hsa-miR-494
mimic |
5′-UGAAACAUACACGGGAAACCUC-3′ |
| hsa-miR-494
inhibitor |
5′-GAGGUUUCCCGUGUAUGUUUCA-3′ |
| Negative control
sense |
5′-UUCUCCGAACGUGUCACGUTT-3′ |
| Negative control
antisense |
5′-CAGUACUUUUGUGUAGUACAA-3′ |
| SDC1-siRNA |
5′-GACTGCTTTGGACCTAAAT-3′ |
Western blot analysis
At 48 h following transfection, the cells were
harvested and lysed with radioimmunoprecipitation assay (RIPA)
buffer (Beyotime Institute of Biotechnology, Shanghai, China).
Total protein was extracted, and the protein concentration was
determined using the BCA method (KeyGene, Wageningen, The
Netherlands). The 5X sample loading buffer was mixed with the
proteins and boiled for 10 min in a water bath. Following heating
and denaturation, proteins were separated by 7.5% polyacrylamide
gel electrophoresis and transferred onto a polyvinylidene
difluoride membrane (PVDF; EMD Millipore, Billerica, MA, USA). The
membrane was blocked with 5% skimmed milk powder for 1 h followed
by incubation with rat anti-human SDC1 (ab34164, 1:8,000; Abcam
Inc.), E-cadherin (TA800670, 1:1,000), N-cadherin (TA503775, 1:500)
and Vimentin (TA801250, 1:1,000) antibodies (Zhongshan Jinqiao
Biotech, Beijing, China) at 4°C overnight. The membrane was then
washed and incubated with horseradish peroxidase (HRP)-labeled goat
anti-mouse secondary antibody (ab97040, 1:5,000; Abcam Inc.) at
37°C for 1 h. Enhanced chemiluminescence (ECL) reagents were added
to develop the film, and the optical density (OD) of the target
bands was analyzed using a gel image processing system (UVP Inc.,
San Gabriel, CA, USA) with β-actin as an internal reference.
Cell counting kit (CCK)-8 assay
When cell confluence reached 80%, the cells were
washed twice with PBS, detached by 0.25% trypsin and made into
single cell suspension. After cell counting, 3×10³ to
6×10³ cells were seeded in each well of a 96-well plate
(the volume of each well was 100 μl, with 6 repeated wells
in each group). The plate was subsequently incubated for 24, 48 or
72 h, following which 10 μl CCK-8 reagent (VP757; Dojindo
Co., Kumamoto, Japan) were added to each well for a 2-h incubation.
An enzyme linked immunosorbent assay reader (Dasit, Milan, Italy)
was used to read the OD value of each well at 450 nm. Each
experiment was performed in triplicate.
Scratch test
A transferpettor pipette (200 μl) was used to
make a scratch on the cell surface at 48 h following cell
transfection. Serum-free medium was used to wash the cells 2 times
with cell debris removed, following which images were captured
under an inverted microscope (time 0). The cells were cultured in
serum-free medium in a 5% CO2 incubator with saturated
humidity at 37°C for 24 h and the scratch healing was observed and
recorded at the same observation site. The healing conditions in
each group were compared and the cell migration rate was calculated
based on 5 scratch widths.
Transwell assay
A Transwell chamber inserted with a microporous 8
μm-bore membrane (Costar Corporation, MA, USA) was placed in
a 6-well plate. The bottom of the Transwell chamber was coated with
10 μg/ml type I collagen (Sigma-Aldrich Chemical Co., St.
Louis, MO, USA) and the chamber was dehydrated under sterile
conditions. At 24 h following transfection, the cells in each group
were collected and resuspended at a density of 1×10⁵
cells/ml. Subsequently, 200 μl cell suspension was seeded in
the apical chamber of the Transwell chamber coated with Matrigel
and 800 μl DMEM containing 20% FBS was added to the
basolateral chamber, followed by incubation for 24 h. Gel on the
upper layer of the microporous membrane was removed using a cotton
bud. The cells in the chamber were fixed with paraformaldehyde for
20 min and stained with crystal violet (Amresco Company, Solon, OH,
USA) for 5 min at 37°C. Cells were observed, counted under an
inverted microscope (magnification, ×200, TE2000; Nikon, Shanghai,
China) with representative fields of vision photographed. The
number of cells penetrating through the membrane without Matrigel
was set as 100%, and the percentage was obtained by comparing the
number of cells penetrating through the membrane in each group with
the number of cells penetrating through the membrane without
Matrigel, which was regarded as the cell invasion ability in
vitro. Each group consisted of 3 parallel experiments and each
experiment was repeated 3 times.
Flow cytometry
At 48 h following transfection, the cells were
detached using trypsin without ethylene diamine tetraacetic acid
(EDTA) and collected in a centrifugation tube. The supernatant was
discarded and the cells were washed 3 times with cold PBS and
centrifuged (37°C, 300 × g) again. The supernatant was discarded,
followed by staining with 1 mg/ml RNase A and 50 μg/ml of
propidium iodide (PI) for 30 min. Flow cytometry (BD Biosciences,
San Jose, CA, USA) was performed and the cell cycle was assessed
using ModFit software (Bio-Rad Laboratories, Inc.). An Annexin
V-fluorescein isothiocyanate (FITC) cell apoptosis kit (M3021;
Shanghai Mei Ji Biotechnology Co., Ltd., Shanghai, China) was used
to assess apoptosis. In accordance with the manufacturer's
instructions, Annexin V-FITC, PI and
4-(2-hydroxyethyl)-1-piperazineethanesulfonic acid (HEPES) buffer
solution were mixed at a ratio of 1:2:50 to prepare the Annexin
V-FITC/PI dye. A total of 100 μl dye was added to per
1×10⁶ cells for suspension. The mixture was shaken
evenly and incubated at room temperature for 15 min, following
which 1 ml HEPES buffer solution was added and the mixture was
shaken evenly again. FITC and PI fluorescence were detected using a
flow cytometer to assess cell apoptosis. The results were evaluated
as follows: Cells in the left upper quadrant were dead cells; cells
in the left lower quadrant were negative normal cells; cells in the
right quadrant were apoptotic cells; cells in the upper right
quadrant were late apoptotic cells and cells in the lower right
represented those in early apoptosis.
Xenograft tumors in nude mice
BALB/C female nude mice (8 weeks old, weighing 18–20
g) were purchased from the Laboratory Animal Center, Dalian Medical
University and housed under the condition of a constant temperature
(25–27°C) and constant humidity (45–50%). The SW1990 cells
(1×10⁶) were resuspended in 200 μl normal saline
and injected subcutaneously into the back of right hind leg of nude
mice with 10 mice for each group. The mice that were injected with
the SW1990 cells were assigned into the blank, miR-494 mimic,
SDC1-siRNA and miR-494 inhibitor + SDC1-siRNA groups. Tumor
formation and growth were observed and recorded regularly. When
tumors were clearly visible, the two maximal margins were measured
every 5 days using a vernier caliper. Tumor volume was calculated
using the formula V = L × W2 × 0.5, where L is the
length and W is the width of a tumor. When a single tumor reached
approximately 1.2 cm in diameter, the nude mice were
sacrificed.
Statistical analysis
SPSS 21.0 software (IBM Corp., Armonk, NY, USA) was
used for data analysis. All experiments were repeated 3 times. Data
are presented as the means ± standard deviation. Differences
between 2 groups were compared using independent sample t-test.
Multiple group comparisons were made using one-way analysis of
variance (ANOVA). The least significant difference (LSD) test was
employed for pairwise comparisons. The cell growth conditions in
each group at different time points were assessed using a repeated
measurement analysis of variance. A value of P<0.05 was
considered to indicate a statistically significant difference.
Results
The expression of miR-494 is
downregulated and that of SDC1 is upregulated in PC tissues
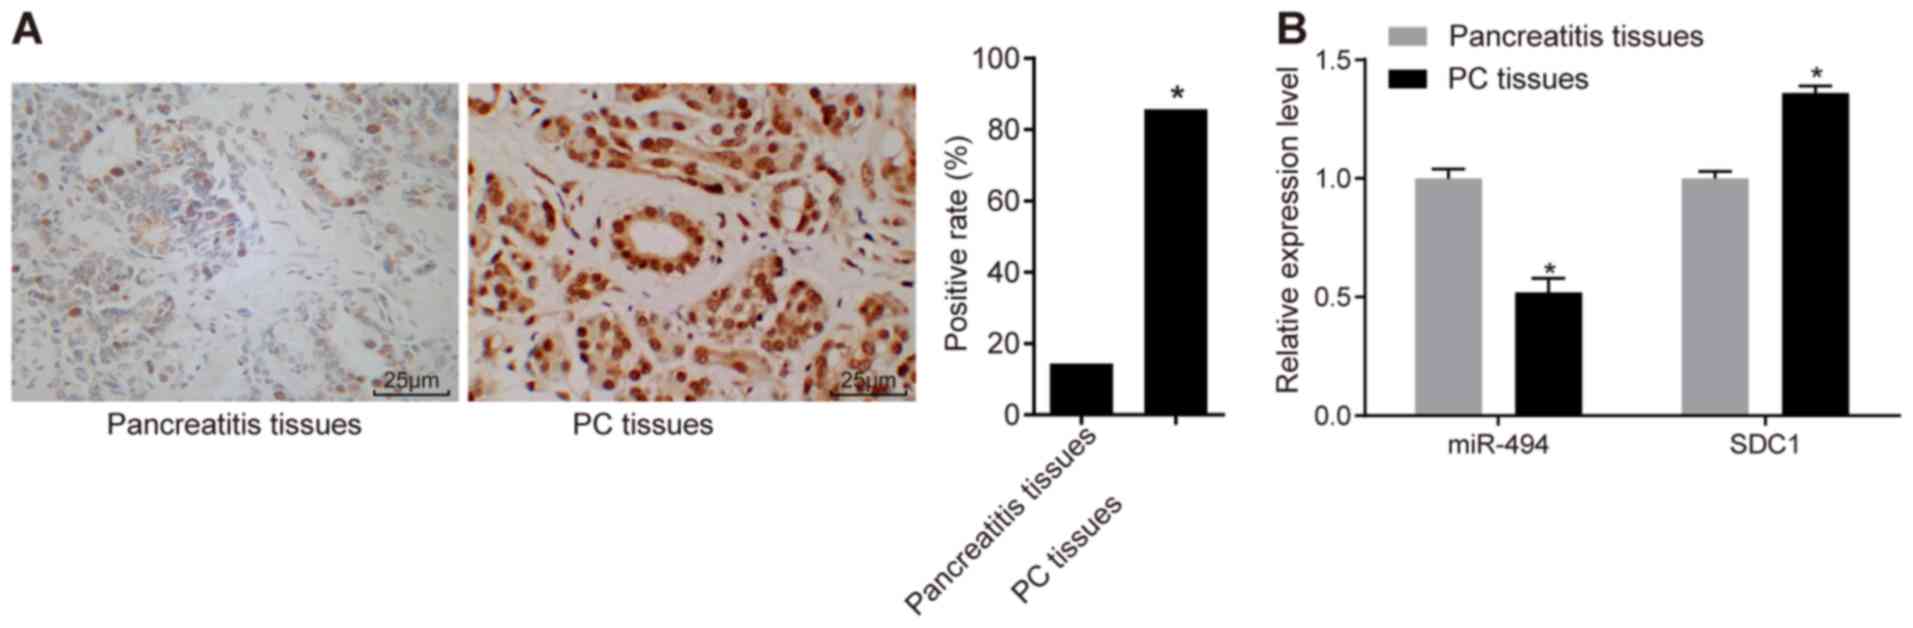
Immunohistochemistry was performed in order to
determine the relative expression of SDC1 in PC tissues. Positive
SDC1 staining was mainly observed in the nuclei and only partly in
cytoplasm (Fig. 1A). The SDC1
positive expression rate in the PC tissues was 85.7% (36/42)
compared with 14.4% (6/42) in the pancreatitis tissues (P<0.05).
Subsequently, we validated the inverse association between miR-494
and SDC1 expression by conducting RT-qPCR. The results revealed
that miR-494 expression was decreased and SDC1 expression was
increased in the PC tissues compared with the pancreatitis tissues
(P<0.05) (Fig. 1B).
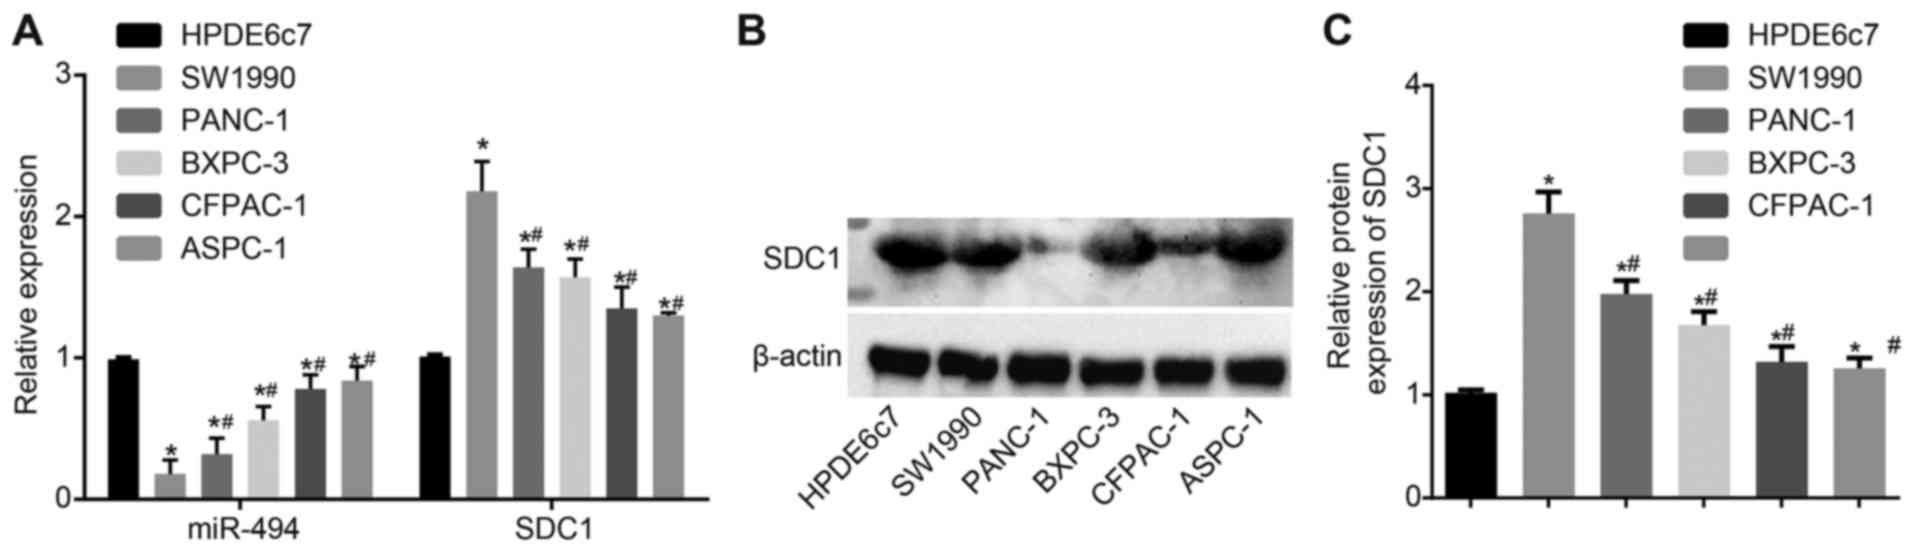
SW1990 cells have the highest SDC1
expression and lowest miR-494 expression
RT-qPCR was performed to determine the mRNA
expression levels of SDC1 in the non-HPC HPDE6c7 cells and PDAC
cell lines (ASPC-1, SW1990, BXPC-3, CFPAC-1 and PANC-1). These cell
lines exhibited a statistically significant inverse association
between SDC1 and miR-494 expression (Fig. 2A). The expression of miR-494 was
also assessed. Western blot analysis was used to measure the
protein levels expression of SDC1 (Fig. 2B), and the results revealed the
same expression pattern as did RT-qPCR. miR-494 expression was
lower in the PDAC cell lines than in the HPDE6c7 cells, and the
lowest miR-494 expression was observed in the SW1990 cells. The
results also revealed that SDC1 expression was upregulated in the
PDAC cells compared with the non-PC cells (P<0.05). Thus, SW1990
was selected for use in further experiments.
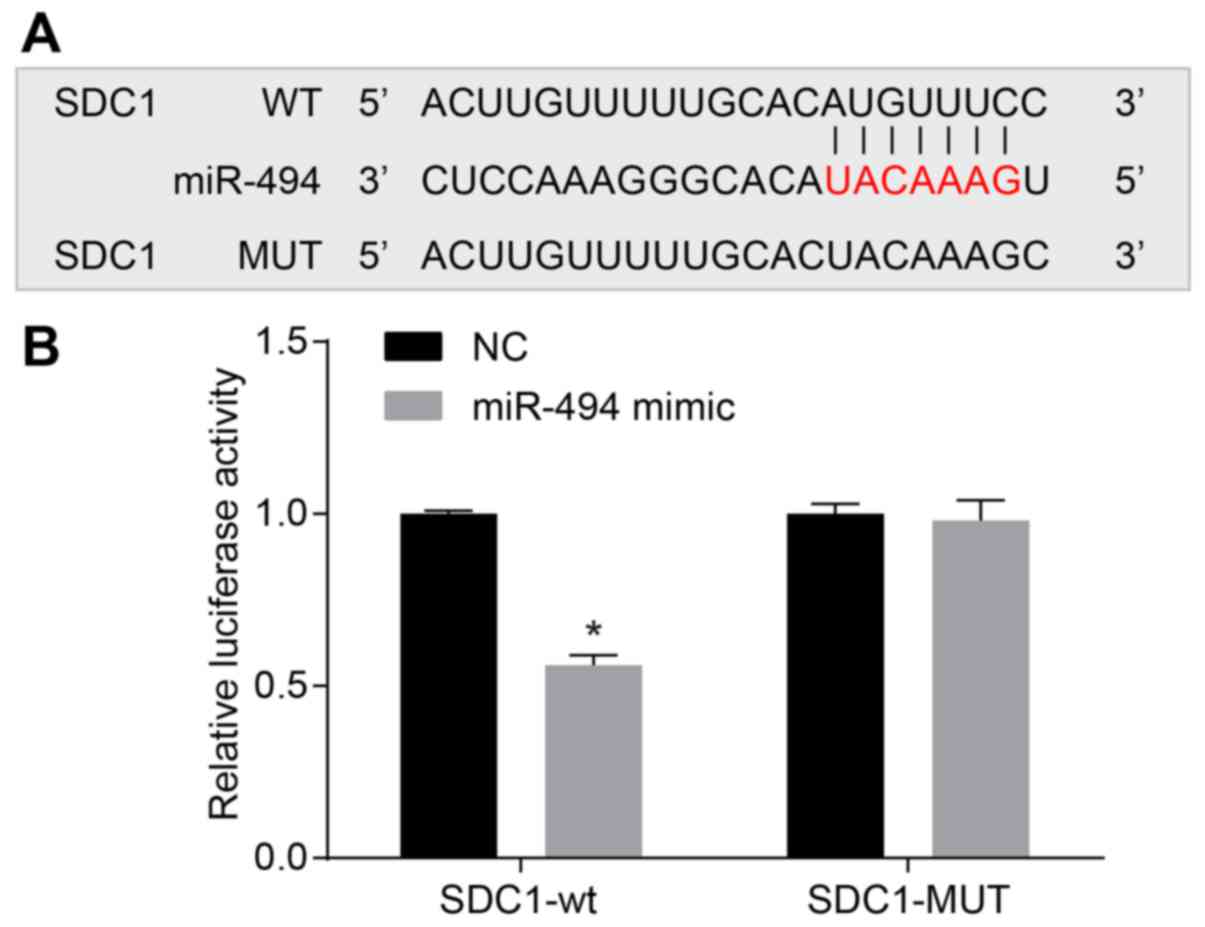
SDC1 was verified as the target gene for
miR-494
Online target prediction was used to determine
whether miR-494 is able to directly regulate SDC1, and the results
were confirmed by a dual luciferase reporter assay. The results
identified a specific binding region between the SDC1 gene and the
miR-494 sequence, indicating that SDC1 was the target gene of
miR-494 (Fig. 3). To prove that
miR-494 affects the target site, WT and MUT sequences lacking the
miR-494 combination sites in the SDC1 3′-UTR area were inserted
using a reporter plasmid. The miR-494 mimic, WT-miR-494/SDC1 or
MUT-miR-494/SDC1 recombined plasmids were co-transfected into the
SW1990 cells, and the results revealed that transfection with the
miR-494 mimics had no significant effects on luciferase activity in
the MUT-miR-494/SDC1 group, whereas the luciferase activity was
significantly decreased following transfection in the
WT-miR-494/SDC1 group (P<0.05). These results indicate that
miR-494 may directly target SDC1.
Restoration of miR-494 suppressed EMT of
SW1990 cells via inhibition of SDC1
Microscopy was used to observe changes in cell
morphology at 48 h following transfection in each group (Fig. 4A). In the NC and blank groups, no
obvious interstitial changes were observed. Compared with the NC
and blank groups, a loss of cell polarity and widened cell gaps
were observed in the miR-494 inhibitor + SDC1-siRNA and the miR-494
inhibitor groups, suggesting that cell adhesion was lost. Some
cells in these groups exhibited outstretched pseudopodia or
mesenchymal cell-like changes, similar to fibroblasts. Changes in
cell morphology were most evident in the miR-494 inhibitor group.
No significant interstitial cell transformation was observed in the
miR-494 mimic or SDC1-siRNA groups.
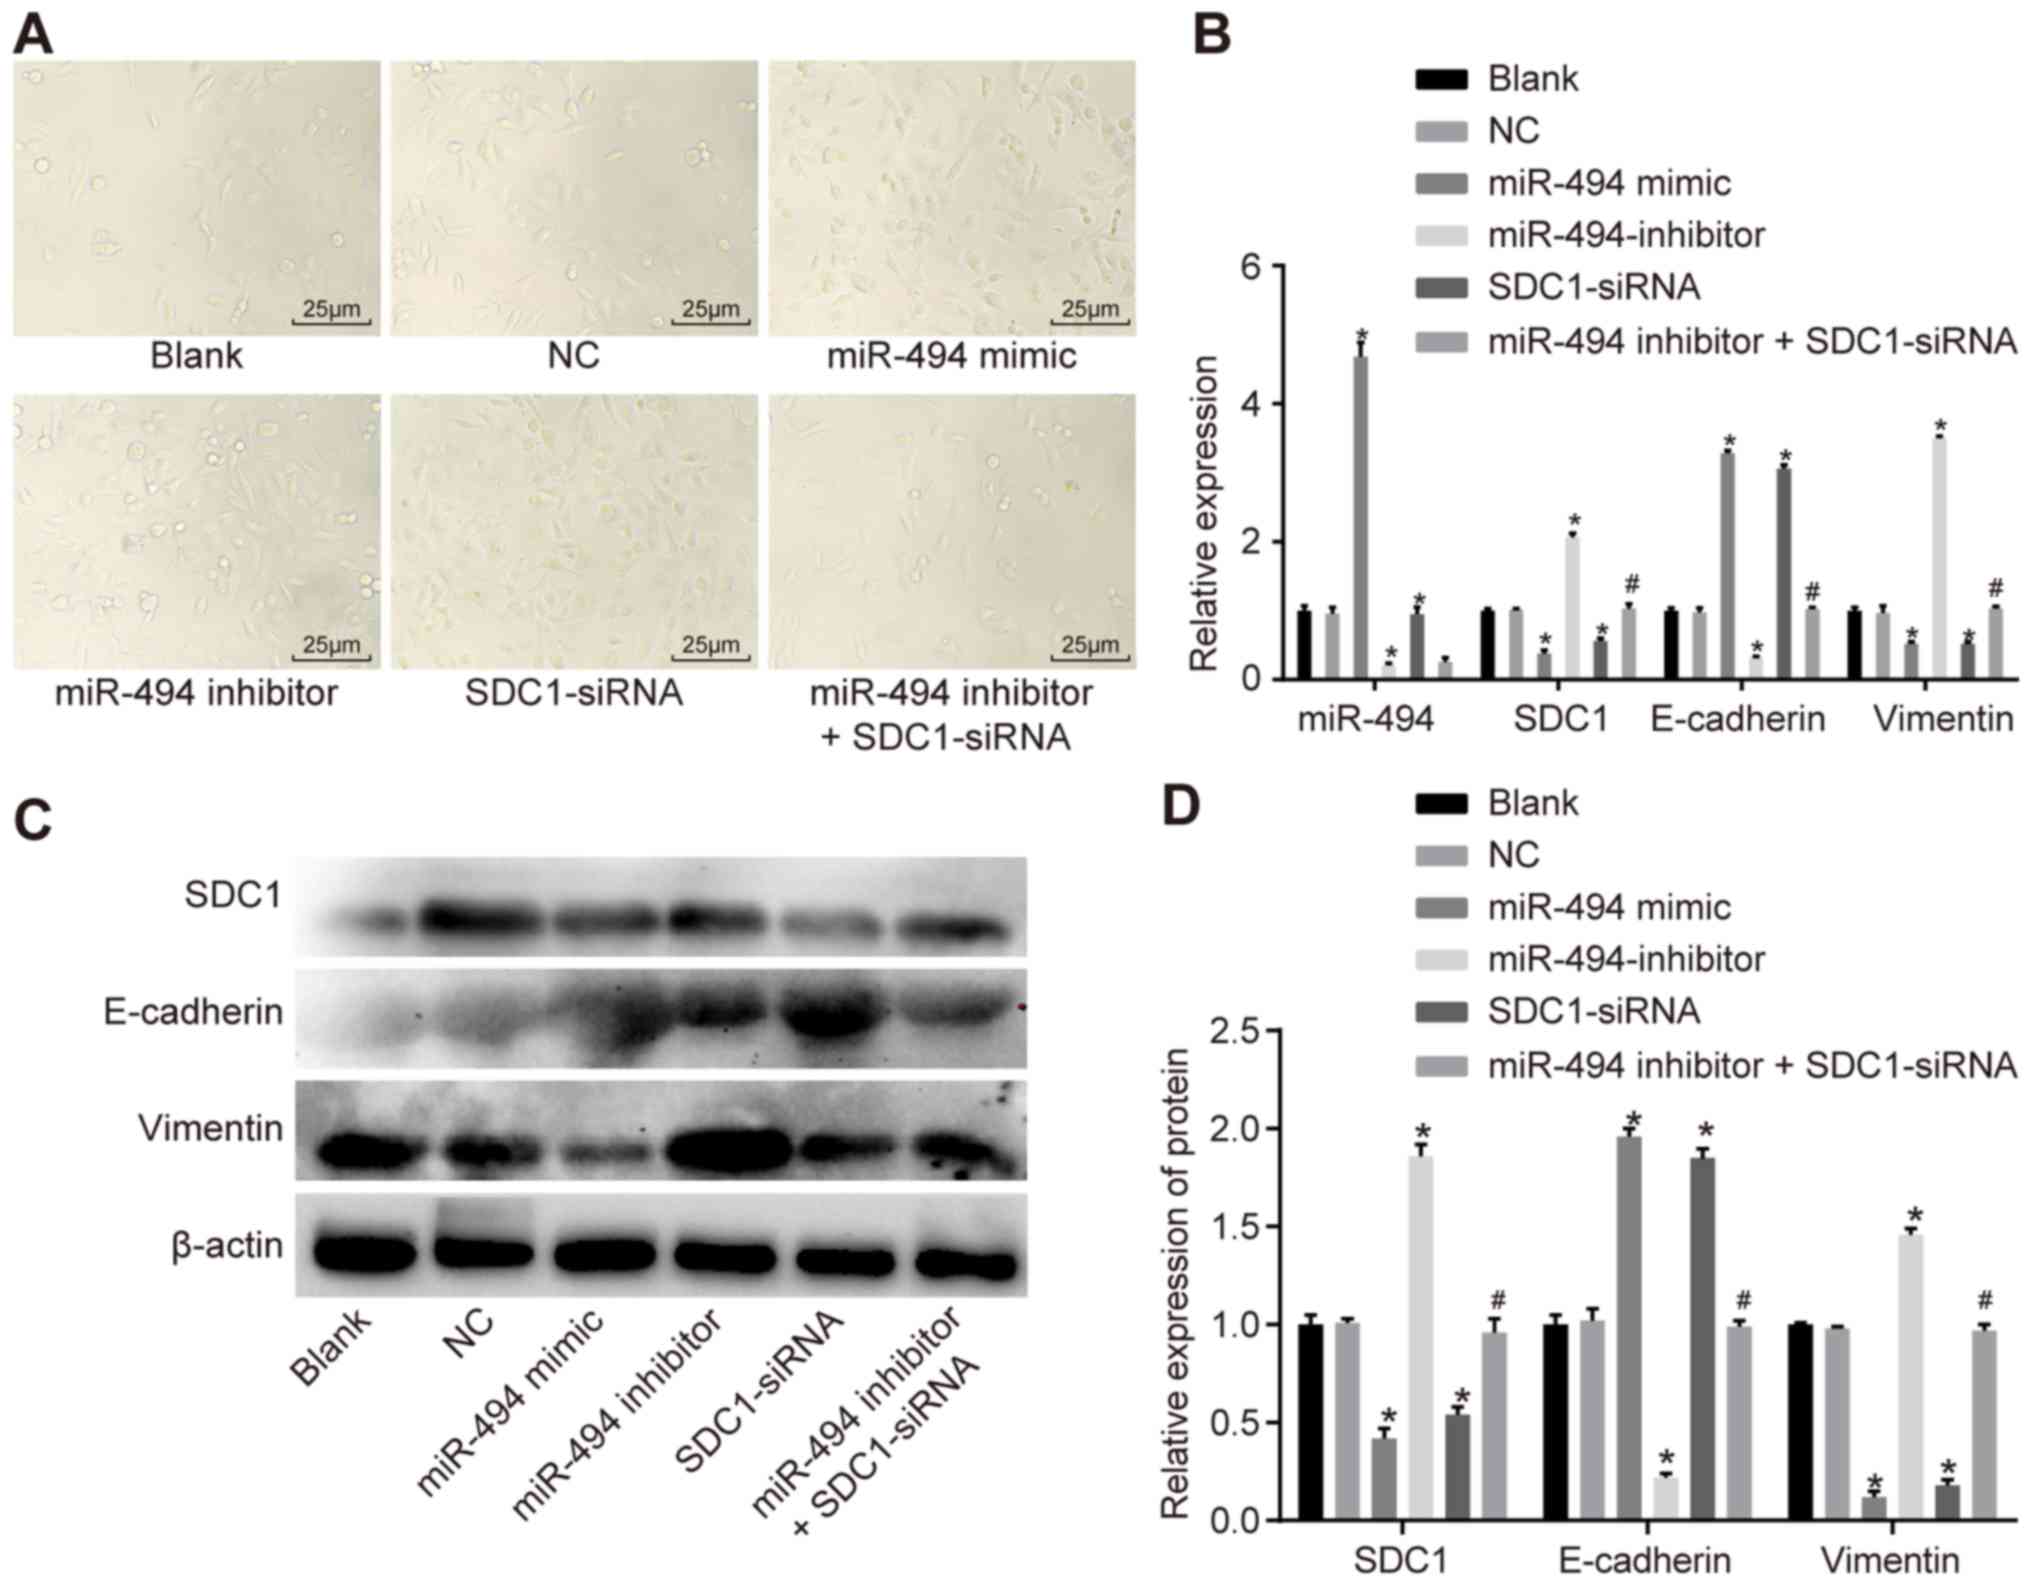 | Figure 4RT-qPCR and western blot analysis
were used to demonstrate that miR-494 overexpression inhibits EMT
in PC cells. (A) Morphology of SW1990 cells (magnification, ×400).
(B) RT-qPCR was used to determine the relative expression of
miR-494, SDC1, E-cadherin and Vimentin. (C) Grey value of SDC1,
E-cadherin and vimentin. (D) Western blot analysis was used to
determine the relative expression of miR-494, SDC1, E-cadherin and
vimentin. *P<0.05 vs. the blank and NC groups;
#P<0.05 vs. the miR-494 inhibitor group; NC, negative
control; miR-494, microRNA-494; SDC1, syndecan-1; RT-qPCR, reverse
transcription quantitative polymerase chain reaction. The data are
presented as mean ± standard deviation, analyzed by one-way ANOVA.
The experiment was independently repeated 3 times. |
RT-qPCR was performed to assess the mRNA expression
levels of SDC1, E-cadherin and vimentin in the SW1990 cells, while
western blot analysis was employed to measure protein expression
(Fig. 4B–D). No significant
differences were observed in miR-494, SDC1, E-cadherin or vimentin
expression between the blank and NC groups (P>0.05). Compared
with the blank and NC groups, the expression of miR-494 was
increased in the miR-494 mimic group, whereas it was decreased in
the miR-494 inhibitor and miR-494 inhibitor + SDC1-siRNA groups.
Compared with the blank and NC groups, the mRNA and protein levels
of SDC1 and vimentin were decreased in the miR-494 mimic and
SDC1-siRNA groups, while the expression of E-cadherin was increased
(P<0.05); elevated mRNA and protein levels of SDC1 and vimentin
were observed in the miR-494 inhibitor group, while the expression
of E-cadherin was decreased (P<0.05). The mRNA and protein
levels of SDC1 and vimentin were lower in the miR-494 inhibitor +
SDC1-siRNA group compared with the miR-494 inhibitor group, whereas
the expression of E-cadherin was increased (P<0.05). Taken
together, these results suggested that miR-494 overexpression and
SDC1 knockdown inhibited EMT in the SW1990 cells, whereas miR-494
knockdown promoted EMT.
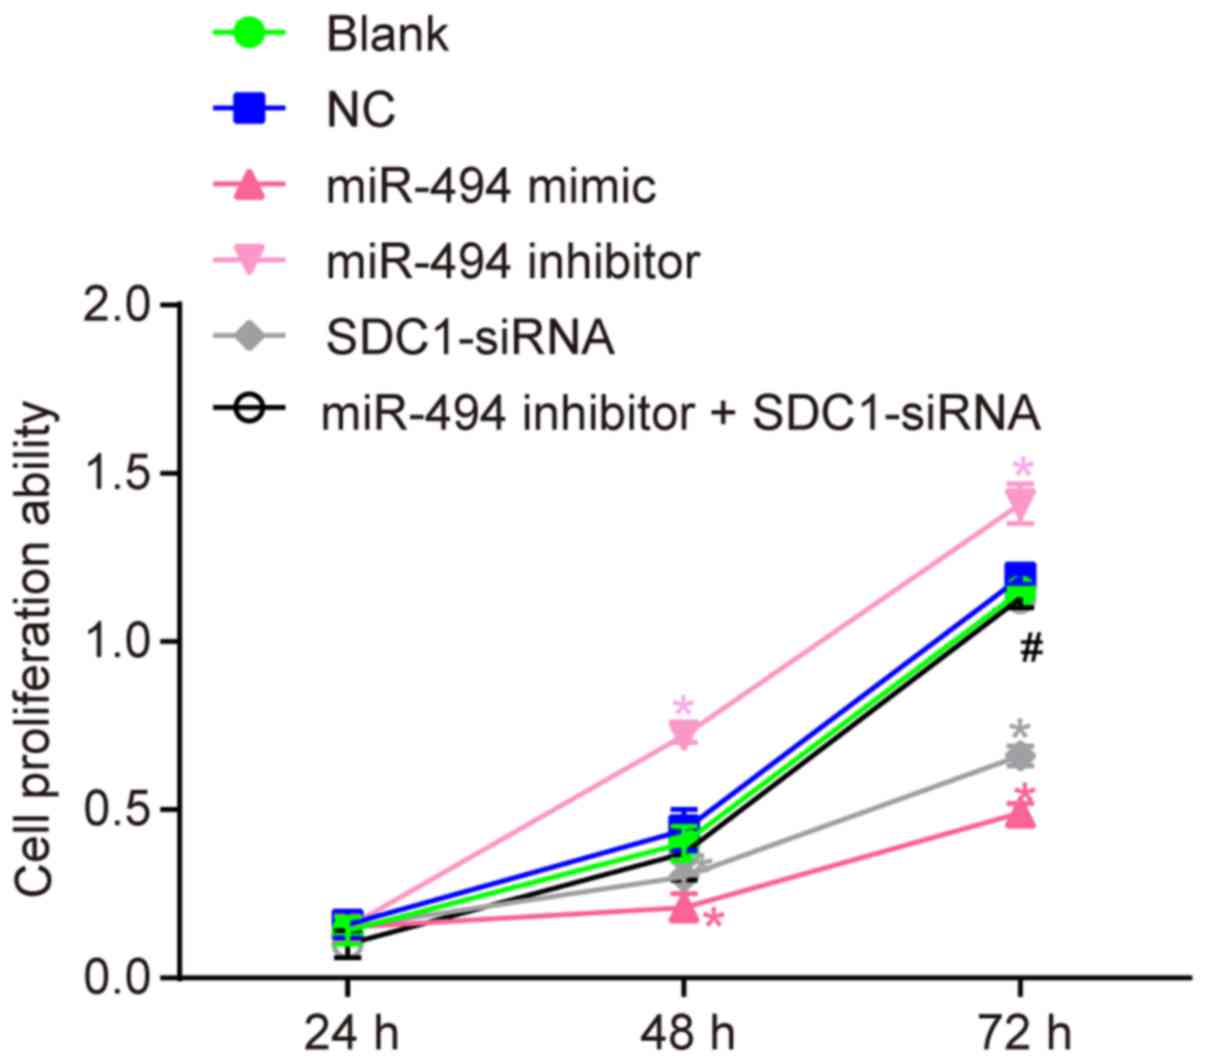
miR-494 overexpression suppresses SW1990
cell proliferation by inhibiting SDC1 expression
To better understand the effects of miR-494 on the
proliferation of SW1990 cells, a CCK-8 assay was performed. The
results (Fig. 5) revealed no
significant difference in cell proliferation between the blank and
NC groups (P>0.05). Compared with the blank and NC groups, cell
growth was decreased in the miR-494 mimic and SDC1-siRNA groups, as
indicated by a lower A450 value at 48 and 72 h (P<0.05).
Furthermore, the A450 value was increased in the miR-494 inhibitor
group (P<0.05). Compared with the miR-494 inhibitor group, cell
proliferation was decreased in the miR-494 inhibitor + SDC1-siRNA
group (P<0.05). These results suggest that miR-494
overexpression or SDC1 silencing suppresses the proliferation of
SW1990 cells in vitro. miR-494 silencing enhances cell
proliferation, while transfection with SDC1-siRNA reverses this
effect.
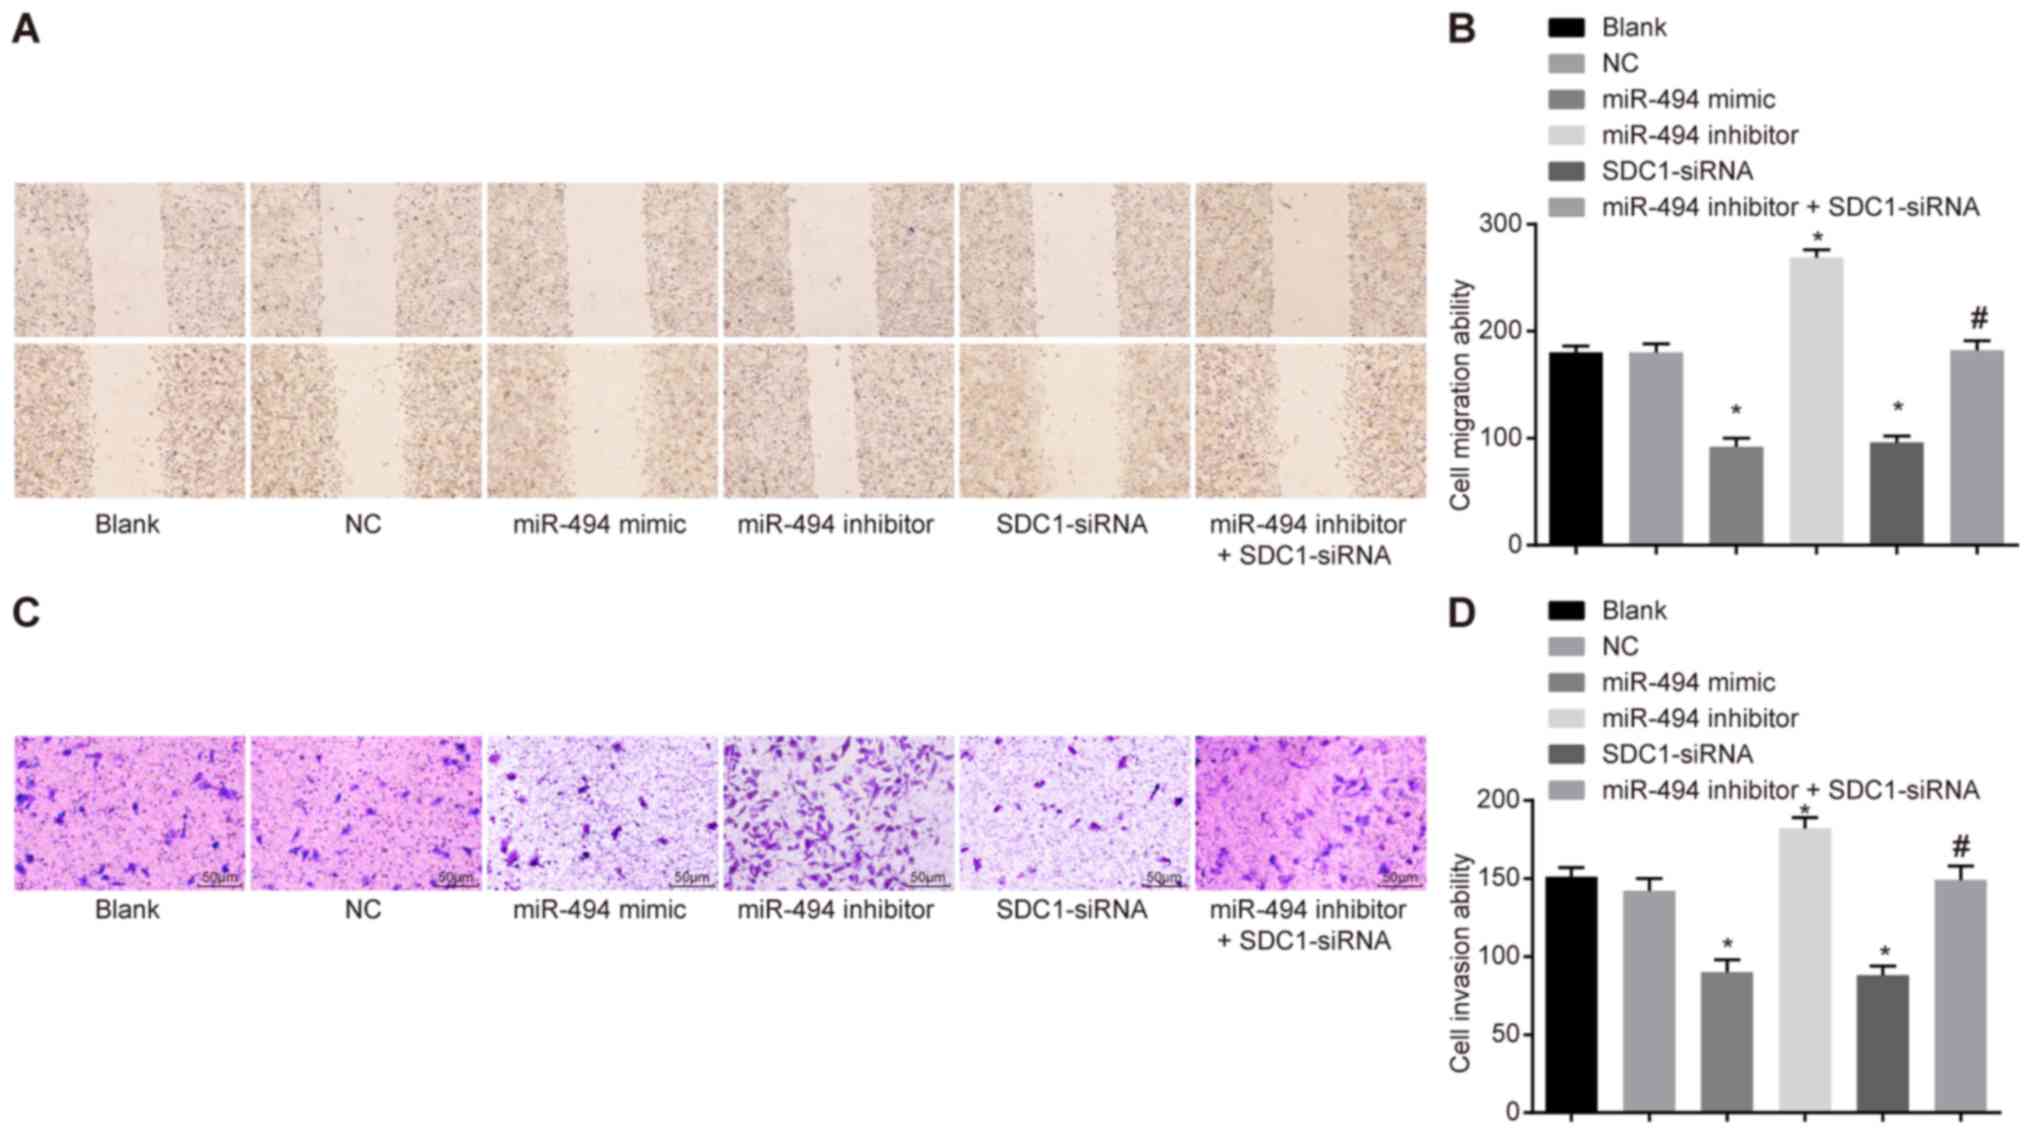
miR-494 overexpression inhibits SW1990
cell migration and invasion by deregulating SDC1
A scratch test and Transwell assay were conducted to
assess the role of miR-494 in the migration and invasion of SW1990
cells. The results (Fig. 6)
revealed that, compared with the blank and NC groups, cell
migration and invasion were significantly reduced in the miR-494
mimic and SDC1-siRNA groups, whereas they were elevated in the
miR-494 inhibitor group (P<0.05). The miR-494 inhibitor +
SDC1-siRNA group exhibited no significant difference in terms of
cell migration and invasion in comparison with the blank and NC
groups; however, the miR-494 inhibitor + SDC1-siRNA group exhibited
reduced cell migration and invasion compared with the miR-494
inhibitor group. These results suggest that miR-494 overexpression
or SDC1 silencing suppresses the migration of SW1990 cells in
vitro, while miR-494 silencing enhances cell migration. The
effects of miR-494 silencing can be reversed by transfection with
SDC1-siRNA.
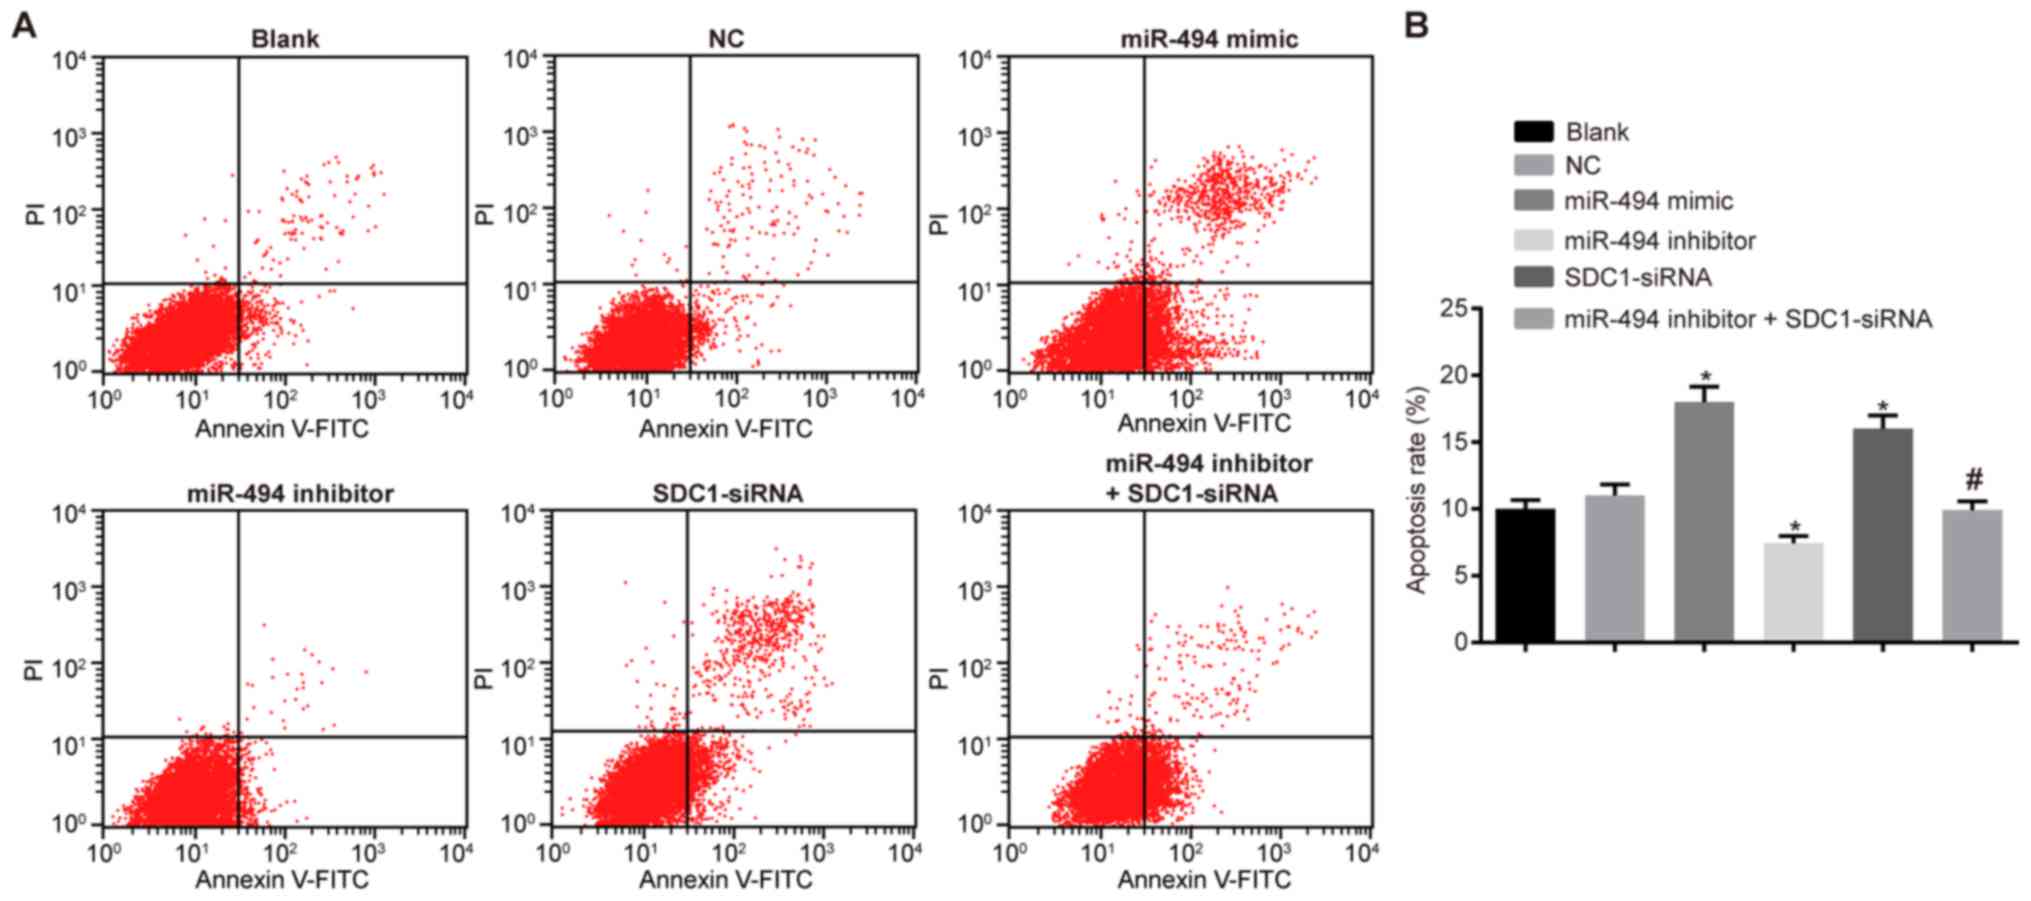
miR-494 overexpression or SDC1 silencing
promotes the apoptosis of SW1990 cells
Flow cytometry was used to detect the cell cycle
distribution and apoptosis. The results (Table III and Fig. 7) revealed that there were an
increased number of cells in the G0/G1 phase and a decreased number
in the S and G2/M phases in the miR-494 mimic and SDC1-siRNA groups
compared with the blank and NC groups (P<0.05). A reduced number
of cells was observed in all phases in the miR-494 inhibitor group
and apoptosis was also reduced (P<0.05). Compared with the
miR-494 inhibitor group, a significant increase in the number of
cells in the G0/G1 phase was observed in the miR-494 inhibitor +
SDC1-siRNA group; furthermore, cell apoptosis was increased and the
number of cells in S and G2/M phase was decreased (P<0.05).
Together, these results suggest that miR-494 overexpression or SDC1
silencing promotes the apoptosis of SW1990 cells; miR-494 silencing
exerts an anti-apoptotic effect on the SW1990 cells, and this is
reversed by transfection with SDC1-siRNA.
| Table IIIComparisons of cell number in G0/G1,
S and G2/M phases using flow cytometry. |
Table III
Comparisons of cell number in G0/G1,
S and G2/M phases using flow cytometry.
| Groups | G0/G1 phase | S phase | G2/M phase |
|---|
| Blank | 44.06±1.74 | 33.24±3.18 | 21.69±1.45 |
| NC | 44.24±1.46 | 35.29±2.13 | 20.47±1.3 |
| miR-494 mimic | 76.92±6.19a | 9.68±5.59a | 13.40±0.69a |
| SDC1-siRNA | 70.42±5.45a | 15.46±4.89a | 14.12±0.56a |
| miR-494
inhibitor | 31.62±3. 90b | 5.75±1.21b | 9.46±1.65b |
| miR-494 inhibitor +
SDC1-siRNA | 43.35±5.65b,c | 35.38±5.86b,c | 21.27±1.34b,c |
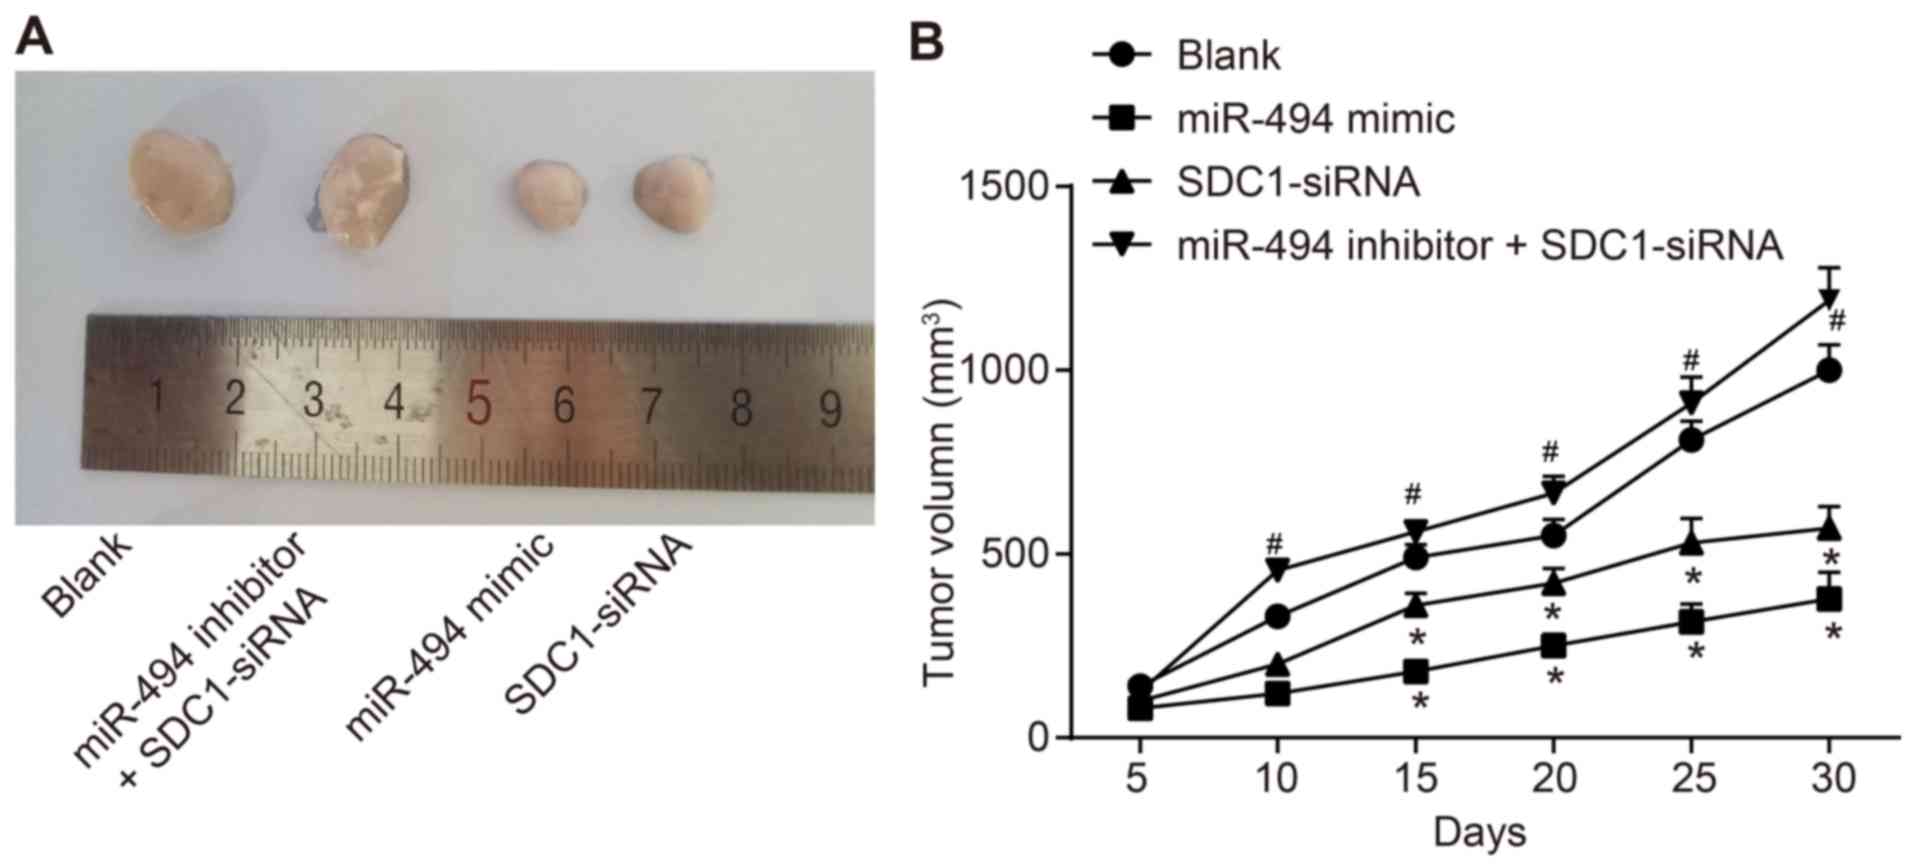
miR-494 overexpression or SDC1 silencing
inhibits tumor growth
Finally, in order to verify the effects of miR-494
in PC cells in vivo, we injected transfected PC cells into
nude mice to observe tumorigenesis. As shown in Fig. 8, tumor volumes were lower in the
miR-494 mimic and the SDC1-siRNA groups compared with the blank
group. Tumor volumes in the miR-494 inhibitor + SDC1-siRNA group
were significantly increased compared with the SDC1-siRNA group
(P<0.05). In conclusion, miR-494 overexpression or SDC1
silencing inhibits tumor growth.
Discussion
PC treatment remains a major challenge due to the
aggressive progression and high degree of chemoresistance observed
in this type of cancer (3,32). Despite advances in treatment
methods, the 5-year survival of patients with PC remains ≤5%
(33). Thus, the development of
novel treatment strategies for PC is of great importance. The
finding of this study that miR-494 suppresses the biological
behaviors of PC cells suggests that miR-494 may be a potential
target for PC treatment.
Our results demonstrated that the expression of
miR-494 was downregulated and that of SDC1 was upregulated in PC
tissues. A recent study reported that miR-494 expression was
decreased in gastric carcinoma (GC), indicating that miR-494 can
act as an anti-oncogene and plays a role in the pathogenesis of GC
(34). Similarly, another study
demonstrated that miR-494 was downregulated in oral cancer compared
to normal tissues (35). miR-494
expression was found to be associated with tumor progression and
has potential as a predictor of a poor prognosis of patients with
PC (36). In addition,
significantly elevated SDC1 serum levels have been reported in
advanced prostate cancer, suggesting that SDC1 shedding is involved
in tumor progression (37). The
SDC1 expression profile was also found to be significant in
colorectal cancer, and may be of use for identifying aggressive
colorectal carcinoma (38). Based
on these data reported, it can be concluded that patients with PC
may exhibit miR-494 downregulation, but an increased level of
SDC1.
Vimentin, a major intermediate filament protein, is
often overexpressed in epithelial cancers, such as prostate cancer,
breast cancer, lung cancer, gastrointestinal tumors and malignant
melanomas. Furthermore, vimentin overexpression is typically
associated with elevated tumor growth and a poor patient prognosis
(39). Vimentin has received
attention as a canonical biomarker of EMT (40). Furthermore, its expression is
associated with motile prostate cancer cell lines (41), and vimentin overexpression can
reduce tumor invasive activity and cell motility via inhibiting
PC-3 cells (42). The specific EMT
markers of a decreased E-cadherin and an increased vimentin
expression are associated with a poor survival (43,44)
and invasion (45). Moreover, a
previous study reported that transfection with miR-494 mimics
upregulated E-cadherin expression and downregulated the expression
of N-cadherin and Vimentin in breast cancer cells (46). SDC2 is able to include
extracellular E-cadherin shedding, changing the fibroblast-like
morphology in colon cancer cell lines (47). Taken together, these reports
suggest that miR-494 overexpression or SDC1 silencing decreases
vimentin expression, and elevates E-cadherin expression, suggesting
that miR-494 can suppress EMT, and the migration and invasion of PC
cells.
In this study, following transfection with miR-494
mimics and SDC1-siRNA, the cell growth rate, migration and invasion
were decreased, while cell apoptosis was increased. A previous
study revealed that a reduced miR-494 expression in PC tissues was
associated with tumor progression (36). Furthermore, it has been reported
that miR-494 expression is notably decreased in PC tissues, as well
as in cell lines, and miR-494 overexpression can significantly
suppress PC cell proliferation in vitro and in vivo
by inducing apoptosis, senescence and G1-phase arrest (48). miR-494 can inhibit tumorigenesis in
breast cancer by targeting PAK1, in gastrointestinal stromal tumors
by targeting KIT and in non-small-cell lung cancer by targeting
c-Myc (17,49-51).
However, the role of miR-494 in cancer cell proliferation may be
reversed; by targeting PTEN and BIM, miR-494 contributes to the
development of hepatocellular carcinoma and non-small-cell lung
cancer, respectively (51,52). Based on these reports, the results
of the present study require further validation. In the present
study, SDC1 was identified as a target gene of miR-494, while
miR-494 was able to negatively target SDC1, suggesting a reciprocal
role. Moreover, we hypothesized that miR-494 suppressed EMT, and
the migration and invasion of PC cells by inhibiting SDC1. The
results of the present study indicate that SDC1 is a functionally
linked target gene regulated by miR-494 in PC, suggesting that
miR-494 may be used as a novel vertical blockade agent for the
treatment of PC. However, there are limitations. miR-494 can also
impact PDAC progression via forkhead box protein M1 (FOXM1),
NAD-dependent deacetylase sirtuin-1 (SIRT1) and c-Myc (48,53),
suggesting that other genes should be considered when evaluating
the involvement of miR-494 in PC. As such, further studies are
required to validate the results of the present study and gain a
broader understanding of the role of miR-494 in PC.
Acknowledgments
The authors would like to thank all the individuals
that provided technical assistance and valuable advice.
References
|
1
|
Wolfgang CL, Herman JM, Laheru DA, Klein
AP, Erdek MA, Fishman EK and Hruban RH: Recent progress in
pancreatic cancer. CA Cancer J Clin. 63:318–348. 2013. View Article : Google Scholar : PubMed/NCBI
|
|
2
|
Ohno K, Nishimori H, Yasoshima T,
Kamiguchi K, Hata F, Fukui R, Okuya K, Kimura Y, Denno R, Kon S, et
al: Inhibition of osteopontin reduces liver metastasis of human
pancreatic cancer xenografts injected into the spleen in a mouse
model. Surg Today. 40:347–356. 2010. View Article : Google Scholar : PubMed/NCBI
|
|
3
|
Kunnimalaiyaan S, Trevino J, Tsai S,
Gamblin TC and Kunnimalaiyaan M: Xanthohumol-mediated suppression
of Notch1 signaling is associated with antitumor activity in human
pancreatic cancer cells. Mol Cancer Ther. 14:1395–1403. 2015.
View Article : Google Scholar : PubMed/NCBI
|
|
4
|
Maupin KA, Sinha A, Eugster E, Miller J,
Ross J, Paulino V, Keshamouni VG, Tran N, Berens M, Webb C, et al:
Glycogene expression alterations associated with pancreatic cancer
epithelial-mesenchymal transition in complementary model systems.
PLoS One. 5:e130022010. View Article : Google Scholar : PubMed/NCBI
|
|
5
|
Hotz B, Arndt M, Dullat S, Bhargava S,
Buhr HJ and Hotz HG: Epithelial to mesenchymal transition:
Expression of the regulators snail, slug, and twist in pancreatic
cancer. Clin Cancer Res. 13:4769–4776. 2007. View Article : Google Scholar : PubMed/NCBI
|
|
6
|
Sabbah M, Emami S, Redeuilh G, Julien S,
Prévost G, Zimber A, Ouelaa R, Bracke M, De Wever O and Gespach C:
Molecular signature and therapeutic perspective of the
epithelial-to-mesen-chymal transitions in epithelial cancers. Drug
Resist Updat. 11:123–151. 2008. View Article : Google Scholar : PubMed/NCBI
|
|
7
|
Yang J and Weinberg RA:
Epithelial-mesenchymal transition: At the crossroads of development
and tumor metastasis. Dev Cell. 14:818–829. 2008. View Article : Google Scholar : PubMed/NCBI
|
|
8
|
Buck E, Eyzaguirre A, Barr S, Thompson S,
Sennello R, Young D, Iwata KK, Gibson NW, Cagnoni P and Haley JD:
Loss of homotypic cell adhesion by epithelial-mesenchymal
transition or mutation limits sensitivity to epidermal growth
factor receptor inhibition. Mol Cancer Ther. 6:532–541. 2007.
View Article : Google Scholar : PubMed/NCBI
|
|
9
|
Thomson S, Buck E, Petti F, Griffin G,
Brown E, Ramnarine N, Iwata KK, Gibson N and Haley JD: Epithelial
to mesenchymal transition is a determinant of sensitivity of
non-small-cell lung carcinoma cell lines and xenografts to
epidermal growth factor receptor inhibition. Cancer Res.
65:9455–9462. 2005. View Article : Google Scholar : PubMed/NCBI
|
|
10
|
Hruban RH and Adsay NV: Molecular
classification of neoplasms of the pancreas. Hum Pathol.
40:612–623. 2009. View Article : Google Scholar : PubMed/NCBI
|
|
11
|
Vincent A, Herman J, Schulick R, Hruban RH
and Goggins M: Pancreatic cancer. Lancet. 378:607–620. 2011.
View Article : Google Scholar : PubMed/NCBI
|
|
12
|
Gutt R, Liauw SL and Weichselbaum RR: The
role of radiotherapy in locally advanced pancreatic carcinoma. Nat
Rev Gastroenterol Hepatol. 7:437–447. 2010. View Article : Google Scholar : PubMed/NCBI
|
|
13
|
Shen Y, Pan Y, Xu L, Chen L, Liu L, Chen
H, Chen Z and Meng Z: Identifying microRNA-mRNA regulatory network
in gemcitabine-resistant cells derived from human pancreatic cancer
cells. Tumour Biol. 36:4525–4534. 2015. View Article : Google Scholar : PubMed/NCBI
|
|
14
|
Zhang XJ, Ye H, Zeng CW, He B, Zhang H and
Chen YQ: Dysregulation of miR-15a and miR-214 in human pancreatic
cancer. J Hematol Oncol. 3:462010. View Article : Google Scholar : PubMed/NCBI
|
|
15
|
Esquela-Kerscher A and Slack FJ: Oncomirs
- microRNAs with a role in cancer. Nat Rev Cancer. 6:259–269. 2006.
View Article : Google Scholar : PubMed/NCBI
|
|
16
|
Volinia S, Calin GA, Liu CG, Ambs S,
Cimmino A, Petrocca F, Visone R, Iorio M, Roldo C, Ferracin M, et
al: A microRNA expression signature of human solid tumors defines
cancer gene targets. Proc Natl Acad Sci USA. 103:2257–2261. 2006.
View Article : Google Scholar : PubMed/NCBI
|
|
17
|
Budhu A, Ji J and Wang XW: The clinical
potential of microRNAs. J Hematol Oncol. 3:372010. View Article : Google Scholar : PubMed/NCBI
|
|
18
|
Kim WK, Park M, Kim YK, Tae YK, Yang HK,
Lee JM and Kim H: MicroRNA-494 downregulates KIT and inhibits
gastrointestinal stromal tumor cell proliferation. Clin Cancer Res.
17:7584–7594. 2011. View Article : Google Scholar : PubMed/NCBI
|
|
19
|
Ohdaira H, Sekiguchi M, Miyata K and
Yoshida K: MicroRNA-494 suppresses cell proliferation and induces
senescence in A549 lung cancer cells. Cell Prolif. 45:32–38. 2012.
View Article : Google Scholar
|
|
20
|
Parimon T, Brauer R, Schlesinger SY, Xie
T, Jiang D, Ge L, Huang Y, Birkland TP, Parks WC, Habiel DM, et al:
Syndecan-1 controls lung tumorigenesis by regulating miRNAs
packaged in exosomes. Am J Pathol. 188:1094–1103. 2018. View Article : Google Scholar : PubMed/NCBI
|
|
21
|
Gharbaran R: Advances in the molecular
functions of syndecan-1 (SDC1/CD138) in the pathogenesis of
malignancies. Crit Rev Oncol Hematol. 94:1–17. 2015. View Article : Google Scholar : PubMed/NCBI
|
|
22
|
Akl MR, Nagpal P, Ayoub NM, Prabhu SA,
Gliksman M, Tai B, Hatipoglu A, Goy A and Suh KS: Molecular and
clinical profiles of syndecan-1 in solid and hematological cancer
for prognosis and precision medicine. Oncotarget. 6:28693–28715.
2015. View Article : Google Scholar : PubMed/NCBI
|
|
23
|
Hashimoto Y, Skacel M and Adams JC:
Association of loss of epithelial syndecan-1 with stage and local
metastasis of colorectal adenocarcinomas: An immunohistochemical
study of clinically annotated tumors. BMC Cancer. 8:1852008.
View Article : Google Scholar : PubMed/NCBI
|
|
24
|
Lundin M, Nordling S, Lundin J, Isola J,
Wiksten JP and Haglund C: Epithelial syndecan-1 expression is
associated with stage and grade in colorectal cancer. Oncology.
68:306–313. 2005. View Article : Google Scholar : PubMed/NCBI
|
|
25
|
Lee SH, Choi EJ, Kim MS, Park JW, Lee YS,
Kim SY and Kang CS: Prognostic significance of syndecan-1
expression in squamous cell carcinoma of the tonsil. Int J Clin
Oncol. 19:247–253. 2014. View Article : Google Scholar
|
|
26
|
Lendorf ME, Manon-Jensen T, Kronqvist P,
Multhaupt HA and Couchman JR: Syndecan-1 and syndecan-4 are
independent indicators in breast carcinoma. J Histochem Cytochem.
59:615–629. 2011. View Article : Google Scholar : PubMed/NCBI
|
|
27
|
Kusumoto T, Kodama J, Seki N, Nakamura K,
Hongo A and Hiramatsu Y: Clinical significance of syndecan-1 and
versican expression in human epithelial ovarian cancer. Oncol Rep.
23:917–925. 2010.PubMed/NCBI
|
|
28
|
Ma Y, Wu Q, Li X, Gu X, Xu J and Yang J:
Pancreatic cancer: From bench to bedside. Ann Transl Med.
4:4582016. View Article : Google Scholar
|
|
29
|
Qian CN, Furge KA, Knol J, Huang D, Chen
J, Dykema KJ, Kort EJ, Massie A, Khoo SK, Vanden Beldt K, et al:
Activation of the PI3K/AKT pathway induces urothelial carcinoma of
the renal pelvis: Identification in human tumors and confirmation
in animal models. Cancer Res. 69:8256–8264. 2009. View Article : Google Scholar : PubMed/NCBI
|
|
30
|
Zhu HN, Zhang SZ, Zhou YK, Wang CL and Wu
XB: Cloning and sequence analysis of the coding sequence of β-actin
cDNA from the Chinese alligator and suitable internal reference
primers from the β-actin gene. Genet Mol Res. 14:12159–12167. 2015.
View Article : Google Scholar : PubMed/NCBI
|
|
31
|
Livak KJ and Schmittgen TD: Analysis of
relative gene expression data using real-time quantitative PCR and
the 2(-Delta Delta C(T)) method. Methods. 25:402–408. 2001.
View Article : Google Scholar
|
|
32
|
Michl P and Gress TM: Current concepts and
novel targets in advanced pancreatic cancer. Gut. 62:317–326. 2013.
View Article : Google Scholar
|
|
33
|
Saleem M, Kaur S, Kweon MH, Adhami VM,
Afaq F and Mukhtar H: Lupeol, a fruit and vegetable based
triterpene, induces apoptotic death of human pancreatic
adenocarcinoma cells via inhibition of Ras signaling pathway.
Carcinogenesis. 26:1956–1964. 2005. View Article : Google Scholar : PubMed/NCBI
|
|
34
|
He W, Li Y, Chen X, Lu L, Tang B, Wang Z,
Pan Y, Cai S, He Y and Ke Z: miR-494 acts as an anti-oncogene in
gastric carcinoma by targeting c-myc. J Gastroenterol Hepatol.
29:1427–1434. 2014. View Article : Google Scholar : PubMed/NCBI
|
|
35
|
Libório-Kimura TN, Jung HM and Chan EK:
miR-494 represses HOXA10 expression and inhibits cell proliferation
in oral cancer. Oral Oncol. 51:151–157. 2015. View Article : Google Scholar
|
|
36
|
Ma YB, Li GX, Hu JX, Liu X and Shi BM:
Correlation of miR-494 expression with tumor progression and
patient survival in pancreatic cancer. Genet Mol Res.
14:18153–18159. 2015. View Article : Google Scholar
|
|
37
|
Szarvas T, Reis H, Vom Dorp F,
Tschirdewahn S, Niedworok C, Nyirady P, Schmid KW, Rübben H and
Kovalszky I: Soluble syndecan-1 (SDC1) serum level as an
independent pre-operative predictor of cancer-specific survival in
prostate cancer. Prostate. 76:977–985. 2016. View Article : Google Scholar : PubMed/NCBI
|
|
38
|
Kim SY, Choi EJ, Yun JA, Jung ES, Oh ST,
Kim JG, Kang WK and Lee SH: Syndecan-1 expression is associated
with tumor size and EGFR expression in colorectal carcinoma: A
clinicopathological study of 230 cases. Int J Med Sci. 12:92–99.
2015. View Article : Google Scholar : PubMed/NCBI
|
|
39
|
Satelli A and Li S: Vimentin in cancer and
its potential as a molecular target for cancer therapy. Cell Mol
Life Sci. 68:3033–3046. 2011. View Article : Google Scholar : PubMed/NCBI
|
|
40
|
Thiery JP: Epithelial-mesenchymal
transitions in tumour progression. Nat Rev Cancer. 2:442–454. 2002.
View Article : Google Scholar : PubMed/NCBI
|
|
41
|
Lang SH, Hyde C, Reid IN, Hitchcock IS,
Hart CA, Bryden AA, Villette JM, Stower MJ and Maitland NJ:
Enhanced expression of vimentin in motile prostate cell lines and
in poorly differentiated and metastatic prostate carcinoma.
Prostate. 52:253–263. 2002. View Article : Google Scholar : PubMed/NCBI
|
|
42
|
Zhao Y, Yan Q, Long X, Chen X and Wang Y:
Vimentin affects the mobility and invasiveness of prostate cancer
cells. Cell Biochem Funct. 26:571–577. 2008. View Article : Google Scholar : PubMed/NCBI
|
|
43
|
Javle MM, Gibbs JF, Iwata KK, Pak Y,
Rutledge P, Yu J, Black JD, Tan D and Khoury T:
Epithelial-mesenchymal transition (EMT) and activated extracellular
signal-regulated kinase (p-Erk) in surgically resected pancreatic
cancer. Ann Surg Oncol. 14:3527–3533. 2007. View Article : Google Scholar : PubMed/NCBI
|
|
44
|
Oida Y, Yamazaki H, Tobita K, Mukai M,
Ohtani Y, Miyazaki N, Abe Y, Imaizumi T, Makuuchi H, Ueyama Y, et
al: Increased S100A4 expression combined with decreased E-cadherin
expression predicts a poor outcome of patients with pancreatic
cancer. Oncol Rep. 16:457–463. 2006.PubMed/NCBI
|
|
45
|
Nakajima S, Doi R, Toyoda E, Tsuji S, Wada
M, Koizumi M, Tulachan SS, Ito D, Kami K, Mori T, et al: N-cadherin
expression and epithelial-mesenchymal transition in pancreatic
carcinoma. Clin Cancer Res. 10:4125–4133. 2004. View Article : Google Scholar : PubMed/NCBI
|
|
46
|
Song L, Liu D, Wang B, He J, Zhang S, Dai
Z, Ma X and Wang X: miR-494 suppresses the progression of breast
cancer in vitro by targeting CXCR4 through the Wnt/β-catenin
signaling pathway. Oncol Rep. 34:525–531. 2015. View Article : Google Scholar : PubMed/NCBI
|
|
47
|
Jang B, Jung H, Chung H, Moon BI and Oh
ES: Syndecan-2 enhances E-cadherin shedding and fibroblast-like
morphological changes by inducing MMP-7 expression in colon cancer
cells. Biochem Biophys Res Commun. 477:47–53. 2016. View Article : Google Scholar : PubMed/NCBI
|
|
48
|
Liu Y, Li X, Zhu S, Zhang JG, Yang M, Qin
Q, Deng SC, Wang B, Tian K, Liu L, et al: Ectopic expression of
miR-494 inhibited the proliferation, invasion and chemoresistance
of pancreatic cancer by regulating SIRT1 and c-Myc. Gene Ther.
22:729–738. 2015. View Article : Google Scholar : PubMed/NCBI
|
|
49
|
Zhan MN, Yu XT, Tang J, Zhou CX, Wang CL,
Yin QQ, Gong XF, He M, He JR, Chen GQ, et al: MicroRNA-494 inhibits
breast cancer progression by directly targeting PAK1. Cell Death
Dis. 8:e25292017. View Article : Google Scholar : PubMed/NCBI
|
|
50
|
Yun S, Kim WK, Kwon Y, Jang M, Bauer S and
Kim H: Survivin is a novel transcription regulator of KIT and is
downregulated by miRNA-494 in gastrointestinal stromal tumors. Int
J Cancer. 142:2080–2093. 2018. View Article : Google Scholar :
|
|
51
|
Romano G, Acunzo M, Garofalo M, Di Leva G,
Cascione L, Zanca C, Bolon B, Condorelli G and Croce CM: MiR-494 is
regulated by ERK1/2 and modulates TRAIL-induced apoptosis in
non-small-cell lung cancer through BIM down-regulation. Proc Natl
Acad Sci USA. 109:16570–16575. 2012. View Article : Google Scholar : PubMed/NCBI
|
|
52
|
Liu K, Liu S, Zhang W, Jia B, Tan L, Jin Z
and Liu Y: miR-494 promotes cell proliferation, migration and
invasion, and increased sorafenib resistance in hepatocellular
carcinoma by targeting PTEN. Oncol Rep. 34:1003–1010. 2015.
View Article : Google Scholar : PubMed/NCBI
|
|
53
|
Li L, Li Z, Kong X, Xie D, Jia Z, Jiang W,
Cui J, Du Y, Wei D, Huang S, et al: Down-regulation of microRNA-494
via loss of SMAD4 increases FOXM1 and beta-catenin signaling in
pancreatic ductal adenocarcinoma cells. Gastroenterology.
147:485–497.e418. 2014. View Article : Google Scholar
|