Introduction
The frequency and mortality of colorectal cancer
(CRC) in the United States is markedly higher among African
Americans (AAs) compared with all other ethnic/racial groups
(1). While socioeconomic factors,
such as poor diet and absence of preventive medical care, may be
associated with increased incidence and reduced early detection and
treatment, it has been reported that AAs with high-grade CRCs had a
mortality rate three times higher compared with that in Caucasian
Americans (CAs) after controlling for such factors (2). A number of studies have reported a
30-50% higher rate of CRC mortality in AAs after diagnosis compared
with CAs. Additionally, these studies concluded that racial health
disparity continues to expand in spite of increased CRC screening
(3-8). An important factor necessitating
early detection is the observation that AAs develop and are
diagnosed with CRC at a younger age compared with CAs (9). Furthermore, it has been demonstrated
that variations exist in AA patients, specifically in mutations of
the mismatch repair genes hMLH1 and hMSH2 (10) and the p53 tumor suppressor
gene (11). Altogether, we may
theorize that molecular differences are the impacting influence for
racial disparity in CRC frequency and mortality.
A number of studies defining epigenetic and genetic
differences, as well as chemotherapeutic response in CRC, have been
performed using cell lines derived from CA patients. The general
lack of AA and Hispanic American (HA) CRC cell lines necessitates
the establishment and characterization of cell lines that span
diverse populations for use in functional in vitro and in
vivo analyses to address racial health disparity. To date, CRC
cell lines of AA background are not available, commercially or
otherwise, for academic research purposes. This fact was confirmed
following an exhaustive literature search by our laboratory, as
well as a thorough investigation conducted by the American Type
Culture Collection (ATCC). The protective effects of non-steroidal
anti-inflammatory drugs (NSAIDs) in CRC (12,13)
and the role of the pro-inflammatory cytokines interleukin (IL)-8
and tumor necrosis factor (TNF)-α in cancer progression (14,15)
have been extensively investigated, albeit using predominately CA
CRC cell lines. Concurrently, findings that correlated the effect
of daily intake of NSAIDs (i.e., aspirin) with genetic
polymorphisms in AA (16,17) prompted the need for evaluation of
inflammatory profiles in AA CRC tumor cells with the use of CA CRC
cells as comparative control.
In the present study, we established, characterized
and validated three cancer cell lines derived from AA patients with
CRC. Tissue for the cell line designated CHTN06 was obtained from
the Cooperative Human Tissue Network (CHTN). Tissues for the cell
lines designated SB501 and SB521 were acquired from Stony Brook
University Medical Center (SBUMC). We herein describe the
morphological and genetic properties of all three cell lines using
an array of analyses, including but not limited to microscopy,
reverse transcription-quantitative polymerase chain reaction
(RT-qPCR) and protein expression assays. These results were
directly compared to those of the HT-29, HCT116 and SW480 CRC cell
lines, derived from CA patients and obtained from ATCC. Overall,
the CHTN06, SB501 and SB521 cell lines exhibited fundamental
characteristics of CRC common to the commercially available cell
lines, with several biologically dissimilar features. The
generation and characterization of these cell lines is expected to
provide model systems for studies addressing racial health
disparity, chemoprevention and chemo-responsiveness in CRC.
Materials and methods
Ethics statement
The present study was approved by the Stony Brook
University Institutional Review Board (approval no. 93677). Patient
CRC samples and metadata obtained from CHTN and SBUMC were
completely de-identified, assigned independent patient codes prior
to release to the researchers, and qualified for a waiver of
consent per 45CFR46.116.d.
Tumor cell isolation and establishment in
primary culture
In a sterile tissue culture environment, excess fat
and normal tissue were removed and the remaining tumor was washed
in 1X Hank's Balanced Salt Solution (Sigma-Aldrich, Merck KGaA,
Darmstadt, Germany). Tumors were minced into 1-3-mm3 sections and
incubated in dissociation medium (Sigma-Aldrich; Merck KGaA)
containing Dulbecco's modified Eagle's medium (DMEM)/F12 (1:1;
Corning Cellgro, Manassas, VA, USA) growth medium supplemented with
1 mg/ml collagenase, type IV (Sigma-Aldrich; Merck KGaA), 10% (v/v)
fetal bovine serum (FBS; Atlanta Biologicals, Lawrenceville, GA,
USA), 100 U/ml penicillin, 100 μg/ml streptomycin (both from
Corning Cellgro), 2.5 μg/ml amphotericin B (Life
Technologies; Thermo Fisher Scientific, Auckland, New Zealand), 100
μg/ml gentamycin, 10 ng/ml insulin (both from Sigma-Aldrich;
Merck KGaA) and 10 μg/ml ciprofloxacin (GenHunter,
Nashville, TN, USA). Dissociated tissue was filtered through a
100-μm cell strainer (BD Biosciences, Bedford, MA, USA) to
remove undigested tissue fragments and washed in phosphate-buffered
saline (PBS; Corning Cellgro). Cells were cultured in primary
growth medium in a humidified incubator at 37°C in 5.0%
CO2. Primary growth medium consisted of DMEM (Corning
Cellgro) supplemented with 10% FBS, 100 U/ml penicillin, 100 U/ml
streptomycin, 15 μg/ml ciprofloxacin, 2.5 μg/ml
amphotericin B, 50 μg/ml gentamycin, 0.25 ng/ml epidermal
growth factor, 1% insulin, 5 mg/ml transferrin and 20 μg/ml
selenium (all from Sigma-Aldrich; Merck KGaA).
The CRC cell lines HT-29, HCT116 and SW480 were
commercially obtained from ATCC (Manassas, VA, USA). Each cell line
was maintained in its respective culture media as defined by ATCC:
McCoy's 5A, F-12K, or DMEM (Corning Cellgro) supplemented with 10%
FBS, 100 U/ml penicillin and 100 μg/ml streptomycin. Cells
were cultured in a humidified incubator at 37°C in 5.0%
CO2.
Transmission electron microscopy
(TEM)
CHTN06, SB501 and SB521 samples used for TEM were
processed using standard techniques. Briefly, cells were grown on
gridded ACLAR (Electron Microscopy Sciences, Fort Washington, PA,
USA), a copolymer film commonly used in electron microscopy, and
fixed in 2.5% electron microscopy-grade glutaraldehyde in 0.1 M PBS
(pH 7.4). The samples were then placed in 1.0% osmium tetroxide in
0.1 M PBS (pH 7.4), dehydrated in a gradient series of ethyl
alcohol and embedded in Durcupan resin (Sigma-Aldrich; Merck KGaA).
Ultrathin sections (80 nm) were cut with a Leica EM UC7
ultramicrotome (Leica Microsystems Inc., Buffalo Grove, IL, USA)
and placed on Formvar-coated single-slot copper grids. The sections
were then counterstained with uranyl acetate and lead citrate. The
samples were imaged using a FEI Tecnai12 BioTwinG2
transmission electron microscope (Field Emission Inc., Hillsboro,
OR, USA) and digital images were acquired with an AMT XR-60 CCD
Digital Camera system (Advanced Microscopy Techniques, Woburn, MA,
USA).
Karyotyping
Mitotic cells were arrested in metaphase by
treatment with 0.5 μg/ml demecolcine (Sigma-Aldrich; Merck
KGaA) for 3 h in a humidified incubator at 37°C in 5.0%
CO2. Harvested cells were then made turgid by incubating
in hypotonic buffer for 45 min at 37°C and subsequently fixed in
Carnoy's fixative (3:1, methanol:glacial acetic acid). Cells were
spread onto microscopy slides and adhered by drying over a hot
plate. Chromosomes were stained with DAPI (Sigma-Aldrich; Merck
KGaA) and imaged using a Nikon Eclipse 90i microscope (Instruments,
Inc.; Edgewood, NY, USA) at a magnification of ×60.
Cell viability/proliferation assay
Cell viability/proliferation was measured using the
3-(4,5-dimethylthiazol-2-yl)-2,5-diphenyltetrazolium bromide (MTT)
colorimetric assay according to the manufacturer's protocol
(Sigma-Aldrich; Merck KGaA). Cells were seeded in 96-well tissue
culture-treated plates at a density of 1×10⁴ cells/well
and cultured overnight at 37°C in 5.0% CO2. MTT reagent
I was added to each well and incubated at 37°C in 5.0%
CO2 for 4 h, after which time the MTT reagent II
solubilization solution was added. Samples treated with reagents
were incubated overnight at 37°C in 5.0% CO2. Optical
density, defining cell viability/proliferation, was determined
using a SpectraMax i3 spectrophotometer plate reader (Molecular
Devices, Sunnyvale, CA, USA) at 590 nm. Results obtained from the
MTT proliferation assay were validated using the trypan blue
(Corning Cellgro) exclusion method.
Cell invasion assay
Invasion assays were conducted in triplicate using
BioCoat™ Matrigel© invasion chambers (BD Biosciences)
with pre-coated 8.0-μM mesh membrane inserts. FBS (10%) in
McCoy's 5A medium was used as the chemoattractant in the outer
chamber of the well for the HT-29 and HCT116 cell lines, whereas
DMEM supplemented with 10% FBS was used for the three AA CRC cell
lines. For all cell lines, 5×10⁴ cells/ml were suspended
in their respective medium with 0.5% FBS, seeded into the inner
chamber of the well and incubated at 37°C in 5.0% CO2
for 24 h. After incubation, non-invading cells were aspirated from
the chamber and the Matrigel© layer was removed from the
mesh membranes. Invading cells entrapped in the membrane were fixed
with 100% methanol and stained with 0.5% crystal violet solution
(Sigma-Aldrich; Merck KGaA). For each membrane, 8 fields of view at
×20 under a phase-contrast microscope were quantified and
averaged.
Histological and morphological evaluation
of tumors
All animals were treated strictly in accordance with
the National Institutes of Health guidelines for the care and use
of laboratory animals, and the protocols used were approved by the
Institutional Animal Care and Use Committee at the State University
of New York at Stony Brook (IACUC; Animal Welfare Assurance no.
A3011-01). Female NOD SCID mice, aged 5-6 weeks (Harlan
Laboratories, Indianapolis, IN, USA), were subcutaneously injected
with cells in 100 μl PBS into each flank (left and right).
One mouse (~25 gr) per cell line was used to generate the original
xenografts. One mouse was used for generation of each subsequent
passage (up to F4). All animals were maintained under controlled
conditions (21°C and 50% relative humidity in a 12-h light/dark
cycle), fed ad libitum with free access to water and
examined at least twice daily. Tumors were generated either
singularly in one flank, or bilaterally in the left and right
flanks. In all cases, the maximal allowable tumor size of each
individual tumor was 1.5 cm with a body condition score of 3
(well-conditioned). The mice were monitored daily. A protocol was
in place to humanely euthanized tumor-bearing mice upon evidence of
distress, as defined by IACUC policy. Tumor volume was calculated
using the equation: Volume (mm3) = [length x width x
(length + width/2) × 0.56] (18).
At the end of the studies, xenografts were harvested, cross-linked
in 10% formalin fixative, and embedded into paraffin blocks using a
standard protocol for specimen dehydration and paraffin embedding
(19). Embedded tissues were then
sliced into 5.0-μm sections. The sections were fixed onto
slides and hematoxylin and eosin (H&E) staining was performed
as previously described (20).
Cellular morphology and histology were examined via photomicroscopy
by a board-certified pathologist.
Immunohistochemistry (IHC)
IHC was performed as previously described (21). Sections (5.0-μm) of
formalin-fixed paraffin-embedded xenograft tumors were
deparaffinized and probed with primary antibody against
carcinoembryonic antigen (CEA; Abcam, Cambridge, MA, USA) diluted
1:500 or IgG isotype control overnight at 4°C. Biotinylated
secondary antibody and the streptavidin biotin complex (Invitrogen;
Thermo Fisher Scientific, Carlsbad, CA, USA) were applied and
counterstaining for nuclei was performed using hematoxylin
(Sigma-Aldrich; Merck KGaA).
Immunofluorescence microscopy
Cells were washed with PBS and cross-linked with
ice-cold 100% methanol (Pharmco-AAPER, Brookfield, CT, USA). Cells
were permeabilized with 0.1% Triton X-100/PBS. Non-specific binding
of antibodies was blocked by incubating in 2.0% bovine serum
albumin/PBS. Cells were incubated with p53 (Santa Cruz
Biotechnology, Dallas, TX, USA), p50, p65 (both from Upstate Cell
Signaling, Lake Placid, NY, USA), villin-1, MSH2, E-Cadherin (all
from Cell Signaling Technology, Inc., Danvers, MA, USA), CEA, or
IgG control antibody (Santa Cruz Biotechnology) overnight at 4°C.
Subsequently, cells were incubated with Alexa Fluor® 488
anti-rabbit secondary antibody (1:2,000; Invitrogen; Thermo Fisher
Scientific) at room temperature for 1 h, and the nuclei were
stained using DAPI. A Nikon Eclipse 90i Fluorescence microscope was
used for detection of protein expression at a magnification of ×20.
A pathologist who was blinded to sample identity qualitatively
evaluated the slides. The staining of cells was scored as positive
or negative and cytoplasmic and/or nuclear.
Immunoblot analysis
Cells were washed with ice-cold PBS and lysed on ice
with RIPA lysis buffer [50 mM Tris-HCl (pH 7.4), 150 mM NaCl, 1 mM
Na2EDTA, 1% NP-40, 0.25% sodium deoxycholate] (Sigma-Aldrich; Merck
KGaA) supplemented with 1 mM phenylmethylsulfonyl fluoride (PMSF;
Sigma-Aldrich; Merck KGaA) and Protease Inhibitor Cocktail 2
(Sigma-Aldrich; Merck KGaA). Protein quantification was achieved
using the Quick Start™ Bradford protein assay (Bio-Rad
Laboratories, Inc., Hercules, CA, USA). Isolated proteins (20
μl/well) were fractionated by sodium dodecyl
sulfate-polyacrylamide gel electrophoresis (7.5% SDS-PAGE) and
transferred onto a polyvinylidene difluoride (PVDF) membrane
(Bio-Rad Laboratories, Inc.). Probing with antibodies for CEA
(Thermo Fisher Scientific; cat. no. PA5-16665), β-catenin (BD
Biosciences; cat. no. 610153), and antibodies purchased from Cell
Signaling Technology, which included p53 (cat. no. MA5-12453), p50
(cat. no. 51-3500), p65 (cat. no. 51-0500), E-cadherin (cat. no.
PA5-16766), villin-1 (cat. no. PA5-22072), MSH2 (cat. no.
PA5-29160), MSH6 (cat. no. PA5-29348), MLH1 (cat. no. PA5-78062),
and ezrin (cat. no. PA1-090) was performed overnight at 4°C.
β-tubulin (cat. no. 05-661; Millipore, Temecula, CA, USA) was used
as a loading control. All primary antibodies were incubated
overnight at 4°C. Subsequently, blots were incubated with secondary
antibodies (Santa Cruz Biotechnology), m-IgGκ BP-HRP (cat. no.
sc-516102) or mouse anti-rabbit IgG-HRP (cat. no. sc-2357), for 1 h
at room temperature. Protein expression was analyzed using a
luminol-based enhanced chemiluminescence reaction kit (Amersham
Biosciences; GE Healthcare, Little Chalfont, UK). Quantification of
staining levels was determined by densitometry of western blot
analyses normalized to β-tubulin.
Total cellular RNA extraction
Total cellular RNA, including microRNA (miRNA), was
isolated from cell lines by using the Illustra TriplePrep Kit
(Amersham Biosciences; GE Healthcare) according to the
manufacturer's protocol. Quantification of RNA was determined using
a NanoDrop 2000C spectrophotometer (Thermo Fisher Scientific,
Rockford, IL, USA).
RT-qPCR
For all samples, cDNA was synthesized from 20 ng of
total cellular RNA using the Universal cDNA Synthesis Kit (Exiqon,
Woburn, MA, USA). After reverse transcription, quantification of
candidate miRNAs (miR-182, miR-204, miR-210 and miR-128) was
determined using commercially available specific miRNA LNA PCR
primers (Exiqon). qPCR was conducted using Universal RT SYBR Green
master mix (Exiqon) in a Realplex Real-time PCR machine (Eppendorf,
Hauppauge, NY, USA). RT-PCR was performed under the following
cycling conditions: 95°C for 10 min, and 45 cycles of 95°C for 10
sec and 60°C for 1 min. All RT-qPCRs were performed in triplicate.
Transcript normalization of samples was obtained using SNORD44 as a
control gene reference.
ELISA
A total of 2×10⁵ cells of each cell line
(SB-501, CHTN-06, SB-521 and HT-29) were seeded separately on
12-well plates and incubated for 48 h with DMEM cell culture media
supplemented as previously described. Next, the media were removed
and replaced with non-supplemented DMEM. TNF-α (30 ng) was added to
the cells and stimulation was allowed to proceed for 6 h. Control
wells were not treated with TNF-α. Each cell line was treated in
triplicates with 3 replicates performed. Supernatants were
collected and kept at -20°C for later analysis using ELISA. IL-8
secretion was detected by the use of the Human IL-8 kit (EHL-IL8;
RayBiotech Inc., Norcross, GA, USA) according to the manufacturer's
instructions.
Statistical analysis
One-way analysis of variance was used to determine
whether there were any statistically significant differences
between the methods of treatment for the various groups of each
cell line. P-values were considered significant at values of <5%
uncertainty or 0.05. Three independent experiments were analyzed
for each treatment group.
Results
Origin and morphology of AA CRC cell
lines
The CRC cell lines CHTN06, SB501 and SB521 were
derived from a liver metastasis from a 69-year-old AA woman, a
stage 3b cecum adenocarcinoma from a 64-year-old AA woman, and a
stage 3c splenic flexure adenocarcinoma from a 53-year-old AA man,
respectively. Once established in vitro, CHTN06 and SB501
cells were viable as adherent cells when cultured on a standard
cell culture-treated surface without a supplemental coating of
attachment factors (i.e., fibronectin or fibrinogen). Over 90% of
the cells in culture were epithelial-like. Both cell lines
exhibited polymorphic characteristics, with a spindle or polygonal
morphology, and proliferated as tightly bound colonies. Conversely,
SB521 cells were viable as a heterogeneous population of adherent
and suspension cells when grown under the same conditions. This
line does not grow in dense colonies and is heterogeneous in terms
of cellular morphology.
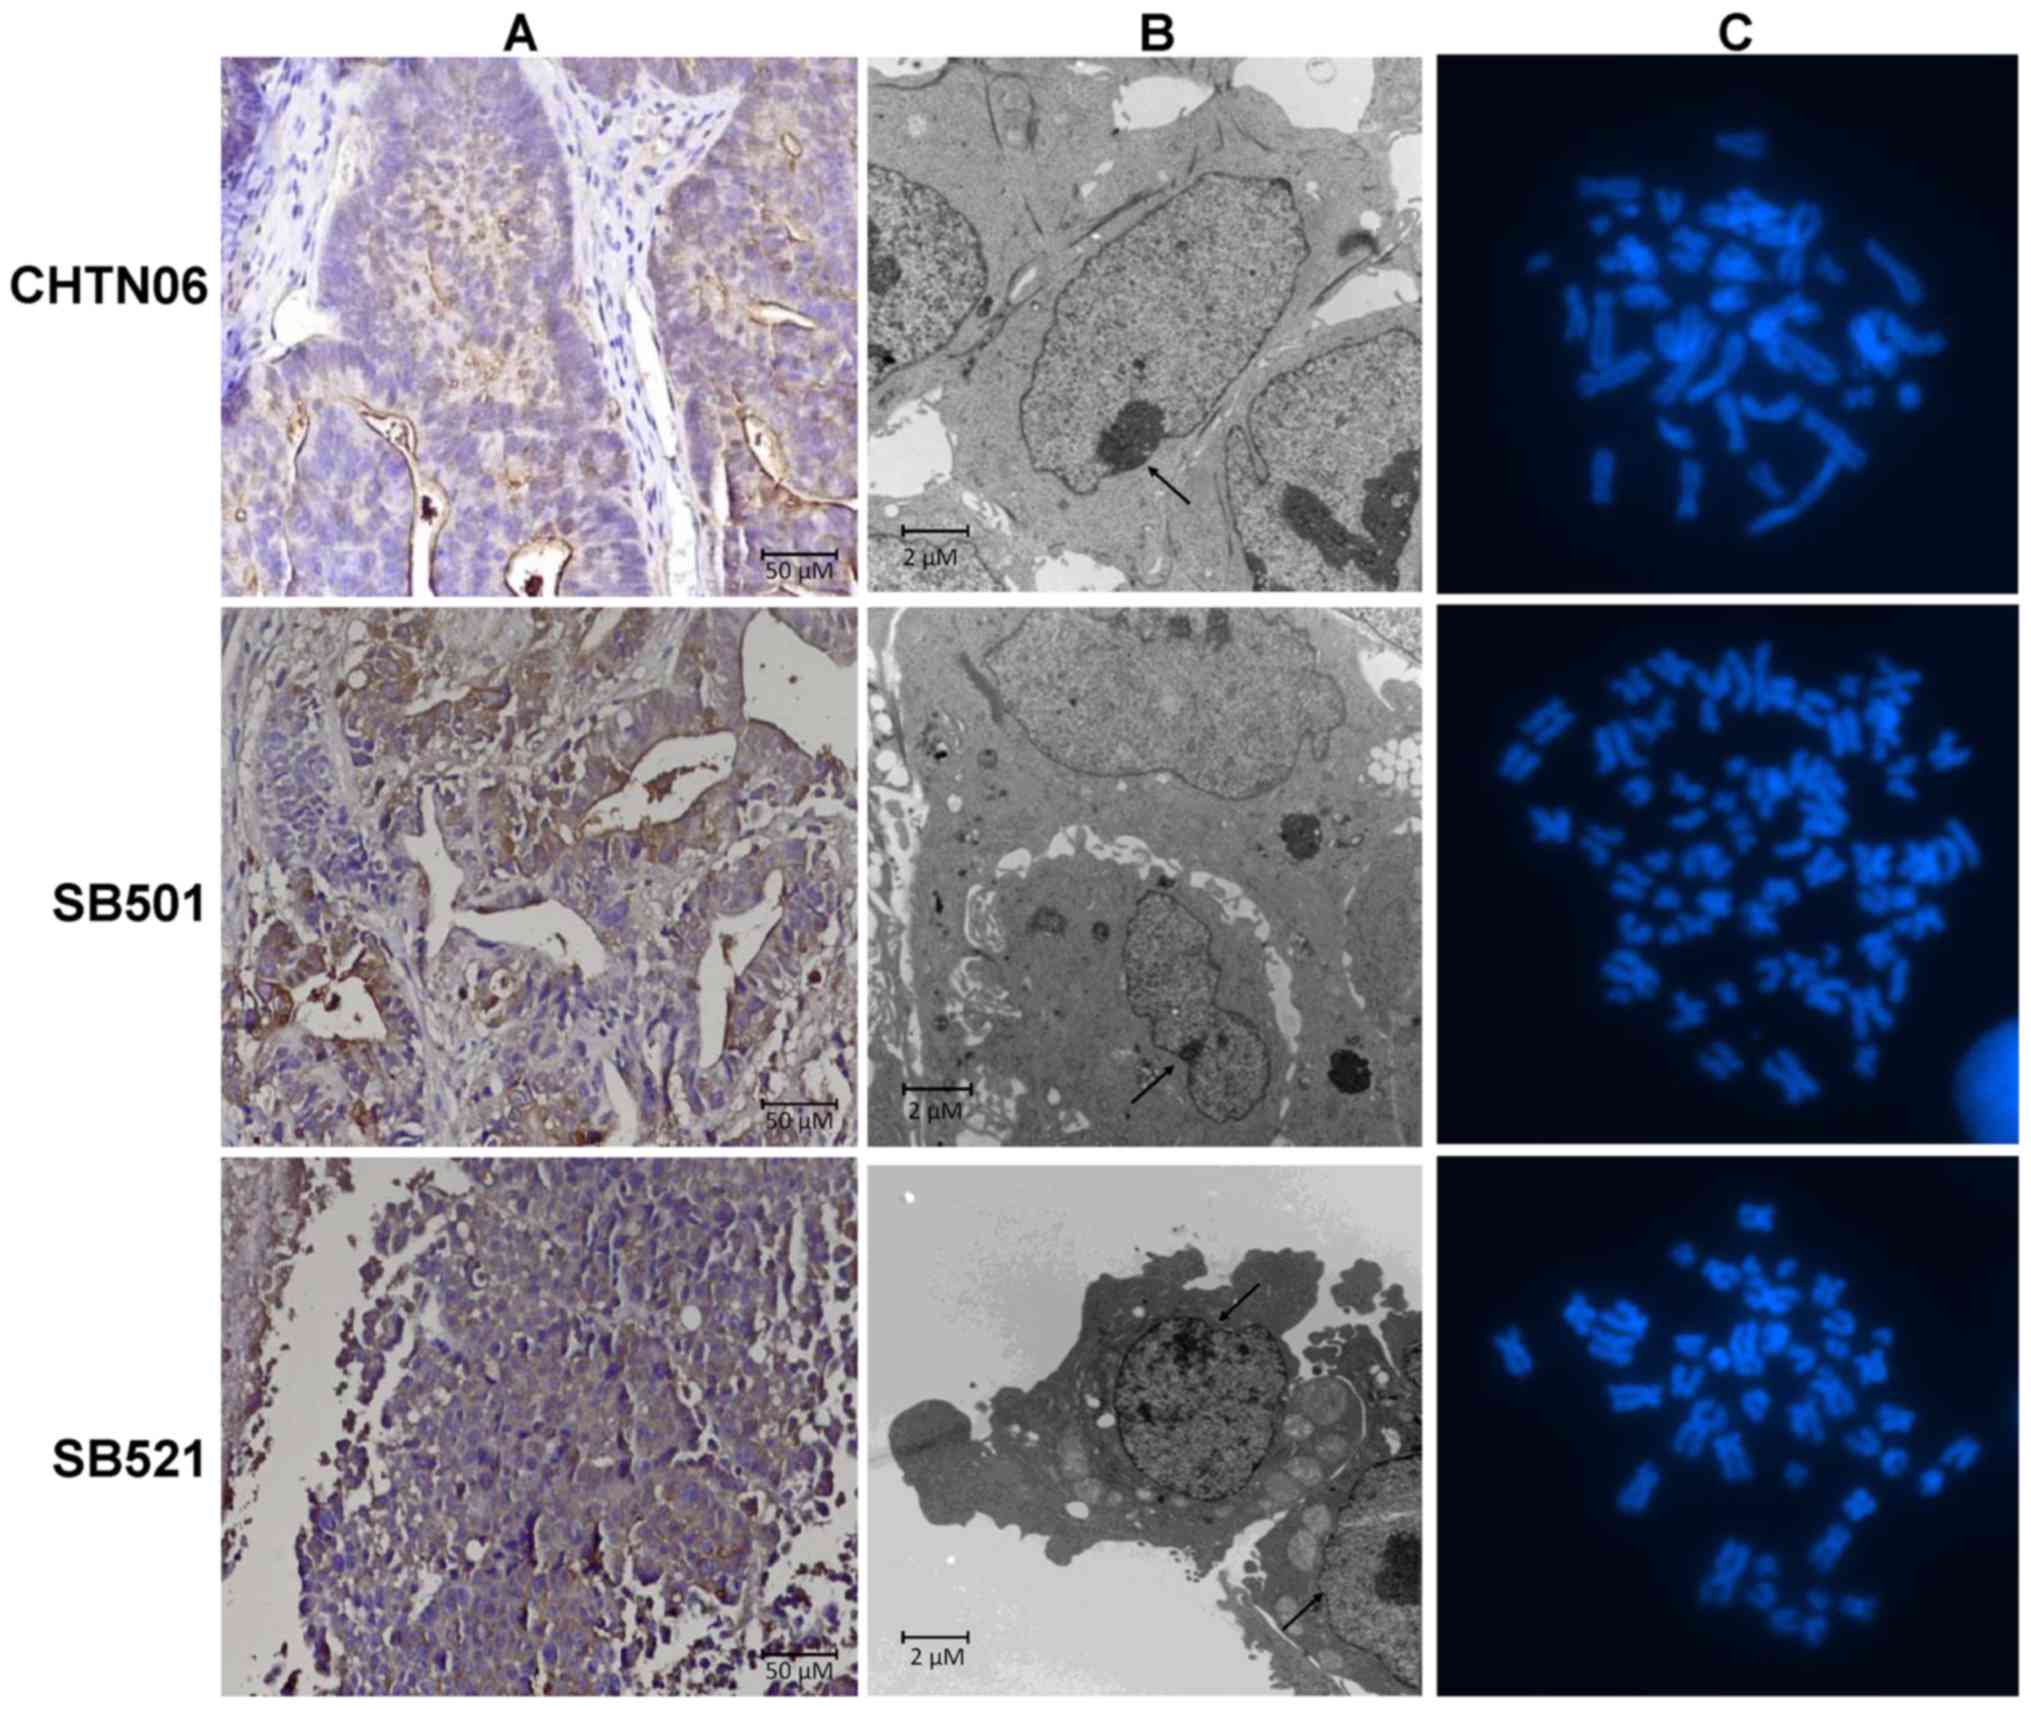
IHC staining for CEA, a CRC epithelial marker, was
conducted to validate the lineage of all three cell lines. CHTN06,
SB501 and SB521 were all positive for the CEA protein (Fig. 1A). Therefore, these novel in
vitro models were validated as epithelial CRC cell lines. Via
TEM analysis, all three cell lines were shown to be mononucleated
with a dense nucleolus (Fig. 1B,
arrow). At higher magnification, tight junctions were visible
between adjacent cells (data not shown). All other organelles,
including mitochondria, Golgi and endoplasmic reticulum, had normal
physiology and were otherwise unremarkable.
Cytogenetic analysis
Karyotyping analysis was performed at a subculture
passage of 4 for all cell lines (Fig.
1C). CHTN06 cells were near-diploid, with a modal number of 45
chromosomes; SB501 cells were hypotriploid, with a modal of 65
chromosomes; and SB521 cells were hypodiploid, with a modal number
of 43 chromosomes. Karyotyping also determined a modal number of 45
chromosomes for HCT116 cells, whereas HT-29 cells were
hypertriploid, with a modal number of 71 chromosomes (data not
shown), which was confirmed by ATCC. Karyotyping for SW480 cells
was not performed; however, this cell line has been reported to be
hypotriploid by ATCC (https://www.atcc.org/en/Products/All/CCL-228.aspx#characteristics).
Genetic profiling and stability of AA CRC
cell lines
To confirm conservation of the genetic profile of
the original patient sample to that of successive passages, short
tandem repeat (STR) DNA profiling of multiple passages was
performed (Genetica DNA Laboratories, Burlington, NC, USA). The STR
DNA profiling of CHTN06 (100% match) and SB501 (92.3% match)
confirmed that both cell lines were authentic from the original
patient tissue, with no or minimal genetic drifting. Furthermore,
each line was a homogeneous cell population, as 1-2 alleles were
identified for each locus analyzed.
Genetic drift was observed in the SB521 line, with a
68.1% match of cell passages from the original patient specimen. To
determine the cause of genetic drifting, microsatellite instability
(MSI) testing was performed (Genetica DNA Laboratories). This cell
line was found to display high-level MSI (MSI-H). Immunoblot
analysis of select mismatch repair (MMR) proteins revealed that
MLH1 expression was not detectable, MSH2 expression was decreased
(2.2-fold) and MSH6 expression was mildly increased (1.3-fold)
compared with HT-29.
A search using the respective STR DNA
profile of each AA CRC cell line revealed that these profiles were
not found in any known cell repositories
Thus, the CHTN06, SB501 and SB521 cell lines are
novel and unique in vitro/in vivo tools for studying
biological factors involved in CRC progression and those
attributing to racial health disparity. Furthermore, SB521 may be
employed to assess the general biology of CRC in AAs with MSI-H
genetic profile.
Cellular proliferation and invasion
properties
All three cell lines were viable and readily
proliferated in growth medium supplemented as described in
Materials and methods. The logarithmic growth phase occurred
between 24 and 96 h. The proliferation rate (mean doubling time
during log growth) was 29.4±2.3 h for CHTN06, 34.0±2.2 h for SB501,
and 19.5±1.5 h for SB521, as determined by MTT proliferation
assays. The maximal mitotic index (rate of growth) occurred at
~72-96 h (data not shown) for all three cell lines. As reported by
ATCC, the established proliferation rate is 21 h for HCT 116, 23 h
for HT-29 and 38 h for SW480.
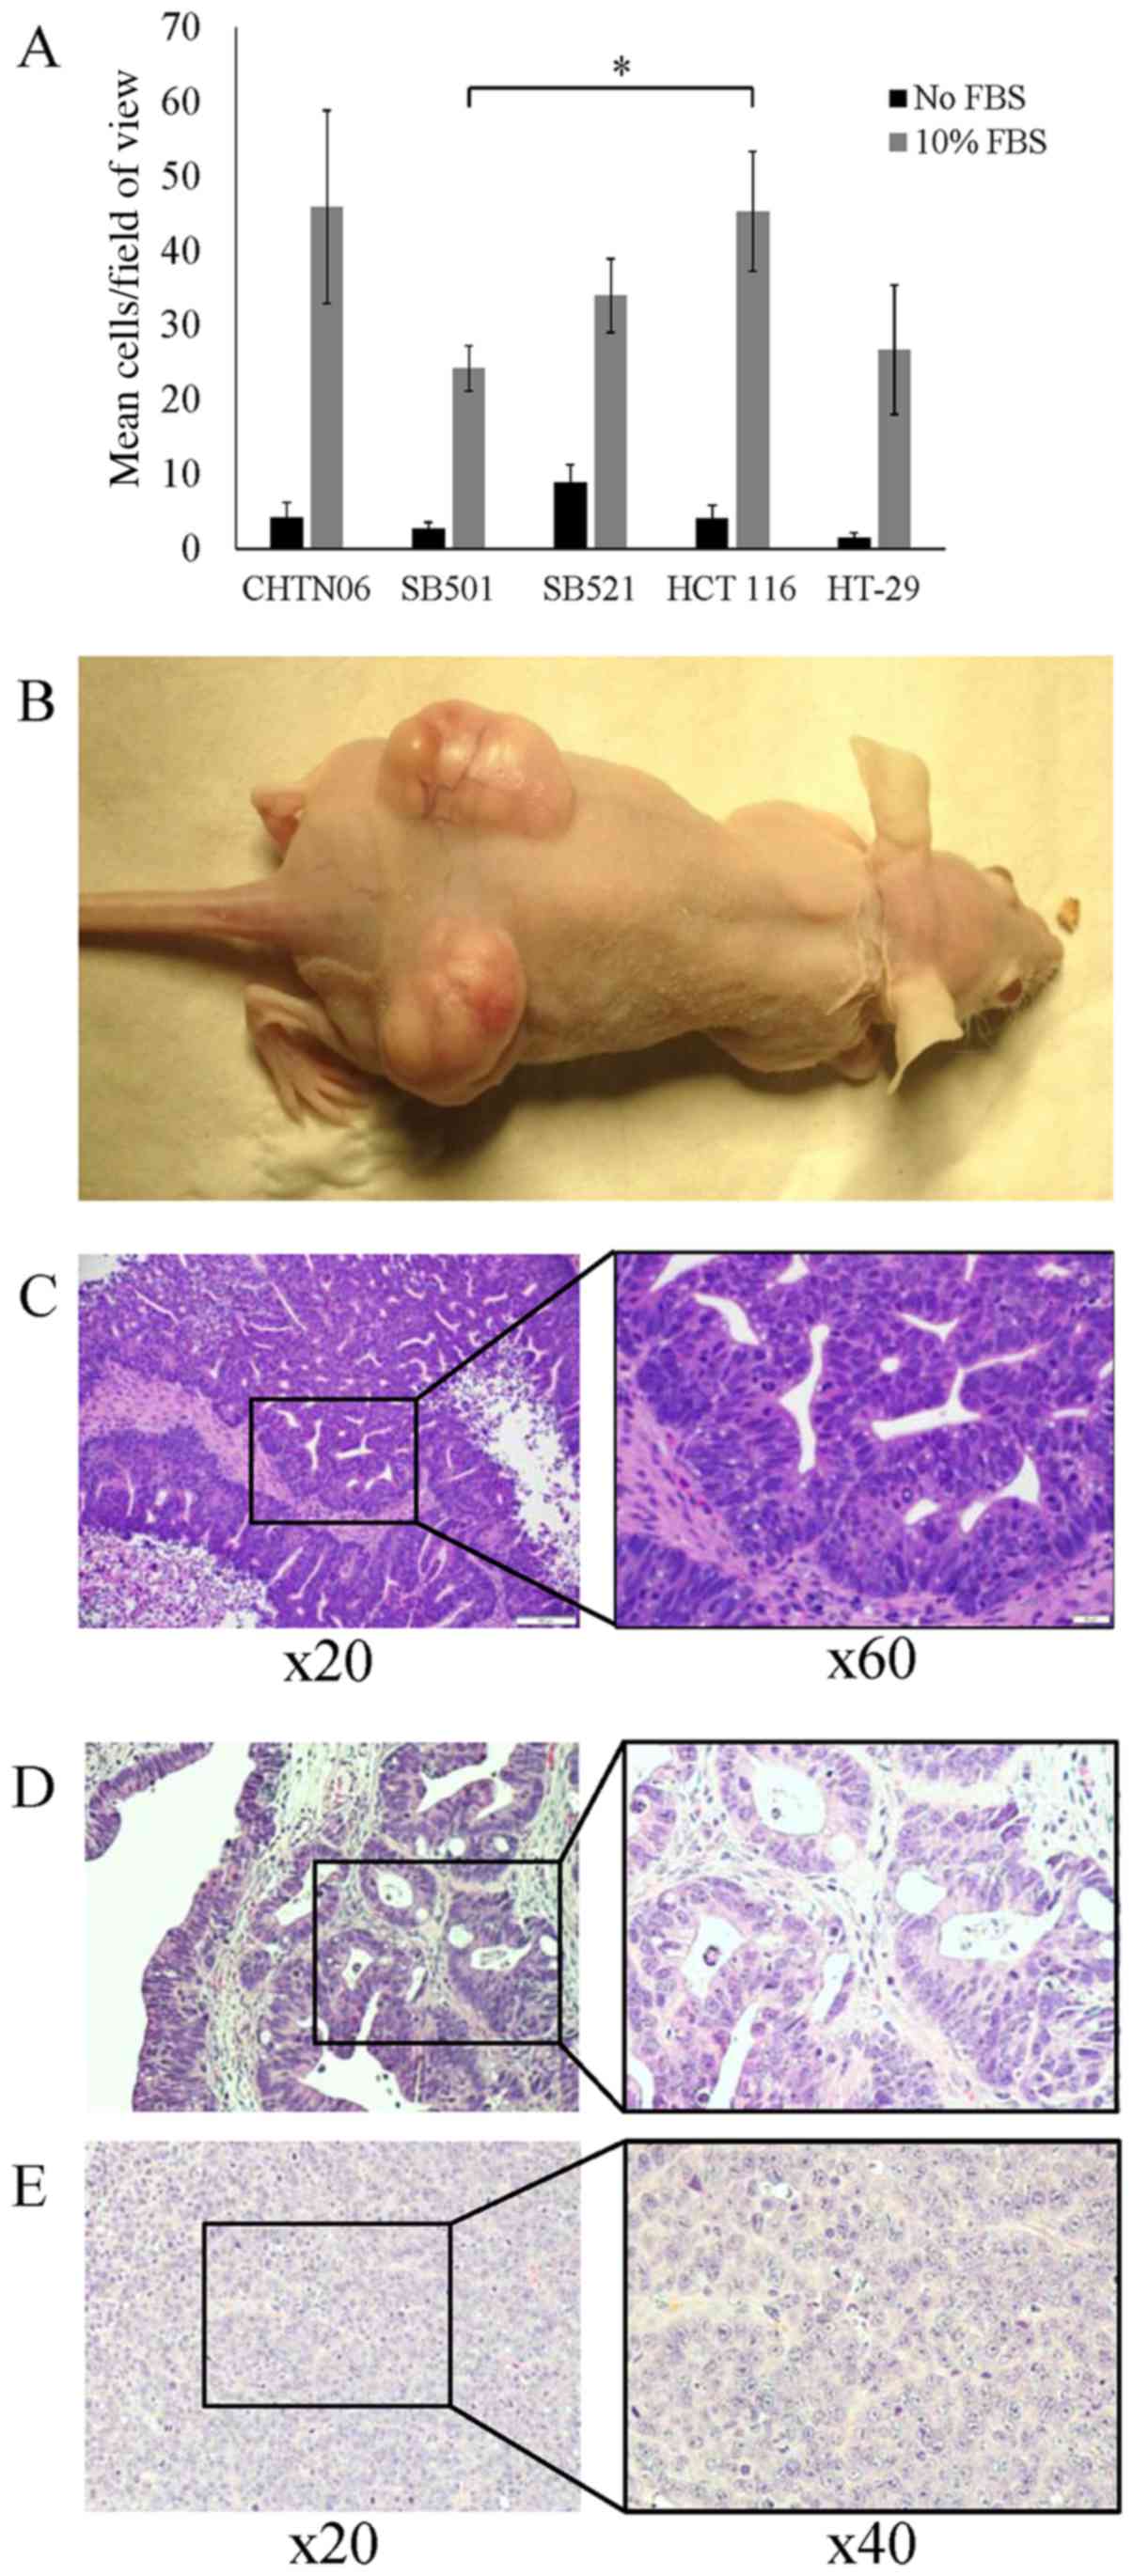
An invasion assay was conducted to evaluate the
invasive properties of the three AA CRC cell lines compared with
the established CA CRC cell lines. After a 24-h incubation, SB501
cells exhibited an invasion rate of 24.3±3.0 cells/field of view
(FOV). This rate was significantly lower compared with that of the
HCT116 cell line (45.3±8.1 cells/FOV). However, the rate was not
different compared with the HT-29 cell line (26.8±8.7 cells/FOV).
The invasion rate of CHTN06 (45.9±13.0 cells/FOV) and SB521
(34.0±5.0 cells/FOV) were not considered to be significantly
different from the two CA CRC lines. Control wells lacking the FBS
chemoattractant produced significantly fewer invasive cells for all
three cell lines (Fig. 2A).
The in vivo tumorigenic properties of the
three AA CRC cell lines were studied using a mouse xenograft model.
Cells suspended in PBS were subcutaneously injected bilaterally
into SCID mice. The xenograft tumors of all three cell lines were
readily established and grew to a mean volume of 1,600
mm3 over 21 days (Fig.
2B). Histology revealed the grafted tumors to be highly
differentiated, displaying glands with crowded, elongated and
dysplastic nuclei, in a background of necrosis with acute
inflammation, highly consistent with well-differentiated colorectal
adenocarcinoma (Fig. 2C–E). Cells
dissociated and cultured from harvested xenograft tumors retained
the same properties as the original cell line.
AA CRC cell lines express hallmark CRC
properties
To further characterize the three AA CRC cell lines,
proteins associated with CRC tumorigenesis and progression, i.e.,
β-catenin, p53, NF-κB (p50 and p65), villin-1, MSH2, MSH6, MLH1,
E-cadherin, ezrin and CEA, were assessed by western blotting and
immunofluorescence analysis. The protein expression of each AA CRC
line was directly compared to that of HT-29, whereas CHTN06 was
additionally evaluated against HCT116 and SW480 (data not shown).
No significant changes in β-catenin expression were observed in the
CHTN06, SB501 or SB521 cell lines compared with the HT-29 cell line
(Fig. 3). Conversely, a marginal
1.3-fold increase or decrease in β-catenin expression was observed
in CHTN06 relative to the HCT116 and SW480 cell lines, respectively
(data not shown).
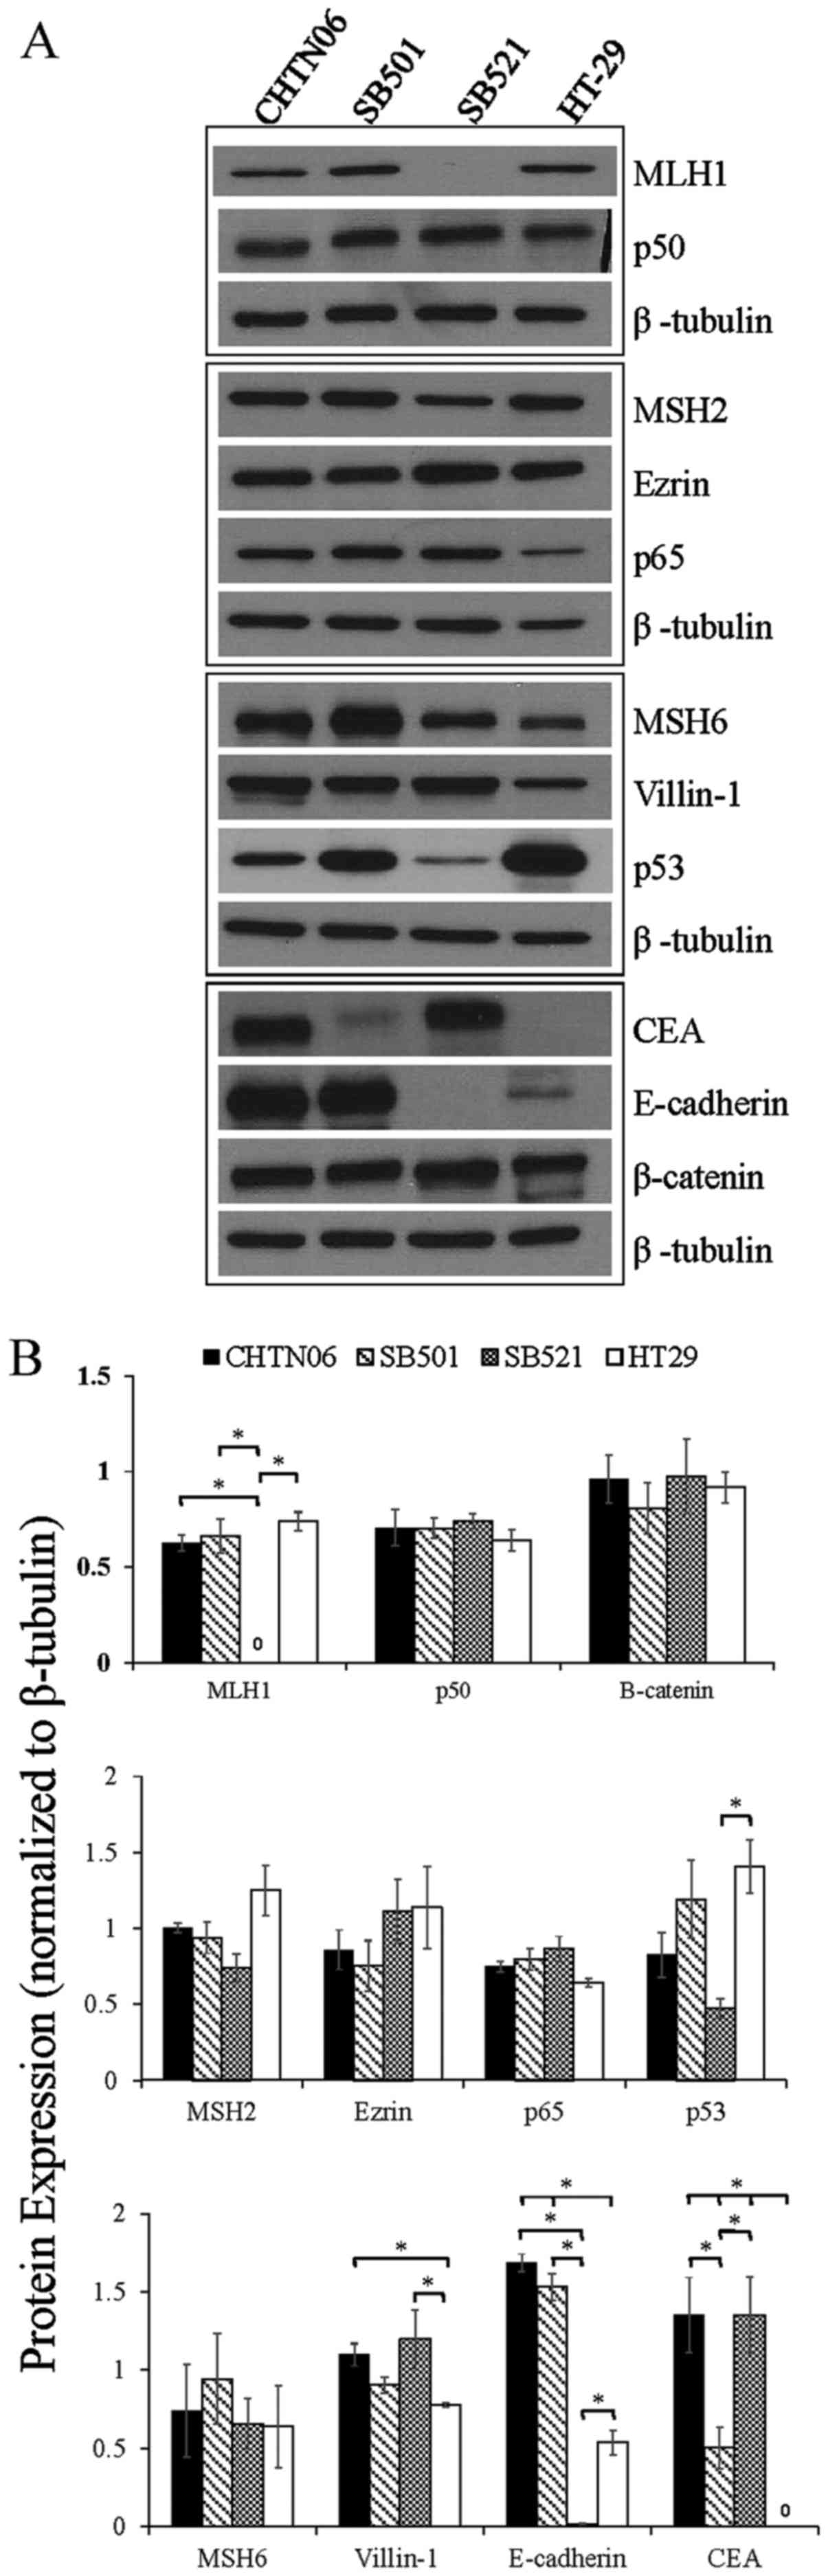 | Figure 3The expression of proteins associated
with colorectal carcinoma (CRC) tumorigenesis and metastasis was
determined in the novel African American CRC lines by
immunoblotting. (A) Qualitative analysis of CHTN06, SB501 and SB521
and HT-29, a Caucasian American CRC cell line, for protein
expression of β-catenin, p53, nuclear factor (NF)-κB (p50 and p65),
villin-1, MSH2, MSH6, MLH1 and ezrin. (B) Semi-quantitative
densitometry was performed by normalizing protein expression to the
respective β-tubulin loading control. Data were generated from
three independent experiments. CEA, carcinoembryonic antigen. |
p53 expression in CHTN06 and SB521 cells was
downregulated to that observed in HT-29 cells, whereas p53
expression in SB501 cells was comparable (Fig. 3). The heterodimeric subunits of
NF-κB (p50 and p65), both of which are commonly overexpressed in
CRC (22), were consistent in
expression levels for all AA cell lines compared with HT-29
(Fig. 3). The expression levels of
p65 were upregulated in CHTN06, SB501 and SB521 cells relative to
HT-29 cells (Fig. 3). The
expression levels of villin-1, a member of the calcium-regulated
actin-binding family and a marker of differentiation in CRC
(23,24), was slightly upregulated in CHTN06,
SB521 and SB501 cells compared with HT-29 cells (Fig. 3). No villin-1 expression was
detected in the HCT116 and SW480 cell lines (data not shown).
Selected members of the MMR protein family were
analyzed, i.e., MLH1, MSH2 and MSH6. Expression of MLH1 was not
detectable in the SB521 cell line, whereas its expression in CHTN06
and SB501 cells paralleled that in HT-29 cells (Fig. 3). The expression level of MSH2 was
down-regulated in CHTN06, SB501 and SB521 cells compared with that
in HT-29 cells (Fig. 3). No
differences in the expression level of MSH2 were noted in the
CHTN06 cell line compared with the HCT116 or SW480 cell lines (data
not shown). The expression level of MSH6 was upregulated in the
CHTN06, SB501 and SB521 cell lines (Fig. 3) compared with the HT-29 cell line.
The expression level of this protein was slightly downregulated in
HCT116 cells and slightly upregulated in SW480 cells relative to
CHTN06 cells (data not shown).
The expression levels of two proteins involved in
cell-to-cell adhesion, namely E-cadherin and ezrin, were also
compared among cell lines. The expression level of E-cadherin was
markedly upregulated in CHTN06 and SB501 and markedly downregulated
in SB521 cells (Fig. 3) relative
to HT-29 cells. The expression level of ezrin was mildly
upregulated in CHTN06, SB501 and SB521 cells as compared to HT-29
cells (Fig. 3).
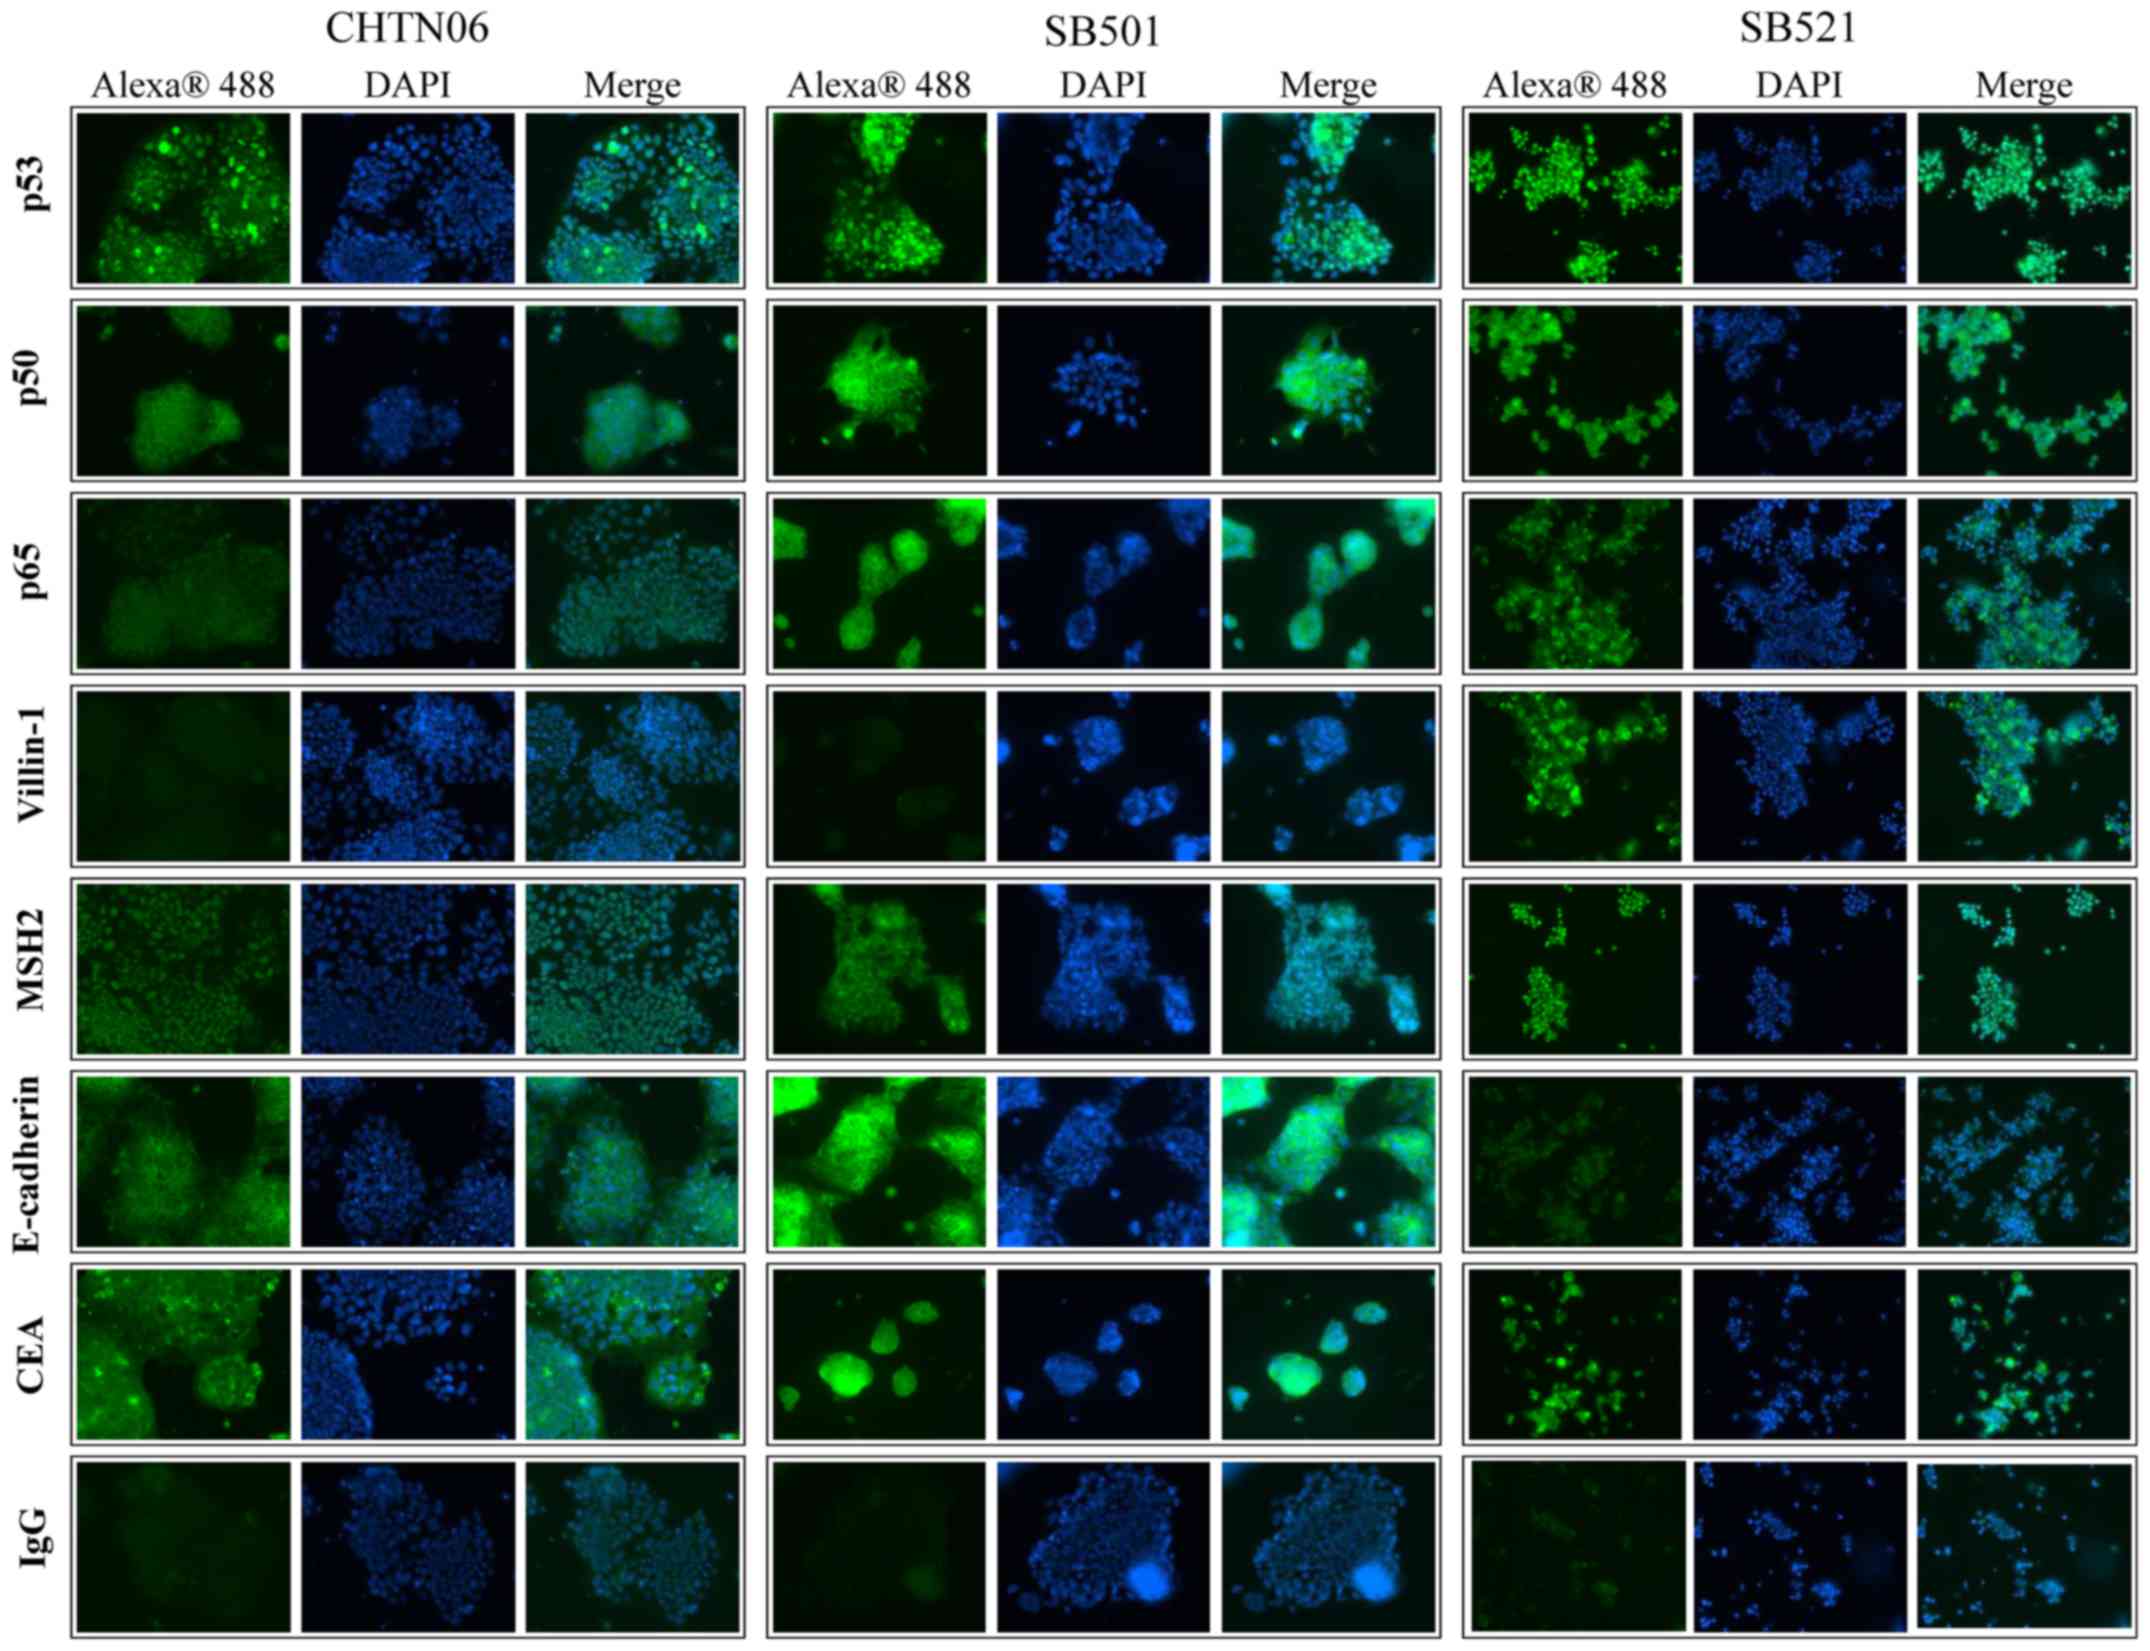
Qualitative assessment for selected proteins was
performed by immunofluorescence analysis for CHTN06, SB501 and
SB521 cells (Fig. 4). In the
present study, p53 was found to accumulate in the nucleus of all
three AA CRC cell lines. Additionally, expression of the NF-κB
subunits p50 and p65, villin-1, MSH2 and E-cadherin was also
observed in all AA cell lines, as was cytosolic expression of CEA.
An IgG isotype control was used to differentiate between
non-specific background staining.
AA cell lines differentially express
specific miRNAs
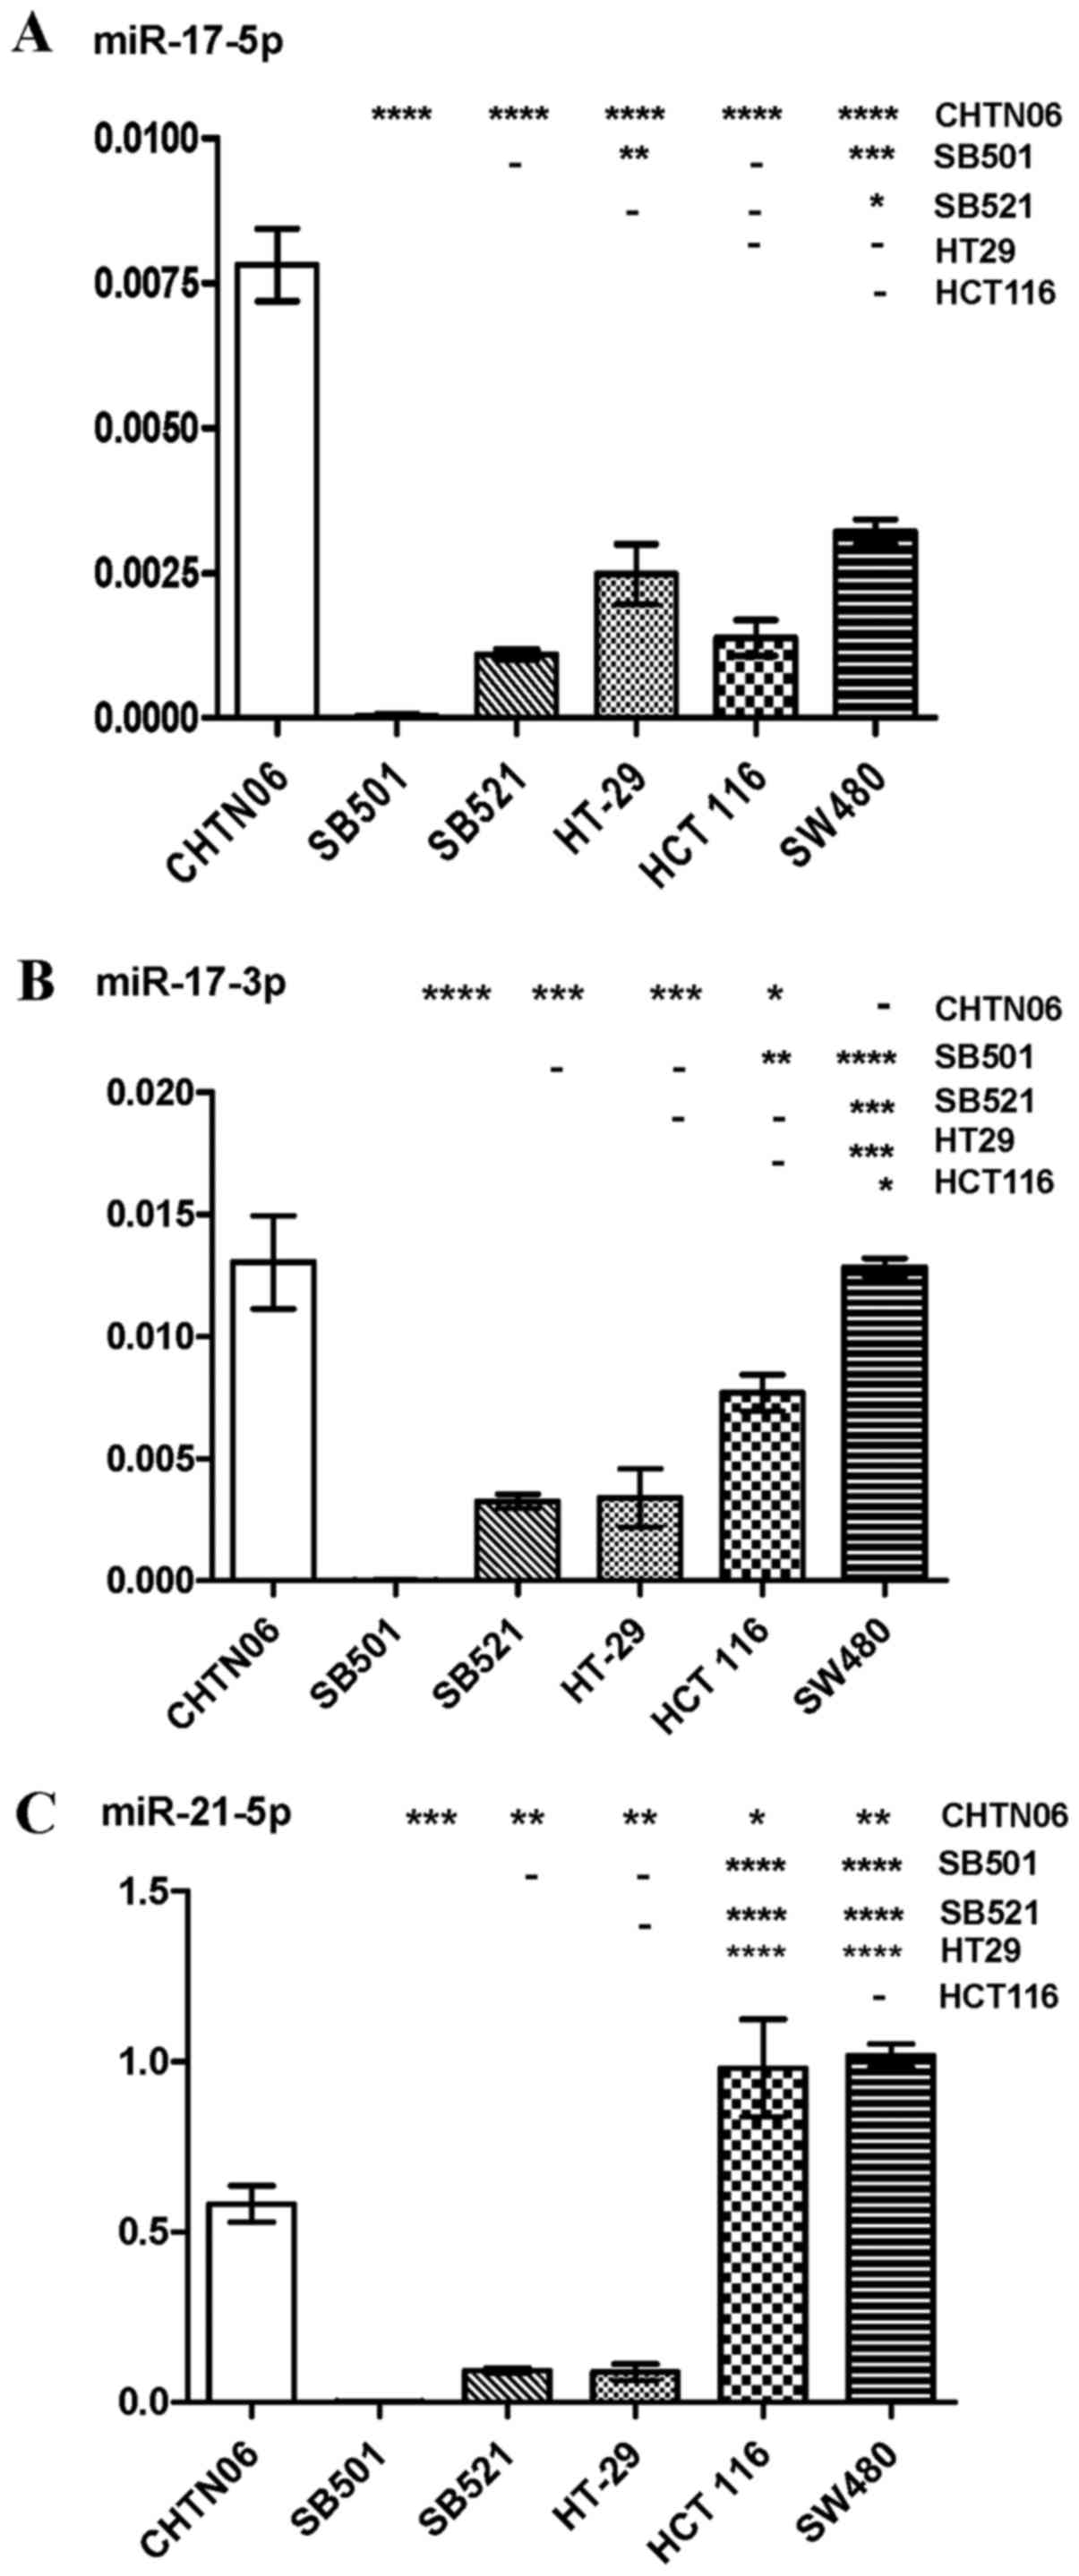
RT-qPCR was used to analyze the expression levels of
several miRNAs in the three novel AA CRC cell lines and the three
established CA CRC cell lines: miR-17-5p and -3p, miR-21-5p and
-3p, miR-128-3p, miR-182-5p, miR-210-3p and miR-222. Differential
expression of these miRNAs was observed between AA and CA CRC cell
lines. The purported oncomir miR-17-5p was upregulated in CHTN06
compared with SB521 and the three CA CRC cell lines, whereas
expression of this miRNA was not detected in the SB501 cell line
(Fig. 5A). Additionally,
expression of miR17-3p in the SB501 and SB521 cell lines was lower
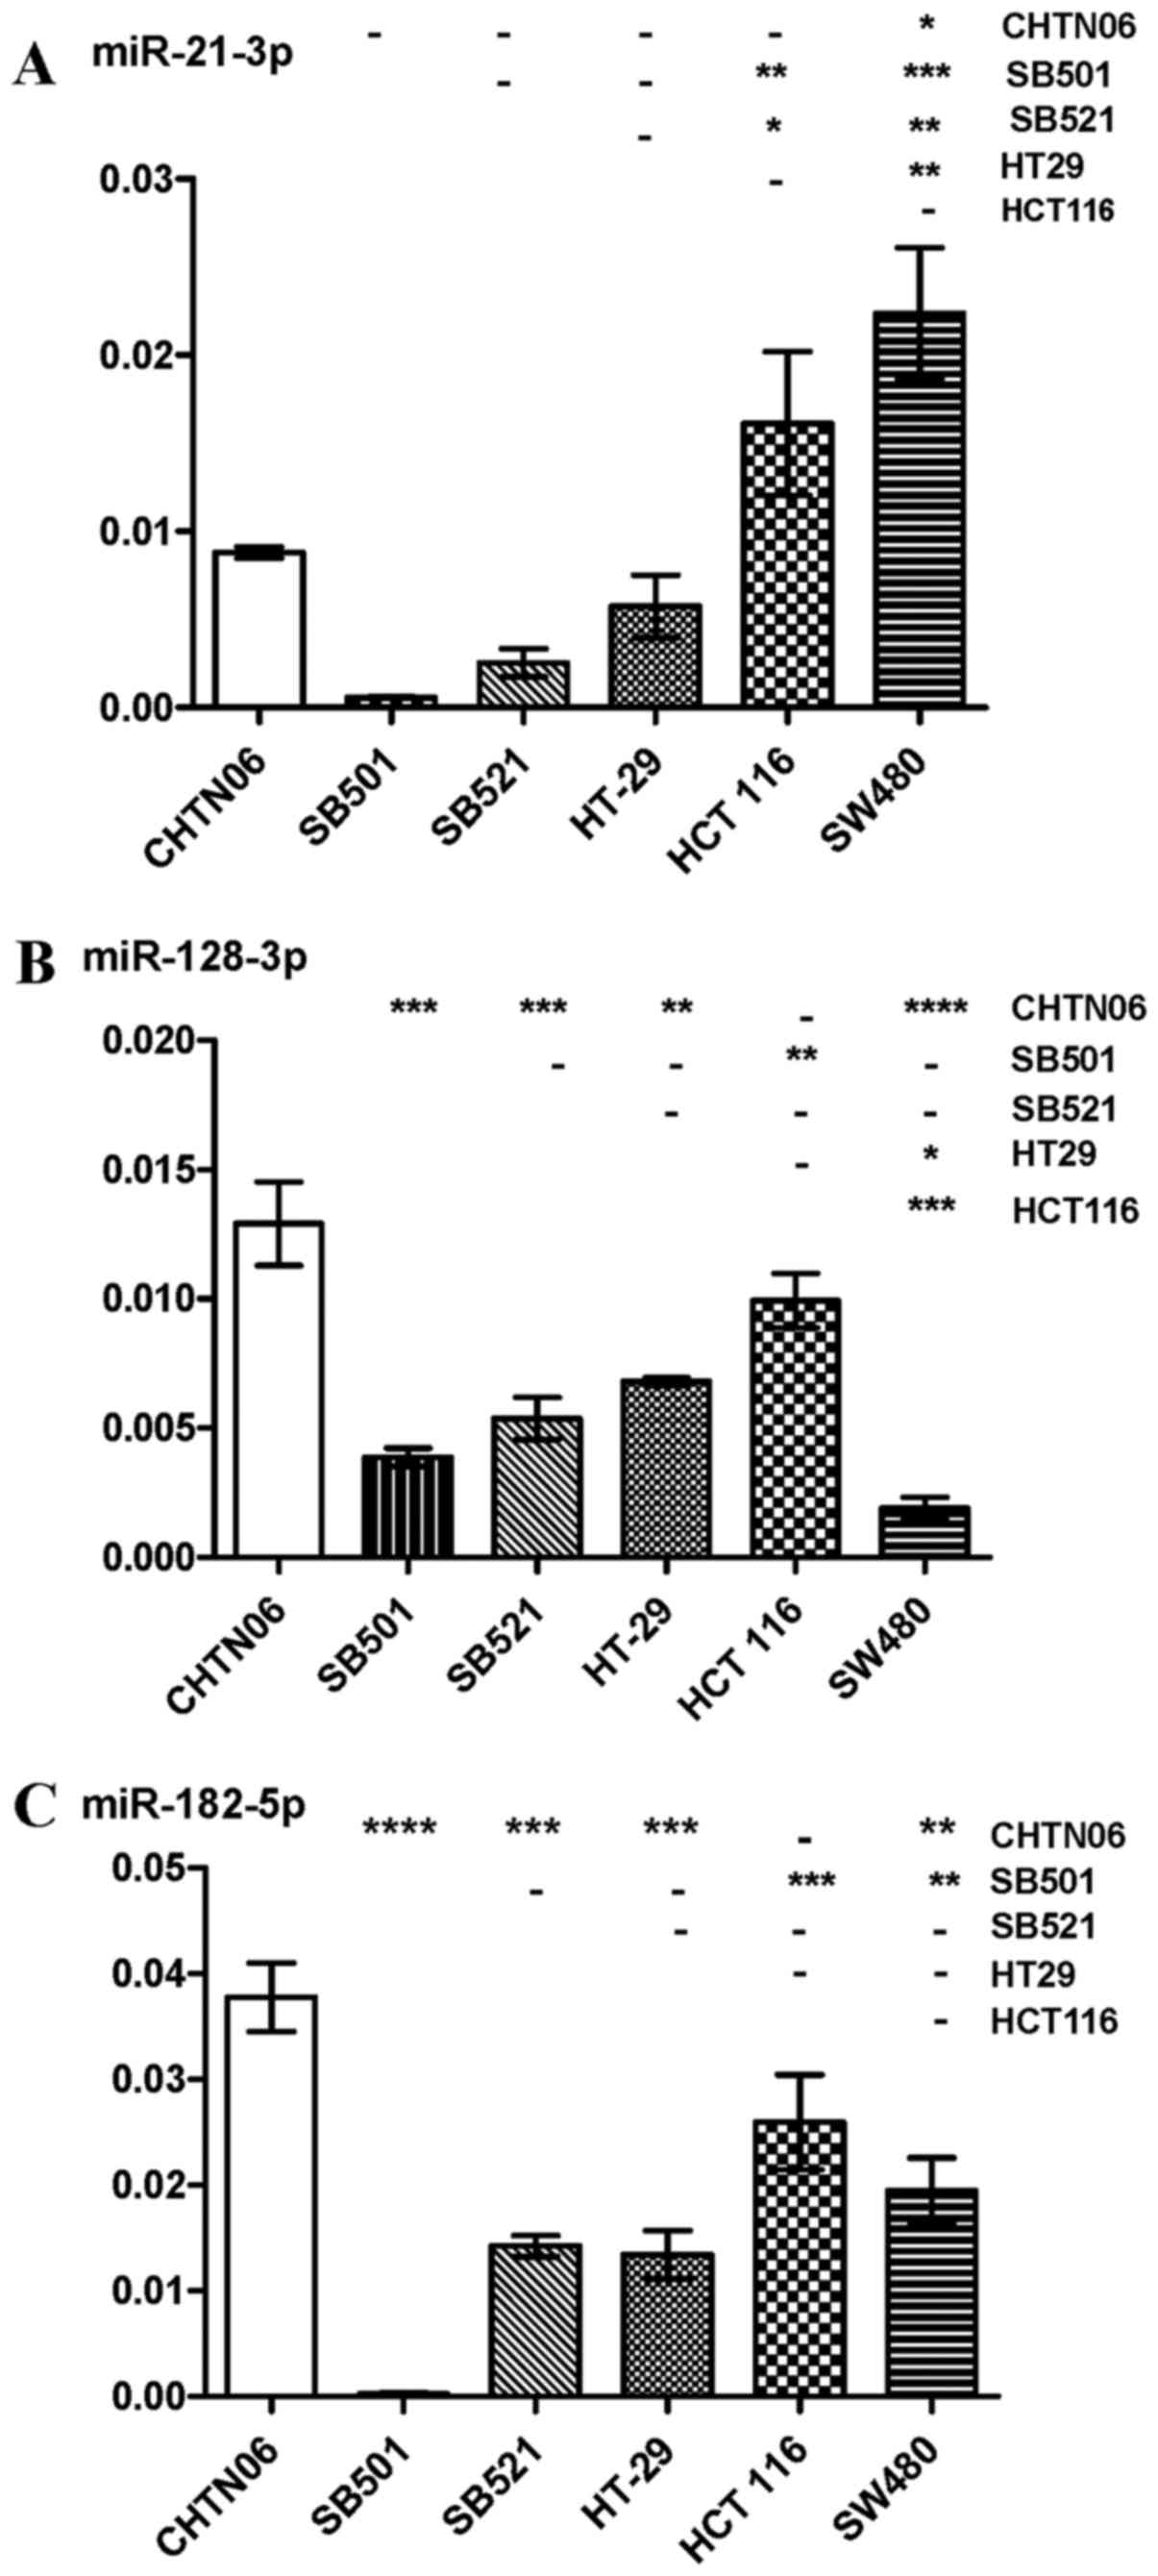
compared with the SW480 and HCT116 CA CRC lines (Fig. 5B). Expression of miR-21-5p and
miR-21-3p, frequently upregu-lated in solid tumors, was
downregulated in the three AA CRC lines compared with SW480 and
HCT116 (Figs. 5C and 6A). However, the three AA CRC lines
expressed higher levels of miR128-3p compared with SW480.
Conversely, SB501 exhibited lower expression of this miRNA compared
with the HCT116 and HT-29 CA CRC cell lines (Fig. 6B). miR-182-5p was upregulated in
CHTN06 compared with two of the CA CRC cell lines (SW480 and
HT-29). SB521 exhibited decreased expression compared with HCT116,
and no detectable levels were observed in the SB501 cell line
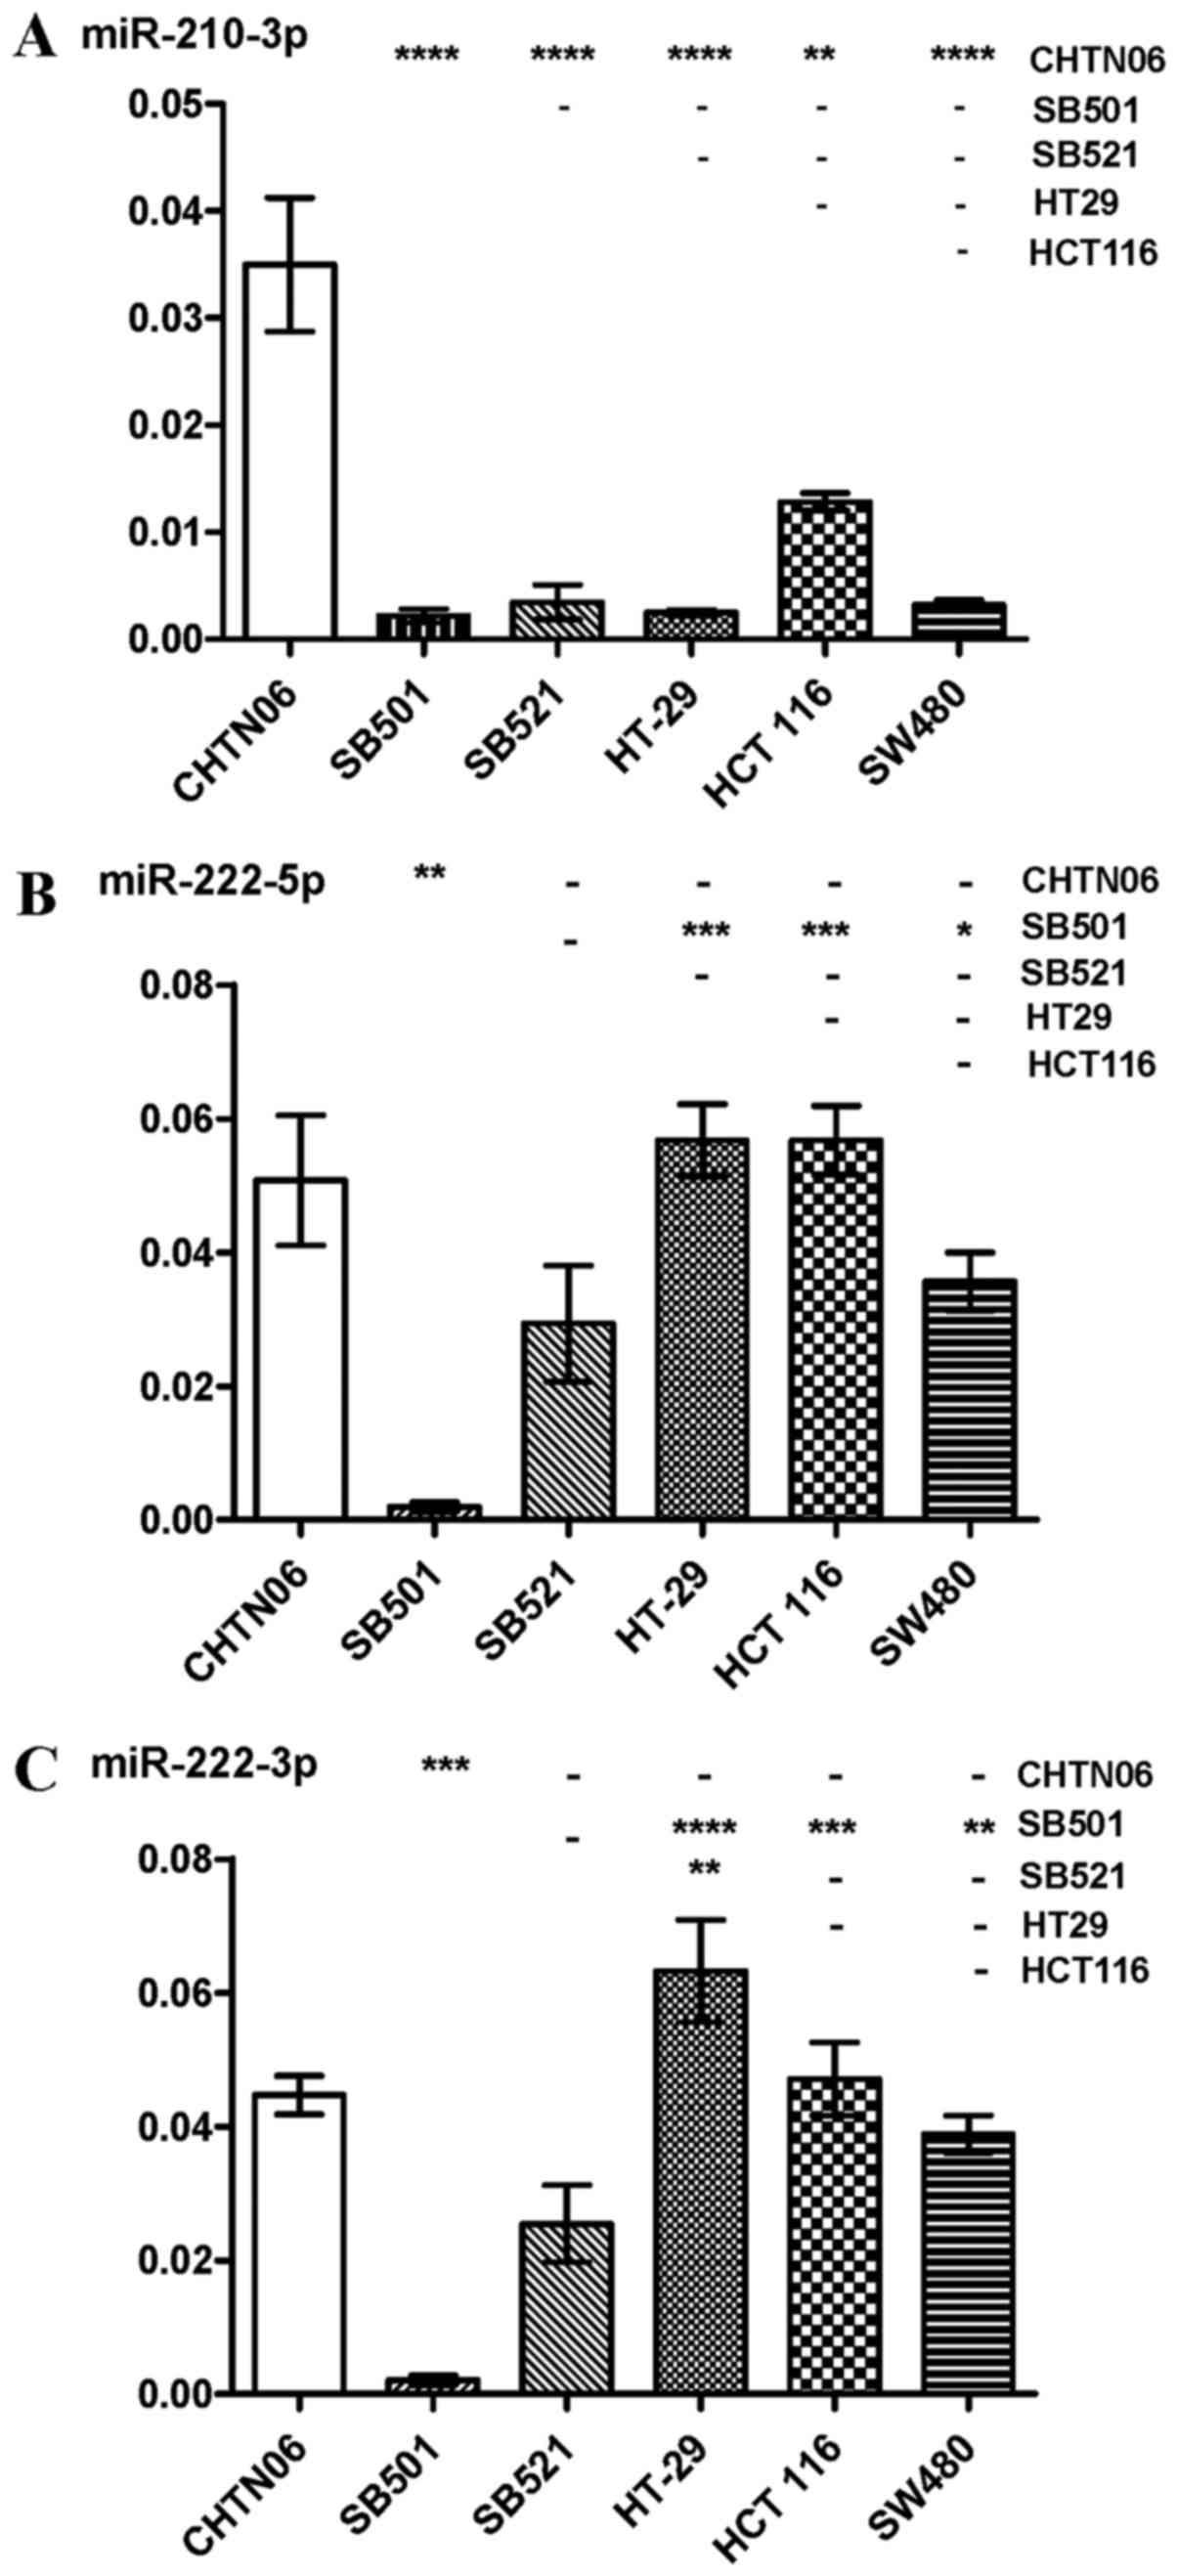
(Fig. 6C). As regards miR-210-3p,
its expression was increased in the CHTN06 cell line compared with
all three CA CRC cell lines, whereas its expression in the SB501
and SB521 cell lines was down-regulated compared with the HCT116
cell line. Only a slight detectable difference was observed between
the SB501 and SB521 AA cell lines compared with the SW480 and HT-29
CA cell lines (Fig. 7A). Decreased
miR-222-5p expression was observed in SB501 compared with all three
CA CRC cell lines, and in SB521 compared with HCT116 and HT-29
(Fig. 7B). Similarly, SB521
exhibited decreased miR-222-3p expression compared with the three
CA CRC cell lines and in SB521 compared with HT-29. The expression
of miR-222-5 or -3p in CHTN06 did not differ significantly compared
with any of the CA CRC cell lines (Fig. 7B and C). The P-value for each miRNA
is provided in Table I.
 | Table IP-values obtained from RT-qPCR
analysis of selected miRNAs. |
Table I
P-values obtained from RT-qPCR
analysis of selected miRNAs.
| vs. SW480 | vs. HCT 116 | vs. HT-29 | vs. SB521 | vs. SB501 |
|---|
| miR-17-5p | | | | | |
| CHTN06 | 0.0022 | 0.0008 | 0.0028 | 0.0004 | |
| SB501 | a | a | a | a | |
| SB521 | 0.0007 | 0.4196 | 0.0557 | | |
| HT-29 | 0.2603 | 0.1397 | | | |
| HCT 116 | 0.0081 | | | | |
| miR-17-3p | | | | | |
| CHTN06 | 0.91605 | 0.05901 | 0.04345 | 0.00710 | 0.01547 |
| SB501 | 0.00014 | 0.00549 | 0.05330 | 0.00709 | |
| SB521 | 0.00003 | 0.00504 | 0.20869 | | |
| HT-29 | 0.00194 | 0.06891 | | | |
| HCT 116 | 0.00342 | | | | |
| miR-21-5p | | | | | |
| CHTN06 | 0.00236 | 0.05938 | 0.00525 | 0.00080 | 0.00346 |
| SB501 | 0.00019 | 0.01316 | 0.08382 | 0.00019 | |
| SB521 | 0.00001 | 0.00346 | 0.25203 | | |
| HT-29 | 0.00027 | 0.01608 | | | |
| HCT 116 | 0.81609 | | | | |
| miR-21-3p | | | | | |
| CHTN06 | 0.00067 | 0.03299 | 0.00124 | 0.00152 | 0.00001 |
| SB501 | 0.00006 | 0.00068 | 0.00001 | 0.07711 | |
| SB521 | 0.00320 | 0.01392 | 0.07896 | | |
| HT-29 | 0.00233 | 0.01612 | | | |
| HCT 116 | 0.03513 | | | | |
| miR-128-3p | | | | | |
| CHTN06 | 0.0027 | 0.1969 | 0.0196 | 0.0139 | 0.0054 |
| SB501 | 0.0227 | 0.0055 | 0.0015 | 0.1626 | |
| SB521 | 0.0190 | 0.0266 | 0.1569 | | |
| HT-29 | 0.0004 | 0.0425 | | | |
| HCT 116 | 0.0021 | | | | |
| miR-182-5p | | | | | |
| CHTN06 | 0.015 | 0.207 | 0.004 | 0.002 | a |
| SB501 | a | a | a | a | |
| SB521 | 0.181 | 0.010 | 0.762 | | |
| HT-29 | 0.189 | 0.022 | | | |
| HCT 116 | 0.108 | | | | |
| miR-210-3p | | | | | |
| CHTN06 | 0.0003 | 0.0021 | 0.0002 | 0.0018 | 0.0004 |
| SB501 | 0.2917 | 0.0005 | 0.7040 | 0.5037 | |
| SB521 | 0.8769 | 0.0065 | 0.5783 | | |
| HT-29 | 0.2745 | 0.0003 | | | |
| HCT 116 | 0.0005 | | | | |
| miR-222-5p | | | | | |
| CHTN06 | 0.4669 | 0.1613 | 0.1715 | 0.0796 | 0.0037 |
| SB501 | 0.0015 | 0.0005 | 0.0005 | 0.0003 | |
| SB521 | 0.0753 | 0.0122 | 0.0140 | | |
| HT-29 | 0.0379 | 0.9962 | | | |
| HCT 116 | 0.0347 | | | | |
| miR-222-3p | | | | | |
| CHTN06 | 0.2202 | 0.7168 | 0.0865 | 0.0404 | 0.0001 |
| SB501 | 0.0002 | 0.0012 | 0.0014 | 0.0156 | |
| SB521 | 0.1047 | 0.0530 | 0.0170 | | |
| HT-29 | 0.0407 | 0.1626 | | | |
| HCT 116 | 0.2523 | | | | |
AA cell lines differ in inflammatory
patterns compared with the CA cell line HT-29
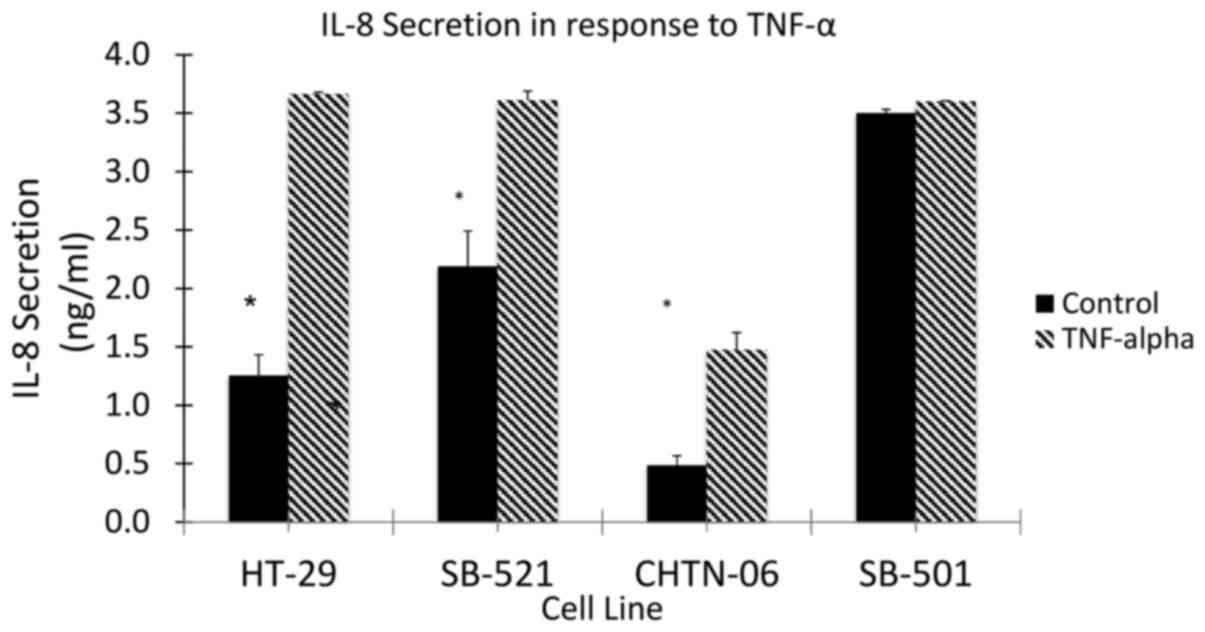
To assess the response to inflammation in the three
AA cell lines (CHTN06, SB501 and SB521), TNF-α was used to induce
an inflammatory state and the subsequent secretion of IL-8 was
quantified by ELISA (Fig. 8). The
AA cell lines, as well as the CA cell line HT-29, demonstrated an
increase in the production of IL-8 in response to stimulation by
TNF-α. However, even in the absence of TNF-α, a higher level of
IL-8 secretion was observed in the AA cell lines SB501 and SB521.
This would suggest the presence of a basal inflammatory state up to
2.6-fold higher compared with HT-29. Taking into consideration the
significant differential secretion of IL-8 in response to TNF-α
between the AA cell lines and HT-29, future experiments are being
planned to investigate the response to anti-inflammatory cytokines,
such as IL-10, and anti-inflammatory drugs associated with CRC
prevention, such as aspirin and other NSAIDs (12,13).
Discussion
The availability of the appropriate cell culture and
animal models is crucial for studying the development and
chemo-responsiveness of colonic diseases in vitro and in
vivo. Particularly important for addressing issues of racial
disparity in CRC is the access to cell lines of diverse
populations. These cell lines allow for the characterization of
cellular and molecular properties responsible for the differential
CRC incidence observed in AAs compared with CAs. Cell culture and
animal models exist for cell lines derived from the tissue of CA
CRC patients. However, such tools for studying CRC with an AA
background did not exist to date. In the present study, the unique
CRC cell lines CHTN06, SB501 and SB521 were established and
characterized. Each respective cell line was derived from a single
human patient sample and exhibited histological characteristics
consistent with well-differentiated colonic epithelial cell
lineage. The epithelial nature of each cell line was further
confirmed by photomicroscopy, electron microscopy and H&E
staining. Additionally, it was demonstrated that the three cell
lines proliferate under cell culture conditions, undergo
subculturing without immortalization, and are readily established
as engrafted tumors in mouse xenograft models. STR DNA profiling at
multiple culturing passages matched the original patient tissue for
CHTN06 and SB501; while SB521 did not match the original patient
specimen with confidence, further analysis concluded that this cell
line is MSI-H, thus explaining the high degree of genomic
instability. This characteristic will be used as a model for
studying MSI-H in CRC patients of African background. Additionally,
extensive search of the STR DNA profile for each of the three AA
cell lines revealed that they are unique among all cell
repositories. These cell lines represent a novel and valuable tool
for investigating the molecular differences involved in the
disparity in the incidence of CRC and response to chemotherapeutic
and anti-inflammatory agents observed in AAs in respect to CAs.
Several transcription factors are known to be
dysregulated in CRC tissue. p53 regulates the cell cycle by
arresting growth in the G1/S transition and initiating apoptosis
(30). p53 expression in CHTN06
and SB521 was found to be downregulated compared with HT-29. p53
nuclear accumulation, which is characteristic of aberrant mutant
p53 expression, was observed in all three AA CRC cell lines.
Sequestration of p53 in the nucleus is well-characterized in cases
of CRC with mutant TP53 (31,32).
Indeed, the CHTN06 cell line was found, as determined by sequencing
of the region of interest (Agilent Technologies, Inc., Santa Clara,
CA, USA), to have a single nuclear polymorphism at residue 72,
namely Pro/Pro as opposed to the favorable wild-type Arg/Arg (data
not shown). We also reported the increased expression of villin-1
in CHTN06, SB521 and SB501 cells compared with the HT-29 cell line.
Villin-1, a member of the calcium-regulated actin-binding family,
functions in the bundling, capping and severing of actin filaments,
and its expression has been associated with tumors that are better
differentiated (23,24), a feature observed in the CRC cells
of AA background. There was no notable expression of villin-1 in
HCT116 and SW680 cells. To date, no definitive molecular markers
have been identified that would allow for early detection, optimal
therapeutic treatment and/or possible chemoprevention of CRC. This
is particularly true for AA patients with CRC. Barriers to this
have been the unavailability or limited availability of CRC cell
lines or tissues from AA patients with CRC.
Dysregulation of miRNAs are well-documented across
several types of cancer, and may serve as potential biomarkers for
cancer classification and prognosis (33). miRNAs may act as either tumor
suppressors by inhibiting oncogenic gene expression or, conversely,
as oncomirs by inhibiting tumor suppressor gene expression. Our
laboratory has previously reported dysregulated levels of several
miRNAs in CRC tissue samples from AA patients as compared to CA CRC
samples (34). In the present
study, miR-17, miR-21, miR-128-3p, miR-182-5p, miR-210-3p and
miR-222 were found to be differentially expressed in the three
novel AA CRC cell lines as compared to some or all of the CA CRC
cell lines. Cellular proliferation, carcinogenesis and metastasis
of CRC are strongly correlated with aberrant expression of three of
these miRNAs. For example, miR-182 suppresses the expression of
FBXW7, a subunit of the phosphorylation-dependent ubiquitin protein
ligase complex SCF, which acts as a tumor suppressor (35). This miRNA is also known to ablate
expression of SATB2, a DNA-binding protein at nuclear matrix or
scaffolding attachment regions, which in turn induces both
metastasis and epithelial-to-mesenchymal transition in CRC
(36). miR-210 has been shown in
vitro to be inducible by hypoxia-inducible factor-1 in a hypoxic
environment. This miRNA specifically targets VMP1, a stress-induced
protein that promotes the formation of intracellular vacuoles
leading to cell death (37).
Therefore, increased diagnostic and prognostic efficacy for racial
and ethnic diverse patients may be addressed by further exploration
into dysregulations in the expression of miRNAs.
Inflammation has been documented as a risk factor
for the initiation and progression of CRC (29). As such, the expression profile of
the inflammatory proteins was examined in the CHTN06, SB501, SB521
and HT-29 cell lines in terms of cell signaling (cytokines). It was
demonstrated that the AA cell lines display differential responses
to pro-inflammatory cytokines (TNF-α) involved in cell
proliferation and CRC progression (38,39),
as the levels of IL-8 secretion in the AA cell lines differed from
those in the CA cell line HT-29. Possible explanations for our
results may include i) the MSI-H status of SB-521; ii) the aberrant
expression of MMR protein by all three cell lines; and iii) the
reported correlation of these genetic characteristics with
inflammation in CRC (40). Since
this cytokine has been suggested as a biomarker for predicting
response to 5-fluoruracil and cancer progression in CRC patients
(41), the role of IL-8 secretion
and inflammation in the AA cell lines post-treatment with 5-FU is
being investigated; this may enable us to elucidate the role of the
differential expression of inflammatory proteins in CRC racial
disparities.
In conclusion, we herein report the establishment of
three novel stable cell lines (CHTN06, SB501 and SB521) derived
from AA CRC tissue samples. These cell lines are able to propagate
in long-term culture, are tumorigenic in immuno-compromised mice
and have been cryopreserved for future experimentation. We
demonstrated that these three cell lines share the characteristics
of well-documented CA CRC cell lines, while at the same time they
exhibit differences in the expression of several miRNAs,
tumor-promoting proteins and inflammatory responses. The AA CRC
cell lines described herein were generated to serve as models
appropriate for generation and assessment of biomarkers for the
early detection of colon cancer and prediction of therapeutic
response. These cell lines alone are not anticipated to address
racial health disparity, but rather to serve as a starting point.
The authors are continuously working to generate additional cell
lines and, with a statistically valid sample size, we hope to be
able to discern differences between AA and CA, as well as among
individual AA colon cancer patients. Differential expression of
miRNA and different DNA methylation profiles were found between AA
and CA colon cancer patients (34,42).
As no two individuals are alike, regardless of race or ethnicity,
intra-racial and intra-ethnic differences are expected. Overall,
the goal of the present study was to generate progress in the field
of personalized medicine, which benefits all racial and ethnic
groups. Thus, the cell lines described herein will address the need
for inclusion.
Funding
This study was supported in part by grants
R01CA140487 and P20CA192994-03 Diversity Supplement.
Acknowledgments
The authors would like to thank the Cooperative
Human Tissue Network for providing the patient CRC tissues used in
this study. The Cooperative Human Tissue Network is supported by
the National Cancer Institute. We would also like to thank the
Biobank of Stony Brook Medicine for providing the tissue samples
used to generate 'SB' cell lines. Other investigators may have
received specimens from the same subjects. Technical support for
histological studies was provided by the Stony Brook Medicine
Research Histology Core Lab. The authors wish to thank Ms. Carol
Ann Amella and Ms. Michele McTernan for editorial assistance and
Maria Munoz-Sagastibelza, MS, for technical support. We would also
like to thank Dr Ellen Li, whose parent grant (P20CA192994) was
used to obtain the graduate student's diversity supplemental
grant.
Abbreviations:
|
CRC
|
colorectal cancer
|
|
AA
|
African American
|
|
CA
|
Caucasian American
|
|
ATCC
|
American Type Culture Collection
|
|
CHTN
|
Cooperative Human Tissue Network
|
|
SBUMC
|
Stony Brook University Medical
Center
|
Availability of data and materials
The data generated and analyzed in the present study
are available from the corresponding author on reasonable
request.
Authors' contributions
JP: Study design; data acquisition, analysis and
interpretation; drafting and proofreading of manuscript. PJ: Data
acquisition, analysis and interpretation; drafting of manuscript.
JFL: Data acquisition, analysis and interpretation; drafting of
manuscript. KRS: Analysis of data; supervisory role. LMR: Analysis
and interpretation of data; proofreading of manuscript; supervisory
role (JP). JLW: Study conception and design; analysis and
interpretation of data; funding acquisition; project administration
and supervision; drafting and proofreading of manuscript. All the
authors have read and approved the final version of the
manuscript.
Ethics approval and consent to
participate
This study was approved by the Stony Brook
University Institutional Review Board (approval no. 93677). Patient
CRC samples and metadata obtained from CHTN and SBUMC were
completely de-identified, assigned independent patient codes prior
to release to the researchers, and qualified for a waiver of
consent per 45CFR46.116.d. All animals were treated strictly in
accordance with the National Institutes of Health guidelines for
the care and use of laboratory animals, and the protocols used were
approved by the IACUC at the State University of New York at Stony
Brook (Animal Welfare Assurance no. A3011-01).
Patient consent for publication
Not applicable.
Competing interests
The authors declare that they have no competing
interests to disclose.
References
|
1
|
Lieberman DA, Holub JL, Moravec MD, Eisen
GM, Peters D and Morris CD: Prevalence of colon polyps detected by
colonoscopy screening in asymptomatic black and white patients.
JAMA. 300:1417–1422. 2008. View Article : Google Scholar : PubMed/NCBI
|
|
2
|
Alexander D, Jhala N, Chatla C, Steinhauer
J, Funkhouser E, Coffey CS, Grizzle WE and Manne U: High-grade
tumor differentiation is an indicator of poor prognosis in African
Americans with colonic adenocarcinomas. Cancer. 103:2163–2170.
2005. View Article : Google Scholar : PubMed/NCBI
|
|
3
|
Chien C, Morimoto LM, Tom J and Li CI:
Differences in colorectal carcinoma stage and survival by race and
ethnicity. Cancer. 104:629–639. 2005. View Article : Google Scholar : PubMed/NCBI
|
|
4
|
Clegg LX, Li FP, Hankey BF, Chu K and
Edwards BK: Cancer survival among US whites and minorities: A SEER
(Surveillance, Epidemiology, and End Results) Program
population-based study. Arch Intern Med. 162:1985–1993. 2002.
View Article : Google Scholar : PubMed/NCBI
|
|
5
|
Cooper GS, Yuan Z and Rimm AA: Racial
disparity in the incidence and case-fatality of colorectal cancer:
Analysis of 329 United States counties. Cancer Epidemiol Biomarkers
Prev. 6:283–285. 1997.PubMed/NCBI
|
|
6
|
Hodgson DC, Fuchs CS and Ayanian JZ:
Impact of patient and provider characteristics on the treatment and
outcomes of colorectal cancer. J Natl Cancer Inst. 93:501–515.
2001. View Article : Google Scholar : PubMed/NCBI
|
|
7
|
Hodgson DC, Zhang W, Zaslavsky AM, Fuchs
CS, Wright WE and Ayanian JZ: Relation of hospital volume to
colostomy rates and survival for patients with rectal cancer. J
Natl Cancer Inst. 95:708–716. 2003. View Article : Google Scholar : PubMed/NCBI
|
|
8
|
Mayberry RM, Coates RJ, Hill HA, Click LA,
Chen VW, Austin DF, Redmond CK, Fenoglio-Preiser CM, Hunter CP,
Haynes MA, et al: Determinants of black/white differences in colon
cancer survival. J Natl Cancer Inst. 87:1686–1693. 1995. View Article : Google Scholar : PubMed/NCBI
|
|
9
|
Ries LAG, Kosary CL, Hankey BF, Miller BA,
Harras A and Edwards BK: SEER Cancer Statistics Review. 1973–1994.
1997.
|
|
10
|
Weber TK, Chin HM, Rodriguez-Bigas M,
Keitz B, Gilligan R, O'Malley L, Urf E, Diba N, Pazik J and
Petrelli NJ: Novel hMLH1 and hMSH2 germline mutations in African
Americans with colorectal cancer. JAMA. 281:2316–2320. 1999.
View Article : Google Scholar : PubMed/NCBI
|
|
11
|
Carethers JM: Racial and ethnic factors in
the genetic pathogenesis of colorectal cancer. J Assoc Acad Minor
Phys. 10:59–67. 1999.
|
|
12
|
Burn J, Gerdes AM, Macrae F, Mecklin JP,
Moeslein G, Olschwang S, Eccles D, Evans DG, Maher ER, Bertario L,
et al: CAPP2 Investigators: Long-term effect of aspirin on cancer
risk in carriers of hereditary colorectal cancer: An analysis from
the CAPP2 randomised controlled trial. Lancet. 378:2081–2087. 2011.
View Article : Google Scholar : PubMed/NCBI
|
|
13
|
Tougeron D, Sha D, Manthravadi S and
Sinicrope FA: Aspirin and colorectal cancer: Back to the future.
Clin Cancer Res. 20:1087–1094. 2014. View Article : Google Scholar :
|
|
14
|
Waugh DJ and Wilson C: The interleukin-8
pathway in cancer. Clin Cancer Res. 14:6735–6741. 2008. View Article : Google Scholar : PubMed/NCBI
|
|
15
|
De Simone V, Franzè E, Ronchetti G,
Colantoni A, Fantini MC, Di Fusco D, Sica GS, Sileri P, MacDonald
TT, Pallone F, et al: Th17-type cytokines, IL-6 and TNF-α
synergistically activate STAT3 and NF-kB to promote colorectal
cancer cell growth. Oncogene. 34:3493–3503. 2015. View Article : Google Scholar
|
|
16
|
Goodman JE, Bowman ED, Chanock SJ, Alberg
AJ and Harris CC: Arachidonate lipoxygenase (ALOX) and
cyclo-oxygenase (COX) polymorphisms and colon cancer risk.
Carcinogenesis. 25:2467–2472. 2004. View Article : Google Scholar : PubMed/NCBI
|
|
17
|
Sansbury LB, Millikan RC, Schroeder JC,
Moorman PG, North KE and Sandler RS: Use of nonsteroidal
antiinflammatory drugs and risk of colon cancer in a
population-based, case-control study of African Americans and
Whites. Am J Epidemiol. 162:548–558. 2005. View Article : Google Scholar : PubMed/NCBI
|
|
18
|
Mackenzie GG, Sun Y, Huang L, Xie G,
Ouyang N, Gupta RC, Johnson F, Komninou D, Kopelovich L and Rigas
B: Phosphosulindac (OXT-328), a novel sulindac derivative, is safe
and effective in colon cancer prevention in mice. Gastroenterology.
139:1320–1332. 2010. View Article : Google Scholar : PubMed/NCBI
|
|
19
|
Ouyang N, Williams JL and Rigas B:
NO-donating aspirin isomers downregulate peroxisome
proliferator-activated receptor (PPAR)delta expression in
APC(min/+) mice proportionally to their tumor inhibitory effect:
Implications for the role of PPARdelta in carcinogenesis.
Carcinogenesis. 27:232–239. 2006. View Article : Google Scholar
|
|
20
|
Ouyang N, Ji P and Williams JL: A novel
NSAID derivative, phosphoibuprofen, prevents AOM-induced colon
cancer in rats. Int J Oncol. 42:643–650. 2013. View Article : Google Scholar : PubMed/NCBI
|
|
21
|
Williams JL, Ji P, Ouyang N, Kopelovich L
and Rigas B: Protein nitration and nitrosylation by NO-donating
aspirin in colon cancer cells: Relevance to its mechanism of
action. Exp Cell Res. 317:1359–1367. 2011. View Article : Google Scholar : PubMed/NCBI
|
|
22
|
Puvvada SD, Funkhouser WK, Greene K, Deal
A, Chu H, Baldwin AS, Tepper JE and O'Neil BH: NF-κB and Bcl-3
activation are prognostic in metastatic colorectal cancer.
Oncology. 78:181–188. 2010. View Article : Google Scholar :
|
|
23
|
Al-Maghrabi J, Gomaa W, Buhmeida A,
Al-Qahtani M and Al-Ahwal M: Loss of villin immunoexpression in
colorectal carcinoma is associated with poor differentiation and
survival. ISRN Gastroenterol. 2013:6797242013.PubMed/NCBI
|
|
24
|
Arango D, Al-Obaidi S, Williams DS, Dopeso
H, Mazzolini R, Corner G, Byun DS, Carr AA, Murone C, Tögel L, et
al: Villin expression is frequently lost in poorly differentiated
colon cancer. Am J Pathol. 180:1509–1521. 2012. View Article : Google Scholar : PubMed/NCBI
|
|
25
|
Brat DJ, Bellail AC and Van Meir EG: The
role of interleukin-8 and its receptors in gliomagenesis and
tumoral angiogenesis. Neuro Oncol. 7:122–133. 2005. View Article : Google Scholar : PubMed/NCBI
|
|
26
|
Alfaro C, Suárez N, Martínez-Forero I,
Palazón A, Rouzaut A, Solano S, Feijoo E, Gúrpide A, Bolaños E,
Erro L, et al: Carcinoma-derived interleukin-8 disorients dendritic
cell migration without impairing T-cell stimulation. PLoS One.
6:e179222011. View Article : Google Scholar : PubMed/NCBI
|
|
27
|
Frouws MA, Reimers MS, Swets M,
Bastiaannet E, Prinse B, van Eijk R, Lemmens VE, van Herk-Sukel MP,
van Wezel T, Kuppen PJ, et al: The influence of BRAF and KRAS
mutation status on the association between aspirin use and survival
after colon cancer diagnosis. PLoS One. 12:e01707752017. View Article : Google Scholar : PubMed/NCBI
|
|
28
|
Zhao S, Wu D, Wu P, Wang Z and Huang J:
Serum IL-10 Predicts worse outcome in cancer patients: A
meta-analysis. PLoS One. 10:e01395982015. View Article : Google Scholar : PubMed/NCBI
|
|
29
|
Peddareddigari VG, Wang D and Dubois RN:
The tumor microenvironment in colorectal carcinogenesis. Cancer
Microenviron. 3:149–166. 2010. View Article : Google Scholar
|
|
30
|
Rodrigues NR, Rowan A, Smith ME, Kerr IB,
Bodmer WF, Gannon JV and Lane DP: p53 mutations in colorectal
cancer. Proc Natl Acad Sci USA. 87:7555–7559. 1990. View Article : Google Scholar : PubMed/NCBI
|
|
31
|
Bosari S, Viale G, Bossi P, Maggioni M,
Coggi G, Murray JJ and Lee AK: Cytoplasmic accumulation of p53
protein: An independent prognostic indicator in colorectal
adenocarcinomas. J Natl Cancer Inst. 86:681–687. 1994. View Article : Google Scholar : PubMed/NCBI
|
|
32
|
Bosari S, Viale G, Roncalli M, Graziani D,
Borsani G, Lee AK and Coggi G: p53 gene mutations, p53 protein
accumulation and compartmentalization in colorectal adenocarcinoma.
Am J Pathol. 147:790–798. 1995.PubMed/NCBI
|
|
33
|
Iorio MV and Croce CM: Causes and
consequences of microRNA dysregulation. Cancer J. 18:215–222. 2012.
View Article : Google Scholar : PubMed/NCBI
|
|
34
|
Li E, Ji P, Ouyang N, Zhang Y, Wang XY,
Rubin DC, Davidson NO, Bergamaschi R, Shroyer KR, Burke S, et al:
Differential expression of miRNAs in colon cancer between African
and Caucasian Americans: Implications for cancer racial health
disparities. Int J Oncol. 45:587–594. 2014. View Article : Google Scholar : PubMed/NCBI
|
|
35
|
Li L, Sarver AL, Khatri R, Hajeri PB,
Kamenev I, French AJ, Thibodeau SN, Steer CJ and Subramanian S:
Sequential expression of miR-182 and miR-503 cooperatively targets
FBXW7, contributing to the malignant transformation of colon
adenoma to adenocarcinoma. J Pathol. 234:488–501. 2014. View Article : Google Scholar : PubMed/NCBI
|
|
36
|
Yang MH, Yu J, Jiang DM, Li WL, Wang S and
Ding YQ: microRNA-182 targets special AT-rich sequence-binding
protein 2 to promote colorectal cancer proliferation and
metastasis. J Transl Med. 12:1092014. View Article : Google Scholar : PubMed/NCBI
|
|
37
|
Qu A, Du L, Yang Y, Liu H, Li J, Wang L,
Liu Y, Dong Z, Zhang X, Jiang X, et al: Hypoxia-inducible MiR-210
is an independent prognostic factor and contributes to metastasis
in colorectal cancer. PLoS One. 9:e909522014. View Article : Google Scholar : PubMed/NCBI
|
|
38
|
Viatour P, Merville MP, Bours V and
Chariot A: Phosphorylation of NF-kappaB and IkappaB proteins:
Implications in cancer and inflammation. Trends Biochem Sci.
30:43–52. 2005. View Article : Google Scholar : PubMed/NCBI
|
|
39
|
Brew R, Erikson JS, West DC, Kinsella AR,
Slavin J and Christmas SE: Interleukin-8 as an autocrine growth
factor for human colon carcinoma cells in vitro. Cytokine.
12:78–85. 2000. View Article : Google Scholar : PubMed/NCBI
|
|
40
|
Carethers JM, Koi M and Tseng-Rogenski SS:
EMAST is a form of microsatellite instability that is initiated by
inflammation and modulates colorectal cancer progression. Genes
(Basel). 6:185–205. 2015. View Article : Google Scholar :
|
|
41
|
Jin WJ, Xu JM, Xu WL, Gu DH and Li PW:
Diagnostic value of interleukin-8 in colorectal cancer: A
case-control study and meta-analysis. World J Gastroenterol.
20:16334–16342. 2014. View Article : Google Scholar : PubMed/NCBI
|
|
42
|
Wang X, Ji P, Zhang Y, LaComb JF, Tian X,
Li E and Williams JL: Aberrant DNA Methylation: Implications in
Racial Health Disparity. PLoS One. 11:e01531252016. View Article : Google Scholar : PubMed/NCBI
|