Introduction
Liver cancer (LC) is the second main cause of
cancer-associated mortality threatening global public health, with
hepatocellular carcinoma (HCC) being the main histopathological
subtype (1,2). In the United States, the American
Cancer Society projects that >30,000 patients will succumb to LC
in 2018 (3). Currently, patients
with unresectable advanced LC are treated with chemotherapy as the
main therapeutic strategy (4,5), and
antitumor drug research has made considerable advancements in
recent years. However, due to drug resistance, conventional
pharmacotherapy often fails to produce satisfactory results for
patients with LC (6-8). In addition, the majority of the
chemotherapeutic agents currently available for LC treatment are
highly cytotoxic and have adverse side effects (9,10).
Thus, novel low-toxicity drugs that can provide a high response
rate for LC treatment are urgently required.
One class of potentially promising drug targets for
LC is the topoisomerases, which are important ribozymes that serve
key roles in cell growth by breaking and reconnecting DNA strands
to alter DNA topology (11,12).
Two topoisomerases are recognized: Topoisomerase 1 (TOP1) and
topoisomerase 2 (TOP2); TOP2A is the main isoform of TOP2. TOP1 and
TOP2A are tumor drivers in a myriad of malignant tumors (13-15),
making them attractive and effective targets for the development of
antitumor medicines (16,17). Numerous TOP inhibitors, including
etoposide, Adriamycin and camptothecin, are now widely used in the
clinical setting (18-20). However, the conventional TOP
inhibitors have severe side effects that offset their antitumor
potential, necessitating a search for novel TOP inhibitors with
fewer side effects.
Natural products are receiving increasing attention
as antitumor drugs due to their low tissue toxicity and extensive
biological activities. One such product, nitidine chloride (NC), a
major active compound of the traditional Chinese herb
Zanthoxylum nitidum (Roxb) DC, has proven effective at
suppressing the growth of various malignant tumors (21-23),
including LC (9,24,25).
Previous studies have indicated that the cytotoxic target of NC
could be the topoisomerases (26,27),
but the exact action mode of NC with respect to TOP1 and TOP2A
activity has not yet been established.
The present study investigated the expression,
clinical value and potential pathological role of TOP1 and TOP2A in
LC using immunohistochemistry (IHC), data mining and bioinformatics
analyses. Reverse transcription-quantitative polymerase chain
reaction (RT-qPCR), IHC staining and molecular docking were then
used to determine the inhibitory effects of NC on TOP1 and
TOP2A.
Materials and methods
In vivo LC xenografts in nude mice
A total of 32 BALB/c nude mice (16 males and 16
females; 6 weeks old) with an initial body weight of 18-20 g were
purchased from Shanghai SLAC Laboratory Animal Co., Ltd. (Shanghai,
China). The mice were maintained in specific pathogen-free
conditions, using a 12 h light/12 h dark cycle at a temperature of
24°C. All animal experiments were conducted according to the
international ethics guidelines and the National Institutes of
Health Guide Concerning the Care and Use of Laboratory Animals. The
Ethics Committee of the First Affiliated Hospital of Guangxi
Medical University (Nanning, China) approved the study. HepG2 cells
(1×10¹⁰ cells/l) were subcutaneously injected into the
right armpit of each nude mouse. The drug administration began 7
days after xenograft implantation. Mice were randomized into four
groups of 8 mice: The negative control group with a daily
intraperitoneal injection of saline for 14 days, and the high-,
medium- and low-NC groups, with a daily intraperitoneal injection
of 10, 5 or 2.5 mg/kg NC, respectively, for 14 days. The tumor
volume was determined by the following formula: Tumor volume = π/6
× length × width2. The maximum tumor volume did not
exceed 1,600 mm3 in either group. At the end of the
experiment, the mice were euthanized and then the tumors were
excised and stored at −80°C prior to reverse
transcription-quantitative polymerase chain reaction (RT-qPCR)
experiments. The tumor tissues were fixed in 10% formaldehyde at
room temperature for 12 h and paraffin-embedded prior to use in
further IHC experiments.
Immunohistochemistry staining
Two tissue microarrays containing a total of 261 HCC
samples and 33 non-tumor tissues were purchased from Pantomics,
Inc. (Richmond, CA, USA). All tissues were treated according to
appropriate applicable laws to protect the privacy of individual
patients. Three pairs of NC-treated and NC-untreated tumor tissues
were also obtained from the aforementioned LC nude mouse
xenografts. Immunohistochemistry (IHC) staining was performed on
deparaffinized 4-µm thick sections according to the
manufacturer’s protocols. Endogenous peroxidase activity was
blocked with 3% hydrogen peroxide at room temperature for 10 min.
Rabbit monoclonal anti-TOP1 antibody (1:100 dilution; catalog no.
ab109374) and rabbit monoclonal anti-TOP2A + TOP2B antibody (1:100
dilution; catalog no. ab109524) (both from Abcam, Cambridge, MA,
USA) were used for the tissue microarrays. Mouse monoclonal
anti-TOP1 antibody (1:50 dilution; catalog no. sc32736) and
monoclonal anti-TOP2A antibody (1:50 dilution; catalog no.
sc365916) (both from Santa Cruz Biotechnology, Inc., Dallas, TX,
USA) were used for the tumor tissues from the nude mouse LC
xenografts. Two pathologists examined all immunostained tissues by
microscopy and scored them independently according to the following
two criteria: i) The staining intensity was determined as 0 (no
staining), 1 (weak staining), 2 (moderate staining) and 3 (strong
staining); ii) the staining percentage of tumor cells was scored as
0 (<5%), 1 (5-25%), 2 (26-50%), 3 (51-75%) and 4 (76-100%). The
percentages of positively stained cell nuclei were calculated for
>1,000 cells in five successive and representative high-power
fields (×400 magnification). An immunoreactive score (IRS) was
calculated to determine the final staining score by multi- plying
the intensity score by the percentage score. All samples were
allocated to a positive (IRS≥6) or negative (IRS<6) group.
RT-qPCR
Total RNA was isolated and purified from three
NC-treated LC tissues and three control groups. RT-qPCR was
performed using SYBR-Green with an iCycler iQ RT-qPCR system
(Bio-Rad, Inc., Hercules, CA, USA). GAPDH served as the endogenous
control. The primer sequences synthesized by Takara Bio, Inc.,
(Otsu, Japan) were as follows: GAPDH forward,
5′-AAGAAGGTGGTGAAGCAGGC-3′ and reverse, 5′-TCCACCACCCTGTTGCTGTA-3′;
TOP1 forward, 5′-GGTGAGAAGGACTGGCAGAAAT-3′ and reverse,
5′-CTTGTCGATGAAGTACAGGGCTA-3′; and TOP2A forward,
5′-CGGAATGACAAGCGAGAAGTAA-3′ and reverse,
5′-GCATTGTAAAGATGTATCGTGGAC-3′. All samples were run in triplicate,
and the mean of the three assays was used as the quantitation cycle
(Cq) value. The relative expression of TOP1 and TOP2A was
determined with the 2−∆ΔCq method (28).
Data mining
Relevant microarray and RNA sequencing (RNA-seq)
datasets providing expression data for TOP1 and TOP2A were
collected from the Gene Expression Omnibus (29), Oncomine (30), ArrayExpress (31) and The Cancer Genome Atlas (TCGA)
(32) databases using the
following search terms: (hepatocellular OR liver OR hepatic OR HCC)
and (cancer OR carcinoma OR tumor OR neoplas* OR malignan*).
Two reviewers independently gathered the following
essential information from all available datasets: First author,
publication year, region, dataset, platform, sample size of cancer
group and normal control group, and expression of TOP1 and TOP2A.
Any disagreement was settled by discussion with a third
investigator.
All expression data were log2-transformed. The
expression levels of TOP1 and TOP2A in each dataset were compared
using Student’s t-test and presented as scatter plots. The results
from individual microarrays were not consistent, necessitating a
comprehensive analysis. The combined standard mean deviation (SMD)
and its 95% confidence intervals (CIs) were calculated to
investigate the expression levels of TOP1 and TOP2. A summary
receiver operating characteristic (SROC) curve was generated, and
the area under the curve (AUC) value was calculated to provide a
further estimate of the capability of TOP1 and TOP2A to
discriminate HCC patients from normal controls. The inter-study
heterogeneity was evaluated by the χ2-based Q test and
I2 statistic. A random-effects model was selected to
pool the SMD if heterogeneity existed (I2>50% or
P<0.05); otherwise, a fixed-effects model was selected. Begg’s
and Egger’s tests were applied to estimate the potential
publication bias. All these analyses were performed using STATA
12.0 software (Stata Corporation, College Station, TX, USA).
P<0.05 was considered statistically significant.
The prognostic roles of TOP1 and TOP2A were also
assessed using data from TCGA. The alterations in TOP1 and TOP2A
expression were investigated with data from cBio- Portal (33). The protein expression of TOP1 and
TOP2A was also validated by data from The Human Protein Atlas
(34).
Bioinformatics analysis
Genes that were co-expressed with TOP1 and TOP2A,
and showed correlation coefficients r≥0.3 or r≤−0.3, were acquired
from cBioPortal. Gene Ontology (GO) annotation, Kyoto Encyclopedia
of Genes and Genomes (KEGG) pathway and Panther pathway analyses
were implemented using the Database for Annotation, Visualization
and Integrated Discovery 6.7 (https://david-d.ncifcrf.gov/) (35). Disease Ontology (DO) analysis was
performed with the R package ‘DOSE’ (www.bioconductor.org/packages/release/bioc/html/DOSE.html).
Molecular docking
Molecular docking studies were conducted using SYBYL
2.0 software (Tripos, Inc., St. Louis, MO, USA) to investigate the
interactions between NC and TOP1/TOP2A. The crystal structures of
the TOP1 and TOP2A proteins were obtained from the Protein Data
Bank (36). The three-dimensional
structure building and modeling were performed using the SYBYL 2.0
program package. Retrieved hits for docking studies were added to
the hydrogen atoms and the charge was given by Gasteiger-Huckel
calculations, which optimize the structure of compounds and predict
the combination between compounds and a protein. Energy
minimizations were performed using the Tripos force field with an
energy optimization gradient convergence criterion provided by the
system (37-39). A total score >6 indicated a
favored affinity between NC and TOP1/TOP2A.
Statistical analysis
All statistical analyses were conducted with SPSS
22.0 (IBM Corp., Armonk, NY, USA). Continuity variable results were
represented as the mean ± standard deviation. Student’s t-test or
one-way analysis of variance (ANOVA) was used for comparison
between groups. A Least Significant Difference analysis was
performed if the result of the ANOVA was statistically significant.
P<0.05 was considered to indicate a statistically significant
difference.
Results
TOP1 and TOP 2 are highly expressed in
HCC tissues based on IHC staining
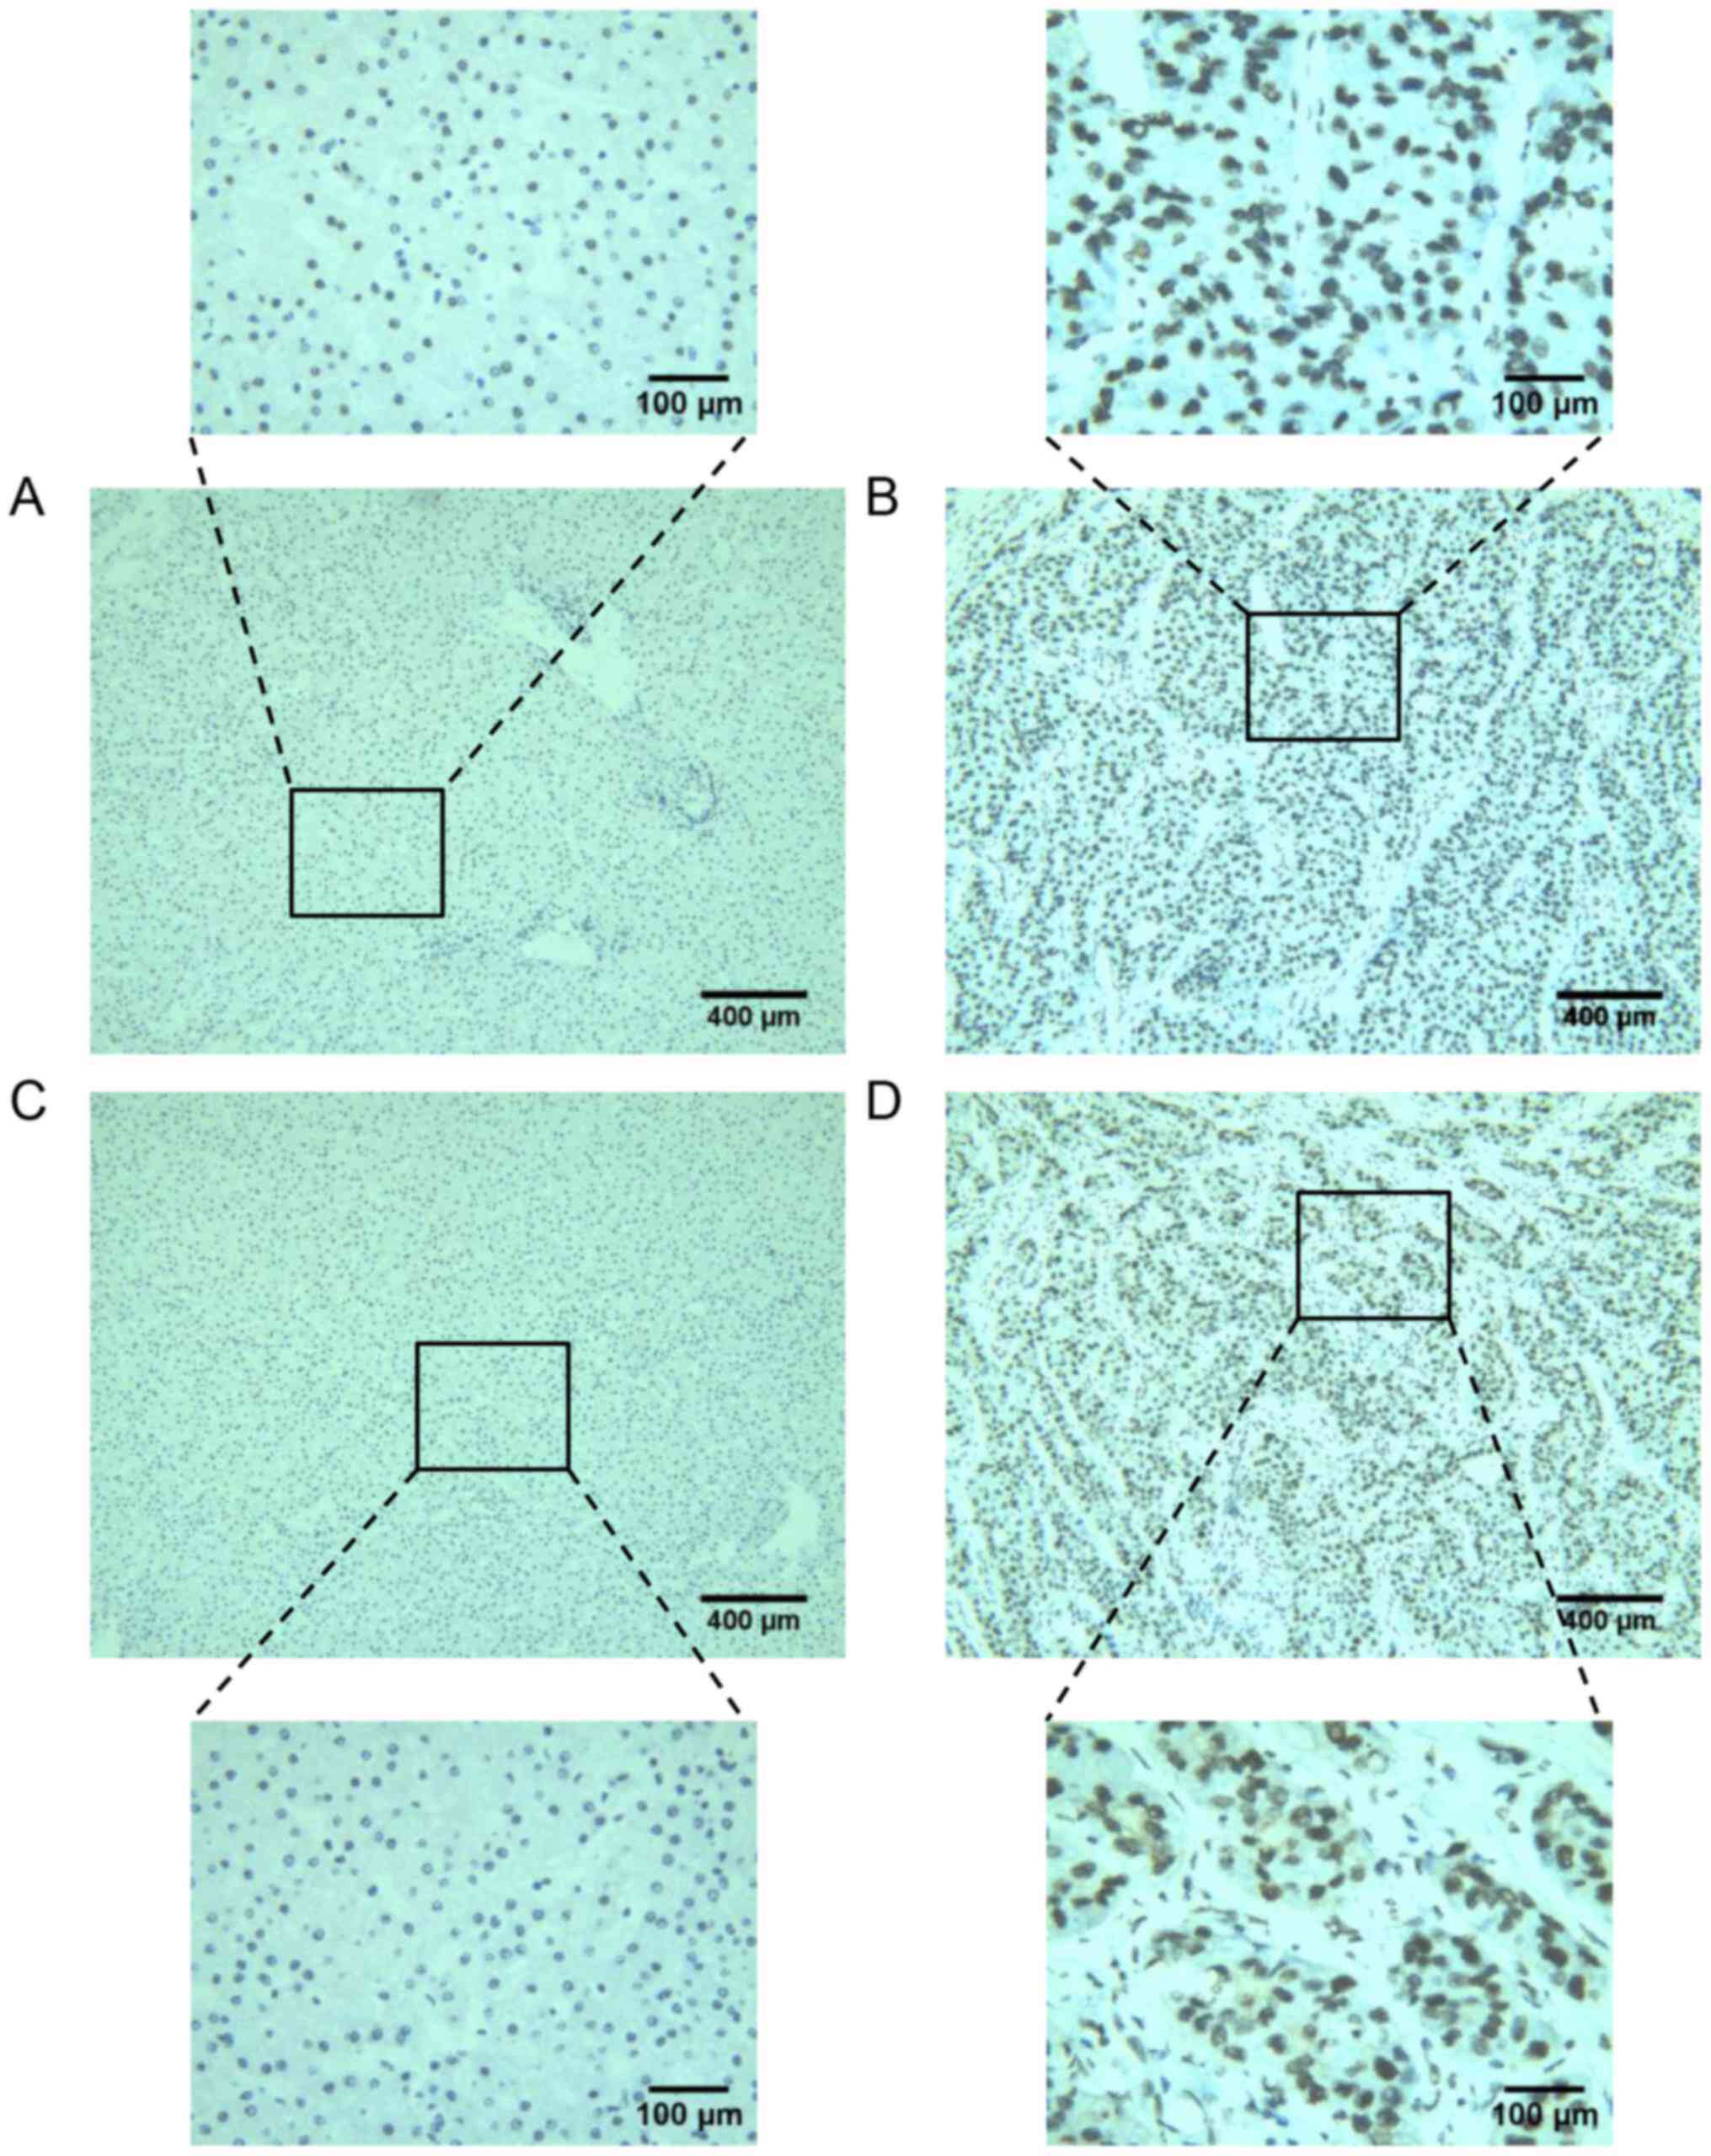
IHC staining revealed the expression of the TOP1 and
TOP2A proteins in 261 HCC tissues and 33 non-tumor tissues. For
TOP1, the positive rate was 25.7% (67/261) in tumor tissues and
3.0% (1/33) in non-tumor tissues (Fig.
1A and B). For TOP2A, the positive rate was 24.9% (65/261) in
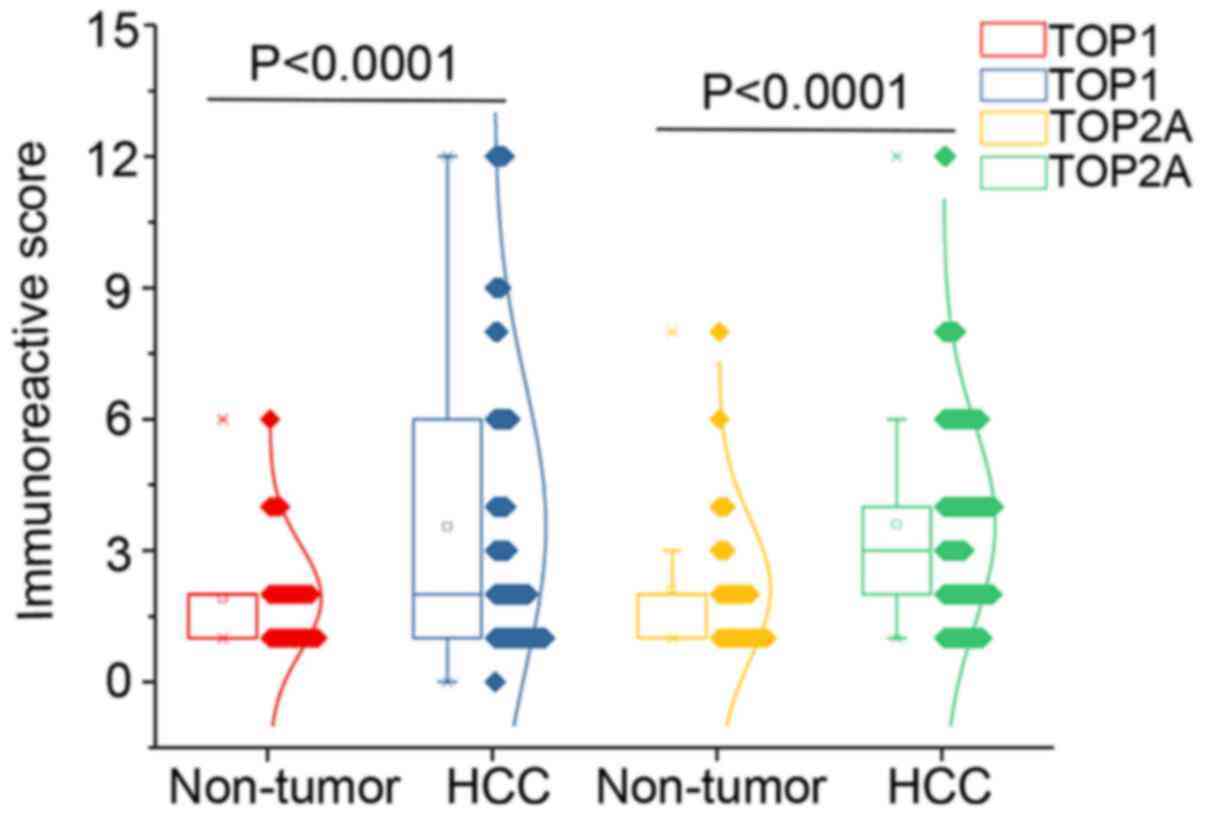
tumor tissues and 6.1% (2/33) in non-tumor tissues (Fig. 1C and D). Assessment of the
expression patterns of the TOP1 and TOP2A proteins in tumor tissues
and corresponding non-cancerous tissues with Student’s t-test and
visualization in the form of scatter-box plots revealed a marked
upregulation of TOP1 and TOP2A in HCC tissues (TOP1, P<0.0001;
TOP2A, P<0.0001) (Fig. 2). The
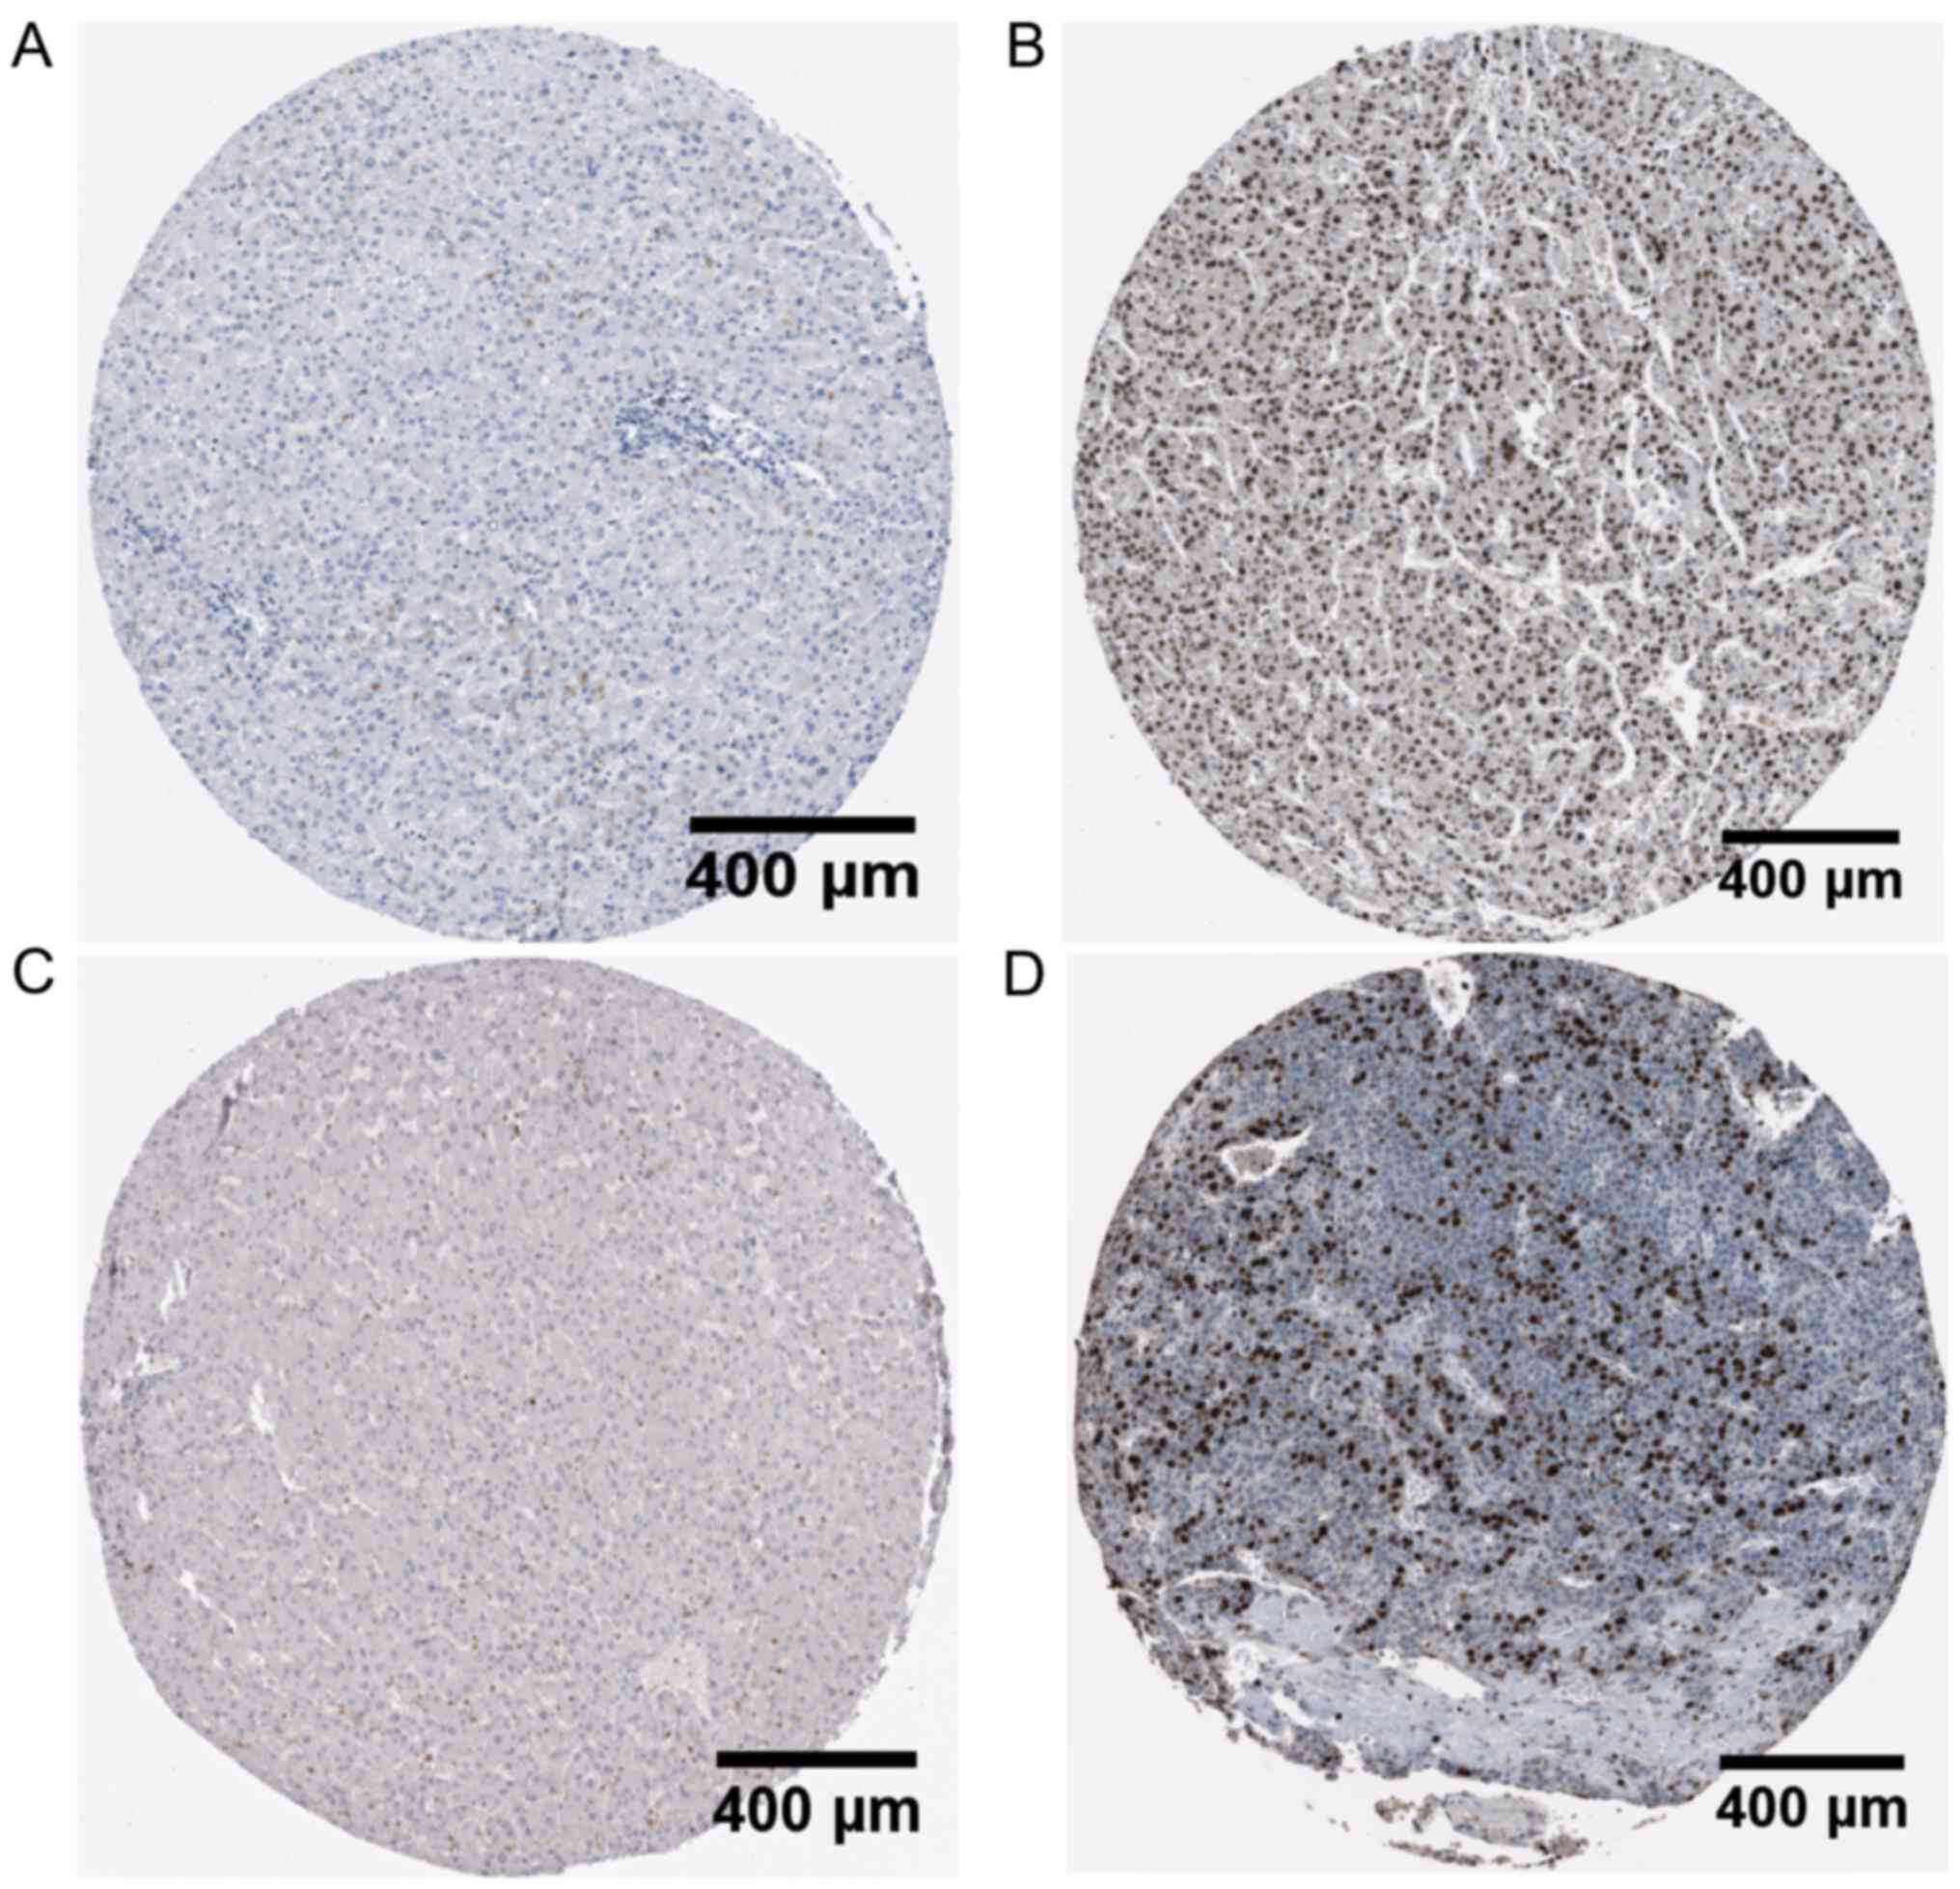
high expression of TOP1 and TOP2A proteins in HCC was corroborated
by The Human Protein Atlas (Fig.
3).
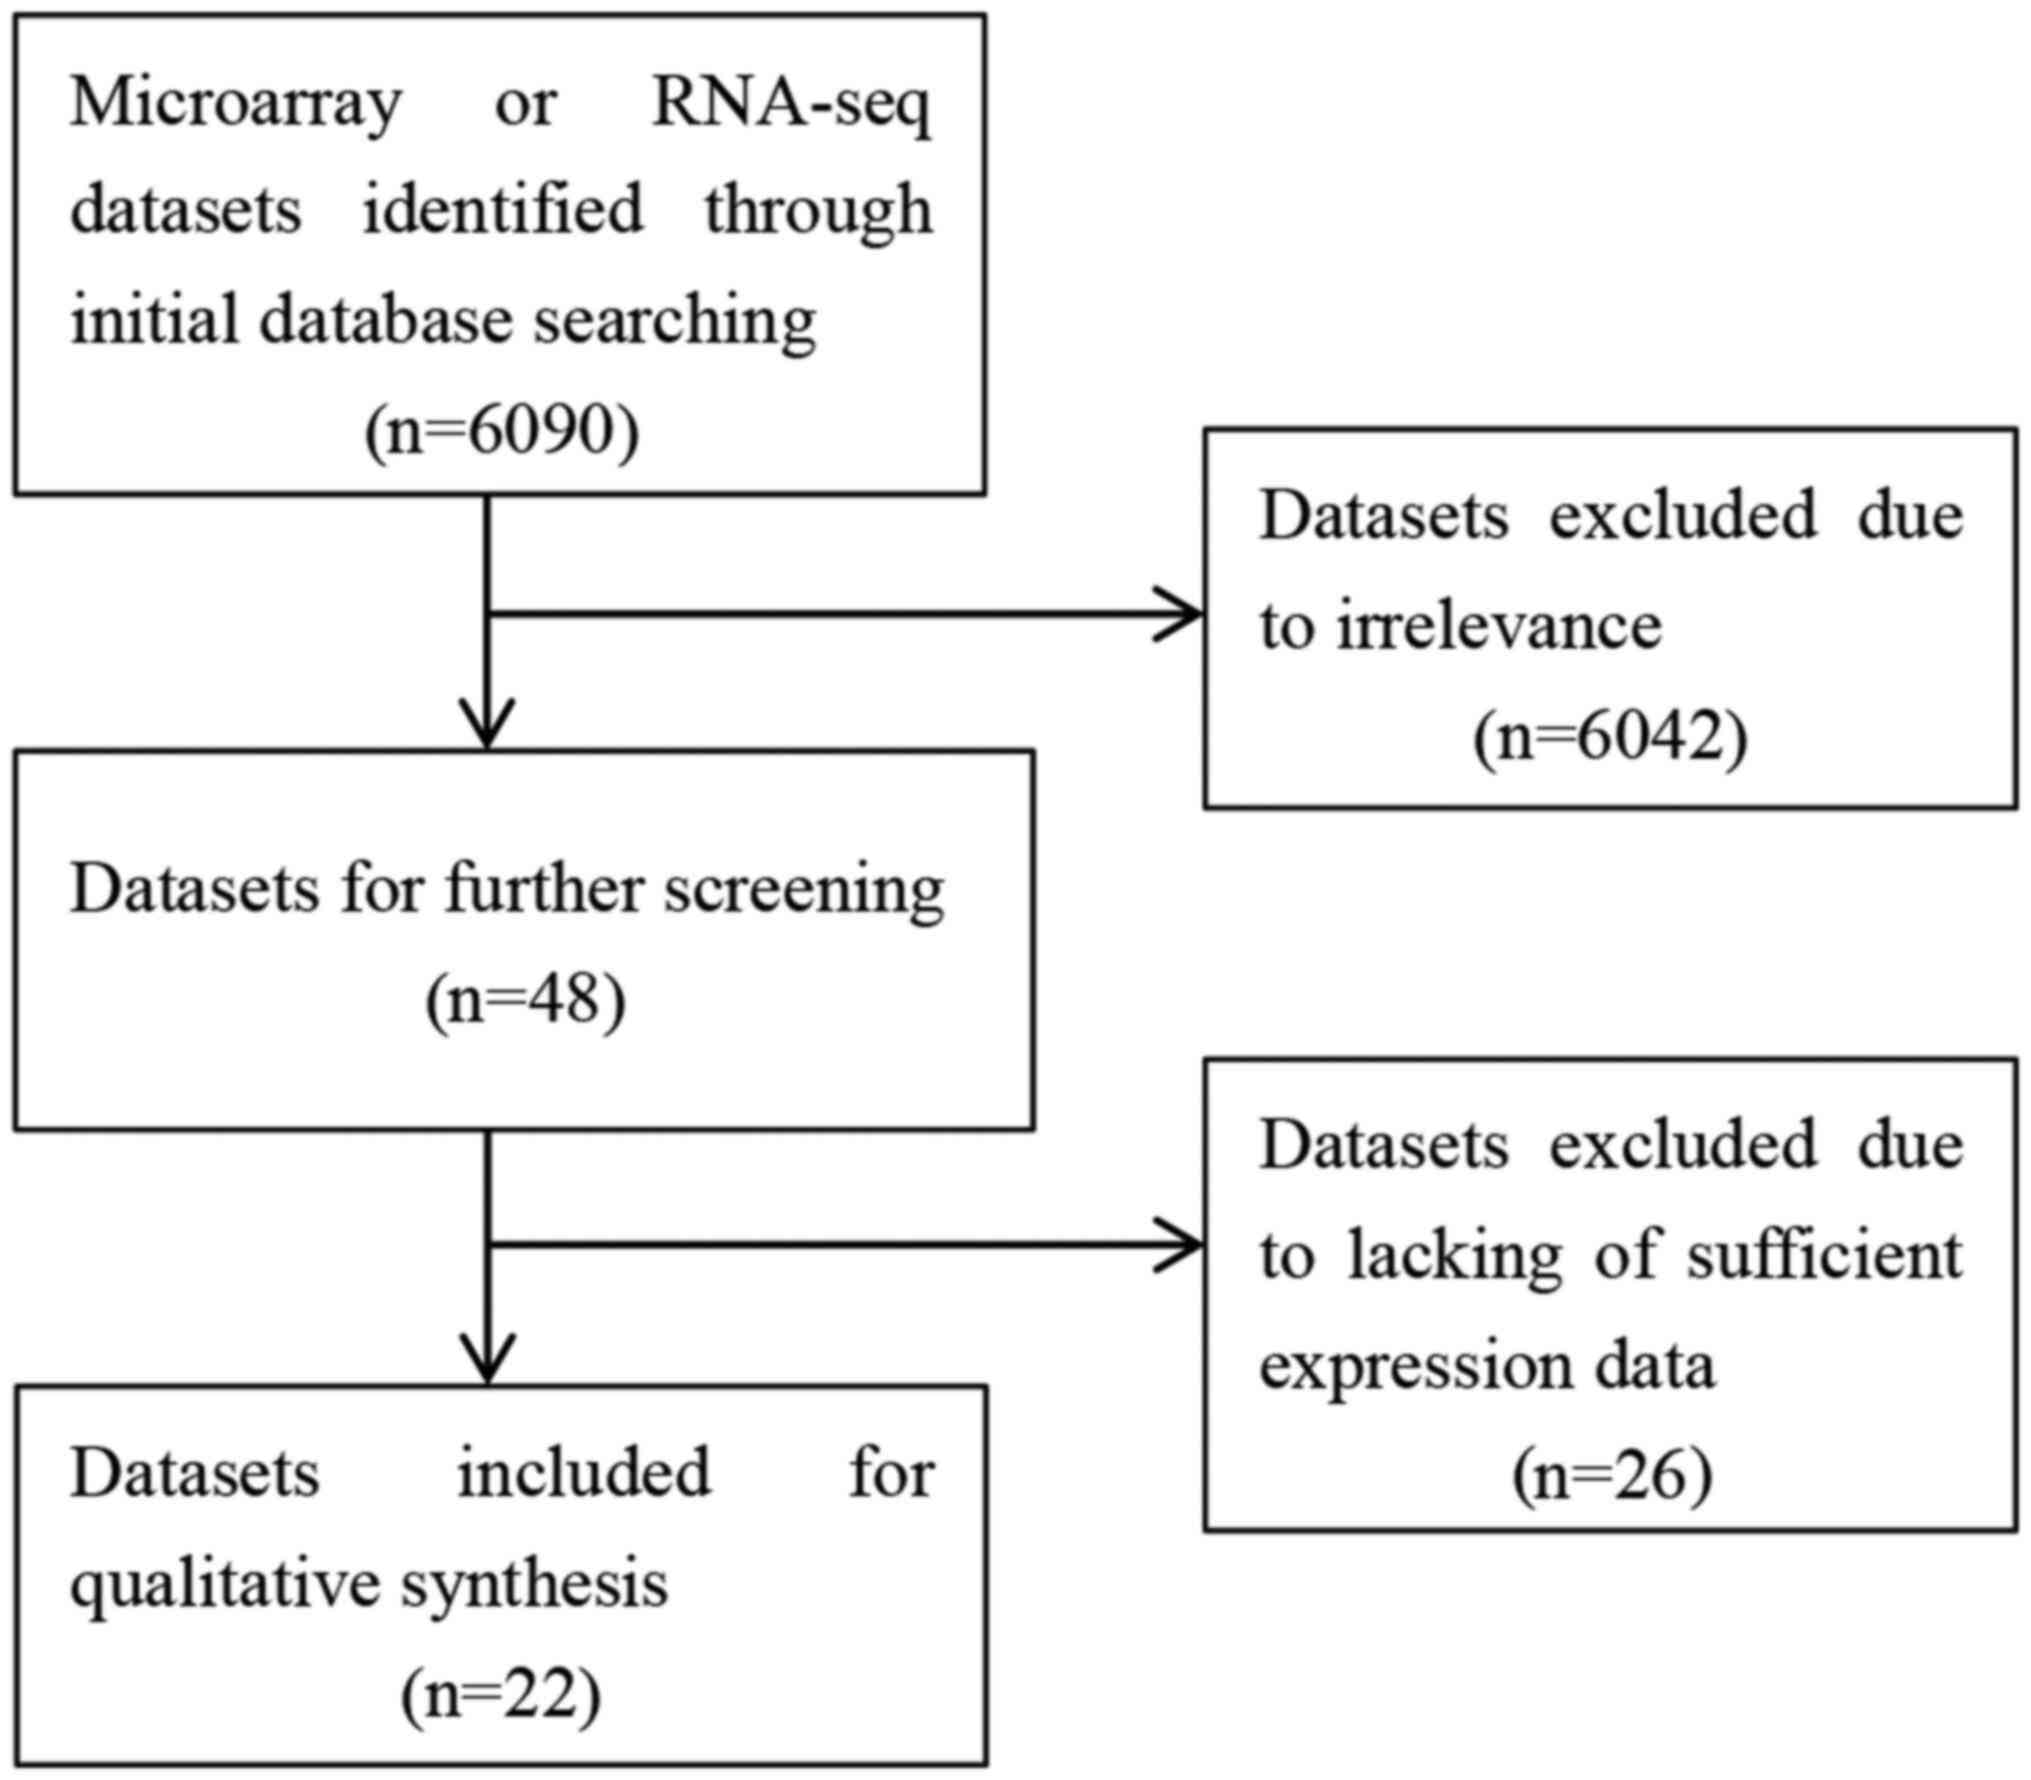
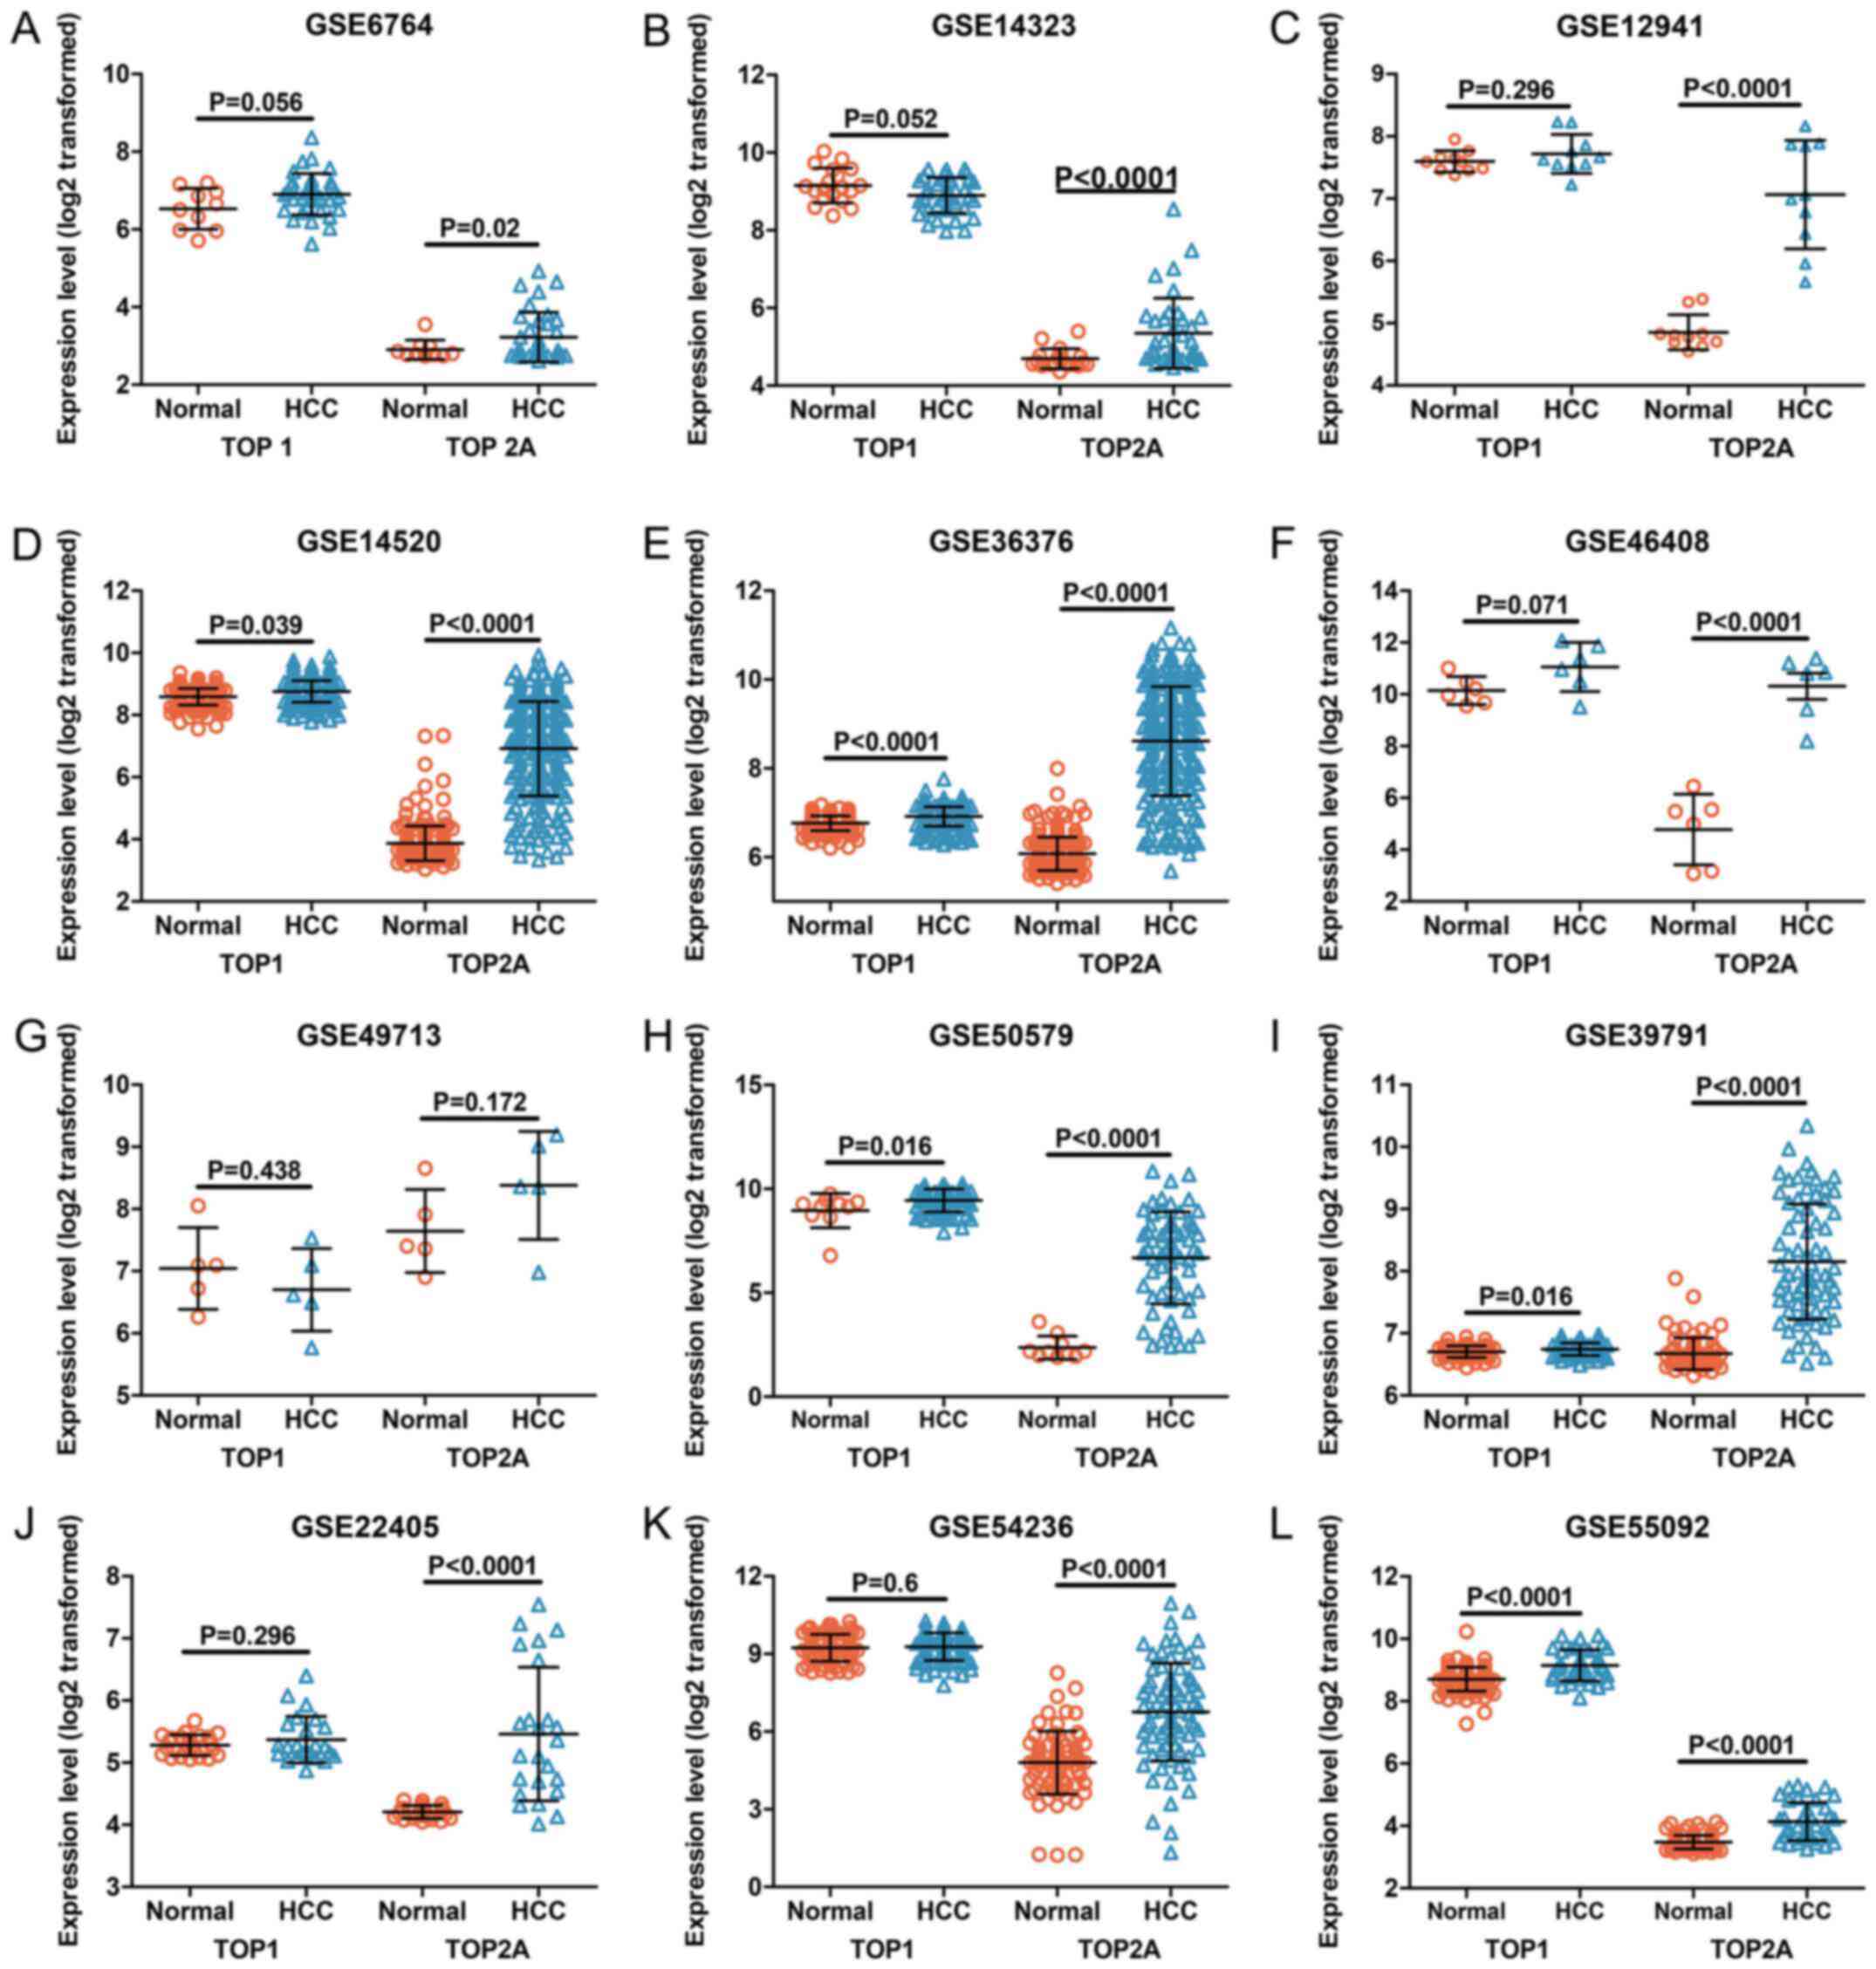
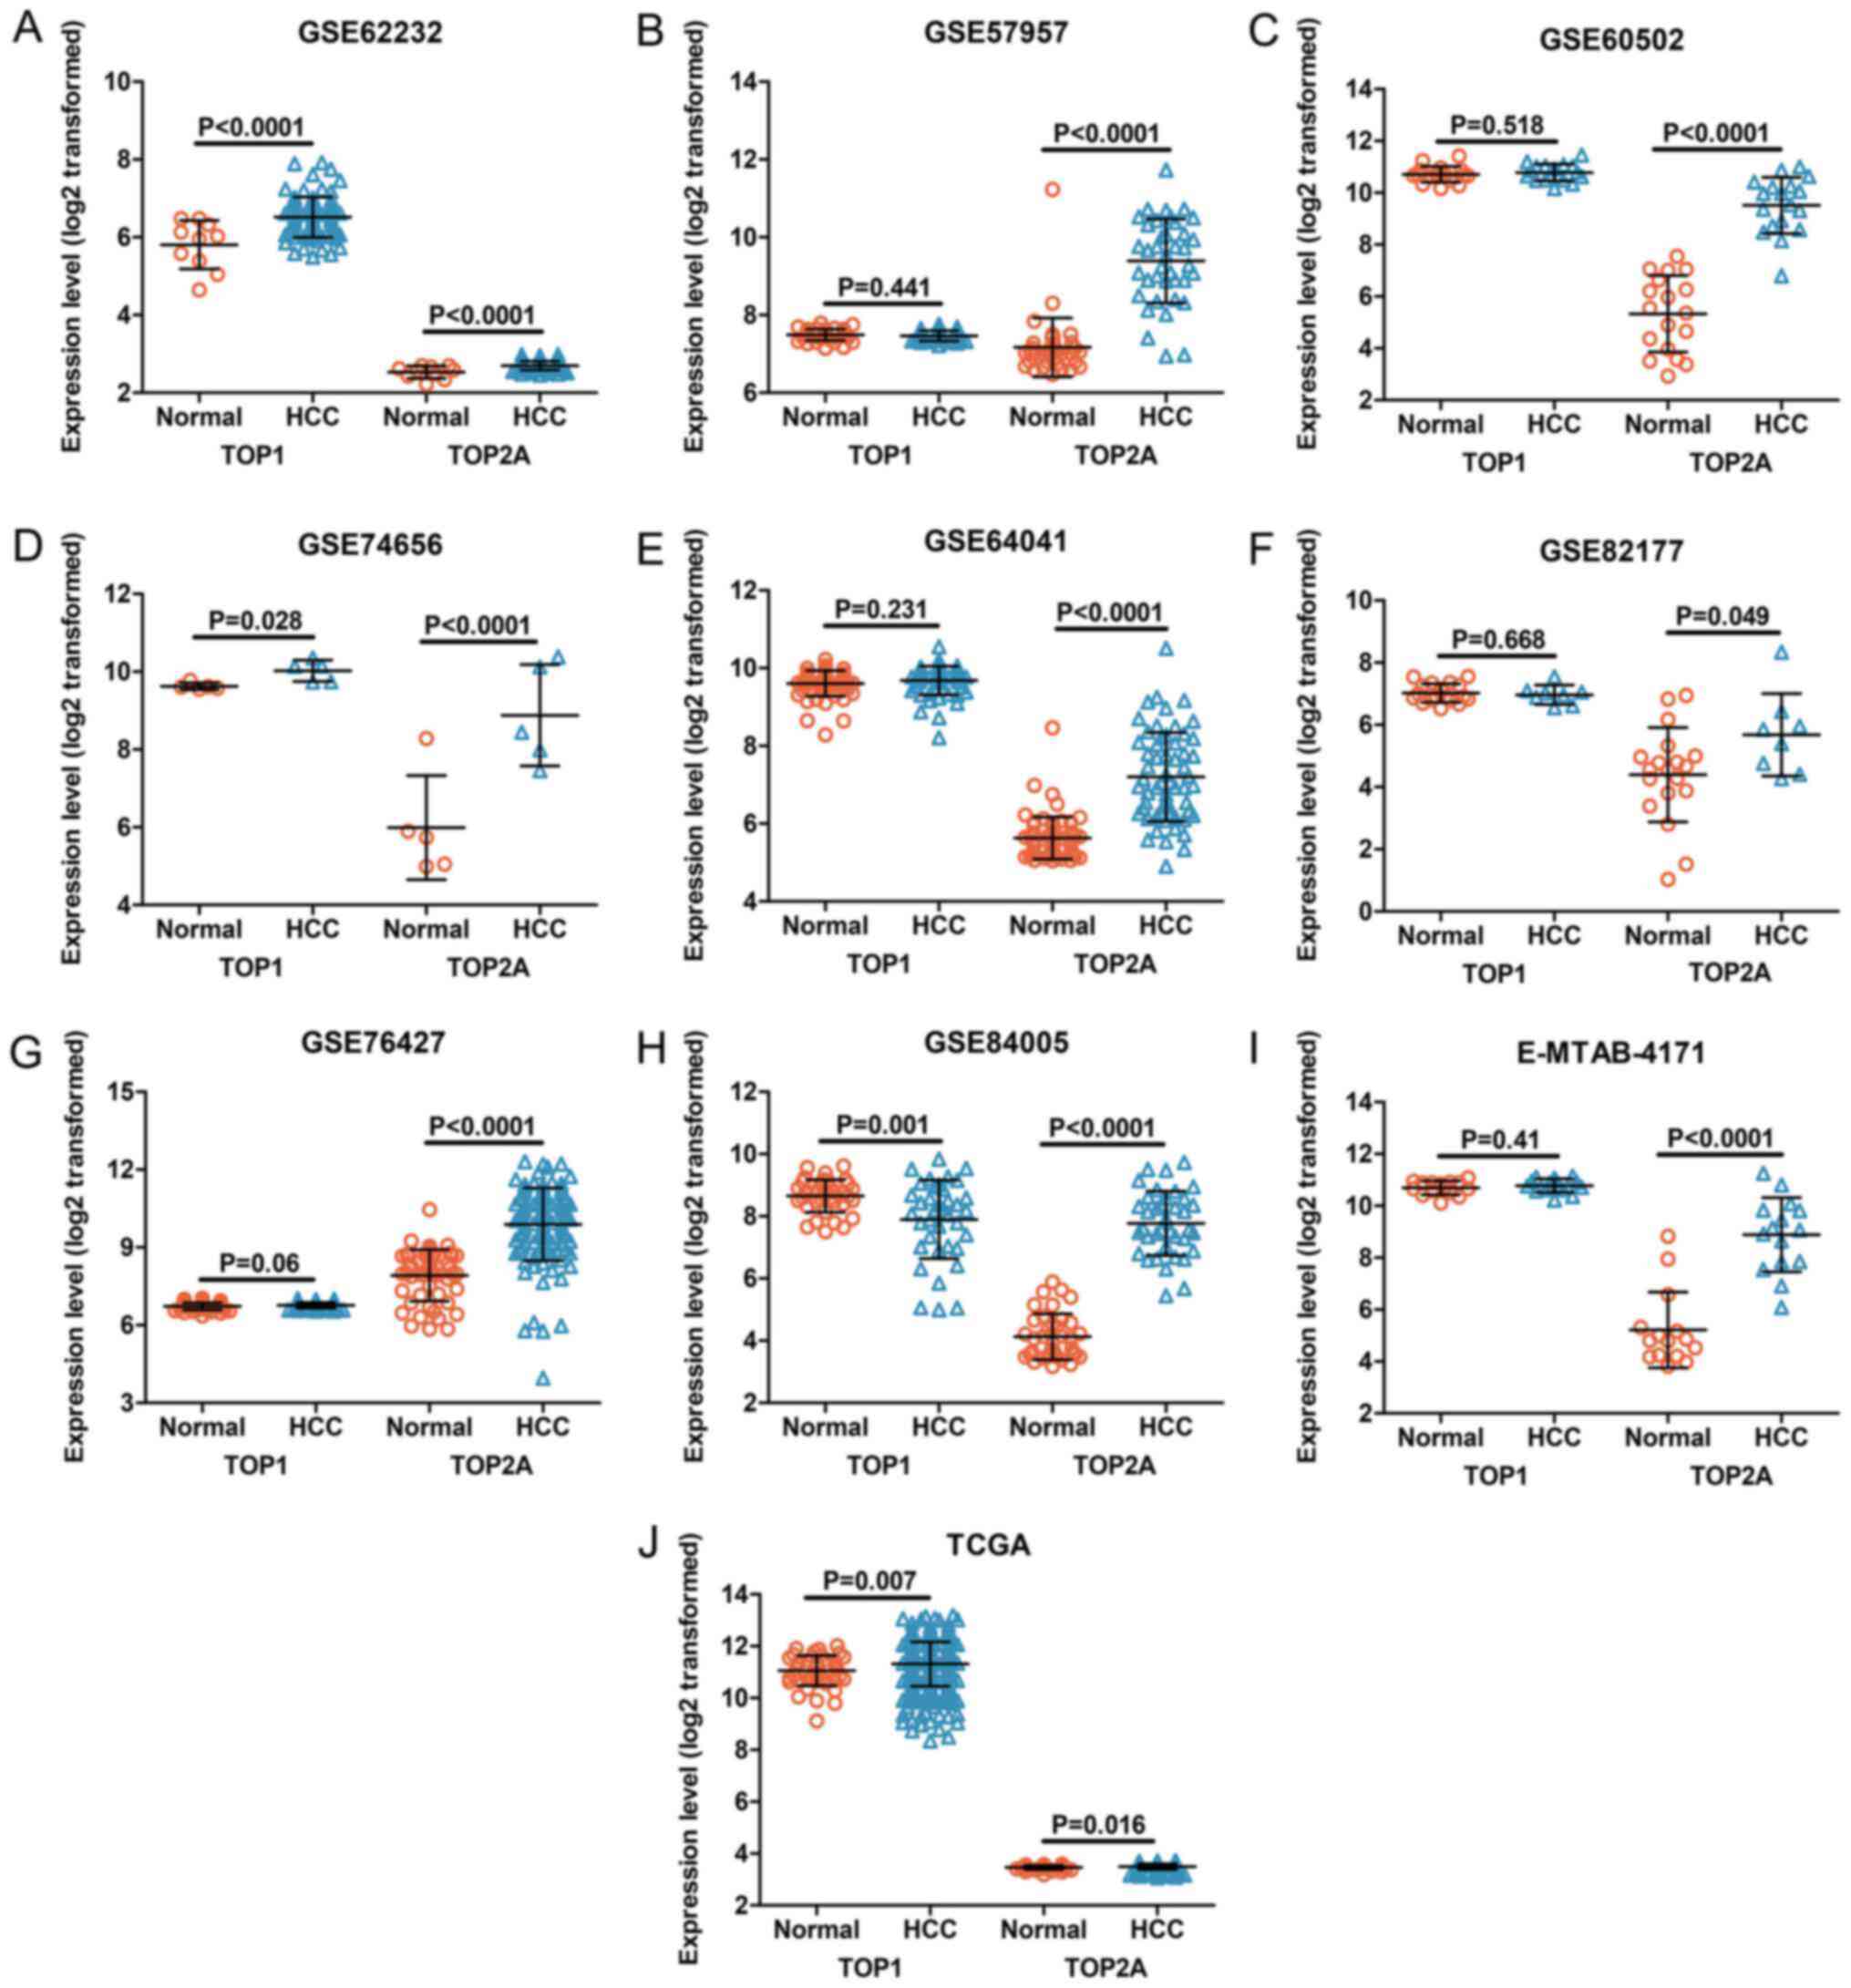
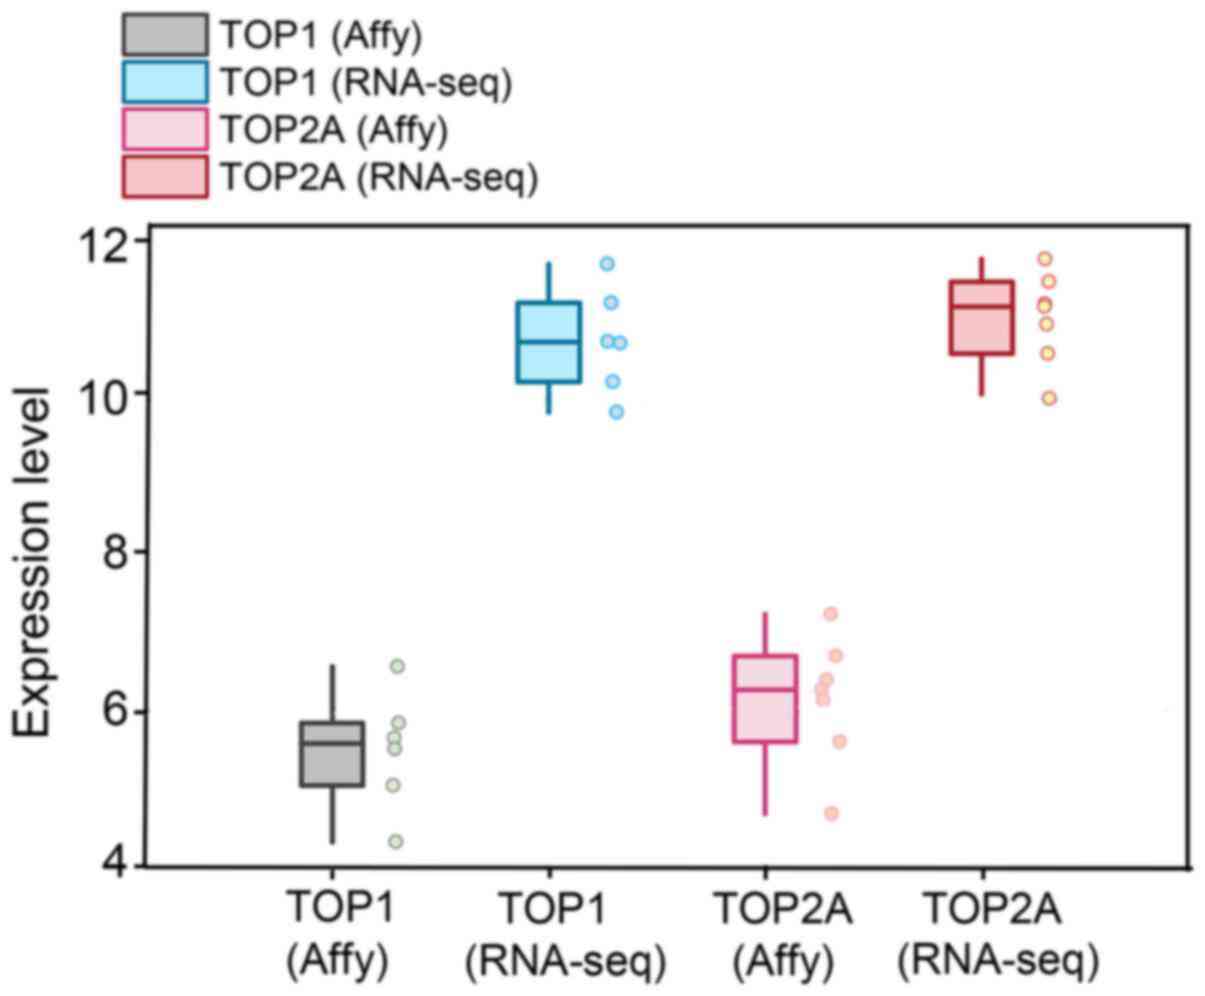
Microarray and RNA-seq datasets indicate
upregulation of TOP1 and TOP2A in HCC tissues
The 22 datasets (40-54)
used in this study included 1,603 HCC samples and 1,048 non-tumor
specimens, and provided expression data for the TOP1 and TOP2A
genes, as shown in Fig. 4. The
fundamental information for the 22 studies is listed in Table I.
 | Table IEssential information of the 22
included microarray and RNA-seq datasets. |
Table I
Essential information of the 22
included microarray and RNA-seq datasets.
| First author
(year) | Region | Dataset | Platform | Sample size (T/N),
n | TOP1 expression
(mean ± SD)
| TOP2A expression
(mean ± SD)
| (Ref.) |
|---|
| T | N | T | N |
|---|
| Wurmbach et
al (2007) | USA | GSE6764 | GPL570 | 35/10 | 6.90±0.53 | 6.53±0.53 | 3.22±0.64 | 2.90±0.25 | (40) |
| Mas et al
(2009) | USA | GSE14323 | GPL571 | 38/19 | 8.90±0.46 | 9.15±0.45 | 5.35±0.90 | 4.70±0.26 | (41) |
| Satow et al
(2010) | Japan | GSE12941 | GPL5175 | 10/10 | 7.70±0.31 | 7.59±0.17 | 7.06±0.87 | 4.85±0.28 | (42) |
| Roessler et
al (2010) | USA | GSE14520 | GPL3921 | 225/220 | 8.76±0.34 | 8.59±0.27 | 6.92±1.52 | 3.87±0.56 | (43) |
| Lim et al
(2012) | South Korea | GSE36376 | GPL10558 | 240/193 | 6.91±0.22 | 6.76±0.17 | 8.61±1.23 | 6.07±0.38 | (44) |
| Jeng et al
(2013) | Taiwan, China | GSE46408 | GPL4133 | 6/6 | 11.05±0.95 | 10.15±0.54 | 10.31±1.24 | 4.78±1.37 | NA |
| Wang et al
(2013) | China | GSE49713 | GPL11269 | 5/5 | 6.70±0.66 | 7.04±0.66 | 8.38±0.87 | 7.65±0.67 | NA |
| Neumann et
al (2012) | Germany | GSE50579 | GPL14550 | 67/10 | 9.45±0.55 | 8.96±0.83 | 6.69±2.21 | 2.36±0.56 | (45) |
| Kim et al
(2014) | USA | GSE39791 | GPL10558 | 72/72 | 6.74±0.10 | 6.70±0.09 | 8.15±0.93 | 6.67±0.26 | (46) |
| Zhang et al
(2014) | USA | GSE22405 | GPL10553 | 24/24 | 5.37±0.37 | 5.28±0.17 | 5.46±1.08 | 4.21±0.10 | NA |
| Villa et al
(2016) | Italy | GSE54236 | GPL6480 | 81/80 | 9.28±0.54 | 9.23±0.52 | 6.76±1.88 | 4.80±1.22 | (47) |
| Melis et al
(2014) | USA | GSE55092 | GPL570 | 49/91 | 9.12±0.49 | 8.67±0.36 | 4.05±0.58 | 3.46±0.19 | (48) |
| Schulze et
al (2015) | France | GSE62232 | GPL570 | 81/10 | 6.52±0.52 | 5.80±0.62 | 2.70±0.11 | 2.53±0.16 | (49) |
| Mah et al
(2014) | Singapore | GSE57957 | GPL10558 | 39/39 | 7.46±0.13 | 7.49±0.15 | 9.39±1.08 | 7.17±0.76 | (50) |
| Wang et al
(2014) | Taiwan, China | GSE60502 | GPL96 | 18/18 | 10.78±0.32 | 10.71±0.31 | 9.51±1.09 | 5.33±1.47 | (51) |
| Tao et al
(2015) | China | GSE74656 | GPL16043 | 5/5 | 10.02±0.27 | 9.63±0.09 | 8.88±1.30 | 5.99±1.34 | NA |
| Makowska et
al (2016) | Switzerland | GSE64041 | GPL6244 | 60/65 | 9.68±0.37 | 9.61±0.33 | 7.20±1.14 | 5.63±0.54 | (52) |
| Wijetunga et
al (2017) | USA | GSE82177 | GPL11154 | 6/16 | 6.97±0.31 | 7.02±0.30 | 5.68±1.32 | 4.40±1.52 | (53) |
| Grinchuk et
al (2018) | Singapore | GSE76427 | GPL10558 | 115/52 | 6.76±0.11 | 6.72±0.14 | 9.80±1.67 | 7.92±0.99 | (54) |
| Tu et al
(2017) | China | GSE84005 | GPL5175 | 38/38 | 7.90±1.27 | 8.65±0.52 | 7.77±1.03 | 4.13±0.74 | NA |
| Nojima et al
(2017) | Japan | E-MTAB-4171 | None | 15/15 | 10.78±0.26 | 10.70±0.27 | 8.88±1.43 | 5.21±1.46 | NA |
| TCGA (2017) | USA | TCGA | None | 374/50 | 11.31±0.85 | 11.06±0.58 | 3.50±0.11 | 3.46±0.08 | NA |
The expression levels of TOP1 and TOP2A in each
dataset were visualized in the form of scatter plots (Figs. 5 and 6). The results from individual
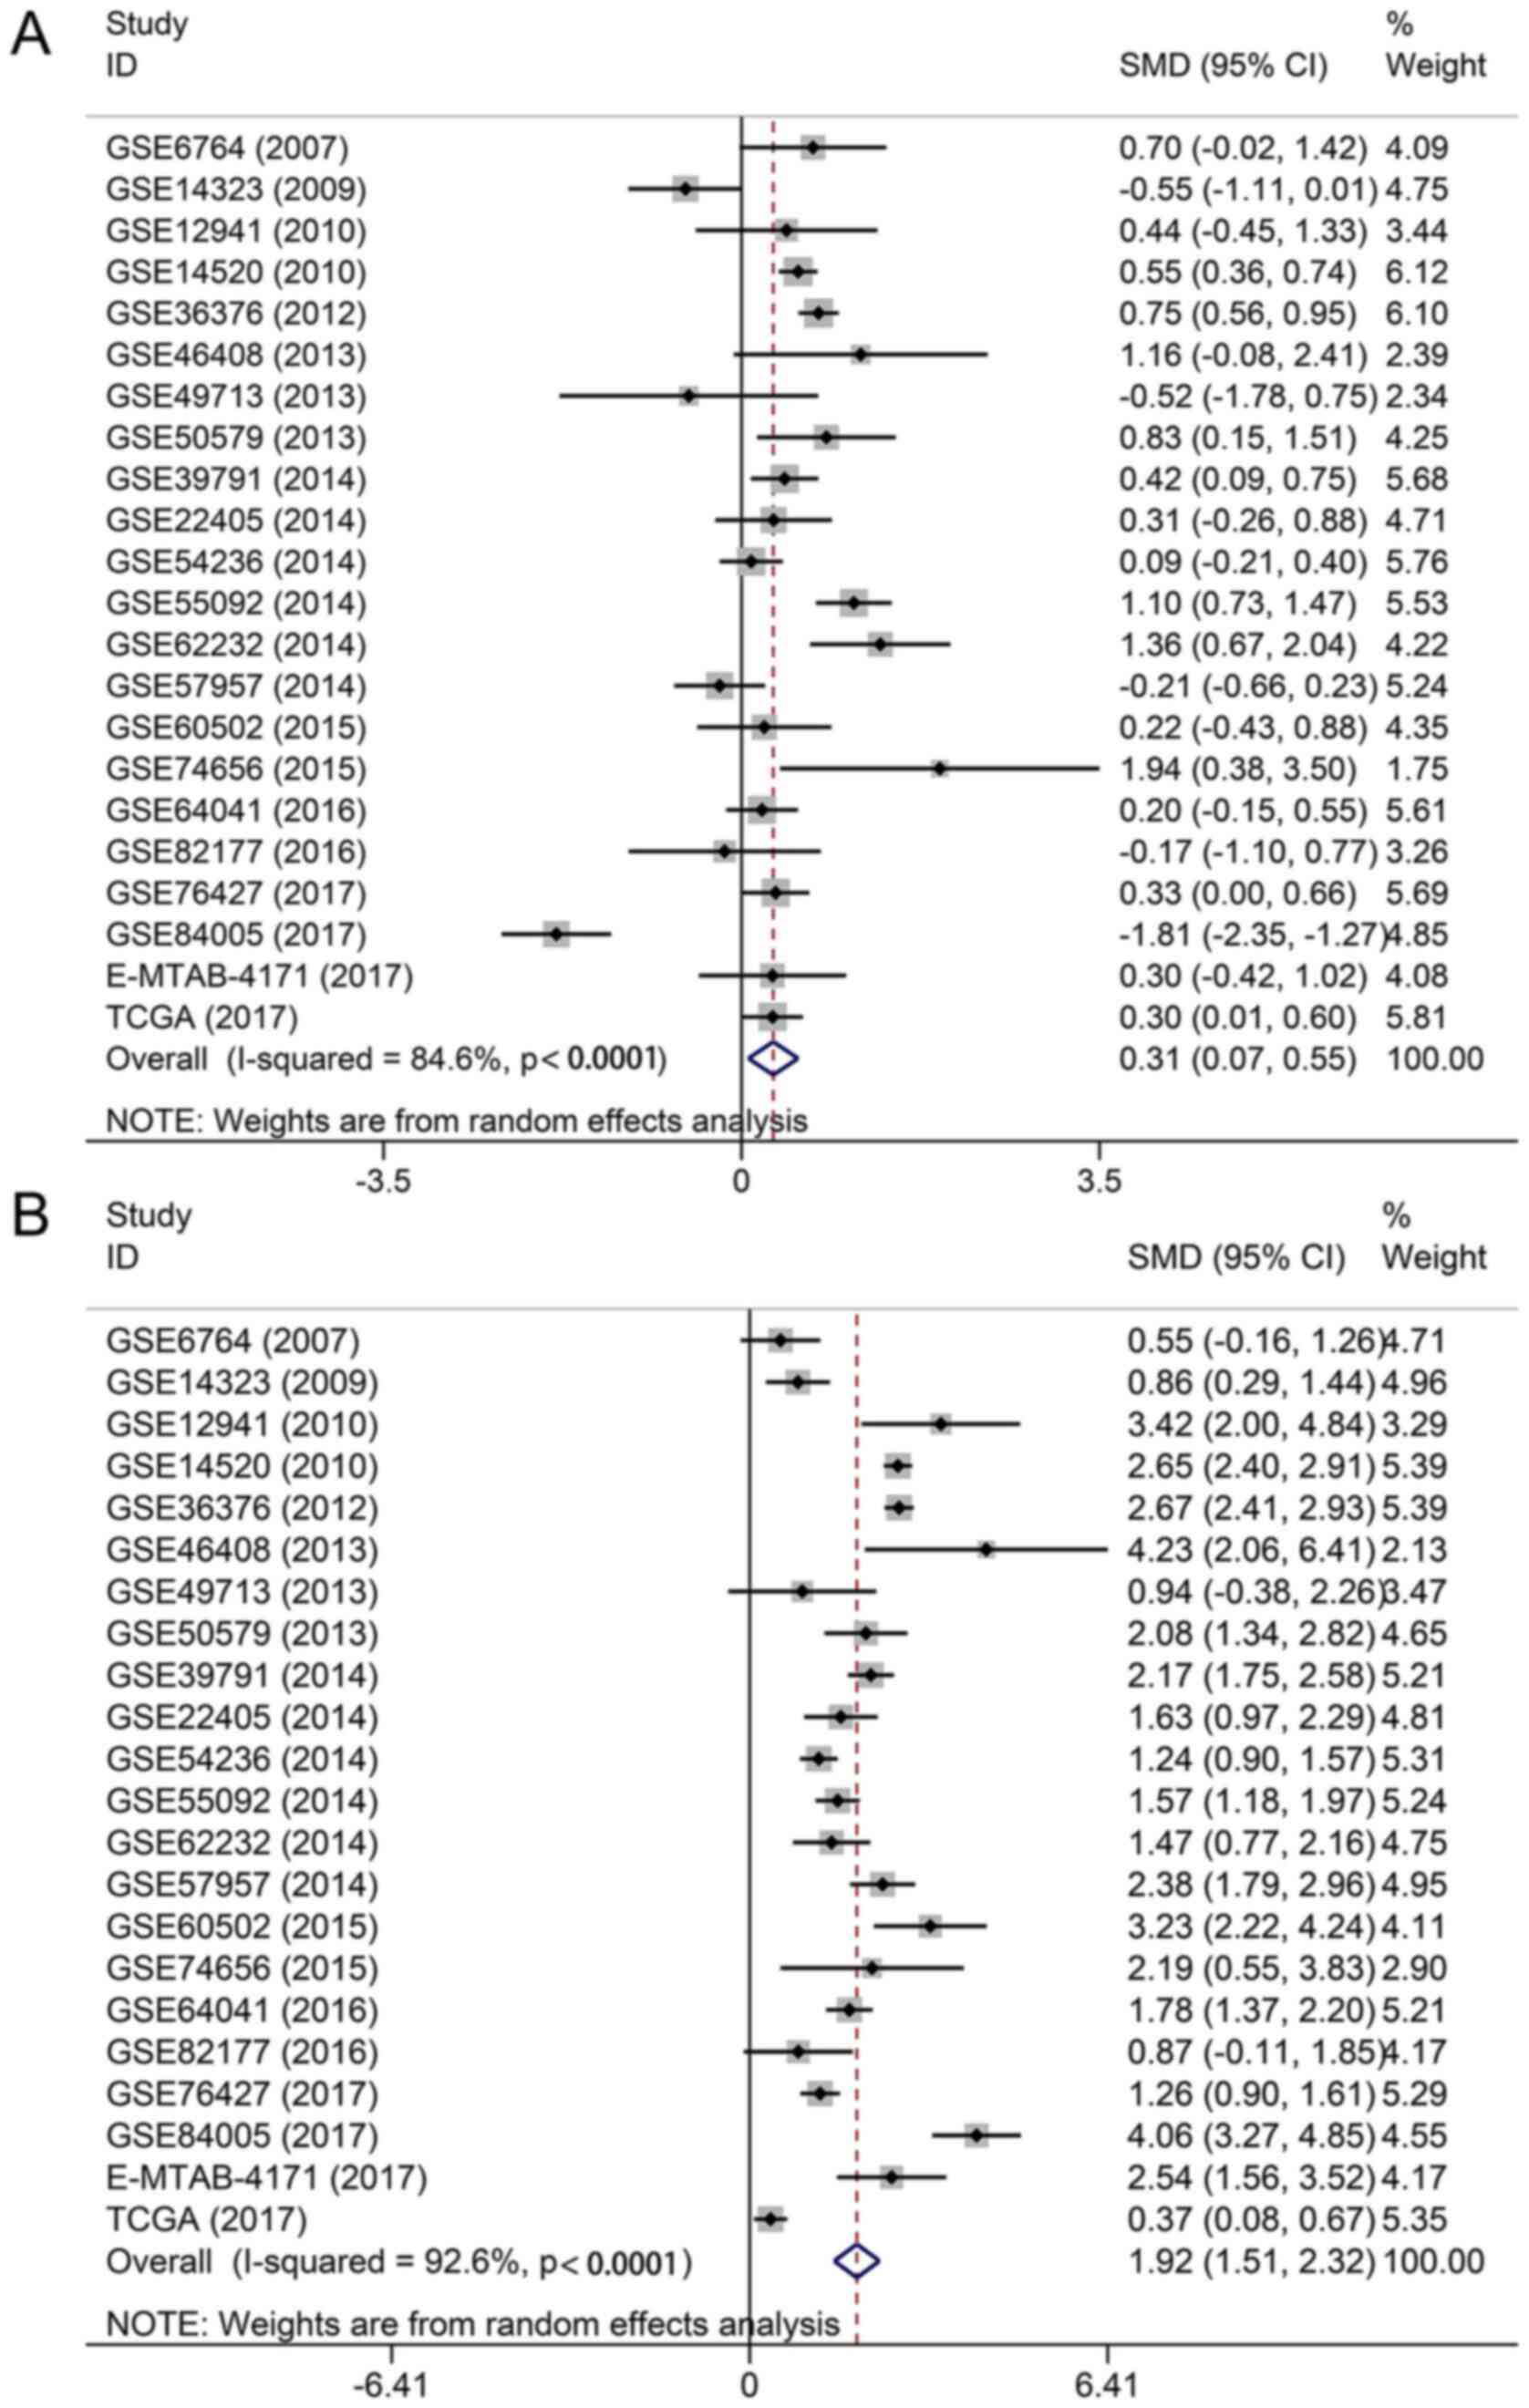
microarrays were not consistent, so the 22 datasets were combined.
The pooled SMD showed that TOP1 and TOP2A were markedly
overexpressed in HCC tissues (TOP1: SMD, 0.31; 95% CI, 0.07-0.55;
P=0.012; and TOP2A: SMD, 1.92; 95% CI, 1.51-2.32; P<0.0001)
(Fig. 7). Recognizing that a
significant heterogeneity arises from differences in RNA
extraction, RNA detection and sample source (TOP1:
I2=84.6, P<0.0001; and TOP2A: I2=92.6,
P<0.0001) (Fig. 7), a
random-effects model was selected to combine all the data. No
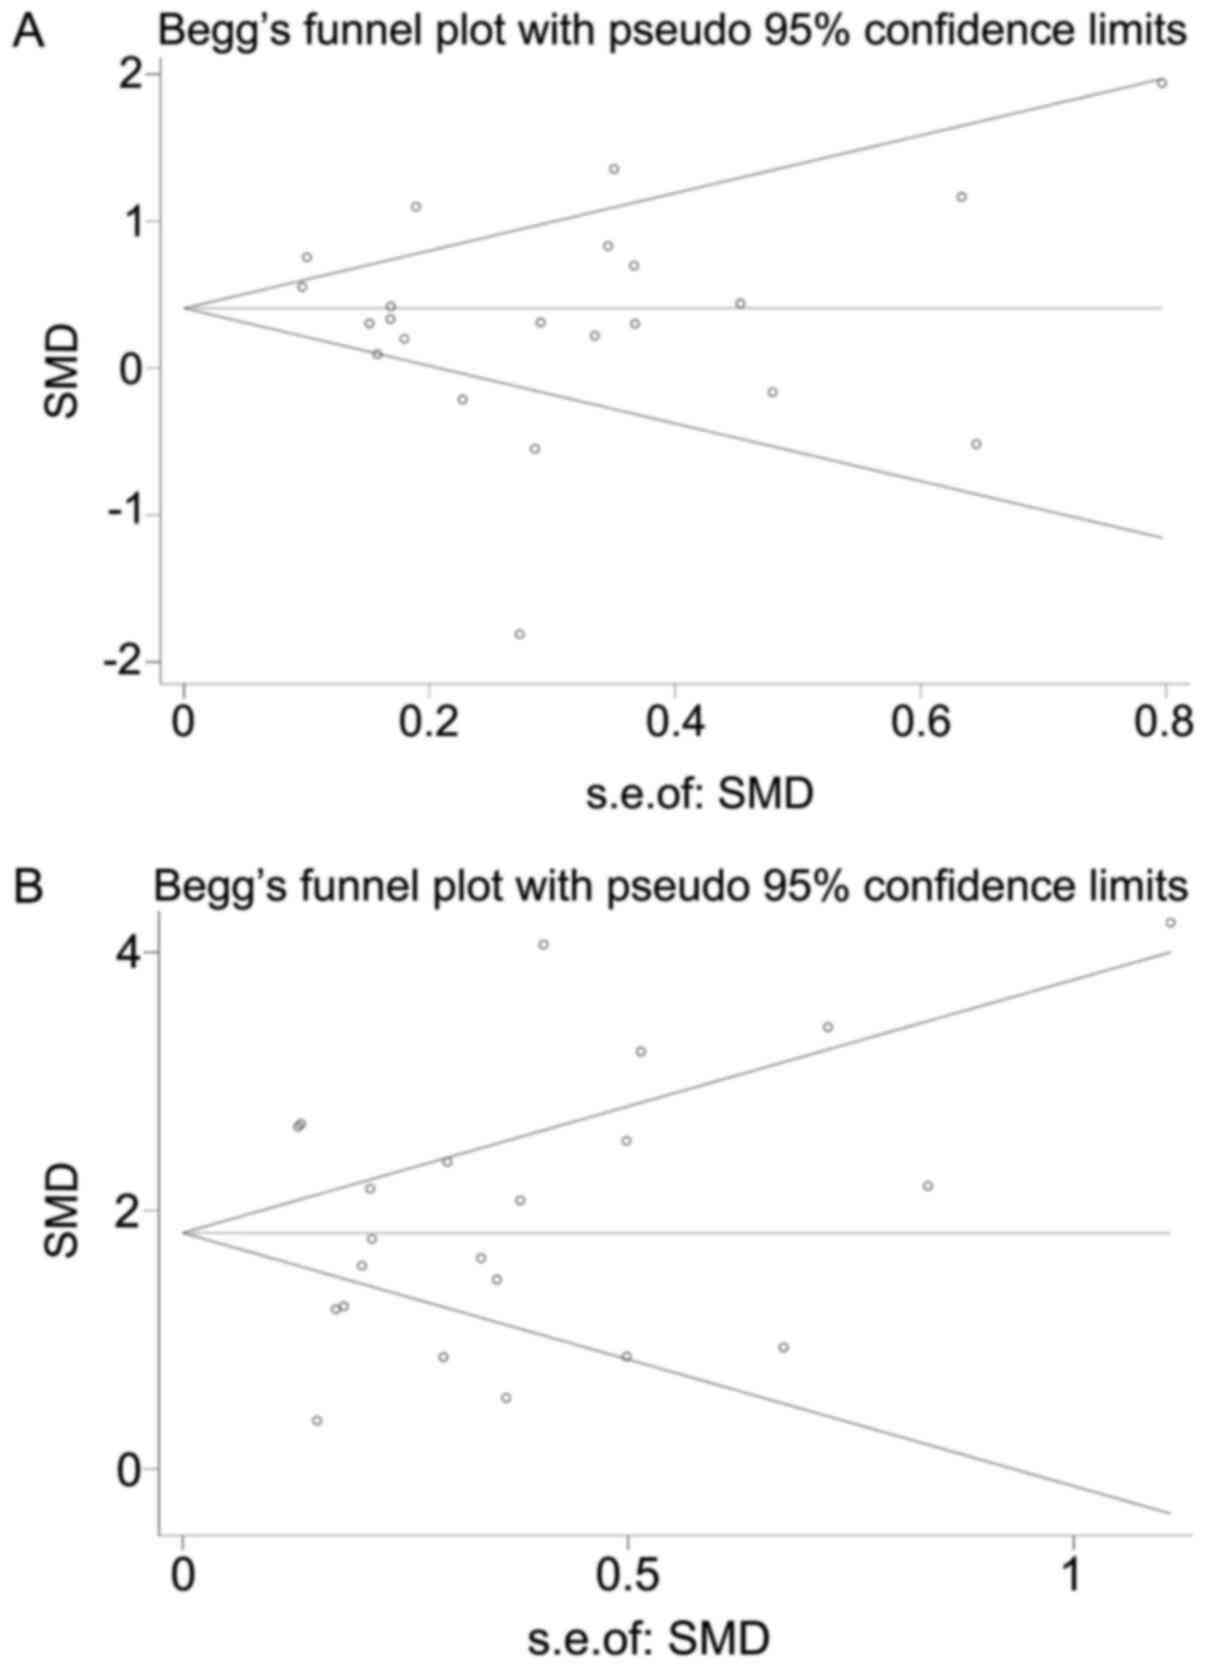
significant publication bias existed in the present study according
to the results of Begg’s and Egger’s tests (TOP1: Begg’s P=0.91,
Egger’s P=0.36; and TOP2A: Begg’s P=0.28, Egger’s P=0.82; Fig. 8).
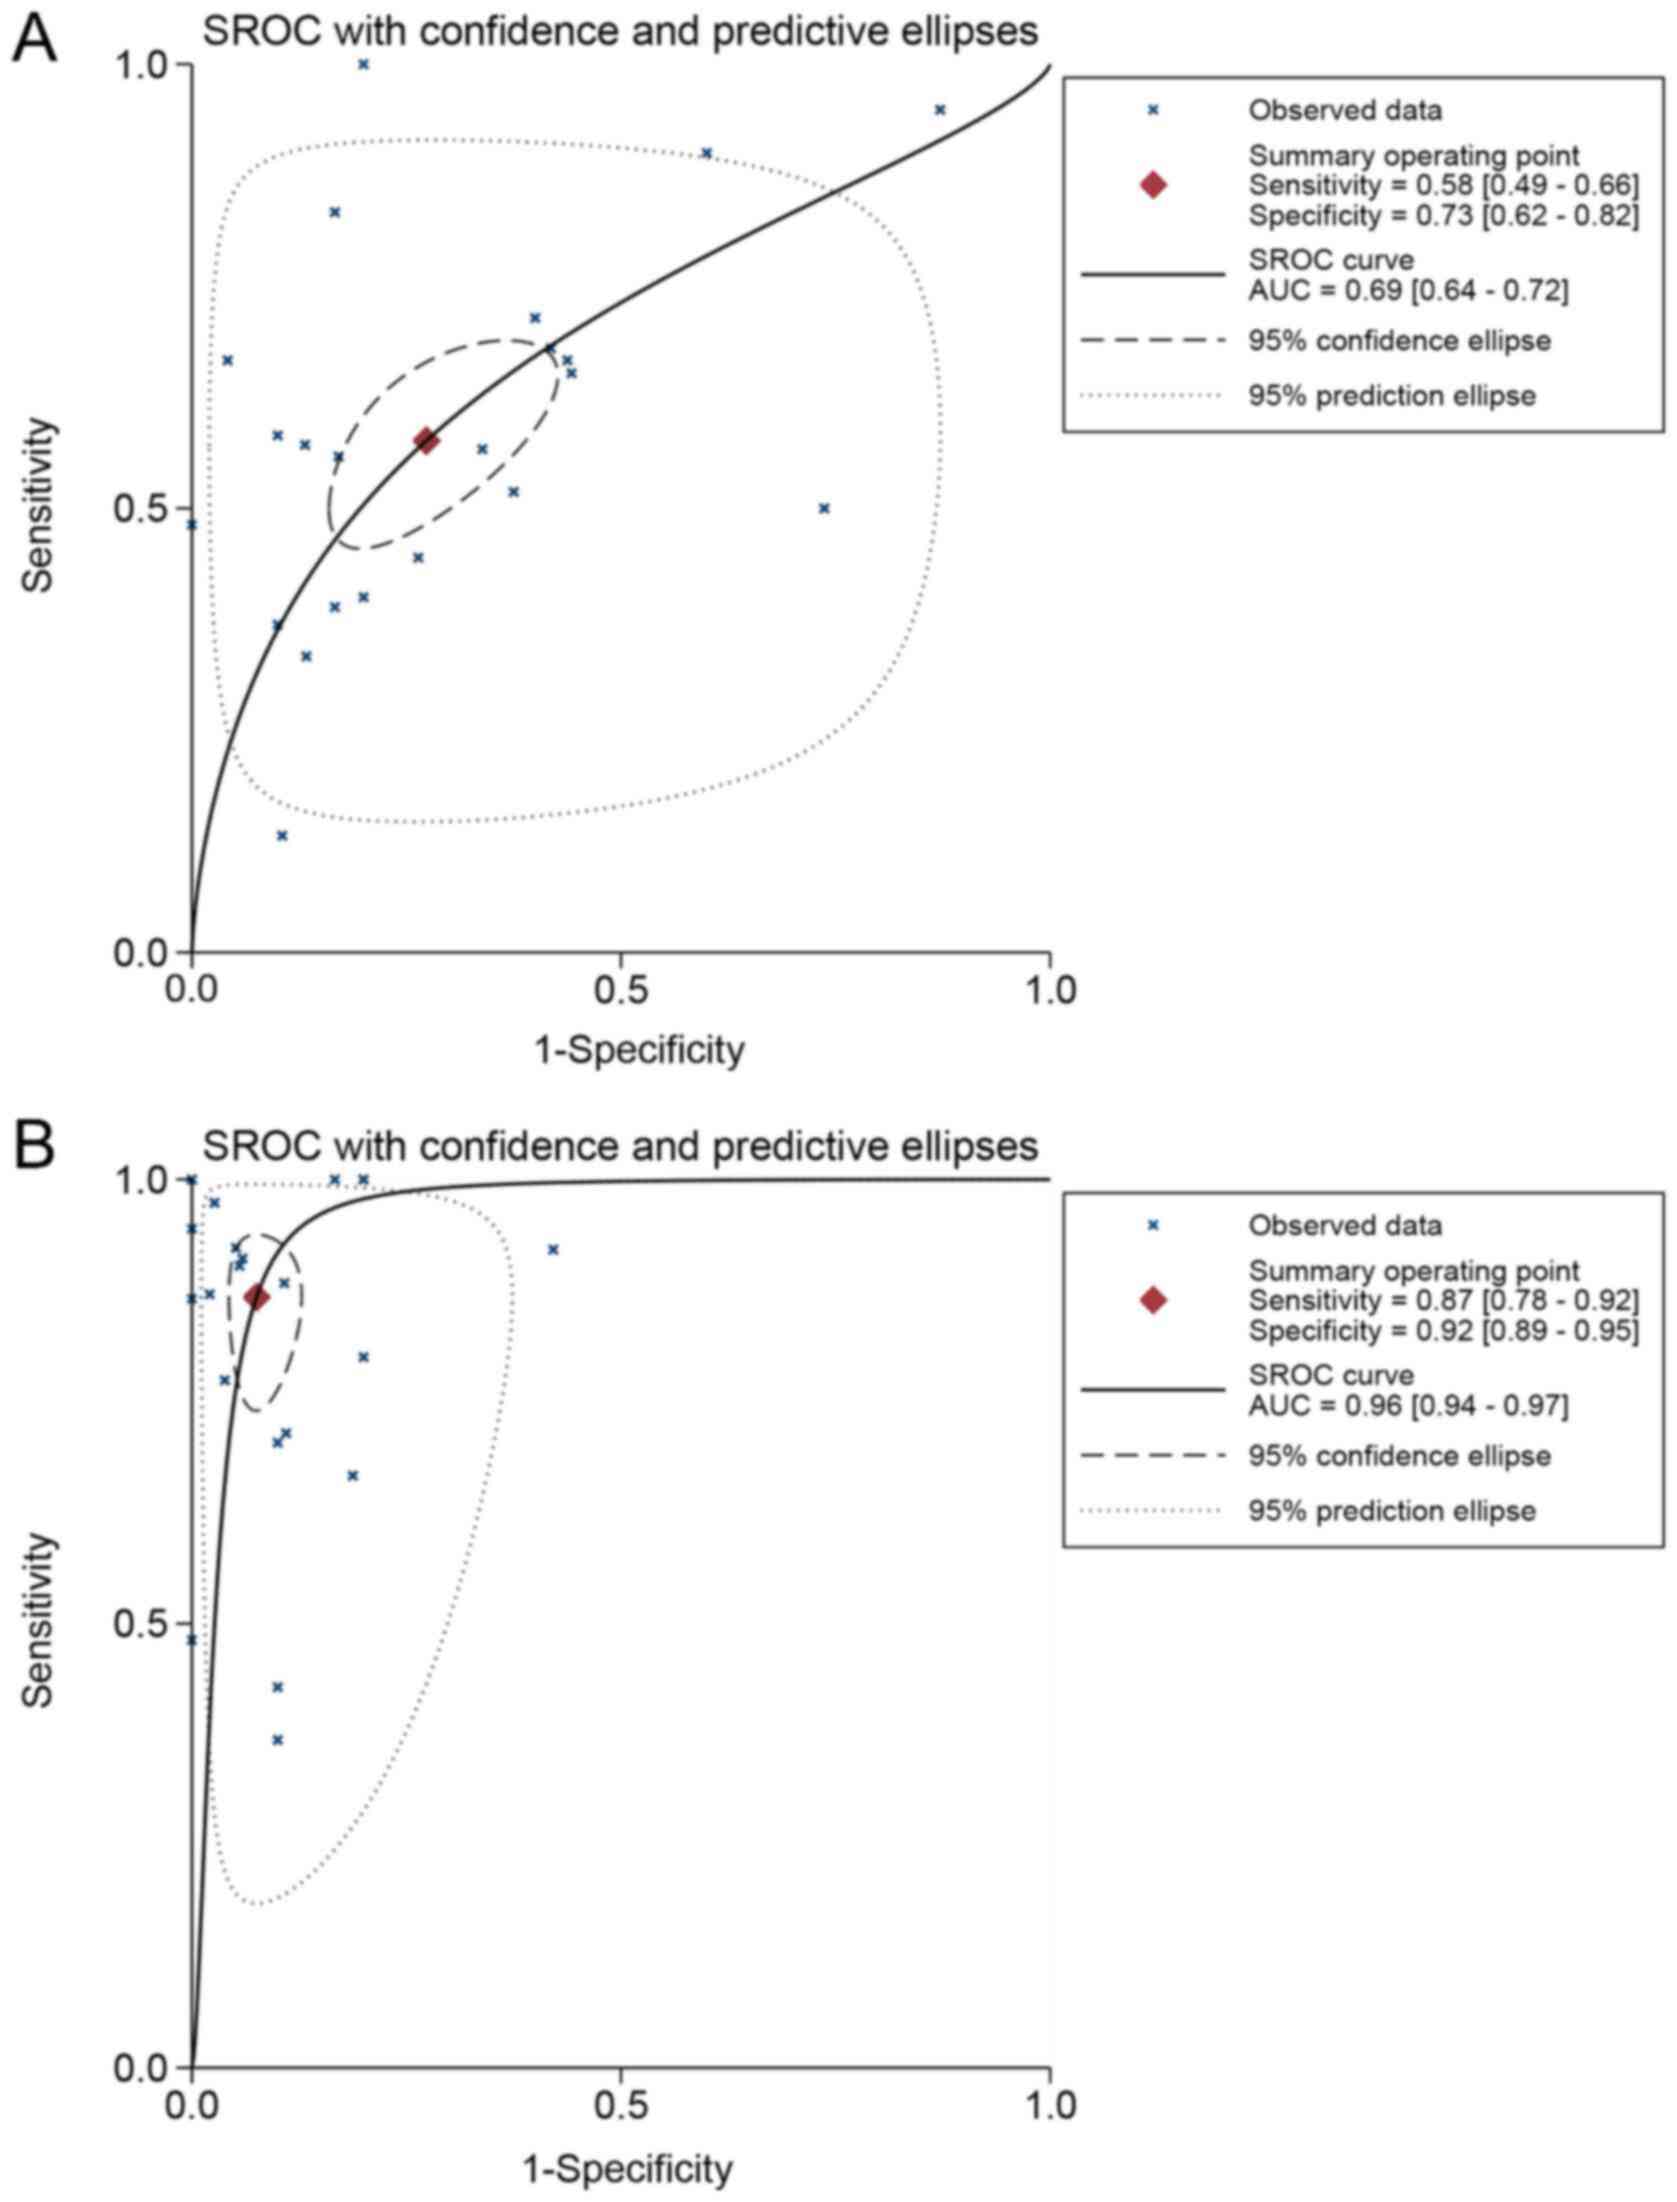
The ability of TOP1 and TOP2A to differentiate HCC
patients from normal controls was further estimated with the SROC
method. The AUC value for TOP1 was 0.69 (95% CI, 0.64-0.72), with a
sensitivity of 0.58 and specificity of 0.73 (Fig. 9A). The AUC value for TOP2A was 0.96
(95% CI, 0.94-0.97), with a sensitivity of 0.87 and specificity of
0.92 (Fig. 9B).
The expression of TOP1 and TOP2A was also verified
in the HCC cell line using the Cancer Cell Line Encyclopedia
(55), as shown in Fig. 10.
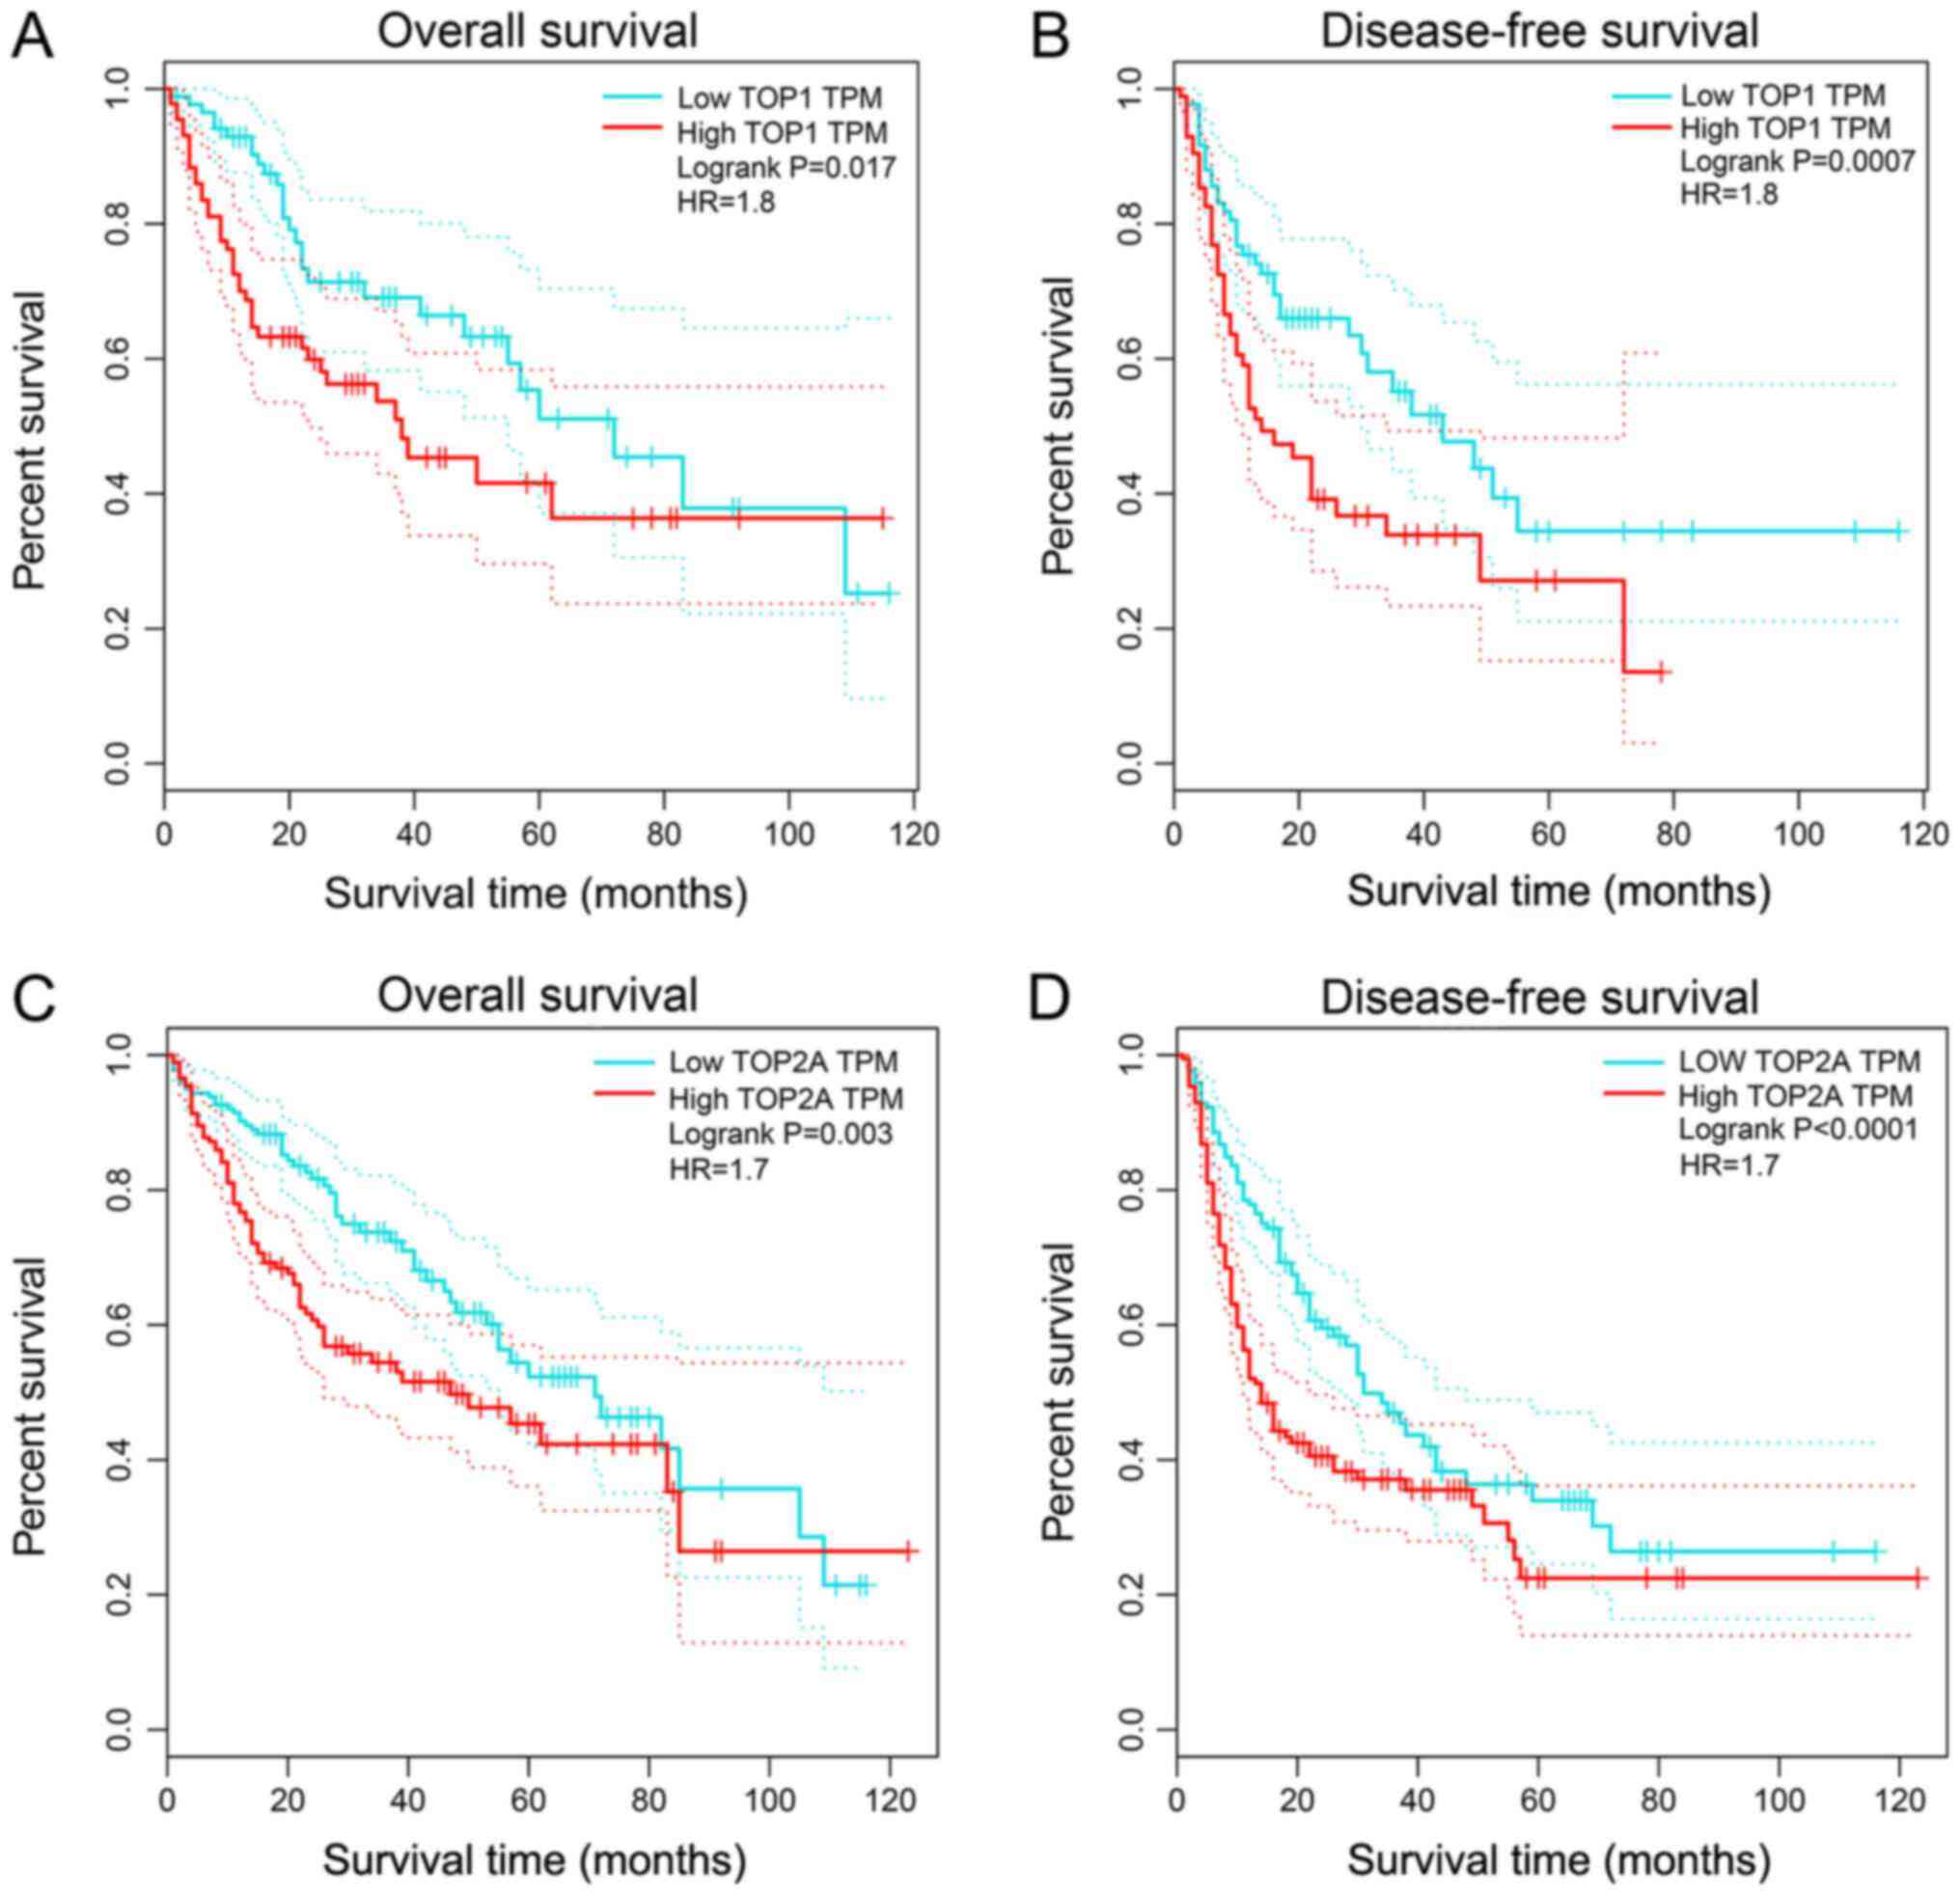
TOP1 and TOP2 were biomarkers of
unfavorable prognosis in LC
First, the prognostic value of TOP1 and TOP2A was
assessed in LC using the Gene Expression Profiling Interactive
Analysis database (56), an online
database that contains and processes data from TCGA. Patients were
divided into TOP1 or TOP2A high and low expression groups according
to the median expression of the two genes. As shown in Fig. 11, the elevated expression of TOP1
and TOP2A was closely associated with poor overall survival (OS)
(TOP1, P=0.017; TOP2A, P=0.003) and disease-free survival (DFS)
(TOP1, P=0.0007; TOP2A, P<0.0001). Further analysis of the
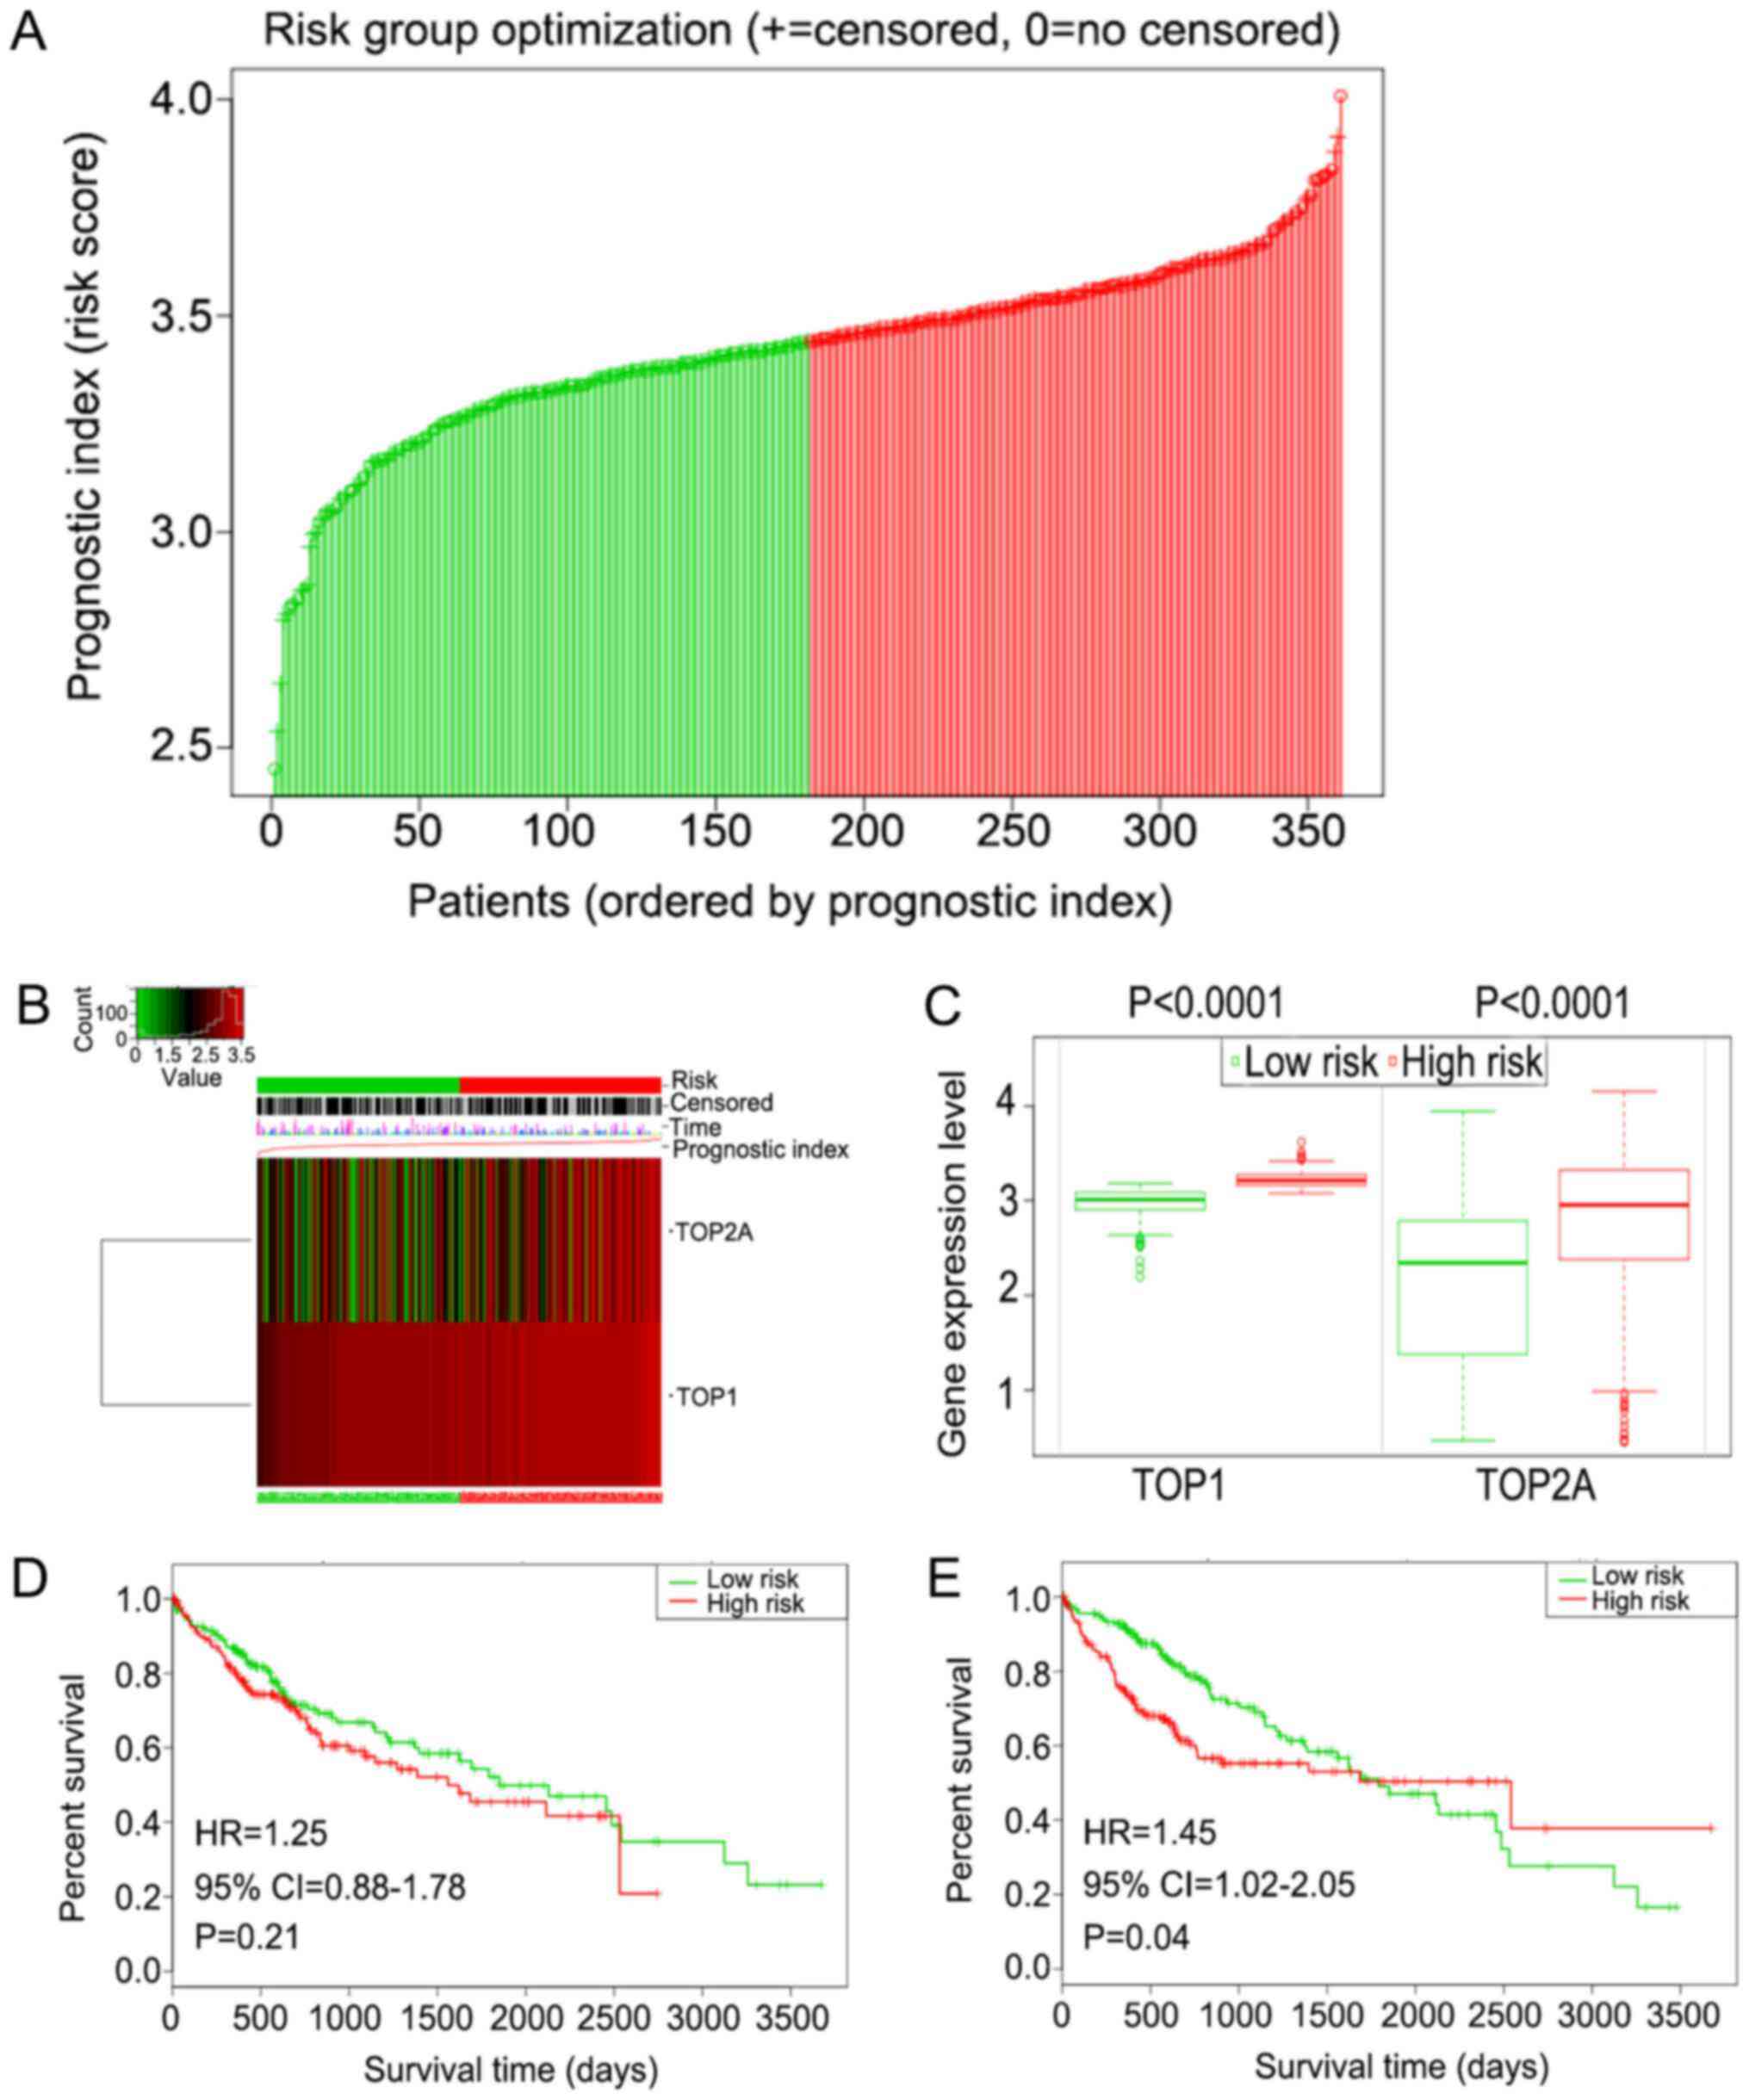
prognostic role of TOP1 and TOP2A in different risk groups was then
conducted using the SurvExpress online tool (57). A cohort of 361 patients with LC was
divided into a high-risk (n=180) and a low-risk (n=181) group
according to the prognostic index (Fig. 12A). TOP1 and TOP2A were highly
expressed in the high-risk group (TOP1, P<0.0001; TOP2A,
P<0.0001) (Fig. 12B and C).
For TOP1, although not statistically significant, patients in the
high-risk group tended to have a poorer prognosis [hazard ratio
(HR), 1.25; 95% CI, 0.88-1.78; P=0.21) (Fig. 12D)]. For TOP2A, patients in the
high-risk group showed a clearly poorer survival outcome (HR, 1.45;
95% CI, 1.02-2.05; P=0.04) (Fig.
12E).
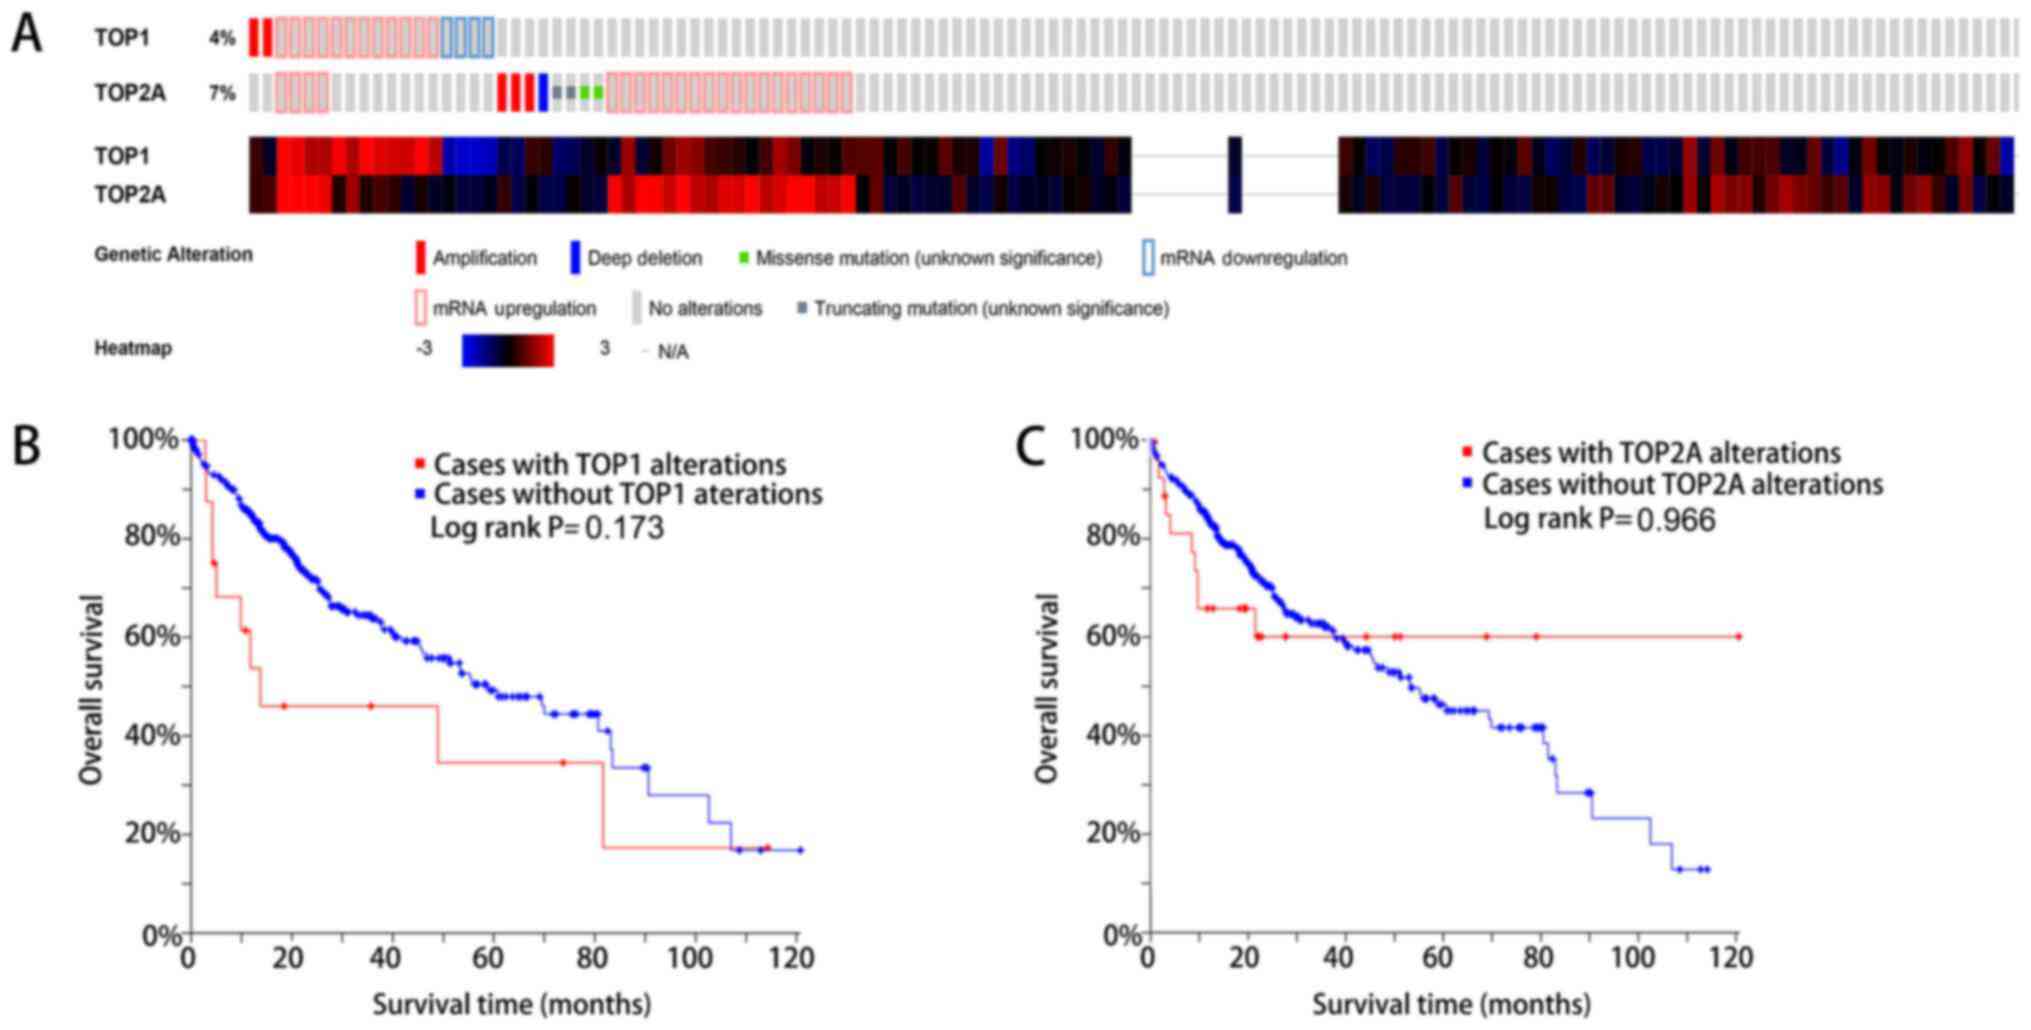
The present study also examined the alterations in
TOP1 and TOP2A expression in LC samples using the cBioPortal
database. TOP1 was altered in 18 (4.1%) and TOP2A was altered in 30
(6.8%) of the 440 patients with LC (Fig. 13A). For TOP1, patients with
alteration tended to have a worse survival (P=0.173) (Fig. 13B), while for TOP2A, the survival
outcome was similar for patients with and without alteration
(P=0.966) (Fig. 13C).
Functional annotation and pathway
enrichment of TOP1 and TOP2A in LC
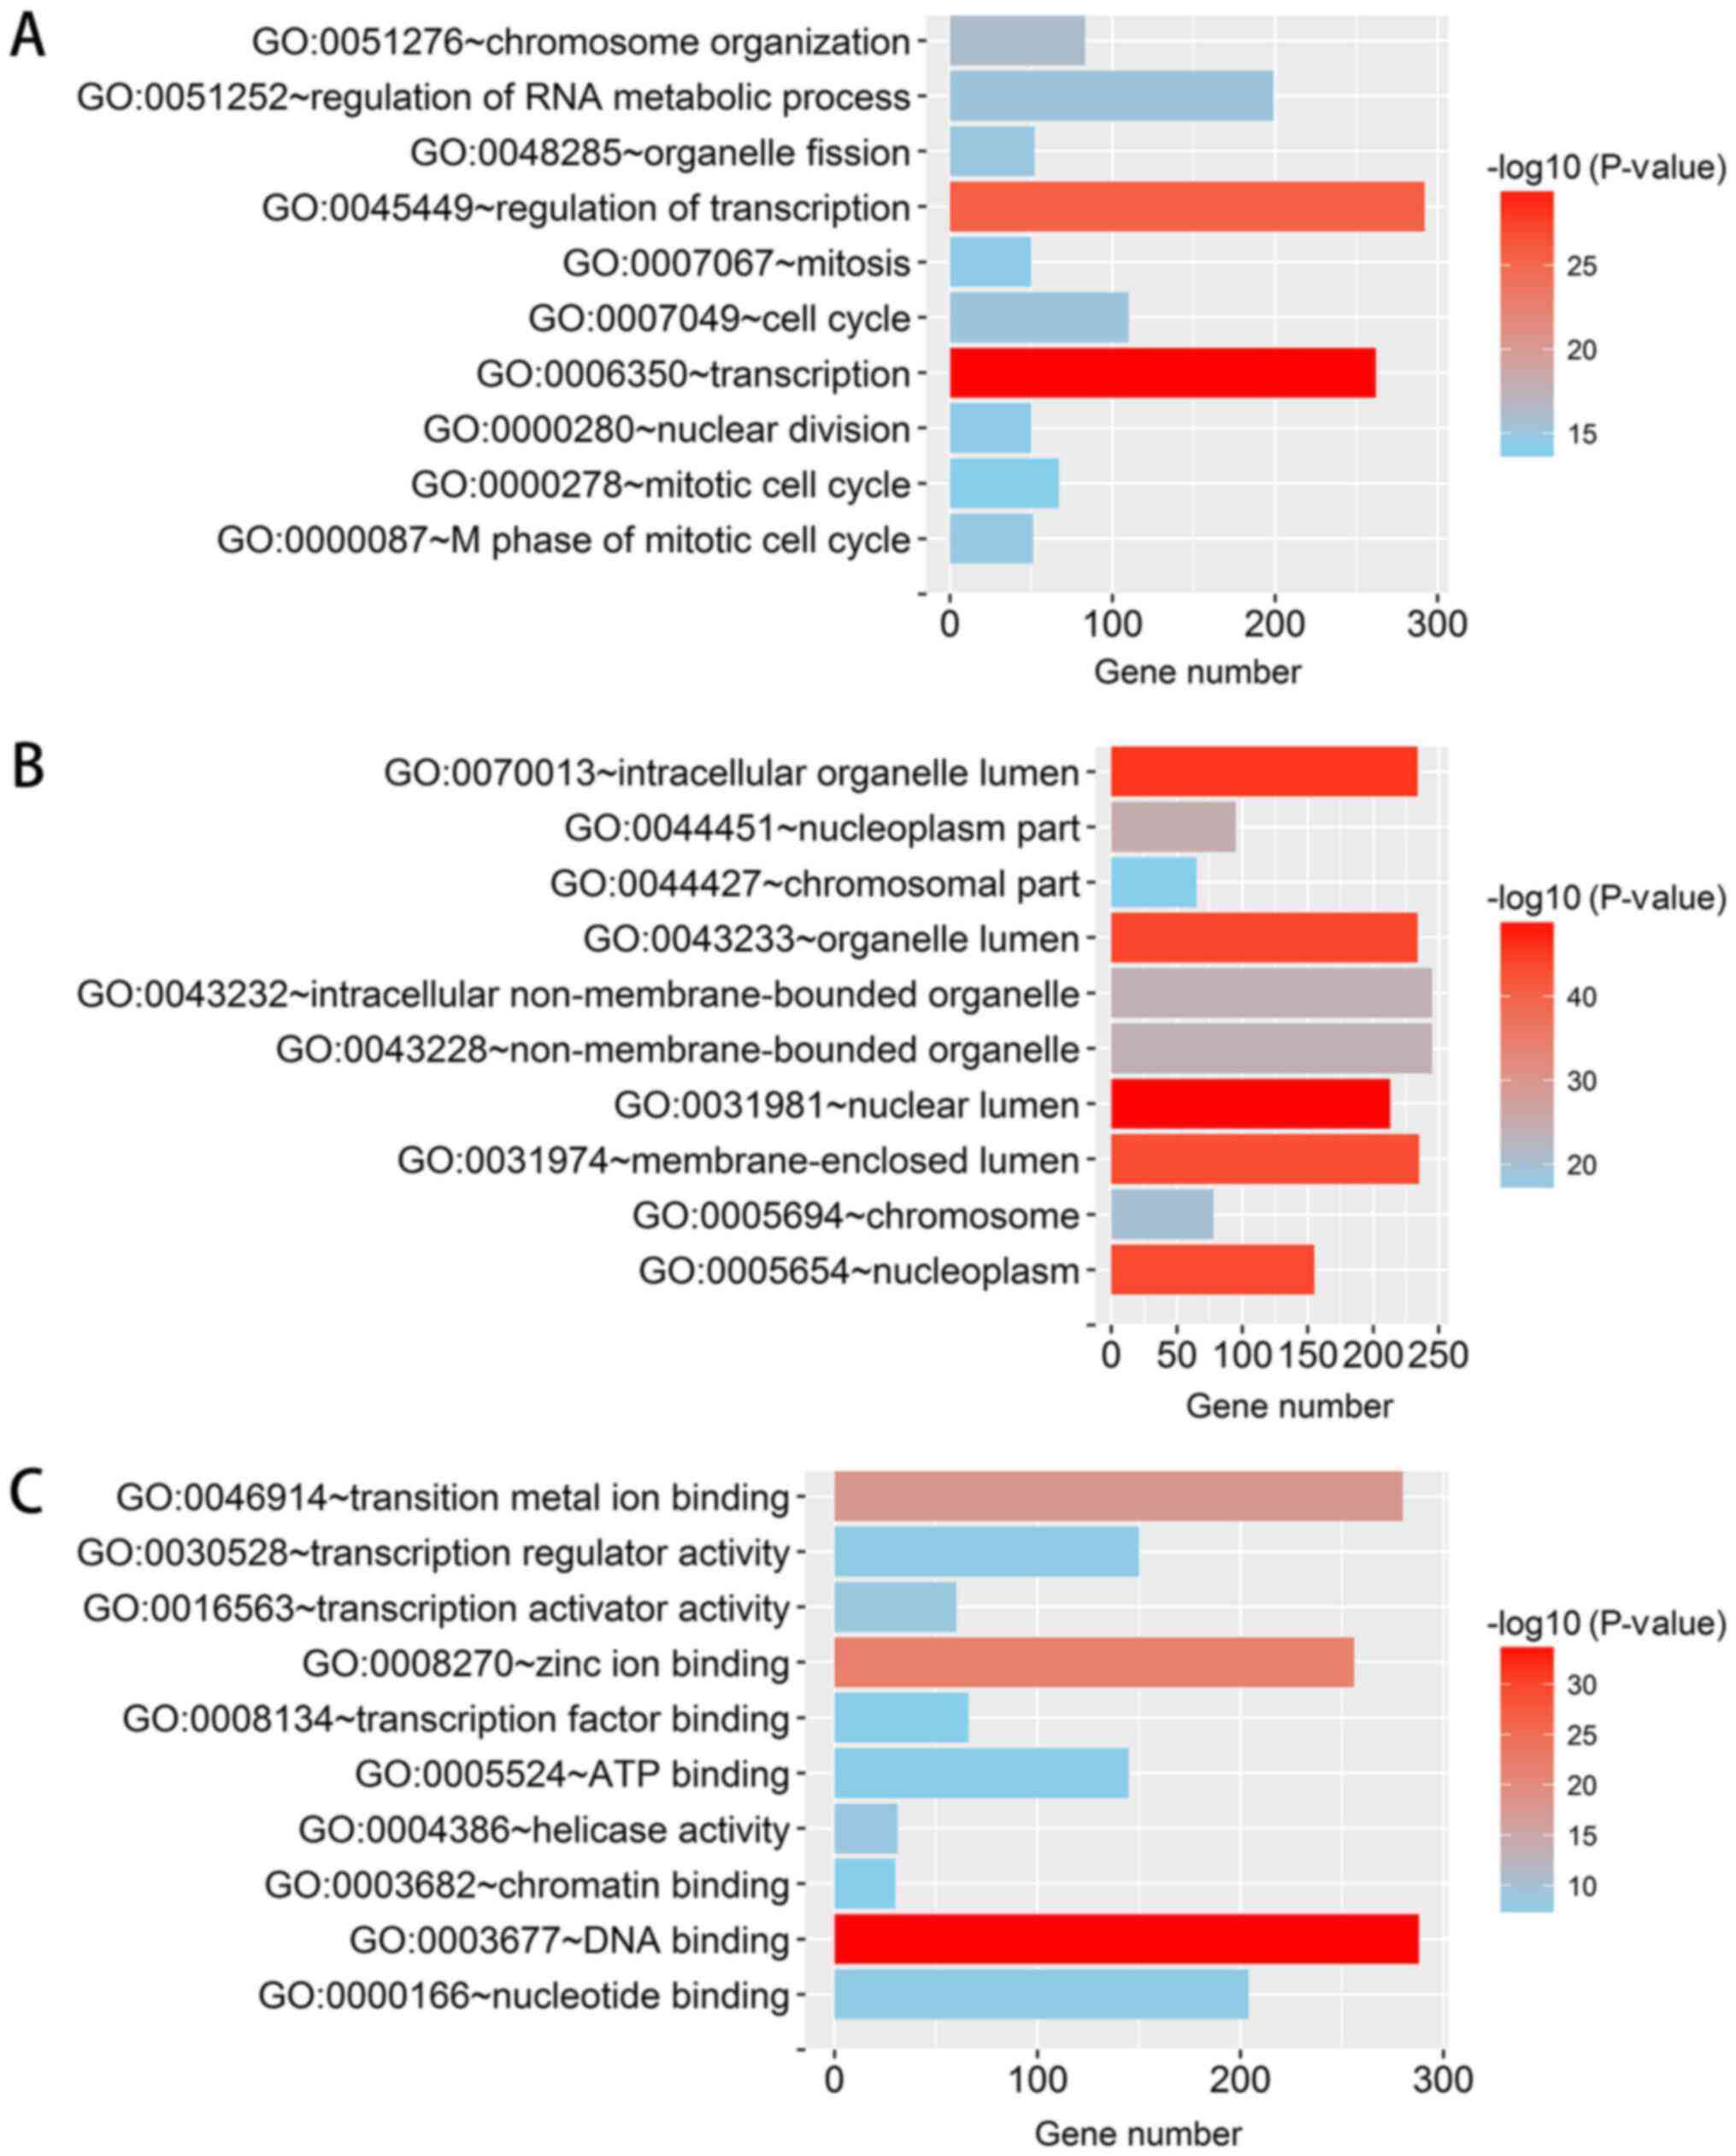
Based on cBioPortal data, a total of 3,959 genes
were co-expressed with TOP1, including 2,448 positively associated
and 1,511 negatively associated genes. For TOP2A, 2,485 genes were
co-expressed, with 2,083 positively associated and 402 negatively
associated genes. Examination of the intersection between the genes
co-expressed with TOP1 and with TOP2A revealed 1,209 overlapping
genes, which were selected for further analysis. The top 10 GO
terms are displayed in Fig. 14.
The co-expressed genes were mainly enriched in nuclear genes and
were involved in the regulation of transcription and the cell
cycle.
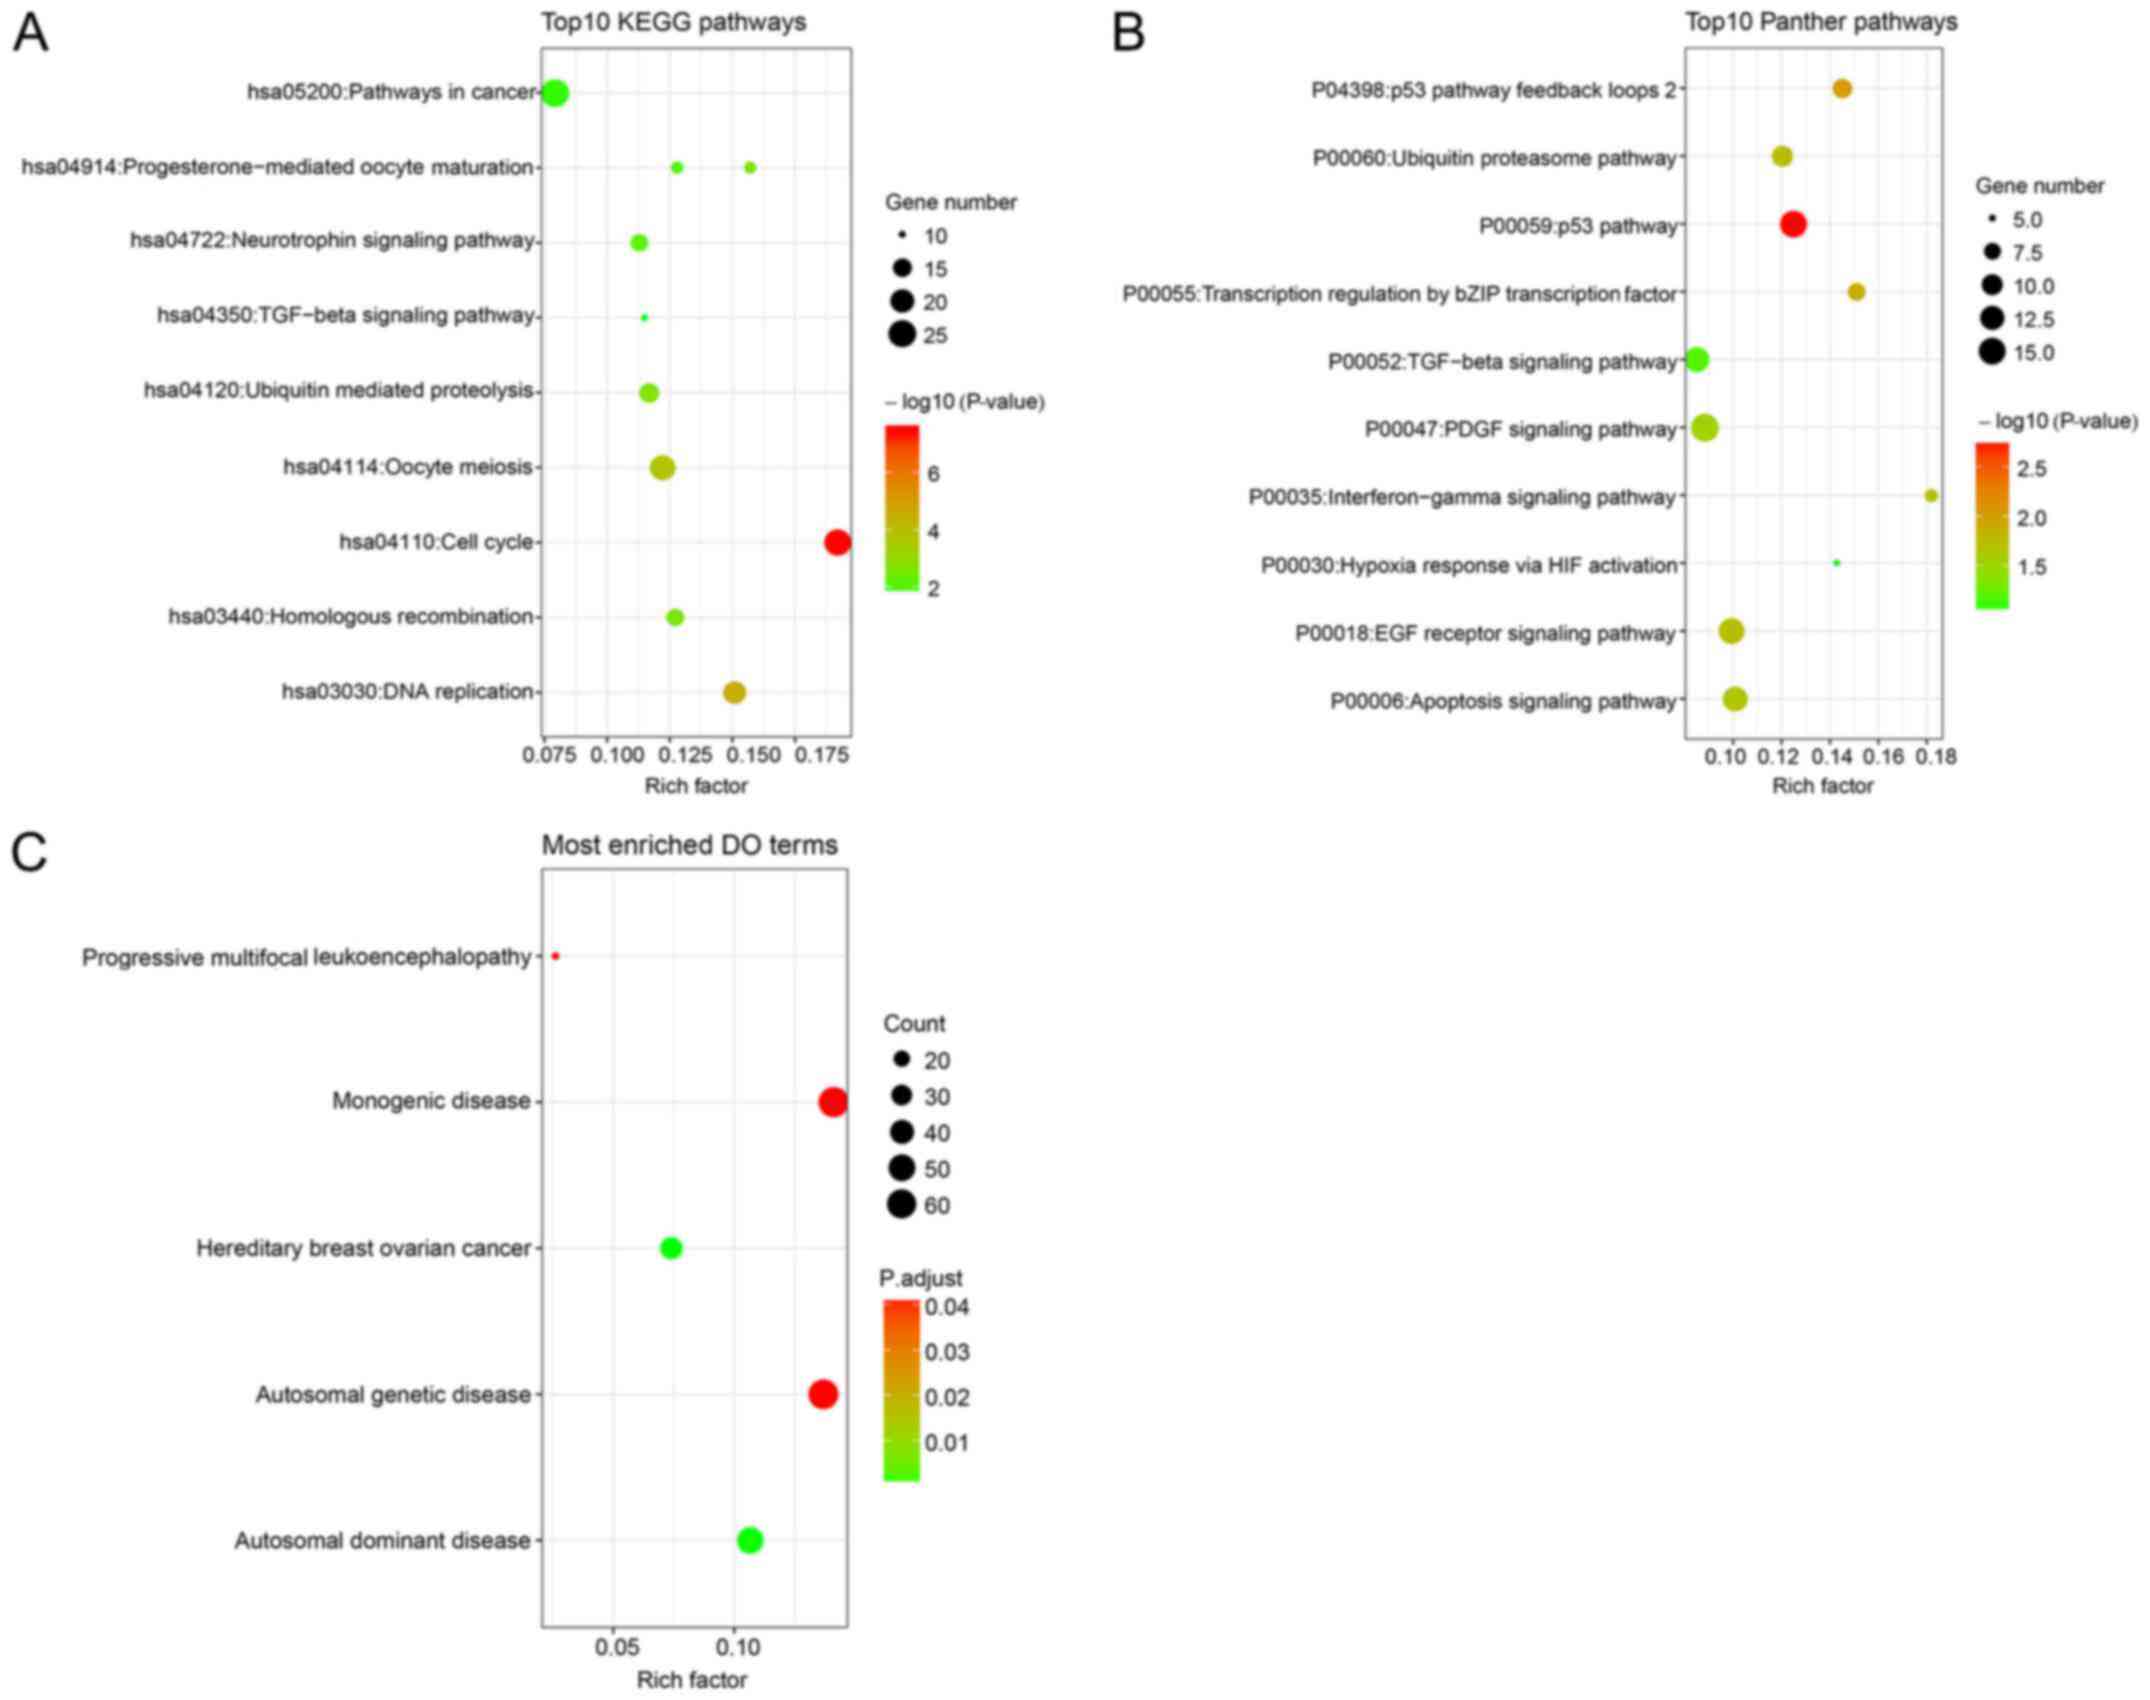
KEGG and Panther pathway analyses revealed that
these genes participated in several cancer-related pathways, such
as the ‘p53 pathway’, ‘pathway in cancer’ and the ‘apoptosis
signaling pathway’ (Fig. 15A and
B). DO analysis, conducted to investigate the involvement of
these genes in disease, revealed that these genes were associated
with ‘hereditary breast ovarian cancer’, ‘autosomal dominant
disease’, ‘autosomal genetic disease’, ‘progressive multifocal
leukoencephalopathy’ and ‘monogenic disease’ (Fig. 15C).
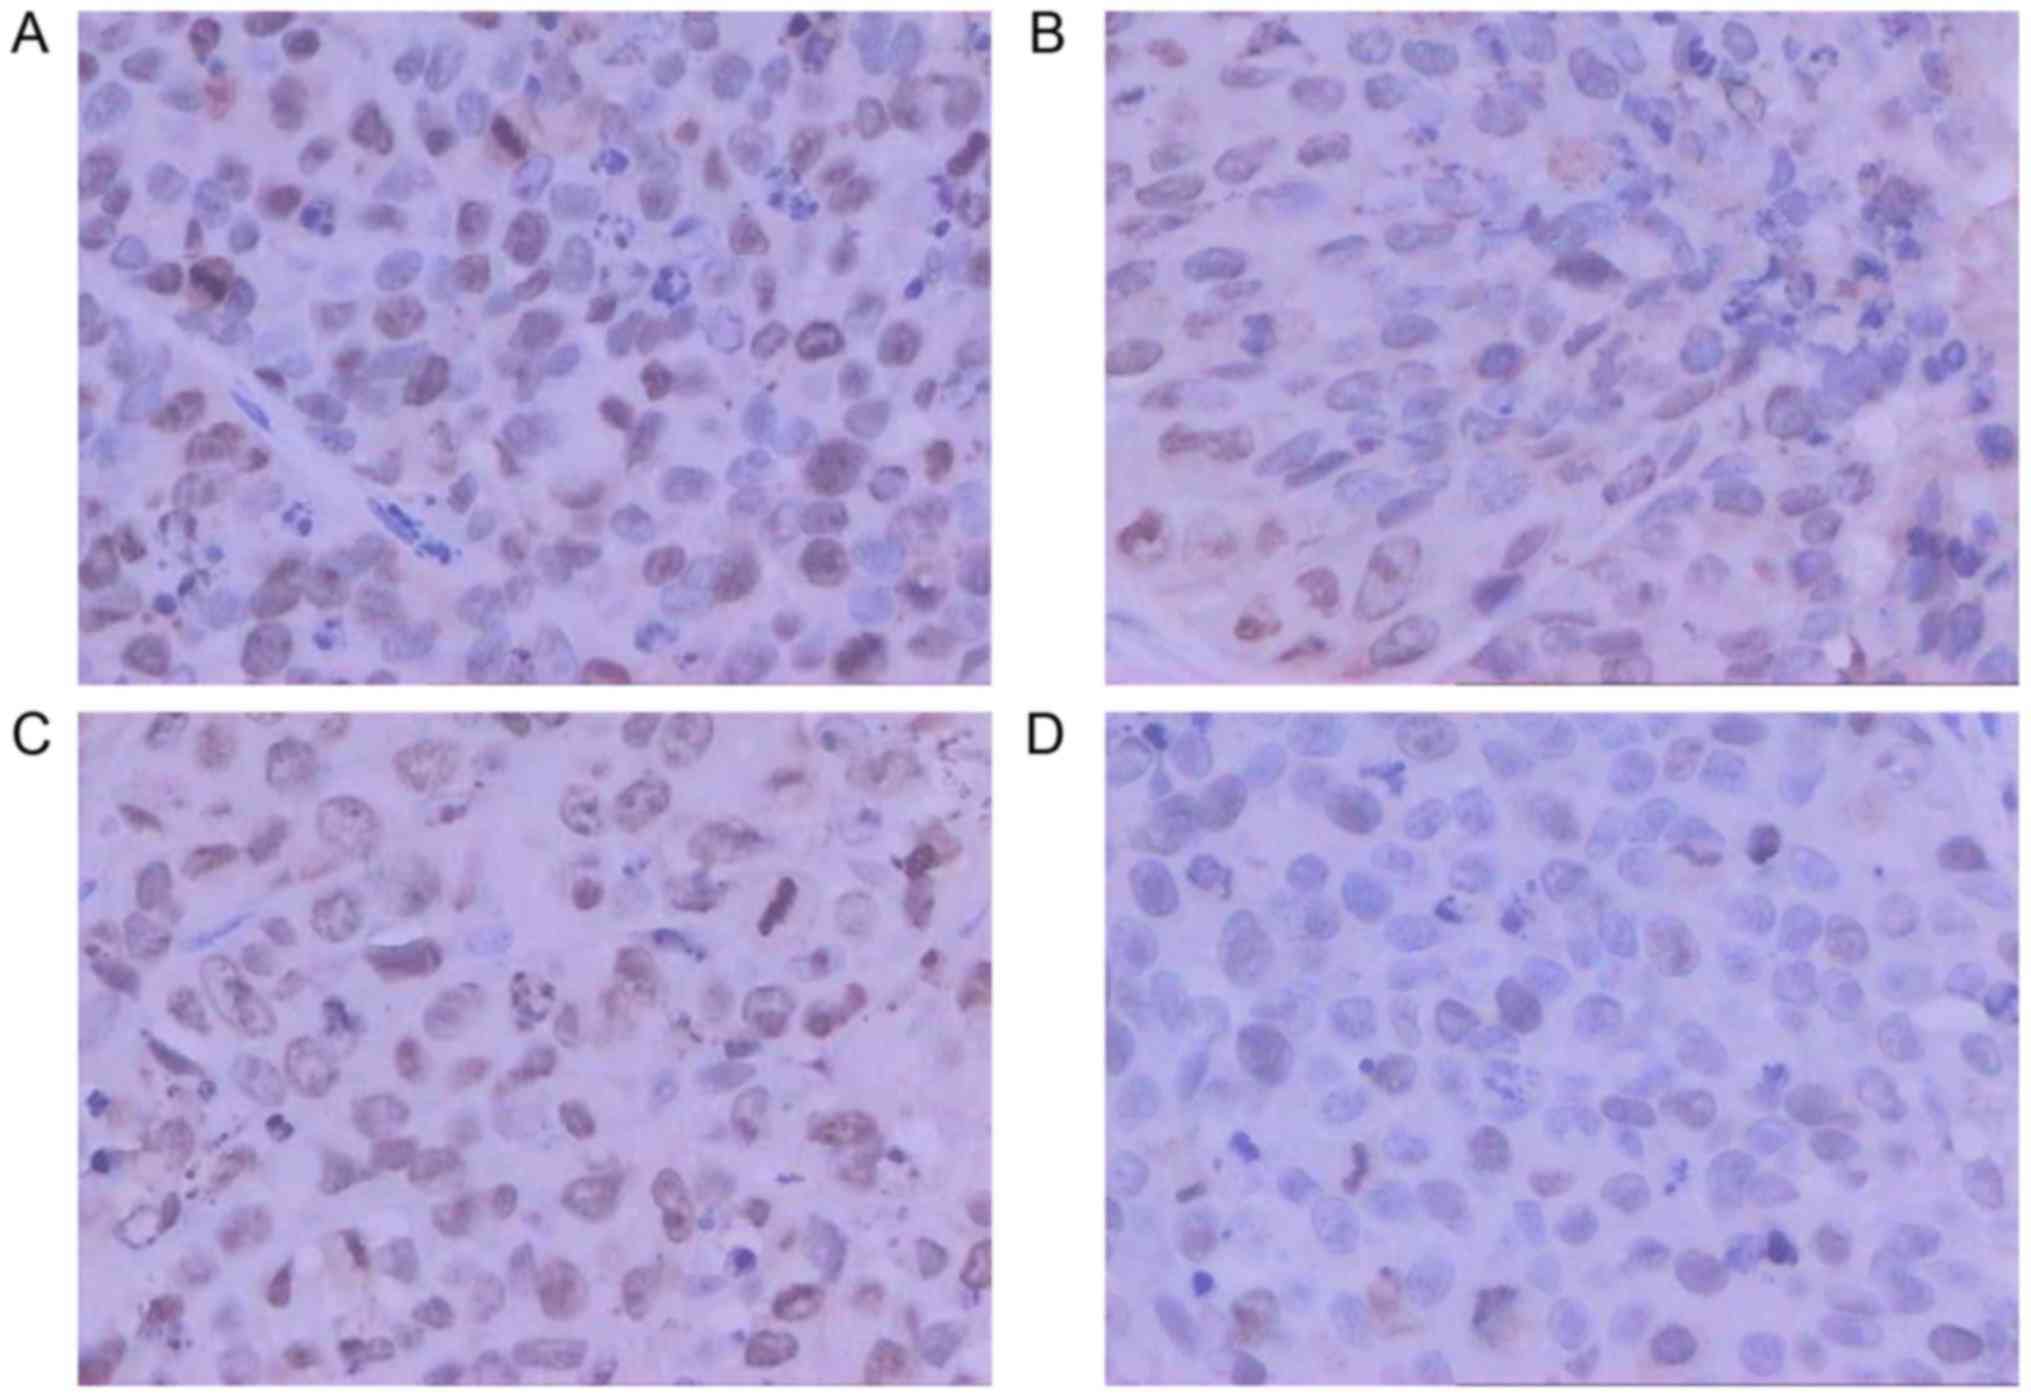
NC inhibits the expression of TOP1 and
TOP2A
NC exhibited an inhibitory effect on the growth of
LC xenografts in the nude mice. When compared with that of the
negative control group, the tumor volume in the NC group was
significantly and dose- dependently reduced (Table II). For TOP1, the mean mRNA
expression in the NC-treated and control groups was 0.073 and
0.236, respectively. For TOP2A, the mean mRNA expression in the
NC-treated and control groups was 0.13 and 0.156, respectively.
These findings suggested that NC could inhibit the expression of
TOP1 and TOP2A at the mRNA level (P<0.05). Subsequent IHC
staining confirmed a similar inhibition of TOP1 and TOP2A
expression at the protein level by NC (Fig. 16).
| Table IITumor volume of liver cancer
xenografts in nude mice following NC treatment. |
Table II
Tumor volume of liver cancer
xenografts in nude mice following NC treatment.
| Treatment | Dosage mg/kg | TV, mm3
| RTV | T/C, % |
|---|
| Pre-treatment (mean
± SD) | Post-treatment
(mean ± SD) |
|---|
| Saline | – | 200.22±89.67 | 1474.4±109.34 | 7.36±1.21 | 100 |
| NC | 2.5 | 241.23±94.59 | 1313.77±242.41 | 5.44±1.47 | 73.95 |
| NC | 5.0 | 201.38±79.43 | 955.89±54.73 | 4.75±0.30a | 64.55 |
| NC | 10 | 224.43±62.53 | 842.55±242.18 | 3.75±0.92b | 51.07 |
Verification of the inhibitory effect of
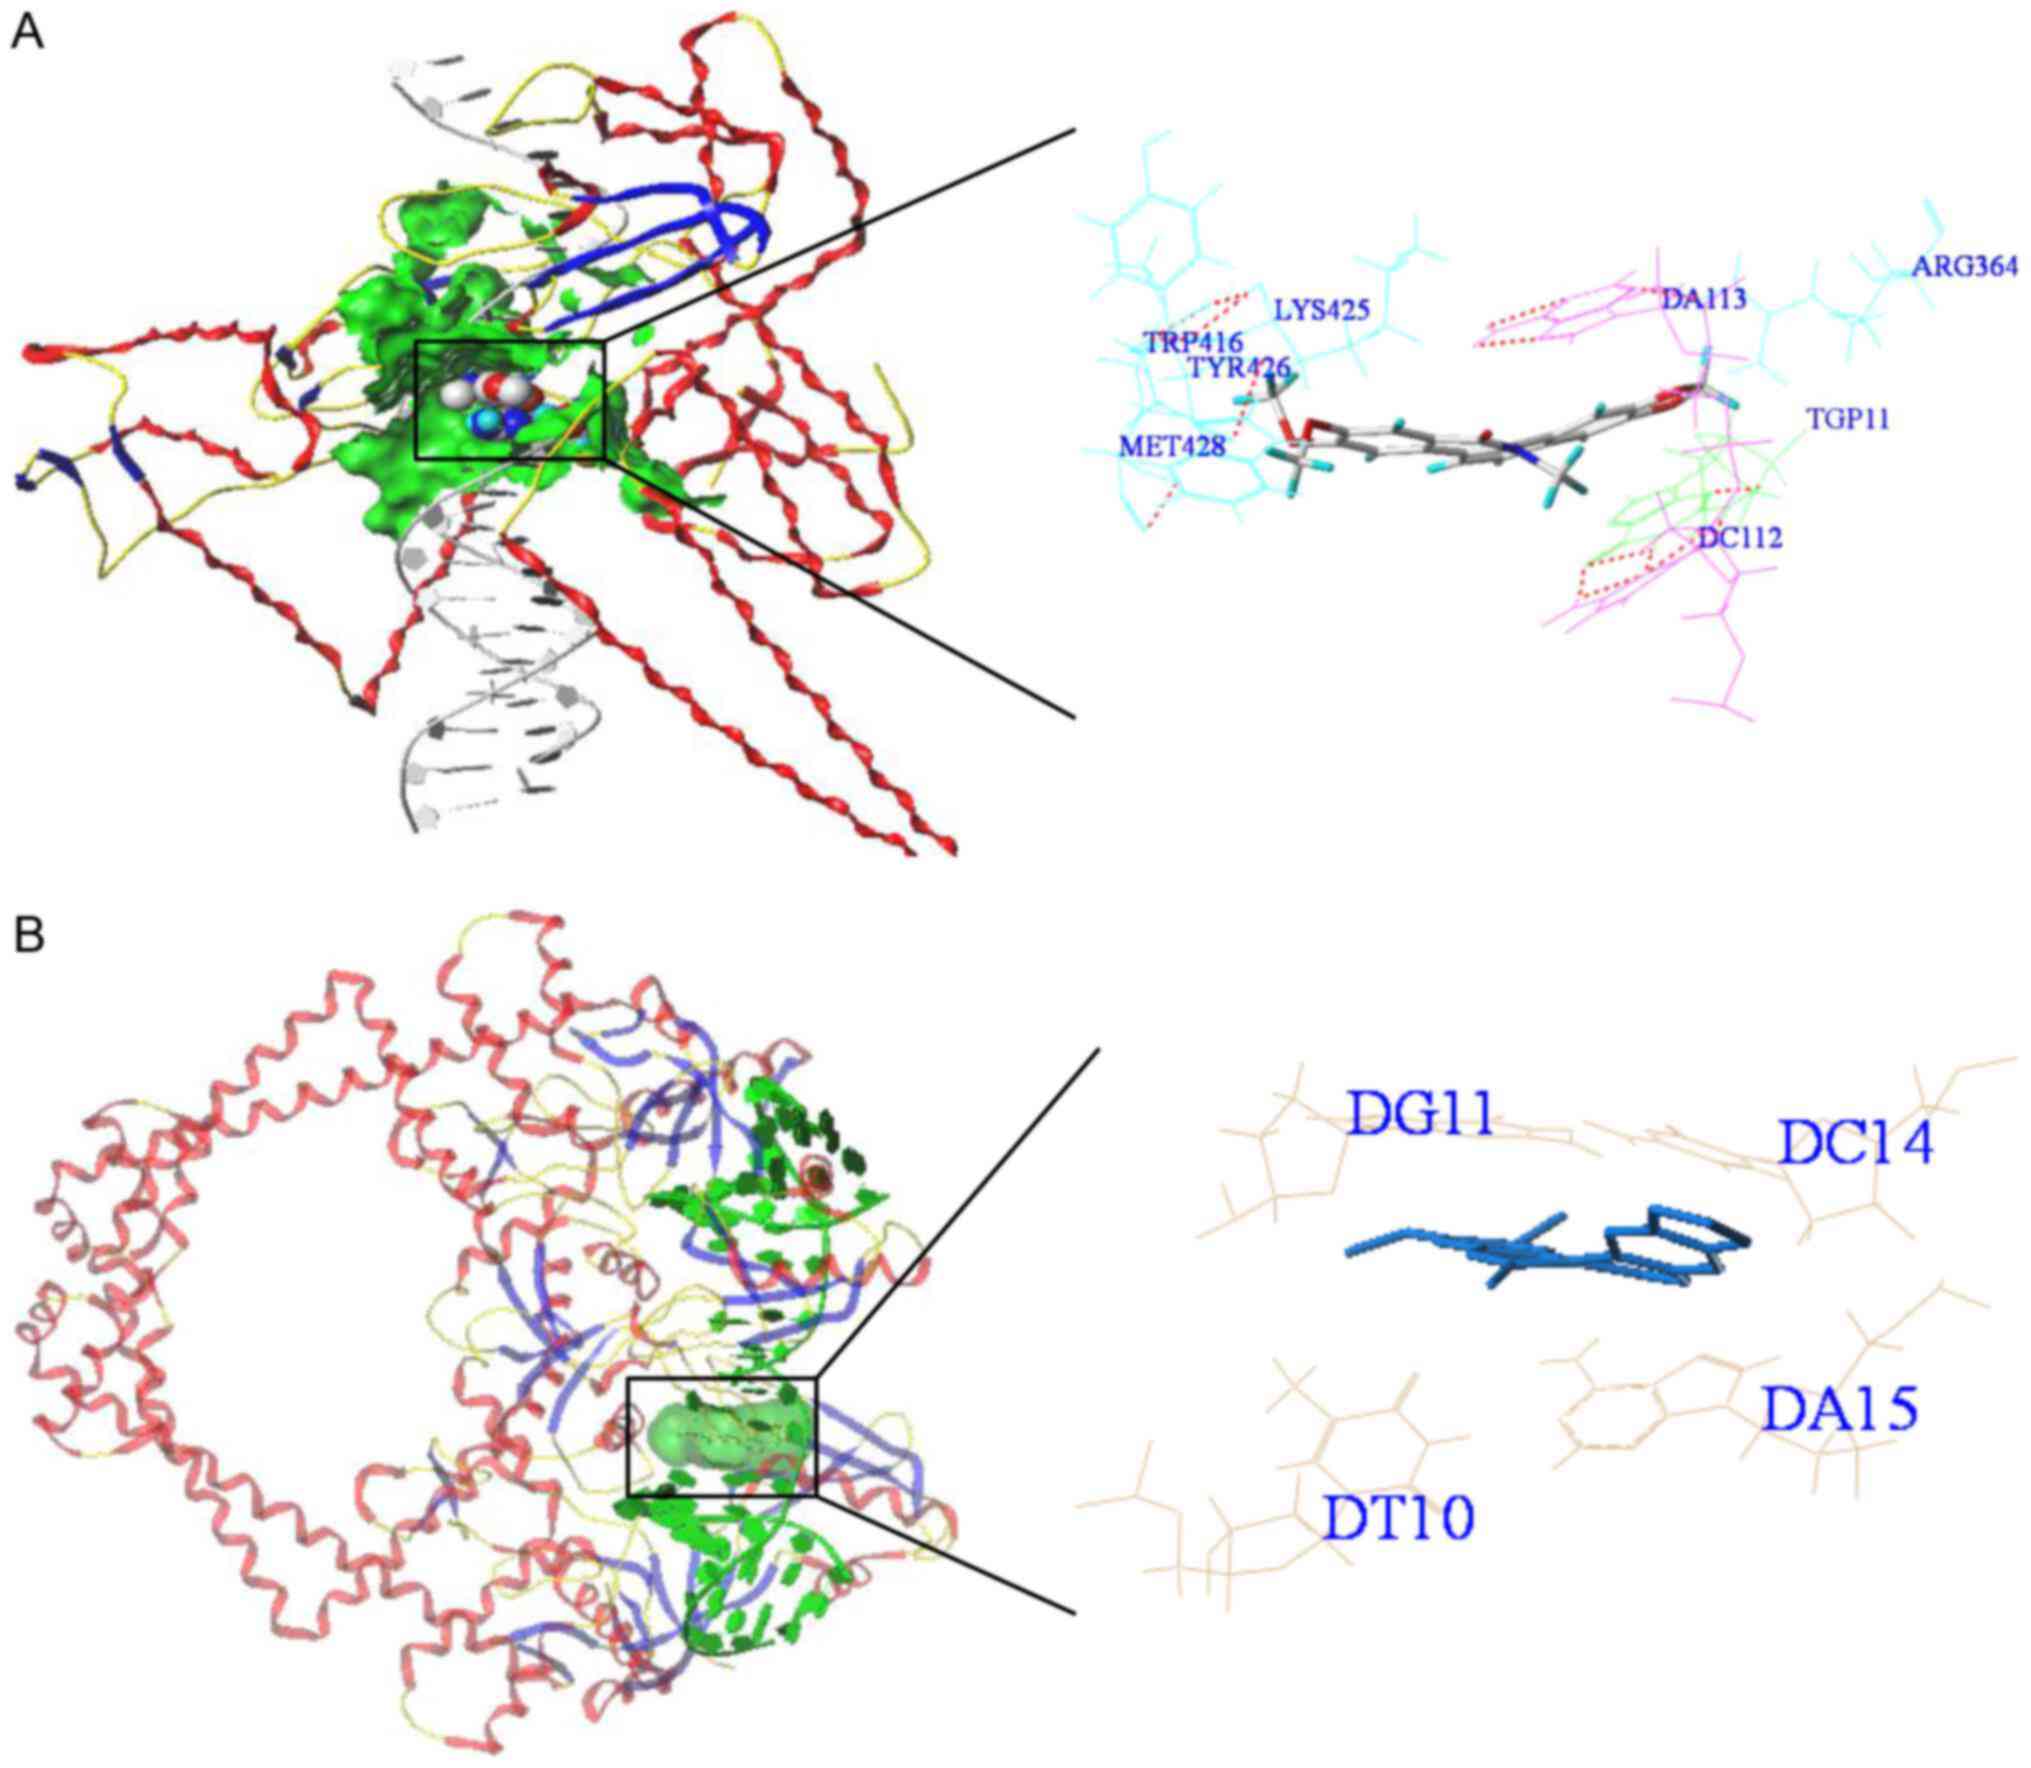
NC on TOP1 and TOP2A by molecular docking
The present study further investigated the binding
modes and interactions between NC and TOP1/TOP2A with a molecular
docking method. The results of the molecular docking calculations
are shown in Table III and
Fig. 17. According to these
results, the total docking scores of TOP1 and TOP2A were 8.2 and
14.47, respectively, indicating strong interactions between NC and
TOP1 and TOP2A.
| Table IIIResults of the molecular docking
calculations. |
Table III
Results of the molecular docking
calculations.
| Protein | PDB ID | Total_Score | Crash | Polar | Cscore |
|---|
| TOP1 | 1k4T | 8.2 | −1.73 | 2.15 | 3 |
| TOP2A | 5btg | 14.47 | −2.02 | 1.22 | 5 |
Discussion
DNA topoisomerases, which are well-known modulators
of DNA topology, catalyze the alteration of DNA topological
structures by cleaving and reconnecting single or double- stranded
DNA (58,59). Depending on whether they make
single- or double-stranded breaks, the topoisomerases are divided
into TOP1 and TOP2 (60,61), with TOP2A being a subfamily of
TOP2. During RNA transcription and DNA replication, TOP1 and TOP2A
can relax positive and negative supercoils to regulate key cellular
processes (62,63). TOP1 and TOP2A are tumor drivers in
a myriad of human cancer types, including LC. The study by Ang
et al (64), which employed
a multiplatform profiling service method based on 350 LC samples,
found upregulation of TOP1 and TOP2A in LC. Wong et al
(65) detected TOP2A expression in
LC cell lines and tissues. It was also determined that TOP2A was
overexpressed in LC, and that the high expression of TOP2A was
closely associated with microvascular invasion, advanced
histological grading, an early age of occurrence of HCC and a poor
survival outcome. Panvichian et al (66) also confirmed the high expression of
TOP2A in LC.
In the present study, a high expression level of
TOP1 and TOP2A protein was observed based on IHC staining. The
combined use of microarrays and RNA-seq data mining also verified
higher gene expression levels for TOP1 and TOP2A in HCC tissues
than those in normal liver tissues. The gene expression level was
much higher for TOP2A in HCC than that for TOP1 (TOP1: SMD, 0.31;
95% CI, 0.07-0.55; P=0.012; and TOP2A: SMD, 1.92; 95% CI,
1.51-2.32; P<0.0001); however, the protein expression levels
were similar. Previous studies have demonstrated that TOP2A is
regulated at the translational or transcriptional level (67,68),
which may result in a discrepancy between protein expression and
RNA expression.
Our data from the cBioPortal revealed genetic
alterations of TOP1 and TOP2A in human hepatocellular carcinoma.
More interestingly, patients with TOP1 alterations showed a lower
OS compared to patients without TOP1 mutation. We assumed that the
abnormal alterations may be responsible for the ontogenetic role of
TOP1 and TOP2A in LC.
The data from TCGA was also used to investigate the
prognostic value of TOP1 and TOP2A expression. High expression of
TOP1 and TOP2A predicted unfavorable OS and poor DFS. Higher
expression levels of TOP1 and TOP2A were also found in high-risk
patients compared with those in low- risk patients. These findings
indicated that TOP1 and TOP2A could be potential biomarkers for
predicting the prognosis of patients with LC, and for identifying
high-risk cases and allowing optimization of individual treatment
management. Bioinformatics analyses were also conducted to
investigate the potential biological processes and signaling
pathways in which TOP1 and TOP2A may be involved. Consistent with
previous studies (69,70), it was found that TOP1 and TOP2A
were located in the nucleus and regulated RNA transcription,
chromosome organization, RNA metabolism and the cell cycle.
Additionally, it was found that TOP1 and TOP2A were associated with
several cancer-related pathways, including the ‘p53 pathway’,
‘pathway in cancer’ and the ‘apoptosis signaling pathway’. The
oncogenic role served by TOP1 and TOP2A in LC may therefore involve
interactions with these signaling cascades. Further studies are
required to verify this speculation.
TOP1 and TOP2A have essential roles in mammalian
cells, making them valuable as drug targets for cancer
pharmacotherapy (71,72). However, the poor selectivity of
traditional TOP inhibitors for tumor cells often results in serious
side effects in patients with cancer, so novel medicines with
favorable targeting effects are urgently required. Natural products
are receiving increasing attention in the treatment of cancer
patients due to their low side effects and extensive biological
activities (73,74).
NC is a natural bioactive alkaloid derived from a
well-known Chinese herbal medicine, Zanthoxylum nitidum
(Roxb) DC. This herbal ingredient is considered a promising
chemotherapeutic agent for malignant tumors, including LC. Liao
et al (9) conducted in
vivo experiments and found that NC restrained LC cell growth by
inhibiting the Janus kinase 1-signal transducer and activator of
transcription 3 signaling pathway. Lin et al (25) also verified the inhibitory effect
of NC on LC cell growth, and Ou et al (24) demonstrated that NC induced
apoptosis in LC cells by regulation of a pathway that included p53,
p21, apoptosis regulator Bax and B-cell lymphoma 2. Several studies
have proposed that NC could be a TOP inhibitor (26,27),
but the mechanism underlying NC action on topoisomerases required
establishing further.
In the present study, IHC and RT-qPCR were used to
compare the mRNA and protein expression of TOP1 and TOP2A in
hepatic tumor tissues with or without NC treatment. The NC
treatment reduced the expression of TOP1 and TOP2A at the mRNA and
protein levels. Molecular docking studies also confirmed the direct
binding of NC to TOP1 and TOP2A. Taken together, these results
indicated that TOP1 and TOP2A could be direct targets of NC.
However, further experiments are necessary to verify these
findings.
In conclusion, the present study points to an
oncogenic role for TOP1 and TOP2A in LC. TOP1 and TOP2A were
upregulated in LC at the protein and mRNA levels, indicating their
potential use as biomarkers to predict prognosis in patients with
LC and to identify high-risk cases, thereby optimizing individual
treatment management. The present findings also increase our
understanding of the antitumor effects of NC on LC and reveal its
promise as a therapeutic agent for LC treatment.
Funding
This study was financially supported by funds from
the National Natural Science Foundation of China (grant nos.
NSFC81860717 and 81560489), the Natural Science Foundation of
Guangxi, China (grant no. 2017GXNSFAA198017), the Guangxi Medical
University Training Program for Distinguished Young Scholars, and a
‘Medical Excellence Award’ funded by the Creative Research
Development Grant from the First Affiliated Hospital of Guangxi
Medical University.
Availability of data and materials
The datasets used and/or analyzed during the current
study are available from the corresponding author on reasonable
request.
Authors’ contributions
LML conducted the in vivo experiments,
RT-qPCR, IHC and molecular docking, and contributed to the main
writing of the manuscript. DDX collected and analyzed data from the
GEO, Oncomine, ArrayExpress and TCGA, and contributed to the main
writing of the manuscript. PL and HY conducted the bioinformatics
analyses. YWD conducted the IHC of the tissue microarrays. GC
guided the design of this study and the writing of the
manuscript.
Ethics approval and consent to
participate
All participants provided informed consent prior to
sample collection. The Ethics Committee of the First Affiliated
Hospital of Guangxi Medical University approved this
investigation.
Patient consent for publication
Not applicable.
Competing interests
The authors declare that they have no conflicts of
interest.
Acknowledgments
Not applicable.
References
|
1
|
Ferlay J, Soerjomataram I, Dikshit R, Eser
S, Mathers C, Rebelo M, Parkin DM, Forman D and Bray F: Cancer
incidence and mortality worldwide: Sources methods and major
patterns in GLOBOCAN 2012. Int J Cancer. 136:E359–E386. 2015.
View Article : Google Scholar
|
|
2
|
Park JW, Chen M, Colombo M, Roberts LR,
Schwartz M, Chen PJ, Kudo M, Johnson P, Wagner S, Orsini LS, et al:
Global patterns of hepatocellular carcinoma management from
diagnosis to death: The BRIDGE Study. Liver Int. 35:2155–2166.
2015. View Article : Google Scholar : PubMed/NCBI
|
|
3
|
Siegel RL, Miller KD and Jemal A: Cancer
statistics, 2018. CA Cancer J Clin. 68:7–30. 2018. View Article : Google Scholar : PubMed/NCBI
|
|
4
|
Yoshimoto T, Imura S, Morine Y, Ikemoto T,
Arakawa Y, Iwahashi S, Saito YU, Takasu C, Ishikawa D, Teraoku H,
et al: The outcome of sorafenib therapy on unresectable
hepatocellular carcinoma: Experience of conversion and salvage
hepatectomy. Anticancer Res. 38:501–507. 2018.
|
|
5
|
Neuzillet C, de Mestier L, Rousseau B, Mir
O, Hebbar M, Kocher HM, Ruszniewski P and Tournigand C: Unravelling
the pharmacologic opportunities and future directions for targeted
therapies in gastro-intestinal cancers part 2: Neuroendocrine
tumours, hepatocellular carcinoma, and gastro-intestinal stromal
tumours. Pharmacol Ther. 181:49–75. 2018. View Article : Google Scholar
|
|
6
|
Yuan P, Cao W, Zang Q, Li G, Guo X and Fan
J: The HIF-2α- MALAT1-miR-216b axis regulates multi-drug resistance
of hepatocellular carcinoma cells via modulating autophagy. Biochem
Biophys Res Commun. 478:1067–1073. 2016. View Article : Google Scholar : PubMed/NCBI
|
|
7
|
Zhang Li M, Ge L, Chen C, Fang L, Li T,
Tian H, Liu H, Chen J, Jiang TG, et al: An isocorydine derivative
(d-ICD) inhibits drug resistance by downregulating IGF2BP3
expression in hepatocellular carcinoma. Oncotarget. 6:25149–25160.
2015.PubMed/NCBI
|
|
8
|
Auyeung KK and Ko JK: Coptis chinensis
inhibits hepatocellular carcinoma cell growth through nonsteroidal
anti-inflammatory drug-activated gene activation. Int J Mol Med.
24:571–577. 2009.PubMed/NCBI
|
|
9
|
Liao J, Xu T, Zheng JX, Lin JM, Cai QY, Yu
DB and Peng J: Nitidine chloride inhibits hepatocellular carcinoma
cell growth in vivo through the suppression of the JAK1/STAT3
signaling pathway. Int J Mol Med. 32:79–84. 2013. View Article : Google Scholar : PubMed/NCBI
|
|
10
|
Cazzamalli S, Corso AD and Neri D:
Targeted delivery of cytotoxic drugs: Challenges, opportunities and
new developments. Chimia (Aarau). 71:712–715. 2017. View Article : Google Scholar
|
|
11
|
Inoue T, Kurimoto N, Furuya N, Handa H,
Kida H, Nishine H, Ishida A, Nobuyama S, Mineshita M and Miyazawa
T: New technique for endobronchial ultrasound-guided transbronchial
needle aspiration to improve diagnostic yield. J Bronchology Interv
Pulmonol. 20:28–32. 2013. View Article : Google Scholar : PubMed/NCBI
|
|
12
|
Moukharskaya J and Verschraegen C:
Topoisomerase 1 inhibitors and cancer therapy. Hematol Oncol Clin
North Am. 26:507–525. 2012. View Article : Google Scholar : PubMed/NCBI
|
|
13
|
Wang N, Zhu M, Tsao SW, Man K, Zhang Z and
Feng Y: MiR-23a-mediated inhibition of topoisomerase 1 expression
potentiates cell response to etoposide in human hepatocellular
carcinoma. Mol Cancer. 12:1192013. View Article : Google Scholar : PubMed/NCBI
|
|
14
|
Both J, Wu T, Ten Asbroek AL, Baas F and
Hulsebos TJ: Oncogenic properties of candidate oncogenes in
chromosome region 17p112p12 in human osteosarcoma. Cytogenet Genome
Res. 150:52–59. 2016. View Article : Google Scholar
|
|
15
|
Zhou Q, Abraham AD, Li L, Babalmorad A,
Bagby S, Arcaroli JJ, Hansen RJ, Valeriote FA, Gustafson DL,
Schaack J, et al: Topoisomerase IIα mediates TCF-dependent
epithelial-mesenchymal transition in colon cancer. Oncogene.
35:4990–4999. 2016. View Article : Google Scholar : PubMed/NCBI
|
|
16
|
Delgado JL, Hsieh CM, Chan NL and Hiasa H:
Topoisomerases as anticancer targets. Biochem J. 475:373–398. 2018.
View Article : Google Scholar
|
|
17
|
Russo P, Del Bufalo A and Cesario A:
Flavonoids acting on DNA topoisomerases: Recent advances and future
perspectives in cancer therapy. Curr Med Chem. 19:5287–5293. 2012.
View Article : Google Scholar : PubMed/NCBI
|
|
18
|
Kathiravan MK, Kale AN and Nilewar S:
Discovery and development of topoisomerase inhibitors as anticancer
agents. Mini Rev Med Chem. 16:1219–1229. 2016. View Article : Google Scholar : PubMed/NCBI
|
|
19
|
Wasim L and Chopra M: Synergistic
anticancer effect of panobinostat and topoisomerase inhibitors
through ROS generation and intrinsic apoptotic pathway induction in
cervical cancer cells. Cell Oncol (Dordr). 41:201–212. 2018.
View Article : Google Scholar
|
|
20
|
Nukuzuma S, Nakamichi K, Kameoka M,
Sugiura S, Nukuzuma C, Tasaki T and Takegami T: Suppressive effect
of topoisomerase inhibitors on JC polyomavirus propagation in human
neuroblastoma cells. Microbiol Immunol. 60:253–260. 2016.
View Article : Google Scholar : PubMed/NCBI
|
|
21
|
Chen J, Wang J, Lin L, He L, Wu Y, Zhang
L, Yi Z, Chen Y, Pang X and Liu M: Inhibition of STAT3 signaling
pathway by nitidine chloride suppressed the angiogenesis and growth
of human gastric cancer. Mol Cancer Ther. 11:277–287. 2012.
View Article : Google Scholar
|
|
22
|
Mou H, Guo P, Li X, Zhang C, Jiang J, Wang
L, Wang Q and Yuan Z: Nitidine chloride inhibited the expression of
S phase kinase-associated protein 2 in ovarian cancer cells. Cell
Cycle. 16:1366–1375. 2017. View Article : Google Scholar : PubMed/NCBI
|
|
23
|
Sun M, Zhang N, Wang X, Li Y, Qi W, Zhang
H, Li Z and Yang Q: Hedgehog pathway is involved in nitidine
chloride induced inhibition of epithelial-mesenchymal transition
and cancer stem cells-like properties in breast cancer cells. Cell
Biosci. 6:442016. View Article : Google Scholar : PubMed/NCBI
|
|
24
|
Ou X, Lu Y, Liao L, Li D, Liu L, Liu H and
Xu H: Nitidine chloride induces apoptosis in human hepatocellular
carcinoma cells through a pathway involving p53, p21, Bax and
Bcl-2. Oncol Rep. 33:1264–1274. 2015. View Article : Google Scholar
|
|
25
|
Lin J, Shen A, Chen H, Liao J, Xu T, Liu
L, Lin J and Peng J: Nitidine chloride inhibits hepatic cancer
growth via modulation of multiple signaling pathways. BMC Cancer.
14:7292014. View Article : Google Scholar : PubMed/NCBI
|
|
26
|
Makhey D, Gatto B, Yu C, Liu A, Liu LF and
LaVoie EJ: Coralyne and related compounds as mammalian
topoisomerase I and topoisomerase II poisons. Bioorg Med Chem.
4:781–791. 1996. View Article : Google Scholar
|
|
27
|
Prado S, Michel S, Tillequin F, Koch M,
Pfeiffer B, Pierré A, Léonce S, Colson P, Baldeyrou B, Lansiaux A,
et al: Synthesis and cytotoxic activity of benzo[c][1,7] and
[1,8]phenanthrolines analogues of nitidine and fagaronine. Bioorg
Med Chem. 12:3943–3953. 2004. View Article : Google Scholar : PubMed/NCBI
|
|
28
|
Chen G, Umelo IA, Lv S, Teugels E, Fostier
K, Kronenberger P, Dewaele A, Sadones J, Geers C and De Grève J:
miR-146a inhibits cell growth, cell migration and induces apoptosis
in non-small cell lung cancer cells. PLoS One. 8:pp. e603172013,
View Article : Google Scholar : PubMed/NCBI
|
|
29
|
Barrett T, Wilhite SE, Ledoux P,
Evangelista C, Kim IF, Tomashevsky M, Marshall KA, Phillippy KH,
Sherman PM, Holko M, et al: NCBI GEO: Archive for functional
genomics data sets - update. Nucleic Acids Res. 41:D991–D995. 2013.
View Article : Google Scholar
|
|
30
|
Rhodes DR, Yu J, Shanker K, Deshpande N,
Varambally R, Ghosh D, Barrette T, Pandey A and Chinnaiyan AM:
ONCOMINE: A cancer microarray database and integrated data-mining
platform. Neoplasia. 6:1–6. 2004. View Article : Google Scholar : PubMed/NCBI
|
|
31
|
Kolesnikov N, Hastings E, Keays M,
Melnichuk O, Tang YA, Williams E, Dylag M, Kurbatova N, Brandizi M,
Burdett T, et al: ArrayExpress update - simplifying data
submissions. Nucleic Acids Res. 43:D1113–D1116. 2015. View Article : Google Scholar
|
|
32
|
Deng M, Brägelmann J, Schultze JL and
Perner S: Web-TCGA: An online platform for integrated analysis of
molecular cancer data sets. BMC Bioinformatics. 17:722016.
View Article : Google Scholar : PubMed/NCBI
|
|
33
|
Gao J, Aksoy BA, Dogrusoz U, Dresdner G,
Gross B, Sumer SO, Sun Y, Jacobsen A, Sinha R, Larsson E, et al:
Integrative analysis of complex cancer genomics and clinical
profiles using the cBio- Portal. Sci Signal. 6:pl12013. View Article : Google Scholar
|
|
34
|
Fagerberg L, Lindskog C, Oksvold P,
Mardinoglu A, Sivertsson Å, Kampf C, Sjöstedt E, Asplund A, et al:
Proteomics. Tissue-based map of the human proteome. Science.
347:12604192015. View Article : Google Scholar : PubMed/NCBI
|
|
35
|
Huang W, Sherman BT and Lempicki RA:
Systematic and integrative analysis of large gene lists using DAVID
bioinformatics resources. Nat Protoc. 4:44–57. 2009. View Article : Google Scholar
|
|
36
|
Burley SK, Berman HM, Christie C, Duarte
JM, Feng Z, Westbrook J, Young J and Zardecki C: RCSB Protein Data
Bank: Sustaining a living digital data resource that enables
breakthroughs in scientific research and biomedical education.
Protein Sci. 27:316–330. 2018. View Article : Google Scholar
|
|
37
|
Gao J, Liang L, Zhu Y, Qiu S, Wang T and
Zhang L: Ligand and structure-based approaches for the
identification of peptide deformylase inhibitors as antibacterial
drugs. Int J Mol Sci. 17:172016. View Article : Google Scholar
|
|
38
|
Orabi KY, Abaza MS, El Sayed KA, Elnagar
AY, Al-Attiyah R and Guleri RP: Selective growth inhibition of
human malignant melanoma cells by syringic acid-derived proteasome
inhibitors. Cancer Cell Int. 13:822013. View Article : Google Scholar : PubMed/NCBI
|
|
39
|
He HZ, Wang N, Zhang J, Zheng L and Zhang
YM: Tas13D inhibits growth of SMMC-7721 cell via suppression VEGF
and EGF expression. Asian Pac J Cancer Prev. 13:2009–2014. 2012.
View Article : Google Scholar : PubMed/NCBI
|
|
40
|
Wurmbach E, Chen YB, Khitrov G, Zhang W,
Roayaie S, Schwartz M, Fiel I, Thung S, Mazzaferro V, Bruix J, et
al: Genome-wide molecular profiles of HCV-induced dysplasia and
hepatocellular carcinoma. Hepatology. 45:938–947. 2007. View Article : Google Scholar : PubMed/NCBI
|
|
41
|
Mas VR, Maluf DG, Archer KJ, Yanek K, Kong
X, Kulik L, Freise CE, Olthoff KM, Ghobrial RM, McIver P, et al:
Genes involved in viral carcinogenesis and tumor initiation in
hepatitis C virus-induced hepatocellular carcinoma. Mol Med.
15:85–94. 2009. View Article : Google Scholar
|
|
42
|
Satow R, Shitashige M, Kanai Y, Takeshita
F, Ojima H, Jigami T, Honda K, Kosuge T, Ochiya T, Hirohashi S, et
al: Combined functional genome survey of therapeutic targets for
hepatocellular carcinoma. Clin Cancer Res. 16:2518–2528. 2010.
View Article : Google Scholar : PubMed/NCBI
|
|
43
|
Roessler S, Jia HL, Budhu A, Forgues M, Ye
QH, Lee JS, Thorgeirsson SS, Sun Z, Tang ZY, Qin LX, et al: A
unique metastasis gene signature enables prediction of tumor
relapse in early-stage hepatocellular carcinoma patients. Cancer
Res. 70:10202–10212. 2010. View Article : Google Scholar : PubMed/NCBI
|
|
44
|
Lim HY, Sohn I, Deng S, Lee J, Jung SH,
Mao M, Xu J, Wang K, Shi S, Joh JW, et al: Prediction of
disease-free survival in hepatocellular carcinoma by gene
expression profiling. Ann Surg Oncol. 20:3747–3753. 2013.
View Article : Google Scholar : PubMed/NCBI
|
|
45
|
Neumann O, Kesselmeier M, Geffers R,
Pellegrino R, Radlwimmer B, Hoffmann K, Ehemann V, Schemmer P,
Schirmacher P, Lorenzo Bermejo J, et al: Methylome analysis and
integrative profiling of human HCCs identify novel protumorigenic
factors. Hepatology. 56:1817–1827. 2012. View Article : Google Scholar : PubMed/NCBI
|
|
46
|
Kim JH, Sohn BH, Lee HS, Kim SB, Yoo JE,
Park YY, Jeong W, Lee SS, Park ES, Kaseb A, et al: Genomic
predictors for recurrence patterns of hepatocellular carcinoma:
Model derivation and validation. PLoS Med. 11:pp. e10017702014,
View Article : Google Scholar : PubMed/NCBI
|
|
47
|
Villa E, Critelli R, Lei B, Marzocchi G,
Cammà C, Giannelli G, Pontisso P, Cabibbo G, Enea M, Colopi S, et
al: Neoangiogenesis- related genes are hallmarks of fast-growing
hepatocellular carcinomas and worst survival. Results from a
prospective study. Gut. 65:861–869. 2016. View Article : Google Scholar
|
|
48
|
Melis M, Diaz G, Kleiner DE, Zamboni F,
Kabat J, Lai J, Mogavero G, Tice A, Engle RE, Becker S, et al:
Viral expression and molecular profiling in liver tissue versus
microdissected hepatocytes in hepatitis B virus-associated
hepatocellular carcinoma. J Transl Med. 12:2302014. View Article : Google Scholar : PubMed/NCBI
|
|
49
|
Schulze K, Imbeaud S, Letouzé E,
Alexandrov LB, Calderaro J, Rebouissou S, Couchy G, Meiller C,
Shinde J, Soysouvanh F, et al: Exome sequencing of hepatocellular
carcinomas identifies new mutational signatures and potential
therapeutic targets. Nat Genet. 47:505–511. 2015. View Article : Google Scholar : PubMed/NCBI
|
|
50
|
Mah WC, Thurnherr T, Chow PK, Chung AY,
Ooi LL, Toh HC, Teh BT, Saunthararajah Y and Lee CG: Methylation
profiles reveal distinct subgroup of hepatocellular carcinoma
patients with poor prognosis. PLoS One. 9:pp. e1041582014,
View Article : Google Scholar : PubMed/NCBI
|
|
51
|
Wang YH, Cheng TY, Chen TY, Chang KM,
Chuang VP and Kao KJ: Plasmalemmal Vesicle Associated Protein
(PLVAP) as a therapeutic target for treatment of hepatocellular
carcinoma. BMC Cancer. 14:8152014. View Article : Google Scholar : PubMed/NCBI
|
|
52
|
Makowska Z, Boldanova T, Adametz D,
Quagliata L, Vogt JE, Dill MT, Matter MS, Roth V, Terracciano L and
Heim MH: Gene expression analysis of biopsy samples reveals
critical limitations of transcriptome-based molecular
classifications of hepatocellular carcinoma. J Pathol Clin Res.
2:80–92. 2016. View Article : Google Scholar : PubMed/NCBI
|
|
53
|
Wijetunga NA, Pascual M, Tozour J,
Delahaye F, Alani M, Adeyeye M, Wolkoff AW, Verma A and Greally JM:
A pre-neoplastic epigenetic field defect in HCV-infected liver at
transcription factor binding sites and polycomb targets. Oncogene.
36:2030–2044. 2017. View Article : Google Scholar :
|
|
54
|
Grinchuk OV, Yenamandra SP, Iyer R, Singh
M, Lee HK, Lim KH, Chow PK and Kuznetsov VA: Tumor-adjacent tissue
co-expression profile analysis reveals pro-oncogenic ribosomal gene
signature for prognosis of resectable hepatocellular carcinoma. Mol
Oncol. 12:89–113. 2018. View Article : Google Scholar
|
|
55
|
Cancer Cell Line Encyclopedia C: Genomics
of Drug Sensitivity in Cancer C: Pharmacogenomic agreement between
two cancer cell line data sets. Nature. 528:84–87. 2015.
|
|
56
|
Tang Z, Li C, Kang B, Gao G, Li C and
Zhang Z: GEPIA: A web server for cancer and normal gene expression
profiling and interactive analyses. Nucleic Acids Res. 45:W98–W102.
2017. View Article : Google Scholar : PubMed/NCBI
|
|
57
|
Aguirre-Gamboa R, Gomez-Rueda H,
Martínez-Ledesma E, Martínez-Torteya A, Chacolla-Huaringa R,
Rodriguez- Barrientos A, Tamez-Peña JG and Treviño V: SurvExpress:
An online biomarker validation tool and database for cancer gene
expression data using survival analysis. PLoS One. 8:pp.
e742502013, View Article : Google Scholar : PubMed/NCBI
|
|
58
|
Wang JC: Cellular roles of DNA
topoisomerases: A molecular perspective. Nat Rev Mol Cell Biol.
3:430–440. 2002. View
Article : Google Scholar : PubMed/NCBI
|
|
59
|
Chhatriwala H, Jafri N and Salgia R: A
review of topoisomerase inhibition in lung cancer. Cancer Biol
Ther. 5:1600–1607. 2006. View Article : Google Scholar
|
|
60
|
Bush NG, Evans-Roberts K and Maxwell A:
DNA topoisomerases. Ecosal Plus. 6:62015. View Article : Google Scholar
|
|
61
|
Hou GX, Liu P, Yang J and Wen S: Mining
expression and prognosis of topoisomerase isoforms in
non-small-cell lung cancer by using Oncomine and Kaplan-Meier
plotter. PLoS One. 12:pp. e01745152017, View Article : Google Scholar : PubMed/NCBI
|
|
62
|
Capranico G, Marinello J and Chillemi G:
Type I DNA topoisomerases. J Med Chem. 60:2169–2192. 2017.
View Article : Google Scholar : PubMed/NCBI
|
|
63
|
Chen T, Sun Y, Ji P, Kopetz S and Zhang W:
Topoisomerase IIα in chromosome instability and personalized cancer
therapy. Oncogene. 34:4019–4031. 2015. View Article : Google Scholar
|
|
64
|
Ang C, Miura JT, Gamblin TC, He R, Xiu J,
Millis SZ, Gatalica Z, Reddy SK, Yee NS and Abou-Alfa GK:
Comprehensive multi- platform biomarker analysis of 350
hepatocellular carcinomas identifies potential novel therapeutic
options. J Surg Oncol. 113:55–61. 2016. View Article : Google Scholar
|
|
65
|
Wong N, Yeo W, Wong WL, Wong NL, Chan KY,
Mo FK, Koh J, Chan SL, Chan AT, Lai PB, et al: TOP2A overexpression
in hepatocellular carcinoma correlates with early age onset,
shorter patients survival and chemoresistance. Int J Cancer.
124:644–652. 2009. View Article : Google Scholar
|
|
66
|
Panvichian R, Tantiwetrueangdet A,
Angkathunyakul N and Leelaudomlipi S: TOP2A amplification and
overexpression in hepatocellular carcinoma tissues. BioMed Res Int.
2015.381602:2015.
|
|
67
|
Isaacs RJ, Davies SL, Sandri MI, Redwood
C, Wells NJ and Hickson ID: Physiological regulation of eukaryotic
topoisomerase II. Biochim Biophys Acta. 1400:121–137. 1998.
View Article : Google Scholar : PubMed/NCBI
|
|
68
|
Srikantan S, Abdelmohsen K, Lee EK,
Tominaga K, Subaran SS, Kuwano Y, Kulshrestha R, Panchakshari R,
Kim HH, Yang X, et al: Translational control of TOP2A influences
doxorubicin efficacy. Mol Cell Biol. 31:3790–3801. 2011. View Article : Google Scholar : PubMed/NCBI
|
|
69
|
Calderwood SK: A critical role for
topoisomerase IIb and DNA double strand breaks in transcription.
Transcription. 7:75–83. 2016. View Article : Google Scholar : PubMed/NCBI
|
|
70
|
Szafran M, Skut P, Ditkowski B, Ginda K,
Chandra G, Zakrzewska-Czerwińska J, Jakimowicz D and Topoisomerase
I: Topoisomerase I (TopA) is recruited to ParB complexes and is
required for proper chromosome organization during Streptomyces
coelicolor sporulation. J Bacteriol. 195:4445–4455. 2013.
View Article : Google Scholar : PubMed/NCBI
|
|
71
|
Li TK and Liu LF: Tumor cell death induced
by topoisomerase- targeting drugs. Annu Rev Pharmacol Toxicol.
41:53–77. 2001. View Article : Google Scholar
|
|
72
|
Hande KR: Clinical applications of
anticancer drugs targeted to topoisomerase II. Biochim Biophys
Acta. 1400:173–184. 1998. View Article : Google Scholar : PubMed/NCBI
|
|
73
|
Cort A and Ozben T: Natural product
modulators to overcome multidrug resistance in cancer. Nutr Cancer.
67:411–423. 2015. View Article : Google Scholar : PubMed/NCBI
|
|
74
|
Rodrigues T, Sieglitz F and Bernardes GJ:
Natural product modulators of transient receptor potential (TRP)
channels as potential anti-cancer agents. Chem Soc Rev.
45:6130–6137. 2016. View Article : Google Scholar : PubMed/NCBI
|