Introduction
Liver cancer is considered the sixth most prevalent
tumor type worldwide (1).
Hepatocellular carcinoma (HCC) accounts for nearly all (70-85%)
primary liver cancers (2). Many
factors, including hepatitis B or C virus (HBV) infection, type 2
diabetes, alcohol intake and metabolic syndrome are risk factors
for the development of HCC (3).
Presently, therapeutic remedies for HCC treatment tend to rely on
the Barcelona Clinic Liver Cancer (BCLC) staging system (4), and include surgical resection,
locoregional and systemic approaches (2). Surgical approaches consist of liver
resection and transplantation for early stage HCC and the
application of these procedures is dependent on the cirrhosis,
tumor extension and co-morbidities in patients (2). Locoregional therapies used in
intermediate-stage HCC consist of surgery, ablation and different
types of transcatheter arterial chemo-embolization (5,6).
Even with these treatments, patients still have an unsatisfactory
prognosis, with a 5-year survival rate <10%, which makes liver
cancer the second leading cause of cancer-related death worldwide
(7). In addition, tumor recurrence
was observed in ~70% of the cases within the first 5 years after
tumor resection (5).
HCC is phenotypically and genetically heterogeneous
(2). Other than the many important
mutations in the telomerase promoter (8,9),
tumor suppressor gene TP53 (10),
Catenin β-1, AT-rich interaction domain 1 and axin 1, HCC
pathogenesis is often characterized disruption in a series of
signaling networks (2). The Janus
kinase (JAK)-signal transducer and activator of transcription
(STAT) signaling pathway is activated by over 40 cytokines and
growth factors, and is associated with cell proliferation,
differentiation and apoptosis (11,12).
In the signaling pathway, cytokines induce phosphorylation of
JAK1-3 and tyrosine kinase 2 (TYK2), followed by the activation of
STAT1-6 (11,12). Furthermore, nuclear localization of
STATs causes the activation of target genes among three families of
inhibitory proteins: Protein inhibitors of activated STATs, the
SH2-containg phosphatases and suppressors of cytokine signaling
(13-15). JAK1 was also previously identified
as a novel therapeutic target in patients with inflammatory HCC in
the gp130 mutant population (16).
Meanwhile, B7-H3 was reported to promote aggression and invasion of
HCC by regulating epithelial-mesenchymal transition via
JAK2/STAT3/Slug signaling (17).
Calvisi et al (18)
demonstrated that high expression of STAT3 was a marker of poor
prognosis for HCC patients. Additionally, angiotension II induces
angiogenic factors production partly via an angiotensin II type
1/JAK2/STAT3/suppressors of cytokine signaling 3 (SOCS3) signaling
pathway in MHCC97-H cells (18).
He and Karin (19) suggested that
STAT6 was involved in HCC and may be a poor predictor for HCC
prognosis. Nuclear localization of STATs can lead to the activation
of STAT target genes, such as the SOCS proteins (14). Inactivation of SOCS1 has been
identified in many malignancies, including HCC (19).
At the same time, some members of JAK/STAT signaling
pathway have been reported to be associated with HCC, while other
factors are not. The current study investigated the clinical
significance of mRNA expression of JAK/STAT signaling pathway for
HCC diagnosis and prognosis.
Materials and methods
Ethical approval
This study was approved by the Ethical Review
Committee of the First Affiliated Hospital of Guangxi Medical
University [approval no. 2015 (KY-E-032)]. Informed consent was
provided by all HCC patients.
HCC tissue collection and revers
transcription-quantitative PCR (RT-qPCR)
A total of 21 HCC tissues and non-tumor tissues
(>1 cm margin from tumor) of patients with HBV infection were
collected between the December 2015 and July 2016 (The First
Affiliated Hospital of Guangxi Medical University). Inclusion
criteria were as follows: All the patients were determined to have
HCC via pathological diagnosis. Exclusion criteria: Patients of age
<20 and >70 years. HCC and non-tumor tissues were cut into
pieces and stored in RNAstore Reagent (DP408; Tiangen Biotech Co.,
Ltd.) at 4°C overnight and transferred to −80°C for long-term
storage. Total RNA was extracted from above tissues and reversed
into cDNA (Takara Bio, Inc.). Primers for GAPDH,
JAK2, STAT5A and STAT6 were synthesized by
Sangon Biotech Co., Ltd. with the following sequences (5'-3'):
GAPDH, forward GTC AGC CGC ATC TTC TTT, reverse CGC CCA ATA
CGA CCA AAT; JAK2, forward AGC CTA TCG GCA TGG AAT ATC T,
reverse TAA CAC TGC CAT CCC AAG ACA; STAT5A, forward GCA GAG
TCC GTG ACA GAG G, reverse CCA CAG GTA GGG ACA GAG TCT;
STAT6, forward GTT CCG CCA CTT GCC AAT G, reverse TGG ATC
TCC CCT ACT CGG TG. DEPC-treated water was purchased from Sangon
Biotech Co., Ltd. FastStart Universal SYBR Green Master (ROX) was
used for RT-qPCR (Roche Diagnostics). The conditions were as
follows: 50°C for 2 min, 95°C for 10 min, 95°C for 15 sec, 60°C for
1 min (40 cycles), 95°C for 15 sec, 60°C for 1 min, 95°C for 30
sec, 60°C for 15 sec. The 2-∆∆Cq method was used to
calculate the relative expression of mRNAs (20).
Data source
Data from a total of 212 HCC patients with HBV
infection were accessed from the GSE14520 dataset in the Gene
Expression Omnibus database s a training cohort (platform GPL3921;
ncbi.nlm.nih.gov/geo/query/acc.cgi?acc=GSE14520;
accessed Sept 3rd, 2018) (22,22).
Additionally, data from 370 HCC patients were accessed from the
Cancer Genome Atlas (TCGA) database as a validation cohort
(https://cancergenome.nih.gov/; accessed
Sept 3rd, 2018).
Body map and protein expressions
In addition, expressions of genes in JAK/STAT
pathway were collected from Gene Expression Profiling Interactive
Analysis website (gepia.cancer-pku.cn/index.html; accessed Sept 8th,
2018), while the protein expressions were obtained from the Human
Protein Atlas website (proteinatlas.org/; accessed Sept 8th, 2018) (23).
Diagnosis, prognosis and joint-effect
analysis
Diagnostic receiver operating characteristic (ROC)
curves were constructed by use of mRNA expressions of tumor and
non-tumor tissue samples (GraphPad version 7.0; GraphPad Software,
Inc.). The mRNA expressions of tumor tissues were categorized into
low and high expressions using the median expression level as the
cut-off. Meanwhile, the overall survival was calculated using
Kaplan-Meier and Cox proportional hazards regression model (SPSS
version 16.0; SPSS, Inc.). Prognosis-related clinical factors,
including tumor grade, tumor size, α-fetoprotein (AFP), cirrhosis,
BCLC stage and radical resection, in two cohorts were adjusted for
using the multivariate Cox proportional hazards regression model.
Prognosis-related genes were combined for joint-effect
analysis.
Gene set enrichment analysis (GSEA)
Potential mechanisms, including biological processes
and metabolic pathways of JAK/STAT pathway genes, were explored
using GSEA (gsea2-2.2.4; software.broadinstitute.org/gsea/index.jsp).
Datasets c2.cp.kegg.v6.1.symbols.gmt, c5.bp.b6.1.symbols. gmt,
c5.cc.v6.1.symbols.gmt and c5.mf.v6.1.symbols.gmt were then
analyzed to obtain statistically significant Gene Ontology (GO)
terms, including biological process (BP), cellular component (CC)
and molecular function (MF), and Kyoto Encyclopedia of Genes and
Genomes (KEGG) pathways (24,25).
Risk score model and nomogram
construction
For further examination of prognosis-related genes
for HCC survival, risk score models were constructed for prognosis
prediction. In addition, risk scores, patient survival status,
expression heatmap and prognostic ROC curves were constructed in
the model. The formula of the model is as follows: Risk score =
expression of gene1 × β1 of gene1
+ expression of gene2 × β2 of
gene2 +… + expression of genen ×
βn of genen (26-28).
Contribution coefficients (β) originated from the
multivariate Cox proportional hazards regression model. Nomograms
were generated using clinical factors and genes for predicting
patient survival probability at 1, 3 and 5 years.
Interaction analysis
Pearson correlation matrixes among JAK/STAT pathway
genes were constructed using R version 3.5.0 (r-project.org/). An interactive gene-gene
co-expression network was then constructed using the geneMANIA
Cytoscape plugin (version 3.5.1) and the GO enrichment analysis was
visualized using the BiNGO plugin of Cytoscape software version
3.6.0 (29-31). A protein-protein interaction (PPI)
network was constructed using STRING (https://string-db.org/cgi/input.pl; accessed Sept
20th, 2018) (32).
Statistical analysis
Kaplan-Meier and box plots were produced using
GraphPad software version 7.0 (GraphPad Software, Inc.). Survival
analysis was performed by using SPSS software version 16.0 (SPSS,
Inc.). The median survival time and Log-rank P-values were
calculated using the Kaplan-Meier method; 95% confidence interval
(CI) and hazard ratio (HR) were calculated by univariate and
multivariate Cox proportional hazards regression model. P≤0.05 was
considered to indicate a statistically significant difference.
Results
Demographic characteristics of GSE14520
and TCGA cohorts
In this study, a total of 212 HBV-related HCC
patients were enrolled in training cohort, whereas 370 HCC patients
were enrolled in the validation cohort. Tumor size, AFP, cirrhosis
status and BCLC stage were associated with overall survival (OS;
all P≤0.05; Table SI) in the
GSE14520 cohort. Additionally, HBV infection, tumor stage and
radical resection were associated with overall survival (all
P≤0.05; Table SII) in the TCGA
cohort.
mRNA, protein and BodyMap expression
analysis
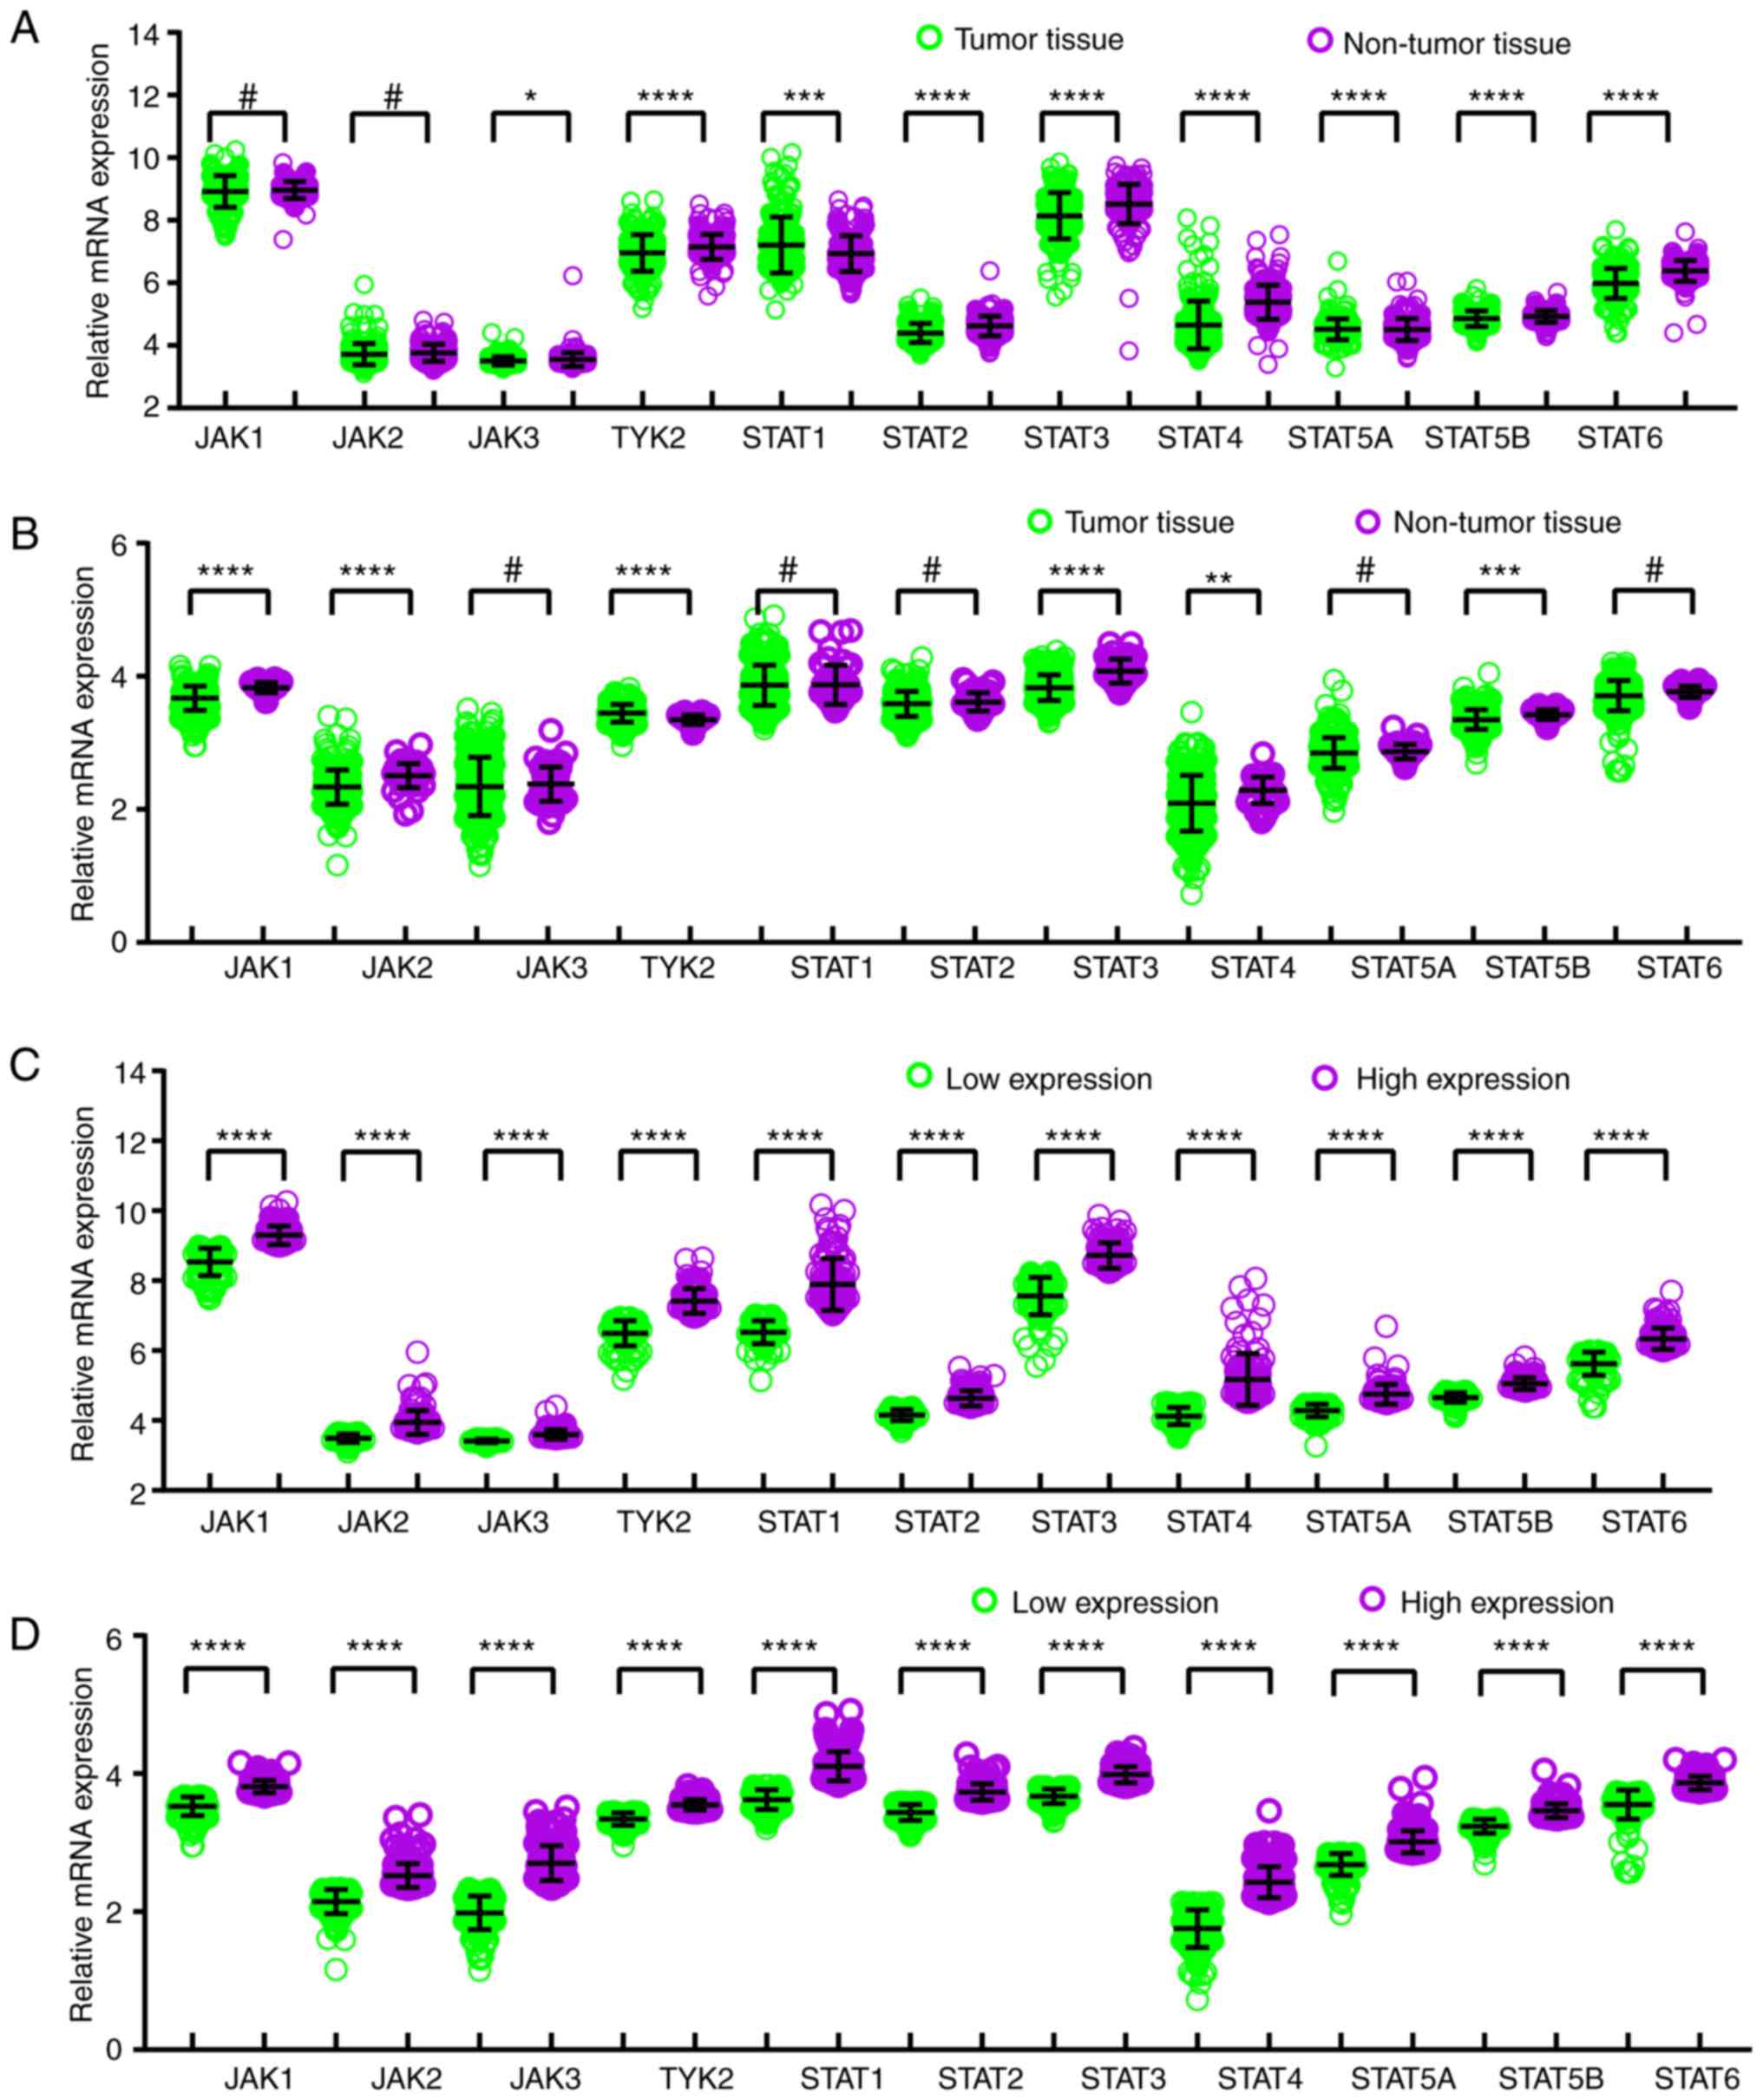
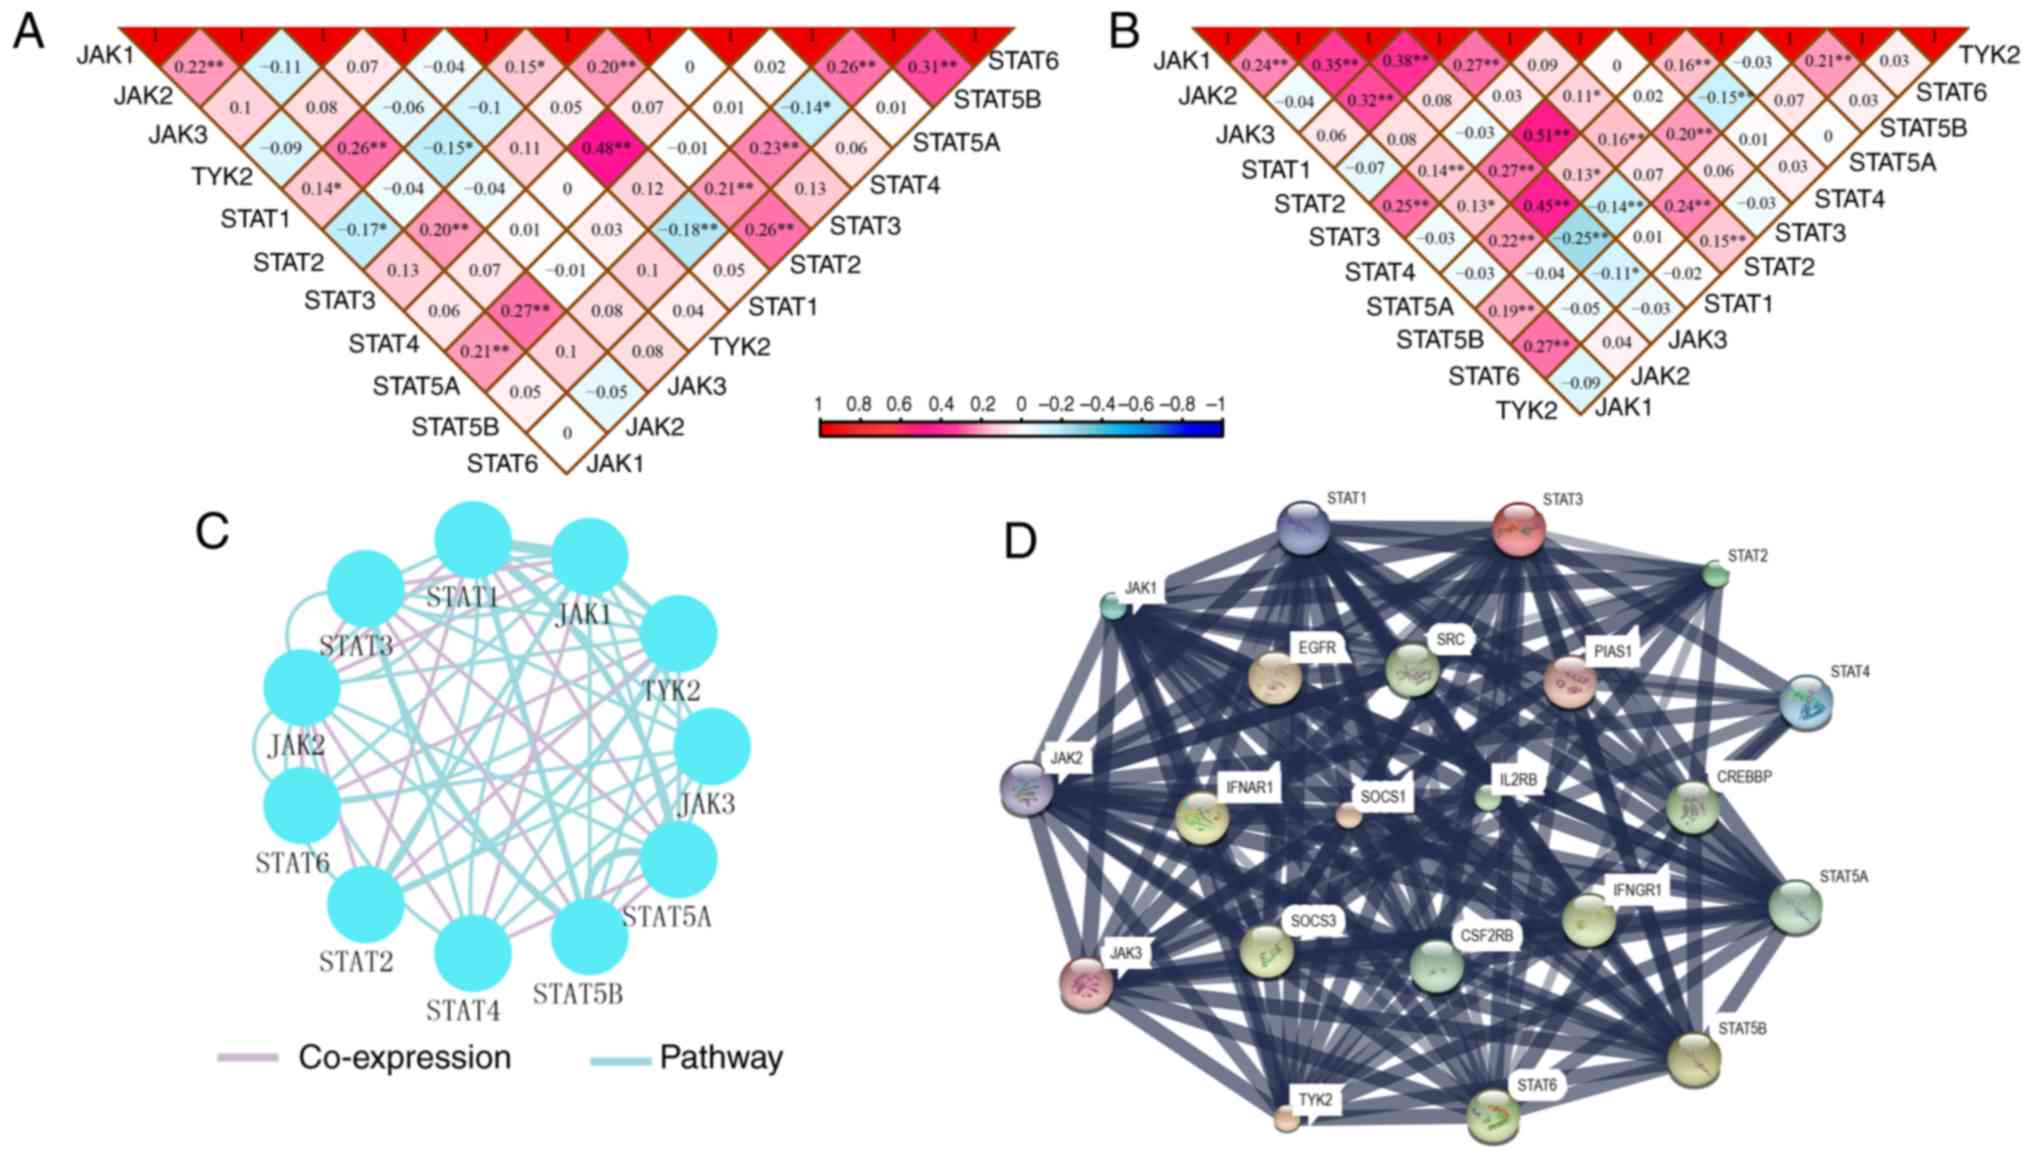
In comparison between tumor and normal tissues,
JAK3, TYK2, STAT1, STAT2, STAT3, STAT4, STAT5A, STAT5B and STAT6
genes exhibited differentially expressed levels in the GSE14520
cohort (all P≤0.05; Fig. 1A), and
JAK1, JAK2, TYK2, STAT3, STAT4 and STAT5B demonstrated
differentially expressed levels in the TCGA cohort (all P≤0.05;
Fig. 1B). Meanwhile, in the
comparison between low and high expression groups, all the genes
showed differently expressed levels in both GSE14520 and TCGA
cohorts (all P≤0.05; Fig. 1C and
D). BodyMap expression of JAK/STAT pathway genes in tumor and
normal tissues is illustrated in Fig.
S1. Protein expression data from the Human Protein Atlas
confirmed that STAT3 is the highest expressed of the JAK/STAT
pathway proteins in HCC (Fig.
S2).
Diagnosis and prognosis analysis
In the diagnostic analysis of the GSE14520 cohort
(Fig. 2), JAK2, JAK3, TYK2, STAT1,
STAT2, STAT3, STAT4, STAT5B and STAT6 genes all indicated
diagnostic significance for HCC [Fig.
2B-H, J-K; P≤0.05; area under curve (AUC) >0.5]. Others did
not show any diagnostic significance (Fig. 2A and I). Of them, STAT2, STAT4 and
STAT6 genes showed higher diagnostic ability (AUC >0.7). Their
combination also illustrated a higher diagnosis ability compared
with using just one gene (Fig.
2L-O). In the diagnostic analysis of TCGA cohort (Fig. 3), JAK1, JAK2, TYK2, STAT3, STAT4
and STAT5B indicated diagnostic significance for HCC (Fig. 3A, B, D, G, H and J; P≤0.05; AUC
>0.5). Others did not show any diagnostic significance (Fig. 3C, E, F, I and K). Of them all,
JAK1, JAK2, TYK2 and STAT3 displayed higher diagnosis ability (AUC
>0.7). A combination of all genes demonstrated higher diagnosis
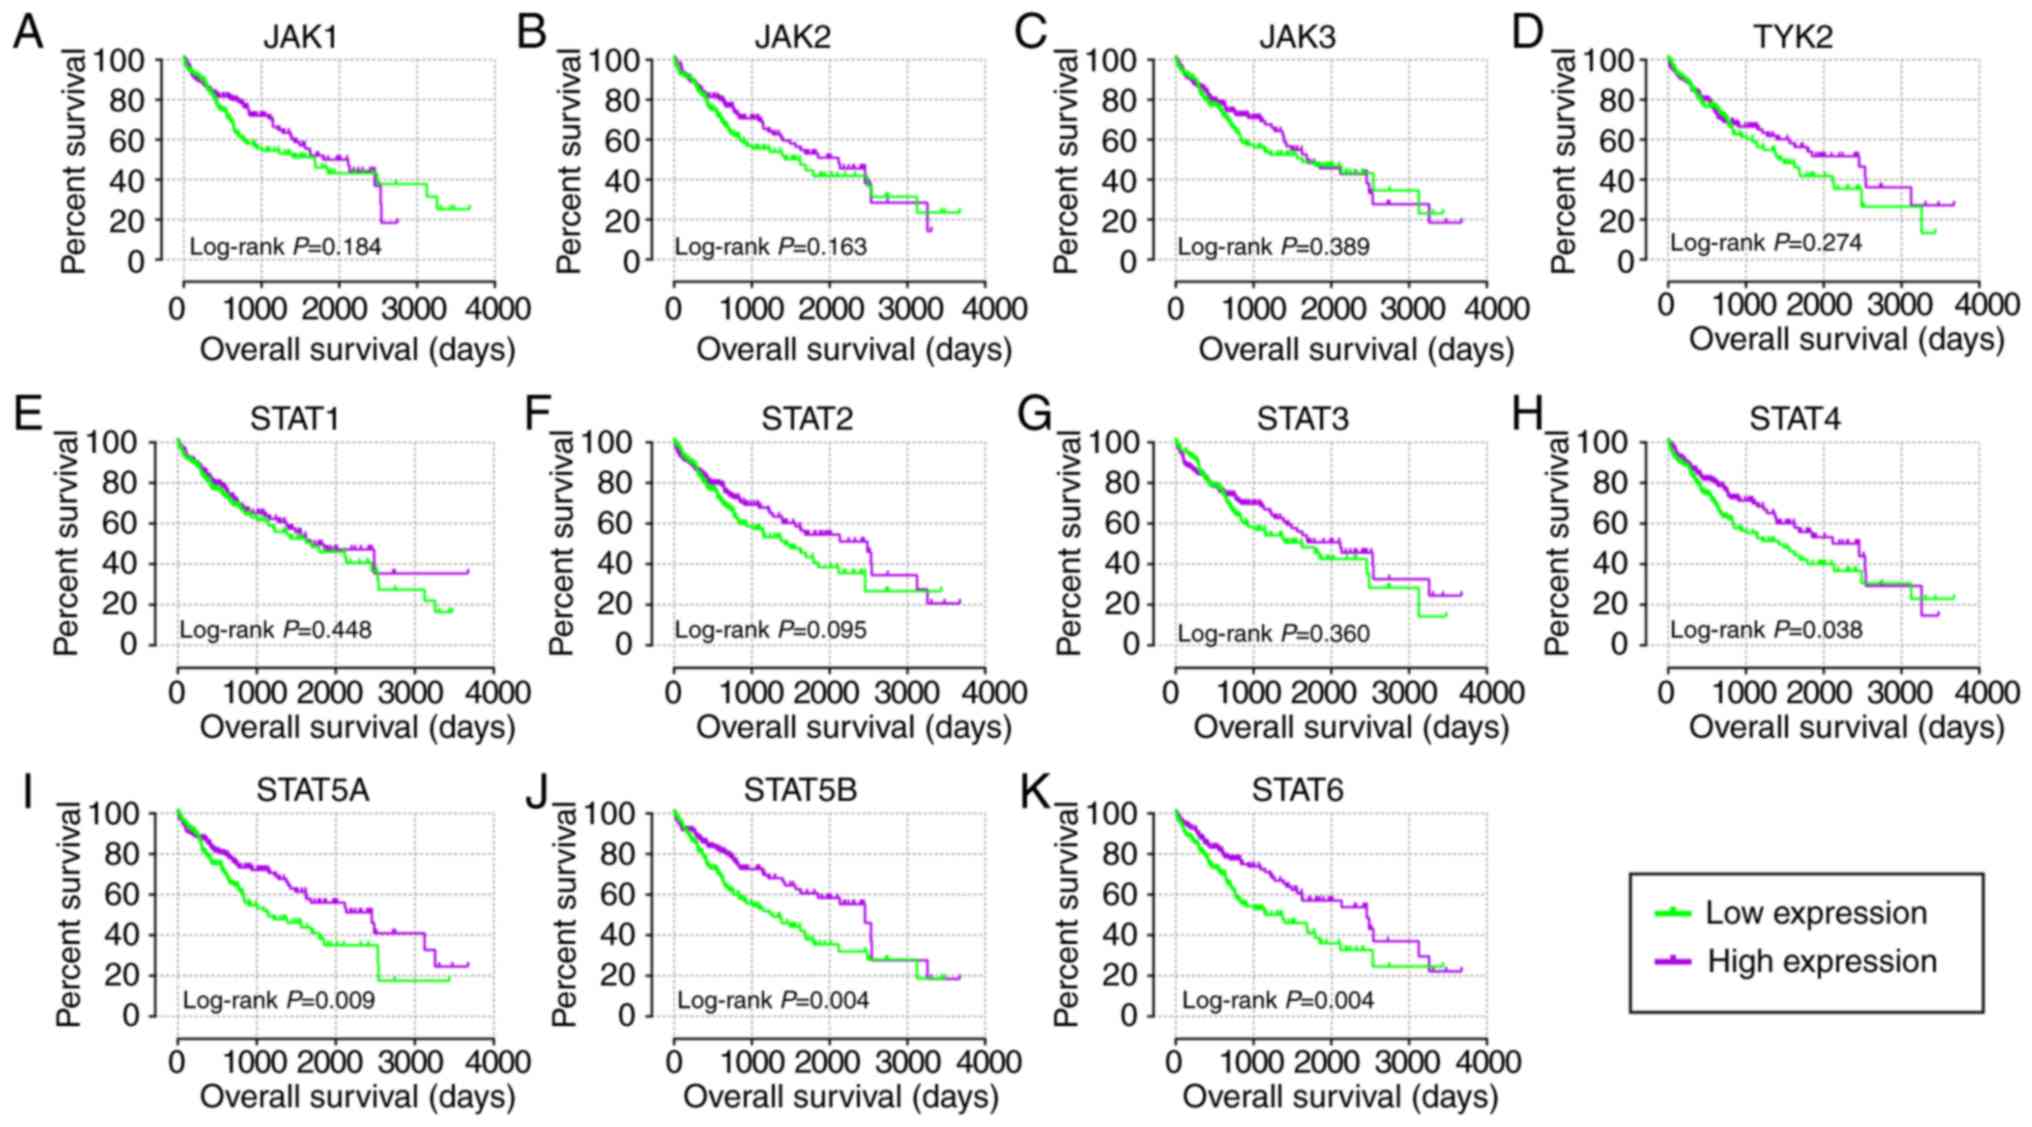
abilities as compared with just one gene (Fig. 3L-V). In the prognosis analysis of
the GSE14520 cohort (Fig. 4),
univariate analysis indicated that JAK2, STAT1, STAT5A, STAT5B and
STAT6 were associated with OS (all adjusted P≤0.05; Table I; Fig.
4B, E and I-K). Others did not show any prognostic significance
(Fig. 4A, C, D and F-H).
Meanwhile, JAK2, STAT1, STAT3, STAT5A and STAT6 expressions were
associated with OS after adjustment for tumor size, cirrhosis, AFP
and BCLC stage (all adjusted P≤0.05; Table I). In the prognosis analysis of
TCGA cohort, univariate analysis showed that STAT4, STAT5A, STAT5B
and STAT6 were all associated with OS (all adjusted P≤0.05;
Table II; Fig. 5H-K). Others did not show any
prognostic significance (Fig.
5A-G). Meanwhile, JAK1, JAK2, STAT5A, STAT5B and STAT6
expressions were associated with OS after adjustment for radical
resection, tumor stage and HBV infection (all adjusted P≤0.05;
Table II).
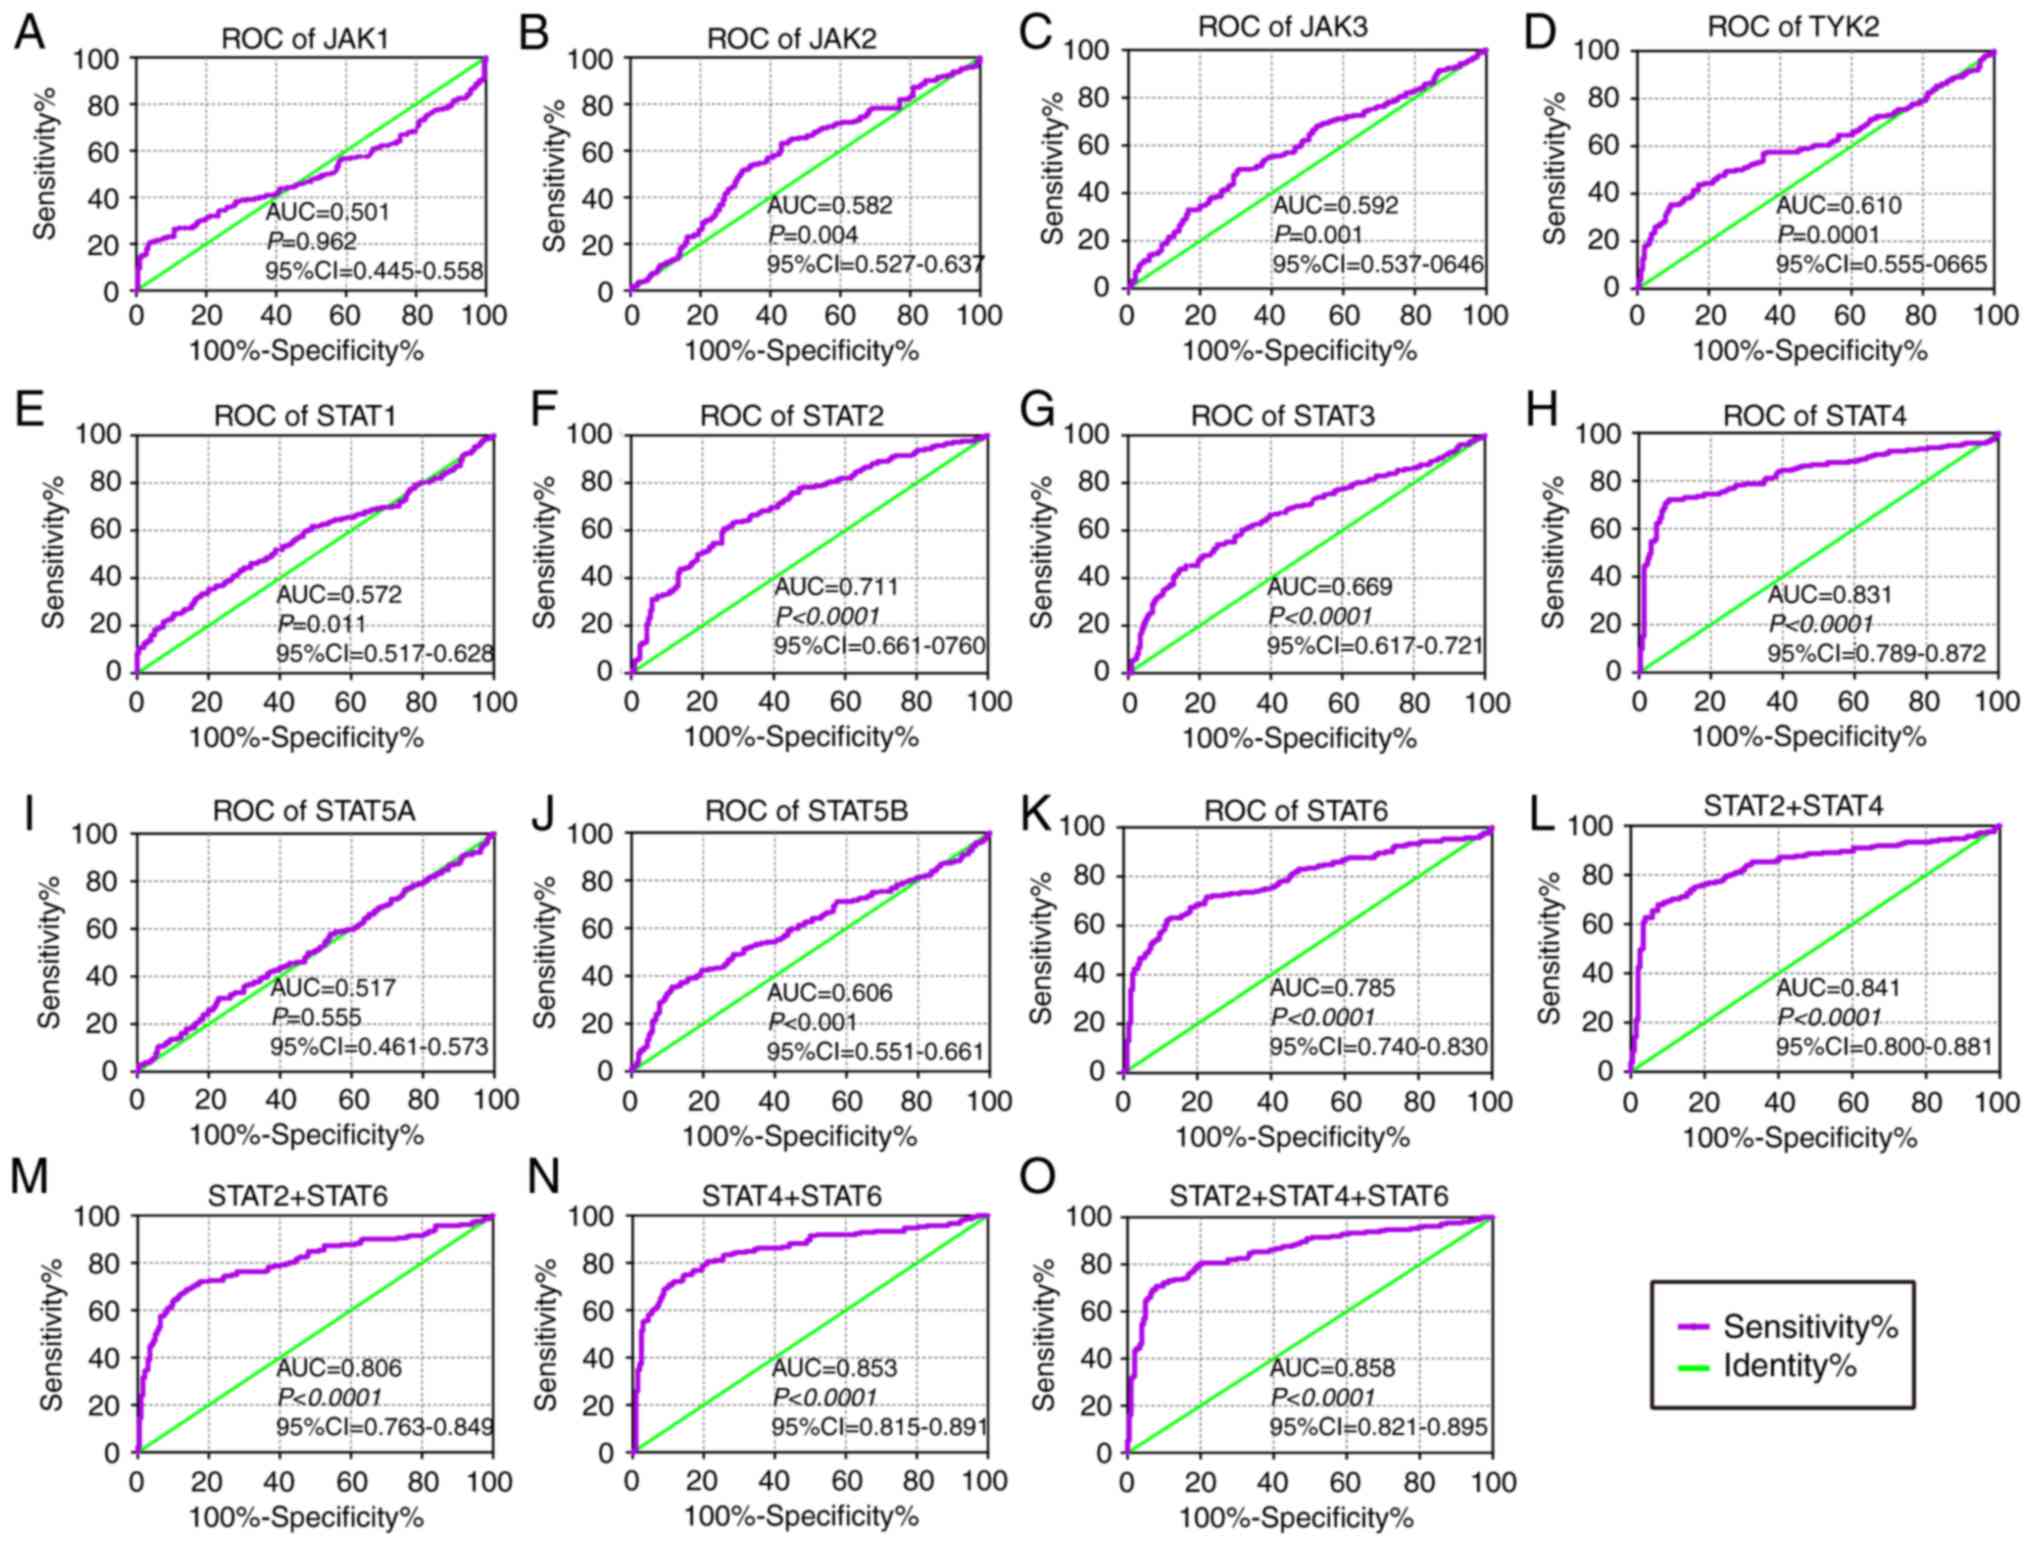 | Figure 2Diagnostic ROC curves of key genes of
JAK/STAT pathway using the GSE14520 dataset. ROC curves of JAK/STAT
pathway members: (A) JAK1, (B) JAK2, (C) JAK3, (D) TYK2, (E) STAT1,
(F) STAT2, (G) STAT3, (H) STAT4, (I) STAT5A, (J) STAT5B and (K)
STAT6. ROC curves of combinations: (L) STAT2 + 4, (M) STAT2 + 6,
(N) STAT4 + 6 and (O) STAT2 + 4 + 6, respectively. ROC, receiver
operating characteristic; AUC, area under the curve; CI, confidence
interval; JAK, Janus kinase; TYK2, tyrosine kinase 2; STAT, signal
transducer and activator of transcription. |
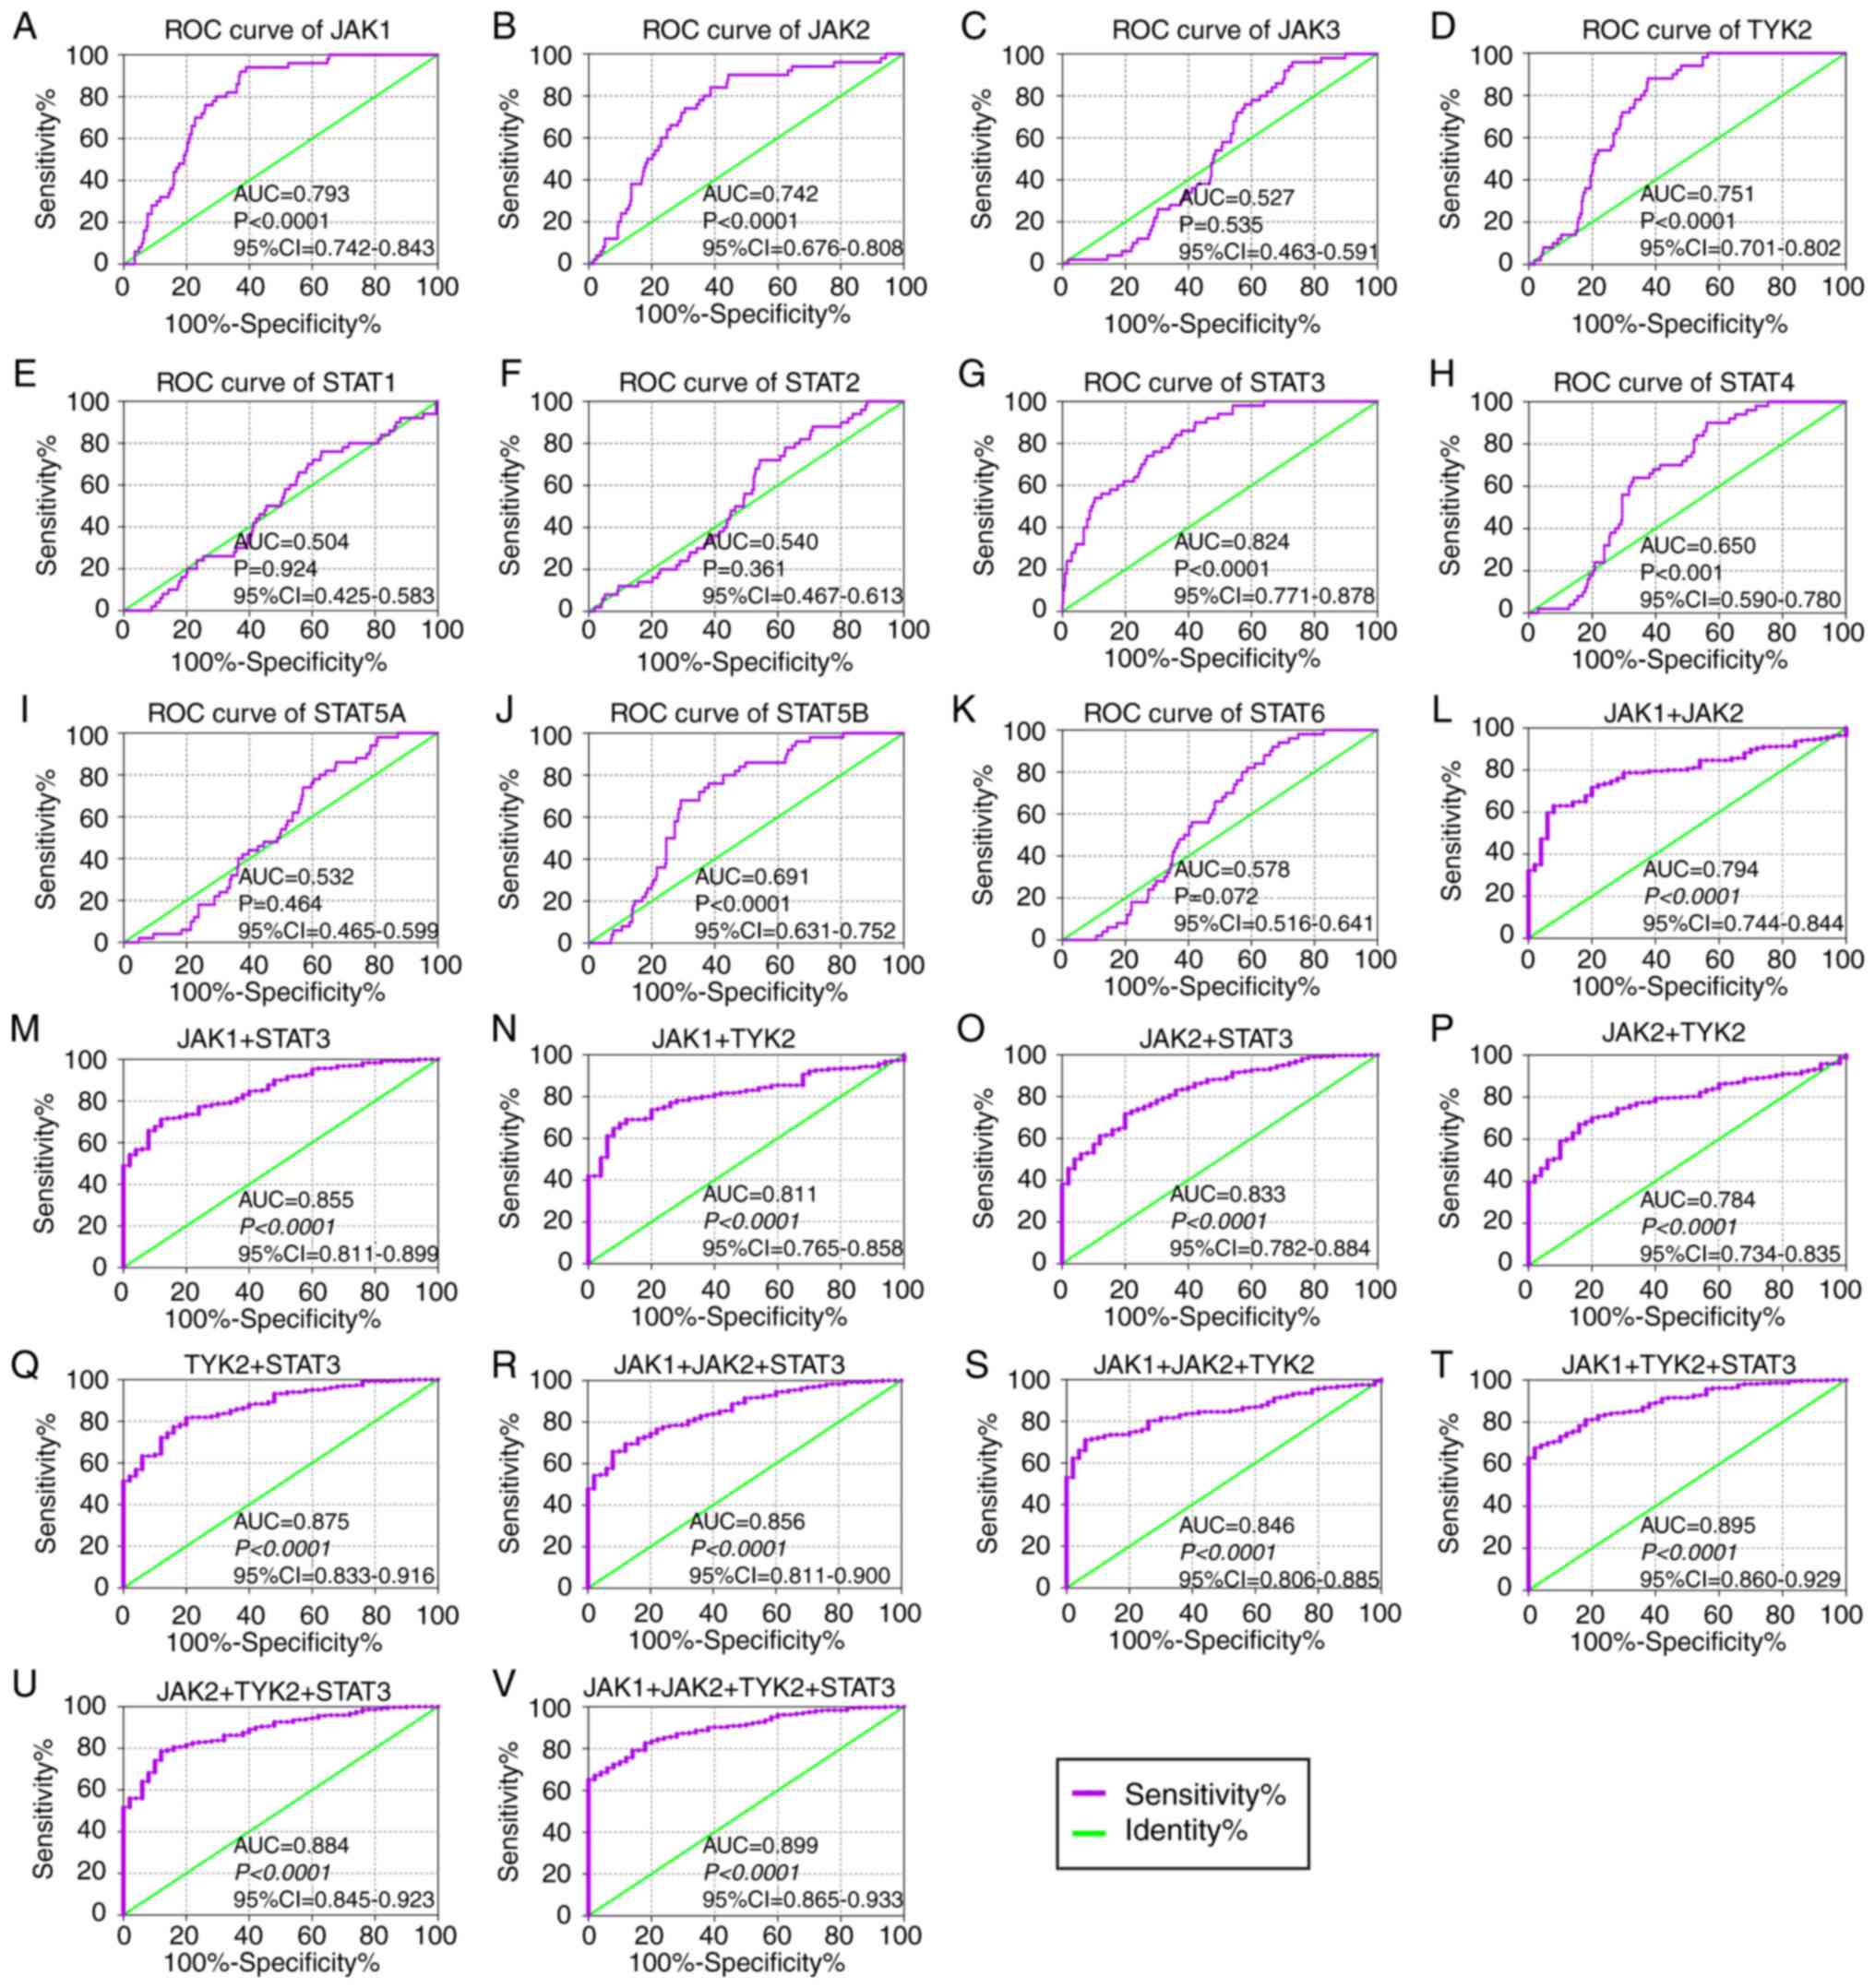 | Figure 3Diagnostic ROC curves of key genes of
JAK/STAT pathway using data from The Cancer Genome Atlas. ROC
curves of JAK/STAT pathway members: (A) JAK1, (B) JAK2, (C) JAK3,
(D) TYK2, (E) STAT1, (F) STAT2, (G) STAT3, (H) STAT4, (I) STAT5A,
(J) STAT5B and (K) STAT6. ROC curves of combination of (L) JAK1 +
2, (M) JAK1 + STAT3, (N) JAK1 + TYK2, (O) JAK2 + STAT3, (P) JAK2 +
TYK2, (Q) STAT3 + TYK2, (R) JAK1 + 2 + STAT3, (S) JAK1 + 2 + TYK2,
(T) JAK1 + STAT3 + TYK2, (U) JAK2 + STAT3 + TYK2 and (V) JAK1 + 2 +
STAT3 + TYK2. ROC, receiver operating characteristic; AUC, area
under the curve; CI, confidence interval; JAK, Janus kinase; TYK2,
tyrosine kinase 2; STAT, signal transducer and activator of
transcription. |
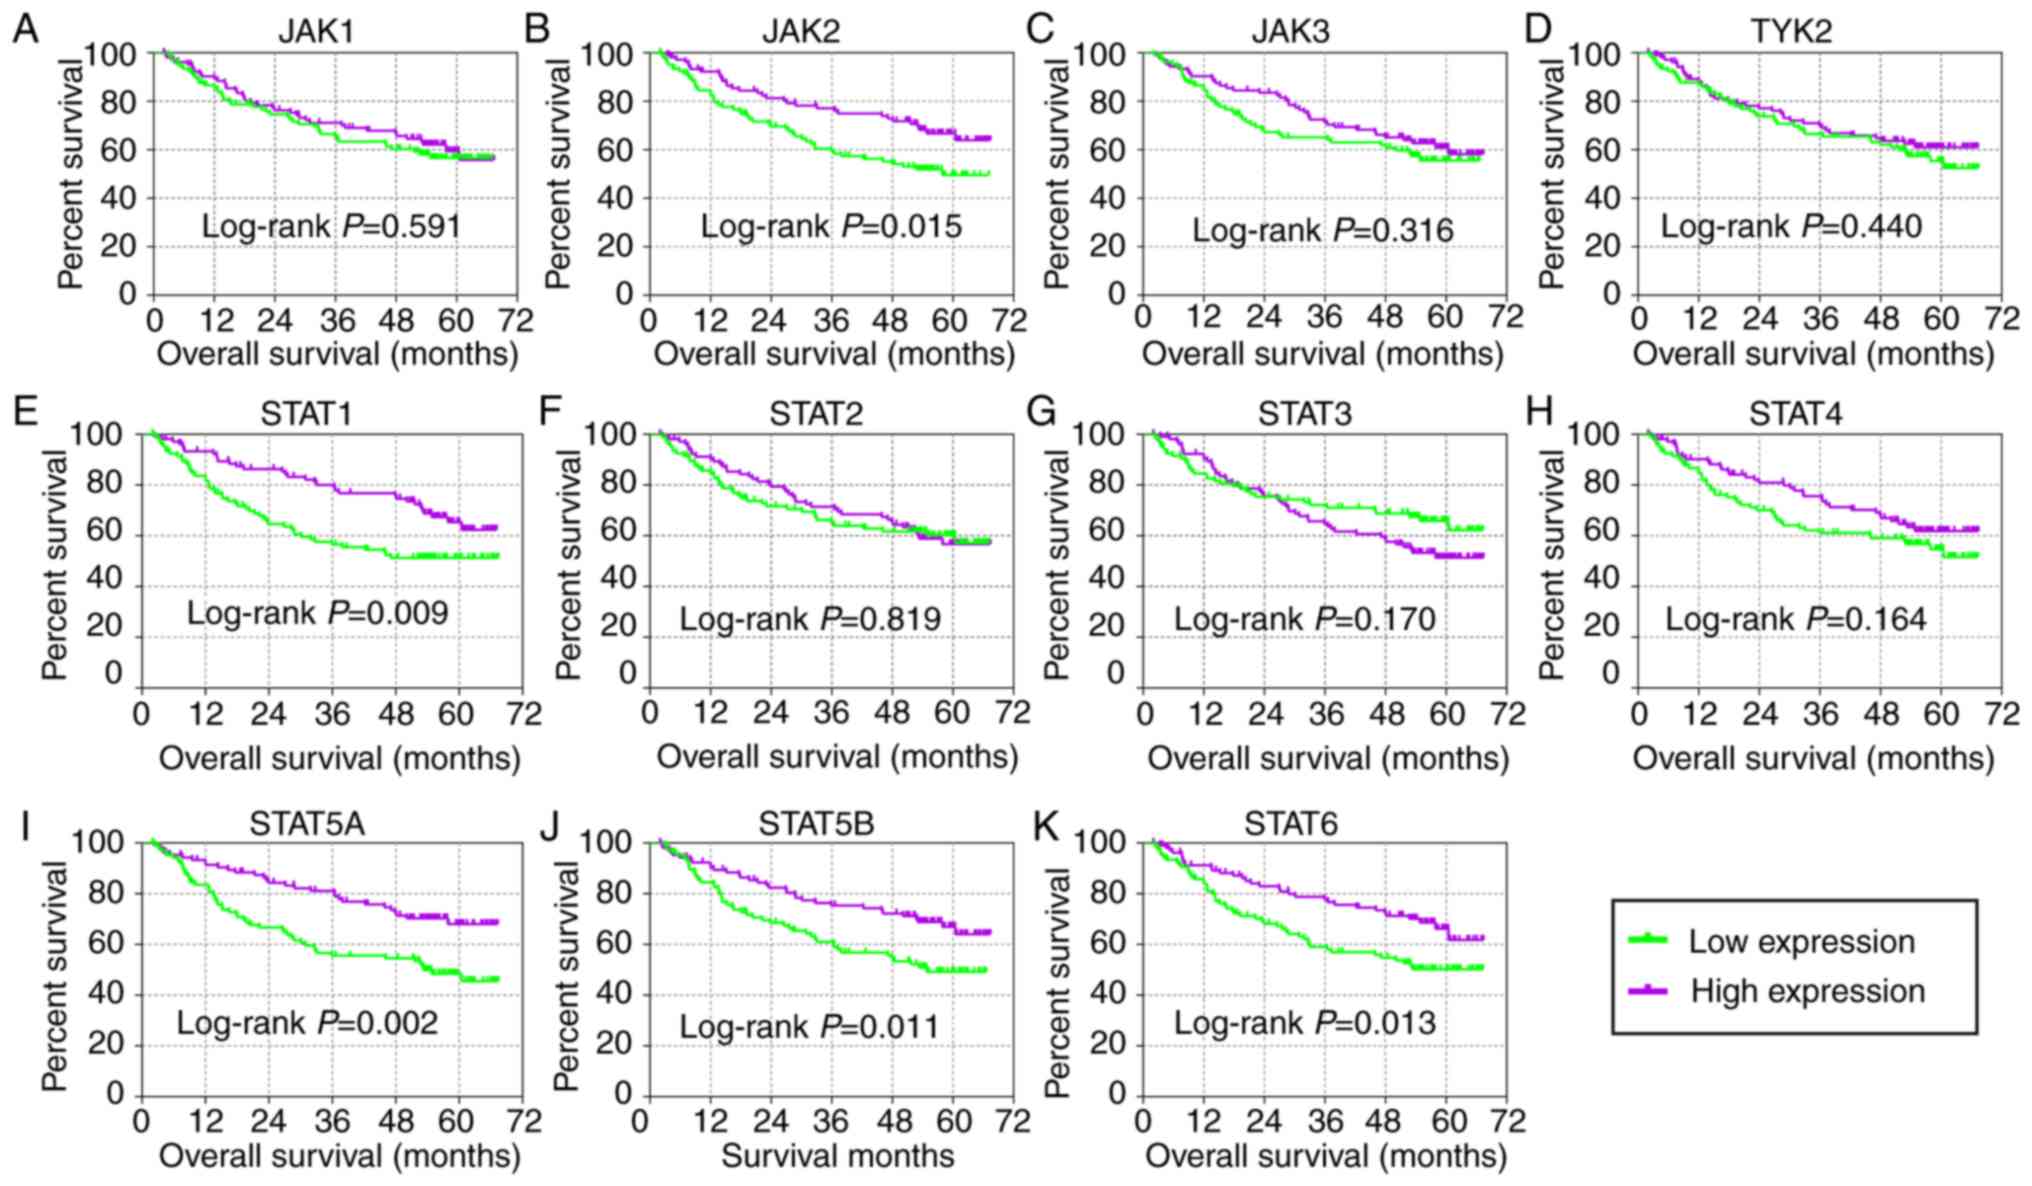 | Figure 4Kaplan-Meier plots of key genes of
JAK/STAT pathway in the GSE14520 cohort. (A) JAK1, (B) JAK2, (C)
JAK3, (D) TYK2, (E) STAT1, (F) STAT2, (G) STAT3, (H) STAT4, (I)
STAT5A, (J) STAT5B and (K) STAT6. JAK, Janus kinase; TYK2, tyrosine
kinase 2; STAT, signal transducer and activator of
transcription. |
 | Figure 5Kaplan-Meier plots of key genes of
JAK/STAT pathway in The Cancer Genome Atlas cohort. (A) JAK1, (B)
JAK2, (C) JAK3, (D) TYK2, (E) STAT1, (F) STAT2, (G) STAT3, (H)
STAT4, (I) STAT5A, (J) STAT5B and (K) STAT6. JAK, Janus kinase;
TYK2, tyrosine kinase 2; STAT, signal transducer and activator of
transcription. |
 | Table IPrognostic analysis of genes in
JAK/STAT signaling pathway for overall survival in GSE14520
dataset. |
Table I
Prognostic analysis of genes in
JAK/STAT signaling pathway for overall survival in GSE14520
dataset.
| Gene | No. of patients
(n=212) | Overall survival
|
|---|
| No. of events | MST (month) | HR (95% CI) | Crude P-value | HR (95%CI) | Adjusted
P-valuea |
|---|
| JAK1 | | | | | | | |
| Low
expression | 106 | 43 | NA | Ref. | | Ref. | |
| High
expression | 106 | 39 | NA | 0.888
(0.576-1.370) | 0.591 | 0.913
(0.588-1.419) | 0.687 |
| JAK2 | | | | | | | |
| Low
expression | 106 | 49 | 57.9 | Ref. | | Ref. | |
| High
expression | 106 | 33 | NA | 0.578
(0.372-0.900) | 0.015b | 0.585
(0.370-0.925) | 0.022b |
| JAK3 | | | | | | | |
| Low
expression | 106 | 43 | NA | Ref. | | Ref. | |
| High
expression | 106 | 39 | NA | 0.801
(0.519-1.236) | 0.316 | 1.019
(0.651-1.595) | 0.934 |
| TYK2 | | | | | | | |
| Low
expression | 106 | 44 | NA | Ref. | | Ref. | |
| High
expression | 106 | 38 | NA | 0.843
(0.546-1.301) | 0.440 | 0.831
(0.535-1.290) | 0.409 |
| STAT1 | | | | | | | |
| Low
expression | 106 | 49 | NA | Ref. | | Ref. | |
| High
expression | 106 | 33 | NA | 0.555
(0.357-0.863) | 0.009b | 0.617
(0.394-0.966) | 0.035b |
| STAT2 | | | | | | | |
| Low
expression | 106 | 40 | NA | Ref. | | Ref. | |
| High
expression | 106 | 42 | NA | 0.951
(0.616-1.467) | 0.819 | 1.184
(0.749-1.873) | 0.469 |
| STAT3 | | | | | | | |
| Low
expression | 106 | 34 | NA | Ref. | | Ref. | |
| High
expression | 106 | 48 | NA | 1.360
(0.877-2.111) | 0.170 | 1.650
(1.065-2.576) | 0.028b |
| STAT4 | | | | | | | |
| Low
expression | 106 | 46 | NA | Ref. | | Ref. | |
| High
expression | 106 | 36 | NA | 0.734
(0.474-1.135) | 0.164 | 0.683
(0.440-1.060) | 0.089 |
| STAT5A | | | | | | | |
| Low
expression | 106 | 52 | 53.3 | Ref. | | Ref. | |
| High
expression | 106 | 30 | NA | 0.487
(0.311-0.764) | 0.002b | 0.498
(0.313-0.791) | 0.003b |
| STAT5B | | | | | | | |
| Low
expression | 106 | 49 | 54.8 | Ref. | | Ref. | |
| High
expression | 106 | 33 | NA | 0.563
(0.361-0.876) | 0.011b | 0.696
(0.441-1.098) | 0.119 |
| STAT6 | | | | | | | |
| Low
expression | 106 | 50 | NA | Ref. | | Ref. | |
| High
expression | 106 | 32 | NA | 0.569
(0.365-0.887) | 0.013b | 0.529
(0.337-0.831) | 0.006b |
| Table IIPrognostic analysis of genes in
JAK/STAT signaling pathway for overall survival in The Cancer
Genome Atlas database. |
Table II
Prognostic analysis of genes in
JAK/STAT signaling pathway for overall survival in The Cancer
Genome Atlas database.
| Gene | Patients
(n=370) | Overall survival
|
|---|
| No. of event | MST (days) | HR (95% CI) | Crude P-value | HR (95% CI) | Adjusted
P-valuea |
|---|
| JAK1 | | | | | | | |
| Low
expression | 185 | 70 | 1,685 | Ref. | | Ref. | |
| High
expression | 185 | 60 | 2,116 | 0.790
(0.557-1.119) | 0.184 | 0.542
(0.364-0.807) | 0.003b |
| JAK2 | | | | | | | |
| Low
expression | 185 | 69 | 1,622 | Ref. | | Ref. | |
| High
expression | 185 | 61 | 2,116 | 0.781
(0.552-1.105) | 0.163 | 0.574
(0.388-0.848) | 0.005b |
| JAK3 | | | | | | | |
| Low
expression | 185 | 69 | 1,622 | Ref. | | Ref. | |
| High
expression | 185 | 61 | 1,694 | 0.859
(0.609-1.213) | 0.389 | 0.816
(0.551-1.208) | 0.310 |
| TYK2 | | | | | | | |
| Low
expression | 185 | 69 | 1,490 | Ref. | | Ref. | |
| High
expression | 185 | 61 | 2,456 | 0.824
(0.583-1.165) | 0.274 | 0.799
(0.541-1.180) | 0.260 |
| STAT1 | | | | | | | |
| Low
expression | 185 | 69 | 1,694 | Ref. | | Ref. | |
| High
expression | 185 | 61 | 1,685 | 0.874
(0.618-1.237) | 0.448 | 0.909
(0.609-1.358) | 0.641 |
| STAT2 | | | | | | | |
| Low
expression | 185 | 70 | 1,423 | Ref. | | Ref. | |
| High
expression | 185 | 60 | 2,486 | 0.744
(0.526-1.053) | 0.095 | 0.715
(0.481-1.063) | 0.098 |
| STAT3 | | | | | | | |
| Low
expression | 185 | 68 | 1,622 | Ref. | | Ref. | |
| High
expression | 185 | 62 | 2,116 | 0.851
(0.602-1.203) | 0.360 | 0.727
(0.495-1.069) | 0.105 |
| STAT4 | | | | | | | |
| Low
expression | 185 | 73 | 1,423 | Ref. | | Ref. | |
| High
expression | 185 | 57 | 2,486 | 0.693
(0.490-0.981) | 0.038b | 0.730
(0.487-1.095) | 0.128 |
| STAT5A | | | | | | | |
| Low
expression | 185 | 72 | 1,147 | Ref. | | Ref. | |
| High
expression | 185 | 58 | 2,456 | 0.626
(0.442-0.888) | 0.009b | 0.648
(0.435-0.967) | 0.033b |
| STAT5B | | | | | | | |
| Low
expression | 185 | 78 | 1,271 | Ref. | | Ref. | |
| High
expression | 185 | 52 | 2,456 | 0.594
(0.418-0.845) | 0.004b | 0.604
(0.408-0.895) | 0.012b |
| STAT6 | | | | | | | |
| Low
expression | 185 | 75 | 1,372 | Ref. | | Ref. | |
| High
expression | 185 | 55 | 2,456 | 0.594
(0.418-0.843) | 0.004b | 0.531
(0.357-0.790) | 0.002b |
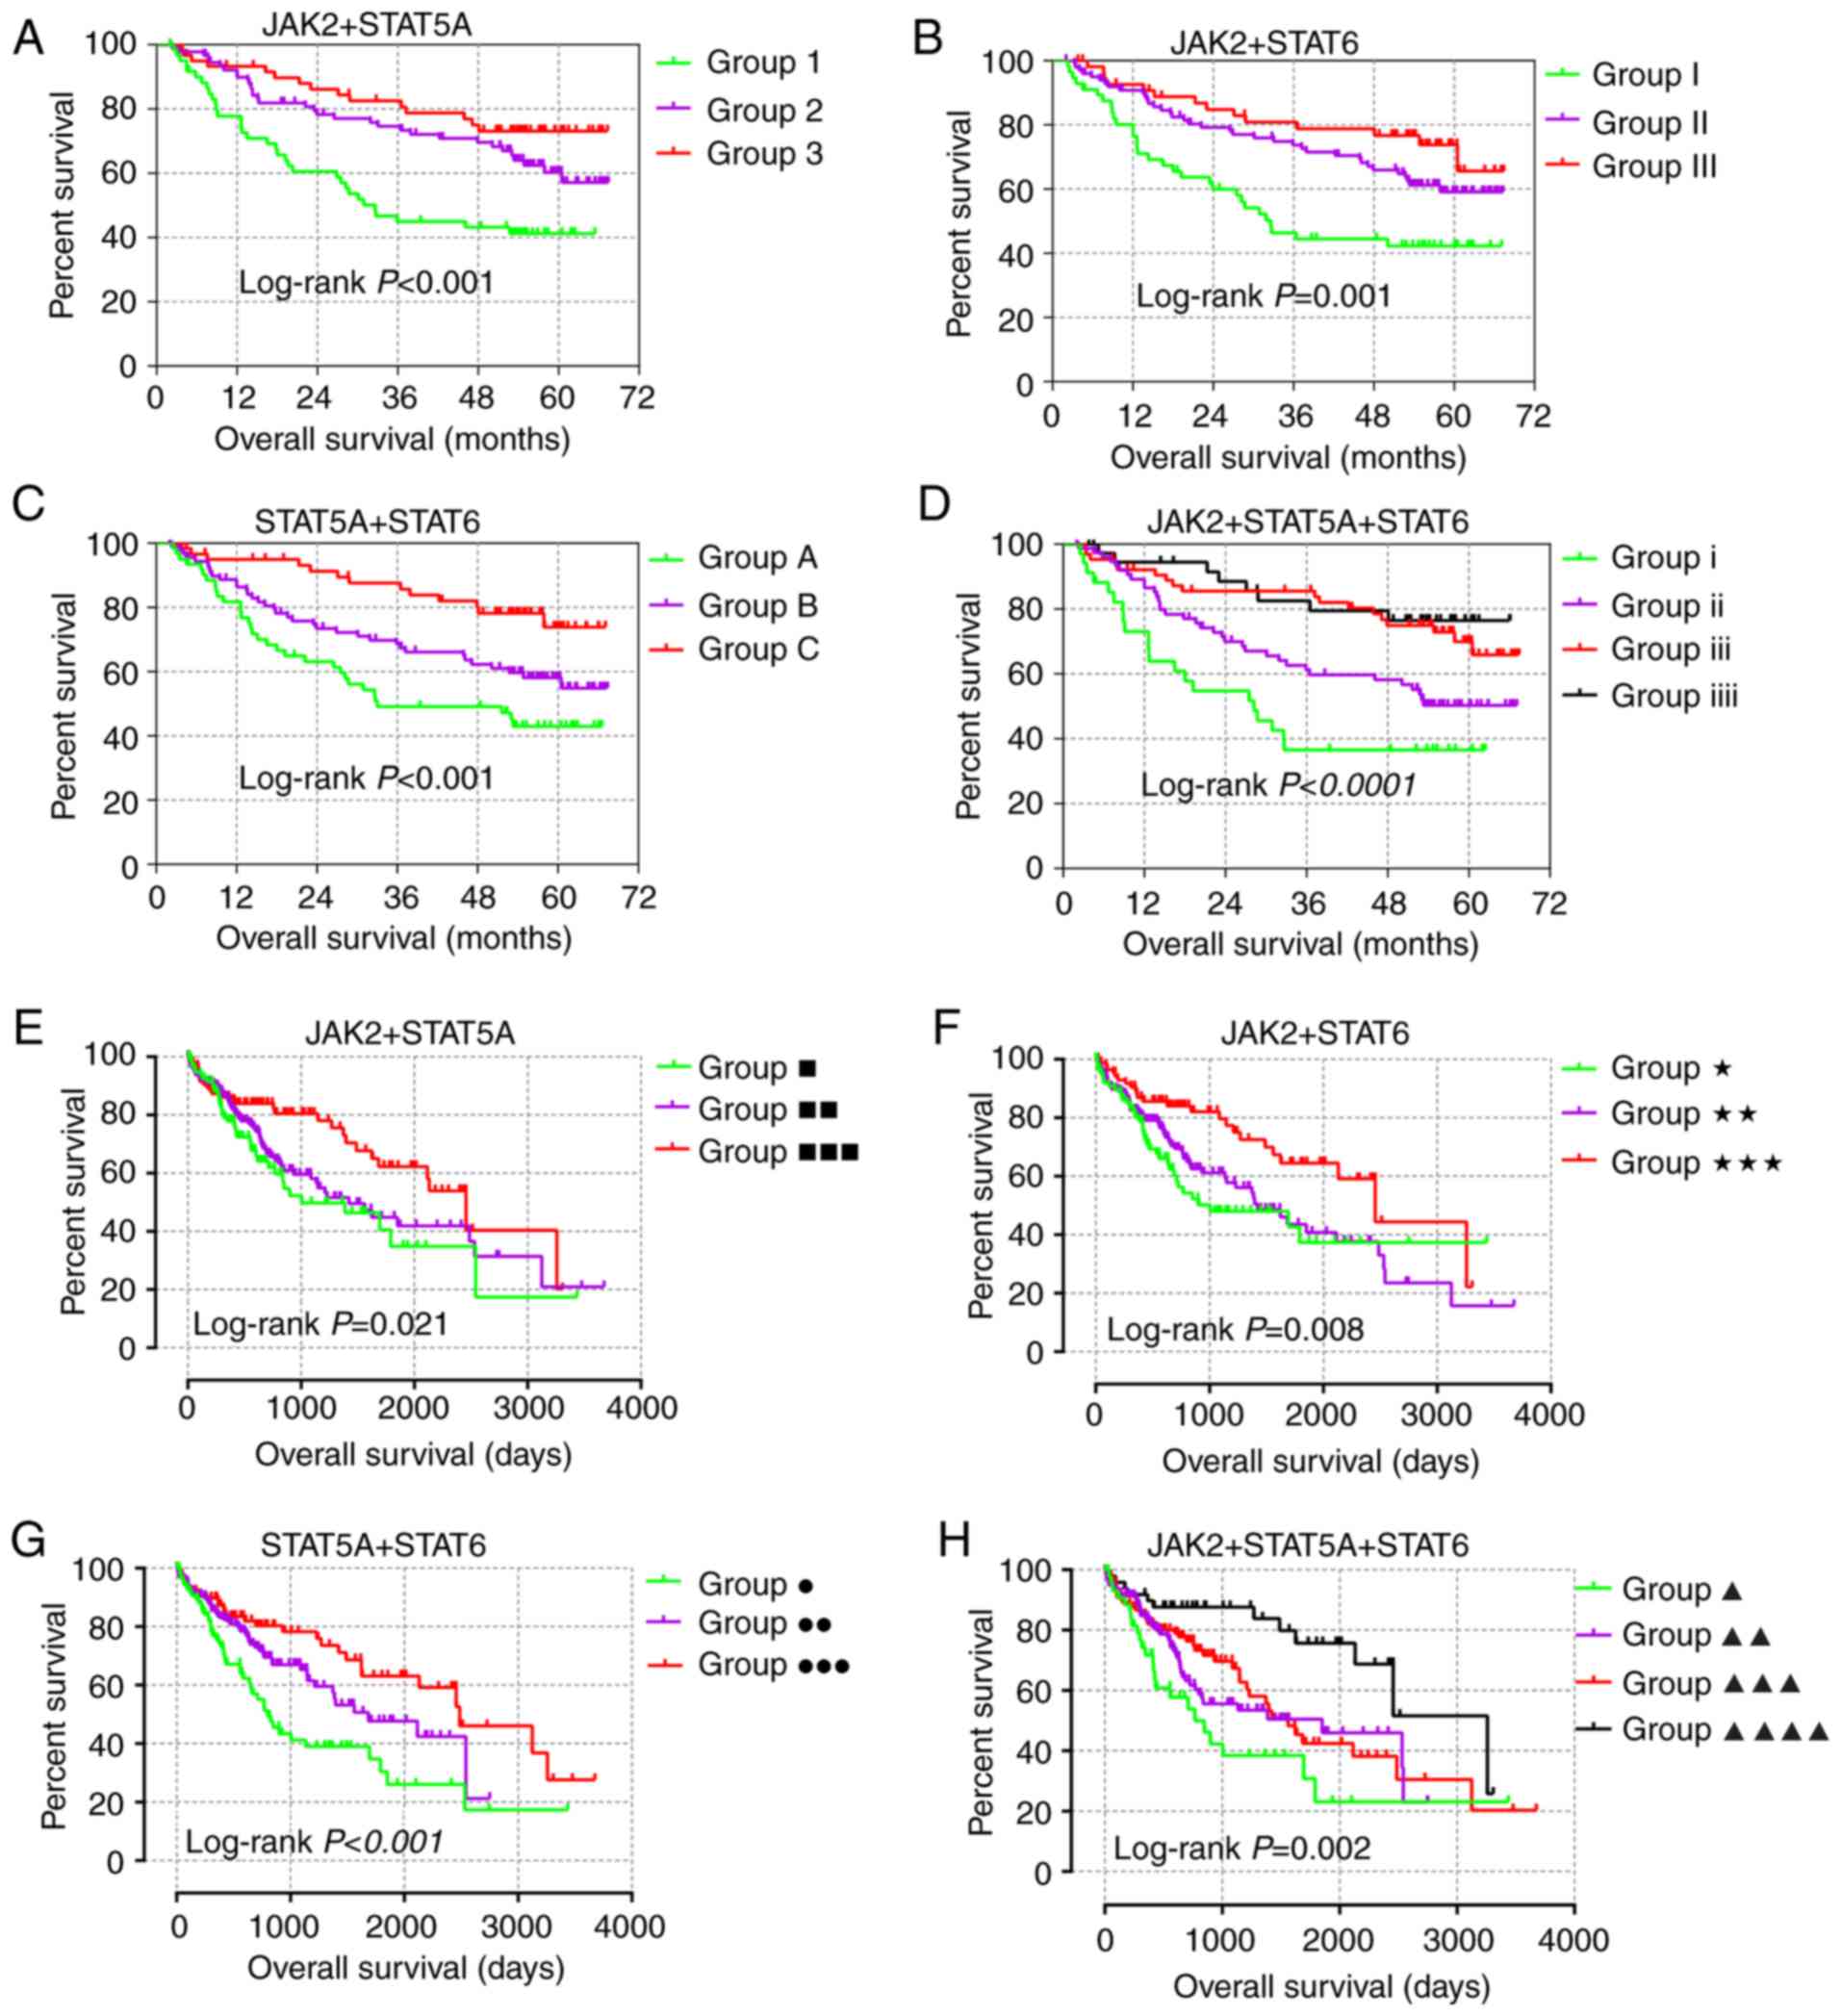
Joint-effect analysis
JAK2, STAT5A and STAT6 demonstrated prognostic
significance in both GSE14520 and TCGA cohorts (Tables I and II) and were additionally used in for
joint-effect analysis. In the multivariate analysis, prognostic
significance was observed among all the groups in the GSE14520 and
TCGA cohorts (all adjusted P≤0.05; Tables III and IV). Groups 1, I, A, i, ■, ★, ● and ▲,
with most of the poor prognosis indicators, indicated the worst
prognosis. However, groups 3, III, C, iiii, ■■■, ★★★, ●●● and ▲▲▲▲
showed the best prognosis (Fig.
6). These results are in line with the fact that combination
analysis has advantage over any gene alone.
| Table IIIJoint-effect analysis of
prognosis-related genes for overall survival in the GSE14520
cohort. |
Table III
Joint-effect analysis of
prognosis-related genes for overall survival in the GSE14520
cohort.
| Group | Expression
| Overall survival
|
|---|
| JAK2 | STAT5A | STAT6 | Events/total | MST (months) | Adjusted HR (95%
CI) | Adjusted
P-valuea |
|---|
| 1 | Low | Low | | 34/61 | 32.6 | Ref. | 0.002b |
| 2 | Low | High | | 33/90 | NA | 0.572
(0.340-0.961) | 0.035b |
| High | Low | | | | | |
| 3 | High | High | | 15/61 | NA | 0.339
(0.181-0.638) | 0.001b |
| I | Low | | Low | 31/56 | 32.6 | Ref. | <0.001b |
| II | Low | | High | 37/100 | NA | 0.443
(0.269-0.728) | 0.001b |
| High | | Low | | | | |
| III | High | | High | 14/56 | NA | 0.326
(0.171-0.619) | 0.001b |
| A | | Low | Low | 33/61 | 33.0 | Ref. | 0.001b |
| B | | Low | High | 36/90 | NA | 0.569
(0.350-0.927) | 0.023b |
| | High | Low | | | | |
| C | | High | High | 13/61 | NA | 0.287
(0.149-0.544) | <0.001b |
| i | Low | Low | Low | 21/34 | 28.2 | Ref. | <0.0001b |
| ii | Low | Low | High | 35/76 | NA | 0.485
(0.277-0.851) | 0.012b |
| Low | High | Low | | | | |
| High | Low | Low | | | | |
| iii | Low | High | High | 18/64 | NA | 0.263
(0.135-0.513) | <0.0001b |
| High | Low | High | | | | |
| High | High | Low | | | | |
| iiii | High | High | High | 8/38 | NA | 0.208
(0.090-0.478) | <0.001b |
| Table IVJoint-effect analysis of
prognosis-related genes for overall survival in The Cancer Genome
Atlas cohort. |
Table IV
Joint-effect analysis of
prognosis-related genes for overall survival in The Cancer Genome
Atlas cohort.
| Group | Expression
| Overall survival
|
|---|
| JAK2 | STAT5A | STAT6 | Events/total | MST (days) | Adjusted HR (95%
CI) | Adjusted
P-valuea |
|---|
| ■ | Low | Low | | 39/100 | 1,005 | Ref. | 0.004b |
| ■■ | Low | High | | 63/170 | 1,423 | 0.703
(0.453-1.090) | 0.115 |
| High | Low | | | | | |
| ■■■ | High | High | | 28/100 | 2,456 | 0.390
(0.223-0.682) | 0.001b |
| ★ | Low | | Low | 38/91 | 1,005 | Ref. | <0.001b |
| ★★ | Low | | High | 68/188 | 1,423 | 0.536
(0.345-0.834) | 0.006b |
| High | | Low | | | | |
| ★★★ | High | | High | 24/91 | 2,456 | 0.285
(0.158-0.515) | <0.0001b |
| ● | | Low | Low | 45/94 | 802 | Ref. | 0.001b |
| ●● | | Low | High | 57/182 | 1,685 | 0.542
(0.348-0.843) | 0.007b |
| | High | Low | | | | |
| ●●● | | High | High | 28/94 | 2,486 | 0.402
(0.238-0.677) | 0.001b |
| ▲ | Low | Low | Low | 24/46 | 768 | Ref. | <0.001b |
| ▲▲ | Low | Low | High | 50/147 | 1,852 | 0.516
(0.308-0.863) | 0.012b |
| Low | High | Low | | | | |
| High | Low | Low | | | | |
| ▲▲▲ | Low | High | High | 44/123 | 1,560 | 0.357
(0.204-0.625) | <0.001b |
| High | Low | High | | | | |
| High | High | Low | | | | |
| ▲▲▲▲ | High | High | High | 12/54 | 3,258 | 0.208
(0.099-0.438) | <0.0001b |
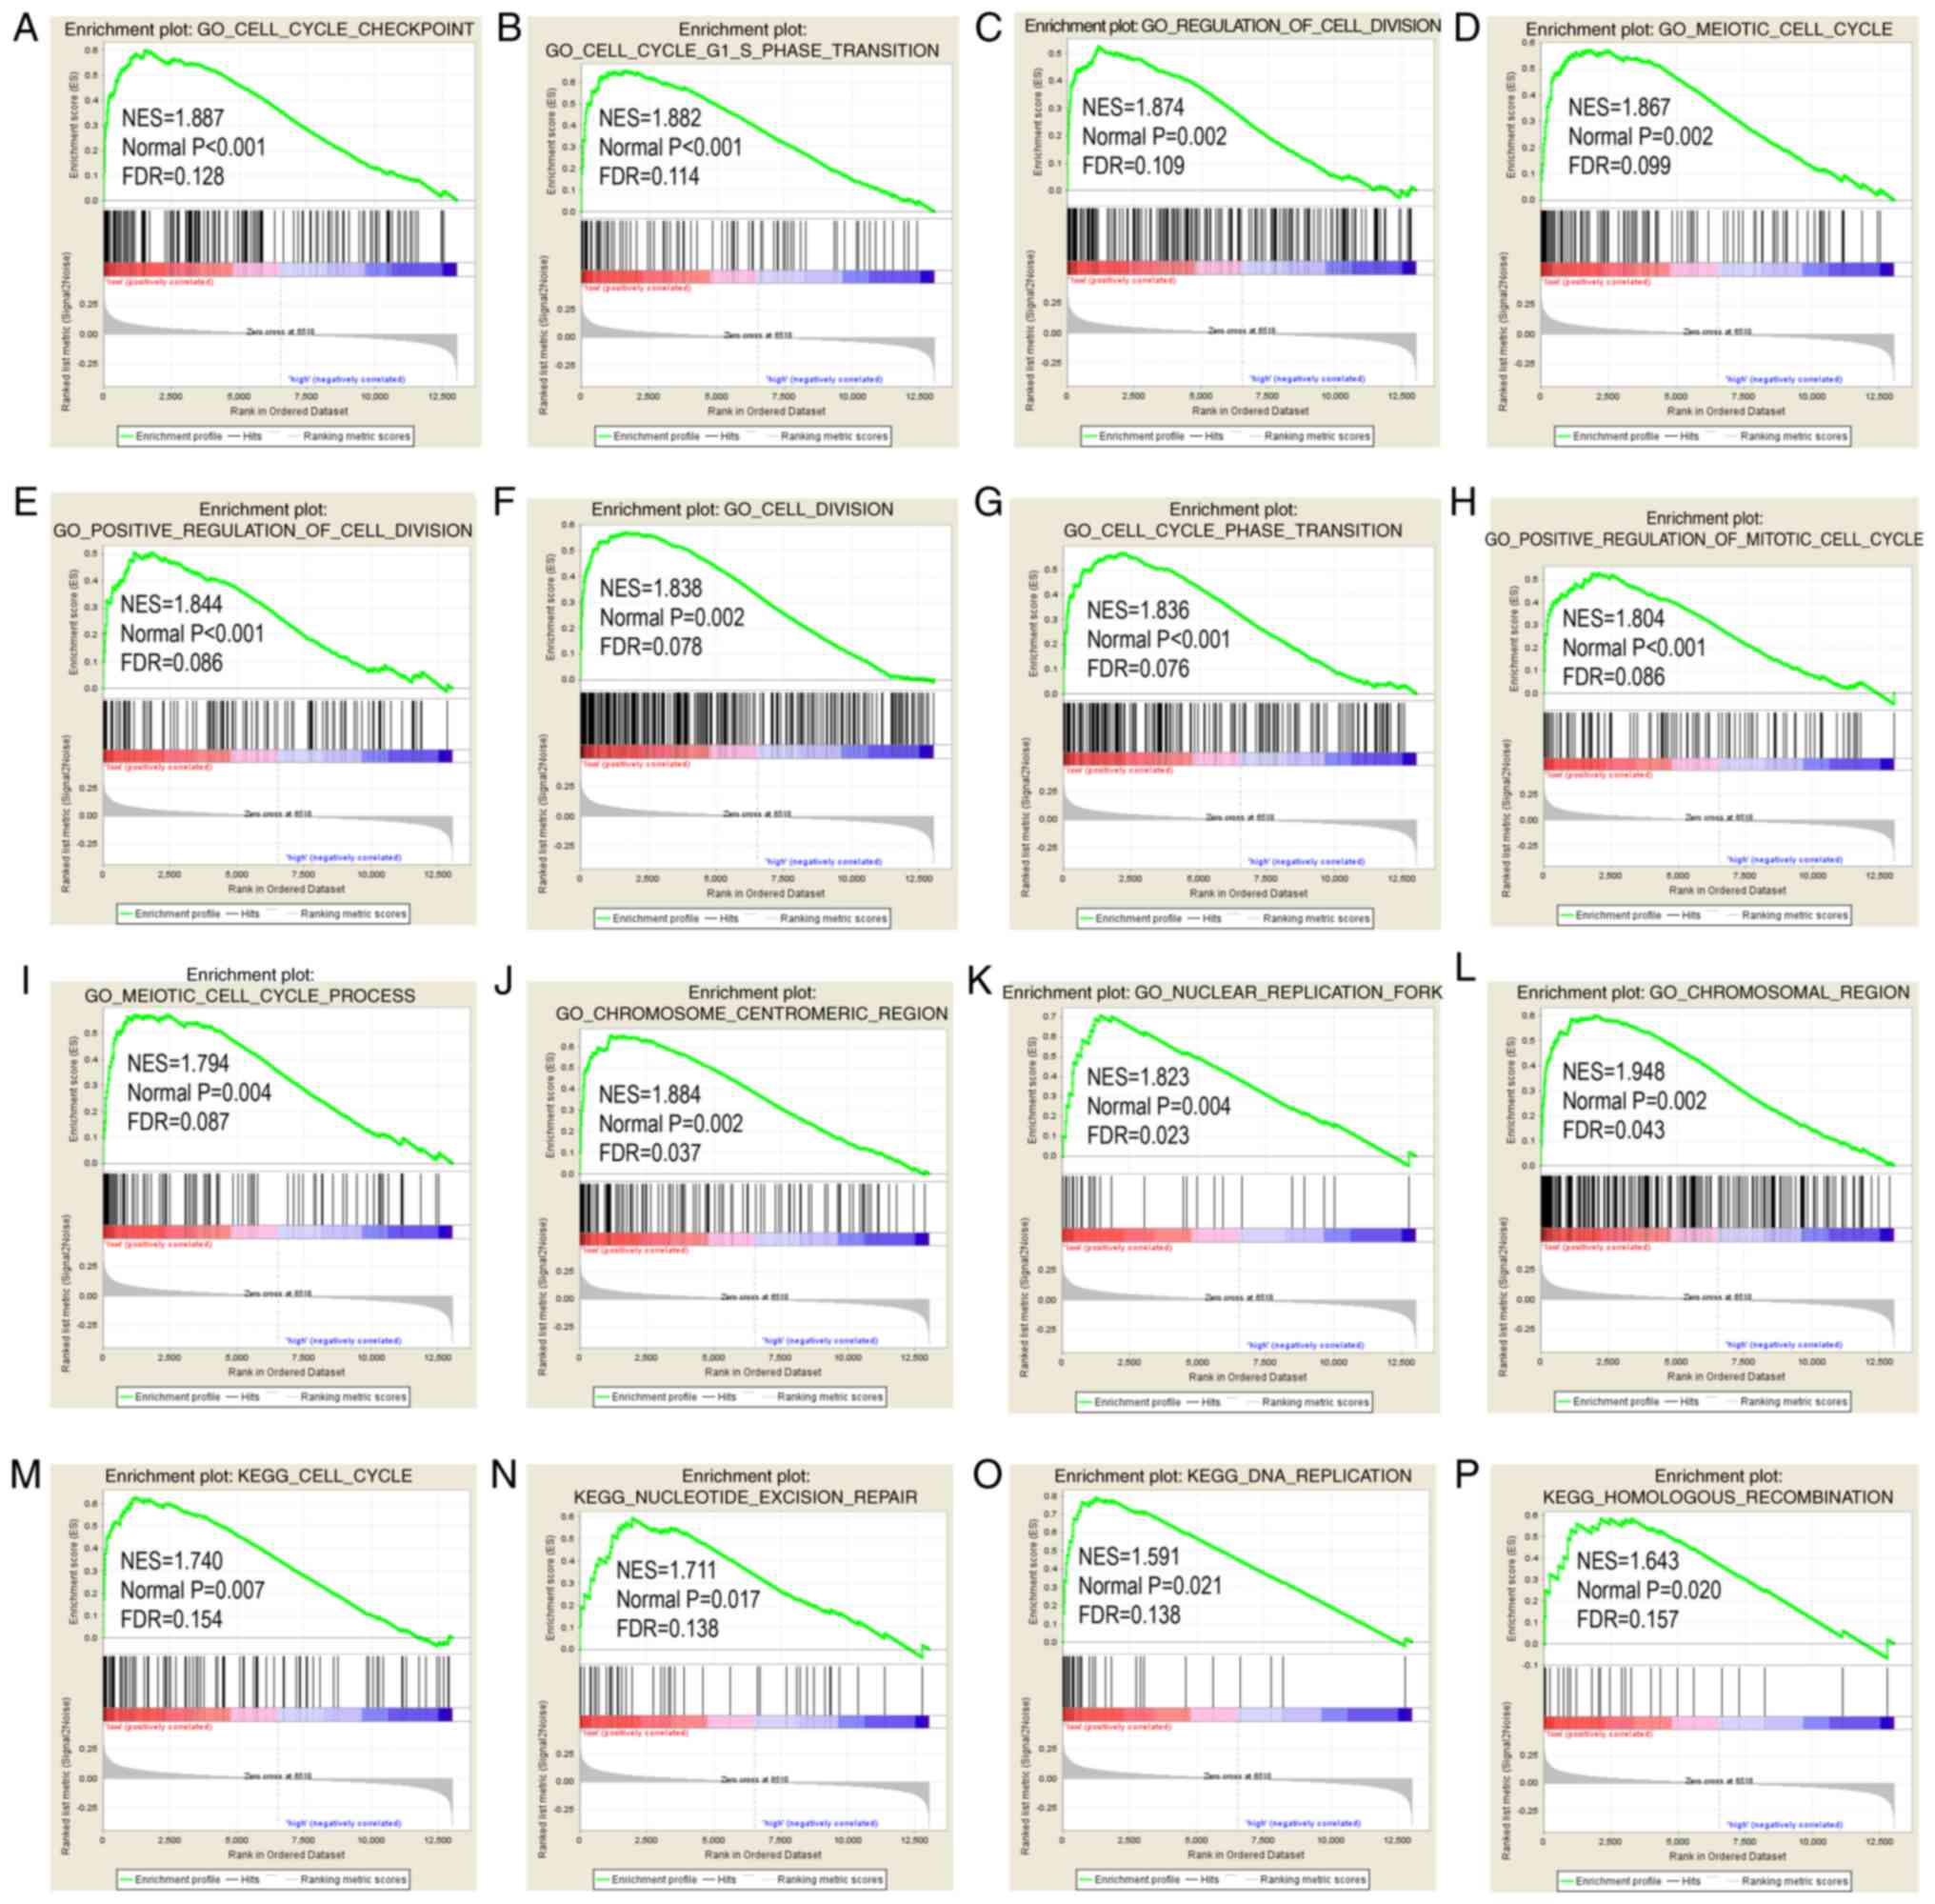
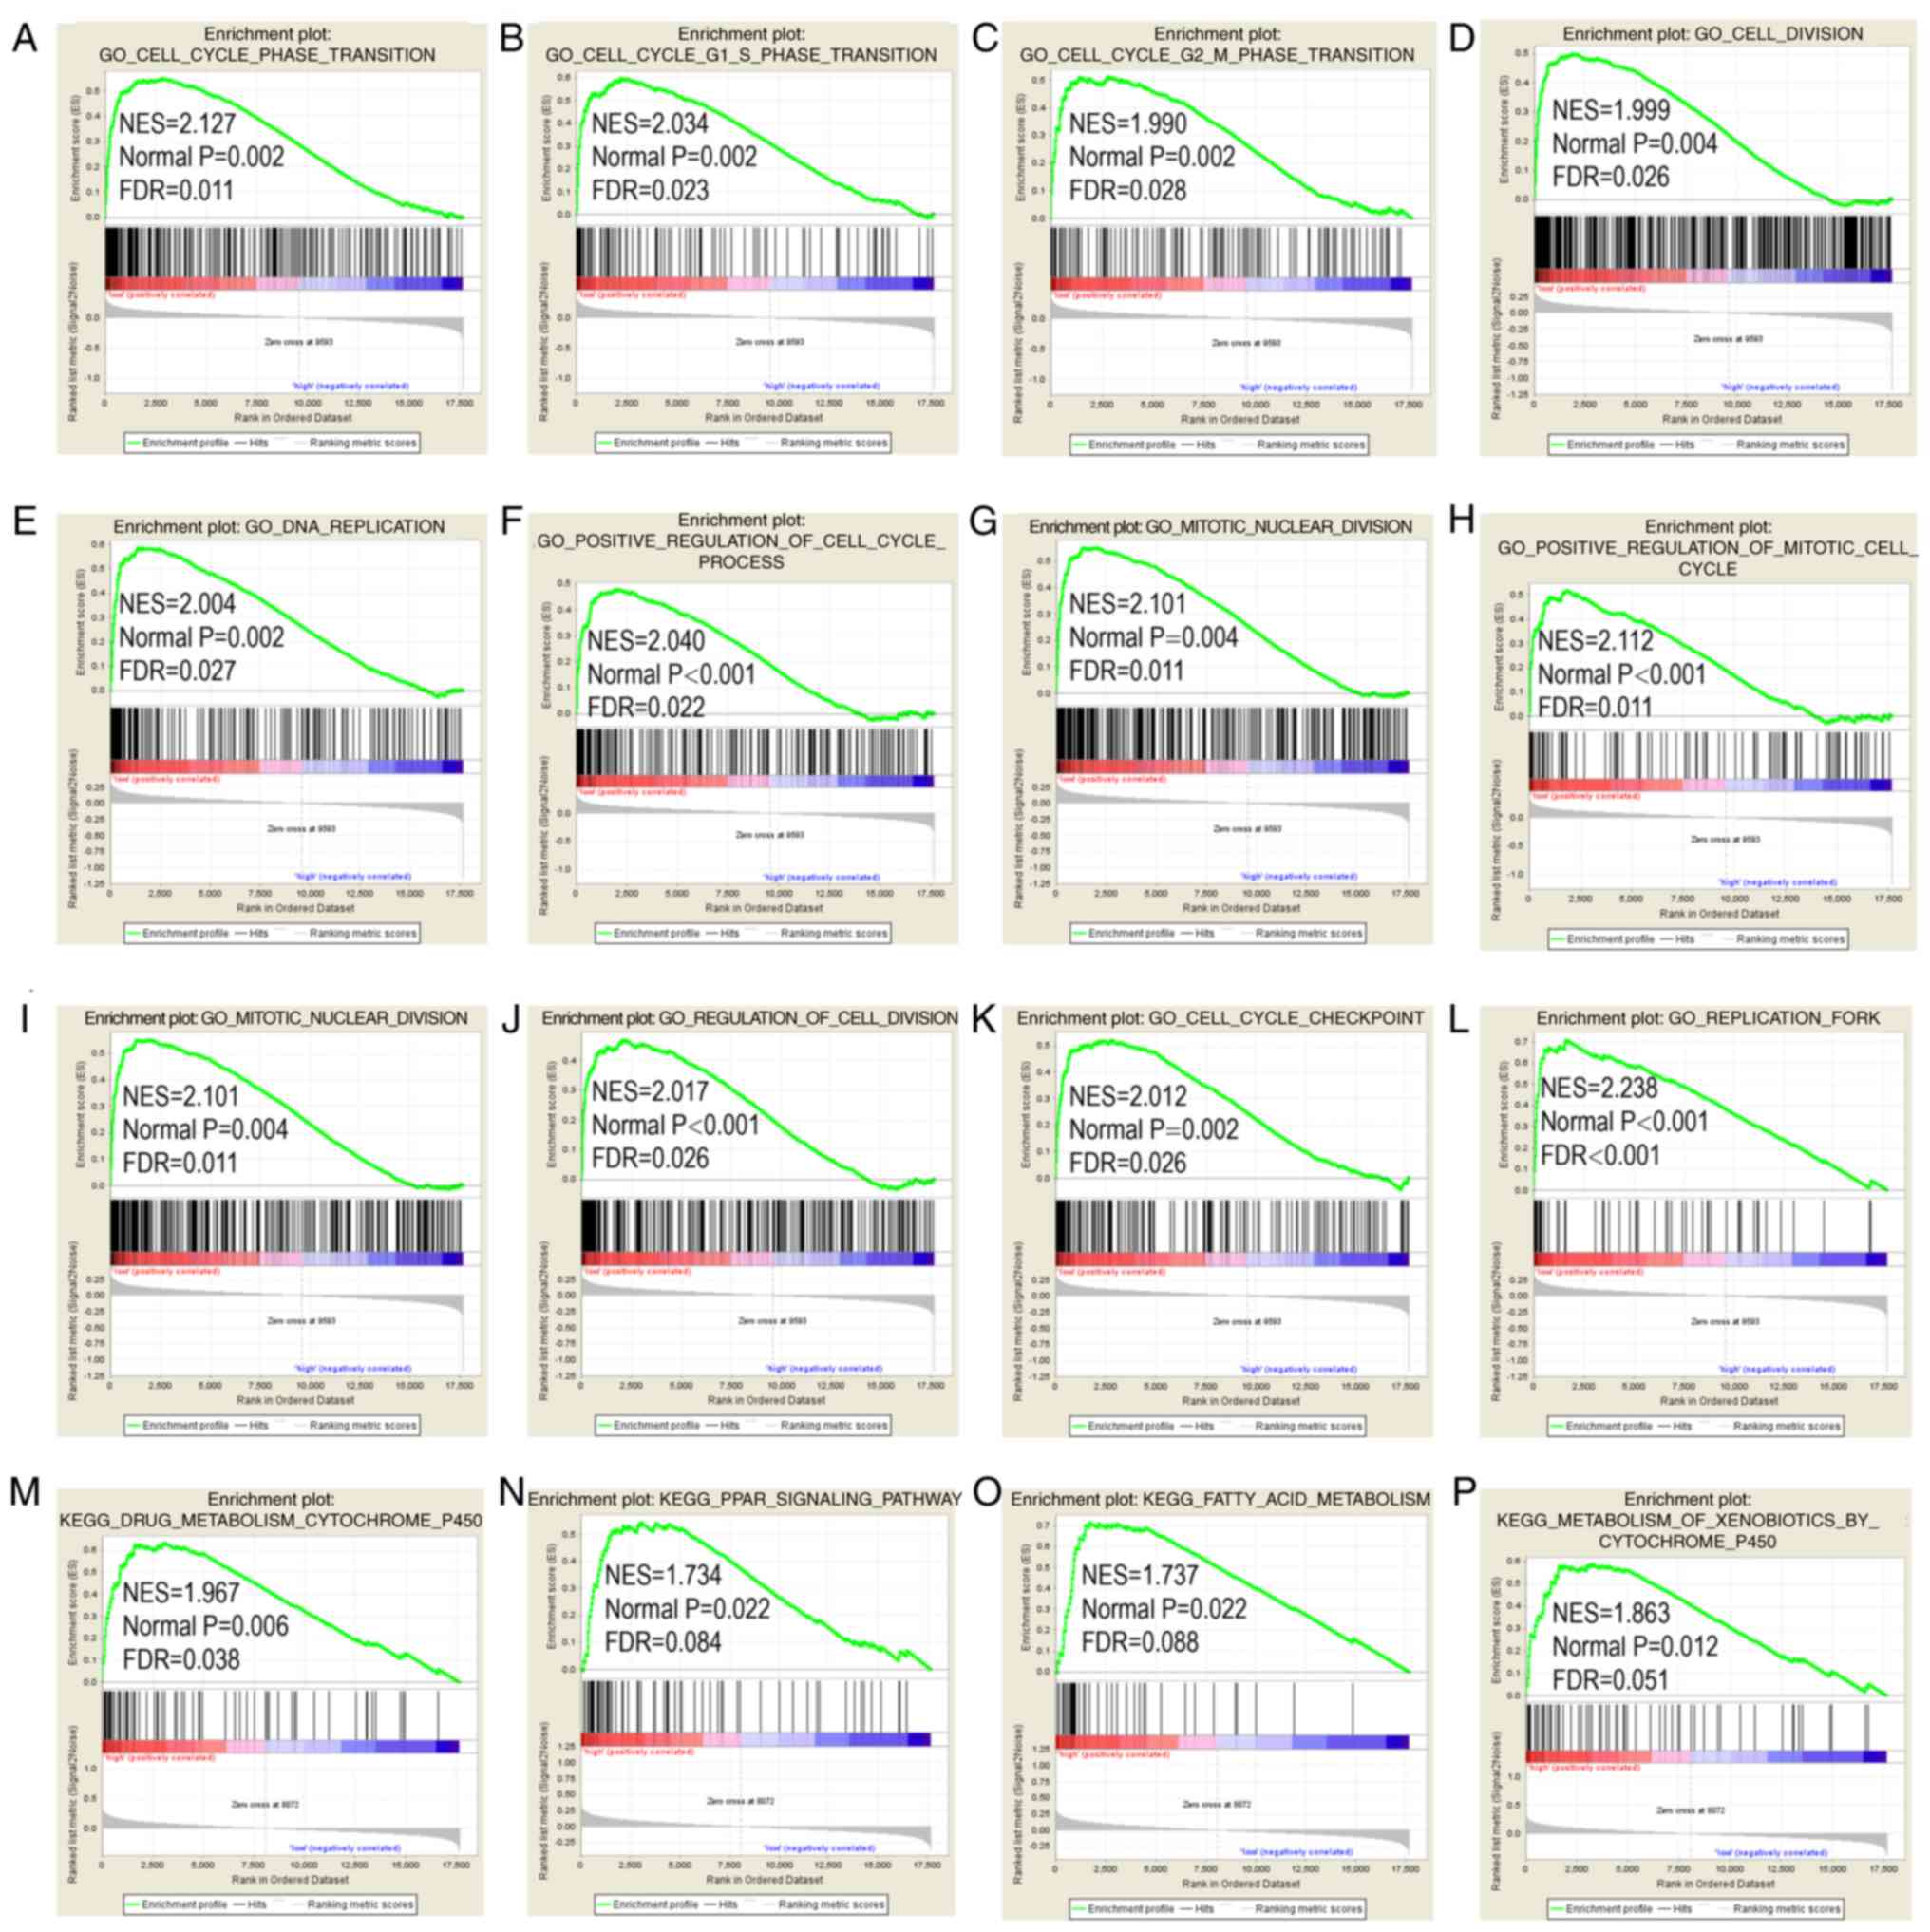
GSEA results
STAT6 was further explored in analysis of GO terms
and KEGG pathways (Figs. 7 and
8). Enriched STAT6 GO terms in
both the GSE14520 and TCGA cohorts were enriched 'cell cycle
checkpoint', 'cell cycle G1 S phase transition', 'regulation of
cell division', 'meiotic cell cycle' and 'cell division' (Figs. 7A-L and 8A-L). Enriched KEGG pathways of STAT6
using the GSE14520 dataset included 'cell cycle', 'nucleotide
excision repair', 'DNA replication' and 'homologous recombination',
among others (Fig. 7M-P).
Meanwhile, enriched KEGG pathways of STAT6 from The Cancer Genome
Atlas data included 'drug metabolism cytochrome P450', 'PPAR
signaling pathway', 'fatty acid metabolism' and 'metabolism of
xenobiotics by cytochrome P450' (Fig.
8M-P).
Construction of nomogram and risk score
model
Clinical factors, JAK2, STAT5A and STAT6 were
analyzed using nomogram for the GSE14520 (Fig. 3A) and TCGA (Fig. 3B) cohorts. High expressions often
cause low points in the two cohorts. The same points indicated
highest probability of survival at 1 year and the lowest
probability of survival at 5 years. Survival probability at 3 years
was in the middle.
In addition, risk score models were constructed for
prognosis prediction as presented in Figs. 9A and 10A. Meanwhile, coefficient β in the
model was obtained from Cox proportional hazards regression model
(Table V). The risk score model
included risk score ranking, living status, gene expression heat
maps and survival plot. The prognostic ROC curves and survival
plots indicated that risk score models have values for prognosis in
the GSE14520 (Fig. 9B and C) and
TCGA (Fig. 10B and C)
cohorts.
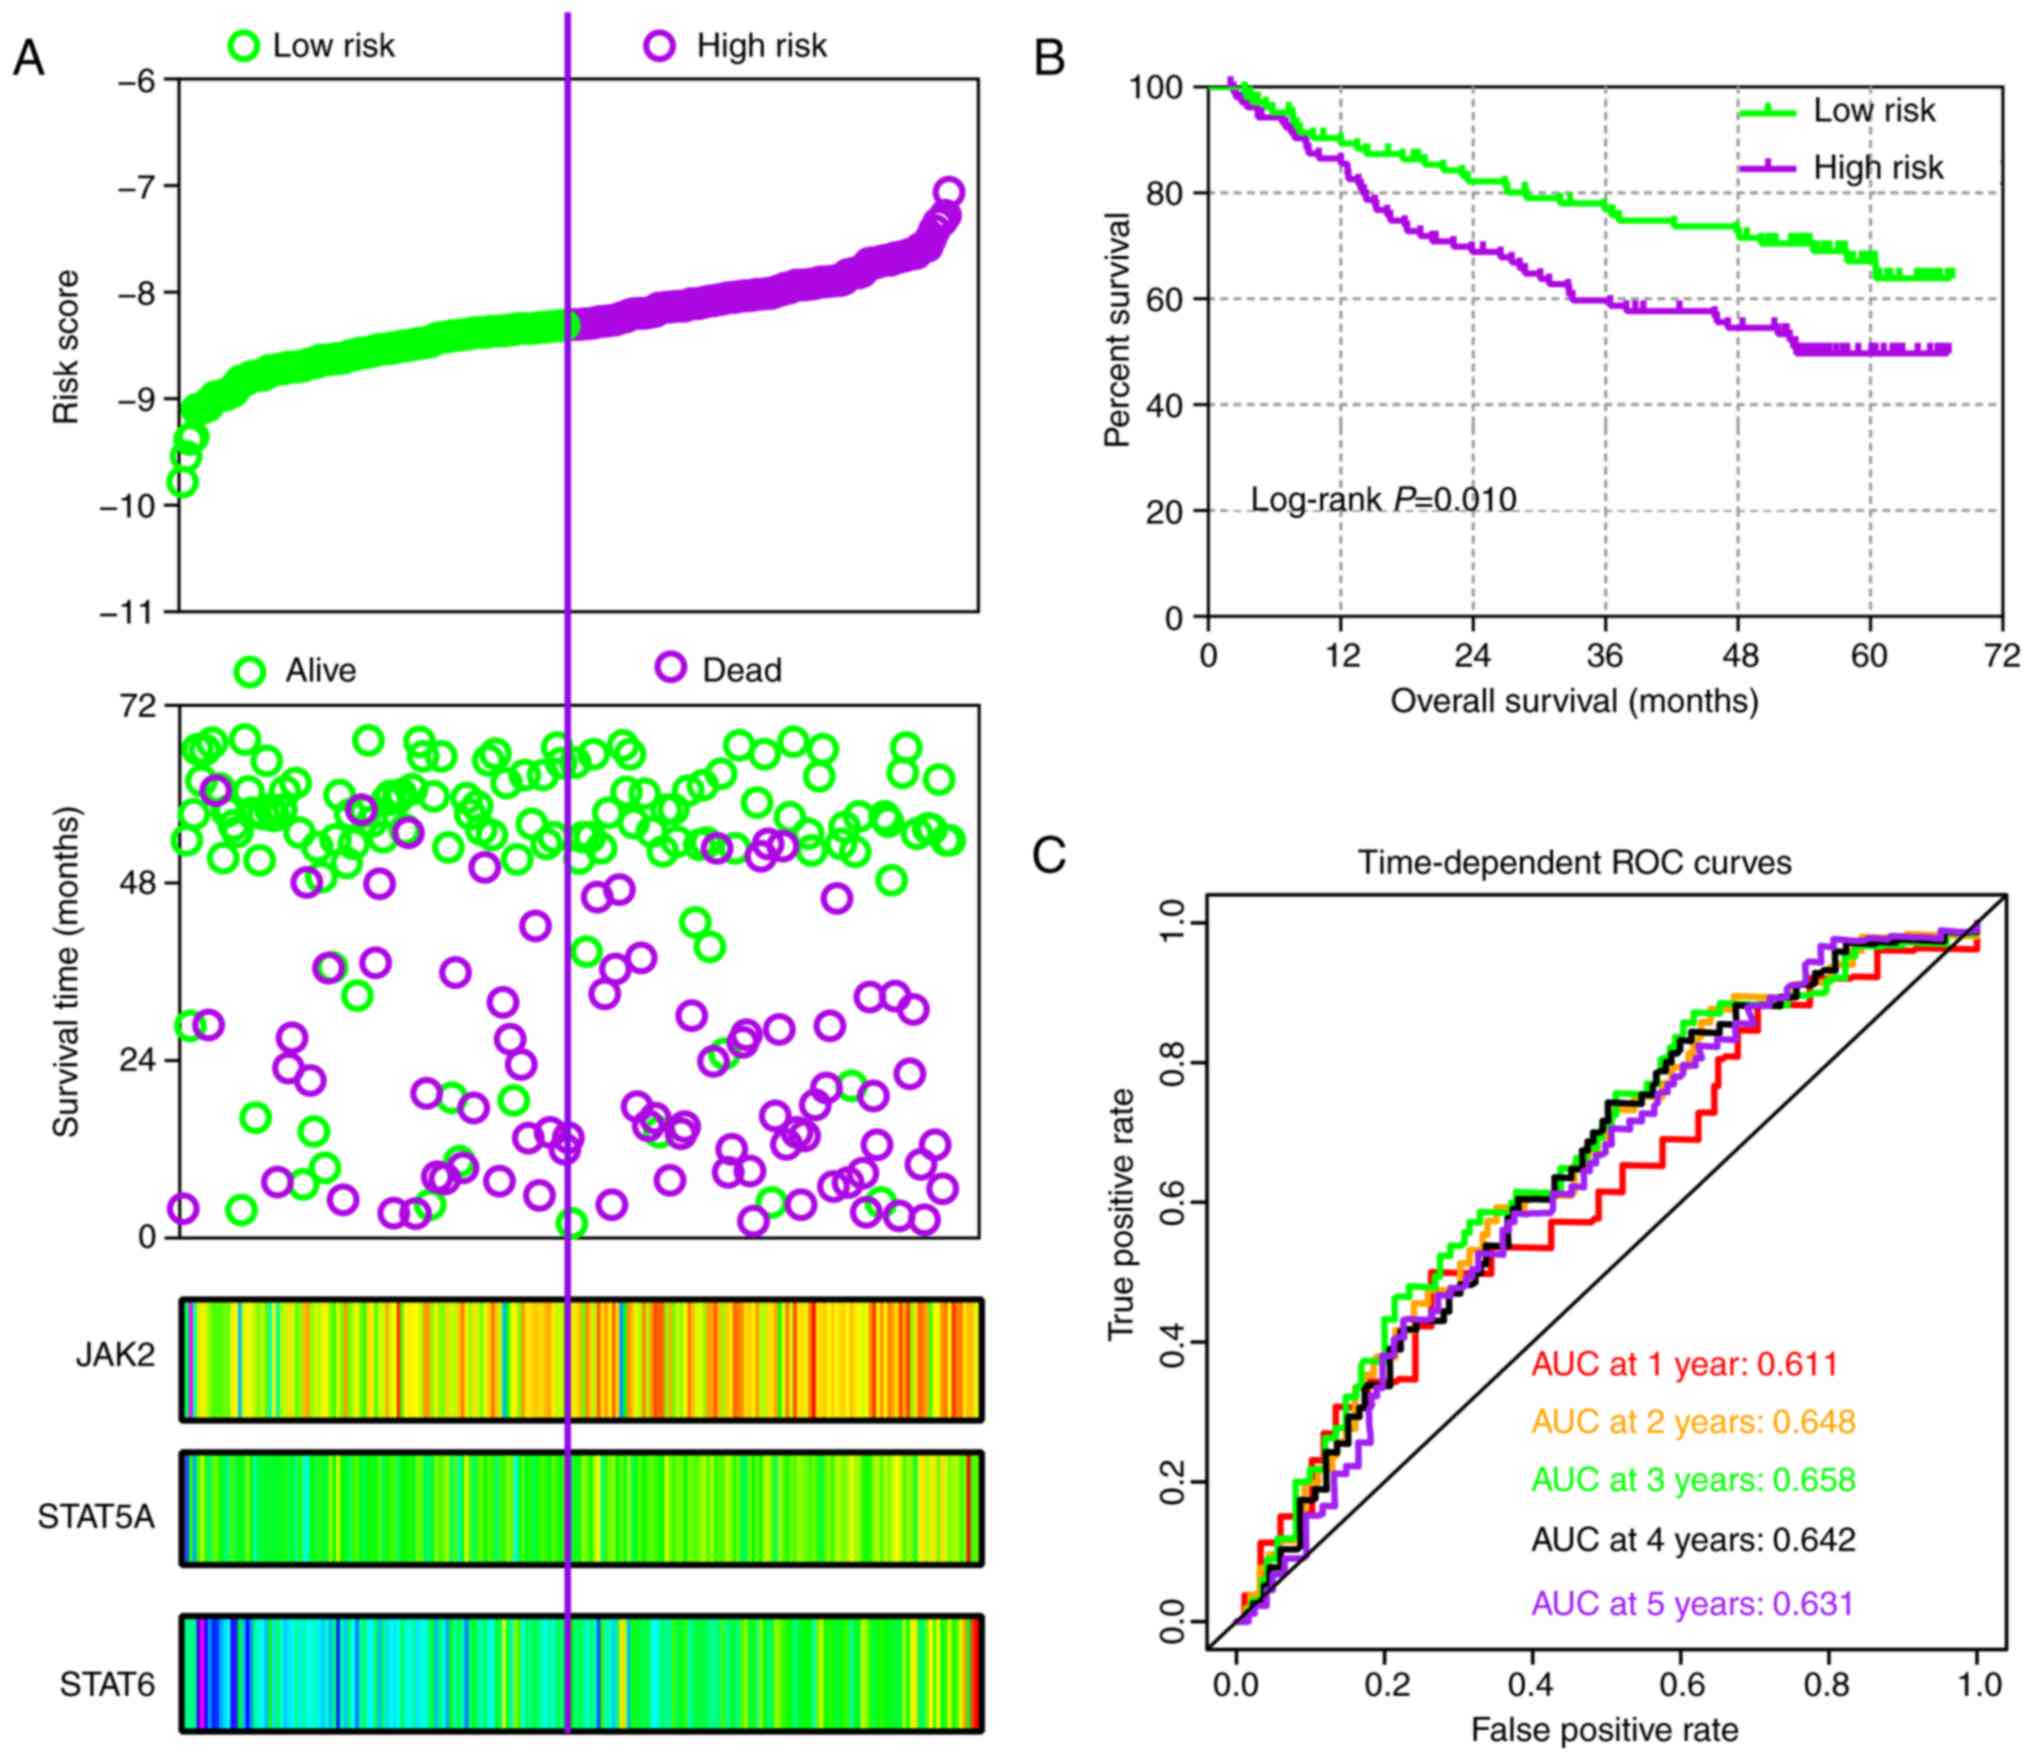 | Figure 9Risk score model, Kaplan-Meier plot,
and survival ROC curves in GSE14520 cohort. (A) Risk score model
including risk score ranking, survival status, and JAK2, STAT5A and
STAT6 heat map. (B) Kaplan-Meier plot of low and high risk score
groups. (C) Time-dependent ROC curves at 1, 2, 3, 4 and 5 years.
JAK, Janus kinase; STAT, signal transducer and activator of
transcription; ROC, receiver operating characteristic; AUC, area
under the curve. |
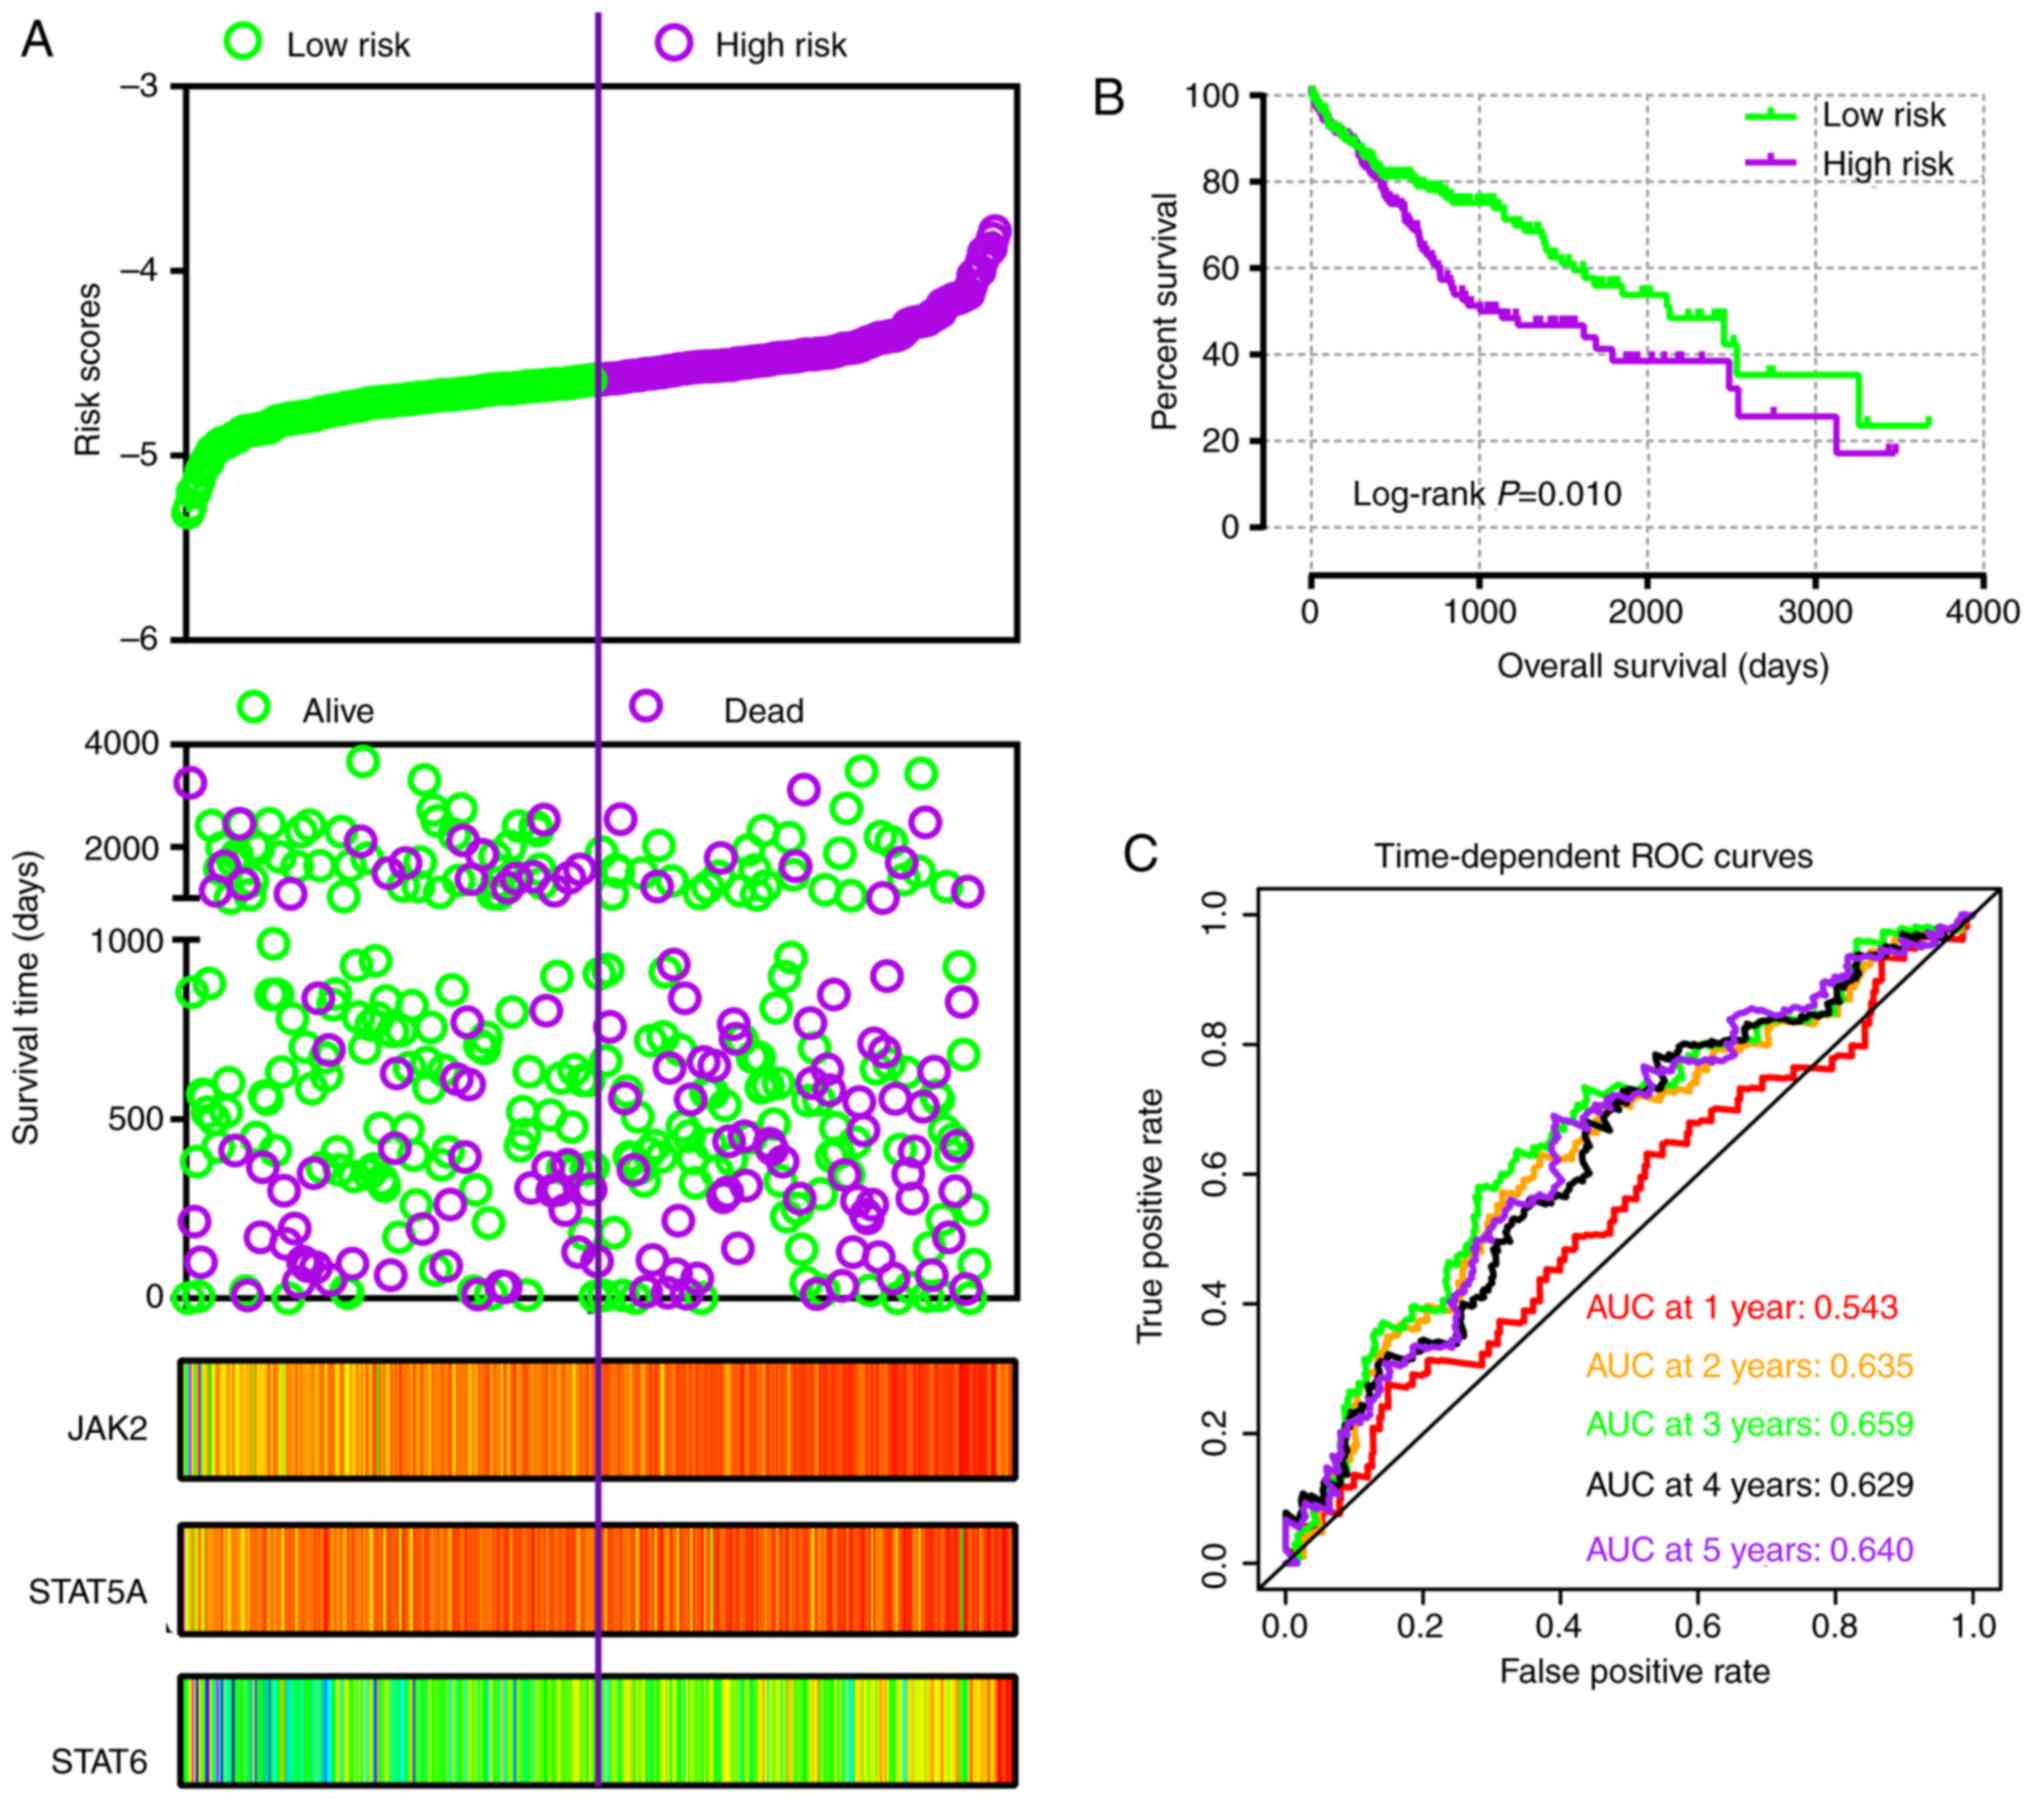 | Figure 10Risk score model, Kaplan-Meier plot,
and survival ROC curves in The Cancer Genome Atlas cohort. (A) Risk
score model including risk score ranking, survival status, and
JAK2, STAT5A and STAT6 heat map. (B) Kaplan-Meier plot of low and
high risk score groups. (C) Time-dependent ROC curves at 1, 2, 3, 4
and 5 years. JAK, Janus kinase; STAT, signal transducer and
activator of transcription; ROC, receiver operating characteristic;
AUC, area under the curve. |
| Table VRisk score model construction of
genes in GSE14520 dataset and TCGA database. |
Table V
Risk score model construction of
genes in GSE14520 dataset and TCGA database.
A, GSE14520
|
|---|
| Variable | β | SE | Wald | HR (95% CI) | P-value |
|---|
| Tumor size | 0.038 | 0.269 | 0.020 | 1.039
(0.613-1.761) | 0.886 |
| Cirrhosis | −1.072 | 0.736 | 2.122 | 0.342
(0.081-1.448) | 0.145 |
| BCLC stage | | | | | |
| 0 | | | 28.571 | | <0.0001 |
| A | 1.440 | 0.726 | 3.938 | 4.223
(1.018-17.518) | 0.047 |
| B | 1.828 | 0.789 | 5.362 | 6.219
(1.324-29.209) | 0.021 |
| C | 2.976 | 0.780 | 14.551 | 19.612
(4.25-90.496) | 0.0001 |
| AFP | 0.194 | 0.230 | 0.717 | 1.214
(0.774-1.904) | 0.397 |
| JAK2 | −0.500 | 0.239 | 4.398 | 0.606
(0.380-0.968) | 0.036 |
| STAT5A | −0.592 | 0.239 | 6.127 | 0.553
(0.346-0.884) | 0.013 |
| STAT6 | −0.616 | 0.231 | 7.101 | 0.540
(0.343-0.850) | 0.008 |
B, TCGA
|
| Variable | β | SE | Wald | HR (95% CI) | P-value |
|
| Tumor stage | | | | | |
| I | | | 8.832 | | 0.012 |
| II | 0.249 | 0.265 | 0.881 | 1.283
(0.763-2.159) | 0.348 |
| III + IV | 0.669 | 0.227 | 8.673 | 1.952
(1.251-3.045) | 0.003 |
| Radical
resection | 0.266 | 0.360 | 0.548 | 1.305
(0.645-2.642) | 0.459 |
| HBV infection | −0.854 | 0.266 | 10.305 | 0.426
(0.253-0.717) | 0.001 |
| JAK2 | −0.567 | 0.200 | 8.045 | 0.567
(0.383-0.839) | 0.005 |
| STAT5A | −0.320 | 0.206 | 2.405 | 0.726
(0.485-1.088) | 0.121 |
| STAT6 | −0.631 | 0.205 | 9.507 | 0.532
(0.356-0.795) | 0.002 |
Co-expression interactions, PPI network
and enrichment analysis
Pearson correlation matrices of JAK/STAT pathway
genes were constructed to show the correlations among them
(Fig. 11A and B). Additionally,
co-expression interaction and pathways along with PPI networks
demonstrated complex interactions at the gene and protein levels
(Fig. 11C and D).
Enrichment analysis identified BP, CC and MF GO
terms associated with JAK/STAT pathway (Fig. S4). A schematic of the JAK/STAT
pathway is presented in Fig. S5.
In particular, the mechanisms of these genes involved in JAK/STAT
signaling pathway were consistent with the GSEA results produced in
the present study.
Validation of expressions of JAK2, STAT5A
and STAT6 using RT-qPCR
A total of 21 pairs of HBV-infected HCC tissue used
to validate the mRNA expression levels of JAK2, STAT5A and STAT6 in
tumor and non-tumor tissues. Due to the low sample size available
for validation, it is clear that not all results were consistent
with the data from the GSE14520 HBV infected-HCC cohort (Fig. S6). STAT6 was differentially
expressed between tumor and non-tumor tissues (P=0.013), whereas
JAK2 was not (P=0.245), which is in line with the GSE14520 cohort.
For STAT5A, the results were not in accordance with the
GSE14520 cohort, as it was not differentially expressed between
tumor and non-tumor tissues in the 21 tissue pairs (P=0.08);
however, this is in line with the result of the TCGA cohort.
Discussion
In the present study, the diagnostic and prognostic
clinical significance of the JAK/STAT signaling pathway in HCC was
investigated using GSE14520, HBV-infected cohort and TCGA cohorts.
JAK2, JAK3, TYK2, STAT1, STAT2, STAT3, STAT4, STAT5B and STAT6
genes had diagnostic significance for HCC in the GSE14520 cohort.
Meanwhile, JAK1, JAK2, TYK2, STAT3, STAT4 and STAT5B showed
diagnostic significance in the TCGA cohort. This indicates that
JAK2, TYK2, STAT3, STAT4 and STAT5B may be diagnostic biomarkers
for HCC. JAK2, STAT1, STAT3, STAT5A and STAT6 in the GSE14520
cohort, and JAK1, JAK2, STAT5A, STAT5B and STAT6 in TCGA cohort,
were correlated with HCC prognosis, indicating that JAK2, STAT5A
and STAT6 may be potential prognostic biomarkers for HCC. The gene
combination analyses for both diagnosis and prognosis have
advantages over using any one gene alone. Additionally, molecular
mechanism exploration using GSEA indicated that STAT6 was enriched
in terms associated with the cell cycle and cell division, and the
'fatty acid metabolism', 'drug metabolism cytochrome P450' and
'PPAR signaling pathway' KEGG pathways. Additionally, the nomograms
and risk score models were constructed and showed advantage for
prediction of HCC prognosis. Furthermore, validation of expression
of the prognosis-related genes from the two cohorts (JAK2,
STAT5A and STAT6) using tumor and non-tumor tissues
samples. STAT6 was differentially expressed between tumor
and non-tumor tissues, but JAK2 was not.
The JAK/STAT signaling pathway is a principal
signaling transduction pathway stimulated by many crucial cytokines
involved in sepsis, including interferon-γ, and interleukin −4, −6,
−10 and −12 (33-38). By binding with the corresponding
receptor, several cytokines activate JAK kinases, which can
selectively phosphorylate STATs (33). Subsequently, the STAT proteins
translocate to the nucleus and mediate the transcription of target
genes (33). The JAK/STAT
signaling pathway consists of the JAK and STAT gene families. The
JAK gene family is composed of JAK1, JAK2, JAK3 and TYK2, while the
STAT gene family is made up of STAT1, STAT2, STAT3, STAT4, STAT5A,
STAT5B and STAT6 (33). Three
members of the JAK family, JAK1, JAK2 and JAK3, are expressed
universally, whereas TYK2 was found to be mainly expressed in the
hematopoietic cells (39,40). The Src-homology 2 (SH2) domain is
an ~100-residue motif that binds to phospho-tyrosine residues and
provides a mechanism for reading the code (41). Additionally, it has a crucial role
in the recruitment of the cytokine receptors and recognition of
specific receptor phosphotyrosine motifs. The SH2 domain is
involved in JAK activation and STAT dimerization (42,43).
Complete deficiency of STAT3, STAT5A and STAT5B is a
lethal event in mice, which is also consistent with the broad and
crucial roles of these proteins (44). Other members, STAT1, STAT2, STAT4,
and STAT6, have more restricted functions. They tend to have
important roles in host defense and immunoregulation (44). More specifically, STAT3 localizes
to mitochondria where it promotes oxidative phosphorylation and
membrane permeability (45). This
effect is dependent on serine phosphorylation, not tyrosine
phosphorylation. STATs are considered to be associated with
environments where cellular respiration is changed, including
cellular stress and cancer (46).
Consecutive activation of JAKs and STATs was
discovered and shown to be associated with malignancies in the
1990s (47). STAT hyperactivity,
typically including STAT3 and STAT5, is considered to be able to
induce cellular transformation downstream of classic oncogenic
markers, such as BCR-ABL, Src and Ras. STAT hyperactivity is also
recog-nized as a defining characteristic of most solid and blood
malignancies (48). JAK1 mutation
was revealed to be associated with the development of acute myeloid
leukemia (49). Following
knockdown of leukemia inhibitory factor receptor, phosphorylation
of JAK1 was increased and promoted HCC metastasis (50). Long non-coding RNA 00152 was
reported to activate the JAK2-STAT3 signaling pathway to promote
the development of HCC (51).
JAK2/STAT3 signaling was reported to be activated by long
non-coding RNA HOST2 and linked to epithelial-mesenchymal
transition, proliferation, migration and invasion capacity of HCC
cells (52). An increased protein
level of JAK3 was observed when evaluating the anti-tumor
immunostimulatory activity of polysaccharides from Salvia
chinensis Benth in mice bearing HCC cells (53). TYK2/STAT3 signaling was previously
reported to be associated with poor prognosis of HCC via high
expression of claudin-17 (54).
STAT1 was reported reduce the growth ability of HepG2 cell by
regulating p53-mediated cell cycling and apoptosis (55). STAT1 and STAT2 were demonstrated to
decrease the growth capacity of HepG2 cells via increased
expression stimulated by phosphatidyl-ethanolamine (56). The rs7574865 polymorphism in STAT4
was found to be a risk factor for HCC in a meta-analysis (57). Additionally, somatic mutation of
JAK2 was found to be associated with a number of hematologic tumors
(58,59), while gain-of-function JAK2
mutations are involved in myeloproliferative malignancies (60). JAK3 mutations were found to be
associated with leukemia and lymphoma (58), and secondary mutations in JAK3 were
identified in juvenile myelomonocytic leukemia. Furthermore, JAK3
is considered to be associated with disease progression (61). Mutations in JAK3 and TYK2 have been
reported to be associated with primary immunodeficiency, such as
severe combined immune deficiency (44). While patients with STAT1 mutations
are susceptible to mycobacterial and virus infections, STAT2
mutations predispose patients to virus infection, and individuals
with STAT3 mutations are susceptible to fungal infection (44). It is well established that STATs
can directly bind to DNA and, thus, function as classical
transcription factors (62). This
is in line with the GSEA results of the present study that showed
that STATs are involved in DNA replication and replication
fork.
Next-generation sequencing has led to an explosion
of genome-wide association studies (GWAS) in which disease
occurrence has been associated with single nucleotide polymorphisms
(SNPs) in affected populations (63). As such, GWAS technology has
identified SNPs within STAT genes, with STAT3 SNPs associated with
Crohn's disease, psoriasis and ankylosing spondylitis, STAT4 SNPs
associated with rheumatoid arthritis, Crohn's disease, systemic
lupus erythematosus and Sjogren's syndrome, and STAT6 SNPs
associated with asthma (62). SNPs
in STAT3 have been identified to be associated with Crohn's
disease, Sjogren's syndrome and systemic lupus erythematosus, while
SNPs in STAT6 have been associated with asthma (64,65).
JAK2/STAT5A/B signaling tends to promote metastatic progression of
prostate cancer by inducing epithelial-mesenchymal transition and
stem cell properties (66).
Additionally, interleukin 17 stimulates a REG3β/JAK2/STAT3
inflammatory pathway seems to promote the transition from chronic
pancreatitis to pancreatic cancer (67).
GSEA in the current study explored specific
mechanism, demonstrating that STAT6 is involved in the cell cycle,
DNA replication and lipid metabolism, which is in agreement with
results of KEGG pathway. High expression of STAT3 indicated a poor
prognosis for HCC in multivariate analysis, which is in line with
exiting studies (68-70). Existing evidence also indicates
that STAT6 is involved in the development of HCC and could serve as
a predictor of poor prognosis for patients with HCC (71). In the present study, high
expression of STAT6 serves as a predictor of good prognosis. Unlike
the results of Shi et al (72) in which JAK2 deficiency in mice had
a protective role against HCC, the results of the current study
indicated that high expression of JAK2 actually provides protection
against HCC. Therefore, further studies are needful to further
explore specific mechanisms of JAK2 in cancer. In addition,
diagnostic ability analysis was performed to demonstrate that JAK2,
TYK2, STAT3, STAT4 and STAT5B may serve as potential diagnostic
biomarkers, which has not been examined previously.
In the validation cohort analyzed via RT-qPCR, three
genes, JAK2, STAT5A and STAT6, consistently
showed elevated expression in tumor tissues compared with in
non-tumor tissues. Nonetheless, these results were not consistent
with previous results in the GSE14520 and TCGA cohorts. Racial
difference, patient numbers and unknown differences in the
clinicopathological characteristics may be the main factors causing
this inconsistency.
The present study had some limitations that should
be recognized. Firstly, there should be additional datasets used to
validate these findings. Additionally, further investigation should
use a multi-centre and multi-racial validation cohort to explore
clinical significance. Finally, there is a need to designate for
functional trials to investigate the mechanisms that JAK2, STAT5A
and STAT6 are involved in, including the proliferation, invasion
and metastasis ability of HCC.
The present study revealed that genes in JAK/STAT
signaling pathway have diagnostic and prognostic clinical
significance for HCC. In particular, JAK2, TYK2, STAT3, STAT4 and
STAT5B may be potential diagnostic biomarkers for HCC. Meanwhile,
JAK2, STAT5A and STAT6 may be potential prognostic biomarkers for
HCC. A combination analysis of multiple genes for diagnosis and
prognosis has advantages over any one gene alone. Additionally,
molecular mechanism exploration using GSEA indicated that STAT6 was
enriched in cell cycle, cell division, fatty acid metabolism, drug
metabolism cytochrome P450 and in the PPAR signaling pathway.
Nomograms and risk score models were generated for HCC prognosis
prediction. STAT6 was differentially expressed between tumor and
non-tumor tissues in the validation cohort, which confirmed the
result from the GSE14520 cohort. In future studies, well-designed
functional trials are required to confirm the mechanisms by which
these genes are involved in HCC development, particularly
STAT6.
Supplementary Data
Abbreviations:
|
HCC
|
hepatocellular carcinoma
|
|
JAK
|
Janus kinase
|
|
STAT
|
signal transducer and activator of
transcription
|
|
HBV
|
hepatitis B virus
|
|
TCGA
|
The Cancer Genome Atlas
|
|
BCLC
|
Barcelona Clinic Liver Cancer
|
|
KEGG
|
Kyoto Encyclopedia of Genes and
Genomes
|
|
GSEA
|
gene set enrichment analysis
|
|
BP
|
biological process
|
|
CC
|
cellular component
|
|
MF
|
molecular function
|
|
GO
|
gene ontology
|
|
OS
|
overall survival
|
|
MST
|
median survival time
|
|
CI
|
confidence interval
|
|
HR
|
hazard ratio
|
|
ROC
|
receiver operating characteristic
|
|
PPI
|
protein-protein interaction
|
Acknowledgments
The authors would like to acknowledge researchers
for their contribution on open access of GEPIA, STRING and The
Human Protein Atlas website and thank Professor Minhao Peng,
Professor Kaiyin Xiao, Professor Ya Guo and Professor Xigang Chen,
and Dr Xinping Ye, Dr Zhang Wen and Dr Bin Chen for providing HCC
samples.
Funding
This work was supported in part by the National
Nature Science Foundation of China (grant nos. 81560535, 81072321,
30760243, 30460143, 30560133 and 81802874), Natural Science
Foundation of Guangxi Province of China (grant nos. 2017JJB140189y
and 2018GXNSFAA050119), Key Laboratory of High-Incidence-Tumor
Prevention & Treatment (Guangxi Medical University), Ministry
of Education (grant nos. GKE2018-01 and GKE2019-11), 2009 Program
for New Century Excellent Talents in University, Guangxi Nature
Sciences Foundation (grant no. GuiKeGong 1104003A-7) and Guangxi
Health Ministry Medicine Grant (Key-Scientific Research-Grant grant
no. Z201018). The present study was also partially supported by
Scientific Research Fund of the Health and Family Planning
Commission of Guangxi Zhuang Autonomous Region (grant no.
Z2016318), The Basic Ability Improvement Project for Middle-aged
and Young Teachers in Colleges and Universities in Guangxi (grant
no. 2018KY0110), 2018 Innovation Project of Guangxi Graduate
Education (grant no. YCBZ2018036). The present study was also
partially supported by Research Institute of Innovative Think-tank
in Guangxi Medical University (The gene-environment interaction in
hepatocarcinogenesis in Guangxi HCCs and its translational
applications in the HCC prevention). The authors also acknowledge
the support of the National Key Clinical Specialty Programs
(General Surgery & Oncology) and the Key Laboratory of Early
Prevention & Treatment for Regional High-Incidence-Tumor
(Guangxi Medical University), Ministry of Education, China.
Availability of data and materials
The datasets analyzed during the current study are
available from the corresponding author on reasonable request.
Author contributions
XW and TP designed this manuscript; XL, TY, YG, LZ,
CH, JH, LY, CY, GZ, WQ, ZL, XZ, JL, QH and TP conducted the study
and analyzed the data. XZ wrote the manuscript and TP guided the
writing.
Ethics approval and patient consent to
participate
This study was approved by the Ethical Review
Committee of the First Affiliated Hospital of Guangxi Medical
University [approval no. 2015 (KY-E-032)]. Informed consent was
signed by all patients.
Patient consent for publication
Not applicable.
Competing interests
The authors declare that they have no competing
interests.
References
|
1
|
Forner A, Llovet JM and Bruix J:
Hepatocellular carcinoma. Lancet. 379:1245–1255. 2012. View Article : Google Scholar : PubMed/NCBI
|
|
2
|
Delgado TC, Barbier-Torres L,
Zubiete-Franco I, Lopitz-Otsoa F, Varela-Rey M, Fernández-Ramos D
and Martínez-Chantar ML: Neddylation, a novel paradigm in liver
cancer. Transl Gastroenterol Hepatol. 3:372018. View Article : Google Scholar : PubMed/NCBI
|
|
3
|
Gerbes A, Zoulim F, Tilg H, Dufour JF,
Bruix J, Paradis V, Salem R, Peck-Radosavljevic M, Galle PR, Greten
TF, et al: Gut roundtable meeting paper: Selected recent advances
in hepatocellular carcinoma. Gut. 67:380–388. 2018. View Article : Google Scholar :
|
|
4
|
Forner A, Gilabert M, Bruix J and Raoul
JL: Treatment of intermediate-stage hepatocellular carcinoma. Nat
Rev Clin Oncol. 11:525–535. 2014. View Article : Google Scholar : PubMed/NCBI
|
|
5
|
Bruix J, Han KH, Gores G, Llovet JM and
Mazzaferro V: Liver cancer: Approaching a personalized care. J
Hepatol. 62(1 Suppl): S144–S156. 2015. View Article : Google Scholar : PubMed/NCBI
|
|
6
|
Llovet JM, Real MI, Montaña X, Planas R,
Coll S, Aponte J, Ayuso C, Sala M, Muchart J, Solà R, et al:
Arterial embolisation or chemoembolisation versus symptomatic
treatment in patients with unresectable hepatocellular carcinoma: A
randomised controlled trial. Lancet. 359:1734–1739. 2002.
View Article : Google Scholar : PubMed/NCBI
|
|
7
|
Lepage C, Bossard N, Dejardin O,
Carmona-Garcia MC, Manfredi S and Faivre J; GRELL EUROCARE-5
Working Group: Trends in net survival from rectal cancer in six
European Latin countries: Results from the SUDCAN population-based
study. Eur J Cancer Prev. 26:S48–S55. 2017. View Article : Google Scholar
|
|
8
|
Nault JC, Mallet M, Pilati C, Calderaro J,
Bioulac-Sage P, Laurent C, Laurent A, Cherqui D, Balabaud C and
Zucman-Rossi J: High frequency of telomerase reverse-transcriptase
promoter somatic mutations in hepatocellular carcinoma and
preneoplastic lesions. Nat Commun. 4:22182013. View Article : Google Scholar : PubMed/NCBI
|
|
9
|
Dhanasekaran R, Bandoh S and Roberts LR:
Molecular pathogenesis of hepatocellular carcinoma and impact of
therapeutic advances. F1000. Res. 5:F10002016.
|
|
10
|
Hussain SP, Schwank J, Staib F, Wang XW
and Harris CC: TP53 mutations and hepatocellular carcinoma:
Insights into the etiology and pathogenesis of liver cancer.
Oncogene. 26:2166–2176. 2007. View Article : Google Scholar : PubMed/NCBI
|
|
11
|
Bromberg JF: Activation of STAT proteins
and growth control. Bioessays. 23:161–169. 2001. View Article : Google Scholar : PubMed/NCBI
|
|
12
|
Kisseleva T, Bhattacharya S, Braunstein J
and Schindler CW: Signaling through the JAK/STAT pathway, recent
advances and future challenges. Gene. 285:1–24. 2002. View Article : Google Scholar : PubMed/NCBI
|
|
13
|
Wormald S and Hilton DJ: Inhibitors of
cytokine signal transduction. J Biol Chem. 279:821–824. 2004.
View Article : Google Scholar
|
|
14
|
Krebs DL and Hilton DJ: SOCS proteins:
Negative regulators of cytokine signaling. Stem Cells. 19:378–387.
2001. View Article : Google Scholar : PubMed/NCBI
|
|
15
|
Larsen L and Röpke C: Suppressors of
cytokine signalling: SOCS. APMIS. 110:833–844. 2002. View Article : Google Scholar
|
|
16
|
Poussin K, Pilati C, Couchy G, Calderaro
J, Bioulac-Sage P, Bacq Y, Paradis V, Leteurtre E, Sturm N, Ramos
J, et al: Biochemical and functional analyses of gp130 mutants
unveil JAK1 as a novel therapeutic target in human inflammatory
hepa-tocellular adenoma. Oncoimmunology. 2:e270902013. View Article : Google Scholar
|
|
17
|
Kang FB, Wang L, Jia HC, Li D, Li HJ,
Zhang YG and Sun DX: B7-H3 promotes aggression and invasion of
hepatocellular carcinoma by targeting epithelial-to-mesenchymal
transition via JAK2/STAT3/Slug signaling pathway. Cancer Cell Int.
15:452015. View Article : Google Scholar : PubMed/NCBI
|
|
18
|
Ji Y, Wang Z, Li Z, Li K, Le X and Zhang
T: Angiotensin II induces angiogenic factors production partly via
AT1/JAK2/STAT3/SOCS3 signaling pathway in MHCC97H cells. Cell
Physiol Biochem. 29:863–874. 2012. View Article : Google Scholar : PubMed/NCBI
|
|
19
|
Yoshikawa H, Matsubara K, Qian GS, Jackson
P, Groopman JD, Manning JE, Harris CC and Herman JG: SOCS-1, a
negative regulator of the JAK/STAT pathway, is silenced by
methylation in human hepatocellular carcinoma and shows
growth-suppression activity. Nat Genet. 28:29–35. 2001. View Article : Google Scholar : PubMed/NCBI
|
|
20
|
Livak KJ and Schmittgen TD: Analysis of
relative gene expression data using real-time quantitative PCR and
the 2(-Delta Delta C(T)) method. Methods. 25:402–408. 2001.
View Article : Google Scholar
|
|
21
|
Roessler S, Jia HL, Budhu A, Forgues M, Ye
QH, Lee JS, Thorgeirsson SS, Sun Z, Tang ZY, Qin LX and Wang XW: A
unique metastasis gene signature enables prediction of tumor
relapse in early-stage hepatocellular carcinoma patients. Cancer
Res. 70:10202–10212. 2010. View Article : Google Scholar : PubMed/NCBI
|
|
22
|
Roessler S, Long EL, Budhu A, Chen Y, Zhao
X, Ji J, Walker R, Jia HL, Ye QH, Qin LX, et al: Integrative
genomic identification of genes on 8p associated with
hepatocellular carcinoma progression and patient survival.
Gastroenterology. 142:957–966.e12. 2012. View Article : Google Scholar :
|
|
23
|
Tang Z, Li C, Kang B, Gao G, Li C and
Zhang Z: GEPIA: A web server for cancer and normal gene expression
profiling and interactive analyses. Nucleic Acids Res. 45:W98–W102.
2017. View Article : Google Scholar : PubMed/NCBI
|
|
24
|
Subramanian A, Tamayo P, Mootha VK,
Mukherjee S, Ebert BL, Gillette MA, Paulovich A, Pomeroy SL, Golub
TR, Lander ES and Mesirov JP: Gene set enrichment analysis: A
knowledge-based approach for interpreting genome-wide expression
profiles. Proc Natl Acad Sci USA. 102:15545–15550. 2005. View Article : Google Scholar : PubMed/NCBI
|
|
25
|
Mootha VK, Lindgren CM, Eriksson KF,
Subramanian A, Sihag S, Lehar J, Puigserver P, Carlsson E,
Ridderstråle M, Laurila E, et al: PGC-1alpha-responsive genes
involved in oxida-tive phosphorylation are coordinately
downregulated in human diabetes. Nat Genet. 34:267–273. 2003.
View Article : Google Scholar : PubMed/NCBI
|
|
26
|
Lossos IS, Czerwinski DK, Alizadeh AA,
Wechser MA, Tibshirani R, Botstein D and Levy R: Prediction of
survival in diffuse large-B-cell lymphoma based on the expression
of six genes. N Engl J Med. 350:1828–1837. 2004. View Article : Google Scholar : PubMed/NCBI
|
|
27
|
Alizadeh AA, Gentles AJ, Alencar AJ, Liu
CL, Kohrt HE, Houot R, Goldstein MJ, Zhao S, Natkunam Y, Advani RH,
et al: Prediction of survival in diffuse large B-cell lymphoma
based on the expression of 2 genes reflecting tumor and
microenvironment. Blood. 118:1350–1358. 2011. View Article : Google Scholar : PubMed/NCBI
|
|
28
|
Wang X, Huang K, Zeng X, Liu Z, Liao X,
Yang C, Yu T, Han C, Zhu G, Qin W and Peng T: Diagnostic and
prognostic value of mRNA expression of phospholipase C β family
genes in hepatitis B virusassociated hepatocellular carcinoma.
Oncol Rep. 41:2855–2875. 2019.PubMed/NCBI
|
|
29
|
Shannon P, Markiel A, Ozier O, Baliga NS,
Wang JT, Ramage D, Amin N, Schwikowski B and Ideker T: Cytoscape: A
software environment for integrated models of biomolecular
interaction networks. Genome Res. 13:2498–2504. 2003. View Article : Google Scholar : PubMed/NCBI
|
|
30
|
Montojo J, Zuberi K, Rodriguez H, Kazi F,
Wright G, Donaldson SL, Morris Q and Bader GD: GeneMANIA Cytoscape
plugin: Fast gene function predictions on the desktop.
Bioinformatics. 26:2927–2928. 2010. View Article : Google Scholar : PubMed/NCBI
|
|
31
|
Maere S, Heymans K and Kuiper M: BiNGO: A
Cytoscape plugin to assess overrepresentation of gene ontology
categories in biological networks. Bioinformatics. 21:3448–3449.
2005. View Article : Google Scholar : PubMed/NCBI
|
|
32
|
Szklarczyk D, Morris JH, Cook H, Kuhn M,
Wyder S, Simonovic M, Santos A, Doncheva NT, Roth A, Bork P, et al:
The STRING database in 2017: Quality-controlled protein-protein
association networks, made broadly accessible. Nucleic Acids Res.
45:D362–D368. 2017. View Article : Google Scholar
|
|
33
|
Cai B, Cai JP, Luo YL, Chen C and Zhang S:
The specific roles of JAK/STAT signaling pathway in sepsis.
Inflammation. 38:1599–1608. 2015. View Article : Google Scholar : PubMed/NCBI
|
|
34
|
Wu HP, Wu CL, Chen CK, Chung K, Tseng JC,
Liu YC and Chuang DY: The interleukin-4 expression in patients with
severe sepsis. J Crit Care. 23:519–524. 2008. View Article : Google Scholar : PubMed/NCBI
|
|
35
|
Steinhauser ML, Hogaboam CM, Lukacs NW,
Strieter RM and Kunkel SL: Multiple roles for IL-12 in a model of
acute septic peritonitis. J Immunol. 162:5437–5443. 1999.PubMed/NCBI
|
|
36
|
Song GY, Chung CS, Chaudry IH and Ayala A:
What is the role of interleukin 10 in polymicrobial sepsis:
Anti-inflammatory agent or immunosuppressant? Surgery. 126:378–383.
1999. View Article : Google Scholar : PubMed/NCBI
|
|
37
|
Nijsten MW, Hack CE, Helle M, ten Duis HJ,
Klasen HJ and Aarden LA: Interleukin-6 and its relation to the
humoral immune response and clinical parameters in burned patients.
Surgery. 109:761–767. 1991.PubMed/NCBI
|
|
38
|
Heinzel FP: The role of IFN-gamma in the
pathology of experimental endotoxemia. J Immunol. 145:2920–2924.
1990.PubMed/NCBI
|
|
39
|
Jaime-Figueroa S, De Vicente J, Hermann J,
Jahangir A, Jin S, Kuglstatter A, Lynch SM, Menke J, Niu L, Patel
V, et al: Discovery of a series of novel
5H-pyrrolo[2,3-b]pyrazine-2-phenyl ethers, as potent JAK3 kinase
inhibitors. Bioorg Med Chem Lett. 23:2522–2526. 2013. View Article : Google Scholar : PubMed/NCBI
|
|
40
|
O'Shea JJ, Pesu M, Borie DC and Changelian
PS: A new modality for immunosuppression: Targeting the JAK/STAT
pathway. Nat Rev Drug Discov. 3:555–564. 2004. View Article : Google Scholar : PubMed/NCBI
|
|
41
|
Olsen JV, Blagoev B, Gnad F, Macek B,
Kumar C, Mortensen P and Mann M: Global, in vivo, and site-specific
phosphorylation dynamics in signaling networks. Cell. 127:635–648.
2006. View Article : Google Scholar : PubMed/NCBI
|
|
42
|
Barahmand-Pour F, Meinke A, Groner B and
Decker T: Jak2-Stat5 interactions analyzed in yeast. J Biol Chem.
273:12567–12575. 1998. View Article : Google Scholar : PubMed/NCBI
|
|
43
|
Gupta S, Yan H, Wong LH, Ralph S,
Krolewski J and Schindler C: The SH2 domains of Stat1 and Stat2
mediate multiple interactions in the transduction of IFN-alpha
signals. EMBO J. 15:1075–1084. 1996. View Article : Google Scholar : PubMed/NCBI
|
|
44
|
O'Shea JJ, Holland SM and Staudt LM: JAKs
and STATs in immunity, immunodeficiency, and cancer. N Engl J Med.
368:161–170. 2013. View Article : Google Scholar : PubMed/NCBI
|
|
45
|
O'Shea JJ, Schwartz DM, Villarino AV,
Gadina M, Mcinnes IB and Laurence A: The JAK-STAT pathway: Impact
on human disease and therapeutic intervention. Annu Rev Med.
66:311–328. 2015. View Article : Google Scholar : PubMed/NCBI
|
|
46
|
Meier JA and Larner AC: Toward a new
STATe: The role of STATs in mitochondrial function. Semin Immunol.
26:20–28. 2014. View Article : Google Scholar : PubMed/NCBI
|
|
47
|
Leonard WJ and O'Shea JJ: Jaks and STATs:
Biological implications. Annu Rev Immunol. 16:293–322. 1998.
View Article : Google Scholar : PubMed/NCBI
|
|
48
|
Bromberg J: Stat proteins and oncogenesis.
J Clin Invest. 109:1139–1142. 2002. View Article : Google Scholar : PubMed/NCBI
|
|
49
|
Xiang Z, Zhao Y, Mitaksov V, Fremont DH,
Kasai Y, Molitoris A, Ries RE, Miner TL, McLellan MD, DiPersio JF,
et al: Identification of somatic JAK1 mutations in patients with
acute myeloid leukemia. Blood. 111:4809–4812. 2008. View Article : Google Scholar
|
|
50
|
Luo Q, Wang C, Jin G, Gu D, Wang N, Song
J, Jin H, Hu F, Zhang Y, Ge T, et al: LIFR functions as a
metastasis suppressor in hepatocellular carcinoma by negatively
regulating phosphoinositide 3-kinase/AKT pathway. Carcinogenesis.
36:1201–1212. 2015. View Article : Google Scholar : PubMed/NCBI
|
|
51
|
Li SJ, Sui MH, Sun ZX and Zhang WW: LncRNA
00152 promotes the development of hepatocellular carcinoma by
activating JAK2/STAT3 pathway. Eur Rev Med Pharmacol Sci.
23:1038–1046. 2019.PubMed/NCBI
|
|
52
|
Wu Y, Yuan T, Wang WW, Ge PL, Gao ZQ,
Zhang G, Tang Z, Dang XW, Zhao YF, Zhang JY and Jiang GZ: Long
noncoding RNA HOST2 promotes epithelial-mesenchymal transition,
proliferation, invasion and migration of hepatocellular carcinoma
cells by activating the JAK2-STAT3 signaling pathway. Cell Physiol
Biochem. 51:301–314. 2018. View Article : Google Scholar : PubMed/NCBI
|
|
53
|
Shu G, Zhao W, Yue L, Su H and Xiang M:
Antitumor immu-nostimulatory activity of polysaccharides from
Salvia chinensis Benth. J Ethnopharmacol. 168:237–247. 2015.
View Article : Google Scholar : PubMed/NCBI
|
|
54
|
Sun L, Feng L and Cui J: Increased
expression of claudin-17 promotes a malignant phenotype in
hepatocyte via Tyk2/Stat3 signaling and is associated with poor
prognosis in patients with hepatocellular carcinoma. Diagn Pathol.
13:722018. View Article : Google Scholar : PubMed/NCBI
|
|
55
|
Chen G, Wang H, Xie S, Ma J and Wang G:
STAT1 negatively regulates hepatocellular carcinoma cell
proliferation. Oncol Rep. 29:2303–2310. 2013. View Article : Google Scholar : PubMed/NCBI
|
|
56
|
Liu LY, Huang C, Li ZF, Wang AY, Hu XY, Ni
L, Yu L and Song TS: STAT1 and STAT2 participate in growth
inhibition of human hepatoma HepG2 cells induced by
phosphatidyletha-nolamine. Nan Fang Yi Ke Da Xue Xue Bao.
31:256–258. 2011.In Chinese. PubMed/NCBI
|
|
57
|
Zhang L, Xu K, Liu C and Chen J:
Meta-analysis reveals an association of signal transducer and
activator of transcription-4 polymorphism with hepatocellular
carcinoma risk. Hepatol Res. 47:303–311. 2017. View Article : Google Scholar
|
|
58
|
Tefferi A: JAK and MPL mutations in
myeloid malignancies. Leuk Lymphoma. 49:388–397. 2008. View Article : Google Scholar : PubMed/NCBI
|
|
59
|
Scott LM: The JAK2 exon 12 mutations: A
comprehensive review. Am J Hematol. 86:668–676. 2011. View Article : Google Scholar : PubMed/NCBI
|
|
60
|
Levine RL, Pardanani A, Tefferi A and
Gilliland DG: Role of JAK2 in the pathogenesis and therapy of
myeloproliferative disorders. Nat Rev Cancer. 7:673–683. 2007.
View Article : Google Scholar : PubMed/NCBI
|
|
61
|
Sakaguchi H, Okuno Y, Muramatsu H, Yoshida
K, Shiraishi Y, Takahashi M, Kon A, Sanada M, Chiba K, Tanaka H, et
al: Exome sequencing identifies secondary mutations of SETBP1 and
JAK3 in juvenile myelomonocytic leukemia. Nat Genet. 45:937–941.
2013. View Article : Google Scholar : PubMed/NCBI
|
|
62
|
Villarino AV, Kanno Y, Ferdinand JR and
O'Shea JJ: Mechanisms of Jak/STAT signaling in immunity and
disease. J Immunol. 194:21–27. 2015. View Article : Google Scholar :
|
|
63
|
Manolio TA: Bringing genome-wide
association findings into clinical use. Nat Rev Genet. 14:549–558.
2013. View Article : Google Scholar : PubMed/NCBI
|
|
64
|
O'Shea JJ, Lahesmaa R, Vahedi G, Laurence
A and Kanno Y: Genomic views of STAT function in CD4+ T helper cell
differentiation. Nat Rev Immunol. 11:239–250. 2011. View Article : Google Scholar : PubMed/NCBI
|
|
65
|
Vercelli D: Discovering susceptibility
genes for asthma and allergy. Nat Rev Immunol. 8:169–182. 2008.
View Article : Google Scholar : PubMed/NCBI
|
|
66
|
Talati PG, Gu L, Ellsworth EM, Girondo MA,
Trerotola M, Hoang DT, Leiby B, Dagvadorj A, McCue PA, Lallas CD,
et al: Jak2-stat5a/b signaling induces epithelial-to-mesenchymal
transition and stem-like cell properties in prostate cancer. Am J
Pathol. 185:2505–2522. 2015. View Article : Google Scholar : PubMed/NCBI
|
|
67
|
Loncle C, Bonjoch L, Folch-Puy E,
Lopez-Millan MB, Lac S, Molejon MI, Chuluyan E, Cordelier P, Dubus
P, Lomberk G, et al: IL-17 functions through the novel
REG3β-JAK2-STAT3 inflammatory pathway to promote the transition
from chronic pancreatitis to pancreatic cancer. Cancer Res.
75:4852–4862. 2015. View Article : Google Scholar : PubMed/NCBI
|
|
68
|
Calvisi DF, Ladu S, Gorden A, Farina M,
Conner EA, Lee JS, Factor VM and Thorgeirsson SS: Ubiquitous
activation of ras and Jak/stat pathways in human HCC.
Gastroenterology. 130:1117–1128. 2006. View Article : Google Scholar : PubMed/NCBI
|
|
69
|
Spannbauer MM and Trautwein C: Frequent
in-frame somatic deletions activate gp130 in inflammatory
hepatocellular tumors. Hepatology. 49:1387–1389. 2009. View Article : Google Scholar : PubMed/NCBI
|
|
70
|
He G and Karin M: NF-kB and STAT3-key
players in liver inflammation and cancer. Cell Res. 21:159–168.
2011. View Article : Google Scholar
|
|
71
|
Liao Y, Cai B, Li Y and Wang L: P0360:
STAT6 rs3024974 might predict worse prognosis in hepatocellular
carcinoma patients. J Hepatol. 62(Suppl 2): S445–S446. 2015.
View Article : Google Scholar
|
|
72
|
Shi SY, Schroer SA, Luk CT, Kim MJ,
Dodington DW, Sivasubramaniyam T, Lin L, Cai EP, Lu SY, Wagner KU,
et al: Janus kinase 2 (JAK2) dissociates hepatosteatosis from
hepatocellular carcinoma in mice. J Biol Chem. 292:3789–3799. 2017.
View Article : Google Scholar : PubMed/NCBI
|