Introduction
Breast cancer is a highly prevalent malignancy in
women; however, its exact etiology and the mechanisms underlying
breast carcinogenesis remain elusive. Notably, the incidence of
breast cancer is increasing annually, and it is a highly
heterogeneous disease at the molecular level (1,2).
Perou et al (3) analyzed
the gene expression patterns of 65 breast cancer specimens using a
cDNA microarray that contained 8,102 genes, and 65 specimens of
breast cancer were divided into five subtypes on the basis of
further screening as follows: Luminal A, luminal B, human epidermal
growth factor receptor (HER)-2-overexpressing, triple-negative
breast cancer (TNBC) and normal-like breast cancer. Furthermore,
20-25% of patients with breast cancer have HER-2 gene mutations and
exhibit HER-2 overexpression, which is a characteristic closely
associated with resistance to treatment and poor prognosis
(4,5).
Trastuzumab (Herceptin®; Genentech,
Inc.), the first humanized monoclonal antibody (immunoglobulin G1),
binds directly to the extracellular domain of the HER-2 protein and
has been proven to be beneficial for patients with HER-2-positive
early-stage breast cancer, as well as metastatic breast cancer
(6-8). Compared with chemotherapy alone,
trastuzumab combined with chemotherapy can prolong time-to-tumor
progression, increase objective response rate and prolong overall
survival (9). However, a number of
HER-2-positive patients do not benefit from trastuzumab, due to
drug resistance (10). In
addition, patients with HER-2-positive breast cancer have higher
metastasis and recurrence rates, and a shorter survival time
(11). Therefore, it is necessary
to develop more effective medicines and identify novel therapeutic
targets for the treatment of HER-2-positive breast cancer.
TNBC has the worst prognosis among all types of
breast cancer (12). Due to its
refractoriness to current clinical estrogen and targeted therapies,
it has a high rate of distant metastasis, recurrence and mortality
(13,14). To investigate the poorer prognosis
of TNBC and HER-2-positive breast cancer, this study compared the
invasion and migration of SK-BR-3 and MDA-MB-231 cells, and
observed the difference in the ratio of
CD44+/CD24-/low cells between SK-BR-3 and
MDA-MB-231 cells. The results demonstrated that the invasiveness
and migration of SK-BR-3 and MDA-MB-231 cells were prominent;
however, the CD44+/CD24−/low ratio was almost
0 in SK-BR-3 cells, whereas the proportion of
CD44+/CD24−/low cells was >90% among
MDA-MB-231 cells. Based on these results, it was hypothesized that
there may be other cancer stem cells (CSCs) markers in SK-BR-3
cells. The transcriptome links the genetic information of the
genome with the biological function of the proteome, and it also
forms the basis and starting point for the study of gene function
and structure (15,16). In the present study, SK-BR-3 and
MDA-MB-231 cells were sequenced and analyzed in order to identify
novel CSC markers and design new therapeutic strategies for the
treatment of HER-2-positive breast cancer.
Materials and methods
Cell culture
The human normal breast cell line MCF-10A, and human
breast cancer cell lines MCF-7 and MDA-MB-231 were purchased from
the Shanghai Cell Bank, Chinese Academy of Sciences. The human
breast cancer cell line SK-BR-3 was obtained from the Kunming Cell
Bank, Chinese Academy of Sciences. MCF-10A cells were cultured in
DMEM/F12 supplemented with 5% horse serum, 10 µg/ml insulin,
20 ng/ml epidermal growth factor, 100 ng/ml cholera toxin and 0.5
µg/ml hydrocortisone (all Sigma-Aldrich; Merck KGaA). The
other breast cancer cell lines were cultured in DMEM or RPMI-1640
McCoy's 5A medium (HyClone; GE Healthcare Life Sciences)
supplemented with 10% fetal bovine serum (FBS; Gibco, Thermo Fisher
Scientific, Inc.), 1% penicillin and streptomycin at 37°C in an
incubator containing 5% CO2.
Flow cytometry
Cells were collected by trypsinization, centrifuged
at 800 x g for 5 min and washed twice with phosphate-buffered
saline (PBS). Subsequently, 5×10⁵ cells were resuspended
in 100 µl PBS containing 5 µl CD44-PE (cat. no.
ab46793; 1:20; Abcam) and CD24-FITC antibodies (cat. no. ab30350;
1:20; Abcam) at 4°C for 30 min. After the cells were washed with
PBS, PBS was added to the cells to obtain a total volume 500
µl, and the stained cells were performed by BD FACS Canto
flow cytometry (BD Biosciences). The data were analyzed using
FlowJo (Tree Star, Inc.).
Cell migration and invasion assays
For the cell migration assays, a 8-µm pore
Transwell chamber (EMD Millipore) was inserted into 24-well plates.
A total of 600 µl complete medium supplemented with 10% FBS
was added to the lower chamber. A total of 2×10⁴
cells/well suspended in 200 µl complete FBS-free medium
(DMEM or RPMI-1640) were seeded into the upper chamber. After cells
were cultured for 24 h, the non-migrated cells were removed from
the top surface of the membrane using a cotton swab. The migrated
cells that adhered to the permeable membrane were fixed with 4%
formalin at room temperature for 30 min and stained with 0.1%
crystal violet solution at room temperature for 15-20 min. The
cells were then observed under an inverted light microscope and
were counted in 10 random fields of view. The cell invasion assay
was conducted in a similar manner to the migration assay, with the
exception that the membrane was coated with Matrigel (BD
Bioscience) and the cells were cultured for 24 h.
Serum-free suspension culture of breast
cancer cell lines
The SK-BR-3 and MDA-MB-231 cells were incubated in
RPMI-1640 McCoy's 5A medium (including 2% B27, 20 ng/ml epidermal
growth factor and 10 ng/ml fibroblast growth factor; Sigma-Aldrich;
Merck KGaA) without serum suspension, and were incubated at 37°C in
an atmosphere containing 5% CO2. The culture was gently
oscillated twice a day and the medium was changed every 3 days,
followed by gentle centrifugation (200 x g, 5 min) and collection
of the microspheres. The microspheres were observed under an
inverted light microscope.
Transcriptome sequencing
Total RNA was extracted from the cells using
fast2000 kit (Fast Agen) and RNA was treated with DNase I
(1U/µl, Thermo Fisher Scientific, USA). Magnetic beads with
Oligo (dT) were used to enrich mRNA. Fragmentation buffer was used
to obtain short fragments of mRNA (17). cDNA was then synthesized using the
mRNA fragments as templates with the Agencourt AMPure XP Kit
(Beckman Coulter, Inc.), according to the manufacturer's protocol.
Short fragments were purified and recycled with EB buffer for end
reparation and base ‘A' addition (17). Subsequently, the 200-500 bp size of
the fragments was selected for polymerase chain reaction (PCR)
amplification as follows: 98°C for 30 sec, one cycle; 98°C for 10
sec, 15 cycles; 60°C for 30 sec, 72°C for 30 sec and last cycle at
72°C for 5 min. During the quality control (QC) steps, the
constructed library was qualified and quantified by Agilent 2100
Bioanalyzer (Agilent Technologies, Inc.) and ABI StepOnePlus
Real-Time PCR system (Applied Biosystems; Thermo Fisher Scientific,
Inc.) quality inspection. Finally, Illumina HiSeq™ 2000 (Illumina,
Inc.) was used for sequencing (Beijing Genomics Institute).
Bioinformatics analysis
Primary sequencing data obtained from Illumina
HiSeq™ 2000 sequencing were referred to as raw reads. After
filtering, clean reads were obtained and were used for downstream
bioinformatics analysis. We performed quality control (QC) on clean
data through drawing a base composition chart and quality
distribution chart. After passing QC, cleans reads were aligned to
the human genome (hg19) using BWA software (18), gene expression levels were
quantified by a software package: RSEM (RNASeq by Expectation
Maximization) (17). The
differentially expressed genes (DEGs) between SK-BR-3 and
MDA-MB-231 cells were screened using the Poisson distribution
(19). In addition, Gene Ontology
(GO) enrichment analysis involved the mapping of all DEGs to GO
terms in the database (http://www.geneontology.org/), calculating gene
numbers for every term. Then, the hypergeo-metric test was employed
to identify significantly enriched GO terms in the input list of
DEGs (20). Kyoto Encyclopedia of
Genes and Genomes (KEGG) was used to perform pathway enrichment
analysis of DEGs, and we could to see detailed pathway information
in KEGG database (21).
Reverse transcription-quantitative PCR
(RT-qPCR) analysis
Total RNA was extracted from cultured cells using
TRIzol® reagent (Invitrogen; Thermo Fisher Scientific,
Inc.), according to the manufacturer's protocol. Subsequently, 1
µg total RNA was used to synthesize cDNA with the
PrimeScript Reverse Transcriptase Reagent kit (Takara Bio, Inc.),
according to manufacturer's protocol. RT-qPCR was performed using
the SYBR Green PCR kit (Takara Bio, Inc.) in 94°C denatured for 3
min, one cycle; then 35 cycles: 94°C denatured for 30 sec, 58°C
annealed for 30 sec, 72°C prolonged for 45 sec, and finally
prolonged for 10 min at 72°C. Using GAPDH as an internal control,
the relative mRNA expression levels were assessed using the
2−ΔΔCq method (22).
The primer sequences are listed in Table I.
 | Table IPrimer sequences for reverse
transcription-quantitative polymerase chain reaction. |
Table I
Primer sequences for reverse
transcription-quantitative polymerase chain reaction.
| Gene | Forward primer
(5′-3′) | Reverse primer
(5′-3′) |
|---|
| ALDH1A3 |
AATCCAGGGCAAGACCATC |
TTCCACACCAGCATCAGC |
| CD24 |
TGCTGGCACTGCTCCTACC |
CGAAGAGACTGGCTGTTGACTG |
| CD44 |
GCAGGAAGAAGGATGGATATGG |
TCAGAGTAGAAGTTGTTGGATGG |
| CD109 |
TGTCTCCTTCCCACATCCTC |
CAGCTTCTTTCCCAAACTGC |
| CD164 |
AACAGTTAGTGATTGTCAAGTGG |
CAGGTTGTGAGGTTGGAGTC |
| EpCAM |
GCTGGTGTGAACACTGCT |
ACGCGTTGTGACTCCTTCT |
| GAPDH |
AAGGCTGTGGGCAAGGTCATC |
GCGTCAAAGGTGGAGGAGTGG |
Gene and isoform expression
Gene and isoform expression levels were quantified
using the RNASeq by Expectation Maximization (RSEM) software
package (17). RSEM computes
maximum likelihood abundance estimates using the
Expectation-Maximization algorithm for its statistical model,
including the modeling of paired-end and variable-length reads,
fragment length distributions and quality scores, to determine
which transcripts are isoforms of the same gene. The Fragments Per
Kilobase of transcript per Million (FPKM) method was used to
calculate expression level, as follows:
FPKM=(106C)/(NL/103); for gene A, C is the
number of fragments that are uniquely aligned to gene A, N is the
total number of fragments that were uniquely aligned to all genes,
and L is the number of bases on gene A. FPKM values were obtained
in SK-BR-3 and MDA-MB-231 cells. Log2
Ratio=SK-BR-3-FPKM/MDA-MB-231-FPKM.
Western blot analysis
Cells were placed on ice and washed twice with PBS.
A total of 200 µl RIPA buffer (Cell Signaling Technology,
Inc.) containing protease inhibitors was added and mixed well.
After 30 min of cells lysis on ice, the cells were collected from
the culture dish; all liquids were transferred to the new
centrifuge tube and centrifuged at 4°C and 14,000 x g for 10 min.
The supernatant was carefully transferred to the 1.5 ml EP tube as
required protein. Protein concentration was determined using the
bicinchoninic acid protein assay (Sigma-Aldrich; Merck KGaA).
Denatured proteins (50 µg) were separated by 5-10% SDS-PAGE
and transferred to PVDF membranes (EMD Millipore). The membranes
were blocked with 5% non-fat milk in PBS-0.1% Tween (PBST) at room
temperature for 1-2 h and were incubated with primary antibodies at
4°C overnight. After washing with PBST, the membranes were
incubated with secondary horseradish peroxidase-conjugated goat
anti-rabbit (cat. no. ab205718; 1:2,000; Abcam)/goat anti-mouse
antibodies (cat. no. ab6789; 1:2,000; Abcam) for 1-2 h at room
temperature. The primary antibodies used were anti-aldehyde
dehydrogenase (ALDH)1A1 (rabbit monoclonal; cat. no. ab52492; 1:50;
Abcam), anti-ALDH1A3 (rabbit polyclonal; cat. no. ab129815; 1:200;
Abcam), anti-CD24 (rabbit monoclonal; cat. no. ab179821; 1:1,000;
Abcam), anti-CD44 (rabbit monoclonal; cat. no. ab51037; 1:2,000;
Abcam), anti-CD109 (rabbit polyclonal; cat. no. ab128470; 1:500;
Abcam), anti-CD164 (rabbit polyclonal; cat. no. PA5-80418; 1:500;
Invitrogen; Thermo Fisher Scientific, Inc.), anti-epithelial cell
adhesion molecule (EpCAM; rabbit monoclonal; cat. no. ab223582;
1:1,000; Abcam) and anti-β-actin (mouse monoclonal; cat. no.
sc-47778; 1:2,000; Santa Cruz Biotechnology, Inc.). After washing
with PBST, chemiluminescent liquid (SuperSignal™ West Pico PLUS
Chemiluminescent Substrate, Thermo Fisher Scientific, Inc.) was
applied for ~5 min at room temperature in the dark prior to
visualizing membranes. Protein band images were acquired by
ChemiDoc MP Imaging System (Bio-Rad Laboratories, Inc.).
Patients
A total of 109 breast cancer cases were randomly
selected from the Department of Pathology, The First Affiliated
Hospital of Xi'an Jiaotong University, between January 2014 and
December 2016. The common clinico-pathological characteristics and
the expression of estrogen receptor (ER), progesterone receptor
(PR), HER-2, Ki-67 and molecular markers (EpCAM, ALDH1A3 and
ALDH3B2) were analyzed. According to the expression of ER, PR,
HER-2 and Ki-67, breast cancer was divided into four subtypes as
follows: Luminal A, luminal B, HER-2-positive and TNBC.
Immunohistochemistry
Immunohistochemistry was performed on 4-µm 4%
formalin-fixed overnight at 4°C, paraffin-embedded breast cancer
and paracancerous tissue sections. The sections conventional
dimethylbenzene dewaxing, gradient alcohol dehydration:
Dimethylbenzene I 5 min, dimethylbenzene II 5 min, 100% alcohol I 5
min, 95% alcohol I 5 min, 95% alcohol II 5 min. Blocking of
endogenous peroxidase activity: The sections were placed in 0.3%
hydrogen peroxide water prepared with methanol at room temperature
for 15 min, washed PBS for 5 min three times. Antigen retrieval:
The sections were boiled (95°C, 15 ~20 min) in 0.01 mol/l citric
acid buffer (PH=6.0), cooled naturally for more than 20 min, then
washed with cold water to accelerate cooling to room temperature,
washed PBS for 5 min three times. The slides were then incubated
with anti-EpCAM (rabbit monoclonal; cat. no. ab223582; 1:500;
Abcam), anti-ALDH1A3 (rabbit poly-clonal; cat. no. ab129815; 1:100;
Abcam) and anti-ALDH3B2 (rabbit polyclonal; cat. no. ab238866;
1:20; Abcam) overnight at 4°C. The primary antibody was omitted in
the negative control experiment. After washing with PBS for 5 min
three times, the sections were incubated with biotinylated goat
anti-rabbit IgG (cat. no. ab64256; 1:400; Abcam) at 37°C for 30
min. Next, the sections were dropped with streptavidin-horseradish
peroxidase (cat. no. 21126; 5 µg/ml; Thermo Fisher
Scientific, Inc.) at 37°C for 30 min, washed PBS for 5 min three
times. Color was developed using diaminobenzidine (DAB) substrate
kit (cat. no. 34065; Thermo Fisher Scientific, Inc.) avoiding
light.
Five non-overlapping visual fields were randomly
selected under a light microscope at a magnification of ×200, and
the percentage of positively stained cells and staining intensity
were comprehensively analyzed. ALDH1A3 and ALDH3B2 were located in
the cytoplasm, whereas positive staining for EpCAM was located in
the cell membrane. The percentage of ALDH1A3- and ALDH3B2-positive
cells was calculated in tumor tissues; >10% positive cells was
considered as positive staining and <10% positive was considered
as a negative result.
EpCAM staining was mainly located in the cytoplasm
and cell membrane, and only partially expressed in the nucleus.
According to the number of EpCAM-positive cells among cancer cells,
the scores were defined as follows: 0, 10%; 1, 10-30%; 2, 30-50%;
3, 50-70%; and 4, 70%. In addition, the positive staining intensity
score (0-3 points) was defined as follows: 0 points, none; 1 point,
weak; 2 points, medium; and 3 points, strong staining. The
collective score was up to 7 points. A score of ≥4 points was
considered as positive.
Statistical analysis
GraphPad Prism 6 (GraphPad Software, Inc.) was used
for statistical analysis. Student's t-test was used to analyze the
differences in invasion and migration between SK-BR-3 and
MDA-MB-231 cells. Comparison of variables among different breast
cancer cell lines was performed by one-way analysis of variance
followed by the post hoc Tukey's multiple comparison test.
P<0.05 was considered to indicate a statistically significant
difference.
Results
Characteristics of
CD44+/CD24−/low SK-BR-3 and MDA-MB-23
cells
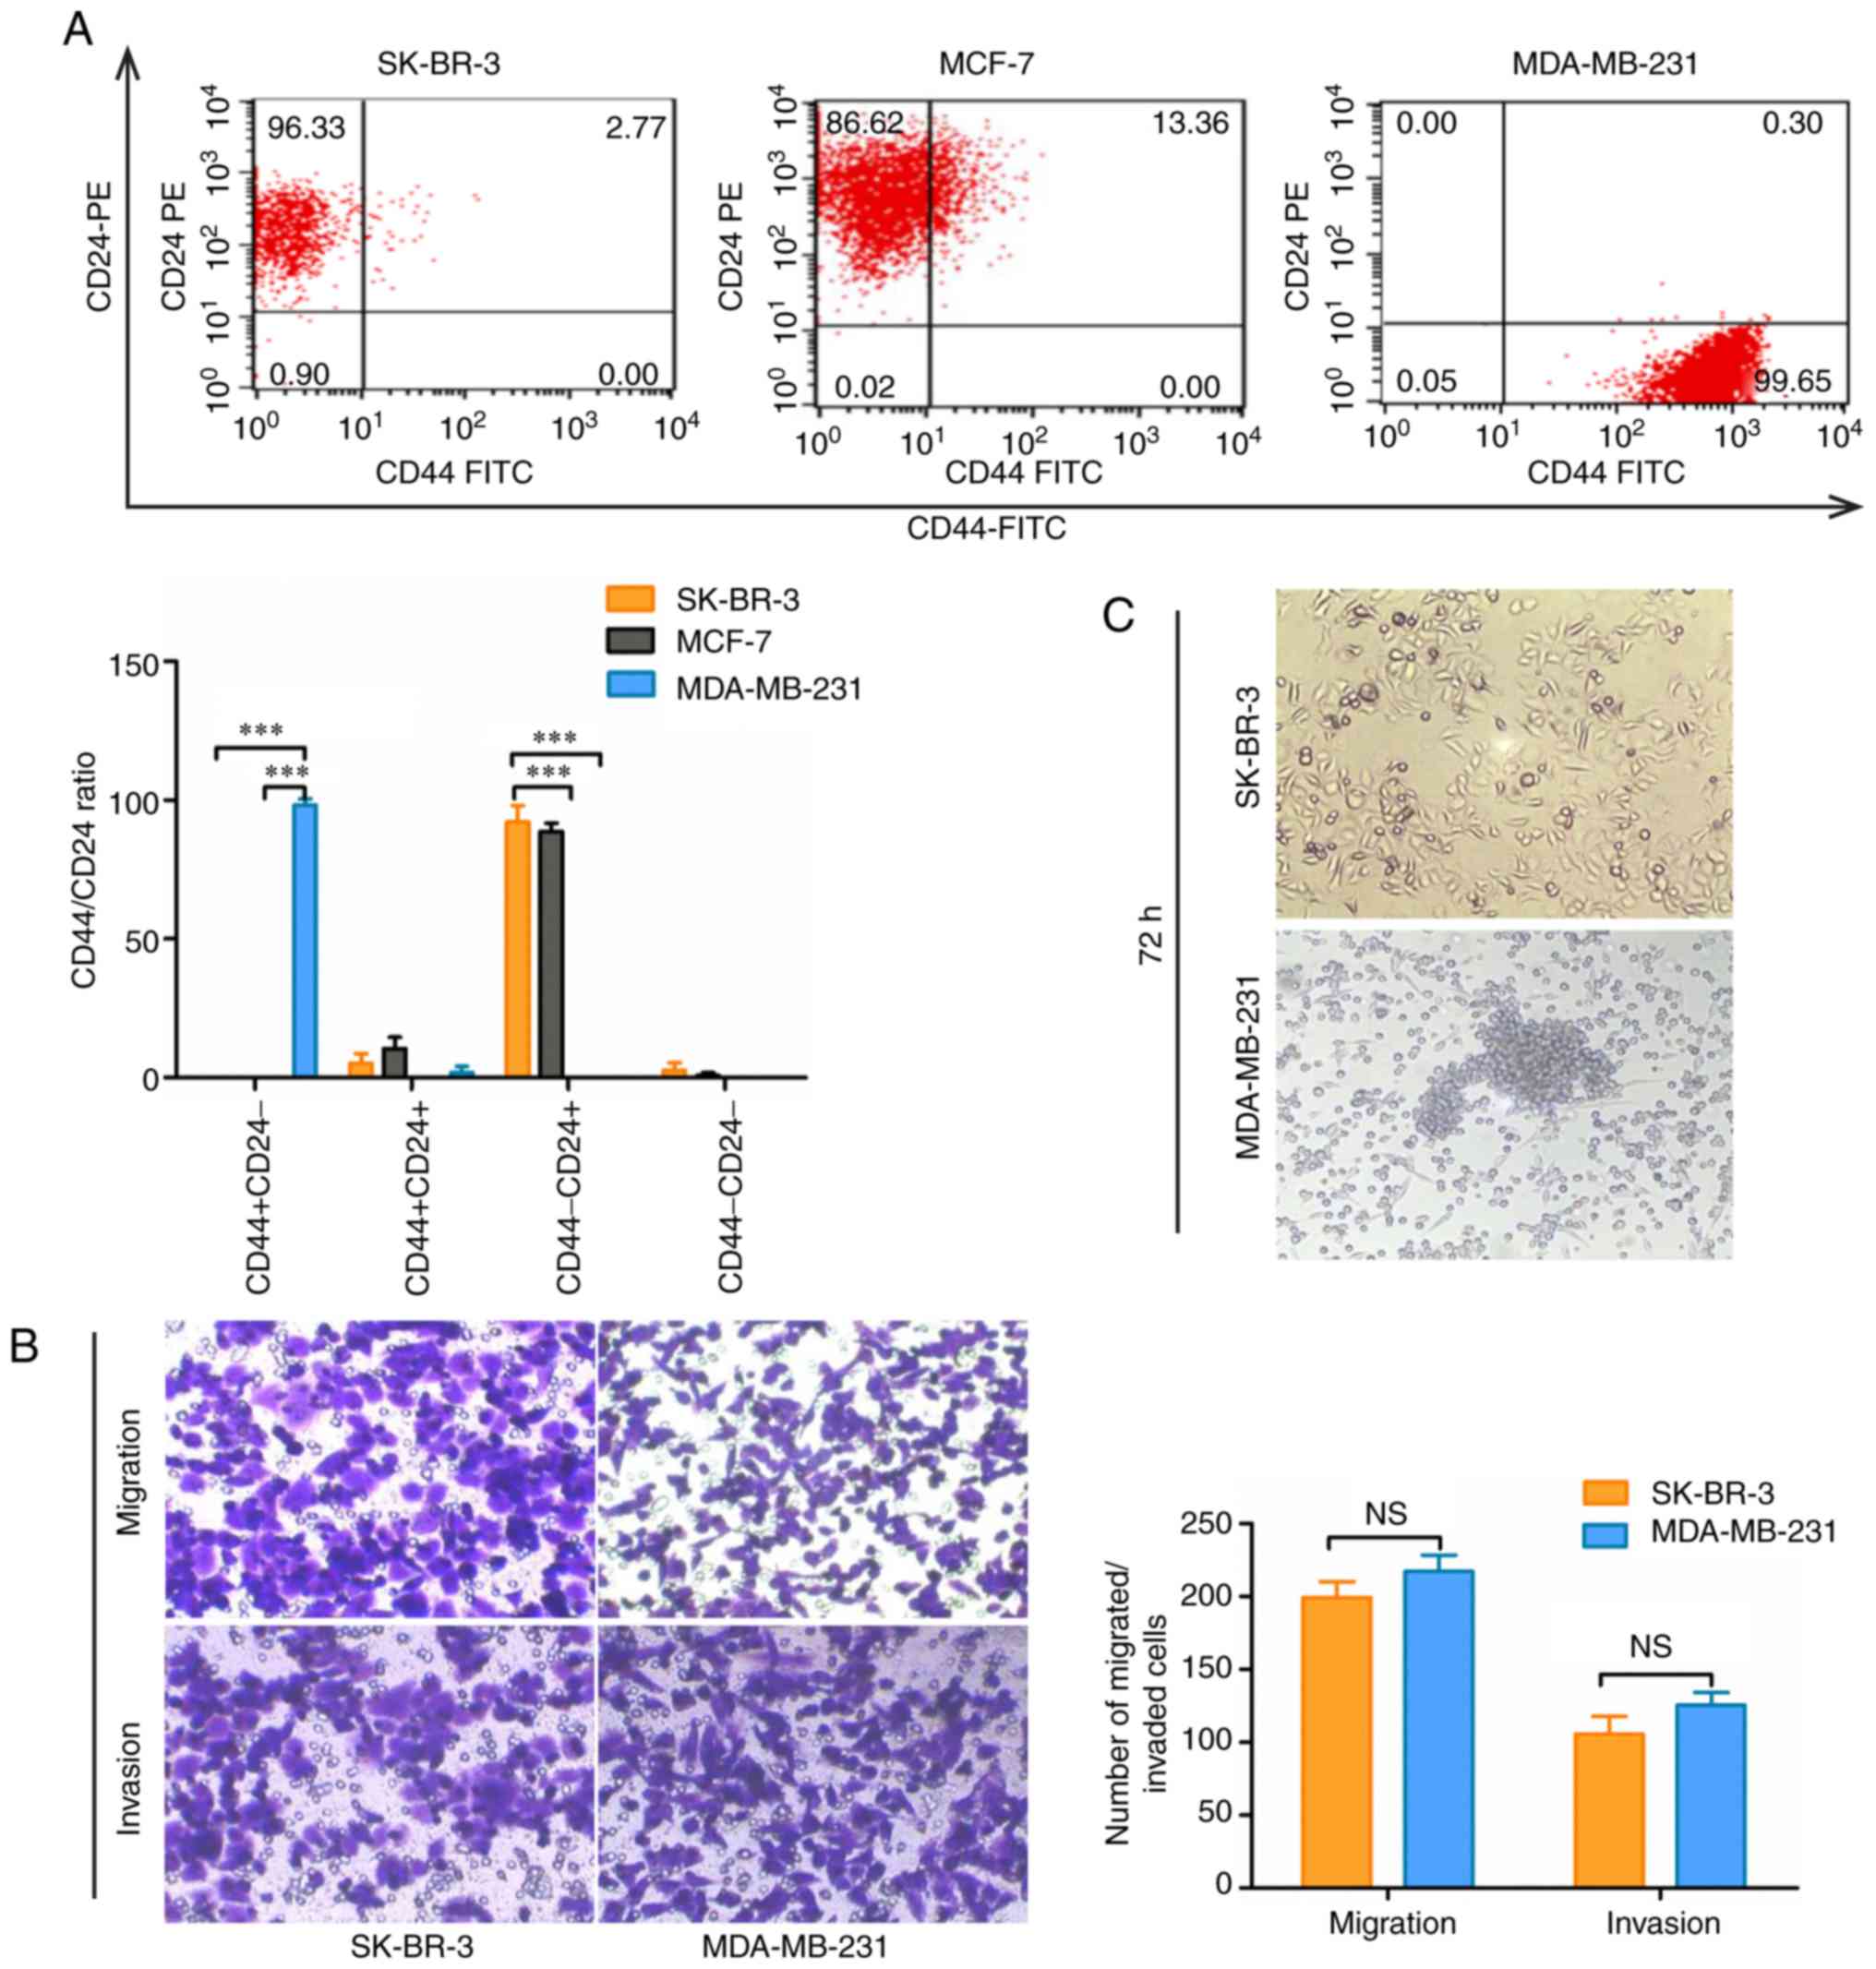
Since CD44+/CD24−/low is
currently the most commonly used marker for breast CSCs (23), the protein expression levels of
CD44 and CD24 were detected in different breast cancer cell
subtypes by flow cytometry. The results revealed that there were
almost no CD44+/CD24−/low cells among SK-BR-3
and MCF-7 cells. However, the ratio of
CD44+/CD24−/low cells was >90% in
MDA-MB-231 cells (P<0.001; Fig.
1A). In addition, it has been reported that
CD44+/CD24−/low cells exhibit stronger
invasion, metastasis and tumor-forming abilities (23,24).
Therefore, migratory and invasive abilities were compared between
SK-BR-3 and MDA-MB-231 cells using Transwell assays. The results
demonstrated that both SK-BR-3 and MDA-MB-231 cells exhibited
strong migratory and invasive abilities (P>0.05; Fig. 1B). The activity of breast CSCs, as
manifested by microsphere formation (25), was higher in MDA-MB-231 cells
compared with in SK-BR-3 cells (Fig.
1C). These results indicated that, although
CD44+/CD24−/low breast cancer cells have the
characteristics of CSCs, CD44+/CD24−/low may
not be an accurate stem cell marker of SK-BR-3 cells. Therefore,
there may be other CSC markers in SK-BR-3 cells that require
further research.
Sequencing data of SK-BR-3 and MDA-MB-231
cells
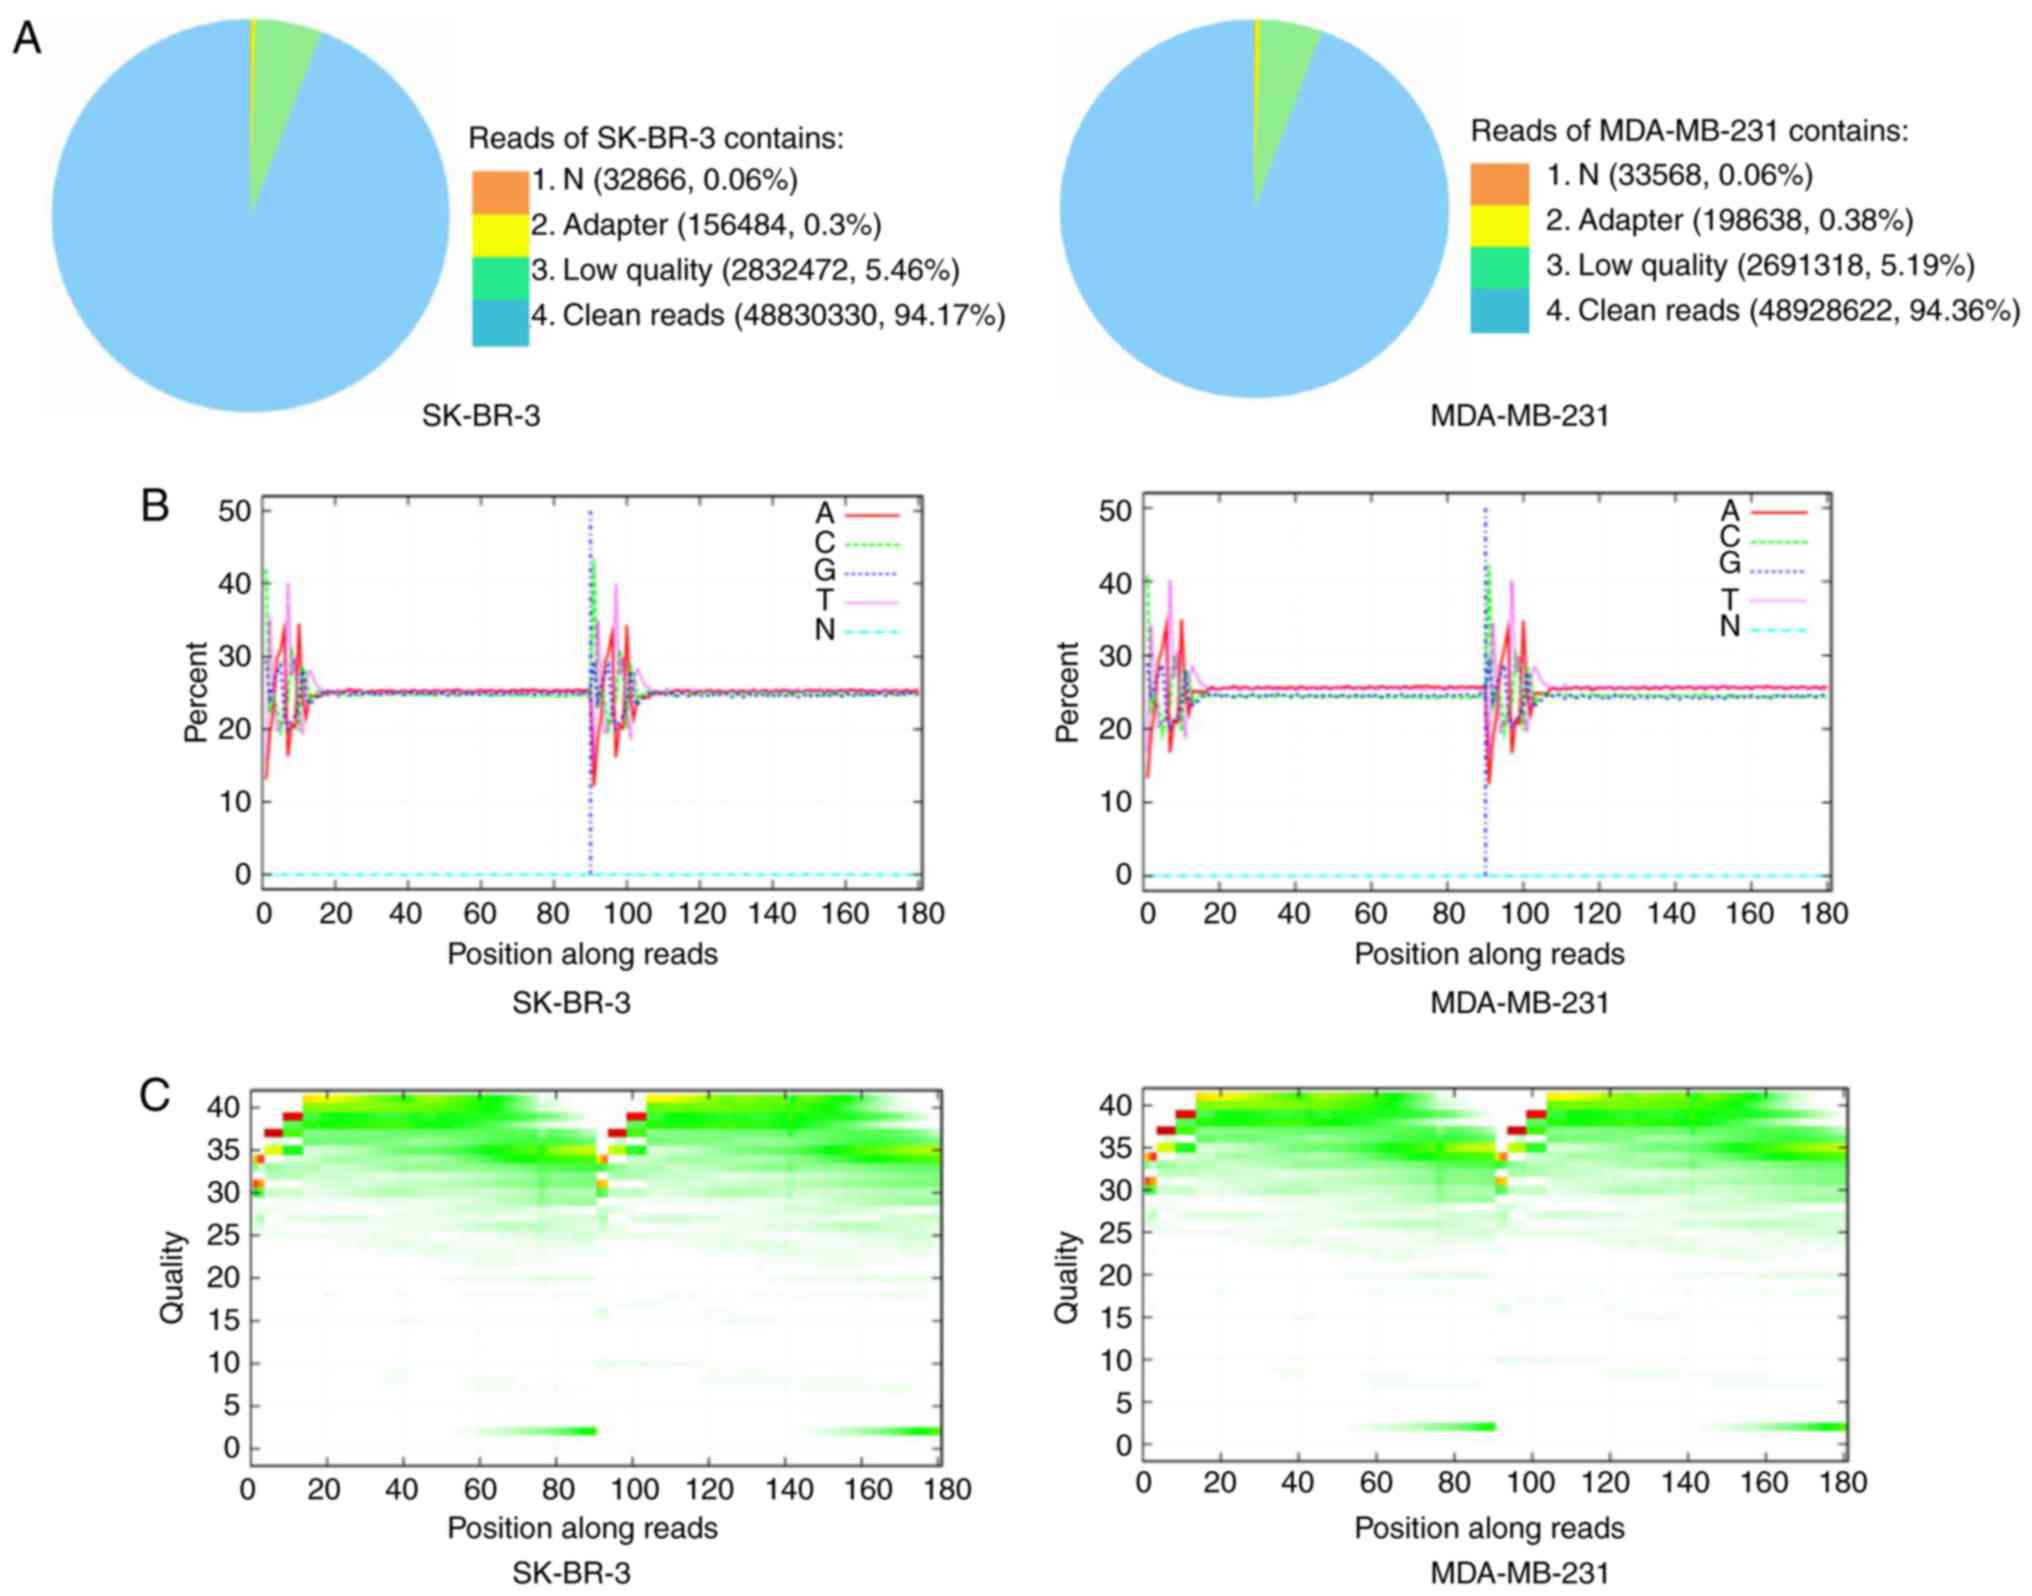
Using the Illumina HiSeq™ 2000 platform, SK-BR-3 and
MDA-MB-231 cells were sequenced. However, as the original
sequencing data may contain low-quality sequences, in order to
ensure the reliability of the results, raw reads containing the
adapter sequence, a high content of unknown bases and low-quality
reads were removed (Fig. 2A).
Clean reads were obtained after filtering and were used for
downstream bioinformatics analysis. Subsequently, base composition
and quality distribution charts of the clean reads were generated;
obtained low-quality (<20) base ratio was low, which indicated
that the quality of the sequencing was relatively good (Fig. 2B and C). Sequence reads were
aligned to the human genome using BWA software (18). Clean reads were mapped to the
reference genome, and the statistics of alignment results yielded a
mean coverage of 81.23% for SK-BR-3 and 81.54% for MDA-MB-231
cells. Furthermore, we identified that 16,616 genes were-expressed
in SK-BR-3 cells and 16,783 genes were expressed in MDA-MB-231
cells
The differentially expressed genes (DEGs) between
SK-BR-3 and MDA-MB-231 cells were then identified using the Poisson
distribution (19). Subsequently,
the multiple hypothesis test was adjusted for the P-value of
differential gene expression and the P-value was determined by
controlling the false discovery rate (FDR). FDR ≤0.001 and an
absolute value of log2 ratio ≥1 were used as the cut-off points for
assessing the significance of differences in gene expression.
According to this cut-off, 6,305 genes were selected that were
differentially expressed between SK-BR-3 and MDA-MB-231 cells at
P<0.05 corrected with FDR ≤0.001.
Upregulation and downregulation of CSC
markers in SK-BR-3 vs. MDA-MB-231 cells
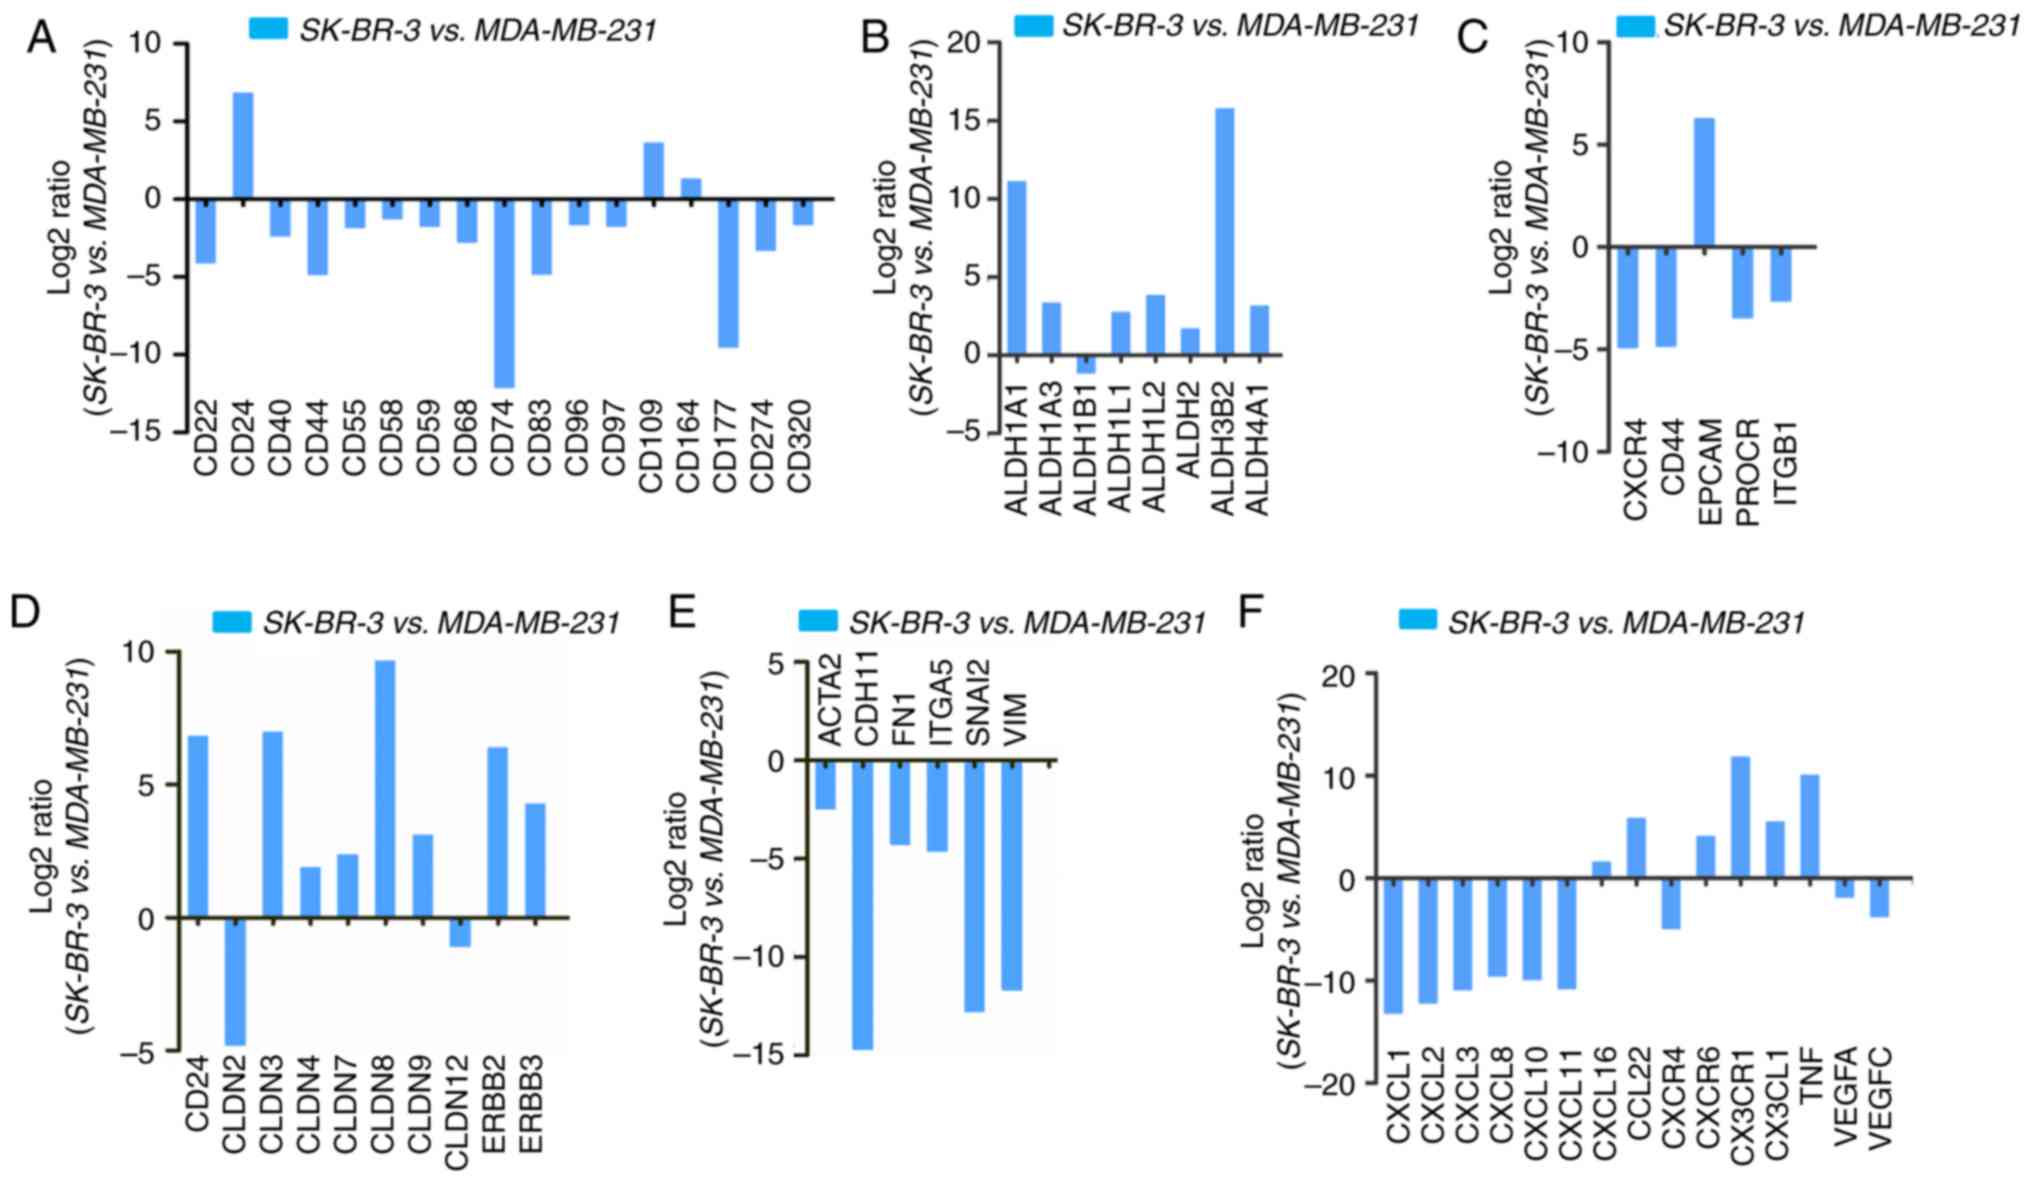
CD44+/CD24−/low cells are
usually considered to be CSCs in breast cancer (23). These cells have a higher invasive
and metastatic potential (24),
and are resistant to conventional chemotherapy and radiotherapy,
which are the main reasons for recurrence and metastasis of breast
cancer (26,27). However, the present study revealed
that there almost no CD44 expression was detected in SK-BR-3 cells.
Therefore, novel CSC markers for SK-BR-3 cells are required. As
leukocyte differentiation antigens have been used as stem cell
markers in a number of tumors (28), this study investigated the
alterations in leukocyte differentiation antigens, among which
CD24, CD109 and CD164 exhibited increased expression in SK-BR-3
cells (Fig. 3A; Table II). The expression of ALDH1A1,
ALDH1A3 and ALDH3B2 was also significantly increased in SK-BR-3
cells (Fig. 3B; Table II). Furthermore, CSC markers, such
as EpCAM, were markedly upregulated in SK-BR-3 cells. Conversely,
other typical stem cell genes, including C-X-C motif chemokine
receptor 4, CD44, protein C receptor and integrin subunit β1, were
downregulated (Fig. 3C; Table II). Furthermore,
epithelial-to-mesenchymal transition (ETM)-related gene expression
was examined in SK-BR-3 cells. Certain epithelial marker genes,
including CD24, claudin (CLDN)3, CLDN8 and erb-b2 receptor tyrosine
kinase 2 (ERBB2), were upregulated (Fig. 3D, Table II), whereas mesenchymal markers,
such as actin α2, smooth muscle (ACTA2), cadherin 11 (CDH11),
fibronectin 1 (FN1), integrin subunit α5 (ITGA5), snail family
transcriptional repressor 2 (SNAI2) and vimentin (VIM), were
markedly downregulated (Fig. 3E;
Table II).
| Table IIScreening of differentially expressed
genes related to cancer stem cell markers, EMT and microenvironment
of CSCs in SK-BR-3 vs. MDA-MB-231 cells. |
Table II
Screening of differentially expressed
genes related to cancer stem cell markers, EMT and microenvironment
of CSCs in SK-BR-3 vs. MDA-MB-231 cells.
| A, ALDH family |
|---|
| Gene | Log2 ratio | P-value |
| ALDH1A1 | 11.08 |
2.8×10⁻¹⁶ |
| ALDH1A3 | 3.31 |
1.4×10−299 |
| ALDH1B1 - | 1.13 |
4.5×10⁻²⁸ |
| ALDH1L1 | 2.71 |
4.8×10−37 |
| ALDH1L2 | 3.79 |
2.4×10⁻¹⁹ |
| ALDH2 | 1.65 |
6.0×10−217 |
| ALDH3B2 | 15.74 | <0.01 |
| ALDH4A1 | 3.12 |
1.1×10−184 |
| B, CSC markers |
| Gene | Log2 ratio | P-value |
| CXCR4 | −4.89 |
4.5×10−82 |
| CD44 | −4.82 | <0.01 |
| EpCAM | 6.24 | <0.01 |
| PROCR | −3.44 |
2.8×10−97 |
| ITGB1 | −2.63 | <0.01 |
| C, Epithelial
markers |
| Gene | Log2 ratio | P-value |
| CD24 | 6.80 | <0.01 |
| CLDN2 | −4.77 | 1.9×10⁻⁷ |
| CLDN3 | 6.96 |
1.4×10−179 |
| CLDN4 | 1.86 | <0.01 |
| CLDN7 | 2.34 | <0.01 |
| CLDN8 | 9.63 | 8.3×10⁻⁶ |
| CLDN9 | 3.08 | 1.6×10⁻⁸ |
| CLDN12 | −1.06 |
1.9×10⁻³² |
| ERBB2 | 6.36 | <0.01 |
| ERBB3 | 4.25 | <0.01 |
| D, Leukocyte
markers |
| Gene | Log2 ratio | P-value |
| CD109 | 3.60 |
1.8×10⁻²⁶ |
| CD164 | 1.28 |
1.6×10−182 |
| M, Mesenchymal
markers |
| Gene | Log2 ratio | P-value |
| ACTA2 | −2.44 |
9.0×10⁻¹² |
| CDH11 | −14.69 |
2.7×10−295 |
| FN1 | −4.25 | <0.01 |
| ITGA5 | −4.61 | <0.01 |
| M, Mesenchymal
markers |
| Gene | Log2 ratio | P-value |
| SNAI2 | −12.75 |
1.1×10−44 |
| VIM | −11.66 | <0.01 |
| F, Cytokines and
receptors |
| Gene | Log2 ratio | P-value |
| CXCL1 | −13.14 |
3.0×10⁻³² |
| CXCL2 | −12.15 |
2.1×10⁻¹⁷ |
| CXCL3 | −10.85 |
4.3×10⁻⁷ |
| CXCL8 | −2.63 |
5.9×10−227 |
| CXCL10 - | 9.85 | 0.0005 |
| CXCL11 - | 10.73 |
6.5×10⁻⁹ |
| CXCL16 | 1.54 |
3.1×10⁻⁵ |
| CCL22 | 5.77 |
1.3×10⁻¹⁸ |
| CXCR4 | −4.89 |
4.5×10−82 |
| CXCR6 | 4.04 | 0.0002 |
| CX3CR1 | 11.75 |
2.6×10⁻³³ |
| CX3CL1 | 5.45 |
1.2×10−172 |
| TNF | 9.98 |
8.3×10⁻⁶ |
| VEGFA | −1.84 | <0.01 |
| VEGFC | −3.72 |
1.2×10−128 |
Analysis of expression levels in SK-BR-3
vs. MDA-MB-231 cells
The expression levels of ALDH1A3, ALDH3B2, CD24,
CD164 and EpCAM were markedly higher in SK-BR-3 cells (Fig. 4A; Table II). Furthermore, the RT-qPCR data
revealed that ALDH1A3, CD24, CD109, CD164 and EpCAM were more
strongly expressed in SK-BR-3 cells compared with in MDA-MB-231
cells (Fig. 4B). Subsequently, the
protein expression levels of ALDH1A1, ALDH1A3, CD24, CD44, CD109,
CD164 and EpCAM were detected in MCF-10A, SK-BR-3, MCF-7 and
MDA-MB-231 cell lines by western blotting. The results revealed
that the expression levels of ALDH1A3, CD24, CD164 and EpCAM were
higher in SK-BR-3 cells compared with in the other cell lines
(Fig. 4C). Ginestier et al
(29) observed that
ALDH1-expressing cells exhibit the characteristics of CSCs. Among
the different subtypes of ALDH1, only ALDH1A3 expression levels
(FPKM value) were found to be significantly higher in SK-BR-3 cells
in this study (Fig. 4A). ALDH1A3
and ALDH3B2 also belong to the ALDH family, and may have similar
functions (Table III).
EpCAM-positive liver cancer cells exhibit diverse differentiation
ability (30); therefore, EpCAM
may be a stem cell marker for HER-2-positive breast cancer. Taken
together, these data suggested that ALDH1A3, ALDH3B2 and EpCAM were
significantly highly expressed in SK-BR-3 cells, and may be used as
stem cell markers for HER-2-positive breast cancer.
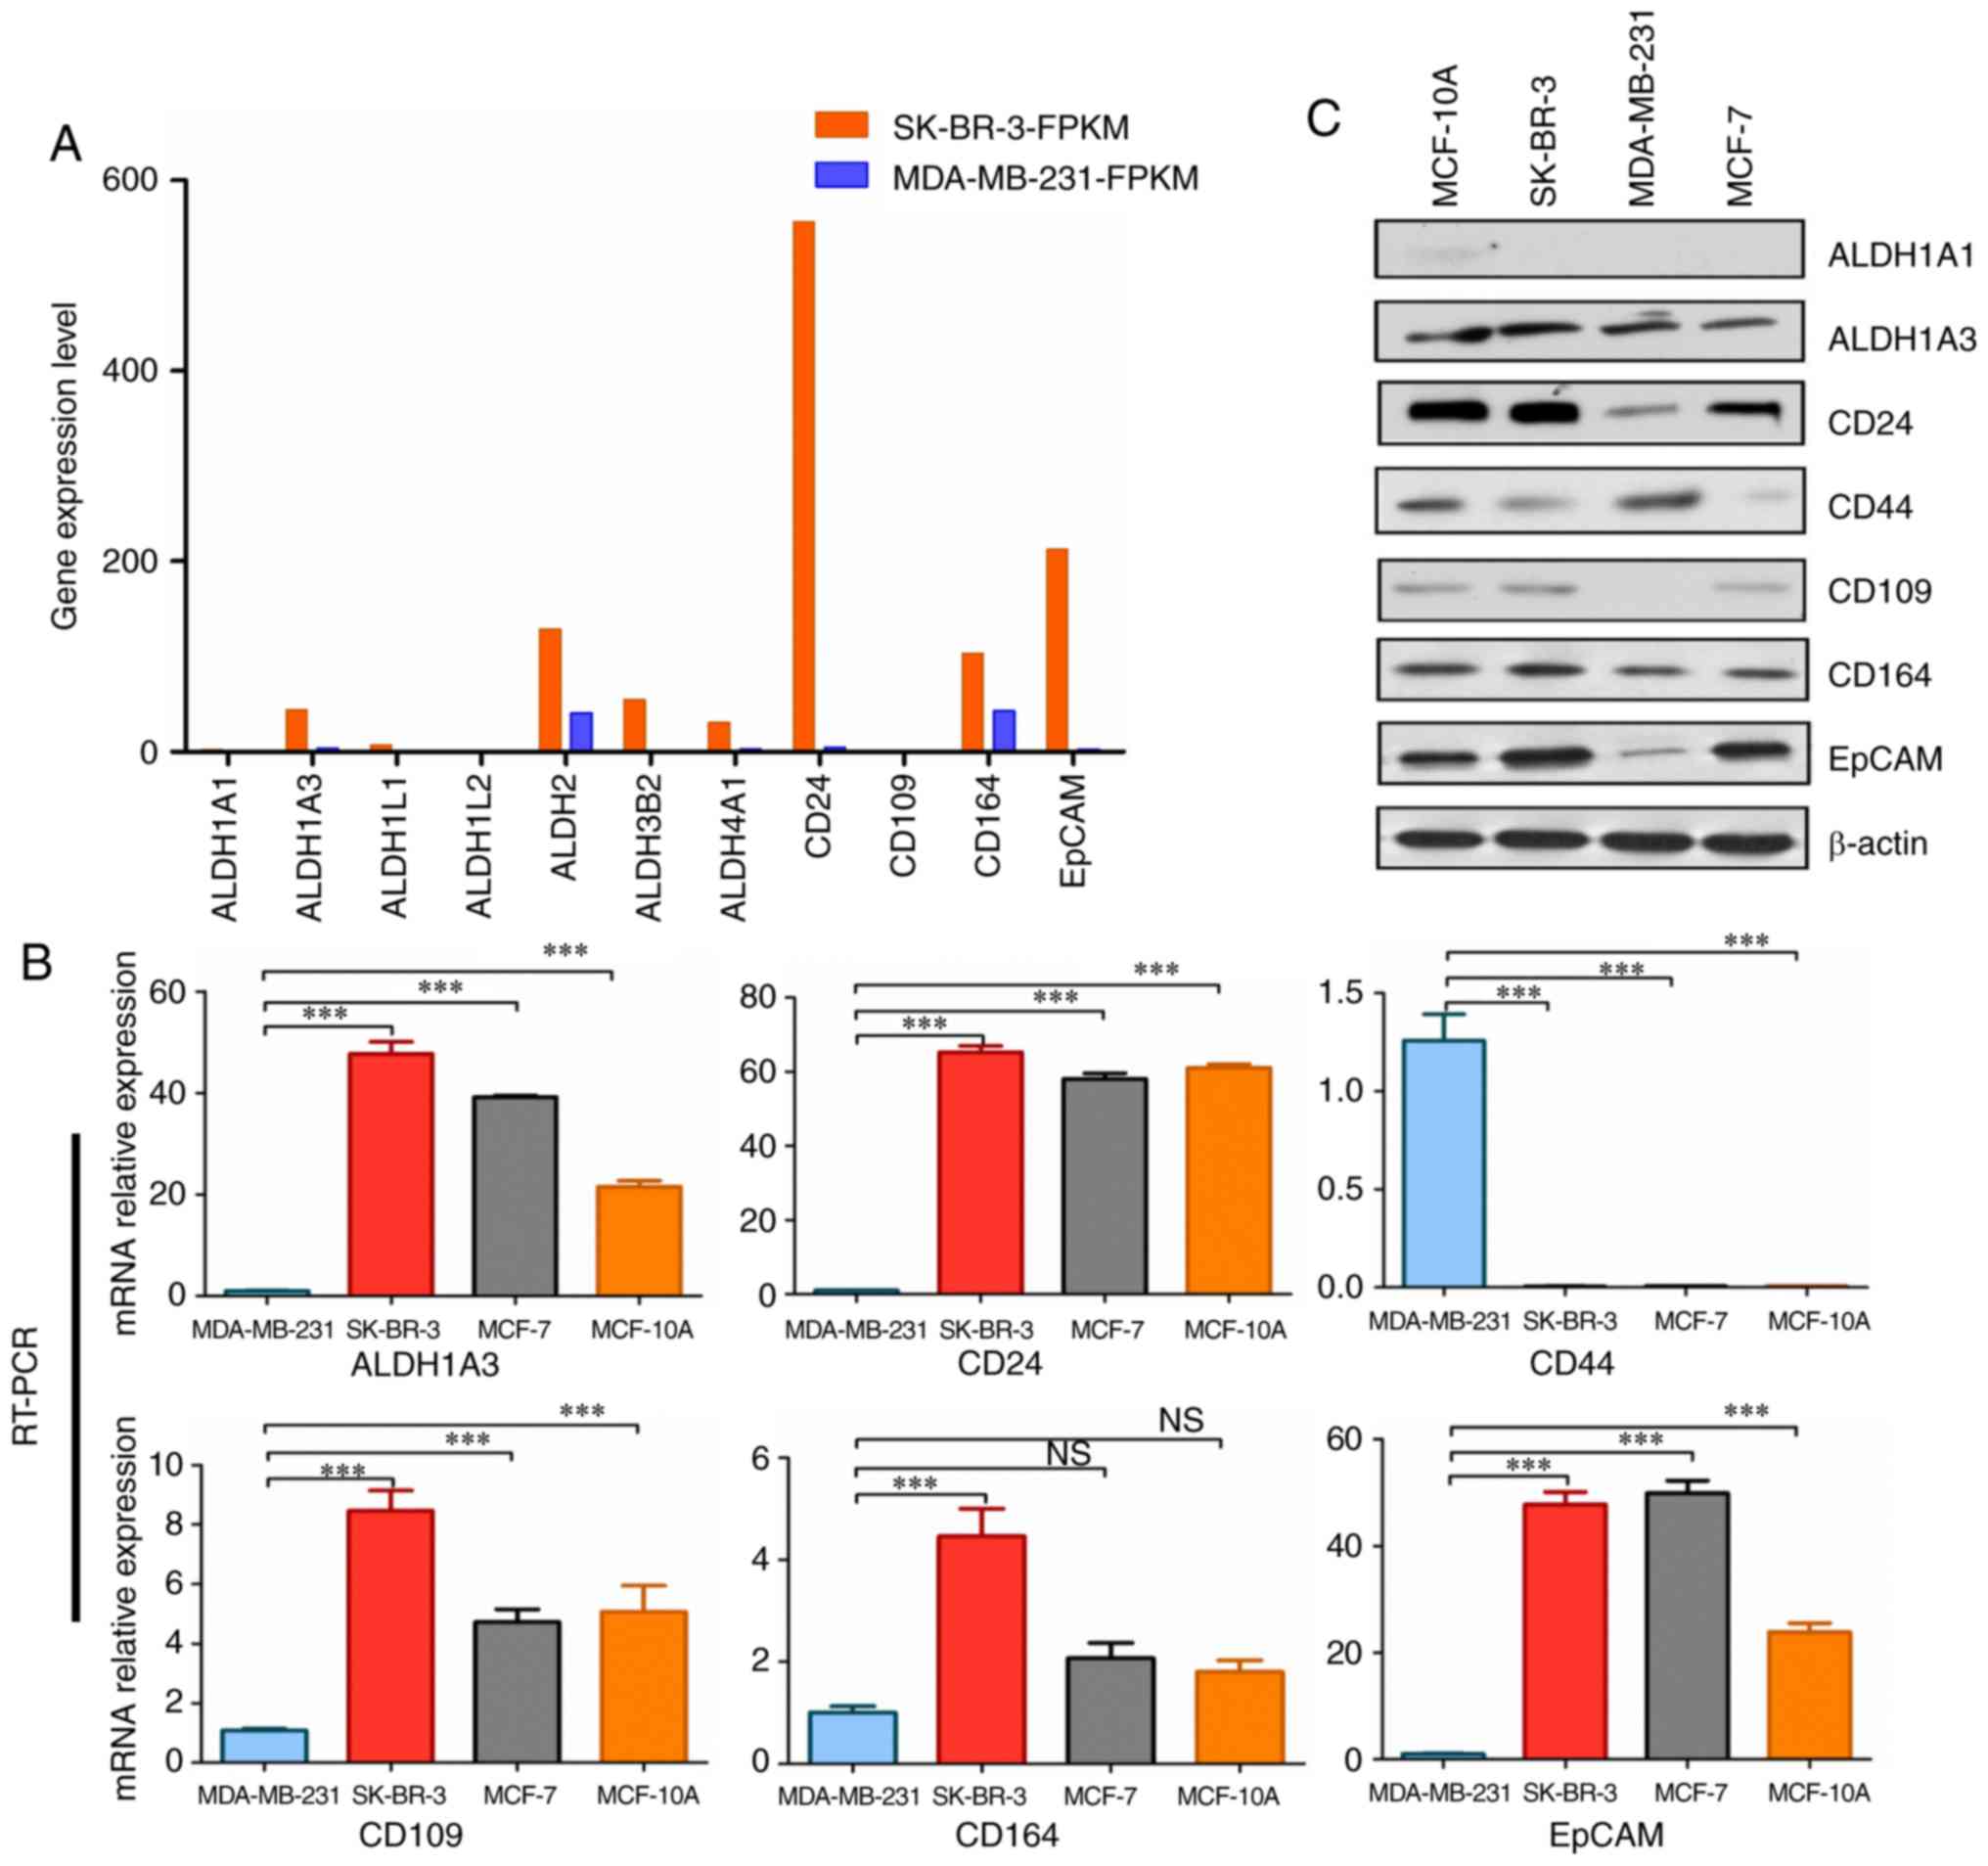 | Figure 4Analysis of upregulated gene
expression levels in SK-BR-3 vs. MDA-MB-231 cells. (A) Upregulated
gene expression levels in SK-BR-3 vs. MDA-MB-231 cells. The
expression levels of ALDH1A3, ALDH3B2, CD24, CD164 and EpCAM were
markedly higher in SK-BR-3 cells. FPKM value represents gene
expression level. (B) Analysis of upregulated mRNA expression
levels in MDA-MB-231, SK-BR-3, MCF-7 and MCF-10A cell lines by
RT-qPCR. All cell lines were normalized to the relative expression
levels of MDA-MB-231. GADPH was used as an internal reference gene.
***P<0.001. Error bars represent standard deviation.
RT-qPCR was performed in triplicate. (C) Protein expression levels
of ALDH1A1, ALDH1A3, CD24, CD44, CD109, CD164 and EpCAM were
detected in MCF-10A, SK-BR-3, MDA-MB-231 and MCF-7 cell lines by
western blotting. β-actin served as a control. ALDH, aldehyde
dehydrogenase; EpCAM, epithelial cell adhesion molecule; FPKM,
Fragments Per Kilobase of transcript per Million mapped reads;
RT-qPCR, reverse transcription-quantitative polymerase chain
reaction. |
| Table IIIGO analysis of upregulated genes in
SK-BR-3 vs. MDA-MB-231 cells. |
Table III
GO analysis of upregulated genes in
SK-BR-3 vs. MDA-MB-231 cells.
| A, ALDH1
family |
|---|
| Gene | SK-BR-3- FPKM | MDA-MB-
231-FPKM | Top three GO
molecular function | GO biological
process |
| ALDH1A1 | 2.17 | 0.001 | GO:0005083: GTPase
regulator activity; GO:0004030: Aldehyde dehydrogenase [NAD(P)+]
activity; GO:000549: Steroid binding | GO:0006067: Ethanol
metabolic process; GO:0044237: Cellular metabolic process |
| ALDH1A3 | 43.85 | 4.410 | GO:0004030:
Aldehyde dehydrogenase [NAD(P)+] activity; GO:0051287: NAD binding;
GO:0042562: Hormone binding | GO:0043010:
Camera-type eye development; GO:0006915: Apoptotic process;
GO:0016331: Morphogenesis of embryonic epithelium; GO:0042573:
retinoic acid metabolic process |
| ALDH1L1 | 7.21 | 1.100 | GO:0016646:
oxidoreductase activity, acting on the CH-NH group of donors, NAD
or NADP as acceptor; GO:0005488: Binding | GO:0009256:
10-formyltetrahydrofolate metabolic process; GO:0006730: one-carbon
metabolic process |
| ALDH1L2 | 1.11 | 0.080 | | |
| ALDH3B2 | 54.74 | 0.001 | GO:0016620:
Oxidoreductase activity, acting on the aldehyde or oxo group of
donors, NAD or NADP as acceptor | GO:0044237:
Cellular metabolic process; GO:0044281: Small molecule metabolic
process |
| ALDH4A1 | 30.71 | 3.54A | GO:0004030:
Aldehyde dehydrogenase [NAD(P)+] activity; GO:0016646:
Oxidoreductase activity, acting on the CH-NH group of donors, NAD
or NADP as acceptor | GO:0006560: Proline
metabolic process |
| B, Leukocyte
markers |
| Gene | SK-BR-3- FPKM | MDA-MB-
231-FPKM | Top three GO
function | GO process |
| CD24 | 556.79 | 4.97 | | |
| CD109 | 1.33 | 0.11 | GO:0004866:
endopeptidase inhibitor activity | |
| CD164 | 103.61 | 42.72 | GO:0005488:
binding | GO:0016337: Single
organismal cell-cell adhesion; GO:0008283: Cell population
proliferation; GO: 0023052: Signaling |
| C, CSC markers |
| Gene | SK-BR-3- FPKM | MDA-MB-
231-FPKM | Top three GO
function | GO process |
| EpCAM | 212.22 | 2.800 | | |
ALDH1A3, ALDH3B2 and EpCAM expression
status in different subtypes of breast cancer
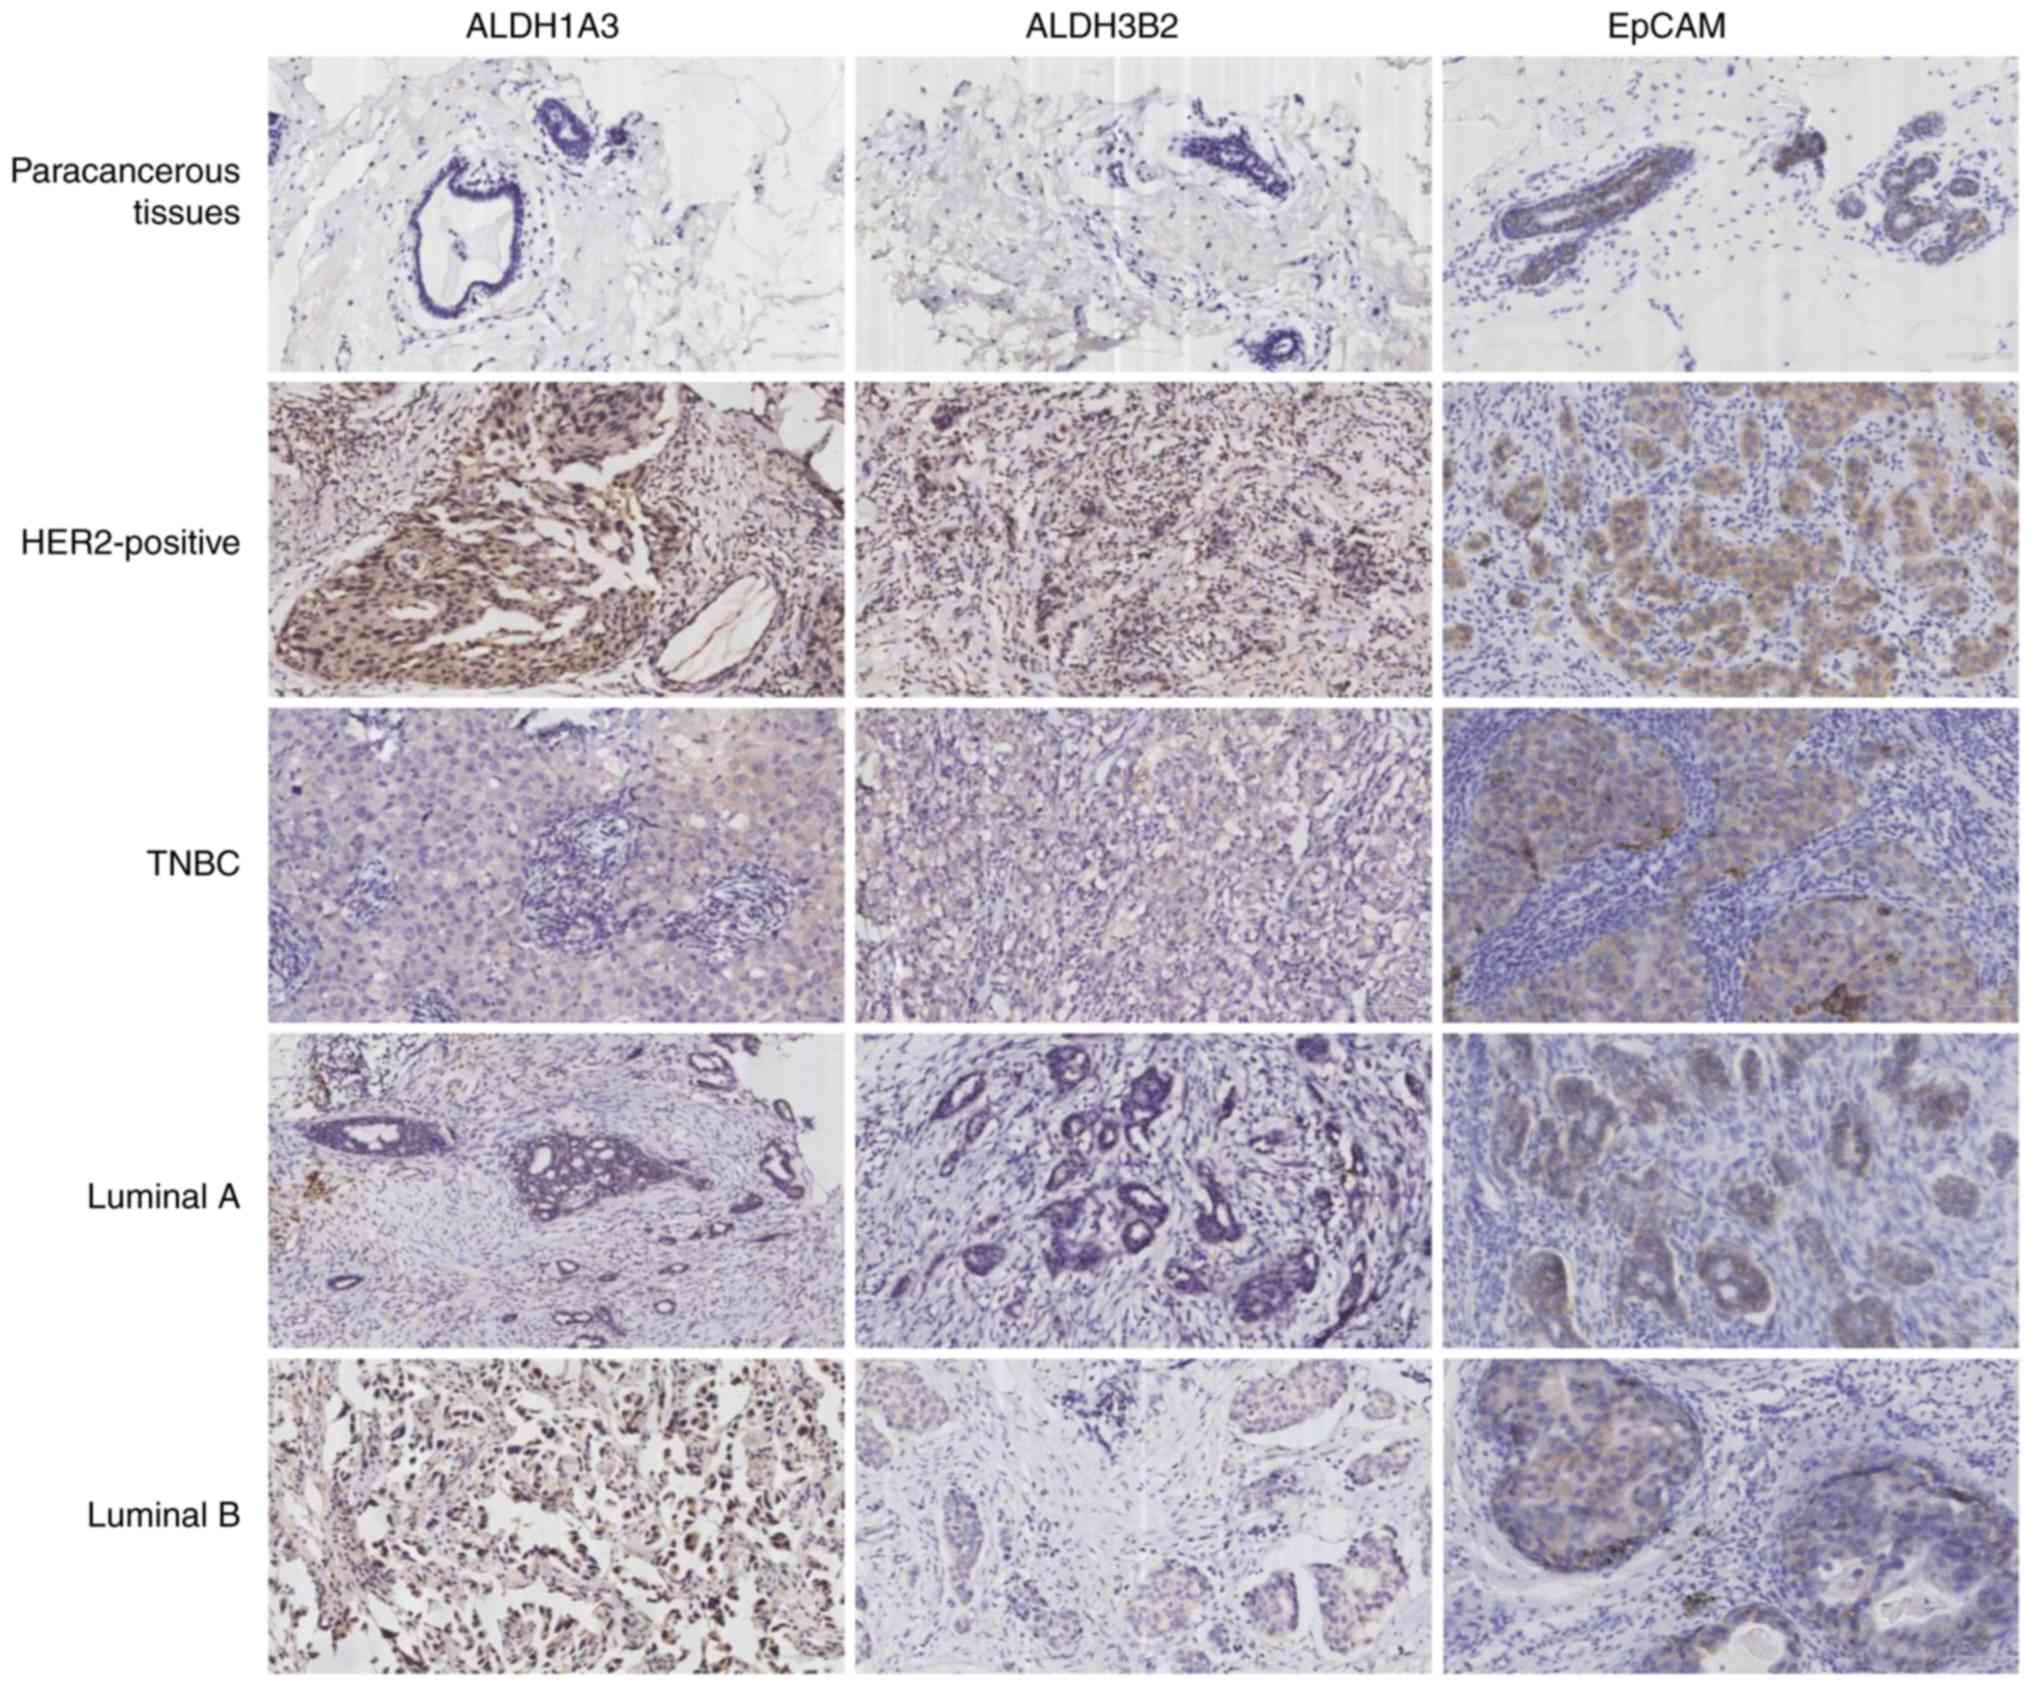
ALDH1A3, ALDH3B2 and EpCAM protein expression was
determined in different subtypes of breast cancer and paracancerous
tissues. Among 109 breast cancer cases, 27 (24.8%) were luminal A,
38 (34.9%) luminal B, 21 (19.3%) HER-2-positive and 23 (21.0%) TNBC
(Table IV). The protein
expression levels of ALDH1A3, ALDH3B2 and EpCAM were higher in
HER-2-positive breast cancer tissues compared with in other
subtypes of breast cancer. In addition, among the 109 paracancerous
tissue samples, ALDH1A3 was expressed in 9 tissues (8.3%), ALDH3B2
was expressed in 6 tissues (5.5%) and EPCAM was expressed in 37
tissues (33.9%). Furthermore, ALDH1A3 expression was observed in 16
(76.2%), ALDH3B2 in 15 (71.4%) and EpCAM in 18 (85.7%) cases of 21
HER-2-positive breast cancer tissues, whereas ALDH1A3 was expressed
in 15 (65.2%), ALDH3B2 in 13 (56.5%) and EpCAM in 15 (65.2%) of 23
TNBC cases (Fig. 5; Table V). The results of
immunohistochemistry for ALDH1A3, ALDH3B2 and EpCAM in different
subtypes of breast cancer and paracancerous tissues demonstrated
that the expression of ALDH1A3, ALDH3B2 and EpCAM in HER-2-positive
breast cancer was higher compared with in other subtypes of breast
cancer and paracancerous tissues. Therefore, ALDH1A3, ALDH3B2 and
EpCAM may serve as stem cell markers and therapeutic targets for
HER-2-positive breast cancer.
| Table IVPatient characteristics. |
Table IV
Patient characteristics.
| Parameter | Values |
|---|
| Age, years | |
| Median | 53.6 |
| Range | 35-77 |
| Menopausal status,
n (%) | |
| Premenopausal | 41 (37.6) |
|
Postmenopausal | 68 (62.4) |
| Tumor size, n
(%) | |
| ≤2 cm | 65 (59.6) |
| >2 cm | 44 (40.4) |
| Nodal status, n
(%) | |
| ≤3 | 58 (53.2) |
| ≥4 | 51 (46.8) |
| Tumor histology, n
(%) | |
| Ductal
carcinoma | 95 (87.2) |
| Lobular
carcinoma | 3 (2.8) |
| Other | 11 (10.0) |
| Histological grade,
n (%) | |
| I | 33 (30.3) |
| II | 20 (18.3) |
| III | 56 (51.4) |
| Ki-67, n (%) | |
| <14% | 34 (31.2) |
| ≥14% | 75 (68.8) |
| ER, n (%) | |
| Negative | 46 (42.2) |
| Positive | 63 (57.8) |
| PR, n (%) | |
| Negative | 49 (45.0) |
| Positive | 60 (55.0) |
| HER-2, n (%) | |
| Negative | 66 (60.6) |
| Positive | 43 (39.4) |
| Subtype, n (%) | |
| Luminal A | 27 (24.8) |
| B | 38 (34.9) |
|
Her-2-positive | 21 (19.3) |
|
Triple-negative | 23 (21.0) |
| Table VExpression of ALDH1A3, ALDH3B2 and
EpCAM in paracancerous tissues and different subtypes of breast
cancer. |
Table V
Expression of ALDH1A3, ALDH3B2 and
EpCAM in paracancerous tissues and different subtypes of breast
cancer.
| Group | n | ALDH1A3
| ALDH3B2
| EpCAM
|
|---|
| Positive, n
(%) | Negative, n
(%) | Positive, n
(%) | Negative, n
(%) | Positive, n
(%) | Negative, n
(%) |
|---|
| Paracancerous
tissues | 109 | 9 (8.3) | 100 (91.7) | 6 (5.5) | 103 (94.5) | 37 (33.9) | 72 (66.1) |
| HER-2-positive | 21 | 16 (76.2) | 5 (23.8) | 15 (71.4) | 6 (28.6) | 18 (85.7) | 3 (14.3) |
|
Triple-negative | 23 | 15 (65.2) | 8 (34.8) | 13 (56.5) | 10 (43.5) | 15 (65.2) | 8 (34.8) |
| Luminal A | 27 | 5 (18.5) | 22 (81.5) | 4 (14.8) | 23 (85.2) | 19 (70.4) | 8 (29.6) |
| Luminal B | 38 | 10 (26.3) | 28 (73.7) | 13 (34.2) | 25 (65.8) | 26 (68.4) | 12 (31.6) |
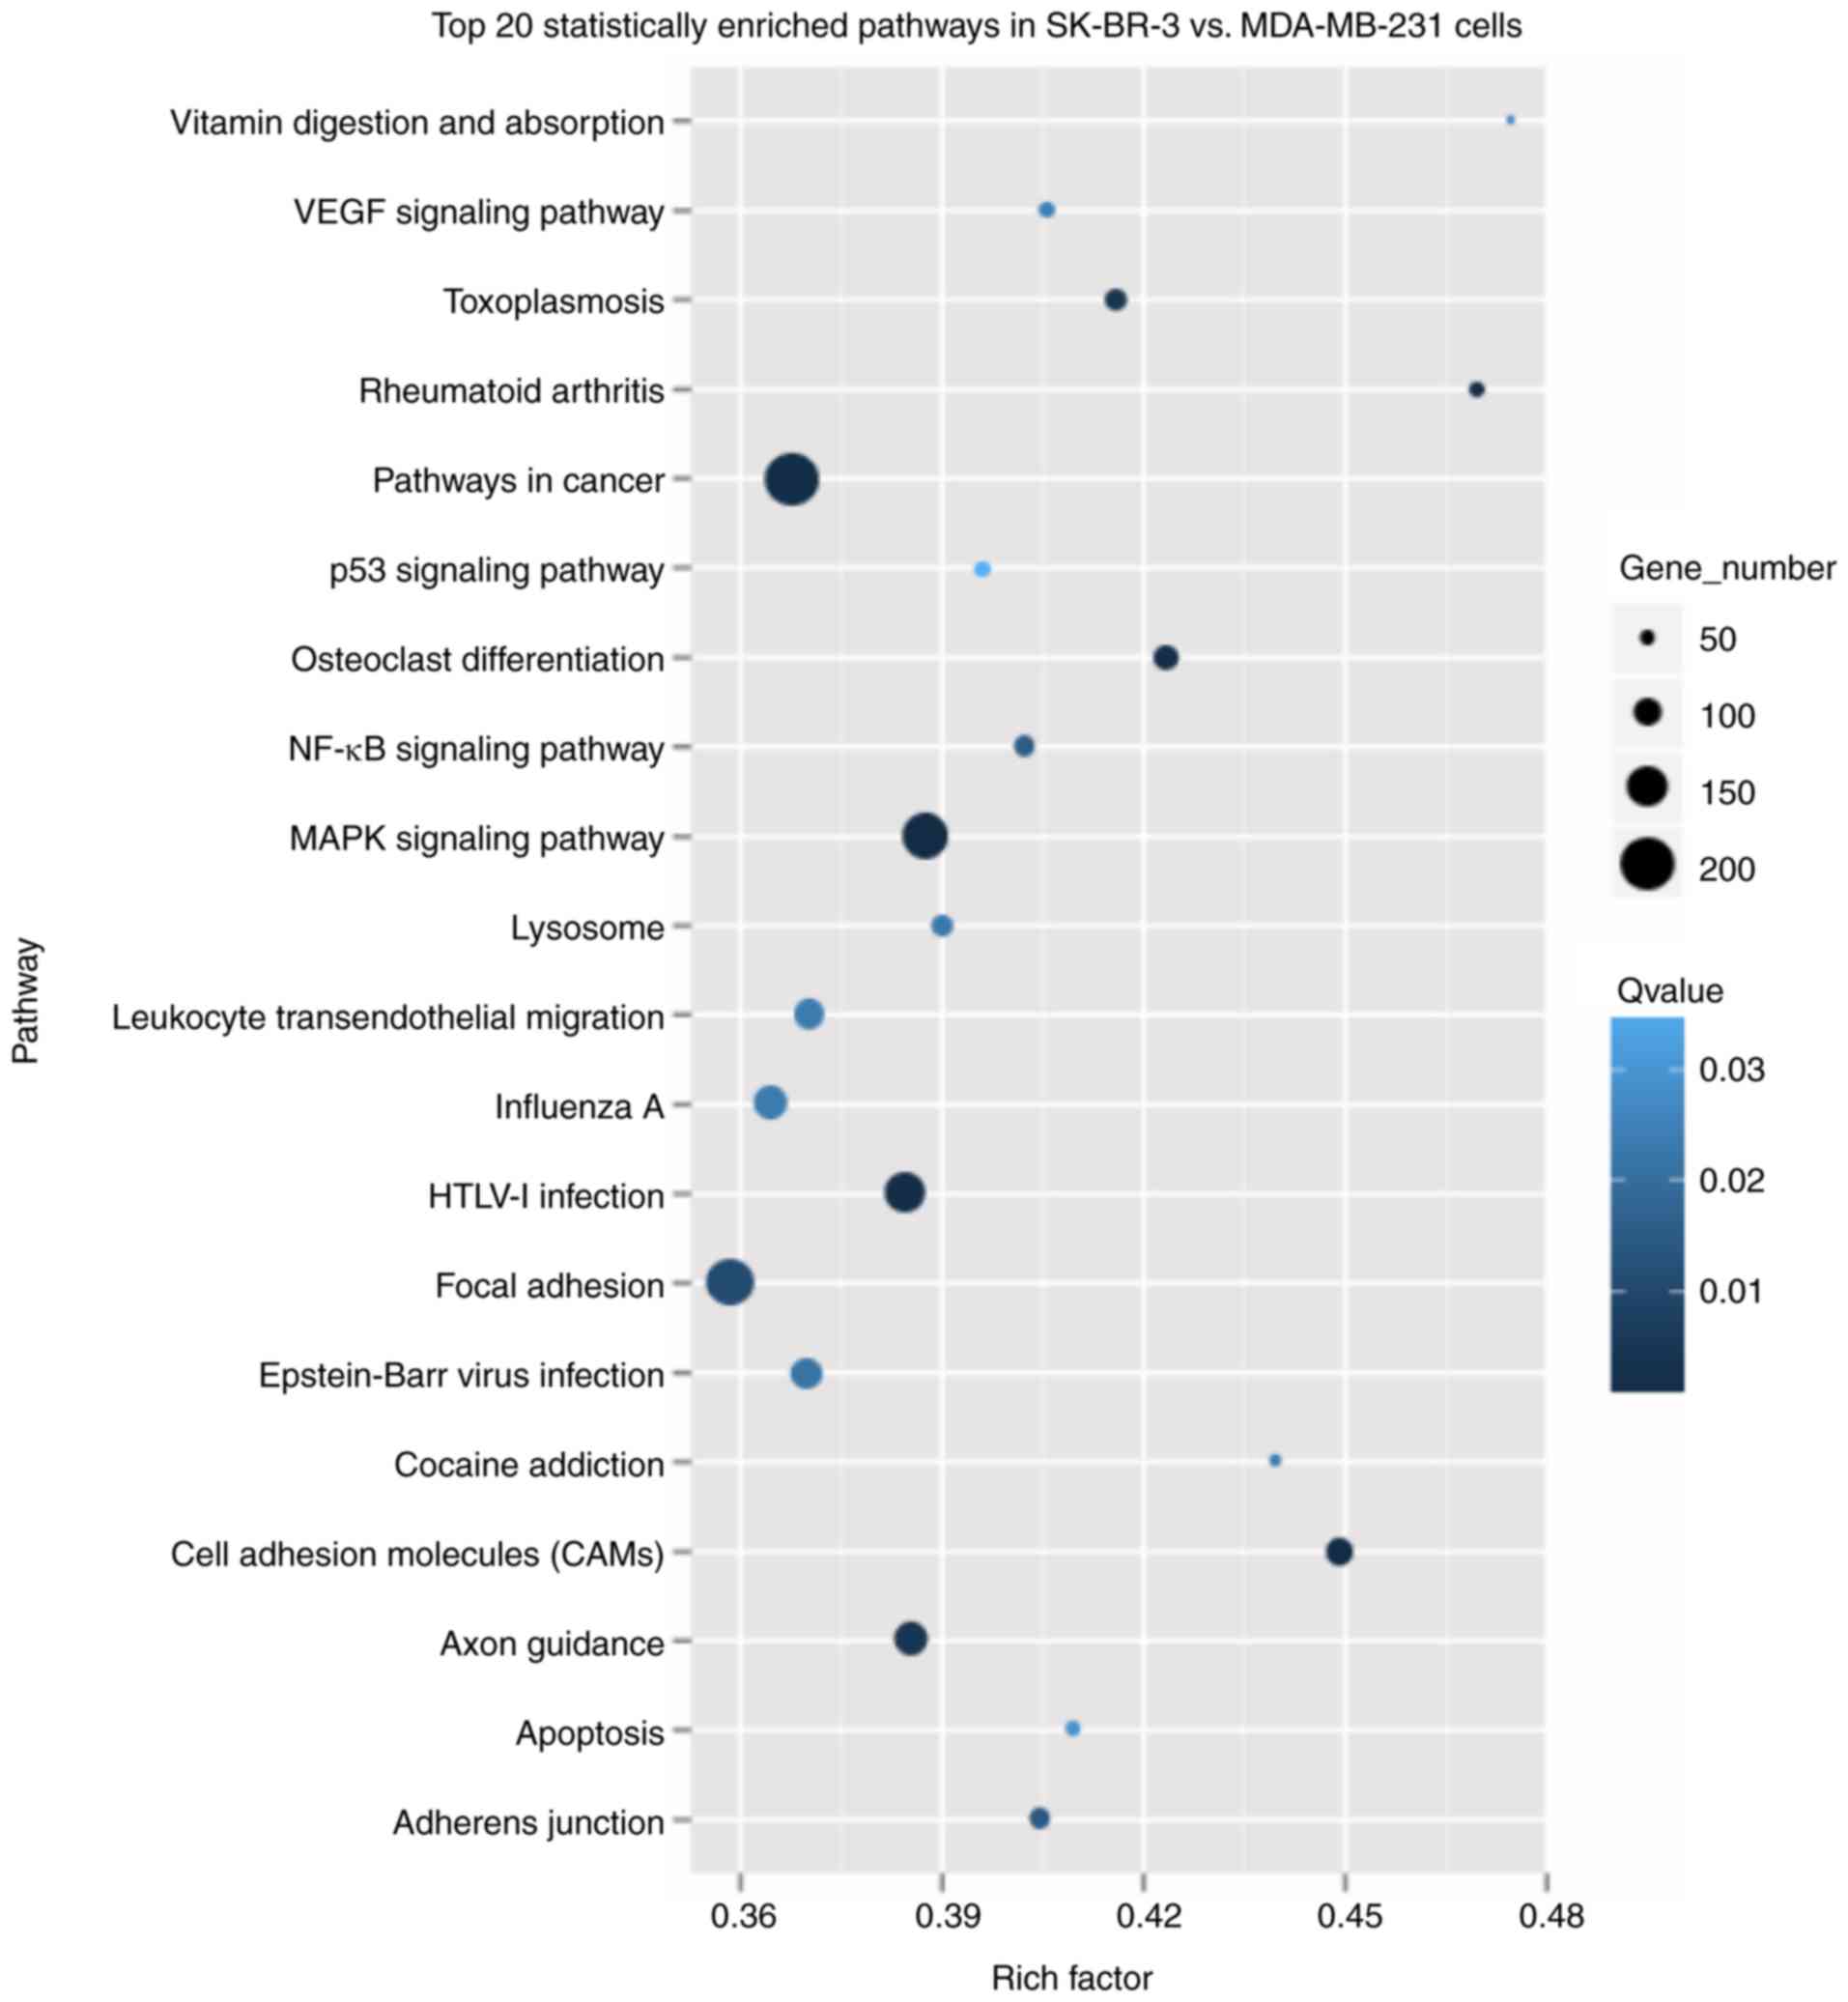
KEGG pathway analysis in SK-BR-3 vs.
MDA-MB-231 cells
To assess the enrichment in signaling pathways, KEGG
was used to analyze the 2,717 upregulated and 3,588 downregulated
genes. The top three significantly enriched pathways were ‘Pathways
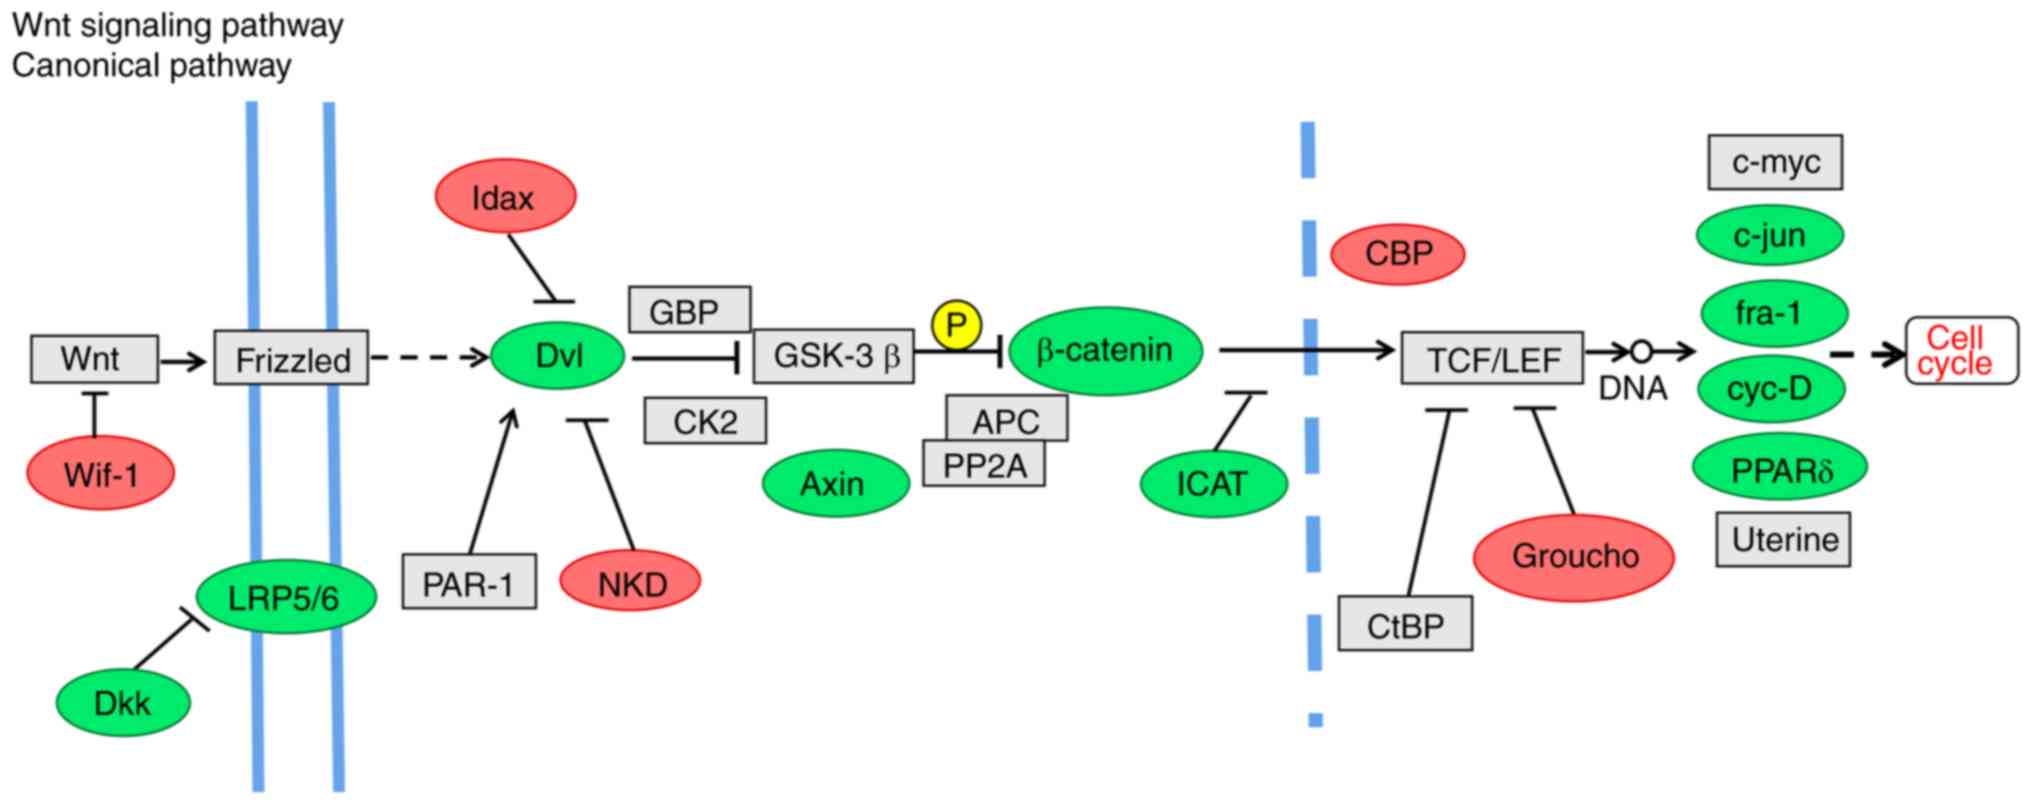
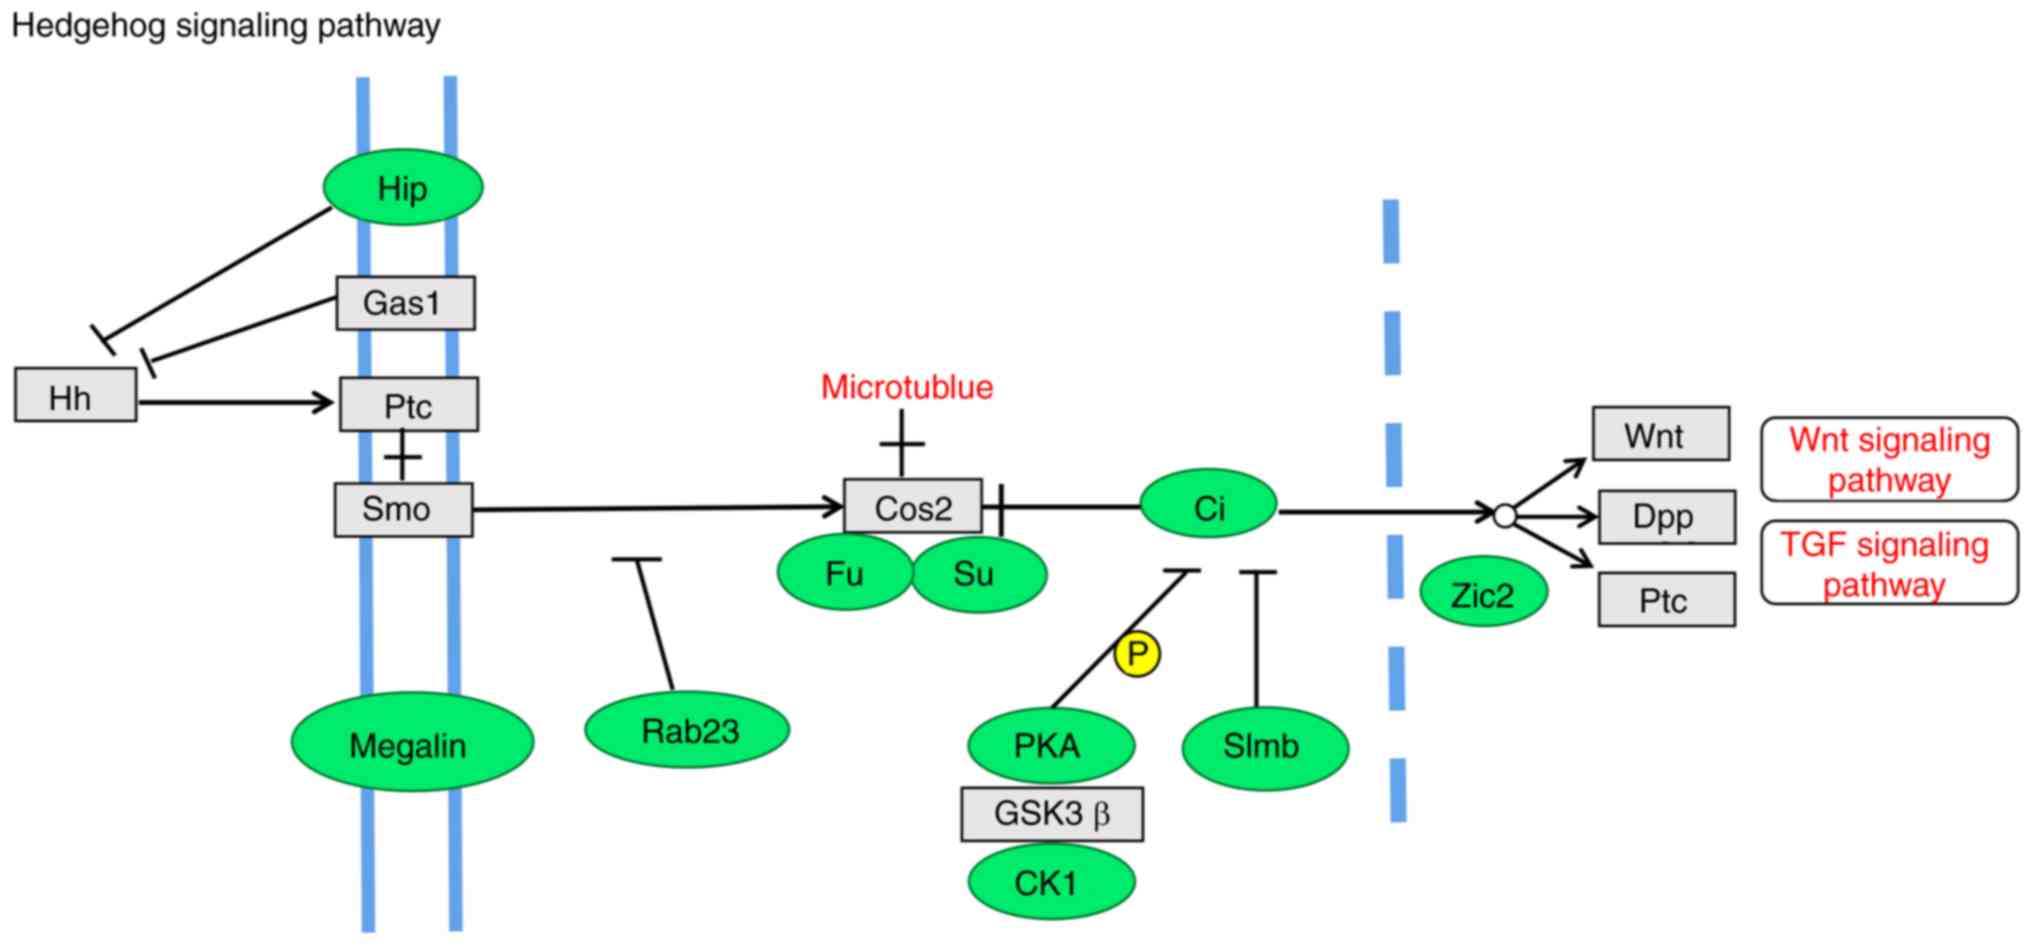
in cancer', ‘Focal adhesion' and ‘MAPK signaling pathway' (Fig. 6; Table VI). The Wnt, Notch, Hedgehog and
transforming growth factor (TGF)-β signaling pathways are
associated with maintaining stemness (31-35).
The Wnt signaling pathway is associated with CSC growth,
differentiation and apoptosis (36), and β-catenin serves a key role in
cell-cell adhesion and is a key regulatory factor of the Wnt
pathway (37). The Wnt inhibitor
Wif-1 and the transcriptional repressor of the Wnt pathway Groucho
were upregulated in SK-BR-3 cells (Fig. 7). In addition, Dkk, low-density
lipoprotein receptor-related protein 5/6 (LRP5/6), β-catenin and
Axin were downregulated in the Wnt pathway in SK-BR-3 cells
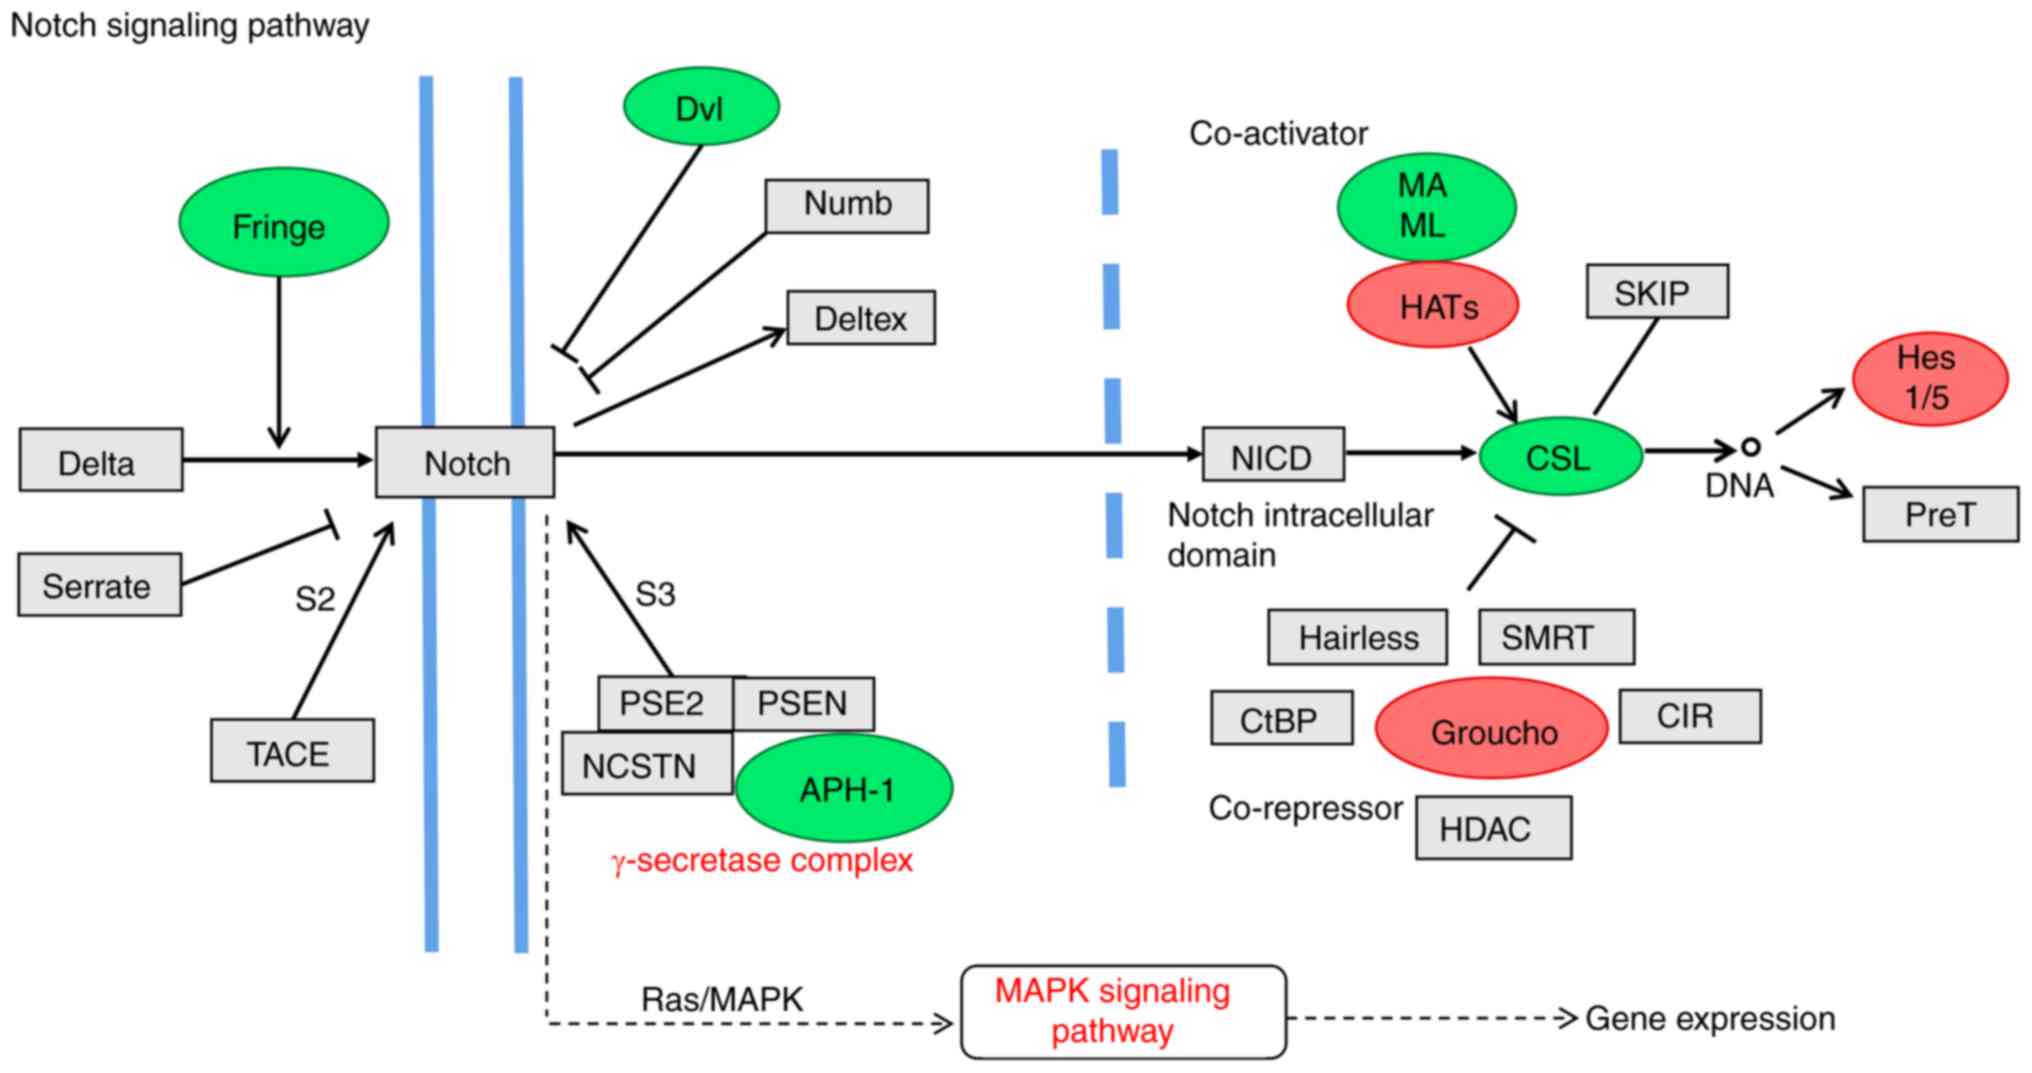
(Fig. 7). The selected genes
(Groucho, Hes1/5, mastermind-like transcriptional coactivator 1 and
CSL (a class of DNA binding proteins) of the Notch pathway, which
participate in tumor self-renewal and differentiation, were altered
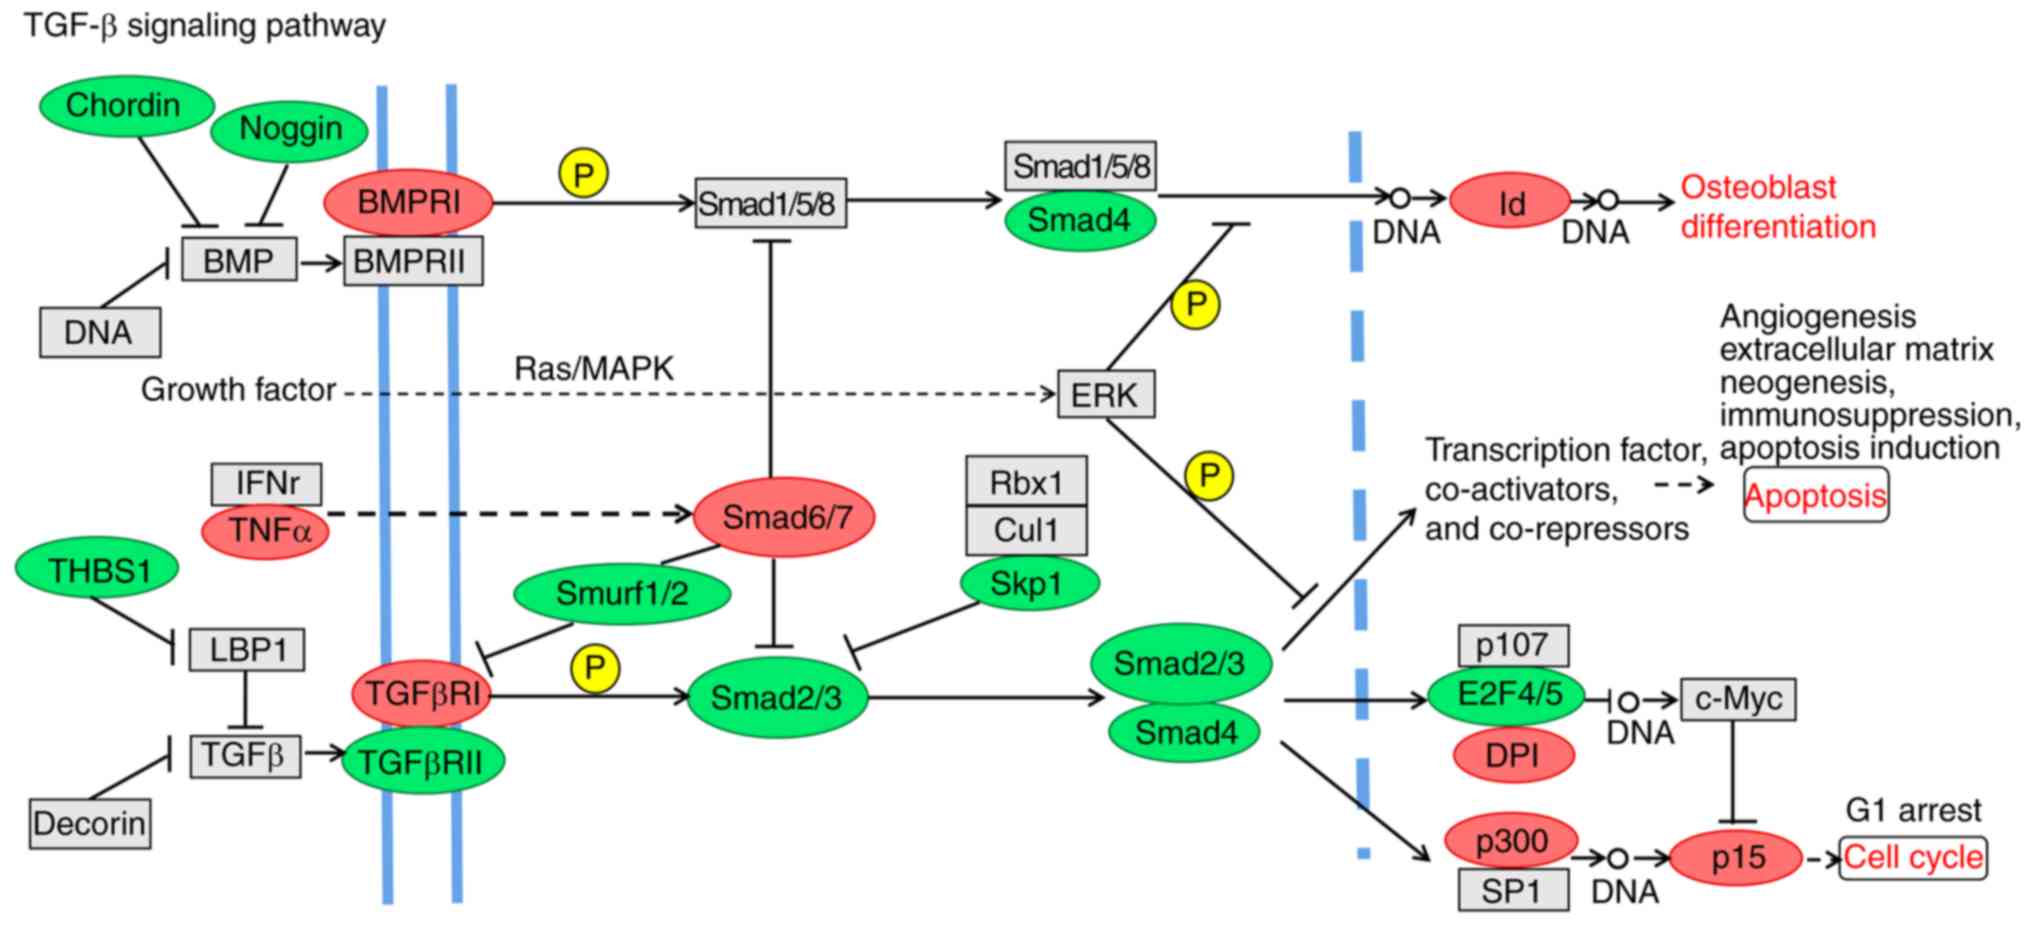
in SK-BR-3 cells (Fig. 8).
Furthermore, the expression of Smad6/7 in the TGF-β pathway was
higher in SK-BR-3 cells, whereas the expression levels of Smurf1/2,
Smad2/3 and Smad4 were reduced (Fig.
9). Notably, there were several downregulated genes in the
Hedgehog signaling pathway, such as the transcription factor Ci,
and the Hip, Megalin, Rab23, Fused, protein kinase-A, casein kinase
1, Slimb and Zic2 (Hpe5) genes (Fig.
10). β-catenin is a key intracellular signaling protein of the
Wnt pathway, which triggers the expression of target genes c-Myc
and cyclin D1 (37). A high level
of β-catenin expression in tumor cells also indicates a poor
prognosis (37,38). Therefore, the expression of
β-catenin was reduced in SK-BR-3 cells compared with in MDA-MB-231
cells, and may serve as a prognostic indicator for breast cancer.
Other gene alterations in stem cell-related signaling pathways
require further observation.
| Table VIPathway enrichment analysis of DEGs
in SK-BR-3 vs. MDA-MB-231 cells. |
Table VI
Pathway enrichment analysis of DEGs
in SK-BR-3 vs. MDA-MB-231 cells.
| Pathway | DEGs with the
pathway annotation (n/5138, %) | P-value |
|---|
| Pathways in
cancer | 200 (3.89) |
2.5×10⁻⁵ |
| Focal adhesion | 176 (3.43) | 0.0003 |
| MAPK signaling
pathway | 169 (3.25) |
4.06×10⁻⁶ |
| HTLV-1
infection | 148 (2.88) |
2.3×10⁻⁵ |
| Axon guidance | 121 (2.36) | 0.0001 |
| Cell adhesion
molecules (CAMs) | 97 (1.89) |
2.90×10⁻⁷ |
| Osteoclast
differentiation | 91 (1.77) |
1.34×10⁻⁵ |
| Toxoplasmosis | 79 (1.54) |
9.9×10⁻⁵ |
| Adhere
junction | 72 (1.4) | 0.0005 |
| NF-κB signaling
pathway | 72 (1.4) | 0.0006 |
| Rheumatoid
arthritis | 54 (1.05) |
2.6×10⁻⁵ |
Chemokines and receptors in SK-BR-3 vs.
MDA-MB-231 cells
The present study detected a statistically
significant increase in the expression of several genes (Fig. 3F; Table II). [C-C motif chemokine ligand 22
(CCL22), C-X3-C motif chemo-kine receptor 1 (CX3CR1) and C-X3-C
motif chemokine ligand 1 (CX3CL1)] in SK-BR-3 cells. Conversely,
significantly decreased expression of chemokine subfamily members
[C-X-C motif chemokine ligand (CXCL)1, CXCL2, CXCL3, CXCL8, CXCL10
and CXCL11] was detected in SK-BR-3 cells. A previous study
indicated that vascular endothelial growth factor (VEGF) may
promote tumor growth by auto-crine secretion (39). VEGF also stimulates the
proliferation and migration of vascular endothelial cells through
paracrine secretion and enhances angiogenesis, thereby promoting
tumor development and metastasis (39). Among the members of the VEGF
family, VEGFA and VEGFC are lymphokine factors that are abundantly
expressed in invasive cells, such as melanoma, non-small-cell lung
cancer and breast cancer cells, and are considered to be involved
in tumor angiogenesis and metastasis (40,41).
The present analysis demonstrated that the expression levels of
VEGFA and VEGFC were low in SK-BR-3 cells (Fig. 3F; Table II). Further studies are required
to elucidate the role of increased expression of certain genes,
such as CCL22, CX3CR1 and CX3CL1, in SK-BR-3 cells.
Discussion
In the present study, the
CD44+/CD24−/low ratio was >90% in
MDA-MB-231 cells; however, there were almost no
CD44+/CD24−/low cells among SK-BR-3 cells. In
2003, Al-Hajj et al (23)
demonstrated that CD44+/CD24−/low cells in
breast cancer tissue had tumor-forming ability, and these
CD44+/CD24−/low breast cancer cells could not
only proliferate indefinitely, but also had the ability of
asymmetric differentiation and self-renewal, further proving that
CD44+/CD24−/low breast cancer cells exhibit
CSC characteristics (42,43).
CD44+/CD24−/low is currently the most
commonly used marker for breast CSCs (23). Furthermore,
CD44+/CD24−/low cells possess the ability to
form micro-spheres (44);
therefore, the microsphere-forming ability of SK-BR-3 cells was
weaker than that of MDA-MB-231 cells. In addition, the results
demonstrated that both SK-BR-3 and MDA-MB-231 cells exhibit strong
migratory and invasive abilities. CSCs are considered to be the key
to tumor recurrence and metastasis (45). These results indicated that,
although CD44+/CD24−/low breast cancer cells
have the characteristics of CSCs,
CD44+/CD24−/low may not be an accurate stem
cell marker of SK-BR-3 cells. Therefore, it may be hypothesized
that there are other types of CSC markers in SK-BR-3 cells.
Using RNA sequencing and other experiments, it was
revealed that the expression levels of CSC markers, such as
ALDH1A3, ALDH3B2, CD164 and EpCAM, were markedly upregulated in
SK-BR-3 cells and HER-2-positive breast cancer. In a previous
study, Ginestier et al (29) reported that ALDH1-positive cells
account for 8% of normal human breast epithelial cells and possess
the characteristics of CSCs. A xenograft transplantation experiment
in NOD/SCID mice was subsequently performed, and the results
demonstrated that 500 ALDH1+ cells were able to form a
tumor, but 50,000 ALDH1− cells failed to form a tumor
(29). The ALDH family has 19
enzymes in human cells, which are widely distributed in various
tissues and catalyze the oxidation of various aldehydes. ALDH1A3
and ALDH3B2 belong to the ALDH family (46); ALDH1 has been considered a CSC
marker in several types of cancer (29); however, only ALDH1A3 gene
expression levels (based on FPKM value) were significantly
increased in SK-BR-3 cells. ALDH1A3 and ALDH3B2 may have similar
functions, and may be used as CSC markers in SK-BR-3 cells,
although further investigation is required. EpCAM was first
identified in colon cancer, and has been reported to be involved in
regulating cell adhesion, proliferation, differentiation, migration
and signal transduction (47).
Kimura et al (30) observed
that EpCAM-positive liver CSCs could form tumors in SCID mice. In
this previous study, EpCAM-positive and -negative subgroups of
hepatocellular carcinoma cells were injected into the
immune-deficient mice; the results demonstrated that a markedly
smaller number of EpCAM-positive cells was sufficient to form a
tumor compared with EpCAM-negative cells, indicating that the
tumorigenicity of the EpCAM-positive cancer cells was stronger.
This study also demonstrated that EpCAM-positive cancer cells could
differentiate into EpCAM-positive and -negative cells, whereas
EpCAM-negative cancer cells could only differentiate into
EpCAM-negative cells, indicating that only EpCAM-positive cancer
cells exhibit diversity in their differentiation ability (30). Therefore, EpCAM is likely to
represent a CSC marker for SK-BR-3 cells. CD164 functions include
mediating or regulating the adhesion of hematopoietic progenitor
cells, and their growth and/or differentiation (48,49).
Previous studies have reported that CD164 not only regulates the
growth and differentiation of hematopoietic progenitor cells, but
also promotes the growth and invasion of malignant tumors (50,51).
CD164 is also considered a potential promoter for regulating tumor
growth, and a diagnostic marker for acute lymphoblastic leukemia
and allergy (52-54). The potential relationship between
CD164 and CSCs remains unclear. Previous studies (48-54)
have demonstrated that CD164 may be used as a potential therapeutic
target for HER-2-positive breast cancer.
EMT gene expression was examined in SK-BR-3 cells in
this study. Certain epithelial marker genes, including CD24, CLDN3,
CLDN8 and ERBB2, were upregulated, whereas mesenchymal markers,
such as ACTA2, CDH11, FN1, ITGA5, SNAI2 and VIM, were markedly
downregulated. EMT can result in acquisition of the behavior of
stromal cells, which is the key to early invasion and metastasis of
breast cancer (55,56), and is a sign of poor prognosis of
breast cancer (57). The EMT
ability of SK-BR-3 cells is weak compared with that of MDA-MB-231
cells, thus epithelial marker genes were upregulated and
mesenchymal genes were downregulated.
Under physiological conditions, cell proliferation,
apop-tosis, differentiation and regeneration are strictly regulated
by signaling transduction pathways. Once a component of the
signaling transduction pathway is mutated or otherwise altered, the
cells may display abnormal differentiation and unrestricted growth,
eventually forming tumors (58).
β-catenin is a key intracellular signaling protein of the Wnt
pathway, which triggers the expression of target genes c-Myc and
cyclin D1 (37). A high level of
β-catenin expression in tumor cells also indicates a poor prognosis
(37,38). In agreement with these data, the
results demonstrated that the expression of β-catenin was lower in
SK-BR-3 cells compared with in MDA-MB-231 cells. Therefore,
β-catenin may be a prognostic indicator for patients with breast
cancer, as well as a novel target for TNBC treatment in the future.
The MAPK signaling pathway was highly active in SK-BR-3 cells;
therefore, investigating the molecular mechanisms involved in the
MAPK signaling pathway may provide a new method for the treatment
of HER-2-positive breast cancer.
It has been reported that tumor cells and stromal
cells may express chemokines and receptors, which can mediate tumor
progression and metastasis. Chemokines and their receptors may
enhance tumor growth by regulating the tumor inflammatory response,
increasing angiogenesis, and inhibiting the anti-tumor immune
response to promote tumor development and progression (59,60).
The expression of chemokines and receptors, CCL22, CX3CR1 and
CX3CL1, were significantly increased in SK-BR-3 cells; however, the
roles of these genes in SK-BR-3 cells require further
elucidation.
In conclusion, the results of the present study
demonstrated that SK-BR-3 cells had almost no
CD44+/CD24−/low expression, and that ALDH1A3,
ALDH3B2 and EpCAM may represent CSC markers in SK-BR-3 cells. CD164
may be used as a potential therapeutic target for HER-2-positive
breast cancer. In addition, β-catenin of the Wnt signaling pathway
may be used as a prognostic indicator for breast cancer. Taken
together, these data indicated a novel prognostic indicator,
therapeutic targets and a novel approach to the management of
HER-2-positive breast cancer.
Funding
This work was supported by grants from the National
Natural Science Foundation of China (grant no. 81272898).
Availability of data and materials
The datasets used and/or analyzed during the current
study are available from the corresponding author on reasonable
request.
Authors' contributions
SZG and XHZ conceived and designed the study. LF and
GA contributed to design and perform the experiments. SHK collected
breast cancer and paracancerous tissue samples, and patient data.
LF and SHK performed the bioinformatics analysis and statistical
analyses. LF and SHK drafted the manuscript. LF and GYW revised the
manuscript. All the authors have read and approved the final
version of this manuscript.
Ethical approval and consent to
participate
Written informed consent was obtained from the
patients, and ethical approval was obtained from the Ethics
Committee of The First Affiliated Hospital of Xi'an Jiaotong
University (approval no. XJTU1AF2019LSK-2019-029).
Patient consent for publication
Not applicable.
Competing interests
The authors declare that they have no competing
interests.
Acknowledgments
Not applicable.
References
|
1
|
Ferlay J, Soerjomataram I, Dikshit R, Eser
S, Mathers C, Rebelo M, Parkin DM, Forman D and Bray F: Cancer
incidence and mortality worldwide: Sources methods and major
patterns in GLOBOCAN 2012. Int J Cancer. 136:E359–E386. 2015.
View Article : Google Scholar
|
|
2
|
Ellsworth RE, Blackburn HL, Shriver CD,
Soon-Shiong P and Ellsworth DL: Molecular heterogeneity in breast
cancer: State of the science and implications for patient care.
Semin Cell Dev Biol. 64:65–72. 2017. View Article : Google Scholar
|
|
3
|
Perou CM, Sørlie T, Eisen MB, van de Rijn
M, Jeffrey SS, Rees CA, Pollack JR, Ross DT, Johnsen H, Akslen LA,
et al: Molecular portraits of human breast tumours. Nature.
406:747–752. 2000. View
Article : Google Scholar : PubMed/NCBI
|
|
4
|
Slamon DJ, Clark GM, Wong SG, Levin WJ,
Ullrich A and McGuire WL: Human breast cancer: Correlation of
relapse and survival with amplification of the HER-2/neu oncogene.
Science. 235:177–182. 1987. View Article : Google Scholar : PubMed/NCBI
|
|
5
|
Slamon DJ, Godolphin W, Jones LA, Holt JA,
Wong SG, Keith DE, Levin WJ, Stuart SG, Udove J, Ullrich A, et al:
Studies of the HER-2/neu proto-oncogene in human breast and ovarian
cancer. Science. 244:707–712. 1989. View Article : Google Scholar : PubMed/NCBI
|
|
6
|
Vogel CL, Cobleigh MA, Tripathy D, Gutheil
JC, Harris LN, Fehrenbacher L, Slamon DJ, Murphy M, Novotny WF,
Burchmore M, et al: Efficacy and safety of trastuzumab as a single
agent in first-line treatment of HER2-overexpressing metastatic
breast cancer. J Clin Oncol. 20:719–726. 2002. View Article : Google Scholar : PubMed/NCBI
|
|
7
|
Baselga J, Carbonell X, Castañeda-Soto NJ,
Clemens M, Green M, Harvey V, Morales S, Barton C and Ghahramani P:
Phase II study of efficacy, safety, and pharmacokinetics of
trastuzumab monotherapy administered on a 3-weekly schedule. J Clin
Oncol. 23:2162–2171. 2005. View Article : Google Scholar : PubMed/NCBI
|
|
8
|
Marty M, Cognetti F, Maraninchi D, Snyder
R, Mauriac L, Tubiana-Hulin M, Chan S, Grimes D, Antón A, Lluch A,
et al: Randomized phase II trial of the efficacy and safety of
trastu-zumab combined with docetaxel in patients with human
epidermal growth factor receptor 2-positive metastatic breast
cancer administered as first-line treatment: The M77001 study
group. J Clin Oncol. 23:4265–4274. 2005. View Article : Google Scholar : PubMed/NCBI
|
|
9
|
Slamon DJ, Leyland-Jones B, Shak S, Fuchs
H, Paton V, Bajamonde A, Fleming T, Eiermann W, Wolter J, Pegram M,
et al: Use of chemotherapy plus a monoclonal antibody against HER2
for metastatic breast cancer that overexpresses HER2. N Engl J Med.
344:783–792. 2001. View Article : Google Scholar : PubMed/NCBI
|
|
10
|
Sun Z, Shi Y, Shen Y, Cao L, Zhang W and
Guan X: Analysis of different HER-2 mutations in breast cancer
progression and drug resistance. J Cell Mol Med. 19:2691–2701.
2015. View Article : Google Scholar : PubMed/NCBI
|
|
11
|
Pinto AE, André S, Pereira T, Nóbrega S
and Soares J: C-erbB-2 oncoprotein overexpression identifies a
subgroup of estrogen receptor positive (ER+) breast cancer patients
with poor prognosis. Ann Oncol. 12:525–533. 2001. View Article : Google Scholar : PubMed/NCBI
|
|
12
|
Bauer KR, Brown M, Cress RD, Parise CA and
Caggiano V: Descriptive analysis of estrogen receptor
(ER)-negative, progesterone receptor (PR)-negative, and
HER2-negative invasive breast cancer, the so-called triple-negative
phenotype: A population-based study from the California cancer
Registry. Cancer. 109:1721–1728. 2007. View Article : Google Scholar : PubMed/NCBI
|
|
13
|
Dawood S, Broglio K, Kau SW, Green MC,
Giordano SH, Meric-Bernstam F, Buchholz TA, Albarracin C, Yang WT,
Hennessy BT, et al: Triple receptor-negative breast cancer: The
effect of race on response to primary systemic treatment and
survival outcomes. J Clin Oncol. 27:220–226. 2009. View Article : Google Scholar
|
|
14
|
Dent R, Trudeau M, Pritchard KI, Hanna WM,
Kahn HK, Sawka CA, Lickley LA, Rawlinson E, Sun P and Narod SA:
Triple-negative breast cancer: Clinical features and patterns of
recurrence. Clin Cancer Res. 13:4429–4434. 2007. View Article : Google Scholar : PubMed/NCBI
|
|
15
|
Wang Z, Gerstein M and Snyder M: RNA-seq:
A revolutionary tool for transcriptomics. Nat Rev Genet. 10:57–63.
2009. View Article : Google Scholar
|
|
16
|
Liu T, Yu N, Ding F, Wang S, Li S, Zhang
X, Sun X, Chen Y and Liu P: Verifying the markers of ovarian cancer
using RNA-seq data. Mol Med Rep. 12:1125–1130. 2015. View Article : Google Scholar : PubMed/NCBI
|
|
17
|
Li B and Dewey CN: RSEM: Accurate
transcript quantification from RNA-Seq data with or without a
reference genome. BMC Bioinformatics. 12:3232011. View Article : Google Scholar : PubMed/NCBI
|
|
18
|
Li H and Durbin R: Fast and accurate short
read alignment with Burrows-Wheeler transform. Bioinformatics.
25:1754–1760. 2009. View Article : Google Scholar : PubMed/NCBI
|
|
19
|
Audic S and Claverie JM: The significance
of digital gene expression profiles. Genome Res. 7:986–995. 1997.
View Article : Google Scholar : PubMed/NCBI
|
|
20
|
Beissbarth T and Speed TP: GOstat: Find
statistically over-represented Gene Ontologies within a group of
genes. Bioinformatics. 20:1464–1465. 2004. View Article : Google Scholar : PubMed/NCBI
|
|
21
|
Mao X, Cai T, Olyarchuk JG and Wei L:
Automated genome annotation and pathway identification using the
KEGG orthology (KO) as a controlled vocabulary. Bioinformatics.
21:3787–3793. 2005. View Article : Google Scholar : PubMed/NCBI
|
|
22
|
Livak KJ and Schmittgen TD: Analysis of
relative gene expression data using real-time quantitative PCR and
the 2(-Delta Delta C(T)) method. Methods. 25:402–408. 2001.
View Article : Google Scholar
|
|
23
|
Al-Hajj M, Wicha MS, Benito-Hernandez A,
Morrison SJ and Clarke MF: Prospective identification of
tumorigenic breast cancer cells. Proc Natl Acad Sci USA.
100:3983–3988. 2003. View Article : Google Scholar : PubMed/NCBI
|
|
24
|
Li W, Ma H, Zhang J, Zhu L, Wang C and
Yang Y: Unraveling the roles of CD44/CD24 and ALDH1 as cancer stem
cell markers in tumorigenesis and metastasis. Sci Rep. 7:138562017.
View Article : Google Scholar : PubMed/NCBI
|
|
25
|
Shao J, Fan W, Ma B and Wu Y: Breast
cancer stem cells expressing different stem cell markers exhibit
distinct biological characteristics. Mol Med Rep. 14:4991–4998.
2016. View Article : Google Scholar : PubMed/NCBI
|
|
26
|
Yin H and Glass J: The phenotypic
radiation resistance of CD44+/CD24(-or low) breast cancer cells is
mediated through the enhanced activation of ATM signaling. PLoS
One. 6:pp. e240802011, View Article : Google Scholar : PubMed/NCBI
|
|
27
|
Zhang J, Kinoh H, Hespel L, Liu X, Quader
S, Martin J, Chida T, Cabral H and Kataoka K: Effective treatment
of drug resistant recurrent breast tumors harboring cancer
stem-like cells by stau-rosporine/epirubicin co-loaded polymeric
micelles. J Control Release. 264:127–135. 2017. View Article : Google Scholar : PubMed/NCBI
|
|
28
|
Puchinskaya MV: Cancer stem cell markers
and their prognostic value. Arkh Patol. 78:47–54. 2016.In Russian.
View Article : Google Scholar : PubMed/NCBI
|
|
29
|
Ginestier C, Hur MH, Charafe-Jauffret E,
Monville F, Dutcher J, Brown M, Jacquemier J, Viens P, Kleer CG,
Liu S, et al: ALDH1 is a marker of normal and malignant human
mammary stem cells and a predictor of poor clinical outcome. Cell
Stem Cell. 1:555–567. 2007. View Article : Google Scholar
|
|
30
|
Kimura O, Takahashi T, Ishii N, Inoue Y,
Ueno Y, Kogure T, Fukushima K, Shiina M, Yamagiwa Y, Kondo Y, et
al: Characterization of the epithelial cell adhesion molecule
(EpCAM)+ cell population in hepatocellular carcinoma cell lines.
Cancer Sci. 101:2145–2155. 2010. View Article : Google Scholar : PubMed/NCBI
|
|
31
|
Fodde R and Brablet T: Wnt/beta-catenin
signaling in cancer stemness and malignant behavior. Curr Opin Cell
Biol. 19:150–158. 2007. View Article : Google Scholar : PubMed/NCBI
|
|
32
|
Androutsellis-Theotokis A, Leker RR,
Soldner F, Hoeppner DJ, Ravin R, Poser SW, Rueger MA, Bae SK,
Kittappa R and McKay RD: Notch signalling regulates stem cell
numbers in vitro and in vivo. Nature. 442:823–826. 2006. View Article : Google Scholar : PubMed/NCBI
|
|
33
|
Valenti G, Quinn HM, Heynen GJJE, Lan L,
Holland JD, Vogel R, Wulf-Goldenberg A and Birchmeier W: Cancer
stem cells regulate cancer-associated fibroblasts via activation of
Hedgehog signaling in mammary gland tumors. Cancer Res.
77:2134–2147. 2017. View Article : Google Scholar : PubMed/NCBI
|
|
34
|
Daynac M, Tirou L, Faure H, Mouthon MA,
Gauthier LR, Hahn H, Boussin FD and Ruat M: Hedgehog controls
quiescence and activation of neural stem cells in the adult
ventricular-subventricular zone. Stem Cell Reports. 7:735–748.
2016. View Article : Google Scholar : PubMed/NCBI
|
|
35
|
Sakaki-Yumoto M, Katsuno Y and Derynck R:
TGF-β family signaling in stem cells. Biochim Biophys Acta.
1830:2280–2296. 2013. View Article : Google Scholar
|
|
36
|
Zhang J, Lai W, Li Q, Yu Y, Jin J, Guo W,
Zhou X, Liu X and Wang Y: A novel oncolytic adenovirus targeting
Wnt signaling effectively inhibits cancer-stem like cell growth via
metastasis, apoptosis and autophagy in HCC models. Biochem Biophys
Res Commun. 491:469–477. 2017. View Article : Google Scholar : PubMed/NCBI
|
|
37
|
Khramtsov AI, Khramtsova GF, Tretiakova M,
Huo D, Olopade OI and Goss KH: Wnt/beta-catenin pathway activation
is enriched in basal-like breast cancers and predicts poor outcome.
Am J Pathol. 176:2911–2920. 2010. View Article : Google Scholar : PubMed/NCBI
|
|
38
|
Li T, Zhang L and Huo X: Inhibitory
effects of aesculetin on the proliferation of colon cancer cells by
the Wnt/β-catenin signaling pathway. Oncol Lett. 15:7118–7122.
2018.PubMed/NCBI
|
|
39
|
Medeiros PJ and Jackson DN: Neuropeptide Y
Y5-receptor activation on breast cancer cells acts as a paracrine
system that stimulates VEGF expression and secretion to promote
angiogenesis. Peptides. 48:106–113. 2013. View Article : Google Scholar : PubMed/NCBI
|
|
40
|
Zhang Y, Meng X, Zeng H, Guan Y, Zhang Q,
Guo S, Liu X and Guo Q: Serum vascular endothelial growth factor-C
levels: A possible diagnostic marker for lymph node metastasis in
patients with primary non-small cell lung cancer. Oncol Lett.
6:545–549. 2013. View Article : Google Scholar : PubMed/NCBI
|
|
41
|
Saharinen P, Eklund L, Pulkki K, Bono P
and Alitalo K: VEGF and angiopoietin signaling in tumor
angiogenesis and metastasis. Trends Mol Med. 17:347–362. 2011.
View Article : Google Scholar : PubMed/NCBI
|
|
42
|
Clarke MF, Dick JE, Dirks PB, Eaves CJ,
Jamieson CH, Jones DL, Visvader J, Weissman IL and Wahl GM: Cancer
stem cells-perspectives on current status and future directions:
AACR Workshop on cancer stem cells. Cancer Res. 66:9339–9344. 2006.
View Article : Google Scholar : PubMed/NCBI
|
|
43
|
Okamoto OK and Perez JF: Targeting cancer
stem cells with monoclonal antibodies: A new perspective in cancer
therapy and diagnosis. Expert Rev Mol Diagn. 8:387–393. 2008.
View Article : Google Scholar : PubMed/NCBI
|
|
44
|
Phillips TM, McBride WH and Pajonk F: The
response of CD24(-/low)/CD44+ breast cancer-initiating cells to
radiation. J Natl Cancer Inst. 98:1777–1785. 2006. View Article : Google Scholar : PubMed/NCBI
|
|
45
|
Sottoriva A, Verhoeff JJ, Borovski T,
McWeeney SK, Naumov L, Medema JP, Sloot PM and Vermeulen L: Cancer
stem cell tumor model reveals invasive morphology and increased
phenotypical heterogeneity. Cancer Res. 70:46–56. 2010. View Article : Google Scholar : PubMed/NCBI
|
|
46
|
Marcato P, Dean CA, Giacomantonio CA and
Lee PW: Aldehyde dehydrogenase: Its role as a cancer stem cell
marker comes down to the specific isoform. Cell Cycle.
10:1378–1384. 2011. View Article : Google Scholar : PubMed/NCBI
|
|
47
|
Yamashita T, Ji J, Budhu A, Forgues M,
Yang W, Wang HY, Jia H, Ye Q, Qin LX, Wauthier E, et al:
EpCAM-positive hepatocellular carcinoma cells are tumor-initiating
cells with stem/progenitor cell features. Gastroenterology.
136:1012–1024. 2009. View Article : Google Scholar : PubMed/NCBI
|
|
48
|
Watt SM and Chan JY: CD164-a novel
sialomucin on CD34+ cells. Leuk Lymphoma. 37:1–25. 2000. View Article : Google Scholar : PubMed/NCBI
|
|
49
|
Lee YN, Kang JS and Krauss RS:
Identification of a role for the sialomucin CD164 in myogenic
differentiation by signal sequence trapping in yeast. Mol Cell
Biol. 21:7696–7706. 2001. View Article : Google Scholar : PubMed/NCBI
|
|
50
|
Lin J, Xu K, Wei J, Heimberger AB, Roth JA
and Ji L: MicroRNA-124 suppresses tumor cell proliferation and
invasion by targeting CD164 signaling pathway in non-small cell
lung cancer. J Gene Ther. 2:62016.PubMed/NCBI
|
|
51
|
Tang J, Zhang L, She X, Zhou G, Yu F,
Xiang J and Li G: Inhibiting CD164 expression in colon cancer cell
line HCT116 leads to reduced cancer cell proliferation, mobility,
and metastasis in vitro and in vivo. Cancer Invest. 30:380–389.
2012. View Article : Google Scholar : PubMed/NCBI
|
|
52
|
Wong PF and Abubakar S: Comparative
transcriptional study of the effects of high intracellular zinc on
prostate carcinoma cells. Oncol Rep. 23:1501–1516. 2010.PubMed/NCBI
|
|
53
|
Coustan-Smith E, Song G, Clark C, Key L,
Liu P, Mehrpooya M, Stow P, Su X, Shurtleff S, Pui CH, et al: New
markers for minimal residual disease detection in acute
lymphoblastic leukemia. Blood. 117:6267–6276. 2011. View Article : Google Scholar : PubMed/NCBI
|
|
54
|
Chirumbolo S: CD164 and other recently
discovered activation markers as promising tools for allergy
diagnosis: What's new? Clin Exp Med. 11:255–257. 2011. View Article : Google Scholar : PubMed/NCBI
|
|
55
|
Arendt LM, Rudnick JA, Keller PJ and
Kuperwasser C: Stroma in breast development and disease. Semin Cell
Dev Biol. 21:11–18. 2010. View Article : Google Scholar :
|
|
56
|
Thiery JP and Sleeman JP: Complex networks
orchestrate epithelial-mesenchymal transitions. Nat Rev Mol Cell
Biol. 7:131–142. 2006. View Article : Google Scholar : PubMed/NCBI
|
|
57
|
He ZY, Wu SG, Peng F, Zhang Q, Luo Y, Chen
M and Bao Y: Up-regulation of RFC3 promtes triple negative breast
cancer metastasis and is associated with poor prognosis via EMT.
Transl Oncol. 10:1–9. 2017. View Article : Google Scholar
|
|
58
|
Ajani JA, Song S, Hochster HS and
Steinberg IB: Cancer stem cells: The promise and the potential.
Semin Oncol. 42(Suppl 1): pp. S3–S17. 2015, View Article : Google Scholar : PubMed/NCBI
|
|
59
|
Germano G, Allavena P and Mantovani A:
Cytokines as a key component of cancer-related inflammation.
Cytokine. 43:374–379. 2008. View Article : Google Scholar : PubMed/NCBI
|
|
60
|
Nagarsheth N, Wicha MS and Zou W:
Chemokines in the cancer microenvironment and their relevance in
cancer immunotherapy. Nat Rev Immunol. 17:559–572. 2017. View Article : Google Scholar : PubMed/NCBI
|