Introduction
Peripheral T-cell lymphomas (PTCLs) are
heterogeneous malignancies characterized by an aggressive clinical
course and a poor outcome with current treatment strategies
(1). The pathological diagnosis of
PTCLs is often challenging due to its broad morphologic and
immunophenotypic variabilities, and the occasional overlapping of
distinct entities (2). The
majority of PTCLs lack entity-defining genetic alterations.
Therefore, they are named according to their predominant site of
involvement, such as leukaemic, extranodal, cutaneous or nodal
entities (3). The recent
genome-wide molecular characterization of several entities has
provided novel insights into their pathobiology and has led to the
identification of new biomarkers with diagnostic, prognostic or
therapeutic implications for patients with PTCL (4). Moreover, previously unrecognized
recurrent genetic alterations have been described (5).
The t(5;9)(q33;q22) translocation was first reported
in 2006 in a small subset of PTCL-not otherwise specified (NOS)
cases (6). The IL-2-inducible
T-cell kinase (ITK) gene on chromosome 5 was translocated to the
spleen tyrosine kinase (SYK) gene on chromosome 9 (7). The ITK-SYK translocation was
predominantly detected in the follicular variant of PTCL-NOS
(PTCL-F) (8). Soon thereafter,
this translocation was also reported in angioimmunoblastic T-cell
lymphoma (AITL) cases (9).
Although clinical, morphologic and biological features distinguish
PTCL-F from AITL (3), genetic
translocation may imply a new entity in PTCLs.
To the best of our knowledge, this translocation
represents the first fusion protein consisting of two non-receptor
tyrosine kinases with important functions in lymphocyte development
and signal transduction (10). ITK
plays a critical role in all stages of T-cell development and
differentiation (11,12). SYK is involved in B cell receptor
pathway activation, and its expression is markedly reduced in
normal peripheral T lymphocytes (13,14).
The ITK-SYK fusion protein comprises the N-terminal PH-domain of
ITK and the tyrosine kinase domain of SYK (15). In vitro and in vivo
studies have shown that the constitutively active tyrosine kinase
function of ITK-SYK is a key oncogenic event in the pathogenesis of
ITK-SYK-positive PTCLs (7,16-18).
ITK-SYK modulates signalling pathways, including T cell receptor
(TCR), PI3K-Akt and mitogen-activated protein kinase (MAPK)
signalling pathways (15,18). However, the global impact of
constitutive ITK-SYK expression in lymphoma cells is unknown.
Materials and methods
Cell culture and reagents
The human T-cell acute lymphoblastic leukaemia
(T-ALL) cell lines Jurkat, Clone E6-1 (cat. no. TIB-152) and
CCRF-CEM (cat. no. CCL-119) were obtained from the American Type
Culture Collection. The Burkitt Lymphoma cell lines Raji (cat. no.
TCHu 44) was acquired from the Cell Type Culture Collection in the
Institute of Biochemistry and Cell Biology of Chinese Academy of
Sciences (Shanghai, China). All the cell lines were grown in
RPMI-1640 medium supplemented with 10% foetal bovine serum (FBS;
both Gibco; Thermo Fisher Scientific, Inc.), penicillin (100 U/ml),
and streptomycin (100 mg/ml; both HyClone; GE Healthcare Life
Sciences) at 37°C, with a 5% volume fraction of CO2 and
30% saturated humidity. The tyrosine-protein kinase JAK (JAK)3
inhibitor tofacitinib (cat. no. S5001; Selleck Chemicals) was
dissolved in DMSO.
Lentiviral vector construction and
transduction
The human ITK-SYK fusion gene was cloned from ITK
and SYK human cDNA. The 494-bp ITK fragment was amplified using the
following primer sequences: Forward, 5′-ATG AAC AAC TTT ATC CTC CTG
GAA-3′ and reverse, 3′-CCT GTT GTC TTC AGG AGT AGG AGG-5′. The
991-bp SYK fragment was amplified using the following primer
sequences: Forward, 5′-TCC TCC CCT GCC CAA GGG AAC CGG CAA-3′ and
reverse, 3′-TTA GTT CAC CAC GTC ATA GTA GTA ATT-5′. The two genes
were ligated by a fusion PCR system using the following primer
sequences: Forward, 5′-GAC AAC AGG TCC TCC CCT-3′ and reverse,
3′-AGG GGA GGA CCT GTT GTC-5′. The 20 µl PCR volume
contained 10 µl Phusion Green Hot Start II High-Fidelity PCR
Master mix (cat. no. F566L; Thermo Fisher Scientific, Inc.), 100 ng
DNA and 0.4 µM of each primer. The PCRs were run on a C-1000
Thermal Cycler (Bio-Rad Laboratories) using the following cycling
conditions: An initial denaturation at 98°C for 30 sec, followed by
35 cycles of 10 sec at 98°C, 45 sec at 62°C and 45 sec at 72°C, and
a final extension for 10 min at 72°C. The fusion PCR products were
verified by DNA sequencing and then subcloned into the lentiviral
vector pUbi-MCS-3FLAG-SV40-EGFP (GV287; Shanghai GeneChem Co.,
Ltd.). The overexpression vector was sent for sequencing and
designated GV287-ITK-SYK, and the control vector was named
GV287-NC. Jurkat cells, at a density of 1×10⁵ cells/ml,
were infected with lentiviral vectors plus 10 µg/ml
polybrene (Sigma-Aldrich; Merck KGaA) at an MOI of 50:1 for 16 h.
CEM cells were transduced as previously described, but at an MOI of
100:1. The number of the cells and mass of the transfected vectors
were calculated according to the experiments. For an MOI of 50:1 in
six-well plates, cells were seeded at 2×10⁵ cells/well
and 1×10⁷ TU lentivirus vector was added. For an MOI of
50:1 in 24-well plate, cells were seeded at 1×10⁵
cells/well and 5×10⁶ TU lentivirus vector TU lentivirus
vector was added. The cells were maintained at 37°C, with a 5%
volume fraction of CO2 and 30% saturated humidity. After
72 h, stably transfected Jurkat cells were grown in 1640 medium
supplemented with 2 g/ml puromycin and 10% FBS for 2 weeks. Stably
transfected CEM cells were screened with 0.5 g/ml puromycin as
described above.
Soft agar colony formation assay
ITK-SYK+ and ITK-SYK- Jurkat
cells (5×10³/well) were seeded in six-well plate in
0.35% (w/v) low-melting temperature agar (Sigma-Aldrich; Merck
KGaA) over layers of 0.75% low-melting temperature agar. After 3
weeks, the colonies were stained with 1% crystal violet solution
(Sigma-Aldrich; Merck KGaA) for 10 min at room temperature and
scored by counting under a light microscope under low power
magnification (×40).
Microarray analysis
Genome-wide expression profiling analysis was
performed by Genminix Informatics Co., Ltd. using the Affymetrix
Gene Chip Human Gene 1.0 ST Array (Affymetrix; Thermo Fisher
Scientific, Inc.) to identify ITK-SYK target genes and analyse
related signalling pathways. For each sample, three biological
replicates were performed. If the mRNA expression level of a gene
had a 1.5-fold change the gene was determined to be differentially
expressed. Differentially expressed mRNA was based primarily on the
Kyoto Encyclopedia of Genes and Genomes (KEGG) database (http://www.kegg.jp/kegg/) (19,20),
which was used to analyse the potential functions of cross-genes
involved in the pathway. Gene Ontology (GO) (21) enrichment analysis of DEGs was
conducted using the Database for Annotation, Visualization, and
Integrated Discovery (DAVID) (22). A P-value cut-off of <0.05 was
set as the screening condition. An mRNA-mRNA interaction network
was constructed using Cytoscape v3.0 software (http://cytoscape.org/) (23). The matrix of gene expression values
was visualized graphically.
Cell transfection with small-interfering
(si)RNAs targeting IL2RG
ITK-SYK+ Jurkat cells [2×10⁶
cells in 100 µl of siPORT buffer (Ambion; Thermo Fisher
Scientific, Inc.)] were transfected with 100 nM anti-IL2RG
(siIL2RG) or scrambled (si-control) siRNA (both Thermo Fisher
Scientific, Inc.) via electroporation at 200 V, with two 1.5-msec
pulses in two separate 96-well electroporation plates (Bio-Rad
Laboratories) for 20 min at room temperature. The following three
specific siIL2RG were assessed: siIL2RG-1, sense: 5′-CCT GAA GAA
CCT AGA GGA TCT TGT T-3′, anti-sense: 5′-CCT AAG AAT CCG GAG TCT
ATA GGT T-3′; siIL2RG-2, sense: 5′-CAT TGG AGT GAA TGG AGC CAC CCA
A-3′; anti-sense: 5′-CAT TGA GTA AGG AGG CAC CCG TCA A-3′;
siIL2RG-3, sense: 5′-GGA CCA CAG CTG GAC TGA ACA ATC A-3′,
anti-sense: 5′-GGA GAC AGG TCG TCA ACA AAC CTC A-3′ and si-control,
sense: 5′-GGA CAC GAA TGC ACT CAG ATA GGT C-3′; anti-sense: 5′-AGA
CCG ACG GTC GCG AGA TAT AAT C-3′. Cells were used for experiments 2
days after transfection. Cells transfected with siRNAs were seeded
in 24-well plates at a density of 2×10⁵ cells/well and
cell numbers were assayed by trypan blue exclusion daily for 4 days
using Countess™ Automated Cell Counter (Invitrogen; Thermo Fisher
Scientific, Inc.) (24,25). Flow cytometric analysis was used to
determine apoptosis and cell cycle distribution in transfected
cells 3 days after transfection.
Western blotting
ITK-SYK+ Jurkat cells were seeded at a
density of 6×10⁵ cells per well in six-well plates and
further incubation with 0-5 µM tofacitinib (0, 0.5, 2.5 and
5 µM) for 24 h at 37°C. ITK-SYK+ and
siIL2RG-transfected ITK-SYK+ Jurkat cells were incubated
with 25 ng/ml IL-2 (cat. no. 202-IL) or IL-21 (cat. no. 8879-IL;
both R&D Systems) for 24 h at 37°C. Jurkat, Raji,
ITK-SYK+ or ITK-SYK− Jurkat cells were seeded
at a density of 6×10⁵ cells per well in six-well plates.
Wild-type SYK 72-kDa protein, expressed in Raji cells, was used as
a comparison with the fusion SYK 55-kDa protein. The cells were
then harvested and washed twice with cold PBS. For whole-cell
protein analysis, washed cells were lysed with cell lysis buffer
radioimmunoprecipitation lysis buffer with protease and phosphatase
inhibitor cocktail (both Beyotime Institute of Biotechnology).
Total protein was measured using a BCA Protein assay kit (Beyotime
Institute of Biotechnology). A total of 30 µg protein per
lane was separated by SDS-PAGE on 10% gels and then transferred
onto polyvinylidene fluoride transfer membranes (EMD Millipore).
The membranes were blocked by 5% bovine serum albumin (BSA; cat.
no. A1933; Sigma-Aldrich; Merck KGaA) in TBST (0.1% Tris-buffered
saline with 1 ml/l Tween20) for 1 h at room temperature.
Then they were incubated overnight at 4°C with
primary antibodies against SYK (cat. no. 13198), AKT (cat. no.
9272), phosphorylated (p-)AKT (cat. no. 9611), ERK (cat. no. 9102),
p-ERK (cat. no. 4370), lymphocyte cytosolic protein 2 (SLP76; cat.
no. 70896), p-SLP76 (cat. no. 92711), 1-phos-phatidylinositol
4,5-bisphosphate phosphodiesterase γ-1 (PLCG1; cat. no. 5690),
p-PLCG1 (cat. no. 8713), non-receptor tyrosine-protein kinase TYK2
(TYK2; cat. no. 14193), p-TYK2 (cat. no. 68790), JAK1 (cat. no.
3344), p-JAK1 (cat. no. 74129), JAK2 (cat. no. 3230), p-JAK2 (cat.
no. 3776), JAK3 (cat. no. 8827), p-JAK3 (cat. no. 5031), STAT3
(cat. no. 12640), p-STAT3 (cat. no. 9145), STAT5 (cat. no. 25656),
p-STAT5 (cat. no. 9314), caspase-3 (cat. no. 9665), cleaved
caspase-3 (cat. no. 9664), cyclin-dependent kinase (CDK) inhibitor
1B (p27Kip1; cat. no. 3686), CDK2 (cat. no. 2546) and β-actin (cat.
no. 4970; all 1:1,000; Cell Signalling Technology). Other primary
antibodies used were the following: Interleukin-2 receptor subunit
α (IL2RA; cat. no. ab128955), IL2R subunit β (IL2RB; cat. no.
ab61195), IL2R subunit γ (IL2RG; cat. no. ab202911), IL7R (cat. no.
ab155755) and IL21R (cat. no. ab5980; all 1:500; Abcam). After
washing with TBST three times for 10 min, the membranes were
further incubated with horseradish peroxidase (HRP)-conjugated goat
anti-rabbit immunoglobulin (Ig)G secondary antibodies (cat. no.
ab6721; 1:4,000; Abcam) for 1 h at room temperature. The membrane
was washed with TBST three times for 10 min and developed using
SuperSignal West Pico Chemiluminescent Substrate (Thermo Fisher
Scientific, Inc.) according to the protocol provided by the
manufacturer's protocol. Densitometric analysis of the proteins
band was performed by ImageJ software (version 1.6.0; National
Institutes of Health).
JAK3 inhibitor experiments in
ITK-SYK+ Jurkat cells
A total of 5×10³ ITK-SYK+ or
ITK-SYK− Jurkat cells per well were seeded in 96-well
plate with RPMI-1640 medium containing DMSO, or 0.5, 2.5 or 5
µM tofacitinib for 6, 18, 24 and 48 h at 37°C. DMSO exposure
at a concentration of 0.1% in controls had no effect on the
viability of examined cells lines, therefore 0.1% DMSO was used to
treated the cells for 6, 18, 24 and 48 h at 37°C; these cells were
used as the control cells. Cell viability was evaluated using a
Cell Counting Kit-8 assay (CCK-8; Dojindo Molecular Technologies,
Inc.) according to the manufacturer's protocol. Cells were measured
at 450 nm using a Varioskan Flash multimode reader (Thermo Fisher
Scientific, Inc.).
The apoptotic rate of transduced cells that were
treated with tofacitinib was detected using an Annexin V-PE/7-ADD
Apoptosis Detection kit (BD Pharmingen™). Separately, the
transduced and tofacitinib-treated cells (1×10⁶) were
stained with propidium iodide (Sigma-Aldrich; Merck KGaA) at room
temperature in the dark for 30 min. The cells were analysed using a
flow cytometer using ModFit LT version 5.0 analysis software
(Verity Software House, Inc.). Experiments were performed in
triplicate.
JAK3 inhibitor in a xenograft mouse
model
Female NOD/SCID mice with a median weight of 14-16 g
(n=14; 4-6 weeks old; Huafukang Co., Ltd.) were housed in a
dedicated pathogen-free barrier facility at the Laboratory Animal
Center of Tongji Medical College (Wuhan, China). The mice were kept
in separate cages in a room with specific pathogen-free standards
at a temperature of 22±2°C and 50±10% relative humidity, with food
and water available ad libitum. The animal room was on a
12/12-h light/dark cycle. The CEM cells were transduced with
GV287-ITK-SYK at an MOI of 100:1 as described above. After 7 days,
5×10⁶ transduced CEM cells suspended in a volume of 50
µl RPMI-1640 medium were mixed with 50 µl Matrigel
(BD Biosciences) and subcutaneously inoculated into the rear flank
of NOD/SCID female mice. Tumour-bearing mice (average tumour
volume, 100 mm3) were randomly divided into two groups:
A tofacitinib group (n=6) and a control group (n=6). Tofacitinib
(20 mg/kg per day) was administered via oral gavage for 28
consecutive days and 100 µl 1X PBS was used as the vehicle.
Tumour volumes were monitored in 3-day intervals with electronic
callipers and were calculated as follows: Volume
(mm3)=length × width × thickness. Mice were depilated
once a week to reduce the background fluorescence of mouse hair
under short-wavelength excitation light. Fluorescence imaging was
performed at the end of the experiment using an in vivo
imaging system Fx Pro (Bruker Corporation) under 488 nm excitation
and 510 nm emission for green fluorescence. Fluorescent intensity
was visualized by enhanced green fluorescent protein (EGFP) in
NOD/SCID mice. The intensity of the region of interest (ROI) was
plotted in units of maximum number of photons per second per
centimetres squared per steradian (p/sec/cm2/sr), ROIs
were drawn over the signals and average radiant efficiency was
quantified in terms of p/s/cm2/sr. All mice were
sacrificed by CO2 inhalation (flow rate, 20%
CO2/min) (26) at 28
days after the start of tofacitinib treatment and tumours were
removed.
Tumour tissues were fixed with 10% formaldehyde
solution overnight at room temperature and then embedded in
paraffin, the tumours were cut into serial sections ~2-3 µm
thick. Sections were subjected to haematoxylin and eosin (both
Sigma-Aldrich; Merck KGaA) staining for 10 and 5 min, respectively,
at room temperature) and visualized under high power magnification
(×200) on a light microscope. For immunohistochemical staining
assay, paraffin-embedded sections were deparaffinized in xylene,
rehydrated in a graded series of alcohols (100, 95 and 75%) and
rinsed twice with PBS. Antigen retrieval was performed at 60°C for
2 h, then the samples were dewaxed in xylene for 10 min twice.
Samples were then dehydrated in anhydrous ethanol for 5 min twice,
95% ethanol for 2 min, 90% ethanol for 2 min, 80% ethanol for 2
min, 70% ethanol for 2 min. Following antigen retrieval, slides
were incubated with 3% H2O2 for 30 min to
inhibit endogenous peroxidase. Slides were then blocked with 5% BSA
at 20°C for 2 h and incubated with primary antibodies against SYK
(cat. no. sc1240) at 4°C overnight; the antibodies were purchased
from Santa Cruz Biotechnology, Inc. and diluted to 1:100. After
washing in PBS, the tissue sections were treated with
HRP-conjugated goat anti-mouse IgG (cat. no. A4416; 1:1,000;
Sigma-Aldrich; Merck KGaA) for 1 h at room temperature.
Subsequently, 0.1% diaminobenzidine (Sigma-Aldrich; Merck KGaA) was
used as a chromogen at 25°C for 1 min and 10% haematoxylin was used
to re-dye the sections at 25°C for 3 min. The images were viewed
under high power magnification (×400) on a light microscope. A
semi-quantitative analysis of JAK3 expression in stained sections
was assessed by an independent pathologist. The German
semi-quantitative scoring system was applies to score the intensity
and extent of staining. Immunohistochemical staining intensity
scores were determined by multiplying the staining intensity of
SYK-positive cells (0=negative, 1=weak, 2=moderate and 3=strong)
with the extent of positively stained cells (4=75-100%, 3=50-74%,
2=25-49%, 1=1-24% and 0=0%), leading to scores from 0 to 12. The
study was approved on 01/16/2017 by the Institutional Animal Care
and Use Committee at Tongji Medical College, Huazhong University of
Science and Technology (Wuhan, China; ACUC no. S842).
ELISA
IL-2 was measured in the supernatants of
untransfected Jurkat cells incubated with 10 µg/ml anti-CD28
and anti-CD3 (clone UCHT-1; both BD Pharmingen; BD Biosciences) at
37°C for 72 h, ITK-SYK+ Jurkat cells,
ITK-SYK− Jurkat cells. All ILs were measured in the
super-natants of ITK-SYK− Jurkat cells,
ITK-SYK+ Jurkat cells and ITK-SYK+ Jurkat
cells transfected with si-control or si-IL2RG. All cells were
seeded in a six-well plate at a density of 2×10⁵
cells/well and incubated for 72 h at 37°C, with a 5% volume
fraction of CO2 and 30% saturated humidity. IL-2 (cat.
no. D2050), IL-4 (cat. no. D4050), IL-7 (cat. no. HS750), IL-9
(cat. no. DY209-05), IL-15 (cat. no. D1500) and IL-21 (cat. no.
DY8879-05) protein concentrations were measured in triplicate using
ELISA kits (R&D Systems) according to the manufacturer's
protocols.
Statistical analysis
Each experiment was performed independently three
times; the results of the independent experiments were similar. The
results were expressed as the mean ± SD. Significant differences
between two groups were assessed with Student's t-test (parametric)
and Mann-Whitney U test (non-parametric). The significance among
multiple groups was using one-way ANOVA followed by Dunnett's
post-hoc test. All analyses were performed with GraphPad Prism6
Software (GraphPad Software, Inc.). P<0.05 was considered
statistically significant.
Results
An ITK-SYK fusion construct is
overexpressed in cell lines
To study the role of ITK-SYK in lymphomagenesis, a
lentiviral vector carrying the ITK-SYK fusion gene was constructed
as previously described (2).
First, the fusion construct containing ITK and SYK was engineered
and a sequence analysis of the 2.4-kb PCR product was performed to
confirm the fusion of N-terminal ITK to C-terminal SYK (Fig. S1A). Next, the authors assessed
whether the functional expression of the ITK-SYK fusion construct
in mammalian cell lines was feasible. The fusion gene was subcloned
into lentiviral vectors and Jurkat cells were then transduced the
lentiviral vectors. ITK-SYK+ Jurkat cells were detected
under a fluorescence microscope to observe GFP expression (Fig. S1B) and the transduction efficiency
exceeded 85.23% as observed by flow cytometry (Fig. S1C). Transduction of Jurkat cells
with the fusion construct resulted in the expression of a stable
55-kDa protein corresponding to full-length ITK-SYK, which was
shorter than the wild-type SYK 72-kDa protein expressed in Raji
cells; Jurkat cells transduced with control vectors did not express
SYK protein (Fig. 1B).
Collectively, these results showed that the ITK-SYK fusion gene was
successfully expressed in cells.
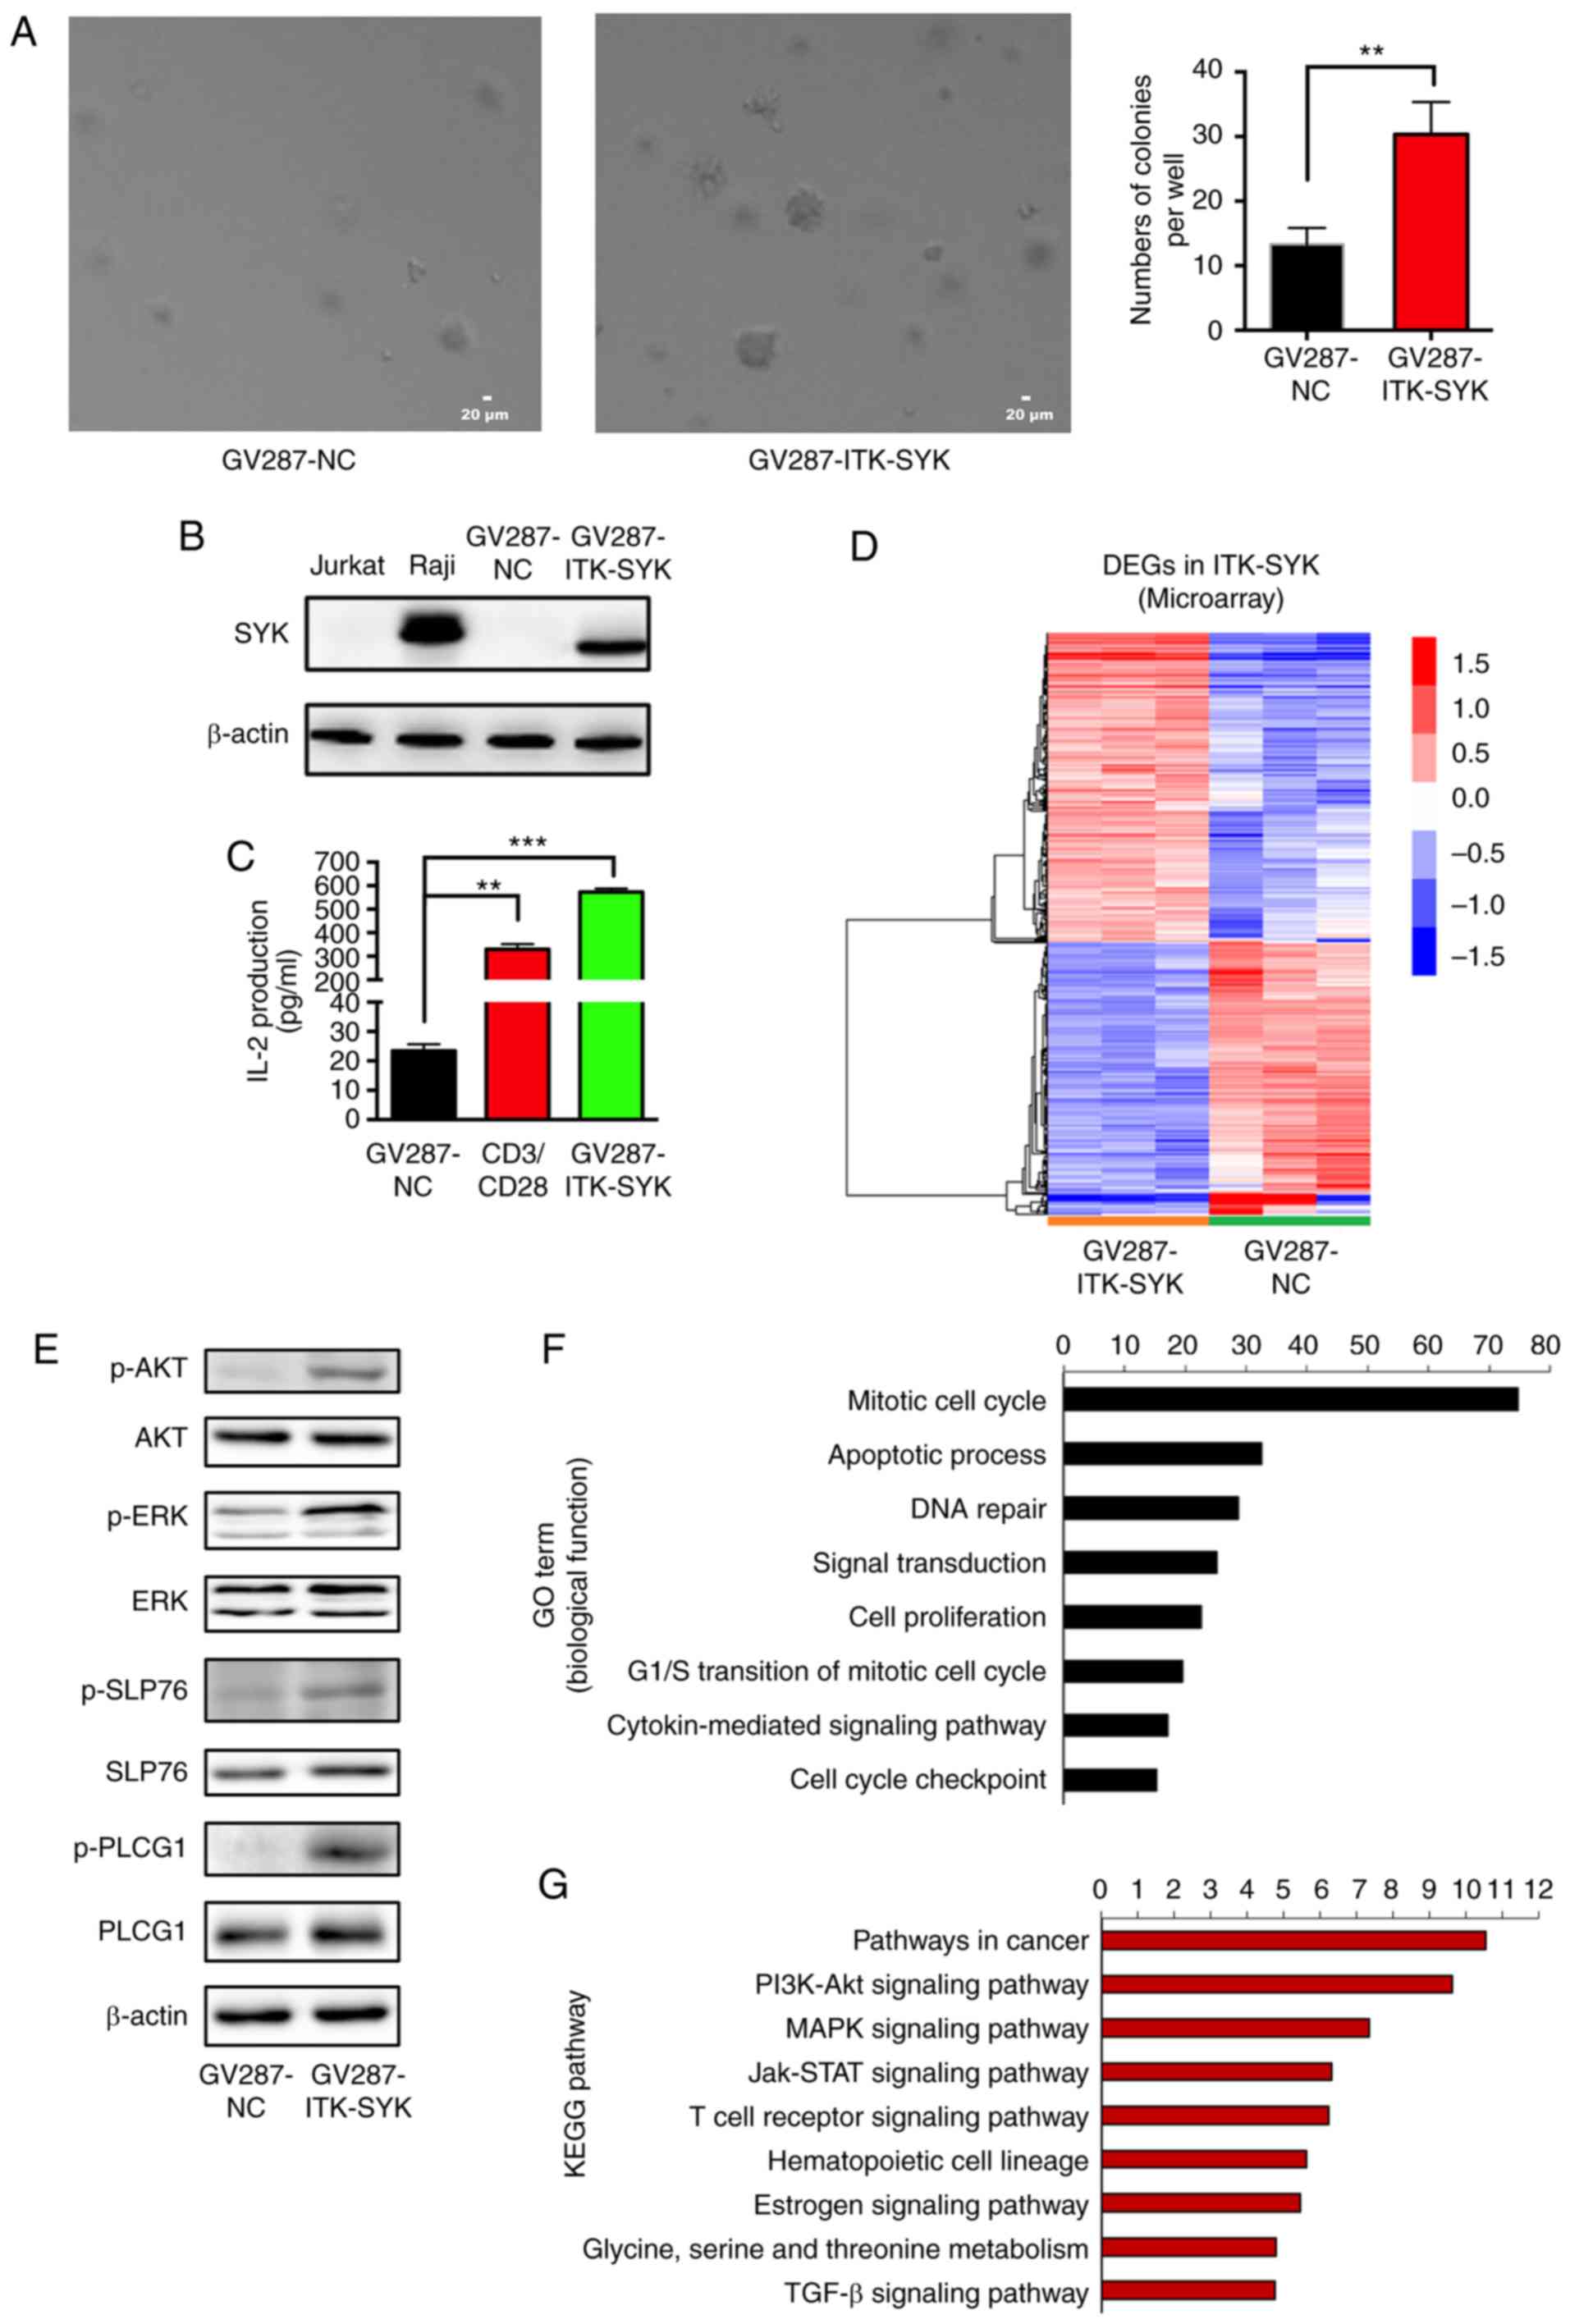 | Figure 1Genome profiling of DEGs mediated by
the ITK-SYK fusion gene. (A) Jurkat cells at a density of
105 cells per well were stably transfected with a
GV287-NC or GV287-ITK-SYK vector in six-well plates in a soft agar
colony formation assay. Colonies were allowed to form for 21 days.
The colonies were then photographed in microscopic fields, as shown
in the left panels; quantification of macroscopically visible
colonies is shown in the right panel. Scale ba= 20 µm. Data
are expressed as the mean ± SD from triplicate samples. (B) Cell
lysates of Jurkat, Raji, and Jurkat cells transfected with GV287-NC
or GV287-ITK-SYK were evaluated with western blotting analysis for
the expression levels of SYK. β-actin was used as the loading
control. (C) Jurkat cells were transfected with GV287-NC or
GV287-ITK-SYK and stimulated with 10 µg/ml anti-CD3/CD28.
IL-2 concentrations (pg/ml) in the cell supernatants were
determined by ELISA. Data are expressed as the mean ± SD from
triplicate samples. (D) A heat map of DEGs in ITK-SYK-transfected
Jurkat cells measured by mRNA microarray data. Upregulated genes
were shown in red and downregulated genes in blue. (E) Total and
phosphorylated levels of AKT, ERK, SLP76 and PLCG were measured by
western blotting analysis. β-actin was used as the loading control.
(F) GO term and (G) KEGG pathway enrichment analysis of DEGs in
ITK-SYK-transduced Jurkat cells. **P<0.01 and
***P<0.001. DEGs, differentially expressed genes;
ITK-SYK, IL-2-inducible T-cell kinase-spleen tyrosine kinase; GO,
Gene Ontology; KEGG, Kyoto Encyclopedia of Genes and Genomes; p-,
phosphorylation; IL, interleukin; SLP76, lymphocyte cytosolic
protein 2; PLCG1, 1-phosphatidylinositol 4,5-bisphosphate
phosphodiesterase γ-1; NC, negative control; CD, cluster of
differentiation; TGF, transforming growth factor. |
Genome-wide expression profiling of
ITK-SYK-transduced cells
As previously reported (27), ITK-SYK+ Jurkat cells
exhibited significantly increased colony-forming ability,
significantly greater IL-2 secretion and oncogenic signalling
compared with ITK-SYK− Jurkat cells (Fig. 1A, C and E). To further understand
the molecular mechanism underlying ITK-SYK function, mRNA
expression profiling was performed to identify the genes influenced
by ITK-SYK. A total of 722 differentially expressed genes (DEGs),
including 278 upregulated and 444 downregulated genes, were
identified in ITK-SYK+ Jurkat cells (P<0.05; fold
change >1.5; Fig. 1D). Next,
gene set enrichment analysis was performed to further define the
biological processes altered by ITK-SYK. Gene Ontology terms of
DEGs in ITK-SYK+ Jurkat cells were enriched, such as
cell cycle, apoptosis, DNA repair, signal transduction and cell
proliferation (Fig. 1F).
Additionally, KEGG pathway that were enriched included paths in
cancer, such as the PI3K/Akt signalling pathway, the MAPK
signalling pathway and the JAK-STAT signalling pathway (Fig. 1G).
ITK-SYK transduction activates the
JAK3/STAT5 signalling pathway
To gain insight into gene interactions for the
discovery of a novel candidate in ITK-SYK-mediated tumourigenesis,
a Signal-Net analysis was performed to generate a network based on
the fold change level in micro-array data. The top genes within the
network were defined as key factors. The resulting network
indicated that genes with the highest degrees of interaction were
JAK3 and STATs (STAT3, STAT5A and STAT5B), indicating JAK/STAT
pathway activation (Fig. 2A). To
the best of our knowledge, the JAK/STAT signalling pathway in
relation to ITK-SYK+ PTCLs has never been reported in
previous studies; therefore, the authors of the current study set
out to investigate the role of the JAK/STAT signalling pathway in
ITK-SYK+ PTCLs. Firstly, the expression of JAK1, JAK2,
JAK3 and TYK2 was detected by western blotting, and it was found
that JAK3 protein levels moderately increased in
ITK-SYK+ Jurkat cells, while JAK1, JAK2, and TYK2
protein levels were not influenced by ITK-SYK (Fig. 2B and D). The upregulation of JAK3
was consistent with the microarray data. Furthermore, JAK3 was
constitutively activated by phosphorylation in ITK-SYK+
Jurkat cells; the ratio of p-JAK3/JAK3 was significantly higher in
the ITK-SYK+ Jurkat cells compared with the cells
transduced with the control vector. Next the authors of the current
study sought to identify the downstream signalling pathway
activated by JAK3, and analysed the activity of STAT3 and STAT5 in
ITK-SYK+ Jurkat cells. JAK3 induced the constitutive
phosphorylation of STAT5 in ITK-SYK+ Jurkat cells, while
the expression and phosphorylation of STAT3 were not influenced
(Fig. 2C and E). The ratio of
p-STAT5/STAT5 was significantly higher in the ITK-SYK+
Jurkat cells compared with the cells transduced with the control
vector.
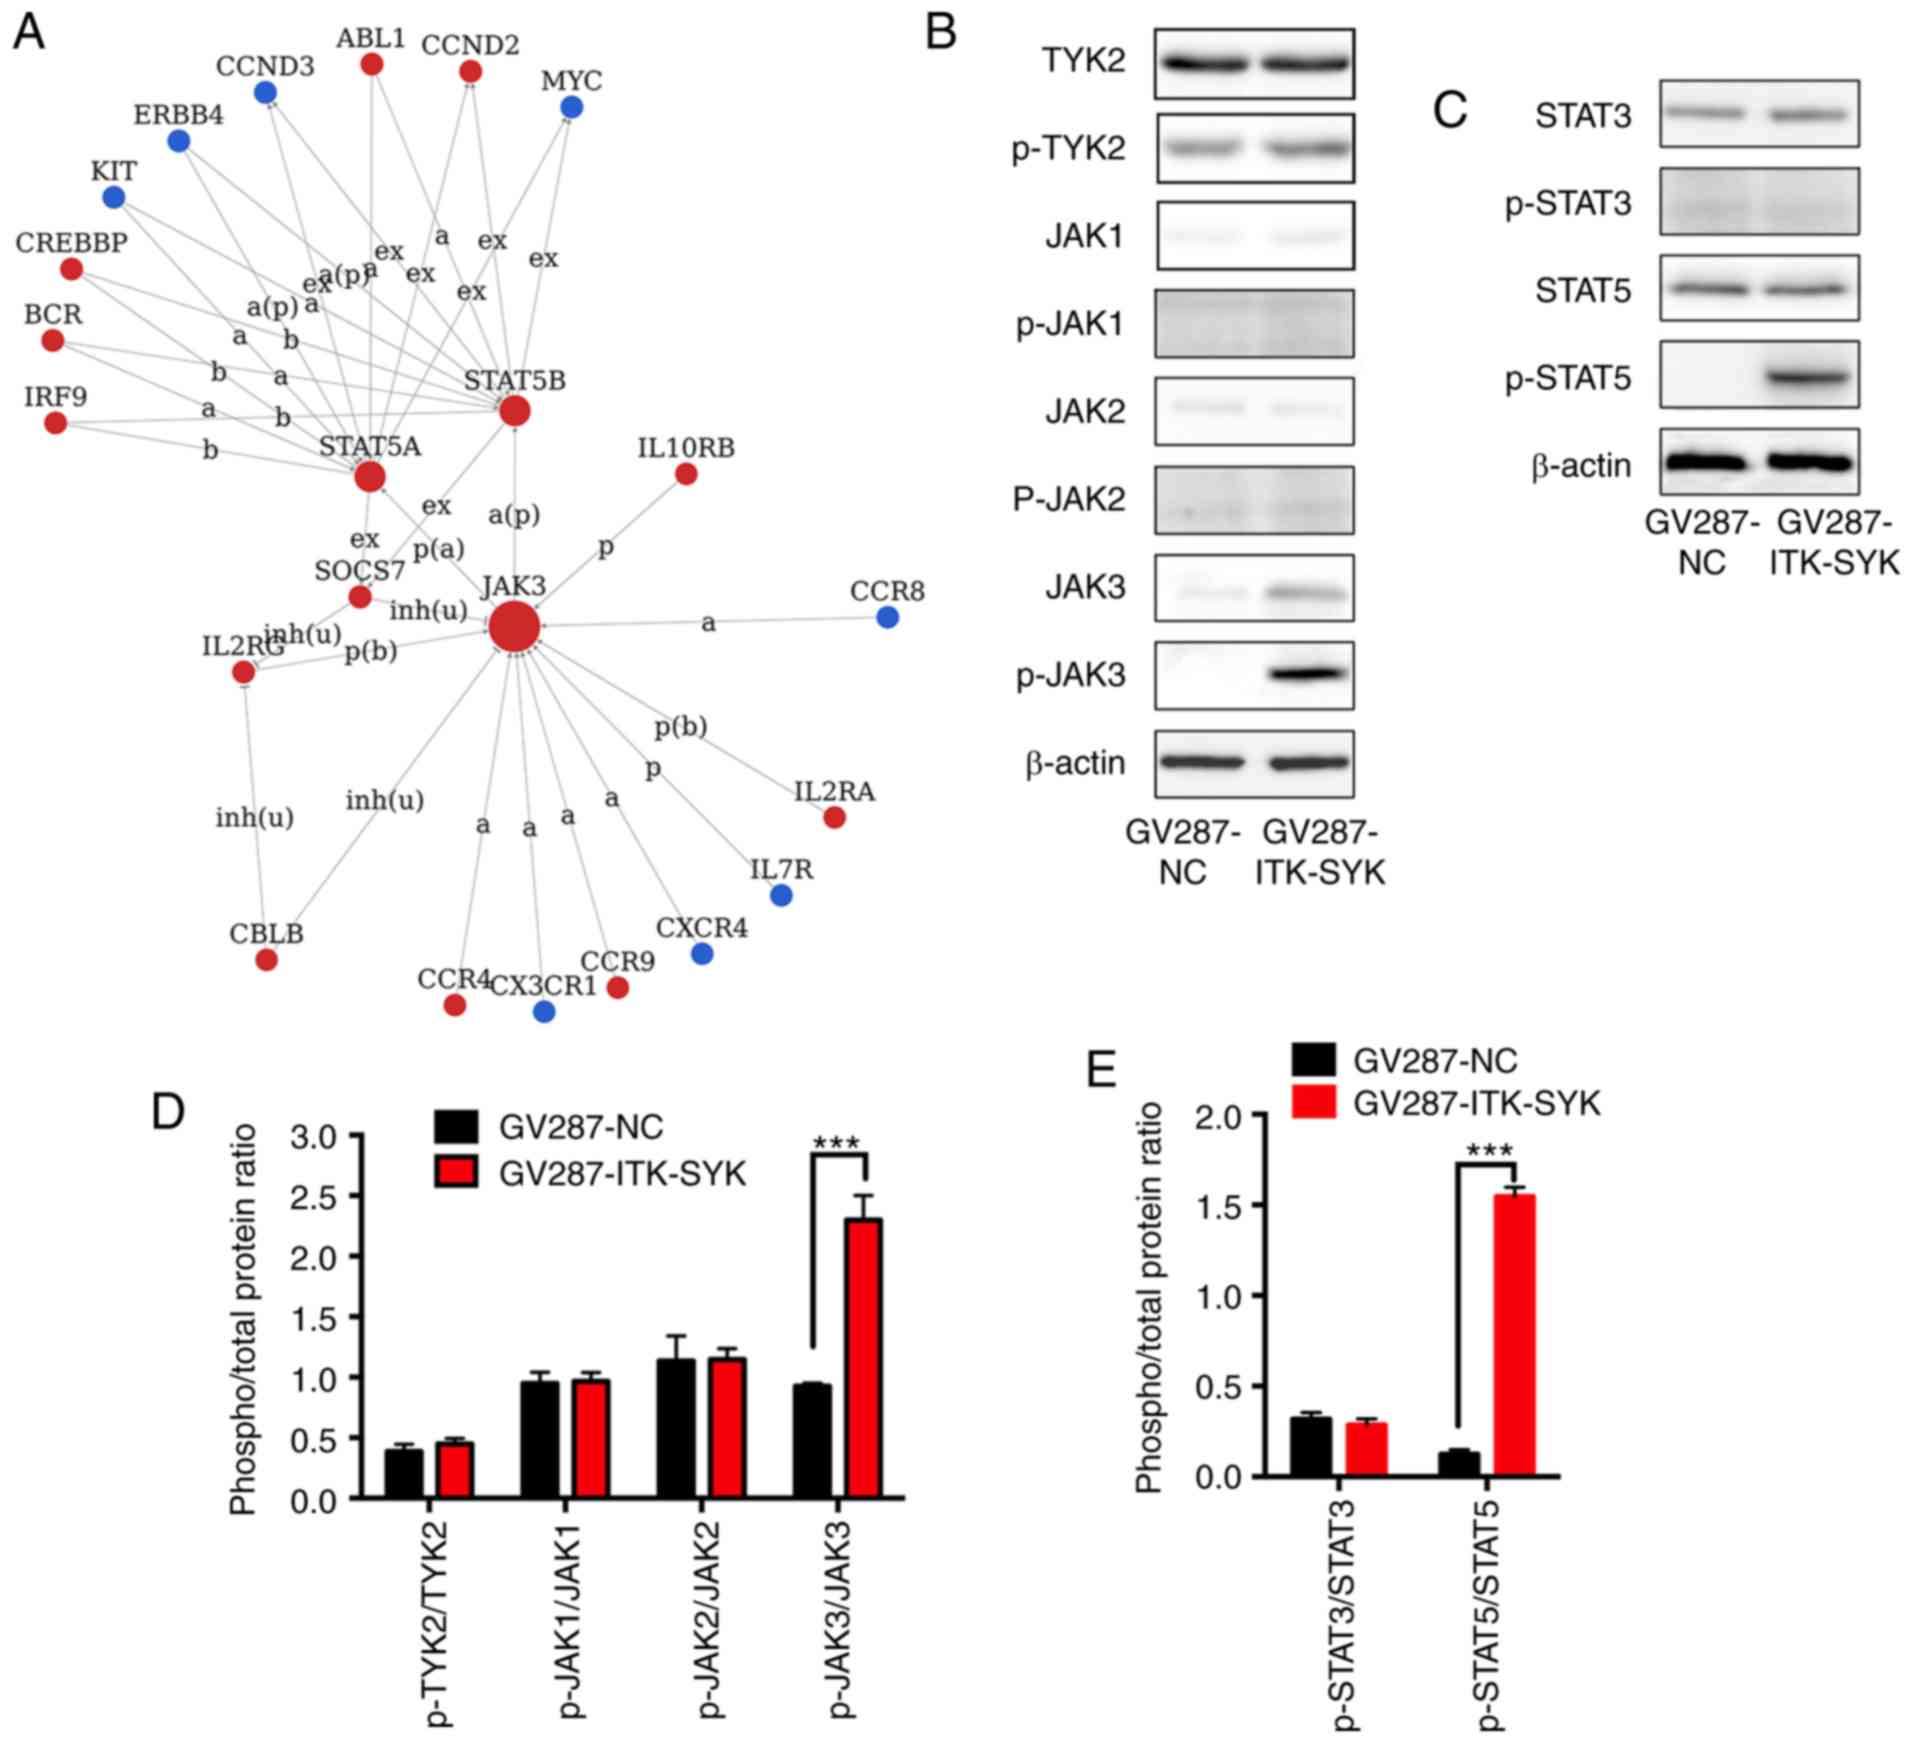 | Figure 2The JAK3/STAT5 signalling pathway is
activated in ITK-SYK-transduced cells. Jurkat cells were transduced
with GV287-ITK-SYK and GV287-NC. (A) Signal-Net analysis of top
genes. The nodes in the figure represent the main genes, the edges
represent interactions between genes and the arrows point toward
the targets. The type of interaction between two genes is denoted
by the letters and abbreviations on the edges. Red nodes represent
upregulated genes, green nodes represent downregulated genes. The
size of the circle was the frequency at which the gene interacts
with other genes in the signalling network. The most frequent genes
were the most prominent central genes in the network. (B) The
expression levels of TYK2, JAKs and their phosphorylated
counterparts were evaluated with western blotting analysis. (C) The
expression levels of total and phosphorylated STAT3 and STAT5 were
evaluated with western blotting analysis. β-actin was used as the
loading control. Densitometric analysis of (D) total and
phosphorylated TYK2 and JAKs, and (E) total and phosphorylated
STAT3 and STAT5. Data is expressed as the mean ± SEM of the
phosphorylated/total protein ratio. Experiments were repeated at
least three times. ***P<0.001. a, activation; b,
binding; ex, expression; p, phosphorylation; inh(u), inhibition
(ubiquitination); ITK-SYK, IL-2-inducible T-cell kinase-spleen
tyrosine kinase; TYK2, non-receptor tyrosine-protein kinase; JAK,
tyrosine-protein kinase JAK; NC, negative control. |
JAK3 inhibition affects the survival of
ITK-SYK+ Jurkat cells
To determine the functional role of JAK3 in the
survival of ITK-SYK+ Jurkat cells, the effects of the
target-selective small molecular inhibitor tofacitinib on
ITK-SYK+ Jurkat cells was evaluated. The results showed
that tofacitinib obviously inhibited the survival of
ITK-SYK+ Jurkat cells compared with ITK-SYK-
Jurkat cells. Furthermore, these inhibitory effects increased with
tofacitinib concentration (0.5, 2.5 and 5 µM) and treatment
time (6, 18, 24 and 48 h), indicating dose and time dependency of
the inhibitory effects on cell viability on ITK-SYK+
Jurkat cells (50% reduction by 2.5 µM at 48 h; Fig. 3A and B). The inhibitory effects on
ITK-SYK− Jurkat cells did not indicate dose and time
dependency (Fig. 3B). Similarly,
ITK-SYK+ Jurkat cells were treated with increasing
concentrations of tofacitinib (0.5, 2.5 and 5 µM) for 24 h,
which caused STAT5 phosphorylation to markedly decrease (Fig. 3C).
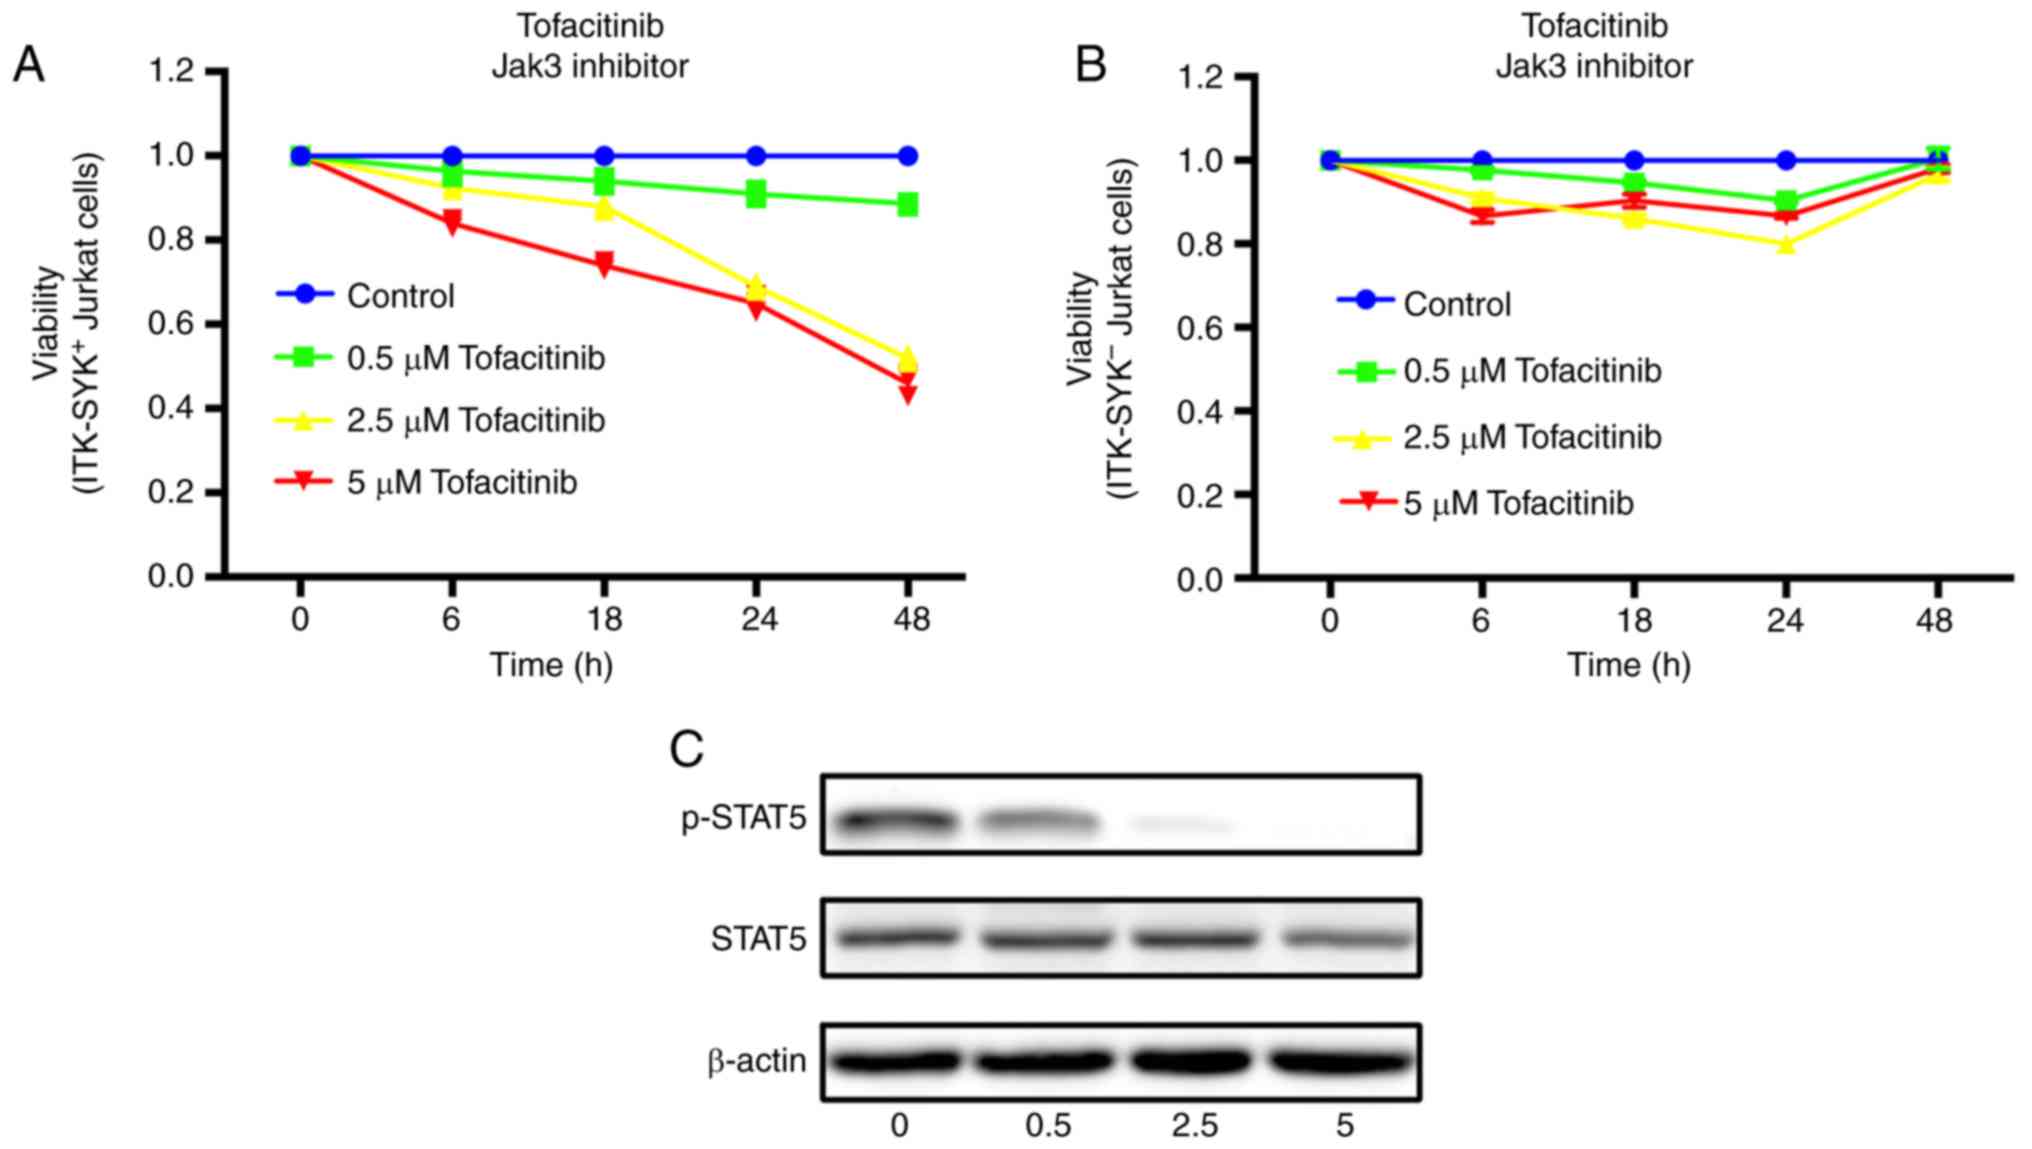 | Figure 3JAK3 inhibition affects
ITK-SYK+ Jurkat cells survival. Jurkat cells were
transduced with GV287-ITK-SYK or GV287-NC for 72 h. (A)
ITK-SYK+ and (B) ITK-SYK- Jurkat cells were incubated
with 0.5, 2.5 and 5.0 µM tofacitinib (a JAK3 inhibitor) or
DMSO for up to 48 h. Cell viability was evaluated by the Cell
Counting Kit-8 assay. The data represent the mean percentage of
viability relative to DMSO control obtained from experiments
performed in triplicate. (C) The expression levels of total and
phosphorylated STAT5 after 24 h of tofacitinib or DMSO treatment.
(D) Flow cytometry analysis with Annexin V-PI staining was
performed to evaluate the percentage of apoptotic cells; the
results are quantified and showed as statistical analysis chart in
the lower panel. The ITK-SYK+ Jurkat cells were treated
with 2.5 µM tofacitinib or DMSO for 24 h (E), Cells were
fixed and stained with PI. Cell cycle profiles were assessed using
flow cytometry; the results are quantified and showed as
statistical analysis chart in the lower panel. (F) Cleaved
caspase-3 and full-length caspase-3, and (G) p27 and CDK2
expression levels were evaluated with western blotting analysis.
β-actin was used as the loading control. *P<0.05,
**P<0.01 and ***P<0.001. ITK-SYK,
IL-2-inducible T-cell kinase-spleen tyrosine kinase; NC, negative
control; PI, propidium iodide; AV, Annexin V; p27, cyclin-dependent
kinase inhibitor 1B; CDK2, cyclin-dependent kinase 2. |
ITK-SYK+ Jurkat cells treated with 2.5
µM tofacitinib exhibited a significantly higher apoptosis
rate compared with those treated with DMSO (tofacitinib 17.11% vs.
control 4.12%; P<0.001; Fig.
3D). The apoptosis rate of cells treated with 0.5 µM or
5 µM tofacitinib increased compared with those treated with
DMSO (0.5 µM tofacitinib 11.83% vs. control 4.12%; 5
µM tofacitinib 15.24% vs. control 4.12%; P<0.05).
However, increased concentrations of tofacitinib beyond 2.5
µM did not lead to increases in the apoptosis rate.
ITK-SYK+ Jurkat cells were treated with 2.5 µM
tofacitinib or DMSO for 24 h. Consistent with the results obtained
by flow cytometry, increased levels of cleaved caspase-3, together
with decreased levels of full-length caspase-3, were observed in
the tofacitinib group (Fig. 3F).
Cell cycle analysis demonstrated a significant increase in the
number of tofacitinib-treated cells in the G1/S phase compared with
the control group (control 71.16% vs. tofacitinib 93.77%;
P<0.05; Fig. 3E). Consistent
with G1/S phase arrest, increased levels of p27 and decreased
levels of CDK2 were observed in the tofacitinib group (Fig. 3F). The combined results suggested
that JAK3 inhibitor tofacitinib affected cell proliferation, the
cell cycle and apoptosis in ITK-SYK+ Jurkat cells.
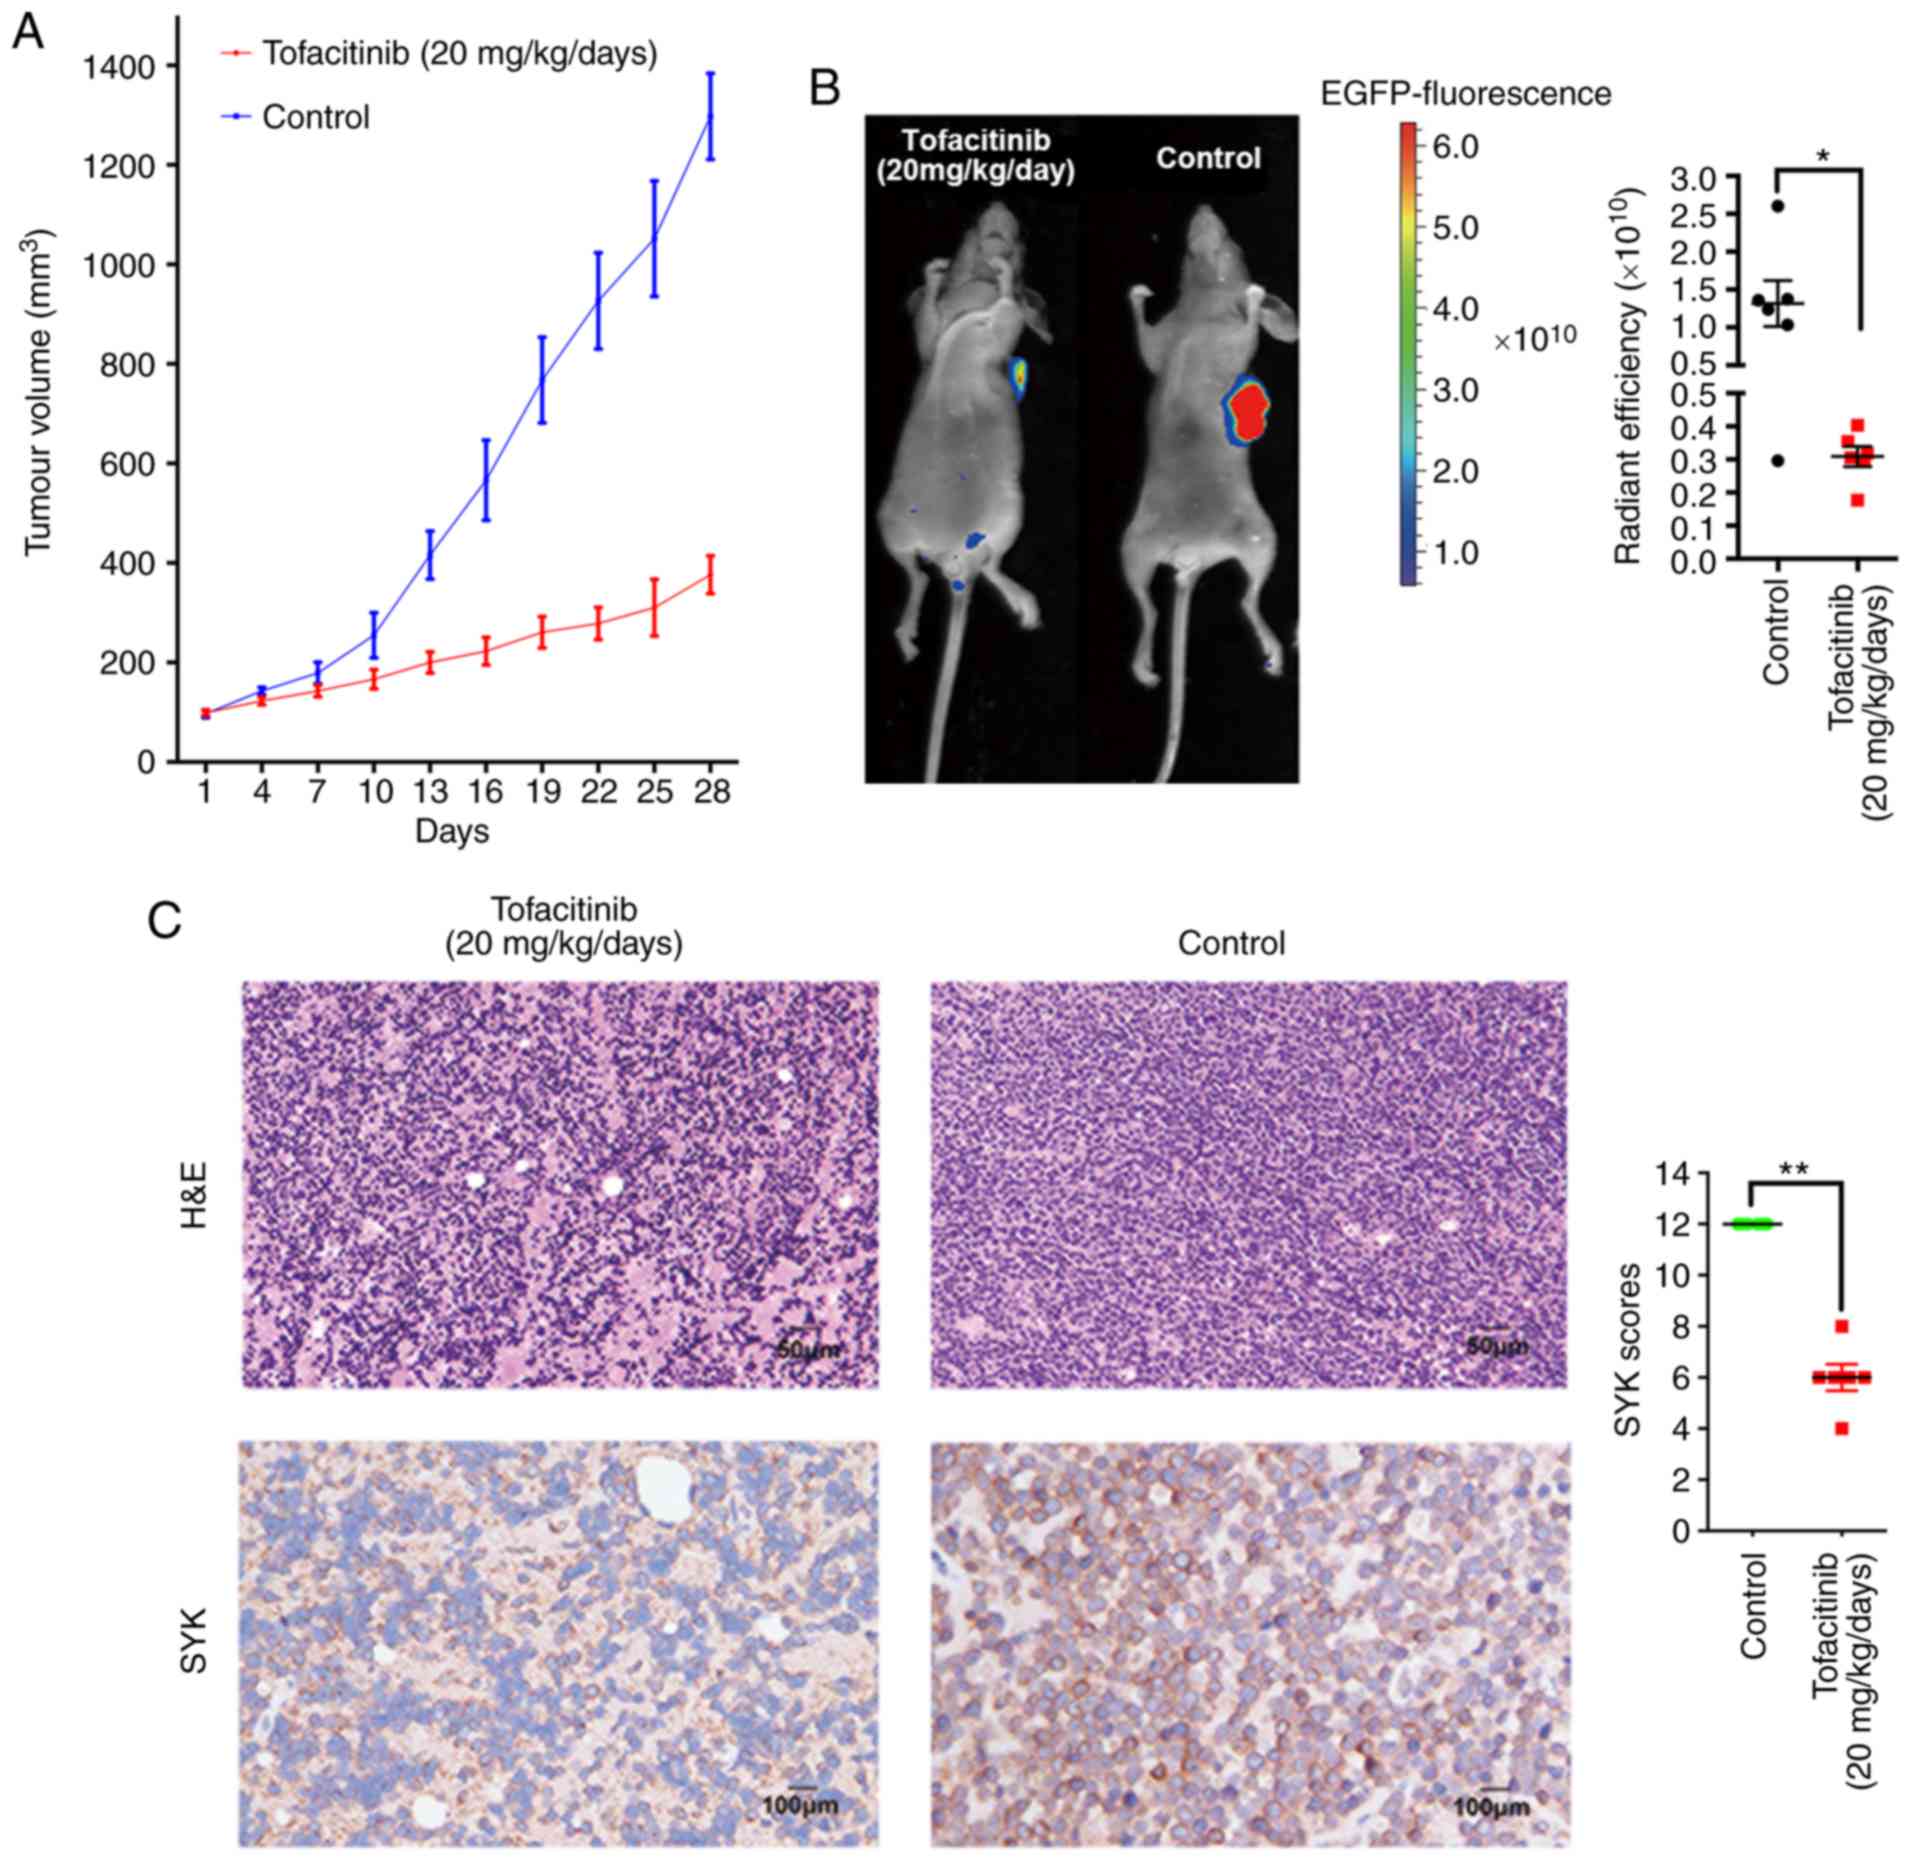
Tofacitinib inhibited the growth of
established tumours in a xenograft mouse model
The current study was extended to an in vivo
xenograft model to validate the significance of the in vitro
findings. Cells from the T-ALL cell line CEM were transduced with
lentiviral vectors and then used for the in vivo xenograft
model as described in a previous study (28). The authors of the current study
then subcutaneously inoculated 5×10⁶ ITK-SYK+
CEM cells into mice. Tofacitinib (20 mg/kg/day) or equivalent PBS
was administered with oral gavage for 28 consecutive days. Compared
with control mice, tofacitinib-treated mice showed a marked delay
in tumour growth at the end of the experiment (Fig. 4A). The anti-tumourigenic potential
of tofacitinib on tumour growth was evident after day 13. CEM cells
were transduced with a lentiviral construct conferring EGFP
expression to enable fluorescence detection. It was found that
tofacitinib significantly decreased the radiant efficiency, showing
that tumour growth was suppressed (Fig. 4B). Immunohistochemical analysis
showed that the immunostaining intensity of SYK was significantly
stronger in the control group than in the tofacitinib group
(Fig. 4C).
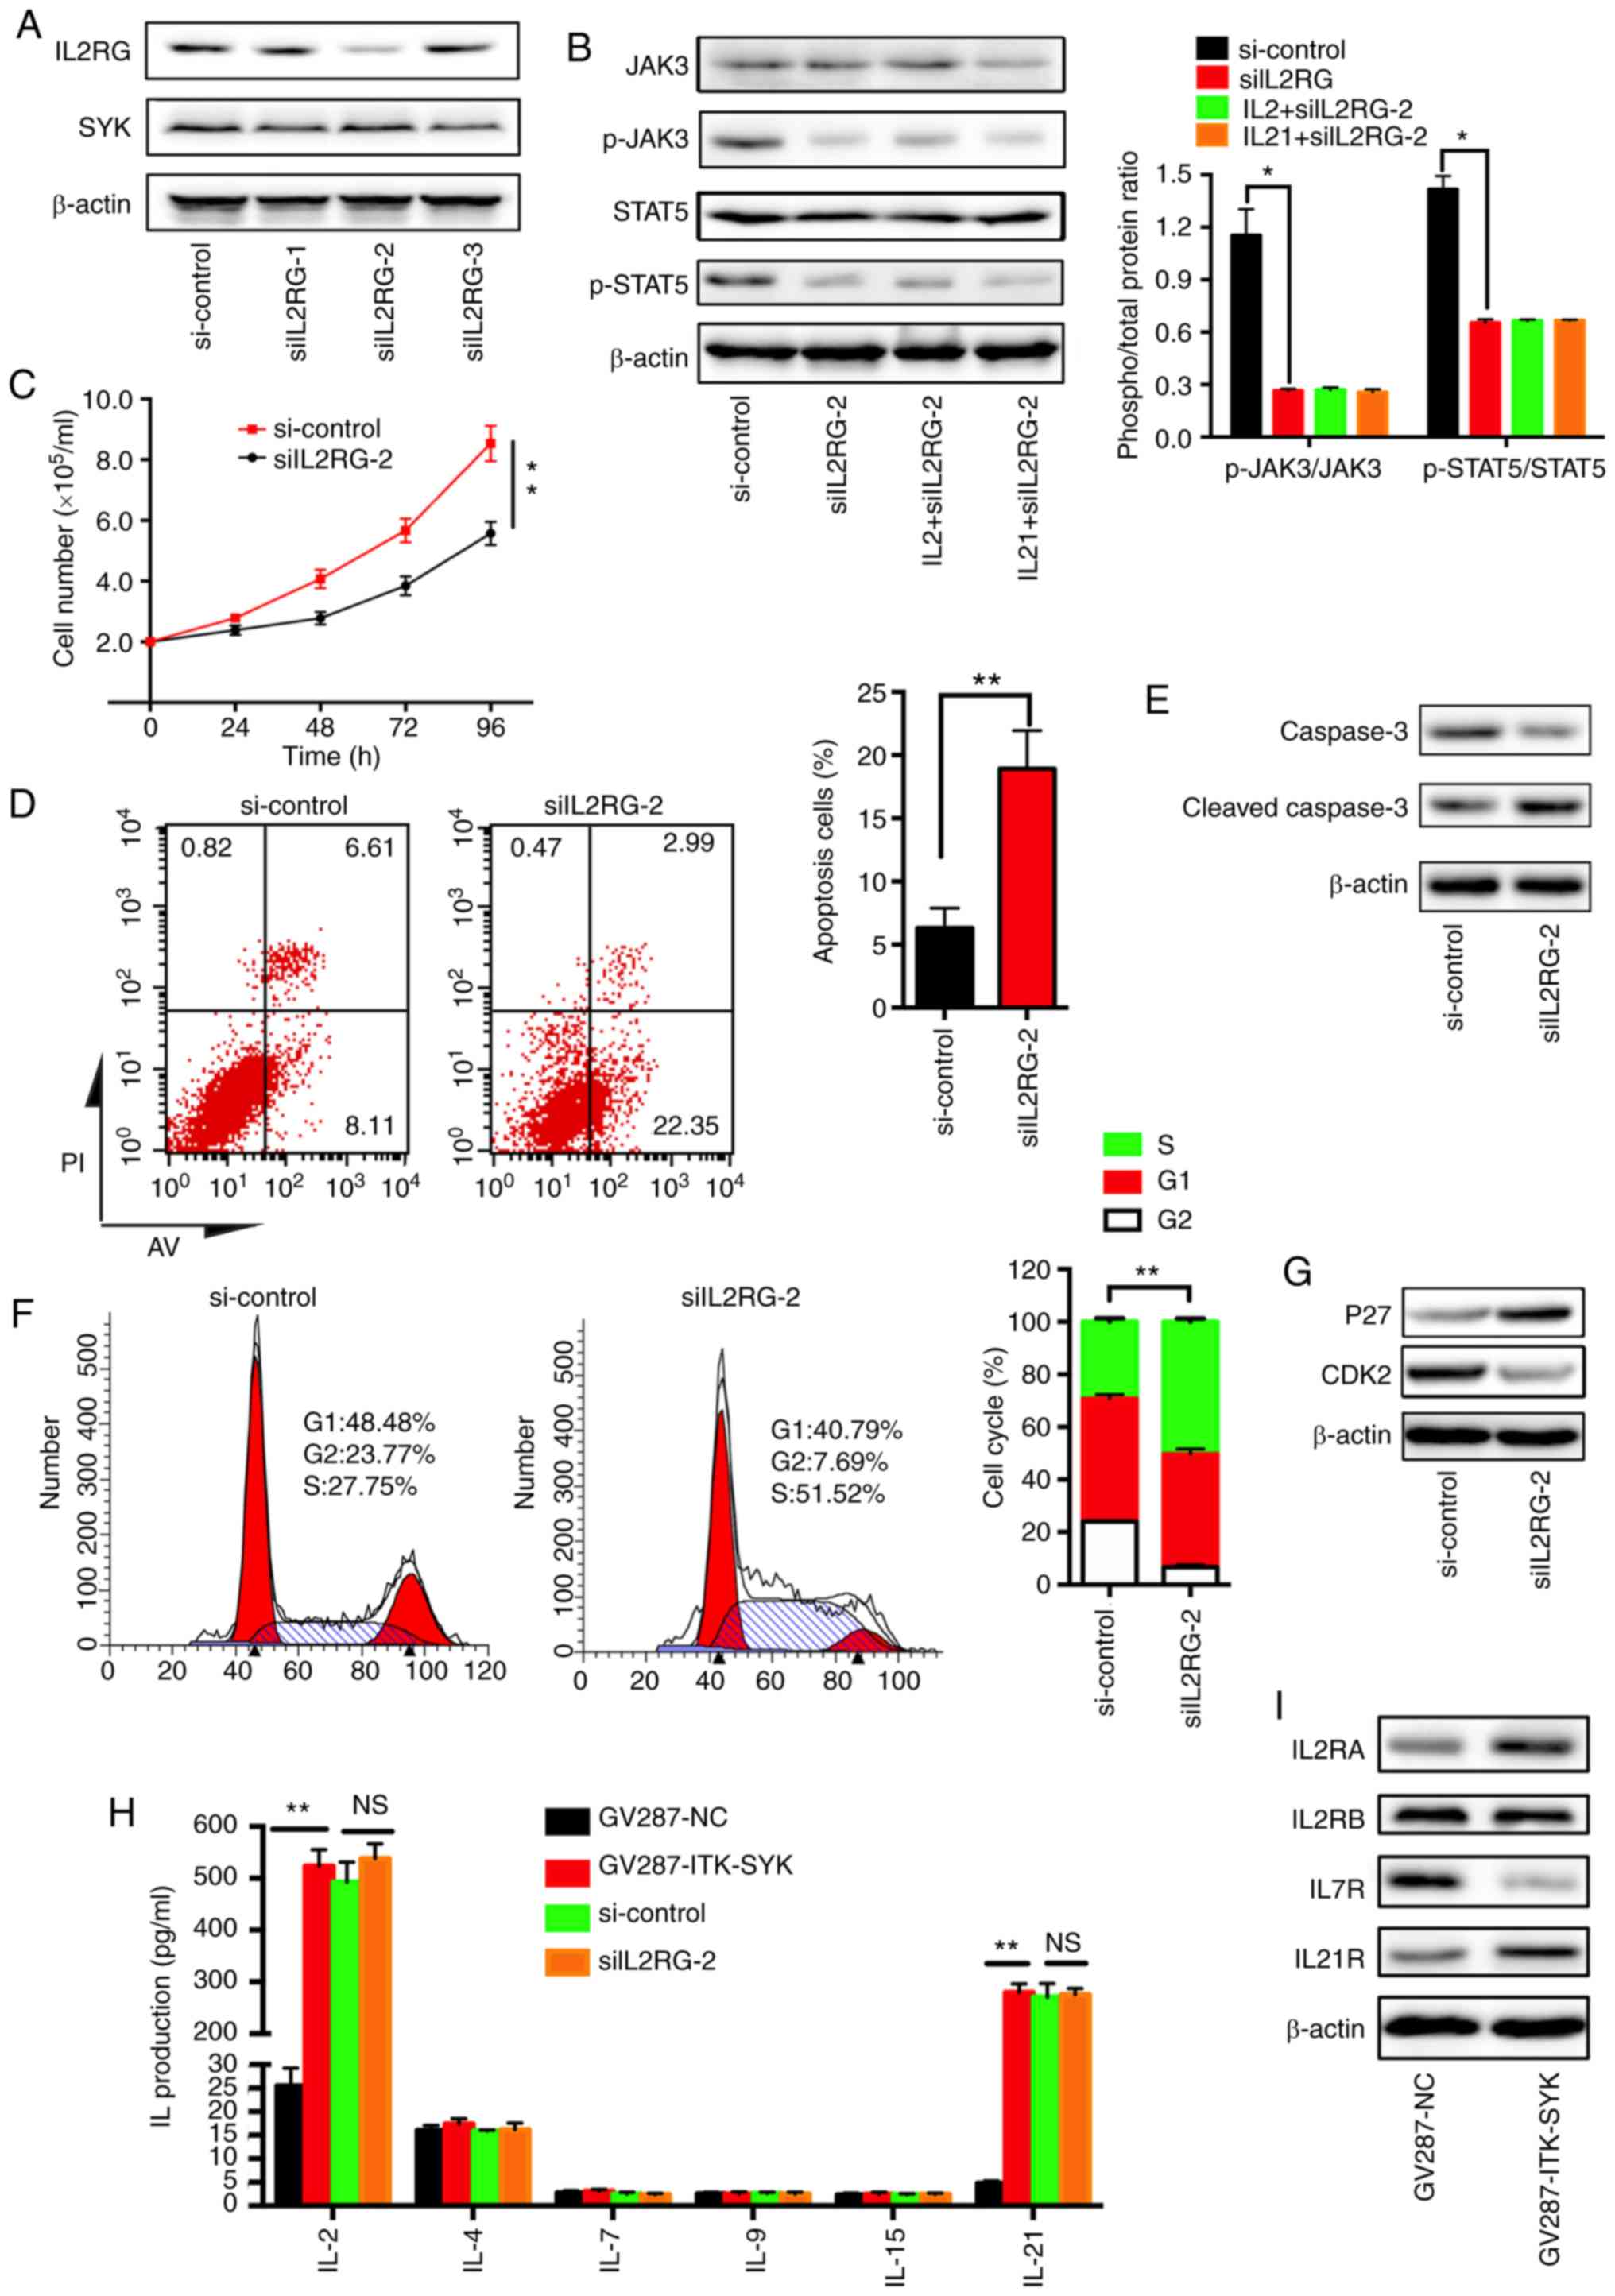
JAK3 phosphorylation was dependent on the
expression of IL2RG, and associated with the secretion of IL-2 and
IL-21
JAK3 is a tyrosine kinase that participates in the
signalling of several cytokines (IL-2, IL-4, IL-7, IL-9, IL-15 and
IL-21) through receptors that share the IL2RG chain (29). To determine whether JAK3 activation
shares a similar receptor-dependent mechanism of constitutive
signalling in ITK-SYK+ Jurkat cells, the effects of
IL2RG-knockdown on ITK-SYK+ Jurkat cells was analysed
and three IL2RG-specific siRNAs were used to inhibit IL2RG
signalling at the gene level. siIL2RG-2 effectively inhibited the
level of IL2RG compared with siIL2RG-1 and siIL2RG-3 (Fig. 5A). The growth curve showed that
IL2RG-knockdown significantly inhibited the number of
ITK-SYK+ Jurkat cells, which was increased in both
groups with the treatment duration (24, 48, 72 and 96 h; Fig. 5C). Similarly, IL2RG-knockdown
induced a significant increase in ITK-SYK+ Jurkat cell
apoptosis compared with the si-control-treated cells (Fig. 5D). Consistent with the results
obtained by flow cytometry, increased levels of cleaved caspase-3,
together with decreased levels of full-length caspase-3, were
observed in the siIL2RG-2-treated group (Fig. 5E). Cell cycle analysis demonstrated
a significant increase in the number of cells in the G1/S phase in
siIL2RG-2-treated ITK-SYK+ Jurkat cells (control 76.23%
vs. siIL2RG-2 92.31%; P<0.01; Fig.
5F). Consistent with the analysis of G1/S phase arrest,
increased levels of p27 and decreased levels of CDK2 were observed
in ITK-SYK+ Jurkat cells following treatment with
siIL2RG-2 (Fig. 5G). The
associated between the secretion of cytokines and IL2RG in
ITK-SYK+ Jurkat cells was then investigated. IL-2 and
IL-21 production was significantly induced in ITK-SYK+
Jurkat cells compared with that in ITK-SYK Jurkat cells, while the
secretion of IL-4, IL-7, IL-9 and IL-15 was not significantly
affected (Fig. 5H). IL-2 and IL-21
production in IL2RG-knocked down ITK-SYK+ Jurkat cells
was not significantly affected when compared with that in the
control. The level of tyrosine phosphorylation of STAT5 is a direct
indicator of the presence of a functional IL-2 receptor complex,
therefore the levels of tyrosine phosphorylation in STAT5 were
measured. The silencing of IL2RG by siIL2RG-2 significantly
suppressed the phosphorylation of JAK3 and STAT5 in
ITK-SYK+ Jurkat cells, while si-control did not affect
it (Fig. 5B). Meanwhile, extrinsic
IL-2 (25 ng/ml) and IL-21 (25 ng/ml) did not restore the changes
caused by siIL2RG-2. Consistent with the results of the cytokine
expression analysis, it was found that the expression levels of
IL2RA and IL21R were elevated in ITK-SYK+ Jurkat cells,
while that of IL7R was decreased (Fig.
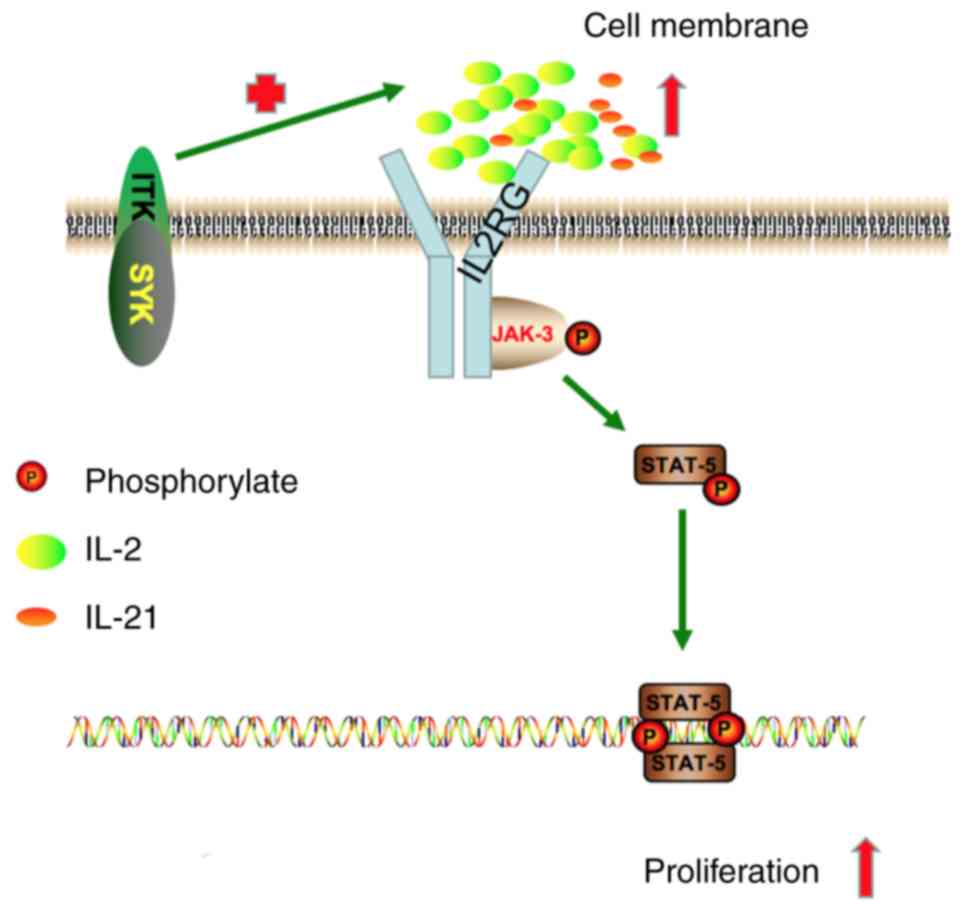
5I). Taken together, these findings showed that JAK3/STA5
phosphorylation was dependent on the presence of IL2RG in
ITK-SYK+ Jurkat cells, and the overexpression of fusion
gene was associated with the secretion of IL-2 and IL-21. All of
these data strongly suggest that IL2RG/JAK/STAT activation is
involved in PTCLs with the ITK-SYK fusion gene (Fig. 6).
 | Figure 5JAK3 phosphorylation is dependent on
the expression of IL2RG, and associated with the secretion of IL-2
and IL-21. ITK-SYK+ Jurkat cells were transfected with
siIL2RG or si-control for 48 h. (A) Western blot analysis of IL2RG
and SYK. (B) Exogenous IL-2 (25 ng/ml) or IL-21 (25 ng/ml) was
added to the Jurkat cells for 24 h. Cell lysates of si-control and
IL2RG-knockdown Jurkat cells, and IL2RG-knockdown Jurkat cells
treated with IL-2 or IL-21 were evaluated with western blotting
analysis for the expression levels of JAK3, p-JAK3, STAT5 and
p-STAT5. Densitometric analysis of the western blotting bands is
shown in the graph on the right. Data is expressed as the mean ±
SEM of the phosphorylated/total protein ratio. Data is expressed as
phospho/total protein ratio. (C) Growth curves in siIL2RG and
si-control cells by cell counting. The results are expressed as the
mean ± SD of five independent experiments. (D) Flow cytometry
analysis with Annexin V-PI staining was performed to evaluate the
percentage of apoptotic cells between siIL2RG and si-control cells;
the results are quantified in the graph on the right. (E-G) The
transduced and transfected Jurkat cells were cultured for 24 h. (E)
Cleaved caspase-3 and full-length caspase-3 were evaluated with
western blotting analysis. (F) The cells were fixed and stained
with PI. Cell cycle profiles were assessed using flow cytometry;
the results are quantified in the right panel. (G) p27 and CDK2
expression levels were evaluated with western blotting analysis.
(H) The protein concentrations of cytokines (IL-2, IL-4, IL-7,
IL-9, IL-15, IL-21) were determined by ELISA (n=3). Quantification
of the ELISAs is shown in the panel on the right. (I) Western
blotting analysed the expression levels of IL2R, IL7R and IL21R.
β-actin was used as the loading control. PI, propidium iodide; AV,
Annexin V; IL, interleukin, IL2RG, interleukin 2 receptor γ;
ITK-SYK, IL-2-inducible T-cell kinase-spleen tyrosine kinase; JAK,
tyrosine-protein kinase JAK; p27, cyclin-dependent kinase inhibitor
1B; CDK2, cyclin-dependent kinase 2; NS, not significant;
si-control, scrambled siRNA; si or siRNA, small interfering RNA.
*P<0.05 and **P<0.01. |
Discussion
The t(5;9)(q33;q22) translocation that results in
the constitutive activation of ITK-SYK tyrosine kinase is a key
oncogenic event in the development of PTCLs (7). In previous studies, ITK-SYK was found
to mimic the TCR signalling pathway and activate the downstream
PI3K-Akt and MAPK pathways (15-18).
However, the exact mechanism underlying ITK-SYK fusion is not well
understood. In the current study, mRNA expression profiling found
that DEGs between ITK-SYK+ and ITK-SYK− cells
were enriched in JAK/STAT, TCR, PI3K and MAPK signalling pathways.
Furthermore, the elevated secretion of IL-2 and IL-21 was induced
by ITK-SYK. Previous studies have reported that ITK-SYK triggers
the profound production of IL-2 in ITK-SYK+ Jurkat cells
at levels even higher (16,18)
than those induced by optimal CD3/CD28 co-stimulation in the
current study.
Signal-Net analysis with microarray data highlighted
the deregulation of the JAK/STAT pathway in ITK-SYK+
PTCLs. The JAK/STAT pathway is instrumental for the
differentiation, proliferation and survival of a variety of cell
types, including those of the haematopoietic lineages (30). The JAK family includes JAK1, JAK2,
JAK3 and TYK2 (31). Unlike JAK1,
JAK2 and TYK2 are ubiquitously expressed, while JAK3 is restricted
in the haematopoietic lineage and plays a vital role in lymphoid
cell development and proliferation (32-34).
In mouse models, the constitutive activation of JAK3 results in
megakaryocyte hyperplasia or lymphoproliferative disease (34,35).
In human pathology, JAK3 activation was found in haematological
malignancies, including adult T-cell leukaemia/lymphoma (36), cutaneous T-cell lymphoma (37,38),
natural killer/T-cell lymphoma (39), T-ALL (40), T-cell prolymphocytic leukaemia
(41) and acute myeloid leukaemia
(42). The majority of abnormal
JAK3 activation is related to gain-of-function mutations (43,44).
Most JAK3 mutants identified in samples from patients with T-ALL
were capable of conferring cytokine-independent growth to cell
lines in vitro and causing leukaemia in vivo
(43,45). However, in certain extranodal
NK/T-cell lymphoma nasal type cases reported in Asia, the function
of JAK3 was altered regardless of their mutation status, mainly due
to phosphorylation (46,47).
In the current study, JAK3 protein levels were
moderately increased, while the phosphorylation of JAK3 was
constitutively activated in ITK-SYK+ Jurkat cells. IL2RG
is essential to JAK3 activation (48). In the present study, silencing
IL2RG resulted in the inactivation of JAK3 and downstream STAT5.
Similar to the results of the current study, Fathi et al
(10) also observed that ITK-SYK
significantly enhanced phosphorylation of STAT. However, the
ITK-SYK fusion gene activated STAT3 instead of STAT5 in their
study, possibly due to the use of different cell lines (10). Sprissler et al (49) have reported that depletion of STAT5
blocks SYK-induced transformation. Their study also used a SYK
fusion gene, but they investigated the downstream mediator of
TEL-SYK instead of ITK-SYK (49).
Several studies have suggested that JAK1 is an essential kinase
required downstream of activated JAK3 (43,50).
Indeed, a close relationship exists between JAK1 and JAK3 at the
normal IL-7 receptor, where both kinases phosphorylate and activate
each other upon stimulation of the receptor (43). However, in the present study,
ITK-SYK caused the phosphorylation of JAK3, but not JAK1.
Furthermore, IL-7R was downregulated by ITK-SYK, consistent with
its JAK1-inactivated status. Taken together, these results suggest
that JAK3 activation by ITK-SYK was independent of JAK1. Further
experiments are required to explore the mechanisms underlying the
activation of JAK3 by the fusion gene.
Considering the restricted expression pattern and
function of JAK3 in lymphoid tissues, JAK3 appears to be a possible
target for therapy in various haematologic malignancies. In the
present study, the anti-tumour effects of the JAK3 inhibitor
tofacitinib against ITK-SYK+ Jurkat cells were evaluated
in vitro and in a murine xenograft model. Tofacitinib
suppressed cell growth, and induced apoptosis and G1/S phase
arrest. In the xenograft model, subcutaneous inoculation of
ITK-SYK+ CEM cells into NOD/SCID mice resulted in tumour
formation, and tofacitinib markedly suppressed tumour growth. As
tofacitinib is currently being assessed in the clinic for the
treatment of inflammatory diseases, it could also be assessed in
T-cell lymphoma in clinical trials. In previous studies, Streubel
et al (6) detected five
PTCL cases with the ITK-SYK fusion gene in 30 patients with
unspecified PTCL. However, Feldman et al (51) could not detect the fusion gene in
141 patients with PTCL. The authors of the current study attempted
to detect the clinical cases of PTCLs with the ITK-SYK fusion gene.
However, only one case with the fusion gene was detected in fresh
tissues by reverse transcription-quantitative PCR, therefore it was
not mentioned in the current study.
In conclusion, the authors of the current study
demonstrated that the IL2RG/JAK3/STAT5 signalling pathway was
activated in ITK-SYK+ Jurkat cells, and this activation
was associated with the abundant secretion of IL-2 and IL-21 driven
by the fusion gene. Finally, the authors of the current study
determined that the JAK3-specific inhibitor tofacitinib shows
potential as a new therapeutic agent against PTCLs with the ITK-SYK
fusion gene. Further studies should focus on the relationship
between ITK-SYK+ tumour cells and T follicular helper
cells.
Supplementary Data
Funding
The current study was supported by the National
Natural Science Foundation of China (grant no. 81400163).
Availability of data and materials
All data generated or analysed during the present
study are included in the published article.
Authors' contributions
LLZ, LL and TG designed the study and participated
in drafting the manuscript. LLZ, HXP and YXW performed the
experiments. All authors were responsible for data collection and
analysis, and read and approved the final version of the
manuscript.
Ethics approval and consent to
participate
The current study was approved on 01/16/2017 by the
Institutional Animal Care and Use Committee at Tongji Medical
College, Huazhong University of Science and Technology (Wuhan,
China; ACUC No. S842).
Patient consent for publication
Not applicable.
Competing interests
The authors declare no competing financial
interests.
Abbreviations:
|
PTCLs
|
peripheral T-cell lymphomas
|
|
ITK-SYK
|
IL-2-inducible T-cell kinase-spleen
tyrosine kinase
|
|
PTCL-NOS
|
peripheral T-cell lymphoma (not
otherwise specified)
|
|
PTCL-F
|
follicular variant of PTCL-NOS
|
|
MOI
|
multiplicity of infection
|
|
KEGG
|
Kyoto Encyclopedia of Genes and
Genomes
|
|
IL2RG
|
interleukin-2 receptor subunit γ
|
Acknowledgments
Not applicable.
References
|
1
|
Broccoli A and Zinzani PL: Peripheral
T-cell lymphoma, not otherwise specified. Blood. 129:1103–1112.
2017. View Article : Google Scholar : PubMed/NCBI
|
|
2
|
Said J and Pinter-Brown L: Clinical and
pathological diagnosis of peripheral T-cell lymphoma and emerging
treatment options: A case-based discussion. Clin Adv Hematol Oncol.
7 (Suppl)(S1): S4–13. S152009.
|
|
3
|
Bisig B, Gaulard P and de Leval L: New
biomarkers in T-cell lymphomas. Best Pract Res Clin Haematol.
25:13–28. 2012. View Article : Google Scholar : PubMed/NCBI
|
|
4
|
Boddicker RL, Razidlo GL, Dasari S, Zeng
Y, Hu G, Knudson RA, Greipp PT, Davila JI, Johnson SH, Porcher JC,
et al: Integrated mate-pair and RNA sequencing identifies novel,
targetable gene fusions in peripheral T-cell lymphoma. Blood.
128:1234–1245. 2016. View Article : Google Scholar : PubMed/NCBI
|
|
5
|
Sandell RF, Boddicker RL and Feldman AL:
Genetic landscape and classification of peripheral T cell
lymphomas. Curr Oncol Rep. 19:282017. View Article : Google Scholar : PubMed/NCBI
|
|
6
|
Streubel B, Vinatzer U, Willheim M,
Raderer M and Chott A: Novel t(5;9)(q33;q22) fuses ITK to SYK in
unspecified peripheral T-cell lymphoma. Leukemia. 20:313–318. 2006.
View Article : Google Scholar
|
|
7
|
Bach MP, Hug E, Werner M, Holch J,
Sprissler C, Pechloff K, Zirlik K, Zeiser R, Dierks C, Ruland J and
Jumaa H: Premature terminal differentiation protects from
deregulated lymphocyte activation by ITK-Syk. J Immunol.
192:1024–1033. 2014. View Article : Google Scholar : PubMed/NCBI
|
|
8
|
Huang Y, Moreau A, Dupuis J, Streubel B,
Petit B, Le Gouill S, Martin-Garcia N, Copie-Bergman C, Gaillard F,
Qubaja M, et al: Peripheral T-cell lymphomas with a follicular
growth pattern are derived from follicular helper T cells (TFH) and
may show overlapping features with angioimmunoblastic T-cell
lymphomas. Am J Surg Pathol. 33:682–690. 2009. View Article : Google Scholar : PubMed/NCBI
|
|
9
|
Attygalle AD, Feldman AL and Dogan A:
ITK/SYK translocation in angioimmunoblastic T-cell lymphoma. Am J
Surg Pathol. 37:1456–1457. 2013. View Article : Google Scholar : PubMed/NCBI
|
|
10
|
Fathi NN, Mohammad DK, Görgens A,
Andaloussi SE, Zain R, Nore BF and Smith CIE:
Translocation-generated ITK-FER and ITK-SYK fusions induce STAT3
phosphorylation and CD69 expression. Biochem Biophys Res Commun.
504:749–752. 2018. View Article : Google Scholar : PubMed/NCBI
|
|
11
|
Andreotti AH, Schwartzberg PL, Joseph RE
and Berg LJ: T-cell signaling regulated by the Tec family kinase,
Itk. Cold Spring Harb Perspect Biol. 2:a0022872010. View Article : Google Scholar : PubMed/NCBI
|
|
12
|
Prince AL, Yin CC, Enos ME, Felices M and
Berg LJ: The Tec kinases Itk and Rlk regulate conventional versus
innate T-cell development. Immunol Rev. 228:115–131. 2009.
View Article : Google Scholar : PubMed/NCBI
|
|
13
|
Rickert RC: New insights into pre-BCR and
BCR signalling with relevance to B cell malignancies. Nat Rev
Immunol. 13:578–591. 2013. View Article : Google Scholar : PubMed/NCBI
|
|
14
|
Tsang E, Giannetti AM, Shaw D, Dinh M, Tse
JK, Gandhi S, Ho H, Wang S, Papp E and Bradshaw JM: Molecular
mechanism of the Syk activation switch. J Biol Chem.
283:32650–32659. 2008. View Article : Google Scholar : PubMed/NCBI
|
|
15
|
Hussain A, Faryal R, Nore BF, Mohamed AJ
and Smith CI: Phosphatidylinositol-3-kinase-dependent
phosphorylation of SLP-76 by the lymphoma-associated ITK-SYK
fusion-protein. Biochem Biophys Res Commun. 390:892–896. 2009.
View Article : Google Scholar : PubMed/NCBI
|
|
16
|
Hussain A, Mohammad DK, Gustafsson MO,
Uslu M, Hamasy A, Nore BF, Mohamed AJ and Smith CI: Signaling of
the ITK (IL2-inducible T-cell kinase)-SYK fusion kinase is
dependent on adapter SLP-76 (SH2 domain-containing leukocyte
protein of 76 kD) and on the adapter function of the kinases
SYK/ZAP70 (zeta-chain [TCR] associated protein kinase 70 kD). J
Biol Chem. 288:7338–7350. 2013. View Article : Google Scholar : PubMed/NCBI
|
|
17
|
Dierks C, Adrian F, Fisch P, Ma H, Maurer
H, Herchenbach D, Forster CU, Sprissler C, Liu G, Rottmann S, et
al: The ITK-SYK fusion oncogene induces a T-cell
lymphoproliferative disease in mice mimicking human disease. Cancer
Res. 70:6193–6204. 2010. View Article : Google Scholar : PubMed/NCBI
|
|
18
|
Pechloff K, Holch J, Ferch U, Schweneker
M, Brunner K, Kremer M, Sparwasser T, Quintanilla-Martinez L,
Zimber-Strobl U, Streubel B, et al: The fusion kinase ITK-SYK
mimics a T cell receptor signal and drives oncogenesis in
conditional mouse models of peripheral T cell lymphoma. J Exp Med.
207:1031–1044. 2010. View Article : Google Scholar : PubMed/NCBI
|
|
19
|
Kanehisa M and Goto S: KEGG: Kyoto
encyclopedia of genes and genomes. Nucleic Acids Res. 28:27–30.
2000. View Article : Google Scholar
|
|
20
|
Kanehisa M, Sato Y, Kawashima M, Furumichi
M and Tanabe M: KEGG as a reference resource for gene and protein
annotation. Nucleic Acids Res. 44:D457–D462. 2016. View Article : Google Scholar :
|
|
21
|
Huang da W, Sherman BT and Lempicki RA:
Bioinformatics enrichment tools: Paths toward the comprehensive
functional analysis of large gene lists. Nucleic Acids Res.
37:1–13. 2009. View Article : Google Scholar
|
|
22
|
Huang da W, Sherman BT and Lempicki RA:
Systematic and integrative analysis of large gene lists using DAVID
bioinformatics resources. Nat Protoc. 4:44–57. 2009. View Article : Google Scholar : PubMed/NCBI
|
|
23
|
Shannon P, Markiel A, Ozier O, Baliga NS,
Wang JT, Ramage D, Amin N, Schwikowski B and Ideker T: Cytoscape: A
software environment for integrated models of biomolecular
interaction networks. Genome Res. 13:2498–2504. 2003. View Article : Google Scholar : PubMed/NCBI
|
|
24
|
Chen KT, Hour MJ, Tsai SC, Chung JG, Kuo
SC, Lu CC, Chiu YJ, Chuang YH and Yang JS: The novel synthesized
6-fluoro- (3-fluorophenyl)-4-(3-methoxyanilino)quinazoline (LJJ-10)
compound exhibits anti-metastatic effects in human osteosarcoma U-2
OS cells through targeting insulin-like growth factor-I receptor.
Int J Oncol. 39:611–619. 2011.PubMed/NCBI
|
|
25
|
Liao CL, Lai KC, Huang AC, Yang JS, Lin
JJ, Wu SH, Gibson Wood W, Lin JG and Chung JG: Gallic acid inhibits
migration and invasion in human osteosarcoma U-2 OS cells through
suppressing the matrix metalloproteinase-2/-9, protein kinase B
(PKB) and PKC signaling pathways. Food Chem Toxicol. 50:1734–1740.
2012. View Article : Google Scholar : PubMed/NCBI
|
|
26
|
Khokhlova ON, Tukhovskaya EA, Kravchenko
IN, Sadovnikova ES, Pakhomova IA, Kalabina EA, Lobanov AV,
Shaykhutdinova ER, Ismailova AM and Murashev AN: Using
Tiletamine-Zolazepam-Xylazine anesthesia compared to
CO2-inhalation for terminal clinical chemistry,
hematology, and coagulation analysis in mice. J Pharmacol Toxicol
Methods. 84:11–19. 2017. View Article : Google Scholar
|
|
27
|
Rigby S, Huang Y, Streubel B, Chott A, Du
MQ, Turner SD and Bacon CM: The lymphoma-associated fusion tyrosine
kinase ITK-SYK requires pleckstrin homology domain-mediated
membrane localization for activation and cellular transformation. J
Biol Chem. 284:26871–26881. 2009. View Article : Google Scholar : PubMed/NCBI
|
|
28
|
Eißmann M, Melzer IM, Fernandez SB, Michel
G, Hrabě de Angelis M, Hoefler G, Finkenwirth P, Jauch A, Schoell
B, Grez M, et al: Overexpression of the anti-apoptotic protein AVEN
contributes to increased malignancy in hematopoietic neoplasms.
Oncogene. 32:2586–2591. 2013. View Article : Google Scholar
|
|
29
|
Hekmatnejad M, Conwell S, Lok SM, Kutach
A, Shaw D, Fang E and Swinney DC: Insights into kinetic mechanism
of Janus kinase 3 and its inhibition by tofacitinib. Arch Biochem
Biophys. 612:22–34. 2016. View Article : Google Scholar : PubMed/NCBI
|
|
30
|
O'Shea JJ, Schwartz DM, Villarino AV,
Gadina M, McInnes IB and Laurence A: The JAK-STAT pathway: Impact
on human disease and therapeutic intervention. Annu Rev Med.
66:311–328. 2015. View Article : Google Scholar : PubMed/NCBI
|
|
31
|
Goll GL and Kvien TK: New-generation JAK
inhibitors: How selective can they be? Lancet. 391:2477–2478. 2018.
View Article : Google Scholar : PubMed/NCBI
|
|
32
|
Ross JA, Spadaro M, Rosado DC, Cavallo F,
Kirken RA and Pericle F: Inhibition of JAK3 with a novel, selective
and orally active small molecule induces therapeutic response in
T-cell malignancies. Leukemia. 28:941–944. 2014. View Article : Google Scholar
|
|
33
|
Kwatra SG: The role of Jak3 signaling in
IL-17 expression in malignant cutaneous T-cell lymphoma. J Invest
Dermatol. 131:1954–1956. 2011. View Article : Google Scholar : PubMed/NCBI
|
|
34
|
Cornejo MG, Kharas MG, Werneck MB, Le Bras
S, Moore SA, Ball B, Beylot-Barry M, Rodig SJ, Aster JC, Lee BH, et
al: Constitutive JAK3 activation induces lymphoproliferative
syndromes in murine bone marrow transplantation models. Blood.
113:2746–2754. 2009. View Article : Google Scholar : PubMed/NCBI
|
|
35
|
Cornejo MG, Boggon TJ and Mercher T: JAK3:
A two-faced player in hematological disorders. Int J Biochem Cell
Biol. 41:2376–2379. 2009. View Article : Google Scholar : PubMed/NCBI
|
|
36
|
Tomita M, Kawakami H, Uchihara JN,
Okudaira T, Masuda M, Matsuda T, Tanaka Y, Ohshiro K and Mori N:
Inhibition of constitutively active Jak-Stat pathway suppresses
cell growth of human T-cell leukemia virus type 1-infected T-cell
lines and primary adult T-cell leukemia cells. Retrovirology.
3:222006. View Article : Google Scholar : PubMed/NCBI
|
|
37
|
Krejsgaard T, Vetter-Kauczok CS, Woetmann
A, Lovato P, Labuda T, Eriksen KW, Zhang Q, Becker JC and Ødum N:
Jak3- and JNK-dependent vascular endothelial growth factor
expression in cutaneous T-cell lymphoma. Leukemia. 20:1759–1766.
2006. View Article : Google Scholar : PubMed/NCBI
|
|
38
|
Lauenborg B, Christensen L, Ralfkiaer U,
Kopp KL, Jønson L, Dabelsteen S, Bonefeld CM, Geisler C, Gjerdrum
LM, Zhang Q, et al: Malignant T cells express lymphotoxin α and
drive endothelial activation in cutaneous T cell lymphoma.
Oncotarget. 6:15235–15249. 2015. View Article : Google Scholar : PubMed/NCBI
|
|
39
|
Yan J, Li B, Lin B, Lee PT, Chung TH, Tan
J, Bi C, Lee XT, Selvarajan V, Ng SB, et al: EZH2 phosphorylation
by JAK3 mediates a switch to noncanonical function in natural
killer/T-cell lymphoma. Blood. 128:948–958. 2016. View Article : Google Scholar : PubMed/NCBI
|
|
40
|
Neumann M, Vosberg S, Schlee C, Heesch S,
Schwartz S, Gökbuget N, Hoelzer D, Graf A, Krebs S, Bartram I, et
al: Mutational spectrum of adult T-ALL. Oncotarget. 6:2754–2766.
2015. View Article : Google Scholar : PubMed/NCBI
|
|
41
|
Stengel A, Kern W, Zenger M, Perglerová K,
Schnittger S, Haferlach T and Haferlach C: Genetic characterization
of T-PLL reveals two major biologic subgroups and JAK3 mutations as
prognostic marker. Genes Chromosomes Cancer. 55:82–94. 2016.
View Article : Google Scholar
|
|
42
|
Wu AY, Yang HC, Lin CM, Wu BD, Qu QS,
Zheng YH, Wei H, Mei XQ, Zeng ZH and Ma XD: The transcriptome study
of subtype M2 acute myeloblastic leukemia. Cell Biochem Biophys.
72:653–656. 2015. View Article : Google Scholar
|
|
43
|
Degryse S, de Bock CE, Cox L, Demeyer S,
Gielen O, Mentens N, Jacobs K, Geerdens E, Gianfelici V, Hulselmans
G, et al: JAK3 mutants transform hematopoietic cells through JAK1
activation, causing T-cell acute lymphoblastic leukemia in a mouse
model. Blood. 124:3092–3100. 2014. View Article : Google Scholar : PubMed/NCBI
|
|
44
|
Jeong EG, Kim MS, Nam HK, Min CK, Lee S,
Chung YJ, Yoo NJ and Lee SH: Somatic mutations of JAK1 and JAK3 in
acute leukemias and solid cancers. Clin Cancer Res. 14:3716–3721.
2008. View Article : Google Scholar : PubMed/NCBI
|
|
45
|
Waldmann TA and Chen J: Disorders of the
JAK/STAT pathway in T cell lymphoma pathogenesis: Implications for
immunotherapy. Annu Rev Immunol. 35:533–550. 2017. View Article : Google Scholar : PubMed/NCBI
|
|
46
|
Kimura H, Karube K, Ito Y, Hirano K,
Suzuki M, Iwata S and Seto M: Rare occurrence of JAK3 mutations in
natural killer cell neoplasms in Japan. Leuk Lymphoma. 55:962–963.
2014. View Article : Google Scholar
|
|
47
|
Lee S, Park HY, Kang SY, Kim SJ, Hwang J,
Lee S, Kwak SH, Park KS, Yoo HY, Kim WS, et al: Genetic alterations
of JAK/STAT cascade and histone modification in extranodal
NK/T-cell lymphoma nasal type. Oncotarget. 6:17764–17776.
2015.PubMed/NCBI
|
|
48
|
Lindemann MJ, Benczik M and Gaffen SL:
Anti-apoptotic signaling by the interleukin-2 receptor reveals a
function for cytoplasmic tyrosine residues within the common gamma
(gamma c) receptor subunit. J Biol Chem. 278:10239–10249. 2003.
View Article : Google Scholar : PubMed/NCBI
|
|
49
|
Sprissler C, Belenki D, Maurer H, Aumann
K, Pfeifer D, Klein C, Müller TA, Kissel S, Hülsdünker J,
Alexandrovski J, et al: Depletion of STAT5 blocks TEL-SYK-induced
APMF-type leukemia with myelofibrosis and myelodysplasia in mice.
Blood Cancer J. 4:e2402014. View Article : Google Scholar : PubMed/NCBI
|
|
50
|
Kiel MJ, Velusamy T, Rolland D,
Sahasrabuddhe AA, Chung F, Bailey NG, Schrader A, Li B, Li JZ, Ozel
AB, et al: Integrated genomic sequencing reveals mutational
landscape of T-cell prolymphocytic leukemia. Blood. 124:1460–1472.
2014. View Article : Google Scholar : PubMed/NCBI
|
|
51
|
Feldman AL, Sun DX, Law ME, Novak AJ,
Attygalle AD, Thorland EC, Fink SR, Vrana JA, Caron BL, Morice WG,
et al: Overexpression of Syk tyrosine kinase in peripheral T-cell
lymphomas. Leukemia. 22:1139–1143. 2008. View Article : Google Scholar : PubMed/NCBI
|