Introduction
Liver cancer is a prevalent type of cancer in humans
that ranks as the third leading cause of cancer-related mortality
worldwide (1). Epidemiological
studies have shown that chronic hepatitis B virus (HBV) infection
is a major risk factor for liver cancer (2). As a member of the hepadnaviridae
family, HBV is among the smallest of all known animal viruses. The
integrated hepatitis B virion is a spherical particle, 42 nm in
diameter, which is also known as the Dane particle (3). The HBV genome is a circular,
partially double-stranded DNA of ~3,200 base pairs. Four
overlapping open reading frames encode a viral envelope protein
(pre-S1/pre-S2/S), a core protein (pre-C/C), a viral polymerase (P)
and an HBV X protein (HBx) (4,5).
HBx, which is highly conserved within the species,
is named after the encoding X gene as the amino acid sequence is
not homologous to any known protein (6,7). It
has been reported to be involved in the etiology of liver cancer
through the transcriptional regulation of certain proto-oncogenes.
However, the molecular mechanism underlying HBx-induced
carcinogenesis remains to be fully elucidated. HBx affects
hepatocyte proliferation and transformation by modulating signal
transduction, such as the Wnt pathway. As a Wnt-regulated protein,
E-cadherin is observed to decrease during epithelial-mesenchymal
transition (EMT) and has been regarded as the most important factor
in the progression of cancer to a more aggressive phenotype.
Smad-interacting protein 1 (SIP1) is one of the most important
transcriptional regulators for the expression of E-cadherin. In our
previous study, it was found that SIP1 regulated HBV replication
and expression (8); however,
whether SIP1 is involved in HBV-related diseases has received
limited attention.
In the present study, the role of SIP1 in
HBx-induced hepatocyte EMT and cancer aggressiveness was examined.
It was found that the exogenous expression of HBx resulted in
hepatocyte EMT through interacting with SIP1. HBx combined with
SIP1 and enhanced its ability to bind the promoter region of
E-cadherin and repress its transcription. Histone deacetylase 1
(HDAC1) was also found to be involved in the repressive complex
formation. Functional analysis demonstrated that the knockdown of
SIP1 abrogated the effect of HBx on cell proliferation, migration
and tumor aggressiveness. The present study is the first, to the
best of our knowledge, to elaborate on the role of SIP1 in
HBx-induced EMT and tumor aggressiveness.
Materials and methods
Plasmid DNA and lentivirus
The pcDNA3.1 and pcDNA3.1- HBx (pHBx) plasmids were
prepared in the Key Laboratory of Molecular Biology of Infectious
Diseases (Chinese Ministry of Education, Chongqing Medical
University). The plasmid expressing SIP1 (pcDNA4his/maxC-SIP1) was
donated by Professor Janet E. Mertz (McArdle Laboratory for Cancer
Research, University of Wisconsin-Madison School of Medicine and
Public Health). SIP1 short hairpin RNA (shSIP1) or non-targeting
shRNA (shCont) were cloned into the pGMLV-SC5 plasmid vector
provided by Genomeditech (Shanghai, China). The sequence of the
SIP1-targeting shRNA was 5′-GAA CAG ACA GGC TTA CGG A-3′ and that
of the shCont sequence was 5′-TGT TCT CCG AAC GTG TGT CAC GT-3′.
The plasmids expressing shSIP or shCont were also packaged into a
lentivirus. The pGL3-Basic and pRL-TK plasmids were obtained from
Promega Corporation (Madison, WI, USA, cat. no. E1751). The
wild-type E-cadherin promoter (proE-cad-Luc) and the mutagenic
E-cadherin promoter combined with a luciferase reporter
(proE-cad-Luc-mEbox) were provided by Kumiko UiTei. The mutation
sites of the E-cadherin promoter sequence covered the putative
E-boxes between CAG GTG/CAC CTG and AAG GTA/AAC CTA.
Cell culture and transfection
The HepG2 cells were maintained in Key Laboratory of
Molecular Biology of Infectious Diseases (Chinese Ministry of
Education, Chongqing Medical University). HepG2 cells were cultured
in Dulbecco's modified Eagle's medium (DMEM) supplemented with 10%
fetal calf serum (Gibco; Thermo Fisher Scientific, Inc., Waltham,
MA, USA) and 100 U/ml penicillin and streptomycin at 37°C under 5%
CO2. The hepatoma cell line stably expressing HBx
protein was established by transfecting the pcDNA3.1-HBx plasmid
into HepG2 cells (at ~70% confluence) using Lipofectamine 2000
(Invitrogen; Thermo Fisher Scientific, Inc.). After 24 h, cells
were selected with 1,000 µg/ml of G418 sulfate using the
limiting dilution method. The cell line was named HepG2-X and
confirmed by western blotting. For the transient expression of HBx,
the HepG2 cells were transfected with pcDNA3.1-HBx and were
collected after 48 h.
Synthesis of small interfering
(si)RNAs
The siRNAs targeting the HBx gene (siHBx) were
designed against the conserved target region of the gene. Negative
control siRNAs (siCont) were designed with scrambled sequences. All
siRNAs were chemically synthesized by Genepharma (Shanghai, China)
and the sequences are shown in Table
I.
 | Table IPrimer and siRNA sequences. |
Table I
Primer and siRNA sequences.
| Primer name | Sequence
(5′-3′) |
|---|
| siRNA |
| HBx siRNA
sense |
AAGAGGACUCUUGGACUCUCAdTdT |
| HBx siRNA
antisense |
UGAGAGUCCAAGAGUCCUCUUdTdT |
| Control siRNA
sense |
UUCUCCGAACGUGUCACGUdTdT |
| Control siRNA
antisense |
ACGUGACACGUUCGGAGAAdTdT |
| Chromatin
immunoprecipitation |
| Primer 1
forward |
AGGCAGGTGGATCATCTGAG |
| Primer 1
reverse |
TGTTCTTGGCTCACTGCAAC |
| Primer 2
forward |
TAGAGGGTCACCGCGTCTAT |
| Primer 2
reverse |
TCACAGGTGCTTTGCAGTTC |
| PCR |
| E-cadherin
forward |
TGCCCAGAAAATGAAAAAGG |
| E-cadherin
reverse |
GTGTATGTGGCAATGCGTTC |
| Vimentin
forward |
GCCAGGCAAAGCAGGAGT |
| Vimentin
reverse |
GGGTATCAACCAGAGGGAGT |
| SIP1 forward |
ATGGGGCCAGAAGCCACGAT |
| SIP1 reverse |
GTCGACTGCATGACCATCGC |
| β-actin
forward |
CTCTTCCAGCCTTCCTTCCT |
| β-actin
reverse |
AGCACTGTGTTGGCGTACAG |
Reagents and antibodies
The following primary antibodies were used in the
present study: Rabbit anti-E-cadherin monoclonal antibody (Cell
Signaling Technology, Inc., Beverly, MA, USA; cat. no. 3195),
rabbit anti-N-cadherin monoclonal antibody (Cell Signaling
Technology, Inc.; cat. no. 4061P), rabbit anti-Slug monoclonal
antibody (Cell Signaling Technology, Inc.; cat. no. 9585P), mouse
anti-vimentin monoclonal antibody (Santa Cruz Biotechnology, Inc.,
Dallas, TX, USA; cat. no. sc-15393), mouse anti-SIP1 monoclonal
antibody (E-11; Santa Cruz Biotechnology, Inc.; cat. no.
sc-271984), rabbit anti-SIP1 monoclonal antibody (Abcam, Cambridge,
UK; cat. no. ab-138222), mouse anti-HBx polyclonal antibody (Santa
Cruz Biotechnology, Inc.; cat. no. sc-57760), mouse anti-HDAC1
polyclonal antibody (Santa Cruz Biotechnology, Inc.; cat. no.
sc-81598), rabbit anti-HDAC1 monoclonal antibody (GeneTex, Inc.,
Irvine, CA, USA; cat. no. GTX100513222) and mouse anti-β-actin
monoclonal antibody (Boster Biological Technology, Ltd., Wuhan,
China; cat. no. BM0627). The HDAC inhibitor trichostatin A (TSA)
was obtained from Sigma-Aldrich; Merck KGaA (Darmstadt, Germany;
cat. no. T1952). DAPI (Beyotime Institute of Biotechnology) and
Lipofectamine 2000 (Invitrogen; Thermo Fisher Scientific, Inc.)
were used according to the manufacturer's protocols.
Western blotting
Protein was extracted from the cells using a protein
extraction kit (KaiJi, Jiangsu, China) according to the
manufacturer's protocol. The protein concentration was measured
with BCA protein assay reagent (Beyotime Institute of
Biotechnology). Approximately 50 µg of protein was separated
by 8% SDS-PAGE and blotted onto PVDF membranes (GE Healthcare
Bio-Sciences, Pittsburgh, PA, USA). After being blocked with 5%
non-fat milk for 1 h and blotted with the indicated primary
antibodies (anti-E-cadherin, anti-N-cadherin, anti-vimentin,
anti-SIP1 and anti-HDAC1 at 1:1,000 dilution; anti-Slug and
anti-HBx at 1:500 dilution; anti-β-actin at 1:2,000 dilution) on a
shaker at 4°C overnight, the membranes were incubated with
secondary goat anti-mouse antibody (1:5,000 dilution Boster
Biological Technology, Ltd., Wuhan, China; cat. no. BA1050) or goat
anti-rabbit antibody (1:5,000 dilution; Boster Biological
Technology, Ltd., Wuhan, China; cat. no. BM1054) for 1.5 h at 37°C.
The levels of targeted protein in the cells were evaluated using
the Bio-Rad electrophoresis documentation system (Gel Doc 1000,
Bio-Rad Laboratories, Inc., Hercules, CA, USA).
Reverse transcription-quantitative PCR
(RT-qPCR) analysis
Total RNA was isolated from the cells using TRIzol
reagent (Invitrogen; Thermo Fisher Scientific, Inc.). The total RNA
was then converted into single-stranded cDNA with a cDNA synthesis
kit (Takara Bio, Inc., Japan). The reaction conditions were as
follows: 37°C for 15 min and 85°C for 5 sec. Amplification of the
targeted genes was performed on a CFX96TM Real-time PCR detection
system (Bio-Rad Laboratories, Inc.) using SYBR Green PCR premix Ex
Taq (Takara Bio, Inc.). The qPCR conditions were as follows:
Initial denaturation at 95°C for 30 sec, followed by 40 cycles of
95°C for 5 sec and 60°C for 30 sec. The relative expression values
of the targeted genes were calculated using the comparative Cq
(2−ΔΔCq) method (9).
The primers used for the qPCR were synthesized by Sangon
Corporation (Shanghai, China) and are shown in Table I.
Immunofluorescent staining
Following rinsing with phosphate-buffered saline
(PBS), the cells were fixed on coverslips with 4% paraformaldehyde,
permeabilized with 0.5% Triton X-100, blocked with goat serum
(Boster Biological Technology, Ltd., Wuhan, China; cat. no. AR0009)
and subsequently incubated with the indicated primary antibody
(anti-E-cadherin or anti-vimentin; 1:100 dilution) overnight at
4°C. Following washing three times, the cells were incubated with
DyLight 549-Conjugated Goat anti-mouse secondary antibody (Abbkine
Scientific Co., Ltd.; cat. no. A23310; 1:100 dilution) or DyLight
549-Conjugated Goat Anti-Rabbit Secondary Antibody (Abbkine
Scientific Co., Ltd.; cat. no. A23320; 1:100 dilution) at 37°C for
1 h. The nuclei of the cells were stained with 10 µg/ml DAPI
at 37°C for 10 min. The fluorescent images were then observed and
analyzed by confocal fluorescence microscopy. Images were typically
selected from those of three repeated experiments.
Transwell assays
The cells were suspended at a density of
10×104/ml in medium without FBS and then placed in the
upper part of the Transwell unit with polycarbonate filters
(Corning Costar, Cambridge, MA, USA). Medium containing 10% FBS was
added to the lower wells of the chambers. Following overnight
culture at 37°C, the cells were fixed with 4% paraformaldehyde and
stained with 0.1% crystal violet at 37°C for 10 min. Three invasion
chambers were used per treated group. The cells in the upper
chamber were removed, washed with ddH2O and dried in
air. The cell migration abilities were quantified by counting the
number of cells that had passed through the membrane and fixed on
the underside.
Dual-luciferase assay
The cells were seeded at ~70% confluence in 24-well
culture plates, co-transfected with a luciferase reporter vector
promoter construct (pGL3-basic, proE-cad-Luc or proE-cad-Luc-mEbox)
and pRL-TK (an internal control) with either pcDNA4hismaxC-SIP1,
shRNA or a control vector using Lipofectamine 2000 (Invitrogen;
Thermo Fisher Scientific, Inc.). The cells were then treated with
TSA or DMSO. At 48 h post-transfection, the cells were collected
and measured for luciferase activity on a GloMax microplate
luminometer (Promega Corporation) using a dual-luciferase assay kit
(Promega Corporation) according to the manufacturer's
specifications. The firefly luciferase activity was normalized
based on the Renilla luciferase activity. Assays were performed in
triplicate and data are expressed as the mean ± standard
deviation.
Treatment of the cells with TSA
The human hepatoma cell lines were plated at 30%
confluence and cultured at 37°C under 5% CO2. TSA (500
µM) or DMSO (for control) were added and incubated for 48 h
at 37°C. During continued incubation, fresh culture medium was
provided every 24 h. Extracts were collected from the cells
following DMSO or TSA treatment and analyzed by western
blotting.
Co-immunoprecipitation (Co-iP) assay
The sonicated cell lysates were added to 0.7 ml of
RIPA lysis buffer (Beyotime Institute of Biotechnology), incubated
with anti-HBx or anti-SIP1 antibodies on a shaker at 4°C for 24 h,
and incubated with protein A/G agarose (Beyotime Institute of
Biotechnology) for at 4°C 5 h. The immune-complexes were resolved
by 10% SDS/PAGE, transferred onto PVDF membranes (GE Healthcare
Life Science, Little Chalfont, UK) and probed with antibodies
against HBx (1:500 dilution), SIP1 (1:1000 dilution) or HDAC1 (1000
dilution), as previously described in the western blotting
protocol.
Chromatin immunoprecipitation (ChIP)
analysis
The treated cells (at ~90% confluence) were
cross-linked with 1% formaldehyde at 37°C for 15 min and treated
with glycine buffer (1:10; Beyotime Institute of Biotechnology) at
37°C for 5 min to quench the crosslinking reaction. Then, the
samples were washed and resuspended in SDS lysis buffer (Beyotime
Institute of Biotechnology) containing 1 mM PMSF. Following lysis
on ice for 20 min, the samples were sonicated for 10 sec at 35 V
with 30-sec spacing intervals for 10 min. Anti-SIP1 (1:200),
anti-HBx (1:100) antibodies and immunoglobin G (negative control),
and protein A+G Agarose/Salmon Sperm DNA (Beyotime Institute of
Biotechnology) were added for immunoprecipitation. The precipitated
DNA was purified (OD 260/280=1.8-2.0) and subjected to PCR
amplification. In total, Two pairs of primers specific to the human
E-cadherin promoter were used for PCR analysis (Table I). The synthesized products were
separated on a 1% agarose gel and visualized with the Gel Doc 1000
electrophoresis documentation system (Bio-Rad Laboratories,
Inc.).
Cell proliferation assay
Cell Counting Kit-8 (CCK-8) assays were used to
determine cell viability in the cell proliferation assays. In
brief, the cells were cultured at a density of 5×10³ in
a 96-well plate. After transfection, the cells were incubated for
12, 24, 36 and 48 h, and 10 µl CCK-8 solution (Dojindo
Molecular Technologies, Inc., Kumamoto, Japan) was added to each
well and incubated for 2 h at 37°C. Absorbance at a wavelength of
490 nm was detected with a microplate reader. Each assay was
performed three times in triplicate.
Cell apoptosis analysis
The cells were seeded in a 6-well plate at a density
of 5×10⁴ and transfected with the indicated plasmids for
48 h. The cells were then trypsinized, washed twice with PBS,
resuspended in 95 µl of binding buffer and stained with 5
µl of Annexin V-FITC and 10 µl of propidium iodide
(PI) working solution. Following incubating in the dark for 20 min,
the cells were examined by flow cytometry.
Analysis of colony formation
For the clonogenicity analysis, at 24 h
post-transfection, the transfected cells were seeded into 12-well
plates at 500 cells (HepG2 cells) per well and maintained in
complete medium for 2 weeks. The colonies were fixed with methanol
and stained with crystal violet. The images were then observed
using an optical microscope.
Tumorigenicity assays in nude mice
The animals were provided by the Laboratory Animal
Centre of Chongqing Medical University (Chongqing, China). The use
of animals complied with the institutional guidelines and was
approved by the Ethics Committee of the Second Hospital Affiliated
to Chongqing Medical University. Nude mice were used to establish a
mouse xenograft model.18 mice (male, 4-6 weeks old) were randomly
divided into three groups, and housed under a 12-h light/dark cycle
at 25°C and had free access to food and water. The HepG2 cell line
and the HepG2-X cells infected with either shSIP1 or shCont were
collected for subcutaneous injection (5×10⁶ cells) into
the mice (n=6 per group). The length and width of each tumor was
monitored every week, and the tumor volume was calculated according
to the following formula: Tumor volume (cm3)=length ×
(width × width)/2. At 6 weeks following subcutaneous injection, the
nude mice bearing subcutaneous tumors were sacrificed and the
subcutaneous tumor masses were isolated for further use within 4
h.
In vivo metastatic model
The tumor masses were cut into 1×1 mm pieces and
steeped in RPMI-1640 that had been supplemented with 100 U/ml of
penicillin and streptomycin. Another 15 six-week-old nude mice were
randomly divided into three groups. Subsequently, a piece of tumor
from one tumor-bearing mouse was carefully implanted into the liver
of one of the new mice to establish a hepatoma orthotopic
transplantation metastatic model. To determine the time to detect
the tumor metastases in vivo, a preliminary experiment was
performed. After 8 weeks, the mice were sacrificed, and the livers,
diaphragm and lungs were removed and prepared for subsequent
histological examination. All animal experiments followed a blind
and randomized animal study protocol.
Hematoxylin-eosin (HE) staining
Liver and diaphragm tissues were immersed in 4%
paraformaldehyde for 4 h at room temperature, and then dehydrated
through ascending alcohol series. Paraffin-embedded blocks were cut
into 5-µm-thick sections, dewaxed in xylene at room
temperature, and rehydrated through decreasing ethanol series.
Then, Sections were stained with HE at room temperature for
histological analysis.
Statistical analysis
The study results are representative of at least
three independent experiments. The data are shown as the mean ± SD.
Statistical analysis and graphical presentation were performed
using the SPSS 16.0 (SPSS, Inc.) and GraphPad Prism software
(version 6; GraphPad Software, Inc.). Student's t-test was used for
all statistical analyses between groups. P<0.05 was considered
to indicate a statistically significant difference.
Results
Influence of the ectopic expression of
HBx on cell mobility and the expression of EMT-related
proteins
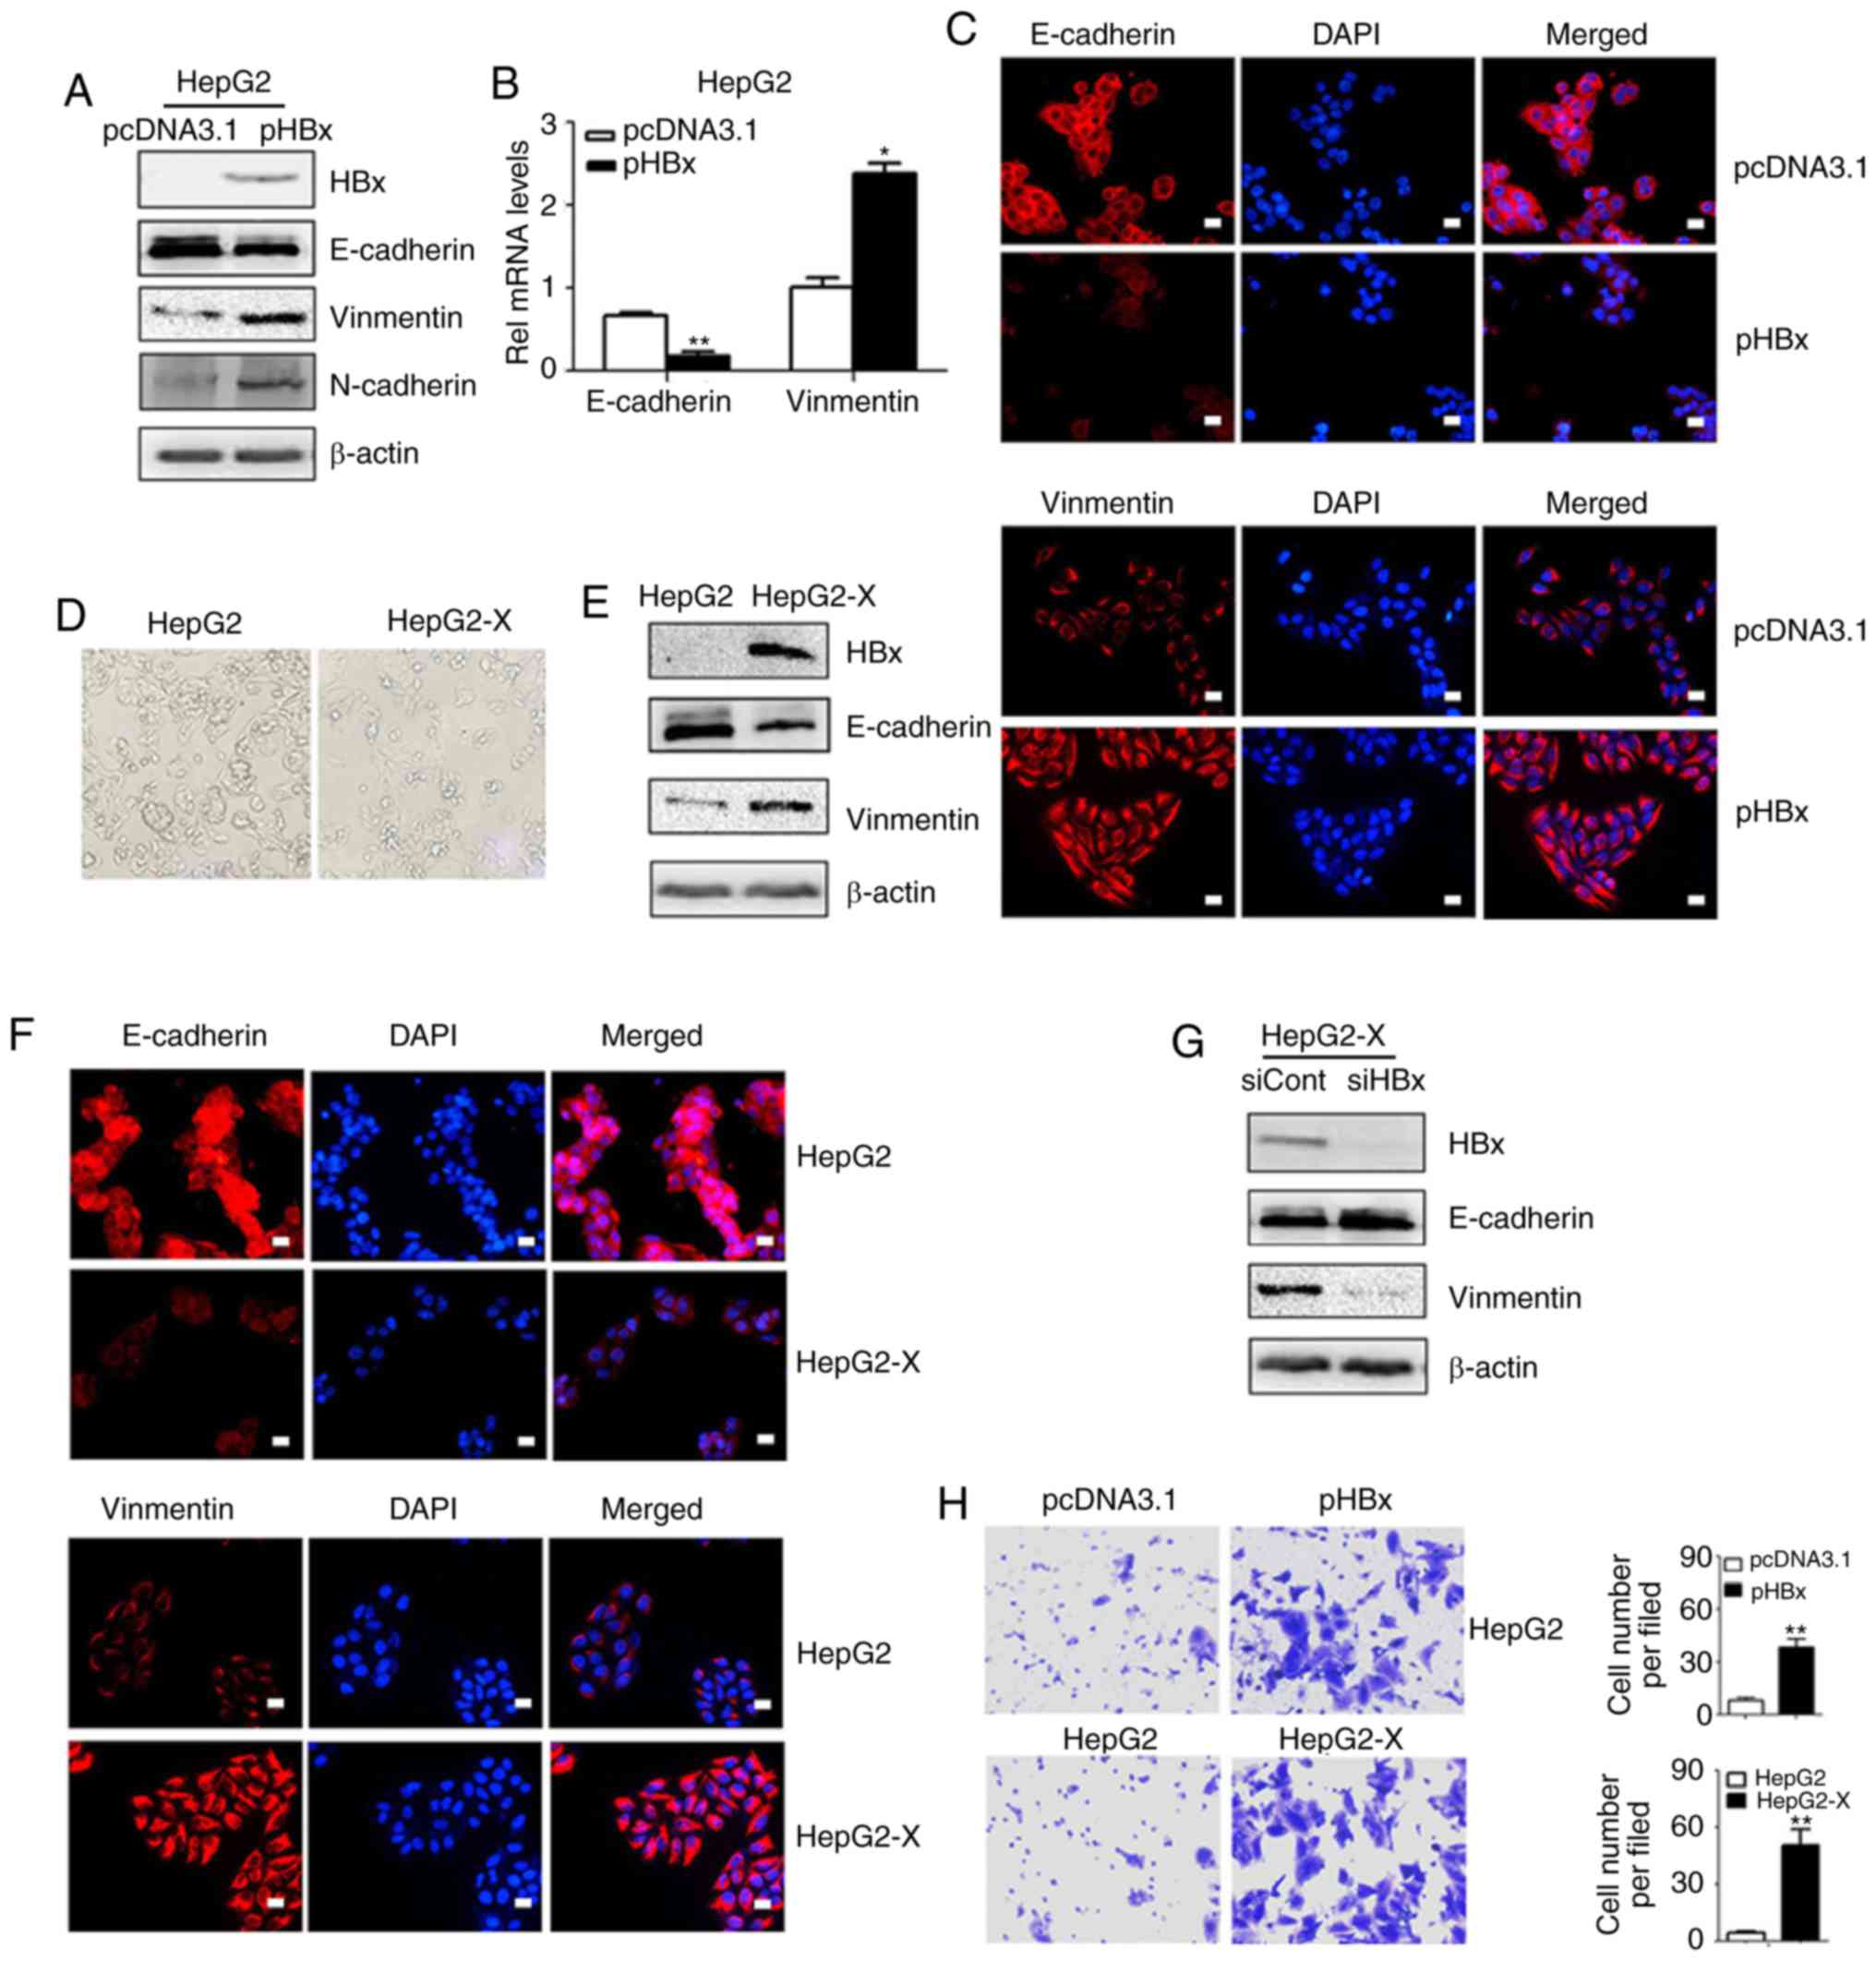
EMT is an important precursor to the invasion and
metastasis of a hepatoma tumor. To examine whether HBx induced EMT
directly, the HepG2 cells were transfected with the pHBx and the
expression levels of the EMT-related proteins were examined by
western blot analysis and immunofluorescent staining methods. As
shown in Fig. 1A, the expression
of HBx resulted in downregulation of the epithelial marker
E-cadherin and a concomitant increase in the expression of the
mesenchymal markers vimentin and N-cadherin. The RT-qPCR assay
confirmed that the transcription levels of E-cadherin decreased and
those of vimentin increased (Fig.
1B). Similar changes in E-cadherin and vimentin were observed
by immunofluorescent staining (Fig.
1C). To further confirm these results, the HepG2-X cells were
also examined. Once a monoclonal strain was established, the
HepG2-X cells lost their overlapping growth characteristics and
exhibited a fibroblast morphology while the parental HepG2 cells
maintained highly organized cell-cell adhesion (Fig. 1D). Western blot analysis confirmed
the decreased expression of E-cadherin and increased expression of
vimentin in the HepG2-X cells (Fig.
1E). These results were further confirmed by immunofluorescent
staining (Fig. 1F). By contrast,
when the overexpression of HBx in HepG2-X cells was knocked down by
siRNA, the repressed levels of E-cadherin were restored and the
expression of vimentin was reduced (Fig. 1G).
As increased cell migration is associated with EMT,
Transwell assays were performed to detect cell mobility. The
pHBx-transfected HepG2 cells demonstrated increased mobility in the
Transwell assays compared with the pcDNA3.1 transfected cells.
Similarly, increased cell mobility was observed in the HepG2-X
cells compared with that in the parental cells (Fig. 1H).
Epigenetic repression of E-cadherin by
HBx is associated with SIP1
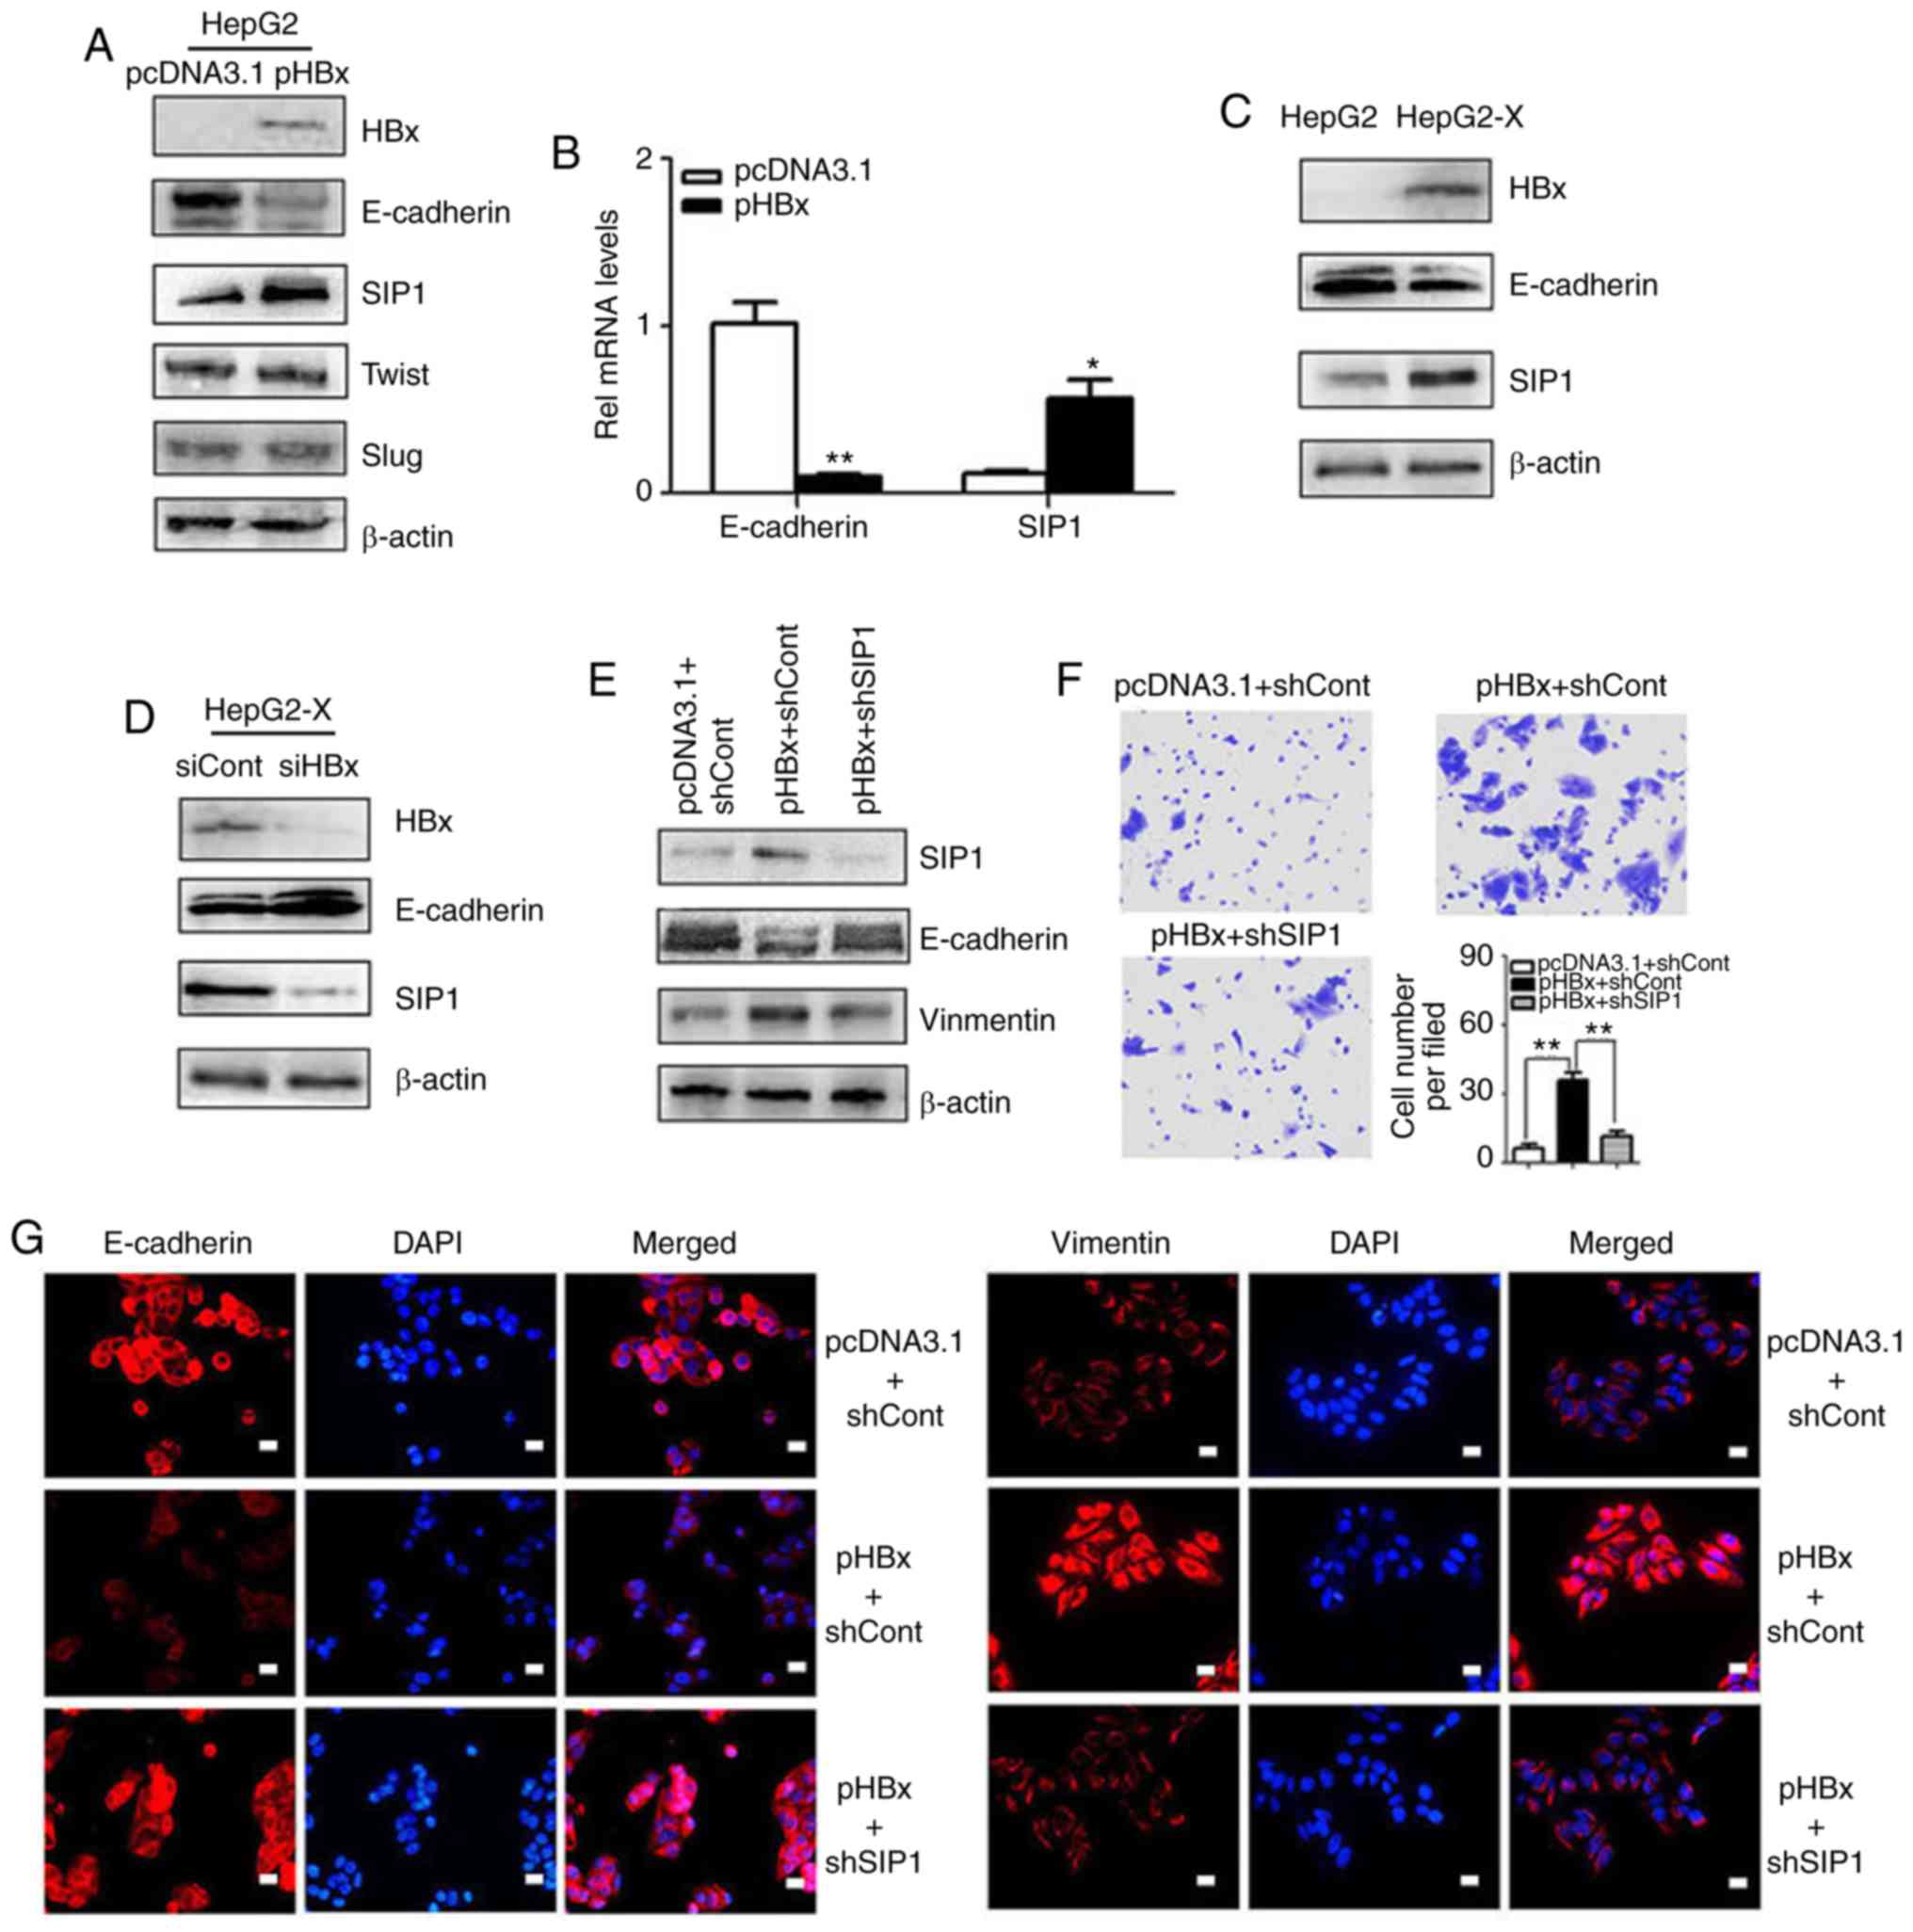
As an essential EMT protein marker, the repression
of E-cadherin is normally required for cell migration and is
associated with a poor cancer prognosis. The present study probed
the molecular mechanisms through which HBx represses E-cadherin. In
screening for the key regulators of the HBx-induced repression of
E-cadherin in hepatoma cells, it was found that the transcription
factor SIP1 was essential. Western blotting was used to investigate
the expression of E-cadherin and several transcription factors
implicated in EMT. Among these transcription factors, SIP1
exhibited increased expression in the pHBx-transfected HepG2 cells
compared with that in the controls. SIP1 also exhibited a negative
relationship with E-cadherin (Fig. 2A
and B). A similar correlation was found between the expression
levels of E-cadherin and SIP1 in HepG2-X cells that stably
expressed HBx (Fig. 2C). By
contrast, the knockdown of HBx by siRNA transfection in the HepG2-X
cells resulted in the reduced expression of SIP1 and concomitant
upregulation of E-cadherin (Fig.
2D), indicating close links between SIP1, E-cadherin and
HBx.
To further examine whether SIP1 is a crucial factor
in HBx-induced EMT, the present study examined whether the
knockdown of SIP1 reverted the EMT phenotypes. Following the
suppression of SIP1 by shRNAs in HBx-expressing HepG2 cells, the
E-cadherin levels were restored (Fig.
2E). Subsequent immunofluorescent staining was performed to
confirm the results. As shown in Fig.
2G, the loss of SIP1 in HBx-expressing HepG2 cells resulted in
the increased expression of E-cadherin and decreased expression of
vimentin. The Transwell migration analysis showed that the
promoting effects of HBx on cell migration were abrogated by the
down-regulation of SIP1 (Fig. 2F).
Together, these data suggested that SIP1 may contribute to the
epigenetic repression of E-cadherin mediated by HBx.
SIP1 migrates to the E-cadherin promoter
region to repress its expression with the cooperation of HBx
As E-cadherin was downregulated at the
transcriptional level following HBx introduction, it was
hypothesized that HBx may directly regulate the promoter activity
of E-cadherin. An E-cadherin promoter-luciferase reporter plasmid
(proE-cad-Luc) was transfected into HepG2 cells to determine how
HBx repressed the expression of E-cadherin. Consistent with the
hypothesis, the overexpression of HBx significantly decreased the
activity of the E-cadherin promoter in the HepG2 cells compared
with that in the empty vector control or mock transfection cells
(Fig. 3A).
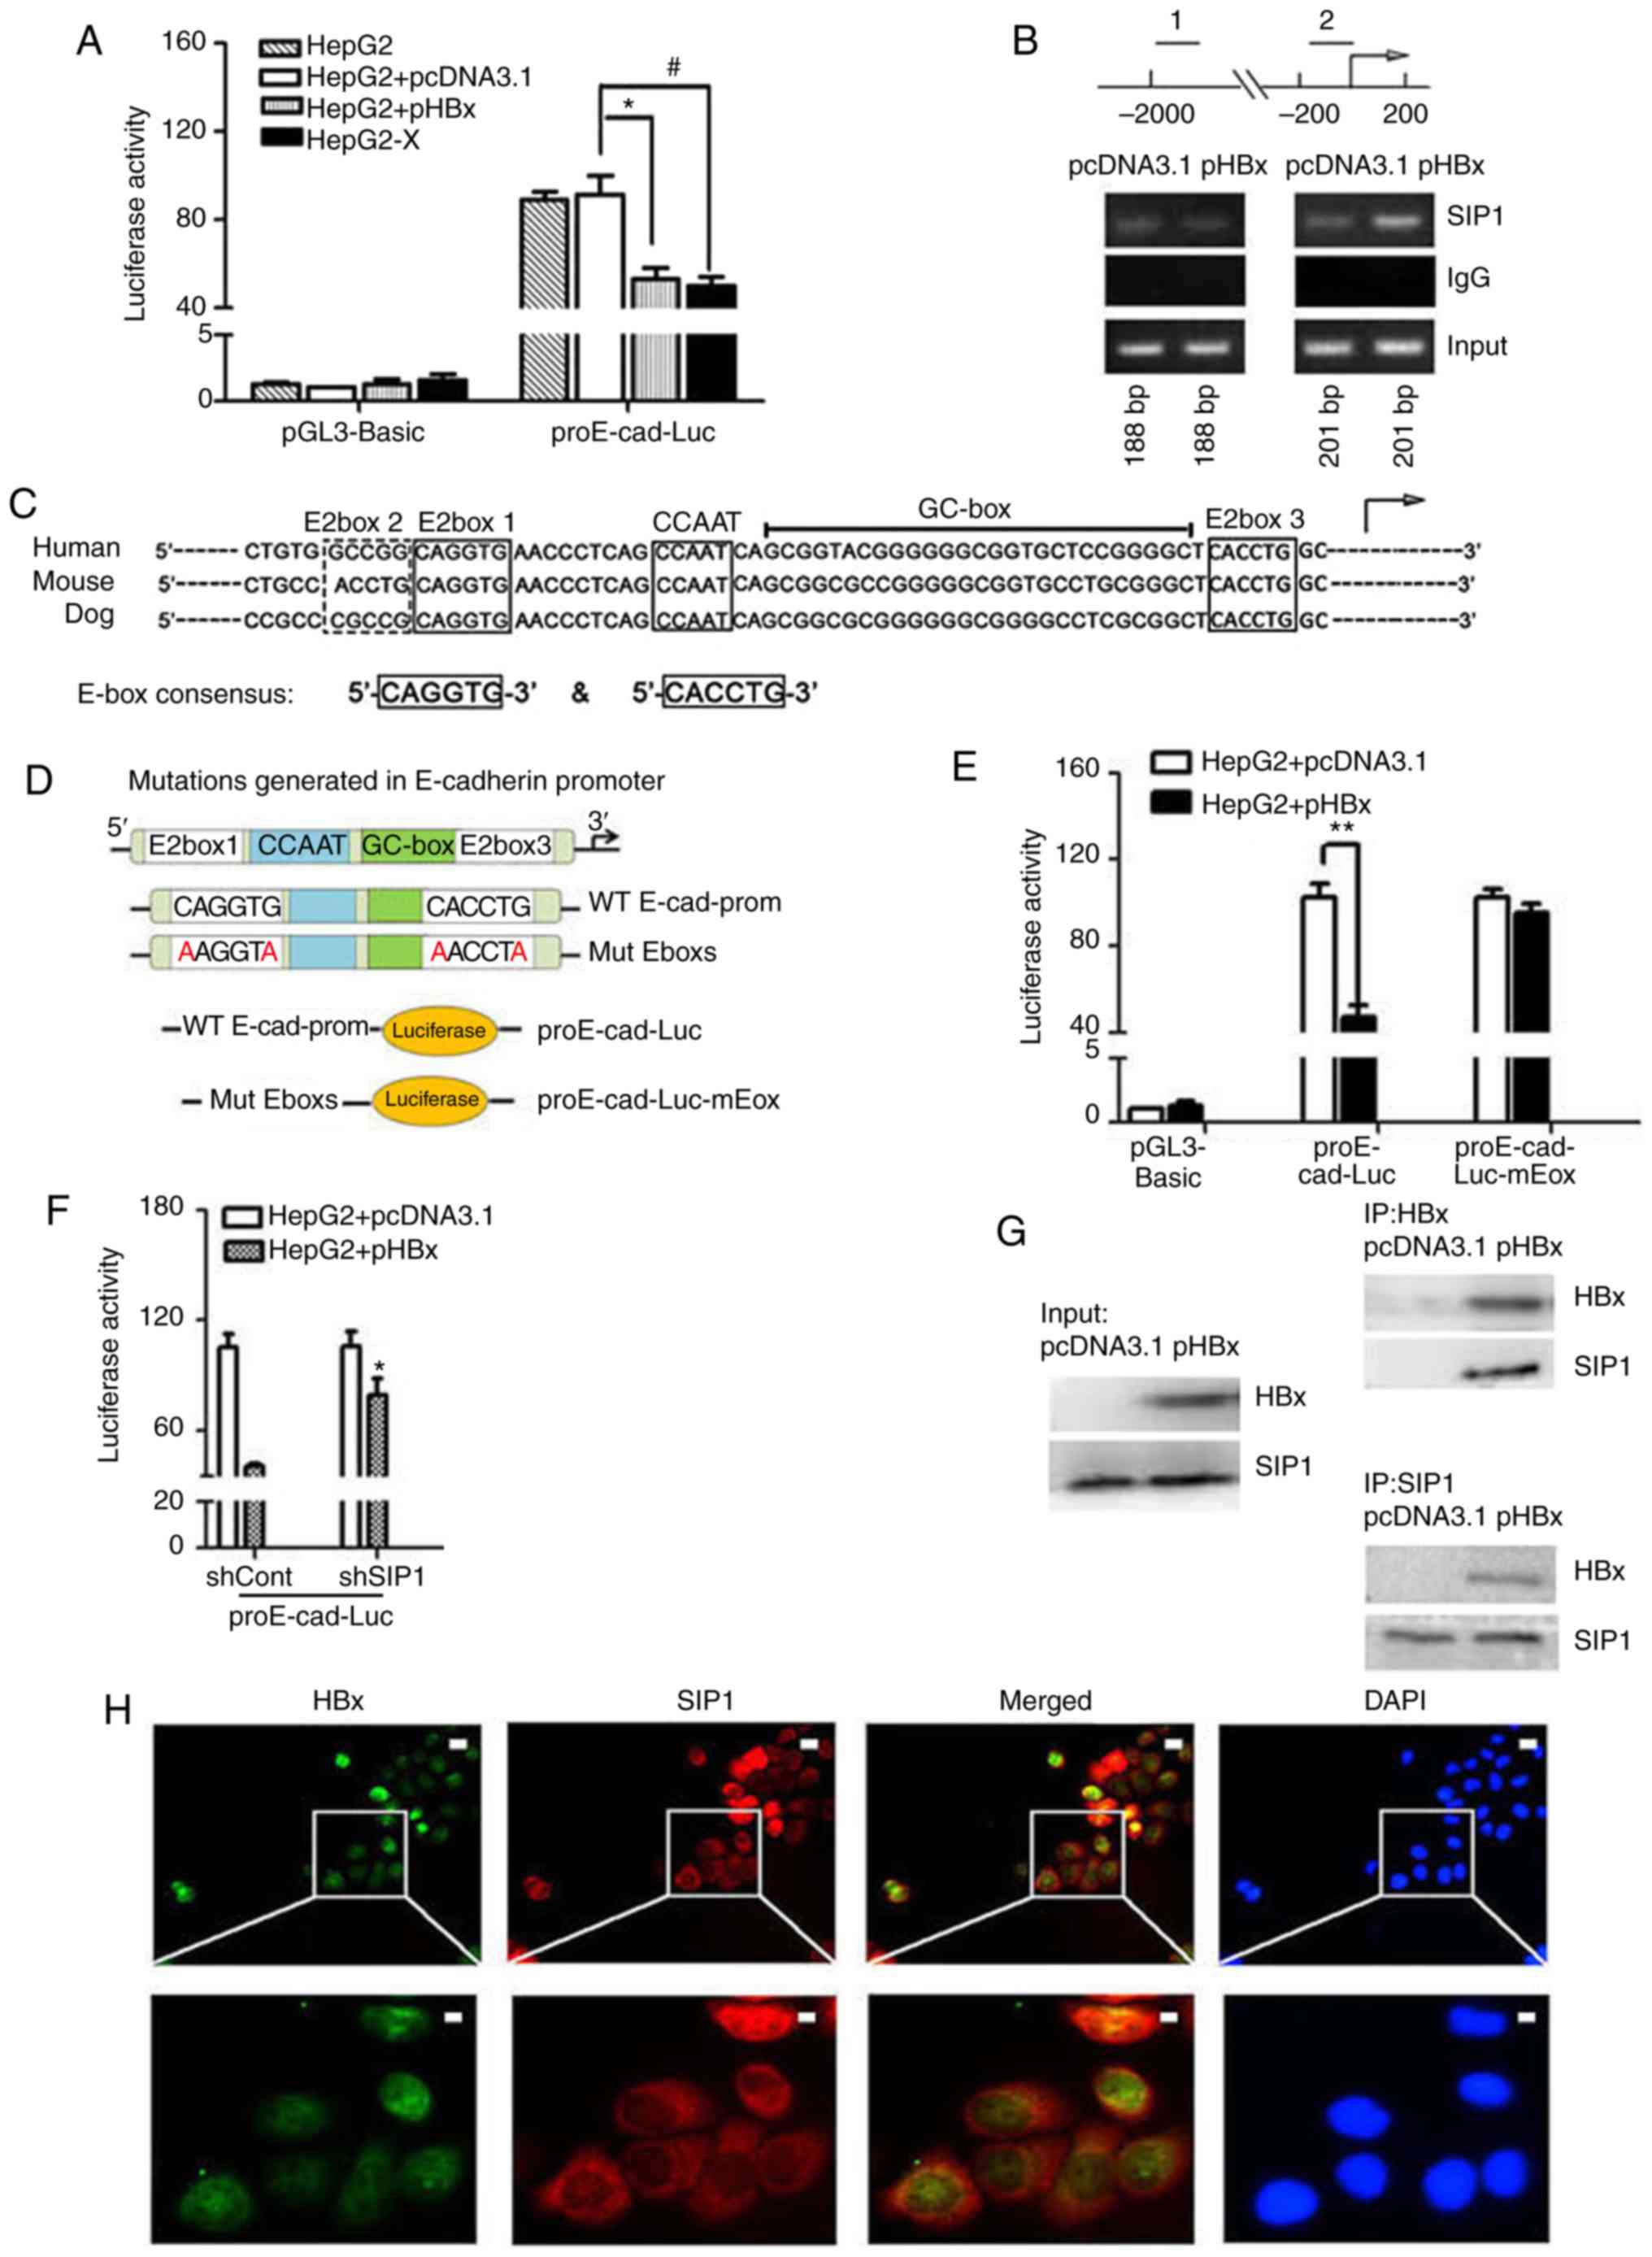 | Figure 3HBx recruits endogenous SIP1 to the
E-cadherin promoter. (A) Dual-luciferase assay of human E-cadherin
promoters in Mock treated, pcDNA3.1 or pHBX transfected HepG2 cells
and HepG2-X cells. Data were normalized to the luciferase activity
of cells treated with pcDNA3.1 and pGL3-Basic. Data are
representative of at least three independent experiments.
*P<0.05 HepG2 + pcDNA3.1 vs. HepG2 + pHBx;
#P<0.05 HepG2 + pcDNA3.1 vs. HepG2-X. (B) ChIP
primers were designed on E-cadherin gene regulatory regions. Distal
primers correspond to downstream regulatory regions (1) of -1895 to -1707 nt of the E-cadherin
gene. The ChIP primers (2) were
designed adjacent to the TSS locations across the E-box region of
the human E-cadherin promoter. pHBx-transfected HepG2 cell lysates
were subjected to ChIP using an anti-SIP1 antibody. PCR was
conducted using the indicated primer pairs. An empty vector and IgG
served as external and internal negative controls. (C) Sequence
homology of the consensus E-box in the E-cadherin promoter of
mammalian. E-boxes 1, 3 and 4, CCAAT box and GC box are conserved
regulatory elements, as shown in the diagram. The arrow indicates
the putative TSS. (D) Mutations generated in the E-boxes carried
the E-box 1 mutation CAGGTG → AAGGTA and E-box 3 mutation CACCTG →
AACCTA. The wild-type E-cadherin promoter and promoter comprising
two mutated E-boxes were cloned into a luciferase vector to
construct the proE-cad-Luc and proE-cad-Luc-mEbox plasmids. (E)
Dual-luciferase assay of E-cadherin promoter constructs with
proE-cad-Luc or proE-cad-Luc-mEbox in pHBx- or pcDNA3.1-transfected
HepG2 cells. **P<0.01. (F) Relative E-cadherin
promoter activities inshSIP1/shCont and pcDNA3.1/pHBX treated HepG2
cells. *P<0.05; (shSIP1 + WT, vs. shCont + WT). (G)
Co-immunoprecipitation in protein extracts of pcDNA3.1-transfected
HepG2 cells and HBx-expressing HepG2 cells with anti-SIP1 or
anti-HBx antibodies and western blot detection of HBx and SIP1,
respectively. (H) Immunofluorescent staining of HepG2-X cells with
anti-HBx and anti-SIP1 to show the subcel-lular co-localization of
HBx and SIP. DAPI was used to visualize nuclei. Scale bar=10
µm. SIP1, Smad interacting protein 1; HBx, hepatitis B virus
X; pHBx, pcDNA3.1-HBx; sh, short hairpin RNA. TSS, transcription
start site; WT, proE-cad-Luc; Mut, proE-cad-Luc-mEbox; ChIp,
chromatin immunoprecipitation. |
As suggested in previous research, E-boxes within
the human E-cadherin promoter are conserved among mammalian
sequences (Fig. 3C). The two
E-boxes (E-box 1 and 3) that cover the proximal transcription start
site have been shown to serve a crucial role in regulating
E-cadherin by providing binding sites for SIP1 (10-12).
To examine whether HBx regulates the expression of E-cadherin by
enhancing SIP1 binding to E-cadherin promoter, ChIP assays were
performed. The results revealed that HBx strengthened the binding
of SIP1 to E-cadherin promoter fragments that spanned the E-boxes
(Fig. 3B). To further elucidate
the effect of this binding complex on the E-cadherin promoter, a
luciferase reporter plasmid constructed with an E-cadherin promoter
that had mutated E-boxes (mutated in both E-box1 and E-box3) was
introduced (Fig. 3D). The results
showed that the mutation of key nucleotides eliminated the
HBx-induced inhibition of the reporter gene activity (Fig. 3E). By contrast, the knockdown of
SIP1 in the pHBx-transfected HepG2 cells increased the wild-type
E-cadherin promoter-driven luciferase activity (Fig. 3F). These data indicated that HBx
may suppress the activity of the E-cadherin promoter by enhancing
SIP1 binding to spaced E-boxes.
To elucidate whether there was a physical
interaction between HBx and Sip1, Co-IP analysis of HBx-expressing
HepG2 cells was performed. The results showed that SIP1 effectively
bound to HBx in the HBx-expressing HepG2 cells (Fig. 3G). Subsequently, the subcellular
distribution of HBx and SIP1 in HepG2-X cells were examined via
immunofluorescent staining. As shown in Fig. 3H, SIP1 primarily localized in the
perinuclear region of the cytoplasm; a lower level had translocated
into the nucleus, with overlapping subcellular distribution of HBx
in the HepG2-X cells, particularly in the nucleus. The present
results suggested that HBx may cooperate with SIP1 to repress the
expression of E-cadherin inside the cell nucleus at the E-box sites
of the E-cadherin promoter.
HBx recruits SIP1 and HDAC1 to repress
the E-cadherin promoter
HDAC1 has been reported to epigenetically modify the
expression of various genes, therefore, the present study examined
whether HDAC1 is involved in the HBx-mediated repression of
E-cadherin. When the HepG2 cells were treated with TSA, an HDAC
inhibitor, the expression levels of E-cadherin increased
significantly and the HBx-mediated repression of E-cadherin was
reversed to a certain level (Fig.
4A). In addition, compared with the pcDNA3.1 transfection
control, HBx transfection increased the expression of HDAC1
significantly. These results indicated that histone deacetylation
may be one of the mechanisms that HBx utilizes to regulate the
expression of E-cadherin.
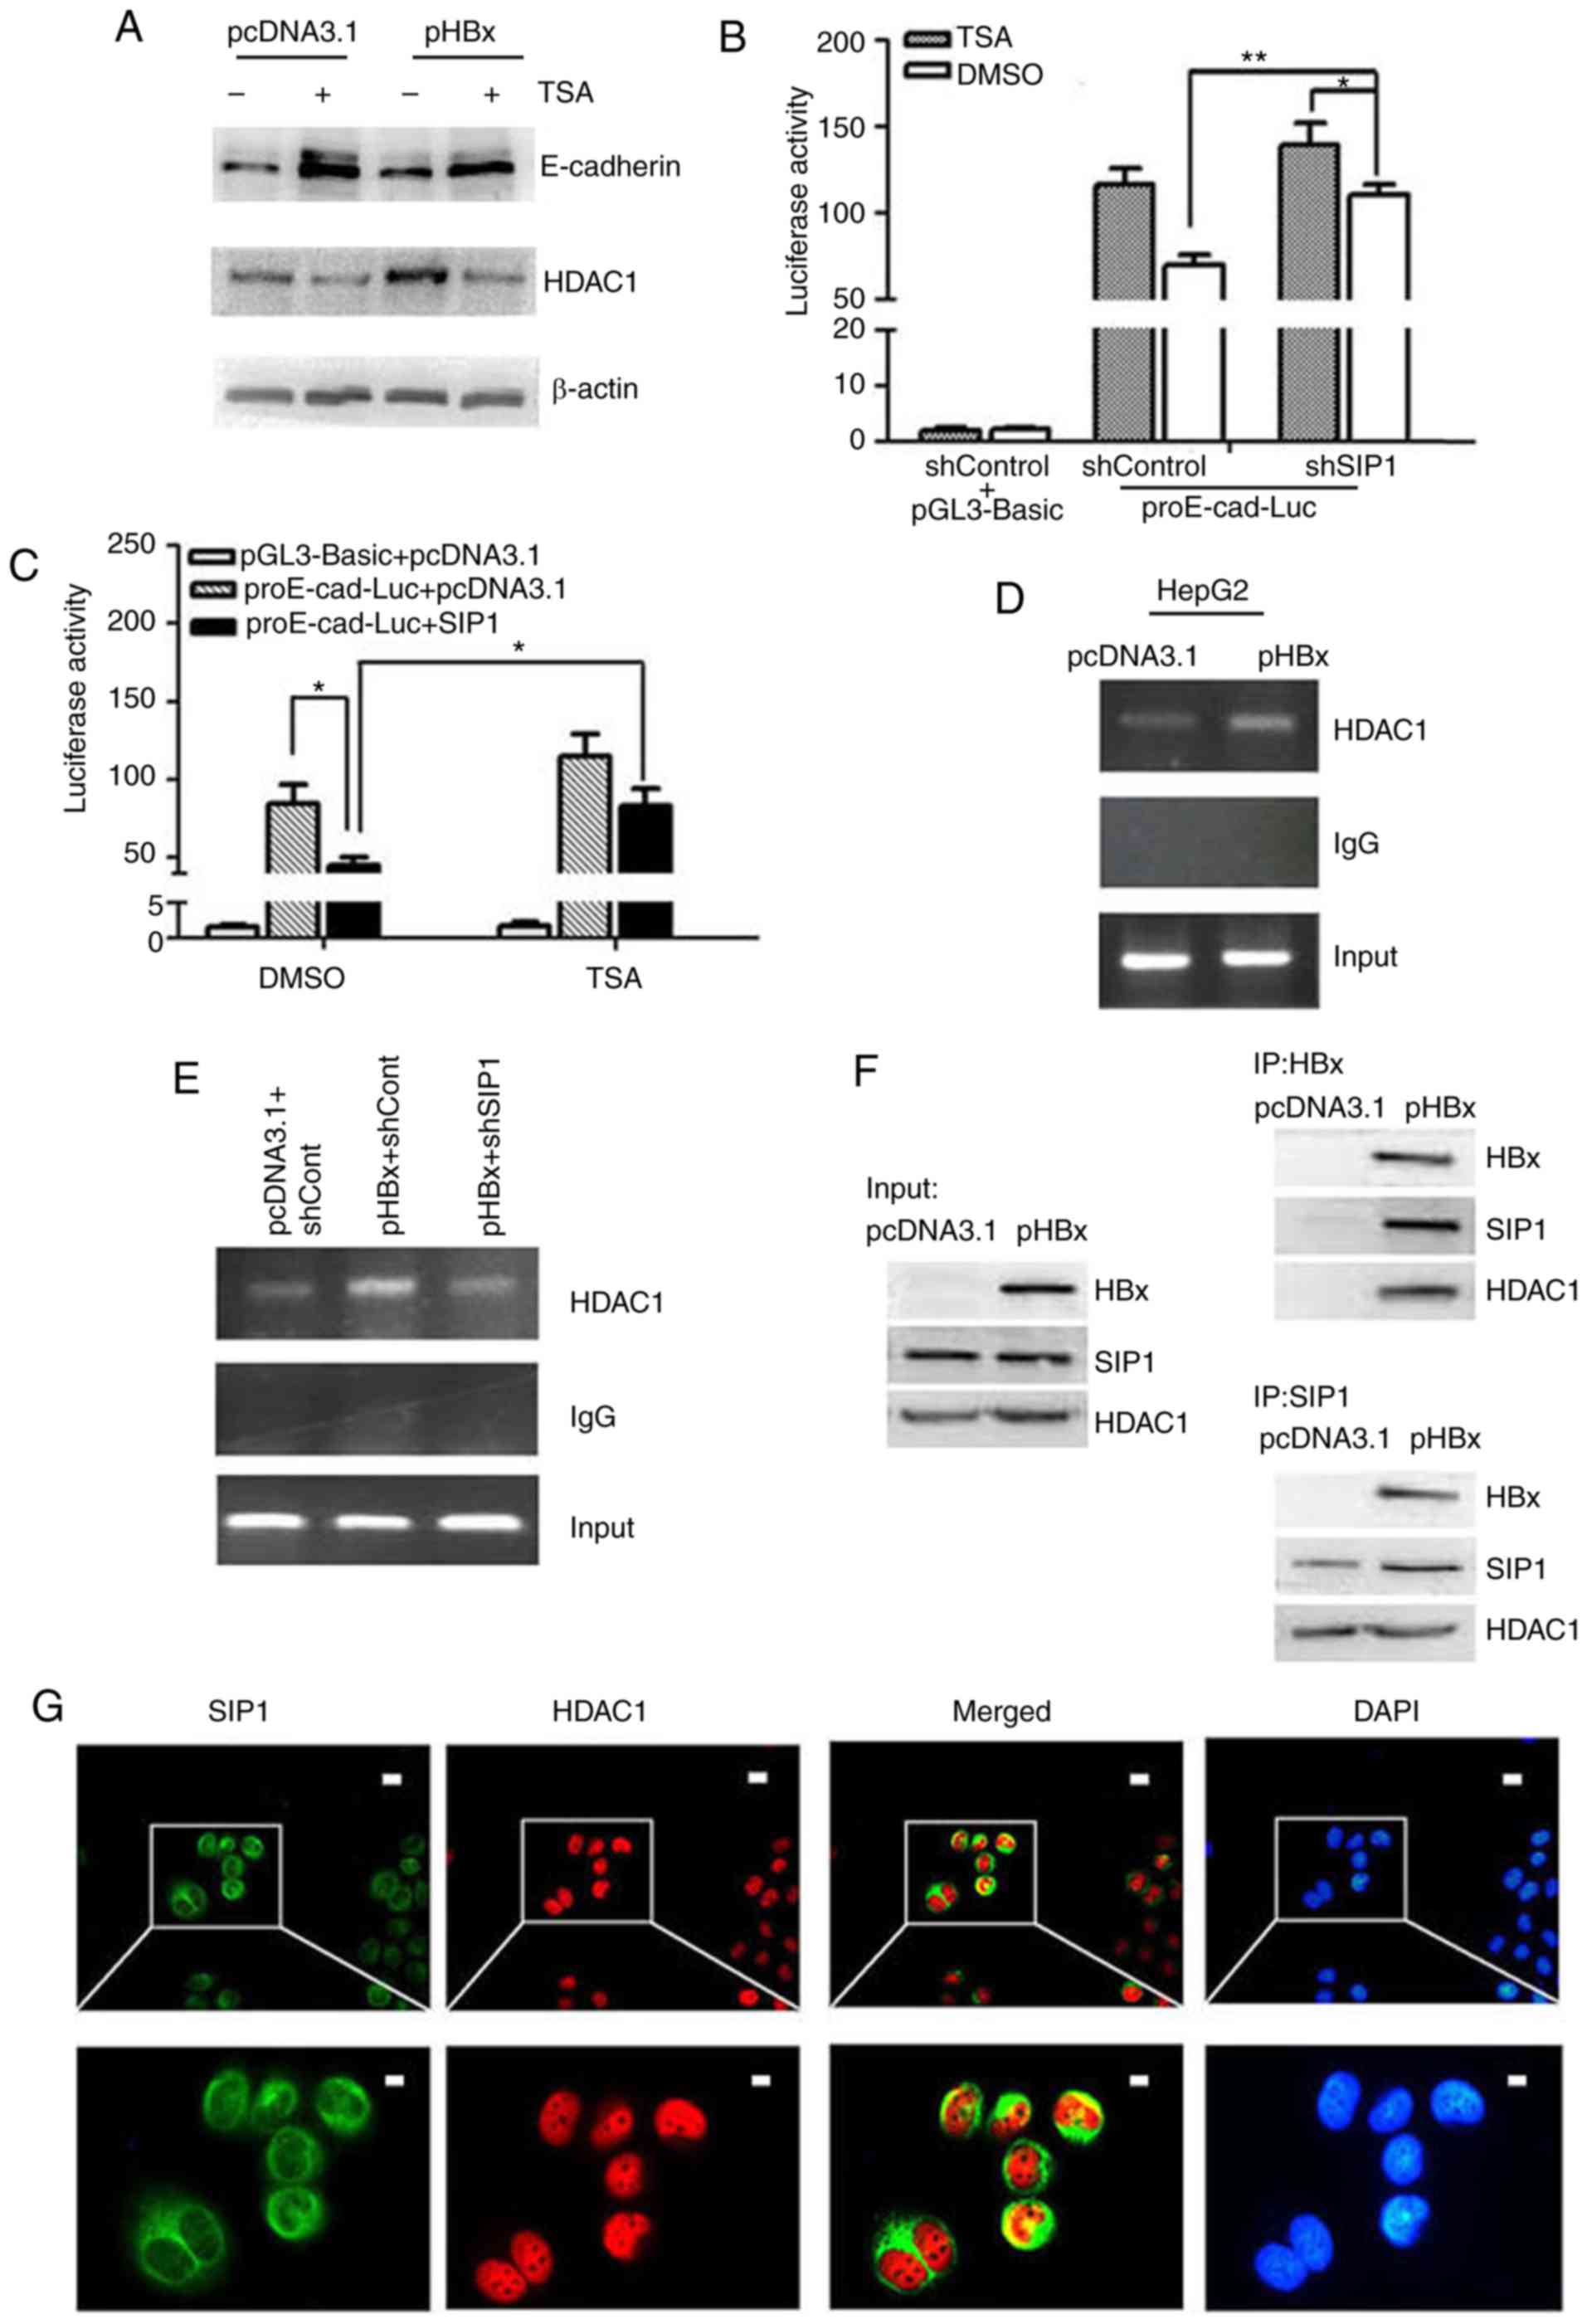 | Figure 4HBx recruits SIP1 and HDAC1 to the
E-cadherin promoter to repress its expression. (A) Western blot
analysis of E-cadherin and HDAC1 in pcDNA3.1 or pHBX transfected
HepG2 cells +/- TSA. E-cadherin promoter activities in TSA-treated
cells following transfection with (B) shSIP1 or (C) SIP1 expression
plasmids. Results are reported as the relative luciferase activity,
vs. activity of pGL3-Basic. *P<0.05,
**P<0.01 (mean ± SD). (D) ChIP of lysates from HepG2
cells transfected with pHBx using anti-HDAC1 antibody. An empty
vector pcDNA3.1 and protein G beads served as external and internal
controls, respectively. (E) ChIP performed using HDAC1 antibody on
the lysates of HepG2 cells treated with shSIP1/shCont and
pcDNA3.1/pHBX. (F) Co-immunoprecipitation of HBx-expressing HepG2
cell-protein extracts with anti-SIP1 or anti-HBx antibodies and
western blot detection of HDAC1, HBx and SIP1, respectively. (G)
Immunofluorescent staining of HepG2-X cells with anti-HDAC1,
anti-SIP1 and DAPI. The merged image showed HDAC1 and SIP1
co-localization in the nucleus. Scale bar=10 µm. SIP1,
Smad-interacting protein 1; HBx, hepatitis B virus X; pHBx,
pcDNA3.1-HBx; sh, short hairpin RNA; Cont, control; HDAC1, histone
deacetylase 1; ChIp, chromatin immunoprecipitation; TSA,
trichostatin A. |
The synergistic effect of SIP1 and HDAC1 on the
activity of the E-cadherin promoter was subsequently analyzed. In
the HepG2-X cells, TSA and shSIP1 enhanced E-cadherin promoter
activity. Additionally, the combined treatment with shSIP1 and TSA
increased E-cadherin promoter activity more than any single
treatment in the HepG2-X cells (Fig.
4B). By contrast, the overexpression of SIP1 resulted in marked
repression of E-cadherin promoter activity, and a small decrease
was observed in the E-cadherin promoter activity levels when TSA
was administered together with the SIP1 plasmid (Fig. 4C). Therefore, HBx likely repressed
E-cadherin promoter activity through SIP1 and HDAC1.
To further understand the role of HDAC1, ChIP
analysis was performed with HDAC1 immunoprecipitates. The results
revealed that HDAC1 bound to the E-cadherin promoter and HBx
enhanced this binding activity (Fig.
4D). Furthermore, HDAC1 binding to the E-cadherin promoter was
inhibited following transfection with shSIP1 (Fig. 4E). To confirm the direct binding
affinity of HBx, SIP1 and HDAC1, a triple Co-IP analysis was
performed. As shown in Fig. 4F,
anti-HBx antibody precipitated SIP1 and HDAC1 at the same time,
showing an interacting effect of HBx to SIP1 and HDAC1. When the
cell lysates were precipitated by anti-SIP1, HBx and HDAC1 proteins
were detected in the HBx-transfected cells. The subcellular
localization of SIP1 and HDAC1 in immunofluorescence assays also
suggested that SIP1 and HDAC1 localized in the same region in the
HepG2-X cells (Fig. 4G).
Knockdown of SIP1 suppresses the
oncogenic activity of HBx in HepG2 cells
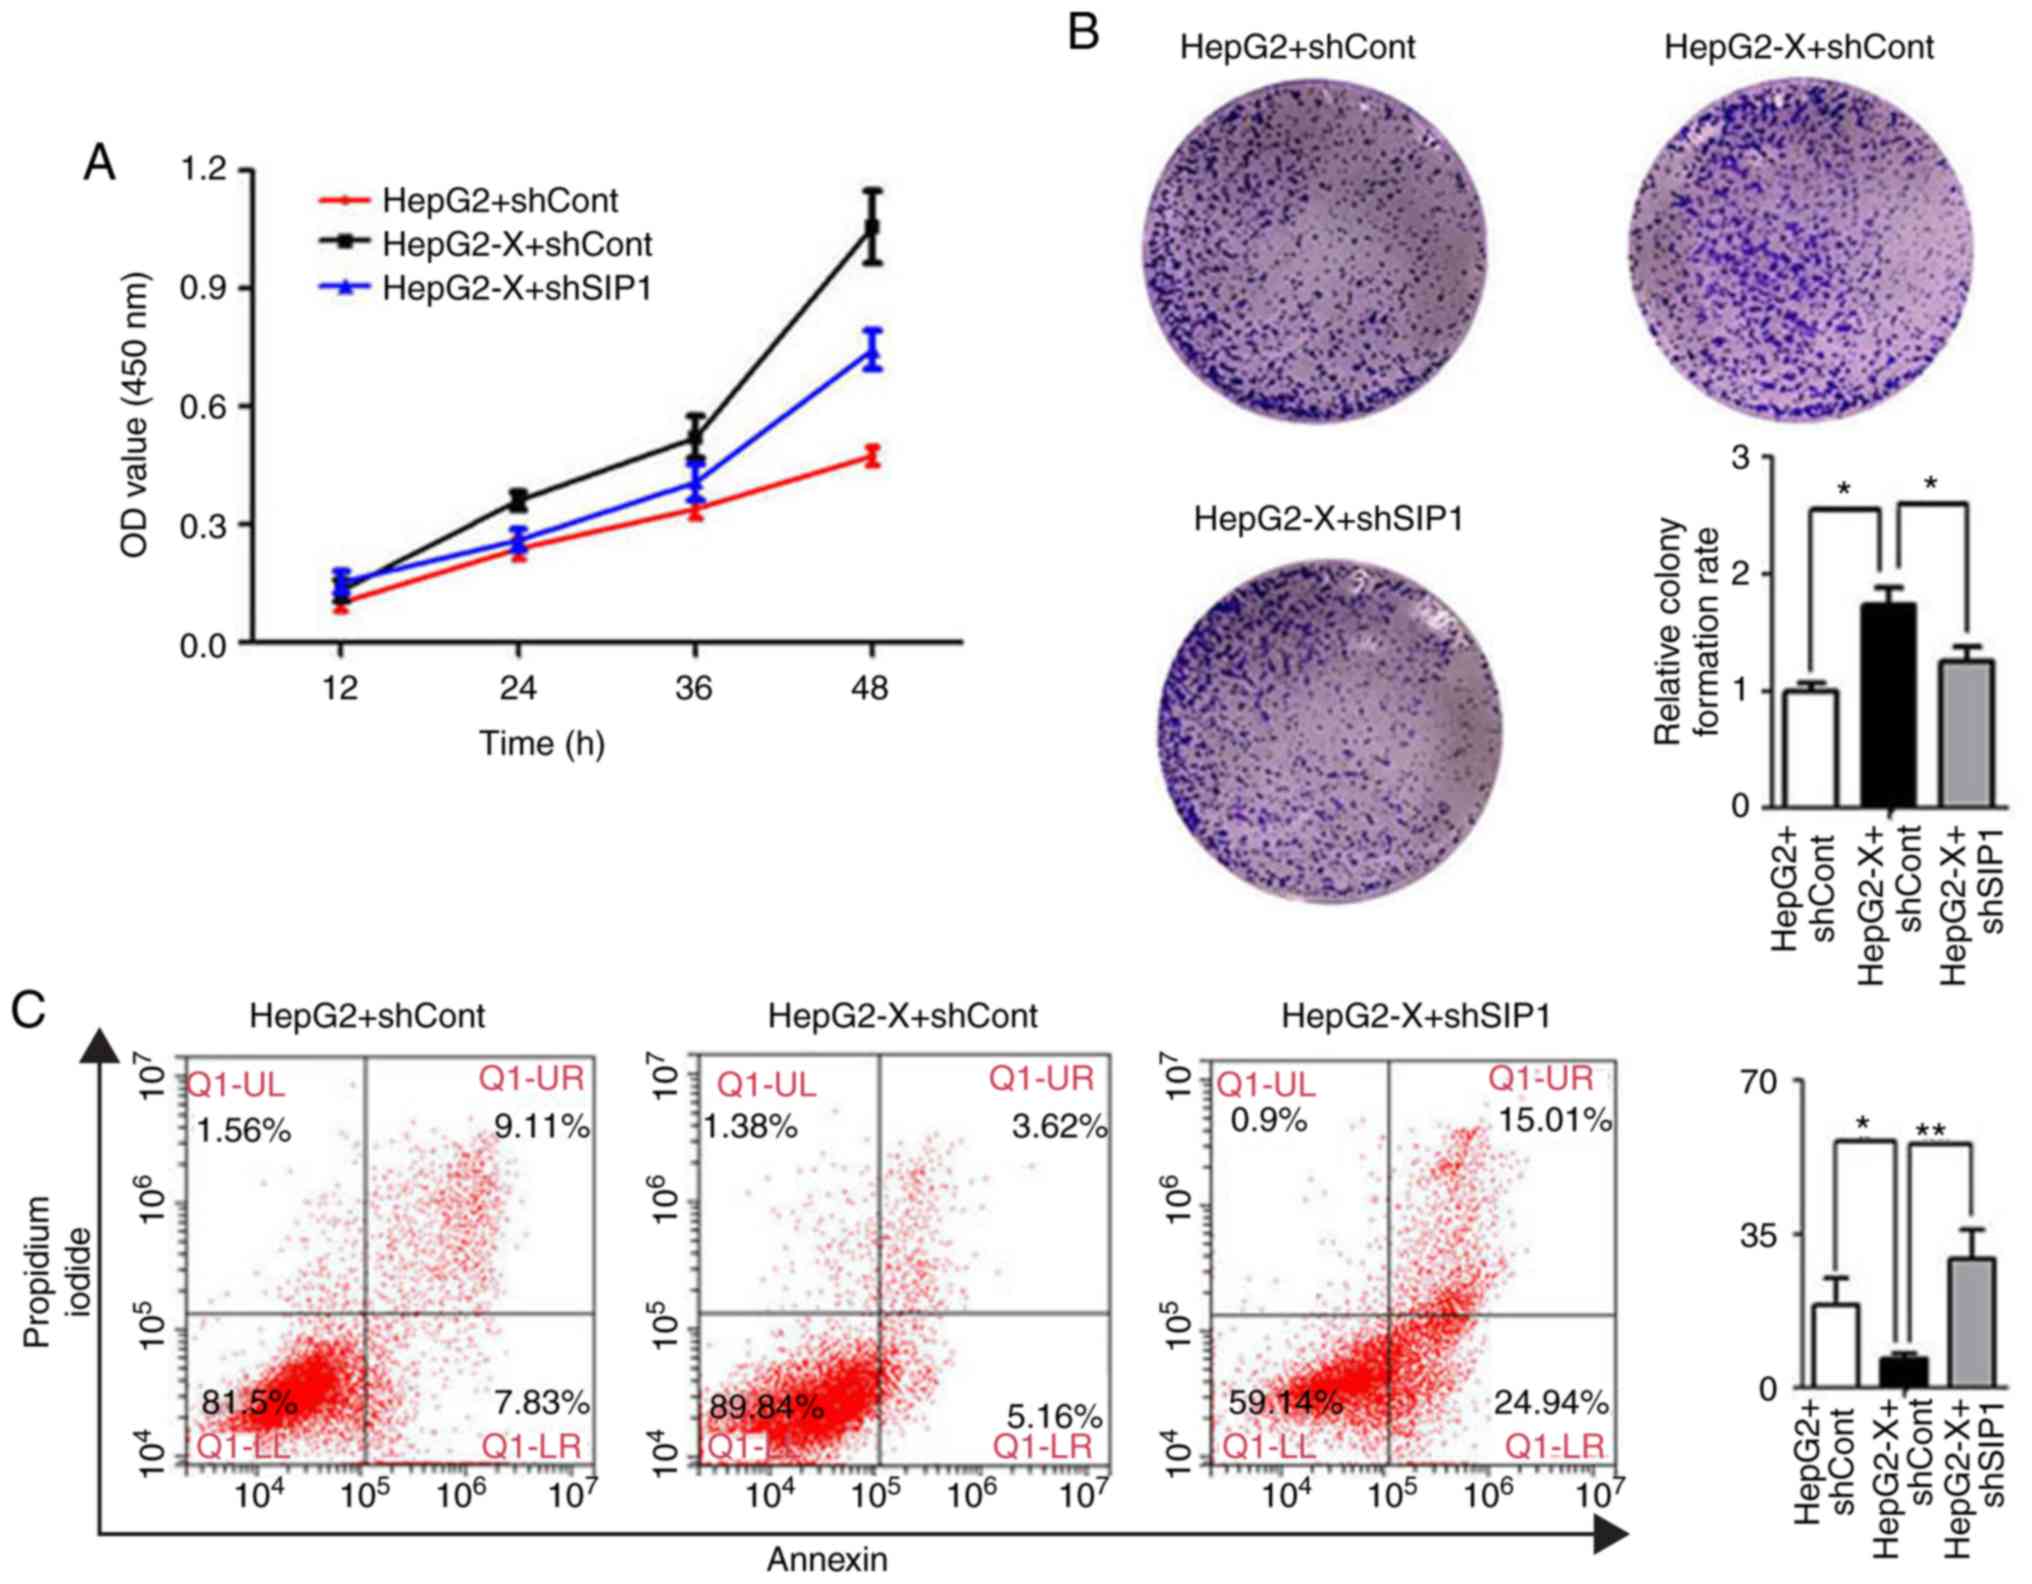
HBx is known to modulate cell growth, cell-cycle
progression and migration. The present study subsequently examined
whether SIP1 is involved in these processes. The CCK-8 assay
indicated that the introduction of HBx significantly increased the
cell growth rate compared with that in the control cells. When SIP1
was knocked down by shRNA, the increased proliferation rate of the
HBx-expressing HepG2 cells almost returned to the original levels
(Fig. 5A). These results suggested
that SIP1 serves a vital role in HBx-regulated cell growth.
Dual staining (Annexin V and PI) of the liver cancer
cells was performed, followed by flow cytometric analysis to
determine the effect of SIP1 and HBx on cell apoptosis. The Annexin
V/PI assays indicated that there was a marked decrease in the
apoptotic rate of the HBx-expressing HepG2 cells compared with that
of the controls (Fig. 5C).
However, the knockdown of SIP1 antagonized the effect of HBx and
reverted the apoptotic rate.
Subsequently, colony formation assays were performed
to further elucidate the effect of HBx and SIP1 on cell
proliferation. As shown in Fig.
5B, HBx significantly enhanced HepG2 cell proliferation,
whereas the knockdown of SIP1 by shRNA in HepG2-X cells resulted in
a reduced proliferation rate. Taken together, these results showed
that HBx is widely engaged in modulating the oncogenic activity of
liver cancer cells in vitro and that SIP1 exerts an
important influence in the process.
SIP1 is involved in HBx-induced
tumorigenesis and liver cancer metastasis in vivo
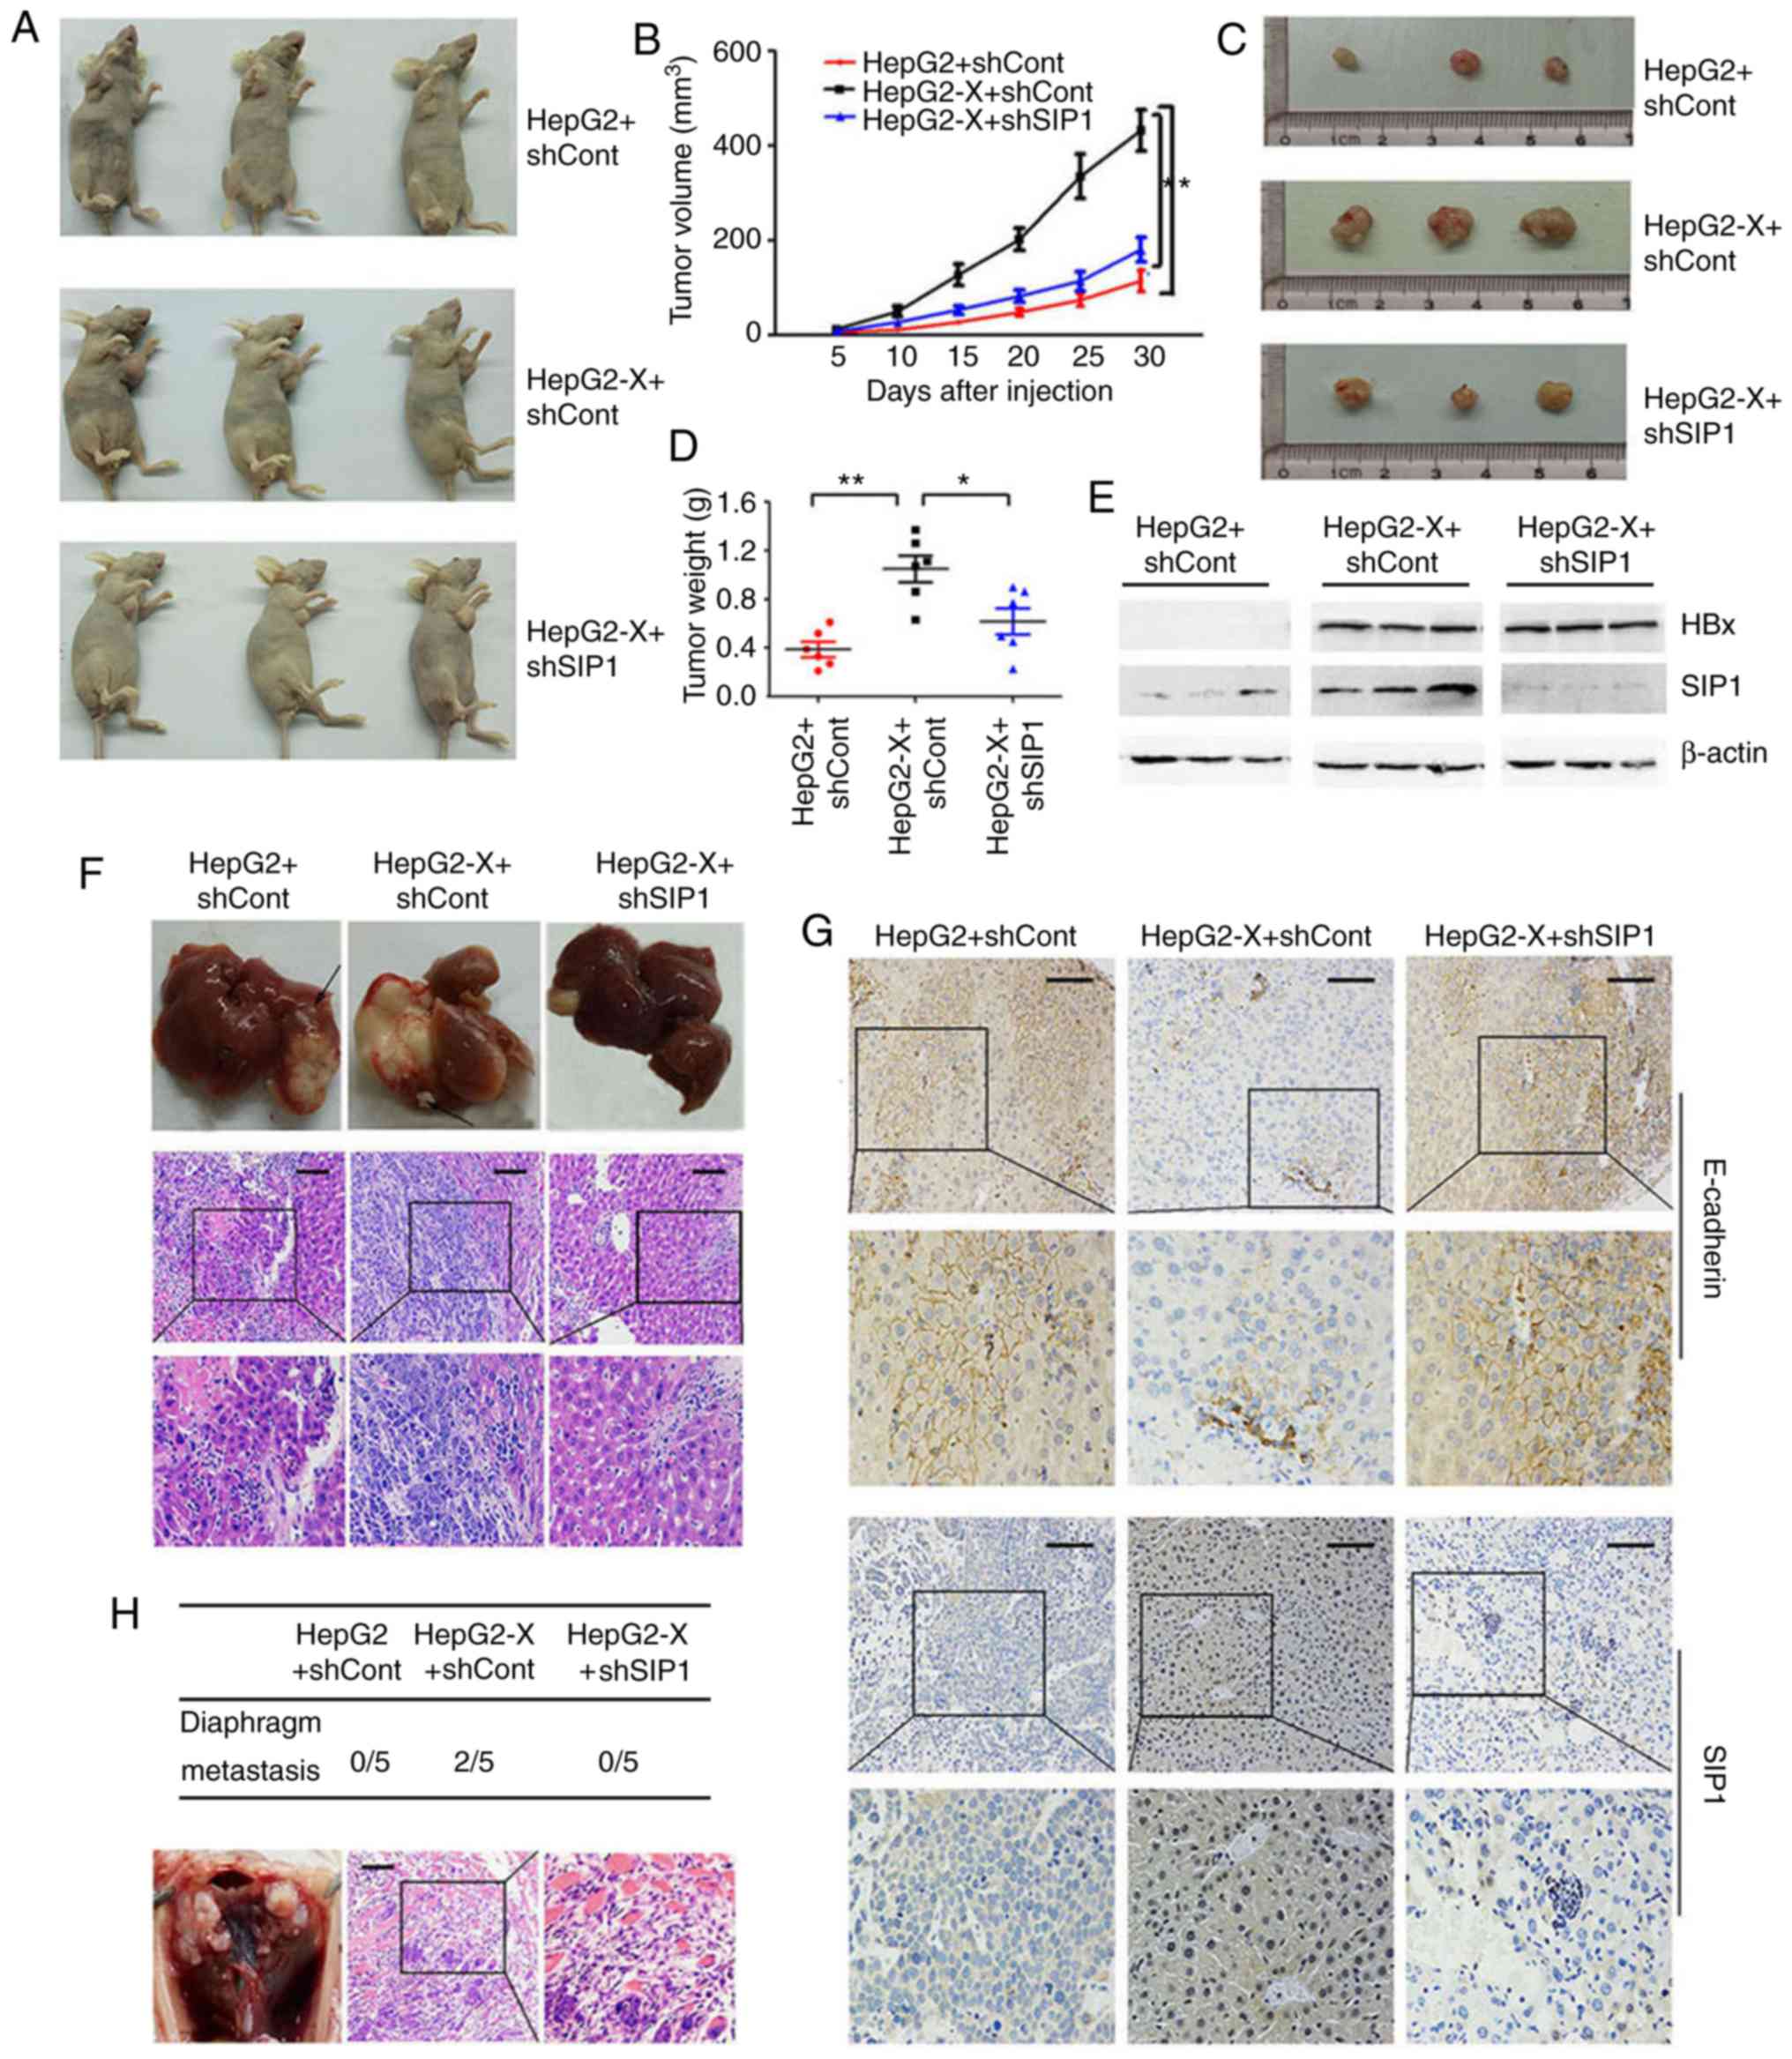
To examine the role of SIP1 in HBx-induced
tumorigenesis and liver cancer aggressiveness, the tumor formation
of liver cancer cells expressing HBx was evaluated in
tumorigenicity assays on athymic nude mice. The nude mice that were
subcutaneously injected with the HepG2-X cells had a larger tumor
volume and increased tumor weight compared with those received the
parental HepG2 control cells (n=6 per group). When the expression
of SIP1 was knocked down by shRNA interference in the HepG2-X
cells, the tumor volume ratio and the tumor weight were reduced
significantly (Fig. 6A-D). The
effect of the knockdown of SIP1 was verified by western blotting
(Fig. 6E).
To further determine the influence of SIP1 on the
metastatic capacity of liver cancer cells caused by HBx in
vivo, a hepatic orthotopic transplantation metastatic animal
model was developed. The mice that were transplanted with the tumor
masses from the HepG2-X cells carrying shCont developed more
expansive liver tumors compared with those transplanted with tumors
derived from the mock-transfected HepG2 cells (Fig. 6F). Visible intrahepatic metastatic
tumors and the HE staining of liver tissue, with the exception of
the orthotopically transplanted portion, indicated wider
intrahepatic metastasis. The knockdown of SIP1 in HBx-expressing
cells led to a significant decrease in liver tumor size and the
scope of intra-hepatic migration (Fig.
6F). Furthermore, tumor metastasis from the transplanted
hepatic tumor to the diaphragm tissue was only detected in the
HepG2-X tumor-transplanted mice. H&E staining of the diaphragm
tissues verified that the metastatic tumor had the same morphology
as the original hepatic tumors (Fig.
6H). Immunohistochemical analysis of the transplanted tumor
confirmed the repressed levels of E-cadherin and increased levels
of SIP1 following HBx introduction (Fig. 6G). Consistent with the in
vitro results, the silencing of SIP1 efficiently restored the
expression of E-cadherin in the tumors.
Discussion
Accumulated evidence supports HBV as an important
cause of liver cancer by modulating different signal transduction
pathways involved in EMT (13-17).
Various transcriptional regulators have been identified as
important EMT mediators, including ZEB1, SIP1, Slug and Twist
(18-20). As one of only two members of the
vertebrate ZFH1 family, SIP1, also known as ZEB2, was initially
found to bind to the MH2 domain of SMAD1. SIP1 was later revealed
to interact with SMAD2, SMAD3 and SMAD5 (21,22)
and to regulate Smad-dependent TGF-β signal transduction pathways.
SIP1 was also reported to be implicated in embryonic development
and cancer progression (23,24).
However, whether SIP1 serves a role in HBV-induced liver cancer has
not been discussed previously.
In the present study, it was found that ectopic HBx
resulted in the increased expression of SIP1 and decreased
expression of E-cadherin, leading to EMT change of the HepG2 cells.
In addition, changes in the EMT protein markers induced by HBx were
reversed by modulation of the expression of SIP1. As a member of
the δEF1 family, SIP1 is characterized by a homeodomain with two
clusters of highly conserved zinc fingers: An N-terminal cluster
consisting of four zinc fingers (NFZ) and a C-terminal cluster
containing three zinc fingers (CFZ) (23). SIP1 occupies promoter elements by
NZF binding to one-spaced CACCT DNA sequences, including E-boxes
(CACCTG), and CZF binding to the other. The binding of SIP1 to the
two conserved E-boxes represses the activity of the E-cadherin
promoter (25). The data obtained
in the present study indicated that HBx suppressed the activity of
the E-cadherin promoter by increasing the expression of SIP1 and
enhancing its ability to efficiently bind to the E-cadherin
promoter in HepG2 cells.
Previous studies have reported that HDAC1 is
involved in the epigenetic modifications of tumor genes and
tumor-suppressing genes in various types of cancer. The expression
of HDAC1 in liver cancer is high (26). HDAC1 was selected as a candidate
molecule for investigation in the present study. An increase of
HDAC1 in HBx-expressing cells was observed, consistent with the
former reports (27,28). Additionally, HDAC1 was found to
form a triple complex with HBx and SIP1, which combined with the
promoter of E-cadherin and repressed its transcriptional activity.
ZEB1 has been reported to form a multi-protein complex with HDAC1
and HDAC2 to regulate the transcription of target genes (29,30).
In the present study, SIP1 was also observed to partially
co-localize with HBx and HDAC1 in subcellular sites. It appears
that HBx recruits SIP1 and facilitates its binding to DNA, together
with HDAC1. The present study focused only on HDAC1. However, other
HDACs may be also involved in the regulation of ZEB2 (SIP1) and the
investigation of other HDAC members is anticipated in the
future.
The reduced expression of E-cadherin interrupts
inter-cellular adhesion and conjunction, which facilitates the
aggressiveness of tumors. HBx has been reported to promote liver
cancer through influencing E-cadherin by several mechanisms, such
as DNA methylation, Wnt, Snail and mSin3A (31-34).
In the present study, SIP1 was identified as an important regulator
in the HBx-induced modification of E-cadherin. The knockdown of
SIP1 abrogated the promoting effect of HBx on cell proliferation,
growth and migration. In subcutaneous transplantation mice and
hepatoma orthotopic implantation mice, HBx promoted tumor growth,
development and metastasis, whereas the sustainable knockdown of
SIP1 efficiently attenuated the HBx-induced promotion of
tumorigenicity and aggressiveness. These data indicate a key role
of SIP1 in the process of HBx-induced tumorigenicity and
metastasis.
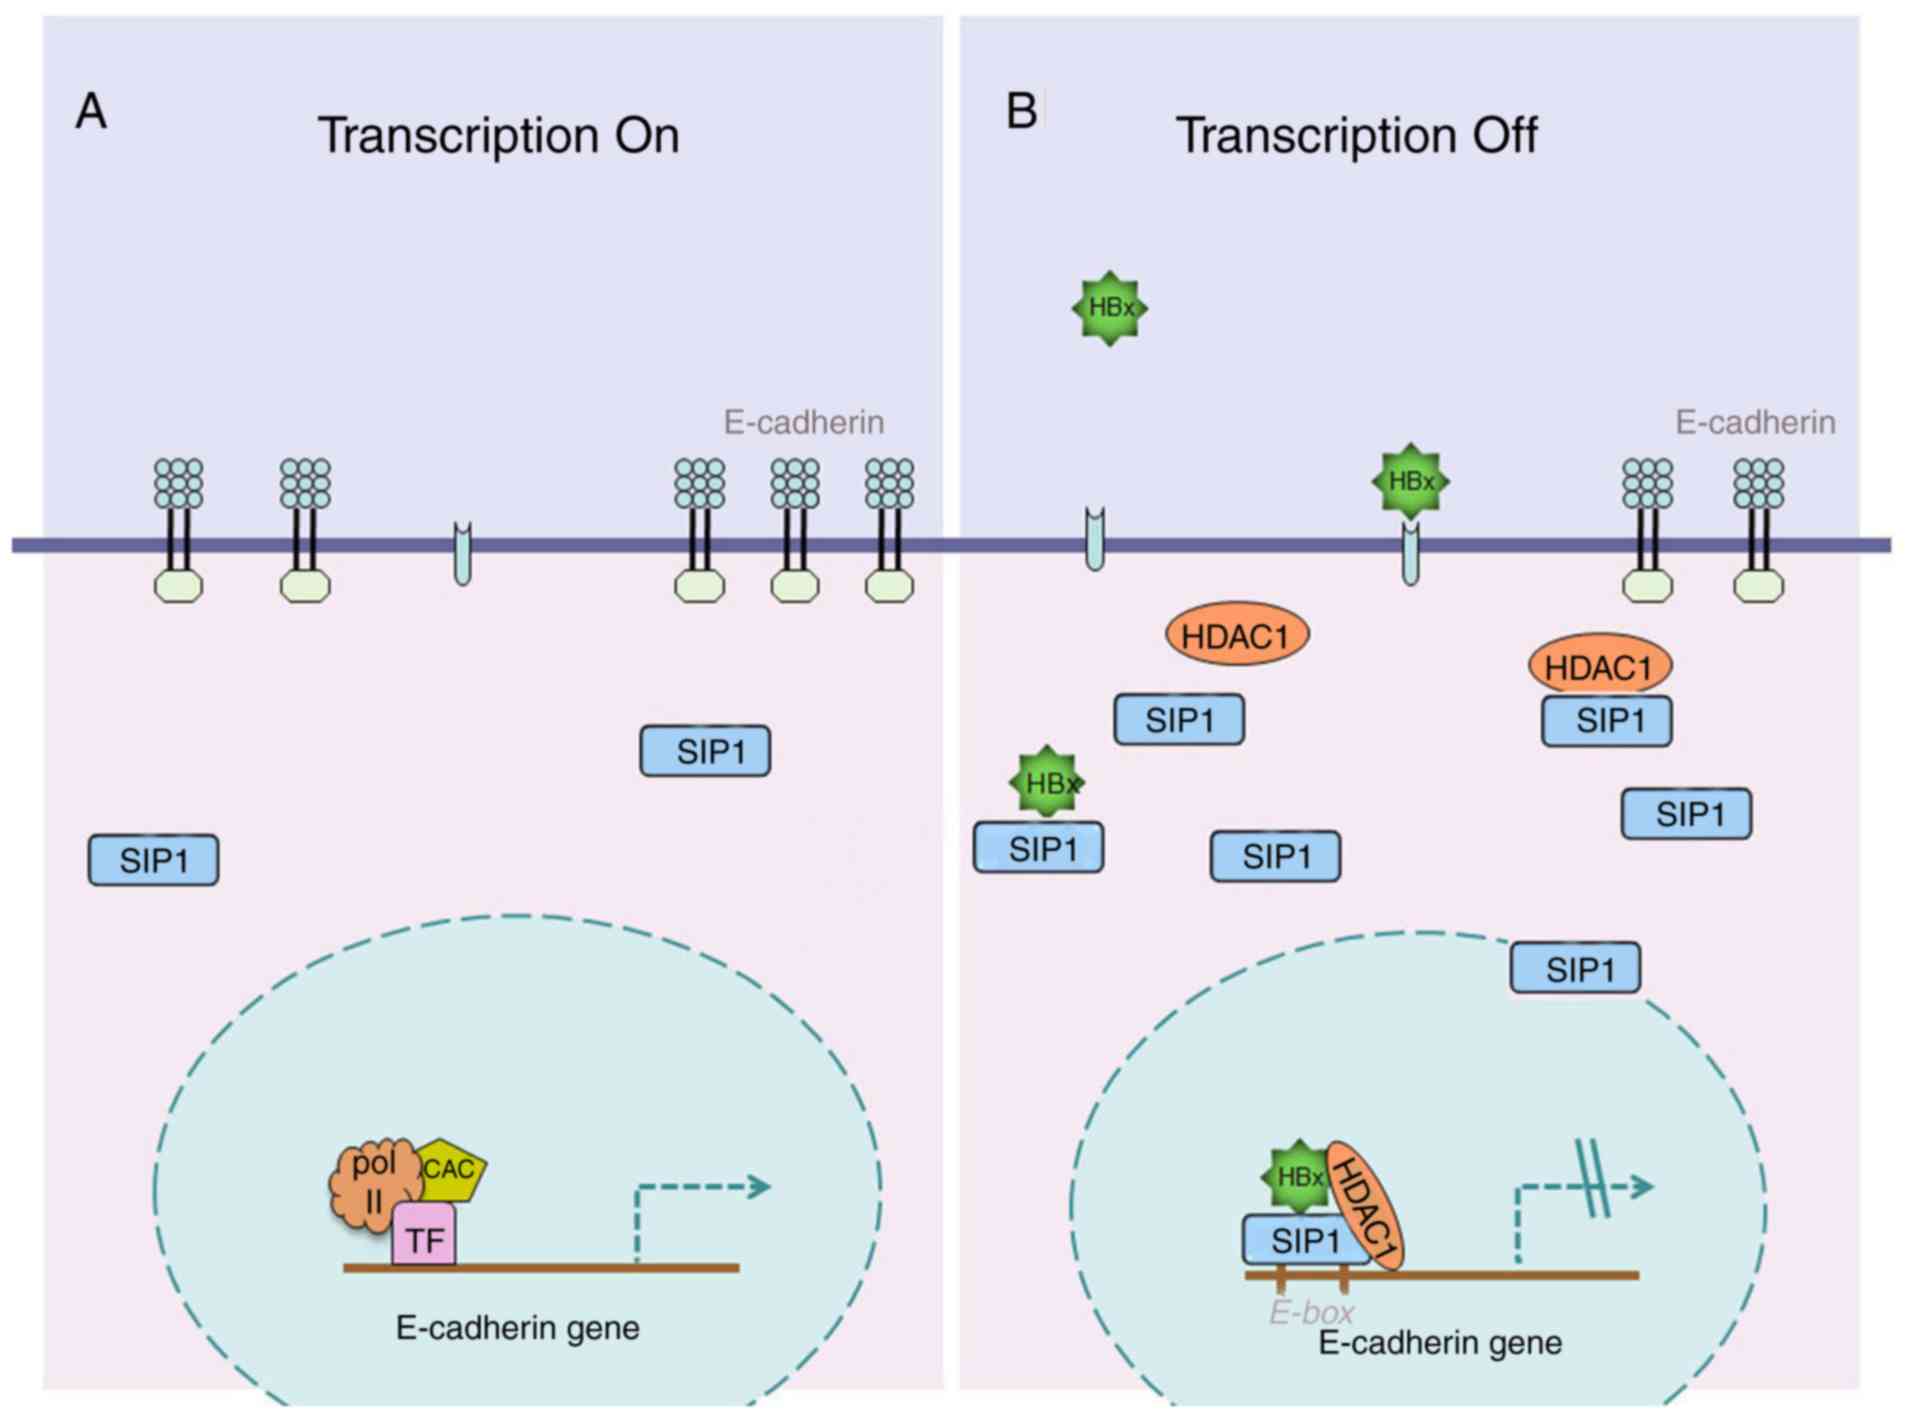
In conclusion, the present study demonstrated that
SIP1 serves a pivotal role in HBx-induced liver cancer growth and
metastasis. The study presents a novel mechanism for HBV-related
liver cancer (Fig. 7) and may help
to examine novel potential therapeutic approaches.
Funding
This study was supported by research grants from the
National Natural Science Foundation of China (grant nos. 81672080
and 81873971) and a grant from Chongqing Health and Family Planning
commission (grant no. 20141005).
Availability of data and materials
The datasets analyzed during the present study are
available from the corresponding author on reasonable request.
Authors' contributions
WXC initiated the project. DDL, PL, LD and BW
designed and monitored the experiments. JJM, QH, JY, QFY and HC
performed the experiments. YYY contributed to writing the
manuscript. JC and WXC read and approved the final manuscript.
Ethics approval and consent to
participate
The animals were provided by the Laboratory Animal
Centre of Chongqing Medical University (Chongqing, China). The use
of the animals complied with the institutional guidelines and was
approved by the Ethics Committee of the Second Hospital Affiliated
to Chongqing Medical University.
Competing interests
The authors declare that they have no competing
interests.
Acknowledgments
The authors thank Professor Janet E. Mertz (McArdle
Laboratory for Cancer Research, University of Wisconsin-Madison
School of Medicine and Public Health) for providing the
pcDNA4hismaxC-SIP1 plasmids.
References
|
1
|
Zhang XD, Wang Y and Ye LH: Hepatitis B
virus X protein accelerates the development of hepatoma. Cancer
Biol Med. 11:182–190. 2014.PubMed/NCBI
|
|
2
|
Buendia MA and Neuveut C: Hepatocellular
carcinoma. Cold Spring Harb Perspect Med. 5:pp. a0214442015,
View Article : Google Scholar : PubMed/NCBI
|
|
3
|
Park NH, Song IH and Chung YH: Molecular
pathogenesis of Hepatitis-B-virus-associated hepatocellular
carcinoma. Gut Liver. 1:101–117. 2007. View Article : Google Scholar : PubMed/NCBI
|
|
4
|
Seeger C and Mason WS: Hepatitis B virus
biology. Microbiol Mol Biol Rev. 64:51–68. 2000. View Article : Google Scholar : PubMed/NCBI
|
|
5
|
Minor MM and Slagle BL: Hepatitis B virus
HBx protein interactions with the ubiquitin proteasome system.
Viruses. 6:4683–4702. 2014. View
Article : Google Scholar : PubMed/NCBI
|
|
6
|
Tang H, Oishi N, Kaneko S and Murakami S:
Molecular functions and biological roles of hepatitis B virus x
protein. Cancer Sci. 97:977–983. 2006. View Article : Google Scholar : PubMed/NCBI
|
|
7
|
Ali A, Abdel-Hafiz H, Suhail M, Al-Mars A,
Zakaria MK, Fatima K, Ahmad S, Azhar E, Chaudhary A and Qadri I:
Hepatitis B virus, HBx mutants and their role in hepatocellular
carcinoma. World J Gastroenterol. 20:10238–10248. 2014. View Article : Google Scholar : PubMed/NCBI
|
|
8
|
He Q, Li W, Ren J, Huang Y, Huang Y, Hu Q,
Chen J and Chen W: ZEB2 inhibits HBV transcription and replication
by targeting its core promoter. Oncotarget. 7:16003–16011.
2016.PubMed/NCBI
|
|
9
|
Livak KJ and Schmittgen TD: Analysis of
relative gene expression data using real-time quantitative PCR and
the 2(-Delta Delta C(T)) method. Methods. 25:402–408. 2001.
View Article : Google Scholar
|
|
10
|
Comijn J, Berx G, Vermassen P, Verschueren
K, van Grunsven L, Bruyneel E, Mareel M, Huylebroeck D and van Roy
F: The two-handed E box binding zinc finger protein SIP1
downregulates E-cadherin and induces invasion. Mol Cell.
7:1267–1278. 2001. View Article : Google Scholar : PubMed/NCBI
|
|
11
|
Behrens J, Löwrick O, Klein-Hitpass L and
Birchmeier W: The E-cadherin promoter: Functional analysis of a
G.C-rich region and an epithelial cell-specific palindromic
regulatory element. Proc Natl Acad Sci USA. 88:11495–11499. 1991.
View Article : Google Scholar : PubMed/NCBI
|
|
12
|
Giroldi LA, Bringuier PP, de Weijert M,
Jansen C, van Bokhoven A and Schalken JA: Role of E boxes in the
repression of E-cadherin expression. Biochem Biophys Res Commun.
241:453–458. 1997. View Article : Google Scholar
|
|
13
|
Martin-Lluesma S, Schaeffer C, Robert EI,
van Breugel PC, Leupin O, Hantz O and Strubin M: Hepatitis B virus
X protein affects S phase progression leading to chromosome
segregation defects by binding to damaged DNA binding protein 1.
Hepatology. 48:1467–1476. 2008. View Article : Google Scholar : PubMed/NCBI
|
|
14
|
Arbuthnot P, Capovilla A and Kew M:
Putative role of hepatitis B virus X protein in
hepatocarcinogenesis: Effects on apoptosis, DNA repair,
mitogen-activated protein kinase and JAK/STAT pathways. J
Gastroenterol Hepatol. 15:357–368. 2000. View Article : Google Scholar : PubMed/NCBI
|
|
15
|
Kew MC: Hepatitis B virus x protein in the
pathogenesis of hepatitis B virus-induced hepatocellular carcinoma.
J Gastroenterol Hepatol. 26(Suppl 1): pp. S144–S152. 2011,
View Article : Google Scholar
|
|
16
|
Shin Kim S, Yeom S, Kwak J, Ahn HJ and Lib
Jang K: Hepatitis B virus X protein induces epithelial-mesenchymal
transition by repressing E-cadherin expression via upregulation of
E12/E47. J Gen Virol. 97:134–143. 2016. View Article : Google Scholar
|
|
17
|
Chen X, Bode AM, Dong Z and Cao Y: The
epithelial-mesenchymal transition (EMT) is regulated by oncoviruses
in cancer. FASEB J. 30:3001–3010. 2016. View Article : Google Scholar : PubMed/NCBI
|
|
18
|
Yang J, Mani SA, Donaher JL, Ramaswamy S,
Itzykson RA, Come C, Savagner P, Gitelman I, Richardson A and
Weinberg RA: Twist, a master regulator of morphogenesis, plays an
essential role in tumor metastasis. Cell. 117:927–939. 2004.
View Article : Google Scholar : PubMed/NCBI
|
|
19
|
Cobaleda C, Pérez-Caro M, Vicente-Dueñas C
and Sánchez-García I: Function of the zinc-finger transcription
factor SNAI2 in cancer and development. Annu Rev Genet. 41:41–61.
2007. View Article : Google Scholar : PubMed/NCBI
|
|
20
|
Thiery JP, Acloque H, Huang RY and Nieto
MA: Epithelial-mesenchymal transitions in development and disease.
Cell. 139:871–890. 2009. View Article : Google Scholar : PubMed/NCBI
|
|
21
|
van Grunsven LA, Michiels C, Van de Putte
T, Nelles L, Wuytens G, Verschueren K and Huylebroeck D:
Interaction between Smad-interacting protein-1 and the corepressor
C-terminal binding protein is dispensable for transcriptional
repression of E-cadherin. J Biol Chem. 278:26135–26145. 2003.
View Article : Google Scholar : PubMed/NCBI
|
|
22
|
Verschueren K, Remacle JE, Collart C,
Kraft H, Baker BS, Tylzanowski P, Nelles L, Wuytens G, Su MT,
Bodmer R, et al: SIP1, a novel zinc finger/homeodomain repressor,
interacts with Smad proteins and binds to 5′-CACCT sequences in
candidate target genes. J Biol Chem. 274:20489–20498. 1999.
View Article : Google Scholar : PubMed/NCBI
|
|
23
|
Remacle JE, Kraft H, Lerchner W, Wuytens
G, Collart C, Verschueren K, Smith JC and Huylebroeck D: New mode
of DNA binding of multi-zinc finger transcription factors: deltaEF1
family members bind with two hands to two target sites. EMBO J.
18:5073–5084. 1999. View Article : Google Scholar : PubMed/NCBI
|
|
24
|
Lerchner W, Latinkic BV, Remacle JE,
Huylebroeck D and Smith JC: Region-specific activation of the
Xenopus brachyury promoter involves active repression in ectoderm
and endoderm: A study using transgenic frog embryos. Development.
127:2729–2739. 2000.PubMed/NCBI
|
|
25
|
van Grunsven LA, Schellens A, Huylebroeck
D and Verschueren K: SIP1 (Smad interacting protein 1) and deltaEF1
(delta-crystallin enhancer binding factor) are structurally similar
transcriptional repressors. J Bone Joint Surg Am. 83-A(Suppl 1):
pp. S40–S47. 2001
|
|
26
|
Ropero S and Esteller M: The role of
histone deacetylases (HDACs) in human cancer. Mol Oncol. 1:19–25.
2007. View Article : Google Scholar : PubMed/NCBI
|
|
27
|
Yoo YG, Na TY, Seo HW, Seong JK, Park CK,
Shin YK and Lee MO: Hepatitis B virus X protein induces the
expression of MTA1 and HDAC1, which enhances hypoxia signaling in
hepa-tocellular carcinoma cells. Oncogene. 27:3405–3413. 2008.
View Article : Google Scholar : PubMed/NCBI
|
|
28
|
Shon JK, Shon BH, Park IY, Lee SU, Fa L,
Chang KY, Shin JH and Lee YI: Hepatitis B virus-X protein recruits
histone deacety-lase 1 to repress insulin-like growth factor
binding protein 3 transcription. Virus Res. 139:14–21. 2009.
View Article : Google Scholar
|
|
29
|
Aghdassi A, Sendler M, Guenther A, Mayerle
J, Behn CO, Heidecke CD, Friess H, Büchler M, Evert M, Lerch MM and
Weiss FU: Recruitment of histone deacetylases HDAC1 and HDAC2 by
the transcriptional repressor ZEB1 downregulates E-cadherin
expression in pancreatic cancer. Gut. 61:439–448. 2012. View Article : Google Scholar
|
|
30
|
Schneider G, Krämer OH and Saur D: A
ZEB1-HDAC pathway enters the epithelial to mesenchymal transition
world in pancreatic cancer. Gut. 61:329–330. 2012. View Article : Google Scholar
|
|
31
|
Srisuttee R, Koh SS, Kim SJ, Malilas W,
Boonying W, Cho IR, Jhun BH, Ito M, Horio Y, Seto E, et al:
Hepatitis B virus X (HBX) protein upregulates β-catenin in a human
hepatic cell line by sequestering SIRT1 deacetylase. Oncol Rep.
28:276–282. 2012.PubMed/NCBI
|
|
32
|
Shen L, Zhang X, Hu D, Feng T, Li H, Lu Y
and Huang J: Hepatitis B virus X (HBx) play an anti-apoptosis role
in hepatic progenitor cells by activating Wnt/β-catenin pathway.
Mol Cell Biochem. 383:213–222. 2013. View Article : Google Scholar : PubMed/NCBI
|
|
33
|
Xie Q, Chen L, Shan X, Shan X, Tang J,
Zhou F, Chen Q, Quan H, Nie D, Zhang W, et al: Epigenetic silencing
of SFRP1 and SFRP5 by hepatitis B virus X protein enhances hepatoma
cell tumorigenicity through Wnt signaling pathway. Int J Cancer.
135:635–646. 2014. View Article : Google Scholar : PubMed/NCBI
|
|
34
|
Arzumanyan A, Friedman T, Kotei E, Ng IO,
Lian Z and Feitelson MA: Epigenetic repression of E-cadherin
expression by hepatitis B virus x antigen in liver cancer.
Oncogene. 31:563–572. 2012. View Article : Google Scholar
|