Introduction
Angiogenesis is crucial for the growth and
metastasis, and therefore the prognosis, of malignant solid tumours
(1-4). Angiogenesis is necessary for the
malignant progression of solid tumours after penetrating the
epithelial basement membrane (1-4).
Generally, there is a positive correlation between the rate and
extent of angiogenesis and the unfavourable prognosis of tumours
(1-4). Newly formed blood vessels in tumours
are characterized by unique structures, such as incomplete vessel
walls that lack vascular smooth muscles and are composed of only
porous endothelial cells and a flaky basement membrane (1-4). A
growing number of studies have noted that the structural features
of new blood vessels provide favourable conditions for the distant
metastasis of malignant tumour cells (1-5).
Therefore, the number of new blood vessels in malignant solid
tumours is an important independent prognostic factor (1-4,6).
Anisomycin [also known as 3,4-Pyrrolidinediol,2-
[(4-methoxyphenyl)methyl]-,3-acetate,(2R,3S,4S)] is the first
confirmed anti-protozoal antibiotic extracted from Streptomyces
griseolus (7,8). Anisomycin inhibits the formation of
peptide bonds in most cells by binding to the 60S ribosomal subunit
and, thereby, inhibiting protein synthesis (7,8).
Previous studies have shown that anisomycin can promote the
production of amyloid β (Aβ) 1-42 causing neurotoxicity, as well as
inhibit the proliferation of certain cancer cells. Yu et al
(9) found that anisomycin
inhibited the proliferation of Jurkat T cells by promoting the
expression of p53, p21 and p27, thus stopping the cells from
entering the S and G2/M phases. Seo et al (10) reported that anisomycin could induce
apoptosis in renal tumour cells by downregulating Bcl-2, c-FLIPL
and Mcl-1. Liu et al (11)
also demonstrated that anisomycin induced the apoptosis of cancer
cells in glucocorticoid-resistant acute lymphoblastic leukaemia by
facilitating the phosphorylation of the mitogen-activated protein
kinase p38 and the activation of JNK. Therefore, anisomycin may be
a promising chemotherapeutic drug.
Long non-coding RNAs (lncRNAs) are transcripts of
>200 nt in length that are produced by RNA polymerase II and
matured by modifications, including alternative splicing, 5′-end
capping, and 3′-end polyadenylation (7,12-15).
LncRNA lacks the complete open reading frame required for
translation, does not encode proteins and has a poorly conserved
primary structure (7,12-15).
An increasing number of studies have found that lncRNA extensively
regulates eukaryotic cell function and the development of diseases
(7,12-15).
LncRNA can regulate the activity of genes at the transcriptional
level, but can also regulate the translation and silencing of mRNAs
at the post-transcriptional level (7,12-15).
At the transcriptional level, lncRNA modulates gene transcription
by mimicking DNA elements, competitively binding transcription
factors or forming scaffold structures, and recruiting multiple
trans-acting factors (7,12-15).
At the post-transcriptional level, lncRNA acts as a 'molecular
sponge' that binds to a target microRNA (miRNA) and blocks its
activity, abolishing its RNA interfering effect on the target gene
(7,12-15).
Multiple studies have indicated that lncRNAs regulate tumour cell
proliferation, metastasis and angiogenesis at multiple levels
(16-20).
Based on the evidence mentioned above, the present
study explored the effects of anisomycin on
CD44+/CD133+ human ovarian cancer stem cells
(HuOCSCs), and specifically on their in vitro and in
vivo proliferation, invasion, angiogen-esis and in vivo
tumorigenicity. The results demonstrated that anisomycin could
significantly inhibit the growth and angiogenesis of ovarian cancer
cells in vitro and in vivo. Next, the present study
examined the epigenetic mechanism of the anisomycin-mediated
inhibition of angiogenesis in ovarian cancer cells. Anisomycin was
demonstrated to attenuate the molecular sponge effect of
lncRNA-Meg3, releasing miR-421, which then silenced the expression
of the target gene platelet derived growth factor receptor α
(PDGFRA), ultimately inhibiting angiogenesis.
Materials and methods
Isolation and culture of primary
HuOCSCs
The experiment was performed according to previously
described methods (21). Briefly,
surgically isolated tissues from 4 ovarian cancer patients
(Table I) were minced, digested
with 0.25% trypsin (Gibco; Thermo Fisher Scientific, Inc.), and
centrifuged at 4°C, 450 × g for 5 min. The cell precipitates were
collected and incubated with mouse anti-human CD133-FITC antibodies
(1:100; cat. no. 11-1339-42; eBioscience; Thermo Fisher Scientific,
Inc.) and rabbit anti-human CD44-APC antibodies (1:100; cat. no.
17-0441-82; eBioscience; Thermo Fisher Scientific, Inc.) at 4°C for
30 min. Next, CD44+/CD133+ OCSCs were sorted
from the sample by fluorescence-activated cell sorting. After
sorting, single cells were plated at 1,000 cells/ml in DMEM/F12
(Gibco; Thermo Fisher Scientific, Inc.), supplemented with 10 ng/ml
basic fibroblast growth factor, 10 ng/ml epidermal growth factor, 5
µg/ml insulin and 0.5% BSA (all from Sigma-Aldrich; Merck
KGaA, and cultured at 37°C with 5% CO2. Cells of the
fourth passage were used to perform subsequent experiments. The
study involving human tissues was approved by the Ethics Review
Committee of Shanghai Geriatric Institute of Chinese Medicine of
Research in Human Production, authorized by Shanghai Municipal
Government; written informed consent was provided by all patients,
in accordance with The Declaration of Helsinki.
 | Table ICharacteristics of the patient
cohort. |
Table I
Characteristics of the patient
cohort.
| Characteristic | Patients (n=4) |
|---|
| Age median
(range) | (39-62) |
| ≤40 | 1 |
| 40-60 | 2 |
| ≥60 | 1 |
| Surgical
staging | |
| I a, b, c | 1 |
| II a, b, c | 2 |
| III a, b, c | 1 |
| IV | - |
| Histopathology | |
| Serous | 4 |
| Endometrioid | - |
| Mucinous | - |
| Clear cells | - |
| Others (mixed
epithelial, undifferentiated) | - |
| Tumor grade | |
| 1 | 1 |
| 2 | 2 |
| 3 or clear
cell | 1 |
| Unknown | - |
| Treatments | |
| Primary
surgery | 4 |
| Radical
surgery | - |
| Secondary
surgery | - |
| Platinum-based
chemotherapy | 1 |
| Radiotherapy | - |
Treatment of
CD44+/CD133+ HuOCSCs with anisomycin
Anisomycin (purity >98%) and dimethyl sulfoxide
(DMSO) were purchased from Sigma-Aldrich (Merck KGaA). According to
the IC50 value determined by MTT assay, anisomycin was
applied at a final concentration of 31.8 mM in all the assays. As a
control, the same volume of DMSO was applied to the cells.
Histopathology by haematoxylin and eosin
(H&E) staining
Briefly, all fresh tissues were soaked in 4%
paraformaldehyde (Sigma-Aldrich; Merck KGaA) at room temperature
for 30 min. The tissues were dehydrated using an ethanol gradient
and embedded in paraffin. Then, the tissues were sectioned
(thickness, 6 µm) and soaked in xylene for dewaxing. The
tissue sections were stained with haematoxylin and eosin
(Sigma-Aldrich; Merck KGaA) and were finally cleared with xylene
and mounted with neutral resin (Sigma-Aldrich; Merck KGaA). Five
random fields of each tissue section from a total 4 slides were
observed (magnification, ×200) with a light microscope (Olympus
CX23; Olympus Corporation).
Immunohistochemistry (IHC) analysis
Briefly, all fresh tissues were soaked in 4%
paraformaldehyde (Sigma-Aldrich; Merck KGaA) at room temperature
for 30 min. The tissues were dehydrated using an ethanol gradient
and embedded in paraffin. Then, the tissues were sectioned
(thickness, 6 µm) and soaked in xylene for dewaxing. Next,
sections were rinsed with 3% phosphate buffer (Sigma-Aldrich; Merck
KGaA). Mouse anti-human CD34 and CD31 primary antibodies (1:200;
cat nos. 3569 and 3528, respectively; Cell Signaling Technology,
Inc.) were added for 60 min at room temperature, and then
anti-mouse horseradish peroxidase-conjugated secondary antibody
(1:200; cat no. 7076; Cell Signaling Technology, Inc.) was added
for 60 min at room temperature. Finally, ABC chromo-genic reagent
(VECTASTAIN Elite ABC kit; cat no. PK-6100; Vector Laboratories,
Inc.) was used for the color reaction. PBS (pH 7.4) was used as a
negative control in the place of the primary antibody. Five random
fields of each tissue section were observed (magnification, ×200)
and analyzed using IPP software (Image-Pro Plus Version 6.0; Media
Cybernetics Co. Ltd.). ImageJ 1.42q (National Institutes of Health)
was used to analyze the area of the positive cells on IHC
staining.
miR-421 overexpression by RNA mimics
transfection
miR-421 and miR-421 mutant (miR-mut; a miRNA mimics
negative control) oligonucleotide RNAs were purchased from Shanghai
GenePharma Co., Ltd. HuOCSCs were transfected with 0.2 mg miR-421
mimics or miR-mut using Lipofectamine 3000 (Invitrogen; Thermo
Fisher Scientific, Inc.), according to the manufacturer's protocol.
The cells were used for subsequent experiments at 24 h
post-transfection.
Cell proliferation assay
Briefly, a total 1,000 cells from each group in 100
µl medium were seeded in a 96-well plate. After 24 h, 10
µl of MTT solution (Sigma-Aldrich; Merck KGaA) was added to
each group of cells for incubation at 37°C for 3 h. The medium was
discarded, 150 µl of DMSO was added to each well, and the
plate was shaken for 15 sec to mix well. The culture plate was
placed in a microplate reader to record the absorbance value at 450
nm. The formula for calculating the cell proliferation inhibition
rate (%) was: [1-(OD value of experimental group of
cells-blank)/(OD value of control group of cells-blank)] ×100.
Annexin V/propidium iodide (PI) staining
and flow cytometry
The experiment was performed according to the
instruction manual of the Annexin V-FITC Apoptosis Detection kit
(Beyotime Institute of Biotechnology). Briefly, adherent cells were
digested using trypsin. The cells were washed with PBS once,
centrifuged, and gently resuspended in 195 µl of Annexin
V-FITC binding solution. Next, 5 µl of Annexin V-FITC was
added, and the sample was gently mixed. Finally, 10 µl of PI
staining solution was added, and the sample was gently mixed and
incubated at 20°C in the dark for 30 min. The cells were then
detected using a flow cytometer (Cytomics FC 500; Beckman Coulter,
Inc.) and analysed using FlowJo software (Version 7.6.1; FlowJo,
LLC).
Transwell invasion assay
The upper chambers of the tran-swell filters
(8.0-µm pore, 6.5-mm polycarbonate; Corning, Inc.) were
pre-coated with 50 µl Matrigel (Corning, Inc.). Cells
(2×10⁵) were resuspended in 200 µl serum-free
DMEM/F12 and seeded on the upper chambers of the Transwell filters.
A total of 600 µl DMEM/F12 containing 10% FBS was added to
the bottom chambers. Cells were allowed to invade for 24 h at 37°C
in a humidified incubator with 5% CO2. Cells invaded to
the lower surface of the filter were fixed in 4% paraformaldehyde
at room temperature for 30 min, and stained with DAPI (Beyotime
Institute of Biotechnology). Invaded cells were then counted using
a fluorescent microscope (Olympus CX23; Olympus Corporation). Five
random optical fields were counted for each Transwell filter.
Capillary tubule formation assay
All steps were performed according to a previously
described method (22). In brief,
human umbilical vein epithelial cells (HUVECs) were divided into
three experimental groups: the non-treated group, the
anisomycin-treated group (anisomycin was applied at a final
concentration of 31.8 mM; dilution for 1:1,000) and the
vehicle-treated group (the same volume of DMSO was applied to the
cells). Each group cells was plated on Matrigel-coated 6-chamber
slides (2×10⁵ cells/chamber), in the presence or absence
of treatments as aforementioned. After 6 h of incubation, the cells
were photographed using a light microscope (Olympus CX23; Olympus
Corporation). To quantitate the data, the number of branch points
in four non-overlapping fields was counted.
In vivo xenograft experiments
Female BALB/c nude mice (n=4; weight, ~20 g; age, 8
weeks) were obtained from the Shanghai Research Center for Model
Organisms (Shanghai, China). This study was approved (permit no.
SRCMR20160018) by the Animal Ethics Committee of Shanghai Research
Center for Model Organisms, and the experimental protocols were in
compliance with the Experimental Animal Regulations of the Ministry
of Science and Technology National Science and Technology
Commission (Beijing, China). All mice were maintained in colonies
of 1 per cage for 7 days, and housed in a temperature-controlled
room under a standard light-dark cycle, with free access to food
and water. Two types of cells HuOCSCs were inoculated into the back
of all mice: DMSO-pretreated cells (total 1×10⁵ cells in
100 µl per mouse) were inoculated into the scapula and
anisomycin-pretreated cells (total 1×10⁵ cells in 100
µl per mouse) were inoculated into the lower back. Each
experimental group comprised four mice. After 35 weeks, the mice
were sacrificed and the tumors were surgically excised. Tumors were
weighed, and the volume was calculated as follows: Tumor volume
(mm3) = [longest axis (mm) x shortest axis
(mm)2]/2.
For the histological analysis of the xenograft
tumors, the fresh tumor tissues were soaked in 4% paraformaldehyde
(Sigma-Aldrich; Merck KGaA) at room temperature for 30 min. The
tumor tissues were dehydrated using an ethanol gradient and
embedded in paraffin. Then, the paraffin blocks were sectioned
(thickness, 6 µm) and soaked in xylene for dewaxing. The
tumor tissue sections were stained with hematoxylin and eosin
(Sigma-Aldrich; Merck KGaA) and were finally cleared with xylene
and mounted with neutral resin (Sigma-Aldrich; Merck KGaA). Three
random fields of each tumor tissue section from a total 4 slides
were observed (magnification, ×200) using a light microscope
(Olympus CX23; Olympus Corporation). In addition,
immunofluorescence analysis was performed. The tumor tissue
sections were rinsed with 3% phosphate buffer, and mouse anti-CD31
(clone P2B1; cat. no. ab24590; Abcam), rabbit anti-CD146 (clone
EPR3208; cat. no. ab75769; Abcam), mouse anti-coagulation factor
VIII (FVIII; clone GMA-012; ab78852; Abcam) and rabbit anti-fms
related tyrosine kinase 1 (Flt1; clone Y103; cat. no. ab32152;
Abcam) were added at 1:200 dilution for 60 min at room temperature.
Then, the tissue sections were incubated with goat anti-mouse
(Alexa Fluor® 555 pre-adsorbed; 1:200; ab150118; Abcam)
or goat anti-rabbit secondary antibody (Alexa Fluor® 488
pre-adsorbed; 1:200; ab150077; Abcam) and 5 µg/ml DAPI at
room temperature for 60 min. The tumor tissue sections were then
washed thoroughly with TBST [25 mM Tris/HCl (pH 8.0), 125 mM NaCl
and 0.05% Tween-20] and observed under a fluorescence microscope
(DMI3000; Leica Microsystems, Inc.). PBS (pH 7.4) was used as a
negative control in the place of the primary antibodies. Three
random fields of each tissue section were observed (magnification,
×200) and analyzed using IPP software (Image-Pro Plus Version 6.0;
Media Cybernetics Co. Ltd.). ImageJ 1.42q (National Institutes of
Health) was used to analyze the area of the positive cells on the
immunofluorescence staining.
Extraction of total RNA and quantitative
PCR (qPCR)
Total RNA from each group of cells was extracted
using TRIzol reagent (Thermo Fisher Scientific, Inc.), according to
the manufacturer's instructions. Total RNA was treated with DNase I
(Sigma-Aldrich; Merck KGaA), quantified and reverse transcribed
into cDNA using the ReverTra Ace-α First Strand cDNA Synthesis kit
(Toyobo Life Science). qPCR was performed with a RealPlex4
real-time PCR detection system from Eppendorf Co. Ltd. SYBR Green
Real-Time PCR Master Mix (Toyobo Life Science) was used as the
fluorescent dye. qPCR was performed as follows: 95°C for 5 min,
then 40 cycles of denaturation at 95°C for 15 sec, annealing at
58°C for 30 sec and extension at 72°C for 42 sec, followed by a
final extension step at 72°C for 10 min. The relative gene
expression levels were calculated using the 2−ΔΔCq
method (ΔCq=Cq of gene -Cq of 18s rRNA; ΔΔCq=ΔCq of experimental
group-ΔCq of control group) (23).
The mRNA expression levels were normalised to the expression levels
of 18s rRNA. The primers for amplification of each gene were as
follows: Notch1, forward 5′-CGC TGA CGG AGT ACA AGTG-3′ and reverse
5′-GTA GGA GCC GAC CTC GTT G-3′; d-like canonical Notch ligand 1
(DLL1), forward 5′-TGT GAC GAG TGT ATC CGC TAT-3′ and reverse
5′-GTG TGC AGT AGT TCA GGT CCT-3′; hes family bHLH transcription
factor 1 (HES1), forward 5′-CCT GTC ATC CCC GTC TAC AC-3′ and
reverse 5′-CAC ATG GAG TCC GCC GTA A-3′; recombination signal
binding protein for immunoglobulin κ J region (RBPJ), forward
5′-AAC AAA TGG AAC GCG ATG GTT-3′ and reverse 5′-GGC TGT GCA ATA
GTT CTT TCC TT-3′; PDGFRA, forward 5′-TTG AAG GCA GGC ACA TTT
ACA-3′ and reverse 5′-GCG ACA AGG TAT AAT GGC AGA AT-3′; platelet
derived growth factor receptor β (PDGFRB), forward 5′-TGA TGC CGA
GGA ACT ATT CAT CT-3′ and reverse 5′-TTT CTT CTC GTG CAG TGT
CAC-3′; miR-421, forward 5′-ATC AAC AGA CAT TAA TTG GGC GC-3′ and
reverse 5′-GCT GTC AAC GAT ACG CTAC CTA-3′; miR-145, forward 5′-GTC
CAG TTT TCC CAG GAA TCC CT-3′ and reverse 5′-GCT GTC AAC GAT ACG
CTA CCT A-3′; lncRNA-Meg3, forward 5′-GCC CAT CTA CAC CTC AC-3′ and
reverse 5′-ATC CTT TGC CAT CCT G-3′; and 18S rRNA, forward 5′-CAG
CCA CCC GAG ATT GAG CA-3′ and reverse 5′-TAG TAG CGA CGG GCG GTG
TG-3′.
Western blot analysis
Briefly, cells were lysed in 2X loading lysis buffer
[50 mM Tris-HCl (pH 6.8), 2% sodium dodecyl sulfate, 10%
β-mercaptoethanol, 10% glycerol and 0.002% bromophenol blue]. The
concentration of total protein was then determined by Enhanced BCA
Protein Assay kit (Beyotime Institute of Biotechnology). Total
proteins (25 µg/µl) from each group were then
separated by 12% SDS-PAGE and transferred onto
Hybrid-polyvinylidene fluoride membranes (EMD Millipore). The
membranes were blocked with 5% (w/v) non-fat dried milk in TBST and
washed four times with TBST at room temperature (15 min per wash)
prior to incubation with the primary antibodies (all final dilution
1:1,000) in 5% non-fat dried milk in TBST) at 37°C for 1 h. The
primary antibodies were: Mouse anti-CD31 (clone P2B1; cat. no.
ab24590; Abcam), rabbit anti-CD146 (clone EPR3208; cat. no.
ab75769; Abcam), mouse anti-FVIII (clone GMA-012; ab78852; Abcam),
rabbit anti-vascular endothelial growth factor receptor 1 (VEGFR1;
clone Y103; cat. no. ab32152; Abcam), rabbit anti-PDGFRA (clone
D1E1E; cat. no. 3174; Cell Signalling Technology, Inc.), rabbit
anti-PDGFRB (clone 28E1; cat. no. 3169, Cell Signalling Technology,
Inc.), rabbit anti-argonaute 2 (Ago2; clone C34C6; cat no. 2897;
Cell Signalling Technology, Inc.), Notch Activated Targets Antibody
Sampler kit (cat. no. 68309; Cell Signalling Technology, Inc.), and
rabbit anti-GAPDH antibody (clone EPR16891; cat. no. ab181602;
Abcam). After washing, the membranes were incubated with
horseradish peroxidase-conjugated goat anti-rabbit or goat
anti-mouse secondary antibody (1:1,000; cat. nos. ab97051 and
ab6789; Abcam) at 37°C for 1 h. After washing four times with TBST
at room temperature (15 min per wash), the immunoreactive protein
bands were visualized by enhanced chemiluminescence (ECL) using an
ECL kit (PerkinElmer, Inc.).
Effect of anisomycin on vascular
development of zebrafish embryos
In a 6-well plate, a total of 30 24-h
post-fertilization zebrafish embryos of the fli1a-EGFP/casper
strain (Shanghai Research Centre for Model Organisms, Shanghai,
China) were added to each well. DMSO (0.1%) was added to the E3
embryonic culture medium (0.58 g/l NaCl, 0.27 g/l KCl, 0.97 g/l
CaCl2·2H2O, 0.16 g/l
MgCl2·6H2O, 1% methylene blue; pH 7.2; all
from Sigma-Aldrich; Merck KGaA) in the control group, and 31.8 mM
anisomycin was used in the experimental group. After 8 h of
treatment, the medium was replaced with fresh embryonic culture
medium, and the phenotypic changes of zebrafish embryos were
photographed under a Nikon SMZ 1500 stereomicroscope (Nikon
Corporation; magnification, ×40). The numbers of fully-developed
intersegmental blood vessels (ISV) and dorsal longitudinal
anastomotic vessels (DLAV) in each embryo were counted. The
inhibition rate of angiogenesis was calculated using the following
formula (24): % inhibition of
angiogenesis = [1-(average number of ISV in the embryoid body in
the experimental group/average numbers of ISV and DLAV in the
embryoid body in the control group)] ×100.
cDNA microarray analysis
Total RNA samples from each group of cells were
labeled using Agilent's Low RNA Input Fluorescent Linear
Amplification kit (Agilent Technologies, Inc.), according to the
manufacturer's protocol. Cy3-dCTP or Cy5-dCTP was incorporated
during reverse transcription of 5 µg total RNA into cDNA.
Different fluorescently labeled cDNA probes were mixed in 30
µl hybridization buffer (3X SSC, 0.2% SDS, 5X Denhardt's
solution and 25% formamide) and applied to the microarray
(CapitalBio human mRNA microarray V2.0; CapitalBio Technology,
Inc.) at 42°Cfor 16 h. After hybridization, the slide was washed
with 0.2% SDS/2X SSC at 42°C for 5 min, and then washed with 0.2X
SSC at room temperature for 5 min. The fluorescent images of the
hybridized microarray were scanned with an Agilent Whole Human
Genome 4×44 microarray scanner system (Agilent Technologies, Inc.).
Images and quantitative data of the gene expression levels were
analyzed using the Agilent's Feature Extraction (FE) software,
version 9.5 (Agilent Technologies, Inc.). Raw data were normalized
with a robust multi-array average algorithm and analyzed using
GeneSpring software (version 13.1; Agilent Technologies, Inc.).
Differentially expressed genes (DEGs) were then identified via the
fold-change (Sample group/Control group) in expression, as well as
the P-value calculated from a t-test. The threshold set for
upregulated and downregulated genes was: Log10 (Sample
group/Control group) >3 was considered significantly upregulated
expression; and log10 (Sample group/Control group) <-2 was
considered significantly downregulated expression. Hierarchical
clustering was then performed to demonstrate the expression profile
of the DEGs among samples using MultiExperiment Viewer (version
4.9.0; http://mev.tm4.org/). Gene Ontology (GO)
and Kyoto encyclopedia of genes and genomes (KEGG; https://www.genome.jp/kegg/) pathway analyses of the
identified DEGs were performed using the Database for Annotation,
Visualization and Integrated Discovery (DAVID; http://david.abcc.ncifcrf.gov/) database.
Finally, protein-protein interaction networks were constructed
using the Search Tool for the Retrieval of Interacting Genes
(STRING version 11.0; https://string-db.org/) database and visualized using
Cytoscape software (version 3.4.0; https://cytoscape.org/).
Luciferase reporter assay
All steps of the luciferase reporter assay were
performed as previously described (21). NIH-3T3 cells were purchased from
The Cell Bank of Type Culture Collection of the Chinese Academy of
Sciences (Shanghai, China), and cultured with DMEM medium (Gibco;
Thermo Fisher Scientific, Inc.) containing 10 % FBS (Gibco; Thermo
Fisher Scientific, Inc.). NIH-3T3 cells were seeded at
3×10⁴/well in 48-well plates and co-transfected with 400
ng of miR-421 mimics or miR-134-mut control, 20 ng of pGL3
cm-PDGFRA-3UTR-WT or pGL3 cm-PDGFRA-3UTR-Mut (NovoBio, Ltd.), pGL3
cm-Meg3-WT (NovoBio, Ltd.) or pGL3 cm-Meg3-Mut (NovoBio, Ltd.), and
pRL-TK (Promega Corporation) using Lipofectamine 2000 reagent
(Thermo Fisher Scientific, Inc.), according to the manufacturer's
protocol. At 48 h post-transfection, the Firefly and Renilla
luciferase activities were measured using the dual-luciferase
reporter assay system (Promega Corporation).
RNA immunoprecipitation (RIP)-PCR
RIP experiments were performed using the Magna RIP
RNA-Binding Protein Immunoprecipitation kit (EMD Millipore). All
the steps of RIP were performed as previously described (12). Briefly, cells from all groups were
lysed (500 µl per plate) in a modified cell lysis buffer
used for western blotting and immunoprecipitation (20 mM Tris
pH7.5, 150 mM NaCl, 1% Triton X-100, 1 mM EDTA, sodium
pyrophosphate, β-glycerophosphate, Na3VO4 and
leupeptin; Beyotime institute of Biotechnology). After lysis, each
sample was centrifuged at 4°C, 1,200 × g for 10 min to clear the
insoluble debris and the supernatant was pre-incubated with 20
µg protein A agarose beads (Beyotime institute of
Biotechnology) by rocking for 30 min at 4°C, followed by
centrifugation (4°C, 450 × g for 2 min) and transfer to a new 1.5
ml tube. The mouse anti-human Ago2 monoclonal antibody (clone
C34C6; cat no. 2897; Cell Signaling Technology, Inc.; 1:100) was
added for 90 min, before the re-addition of 20 µg of protein
A agarose beads to capture the immune complexes. The agarose beads
were then washed three times with ice-cold homogenization buffer.
Then, the co-precipitated RNAs were isolated by resuspending the
beads in TRIzol RNA extraction reagent (Thermo Fisher Scientific,
Inc.), and extracted using the RNeasy Mini kit (Qiagen GmbH). Total
RNAs were subjected to reverse transcription using a ReverTra Ace-α
First Strand cDNA Synthesis kit (Toyobo Life Science). PCR
amplification was performed for 31 cycles as follows: Denaturation
at 95°C for 30 sec, annealing at 65°C for 30 sec and extension at
72°C for 42 sec, using Easy-Load™ PCR Master Mix (cat. no. D7251-1
ml; Beyotime Institute of Biotechnology). The amplification
products were visualized by 1.2% agarose gel electrophoresis. The
primers for amplification of each gene were as follows: miR-421,
forward 5′-ATC AAC AGA CAT TAA TTG GGC GC-3′ and reverse 5′-GCT GTC
AAC GAT ACG CTA CCT A-3′; and lncRNA-Meg3, forward 5′-GCC CAT CTA
CAC CTC AC-3′ and reverse 5′-ATC CTT TGC CAT CCT G-3′.
Statistical analysis
Each experiment was performed as least three times,
and data are presented as the mean ± standard error where
applicable. Differences were evaluated using one-way ANOVA followed
by Dunnett's test. Statistical analysis was performed by GraphPad
Prism Version 5.00 (GraphPad Software, Inc.). P<0.05 was
considered to indicate a statistically significant difference.
Results
Angiogenesis is positively correlated to
the number of CD44+/CD133+ cells in ovarian
cancer tissues
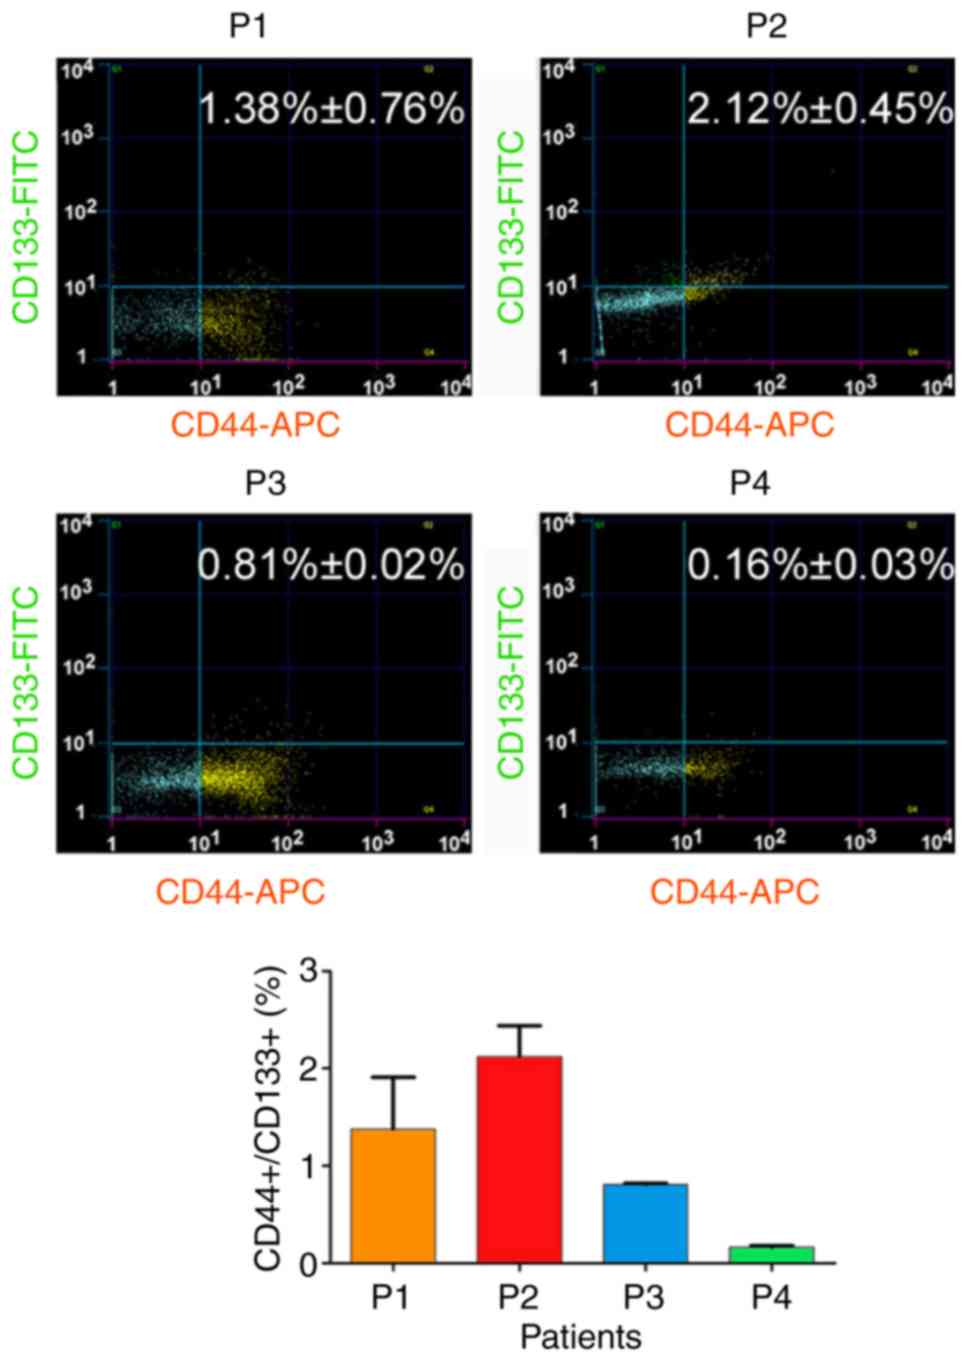
First, the association between HuOCSCs and tumour
angiogenesis was investigated. Flow cytometry analysis revealed a
large difference in the number of
CD44+/CD133+ HuOCSCs in serous ovarian cancer
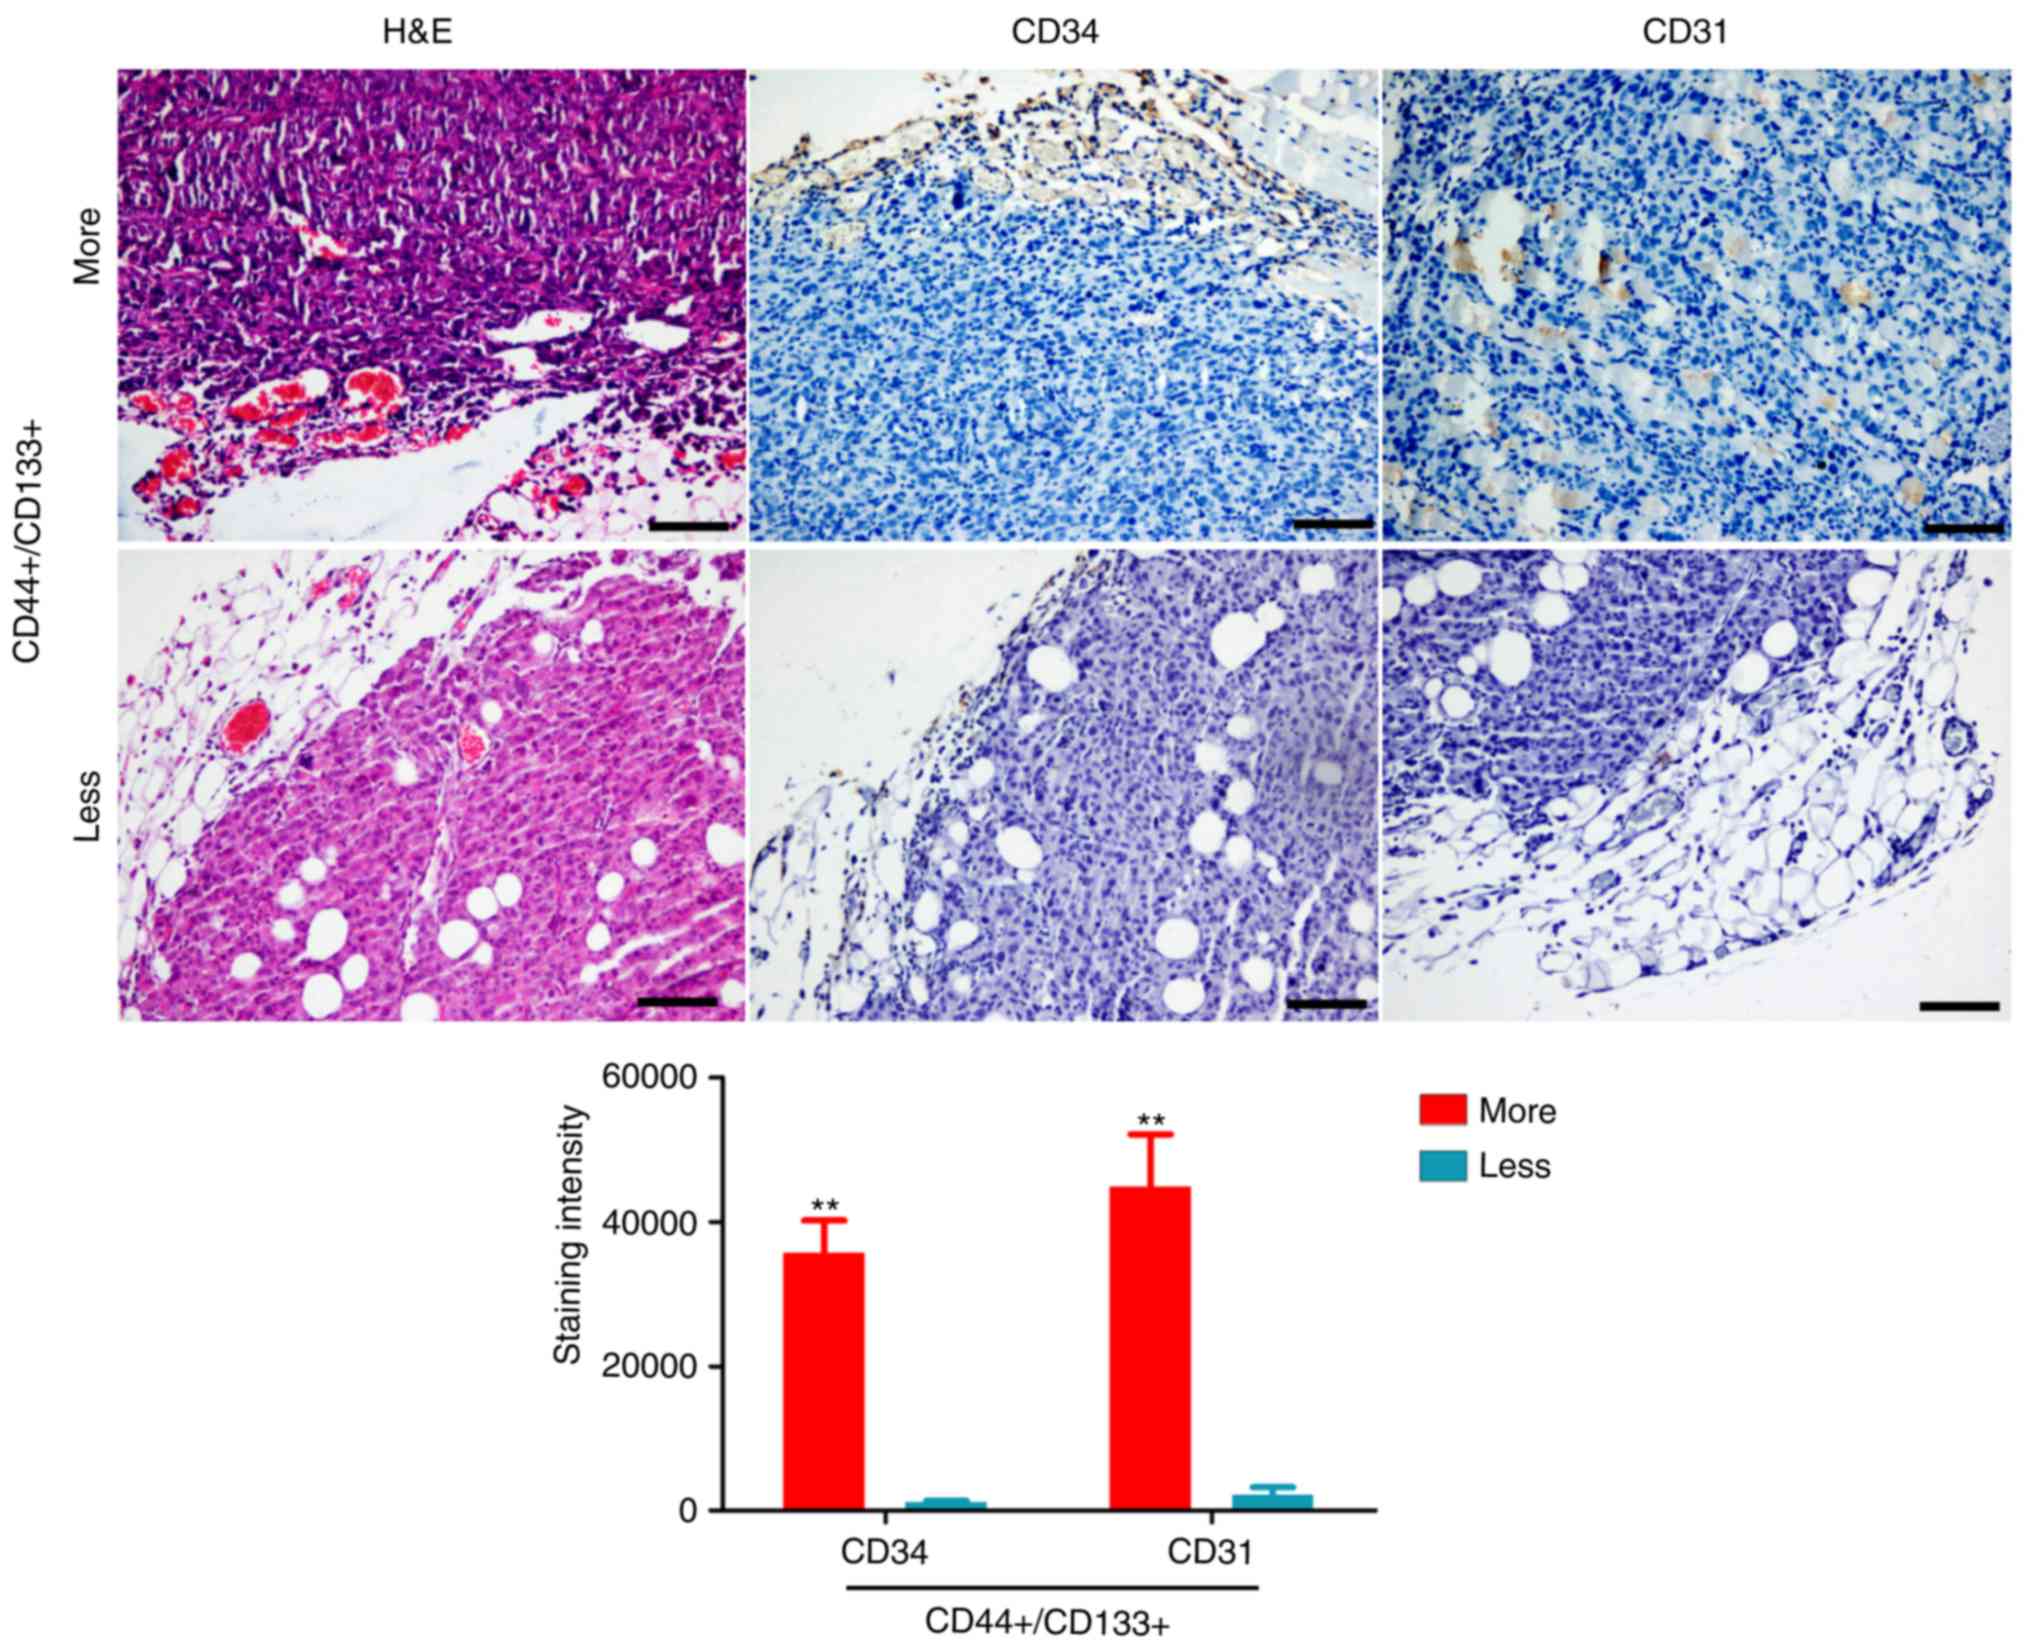
tissues from four different patients (Fig. 1). Subsequently, H&E staining
revealed that there were more new blood vessels in tissues from P2
patient with increased numbers of
CD44+/CD133+ cells than in tissues from P4
patient with less CD44+/CD133+ cells
(Fig. 2). Immunohistochemical
staining confirmed that the expression of CD31 and CD34 was
significantly higher in tissues from P2 patient with more
CD44+/CD133+ cells than in tissues from P4
patient with less CD44+/CD133+ cells
(Fig. 2). Therefore, these results
indicated that higher content of CD44+/CD133+
cells in ovarian cancer tissues may be associated with increased
angiogenesis.
Anisomycin inhibits the activity of
CD44+/CD133+HuOCSCs in vitro
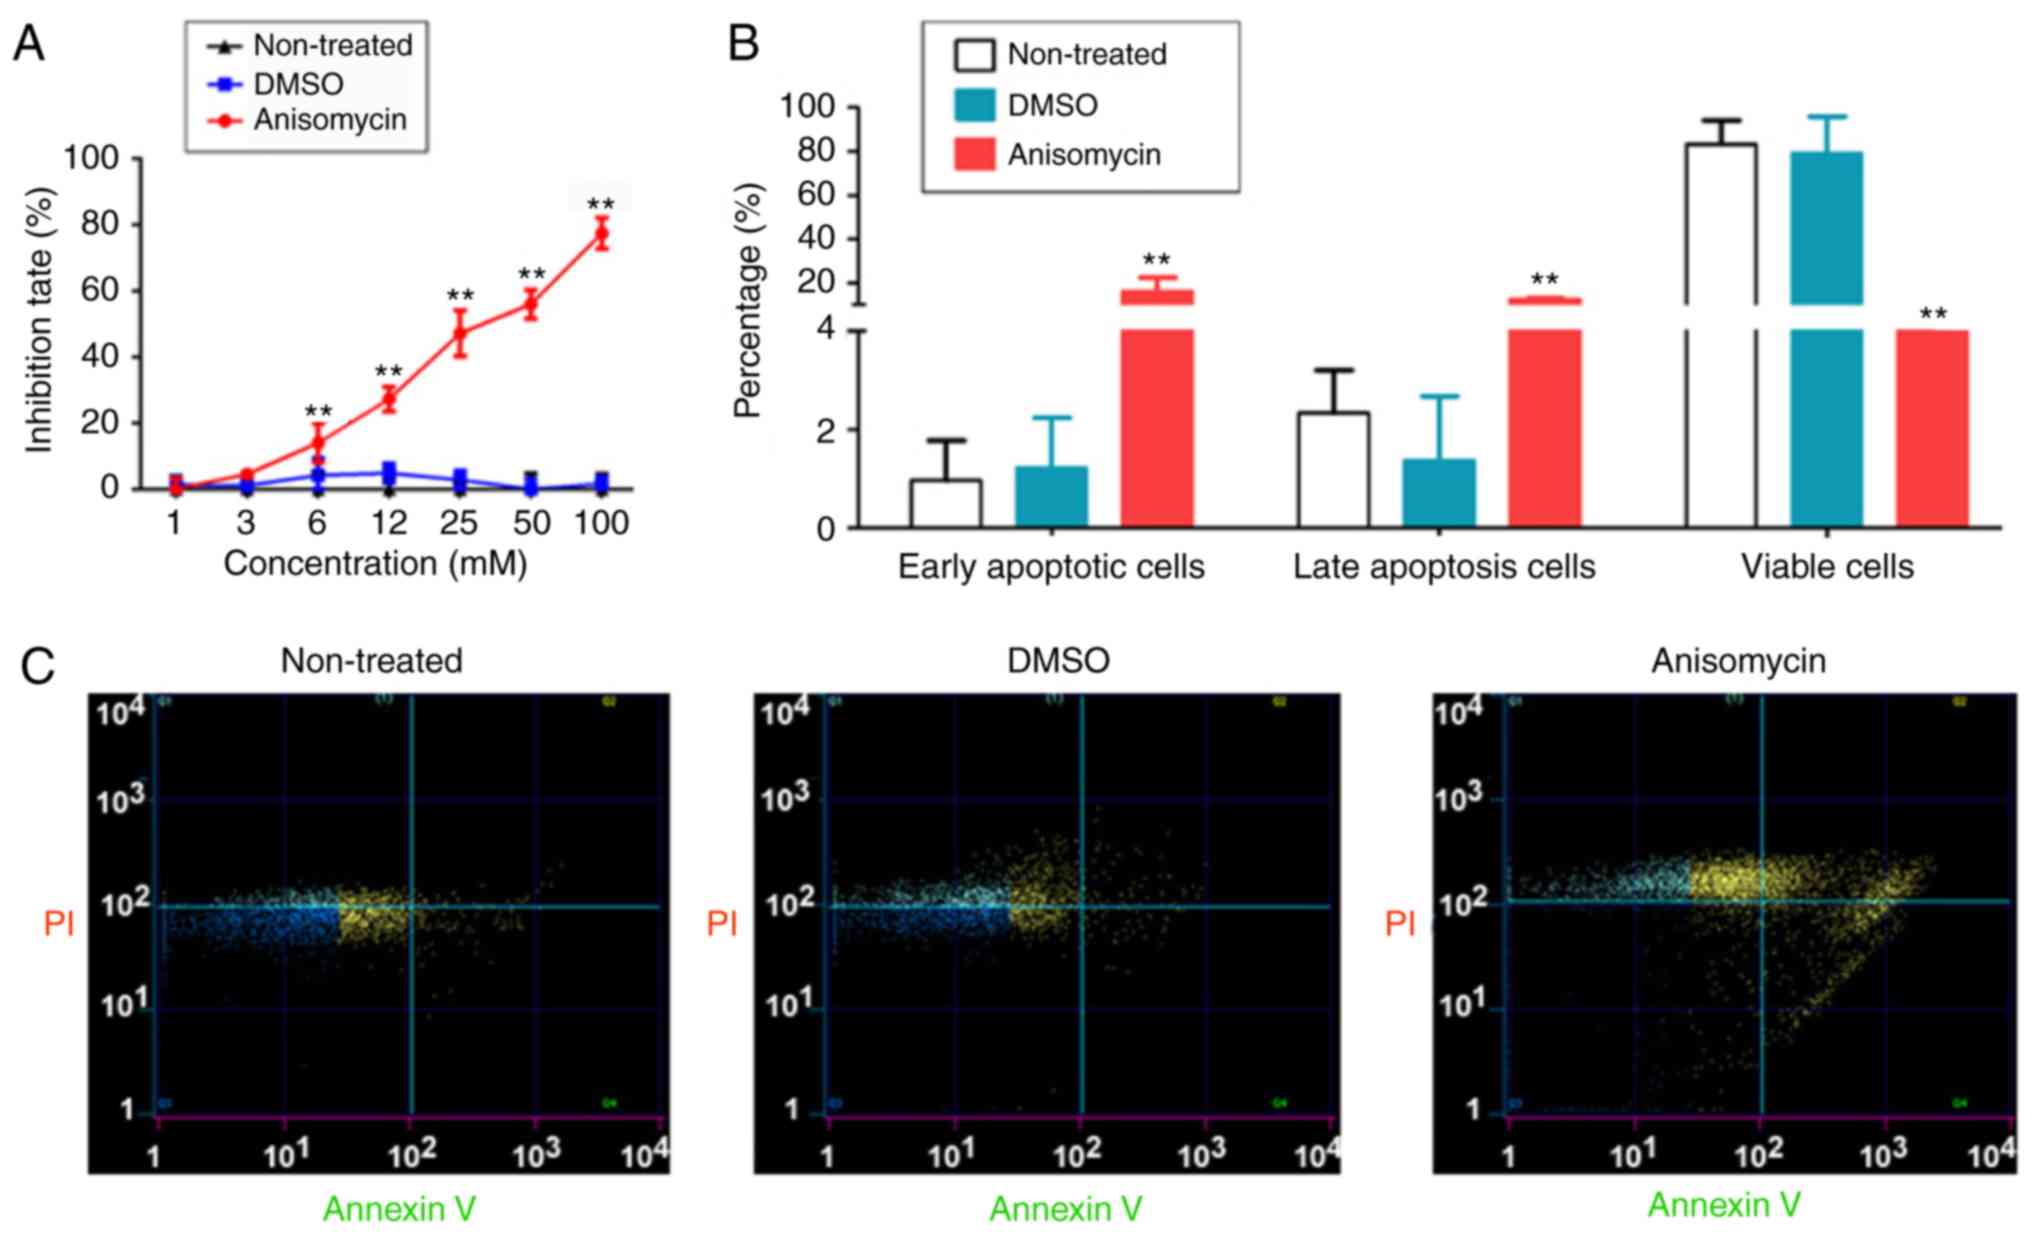
The effect of different concentrations (1-100 mM) of
anisomycin was next analysed on the proliferation of
CD44+/CD133+ HuOCSCs in vitro. The MTT
assay results demonstrated that after 36 h of cell treatment, the
inhibition rate of cell proliferation increased significantly with
the increase of anisomycin concentration (Fig. 3A). The results showed that
anisomycin caused inhibition of cell proliferation in a
dose-dependent manner (IC50=31.8 mM). Flow cytometry
analysis of Annexin V/PI double staining indicated that treatment
of HuOCSCs with anisomycin for 36 h significantly increased the
proportion of apoptotic cells in HuOCSCs, and significantly
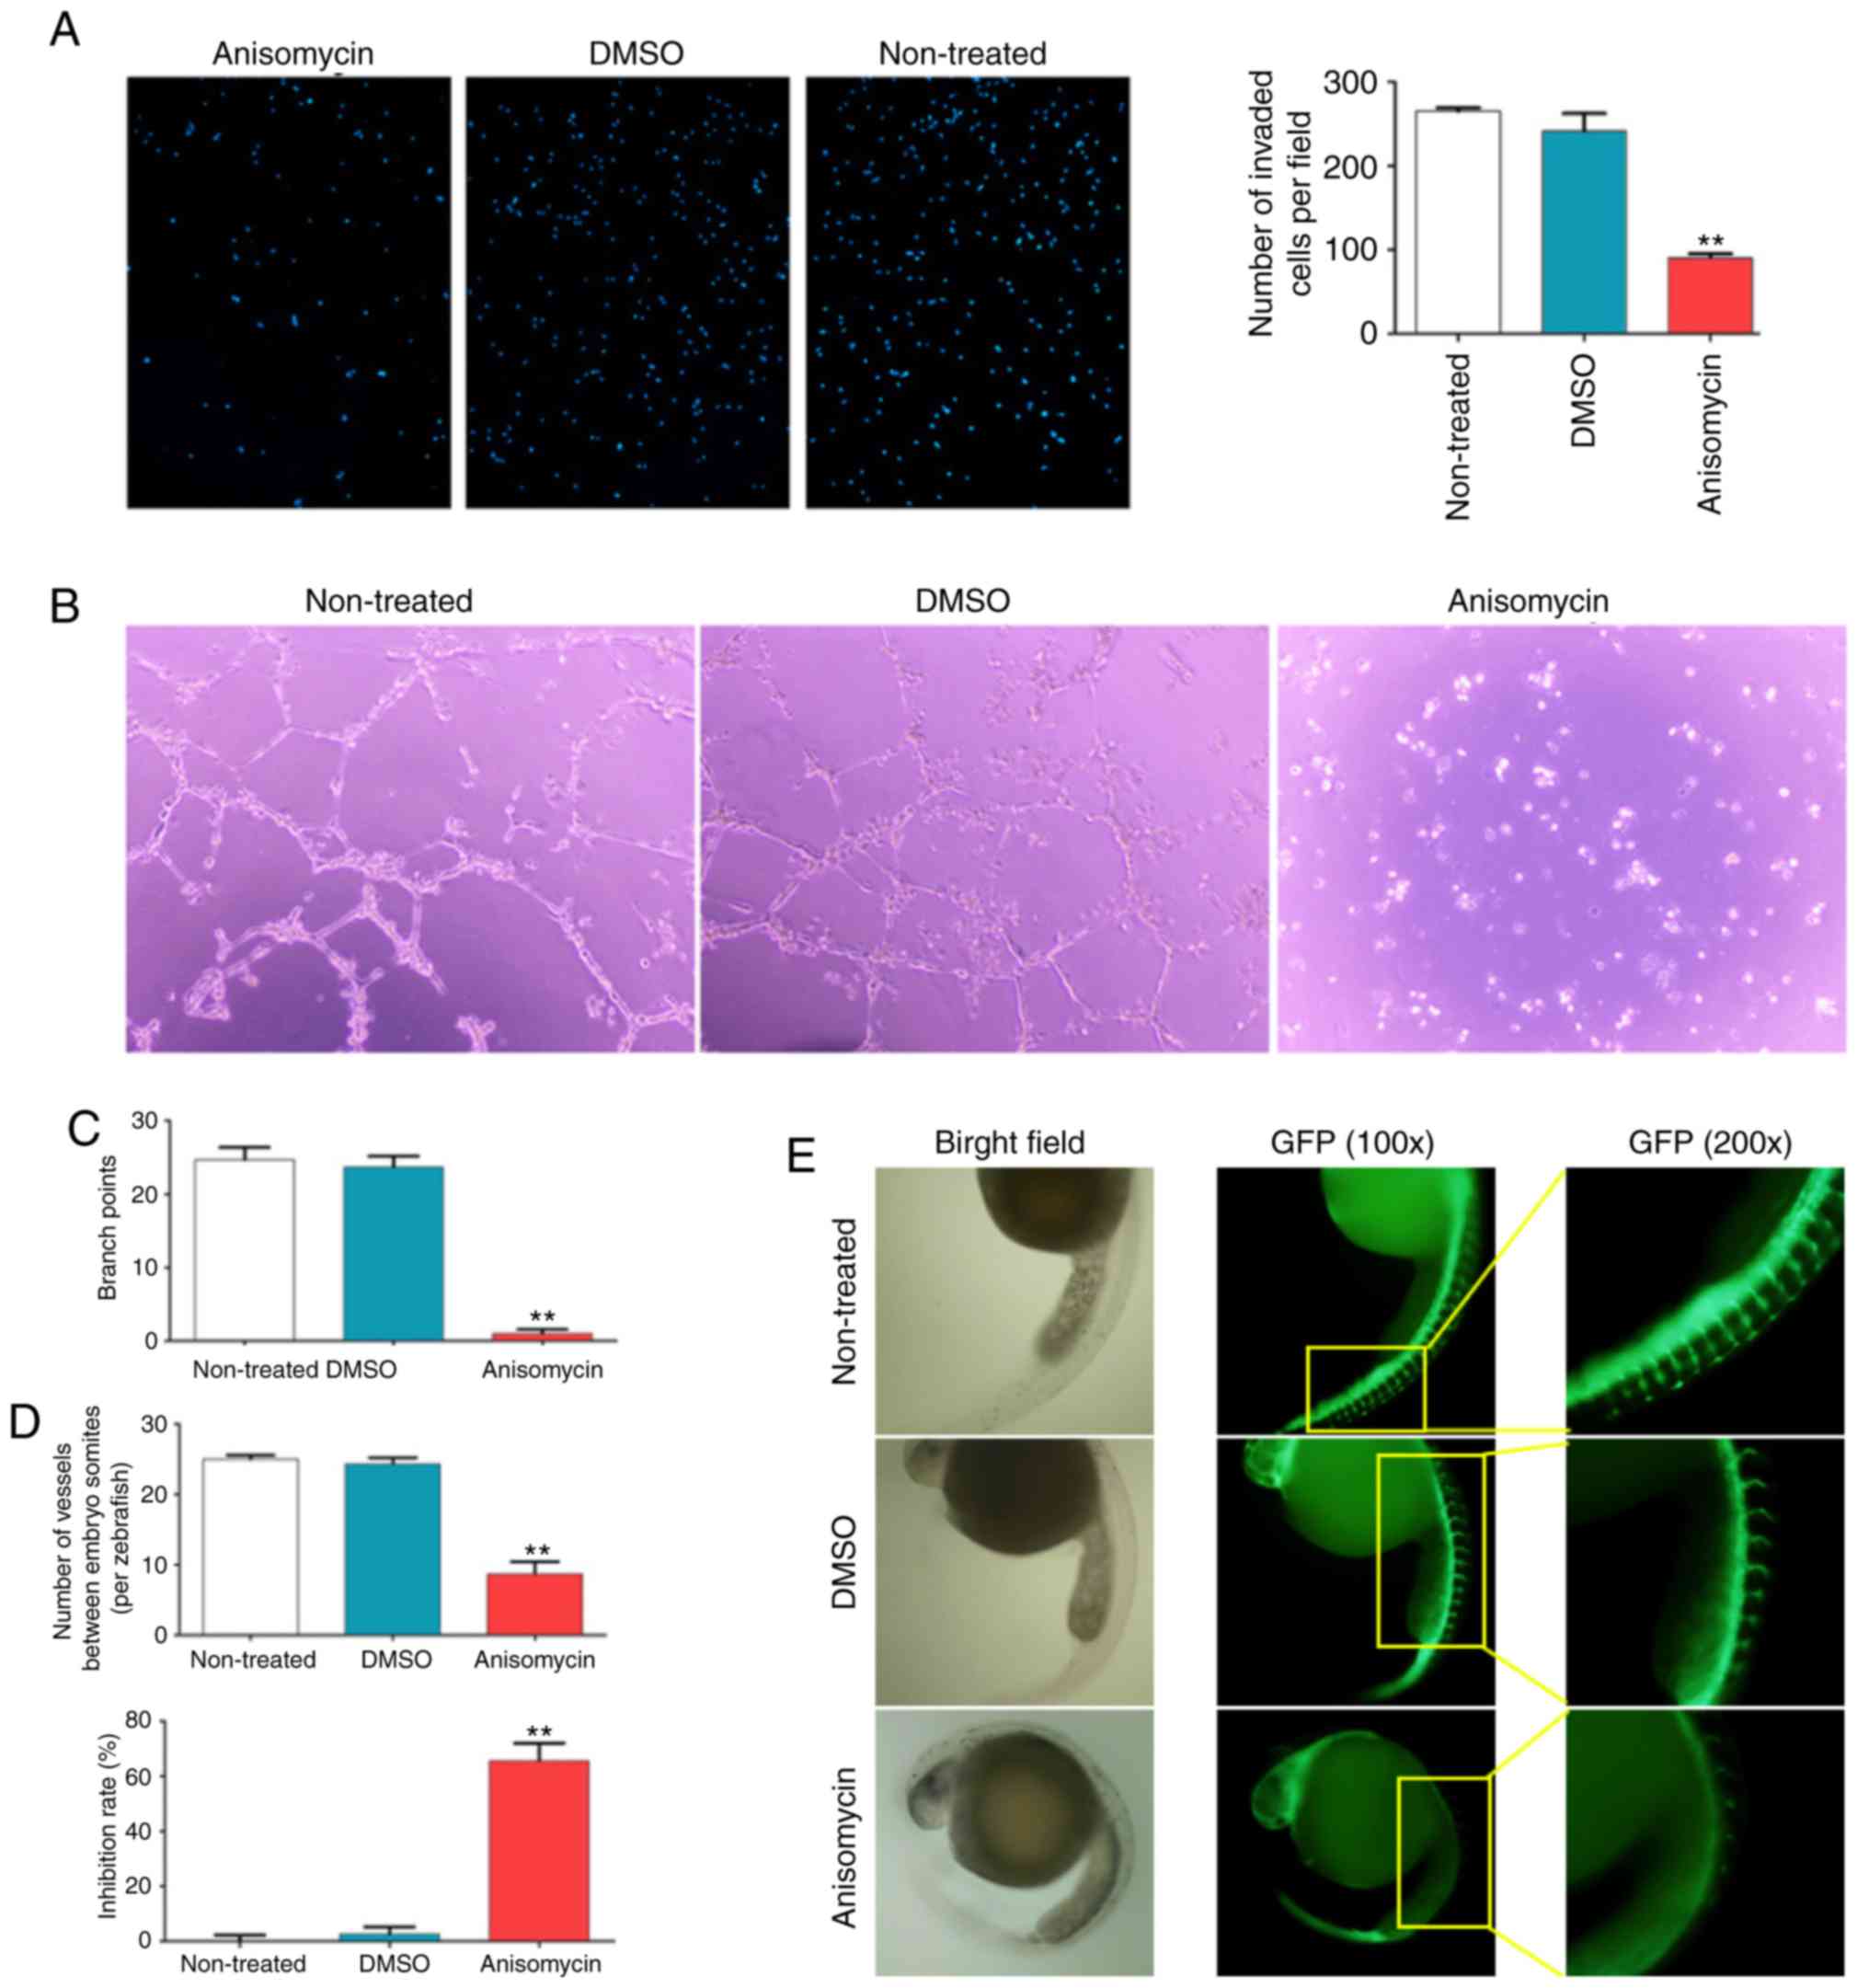
decreased the proportion of viable cells (Fig. 3B and C). In addition, Transwell
invasion assays demonstrated that treatment of HuOCSCs with
anisomycin for 36 h significantly weakened their invasive ability
in Matrigel (Fig. 4A).
Next, the effects of anisomycin on angiogenesis were
investigated. The results of an in vitro HUVEC capillary
tubule formation assay showed that 36 h of treatment with
anisomycin at the IC50 dose significantly inhibited the
ability of HUVECs to form 3-dimensional tubular structures in
Matrigel (Fig. 4B and C).
Furthermore, zebrafish embryos of the fli1a-EGFP/casper strain were
incubated with anisomycin at the IC50 dose for 24 h and
the results demonstrated that anisomycin significantly inhibited
the growth and development of ISV and DLAV (Fig. 4D and E); the inhibition rate of
vascular development in the anisomycin-treated group was
significantly higher compared with the DMSO-treated and non-treated
groups (Fig. 4D). These results
indicated that anisomycin significantly inhibited the proliferation
and invasion of HuOCSCs, as well as inhibited angiogenesis of
HUVECs.
Anisomycin inhibits the activity of
CD44+/CD133+ HuOCSCs in vivo
First, CD44+/CD133+ HuOCSCs
were divided into two groups, one group was treated with anisomycin
at IC50 dose, and the other group was treated with an
equal volume of DMSO. After the two groups of cells were treated
for 36 h as aforementioned, an equal number of cells was used to
subcutaneously inoculate mice at the shoulder or hip. The two
groups of nude mice were kept under the same conditions for 35
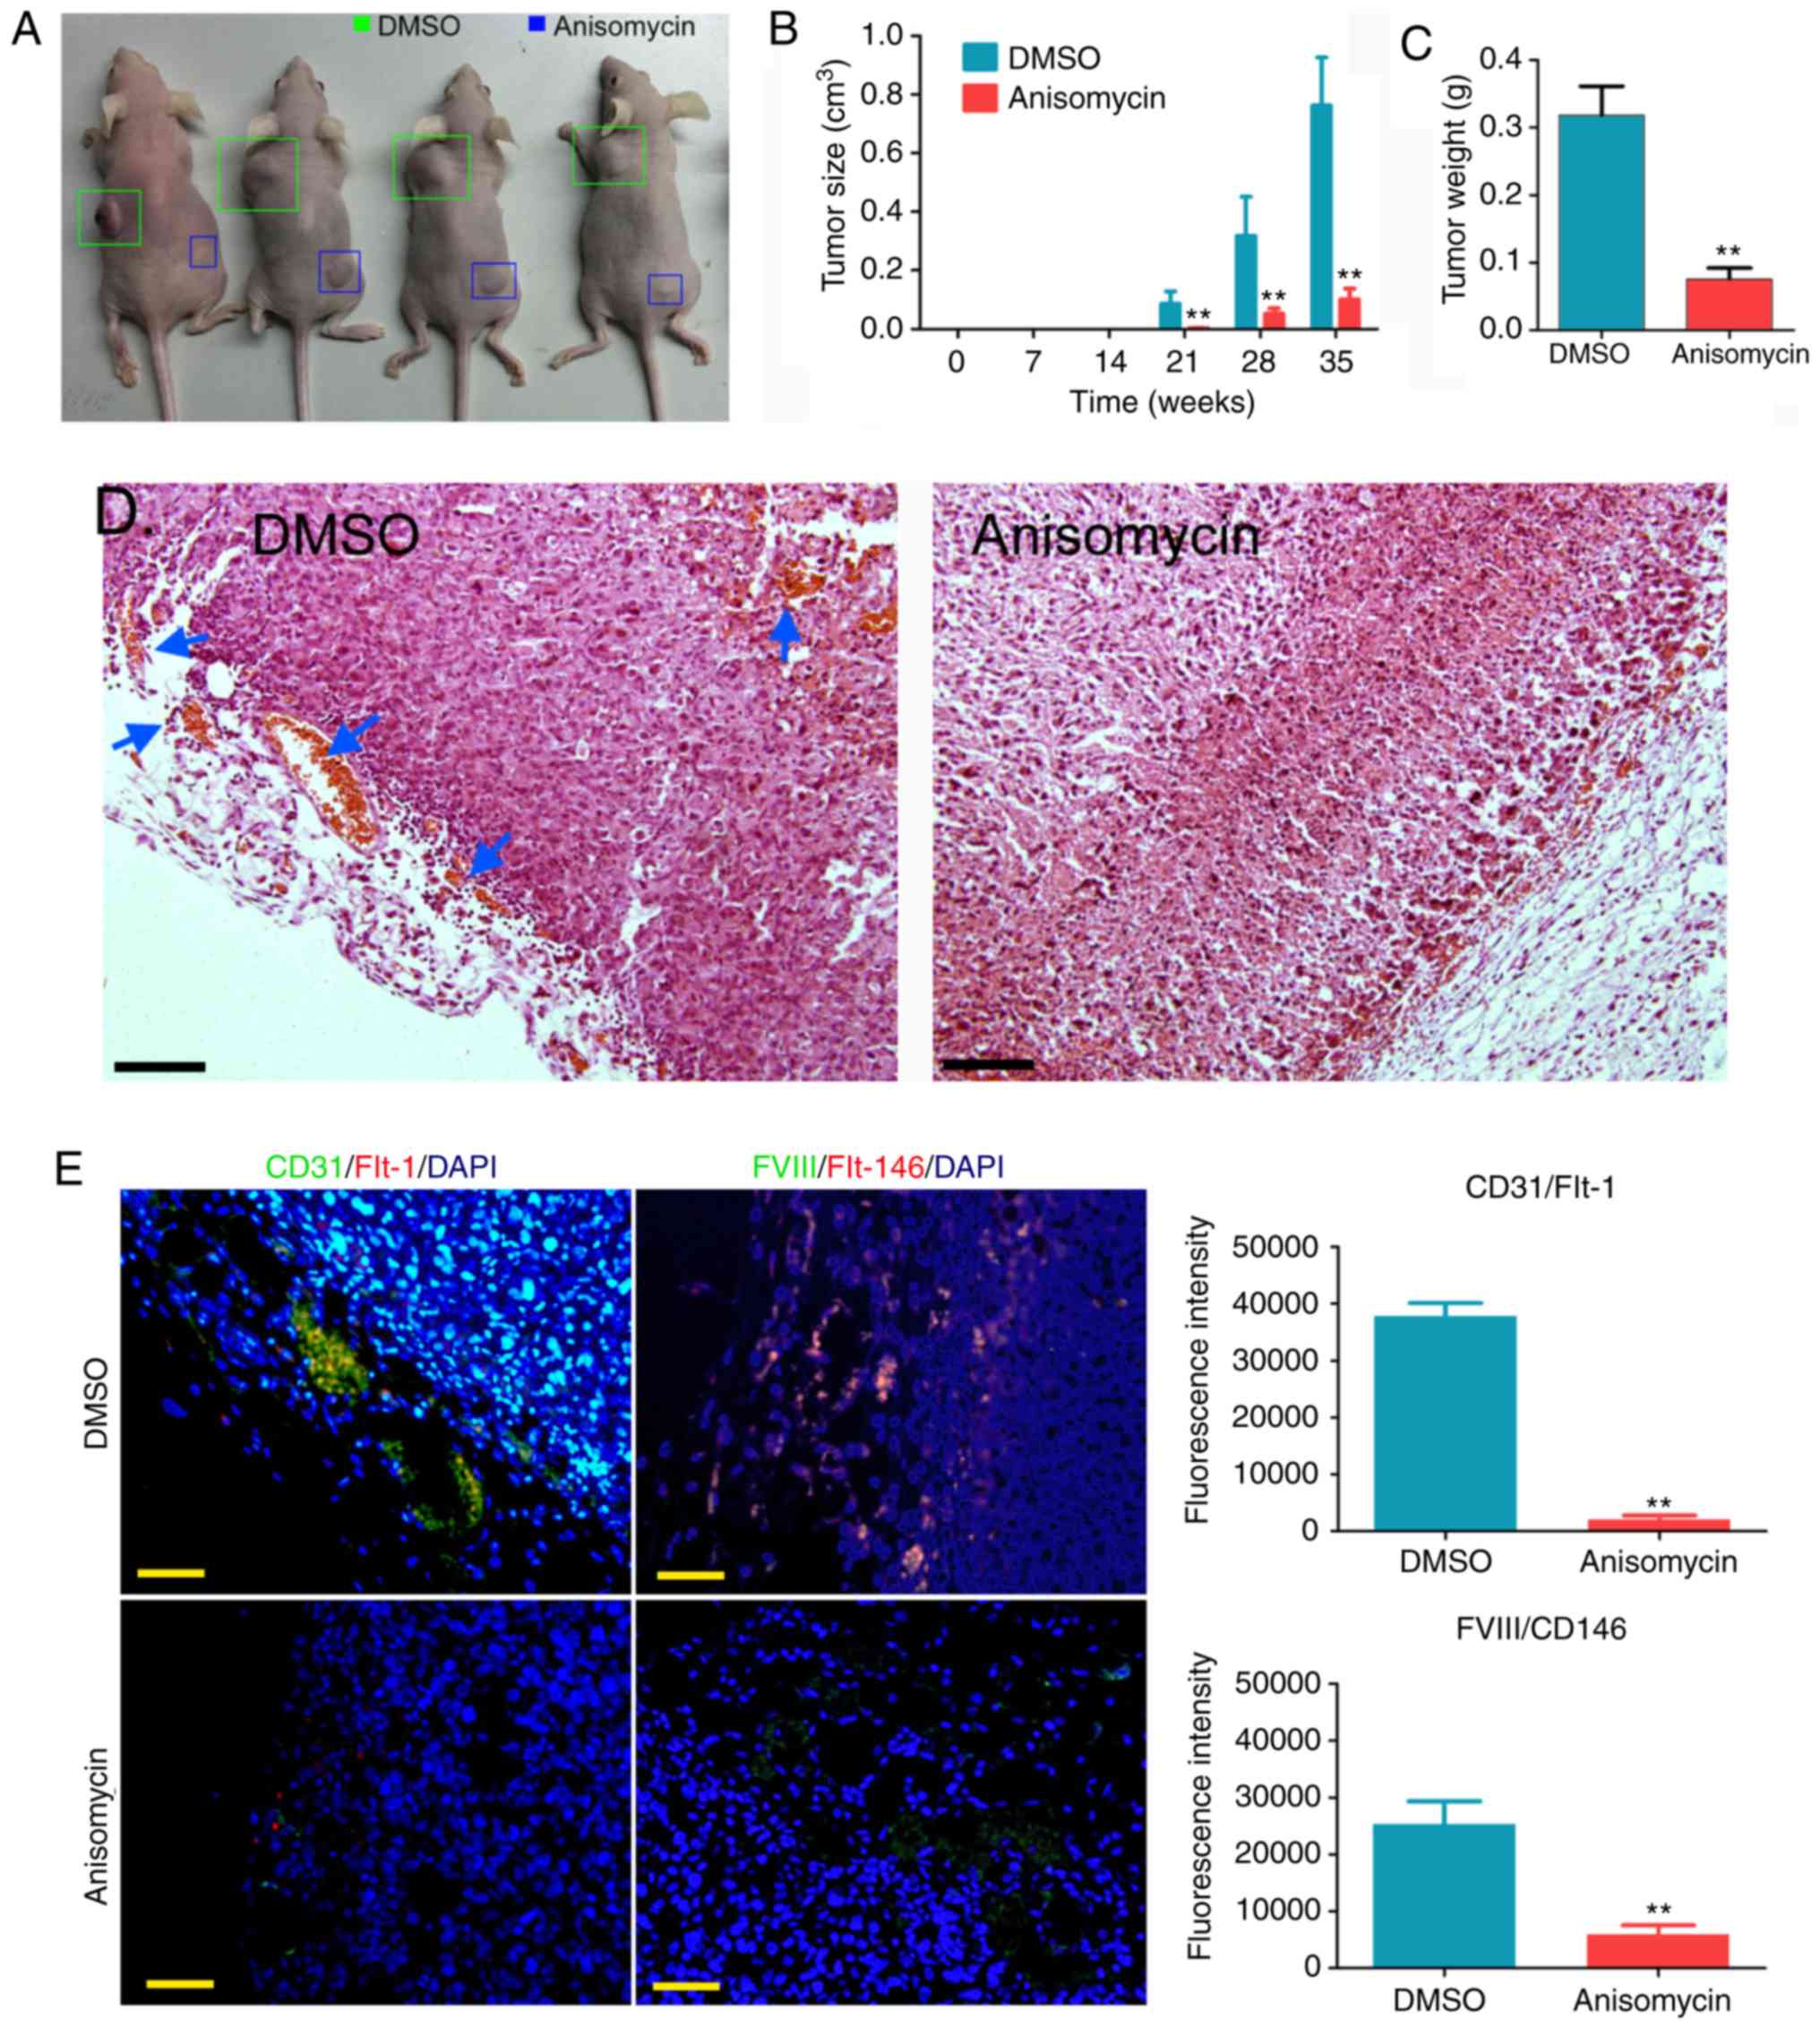
weeks. It was observed that tumours grew on both groups of nude
mice at week 21 post-inoculation, but the tumours formed by
DMSO-treated cells were markedly larger than those formed by
anisomycin-treated cells (Fig.
5A). Over time, the volume of tumours formed by DMSO-treated
HuOCSCs increased significantly, while the volume of tumours formed
by anisomycin-treated HuOCSCs increased slowly; a statistically
significant difference in tumour volume was observed between the
two groups (Fig. 5B). At week 35,
all nude mice were sacrificed, and the weights of tumours in each
group were measured. The results demonstrated that the weight of
the tumours formed by anisomycin-treated HuOCSCs was significantly
decreased compared with that formed by DMSO-treated cells (Fig. 5C). Subsequently, H&E staining
of the xenograft tumours revealed minimal neovascularization in the
tumour tissues formed by anisomycin-treated HuOCSCs, whereas marked
neovascularization was observed in the tumour tissues formed by
DMSO-treated cells (Fig. 5D). In
addition, immunofluorescence staining revealed that the density of
CD31/Flt-1 and FVIII/CD146 double-positive cells in the tumour
tissues formed by anisomycin-treated HuOCSCs was significantly
decreased compared with that in the tumour tissues formed by
DMSO-treated cells (Fig. 5E).
Therefore, these results indicated that anisomycin significantly
inhibited the proliferation and angiogenic ability of
CD44+/CD133+ HuOCSCs in vivo.
Anisomycin inhibits the expression of
multiple angiogenesis-related genes
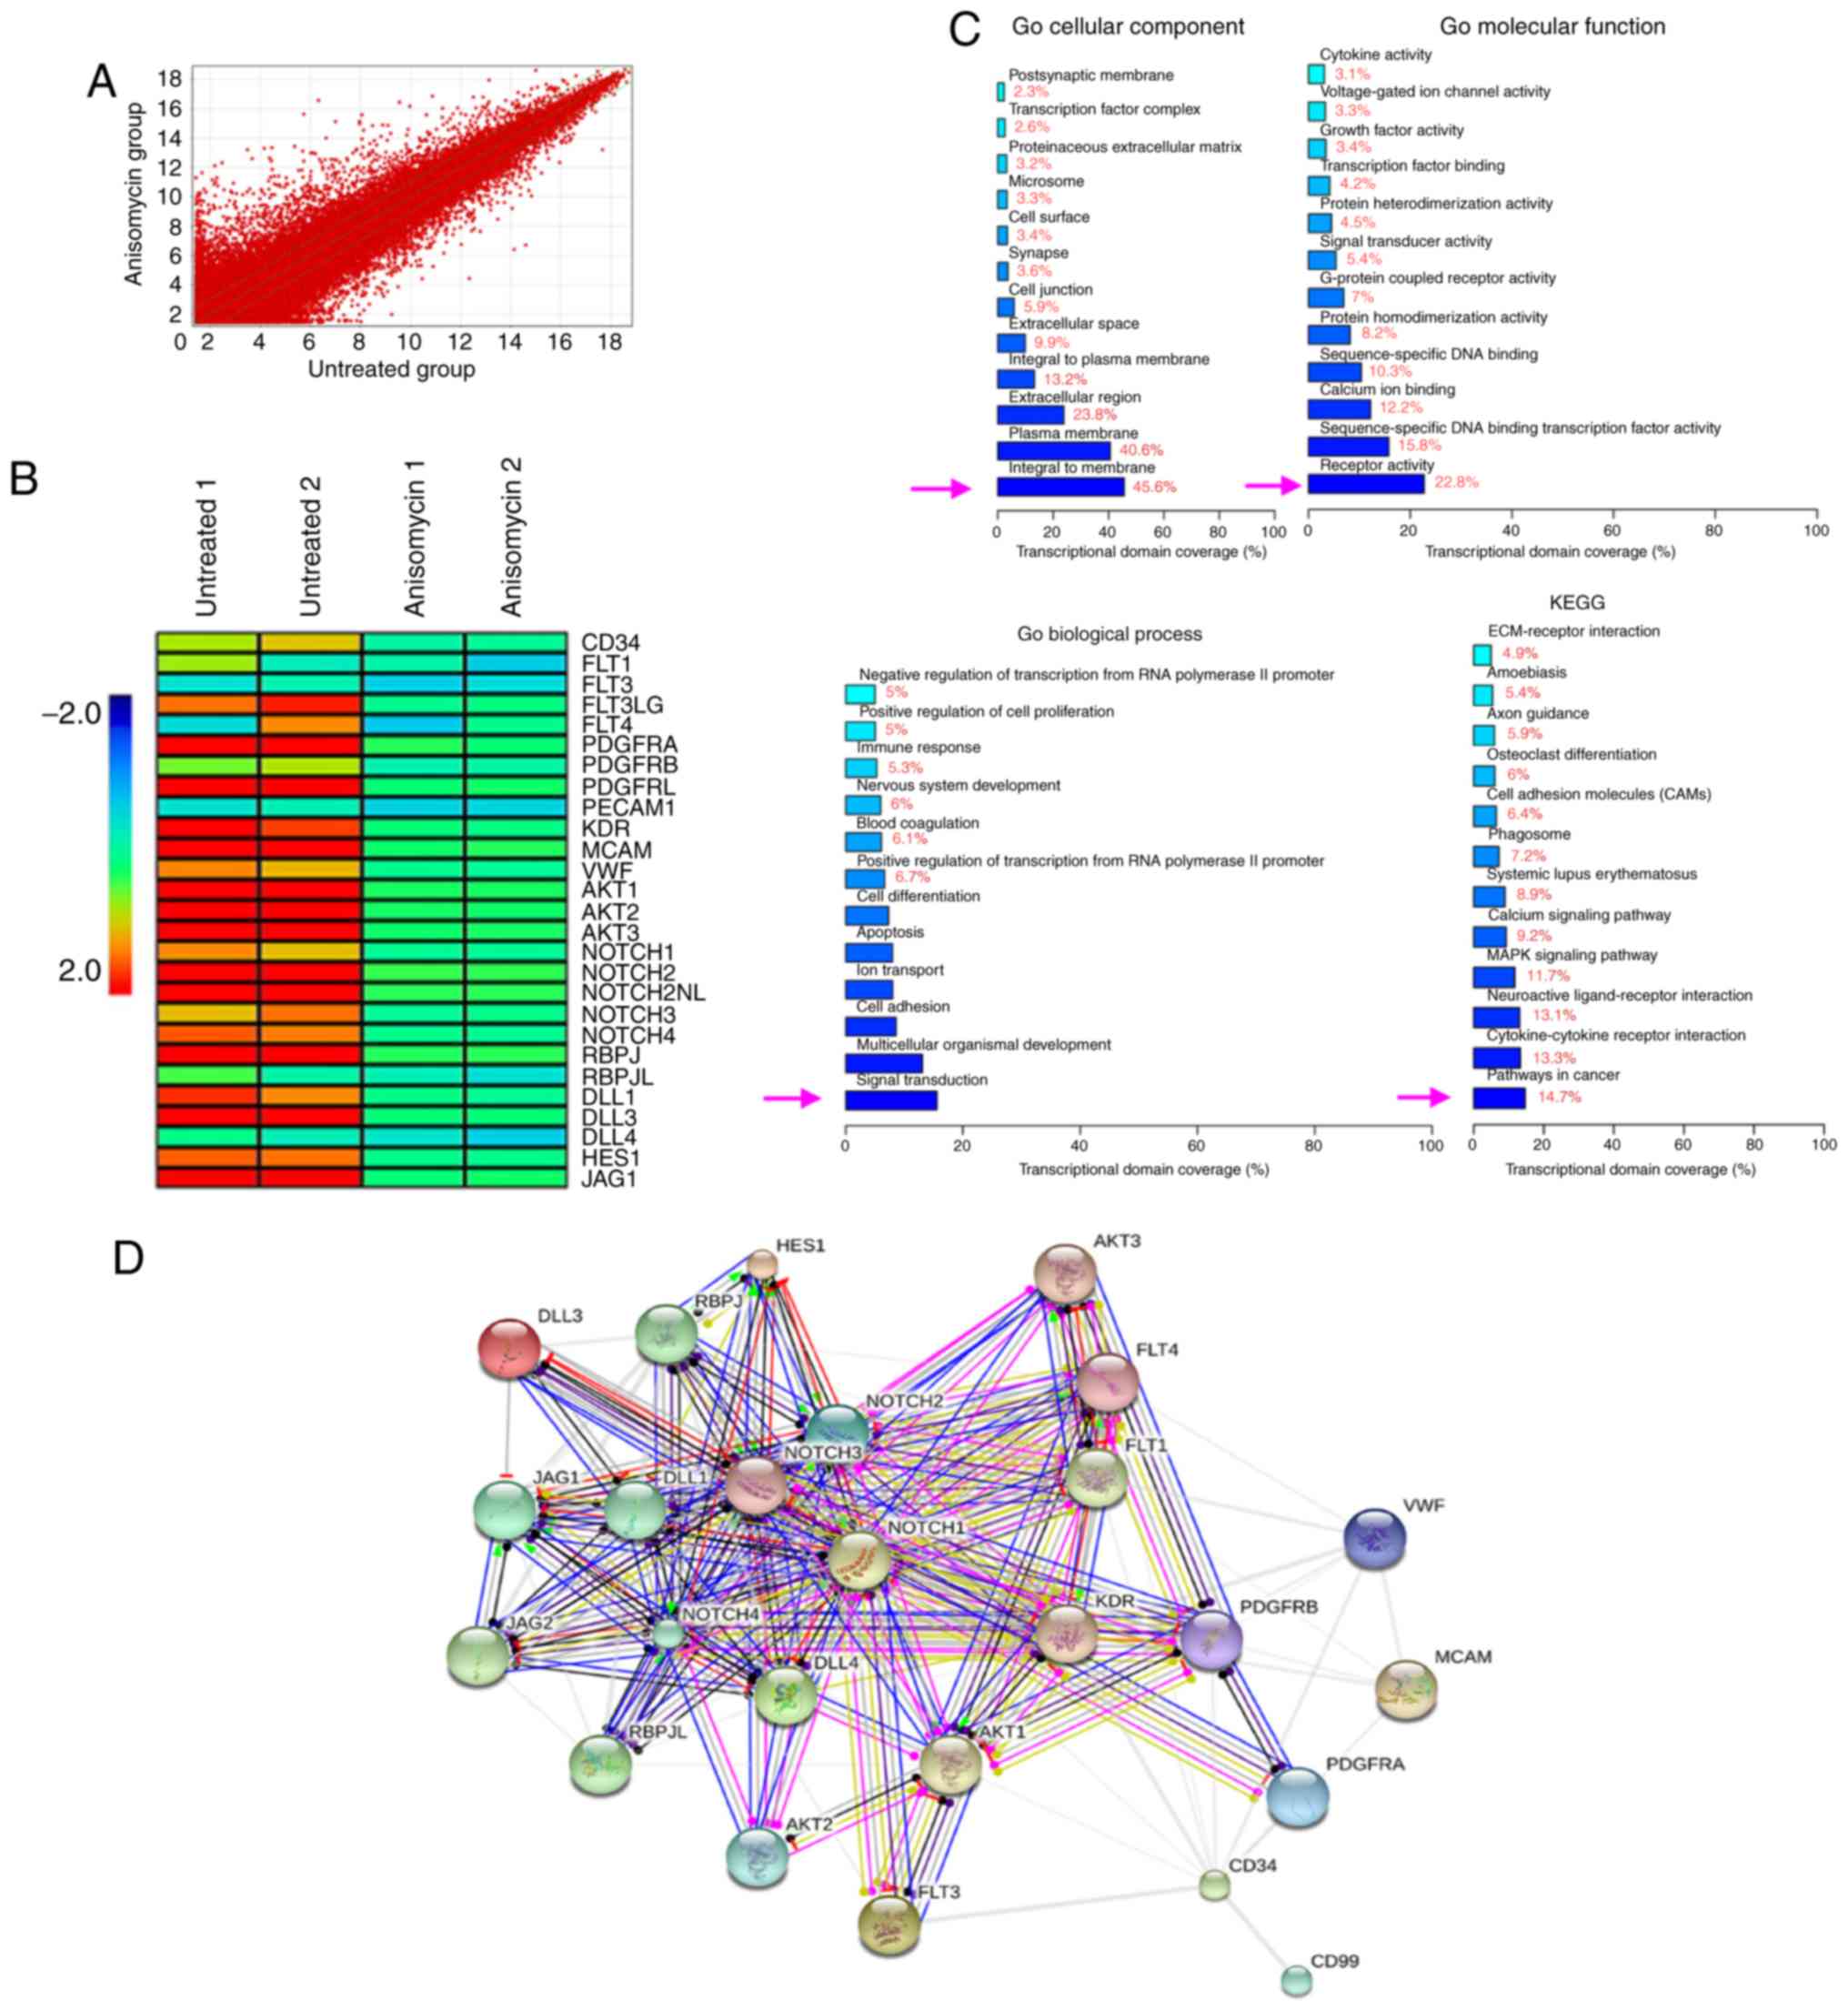
Using cDNA microarrays, changes in the expression
profiles of a total of 14,740 genes were identified between the
anisomycin-treated and the untreated groups (Fig. 6A). Among them, the mRNA expression
levels of 1,797 genes changed significantly following treatment
with anisomycin in CD44+/CD133+ HuOCSCs. The
results indicated that the expression of vascular endothelial cell
markers, platelet-derived growth factors (PDGFs), Notch pathway
components, and 27 tumour angiogenesis-related genes, all showed
significant downregulation (Fig.
6B; Table II). GO analysis
revealed that in terms of cellular components, the most significant
differences in gene expression were observed for genes included in
the 'integral to membrane' section (Fig. 6C). In terms of molecular function,
the most significant differences in gene expression were observed
for genes included in the 'receptor activity' section (Fig. 6C). In terms of biological process,
the most significant differences in gene expression were observed
for genes included in the 'signal transduction' section (Fig. 6C). In addition, with regards to
KEGG analysis, the most significant differences in gene expression
between the anisomycin-treated and untreated groups were observed
for genes included in the 'pathways in cancer' and
'cytokine-cytokine receptor interaction' sections (Fig. 6C). Further analysis with the STRING
bioinformatics tool (https://string-db.org/) identified a network of
interactions among angiogenesis-related proteins. The software
predictions indicated that the vascular endothelial cell marker,
PDGFs, Notch pathway components, and the proteins encoded by 27
angiogenesis-related genes were intrinsically interrelated, with
multiple predicted interactions between them (Fig. 6D). These data indicated that
anisomycin significantly inhibited the expression of multiple
angiogenesis-related genes in ovarian cancer stem cells.
| Table IIResults of angiogenesis-related genes
from the cDNA microarray analysis. |
Table II
Results of angiogenesis-related genes
from the cDNA microarray analysis.
| Genbank accession
no. | Gene symbol | Fold change
(Anisomycin/Untreated) | Official full
name | Genomic
coordinates |
|---|
| NM_001025109 | CD34 | 0.113 | CD34 molecule |
chr1:208062091-208062032 |
| NM_001160031 | FLT1 | 0.181 | fms-related
tyrosine kinase 1 |
chr13:28979986-28979927 |
| NM_004119 | FLT3 | 0.543 | fms-related
tyrosine kinase 3 |
chr13:28578051-28577993 |
| NM_001459 | FLT3LG | 0.032 | fms-related
tyrosine kinase 3 ligand |
chr19:49979743-49979802 |
| AB209637 | FLT4 | 0.066 | fms-related
tyrosine kinase 4 |
chr5:180046720-180046661 |
| NM_006206 | PDGFRA | 0.002 | platelet-derived
growth factor receptora |
chr4:55163989-55164048 |
| NM_002609 | PDGFRB | 0.156 | platelet-derived
growth factor receptorb |
chr5:149493523-149493464 |
| NM_006207 | PDGFRL | 0.006 | platelet-derived
growth factor receptor-like |
chr8:17500476-17500535 |
| NM_000442 | PECAM1 | 0.520 |
platelet/endothelial cell adhesion
molecule 1 |
chr17:62400603-62400544 |
| | | | |
| NM_002253 | KDR | 0.016 | kinase insert
domain receptor |
chr4:55945456-55945397 |
| NM_006500 | MCAM | 0.002 | melanoma cell
adhesion molecule |
chr11:119180061-119180002 |
| NM_000552 | VWF | 0.065 | von Willebrand
factor |
chr12:6058242-6058183 |
| NM_005163 | AKT1 | 0.003 | AKT
serine/threonine kinase 1 |
chr14:105236034-105235975 |
| NM_001626 | AKT2 | 0.004 | AKT
serine/threonine kinase 2 |
chr19:40738762-40738703 |
| NM_005465 | AKT3 | 0.003 | AKT
serine/threonine kinase 3 |
chr1:243665260-243665201 |
| NM_017617 | NOTCH1 | 0.067 | notch receptor
1 |
chr9:139389823-139389764 |
| NM_024408 | NOTCH2 | 0.001 | notch receptor
2 |
chr1:120454917-120454858 |
| NM_203458 | NOTCH2NL | 0.001 | notch 2 N-terminal
like |
chr1:145281999-145282058 |
| NM_000435 | NOTCH3 | 0.059 | notch receptor
3 |
chr19:15270548-15270489 |
| NM_004557 | NOTCH4 | 0.043 | notch receptor
4 |
chr6:32162683-32162624 |
| NM_203284 | RBPJ | 0.001 | recombination
signal binding protein for immunoglobulin κ J region |
chr4:26432686-26432745 |
| NM_014276 | RBPJL | 0.300 | recombination
signal binding protein for immunoglobulin κ J region-like |
chr20:43942760-43943087 |
| NM_005618 | DLL1 | 0.037 | δ-like canonical
Notch ligand 1 |
chr6:170591701-170591642 |
| NM_203486 | DLL3 | 0.013 | δ-like canonical
Notch ligand 3 |
chr19:39998477-39998536 |
| NM_019074 | DLL4 | 0.394 | δ-like canonical
Notch ligand 4 |
chr15:41229655-41229714 |
| NM_005524 | HES1 | 0.044 | hes family bHLH
transcription factor 1 |
chr3:193854276-193854463 |
| NM_000214 | JAG1 | 0.007 | jagged canonical
Notch ligand 1 |
chr20:10619120-10619061 |
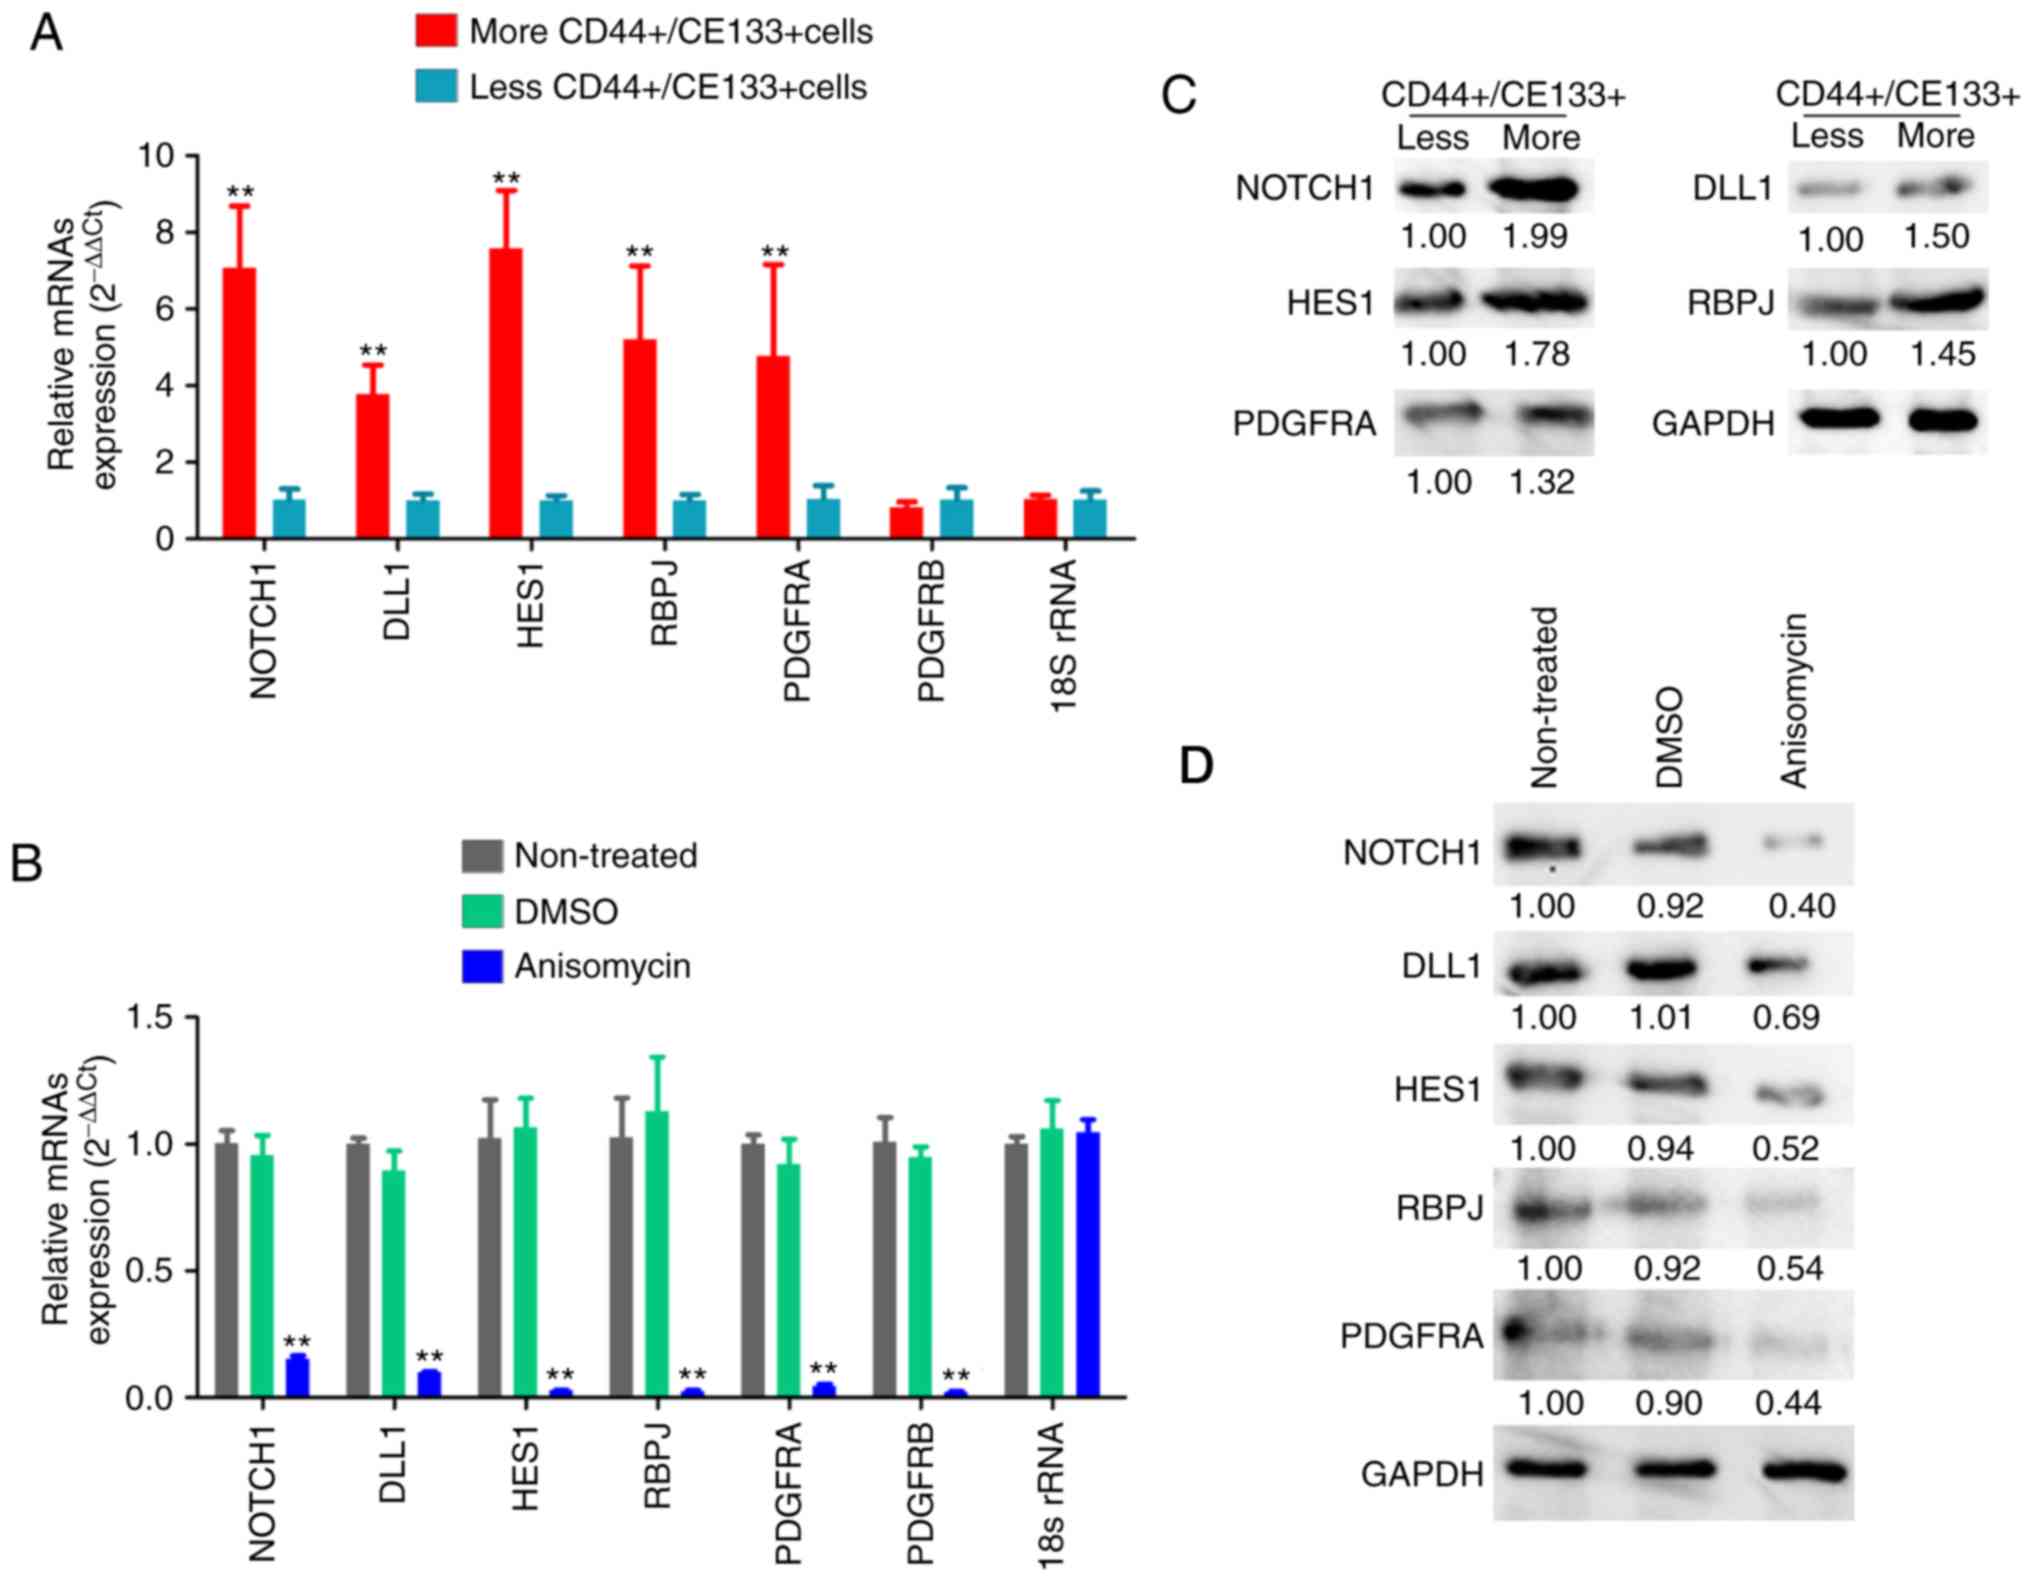
Subsequently, the expression levels of the Notch
pathway components and PDGF receptors were examined by qPCR and
western blotting. qPCR results demonstrated that the mRNA
expression levels of key factors of the Notch pathway (Notch-1,
Dll1, Hes1 and RBPJ) and PDGFRA were significantly increased in
ovarian cancer tissues from P2 patient with more
CD44+/CD133+ HuOCSCs compared with those from
P4 patient with less CD44+/CD133+ HuOCSCs
(Fig. 7A). The results from the
western blot analysis were similar those of qPCR (Fig. 7C). However, after
CD44+/CD133+ HuOCSCs were treated with
anisomycin, the results of qPCR and western blot analyses revealed
that the expression levels of key factors of the Notch pathway
(Notch-1, Dll1, Hes1 and RBPJ) and PDGFRA and PDGFRB in the
anisomycin-treated cells were significantly decreased compared with
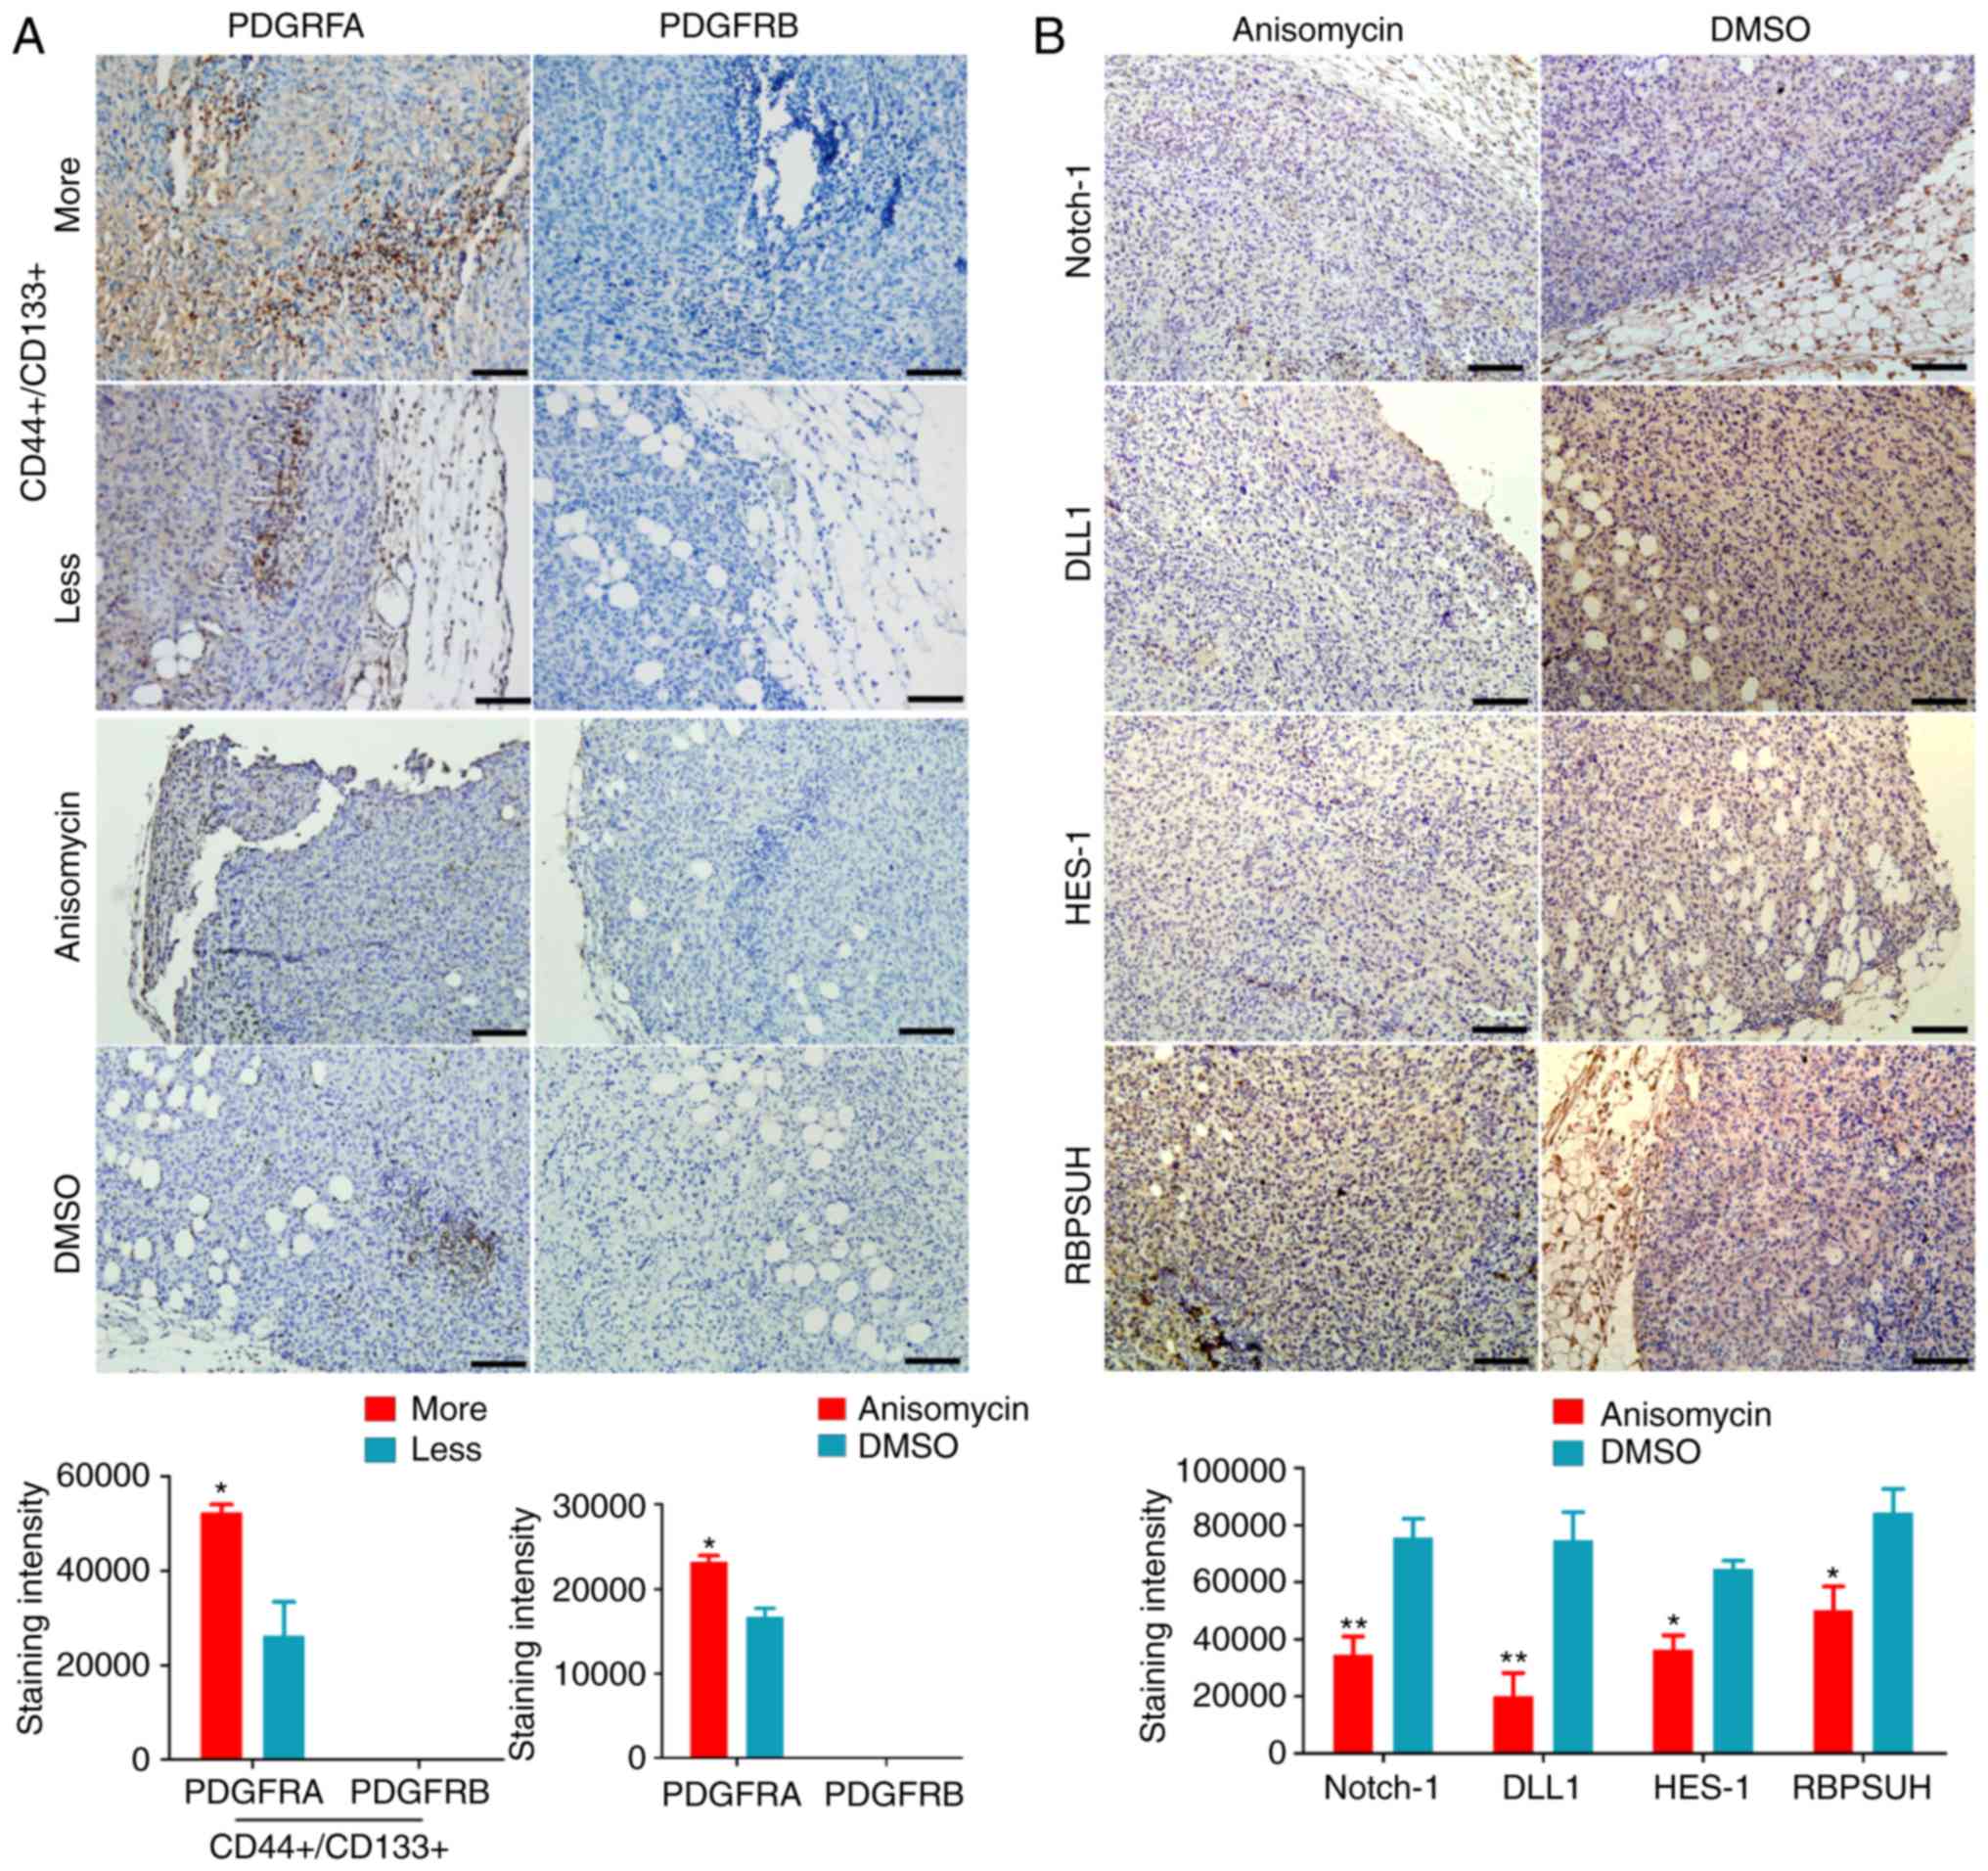
those in the DMSO-treated and non-treated groups (Fig. 7B and D). In addition,
immunohistochemical staining indicated that, firstly, PDGFRA was
highly expressed in ovarian cancer tissues with more
CD44+/CD133+HuOCSCs compared with tissues
with less CD44+/CD133+ HuOCSCs (Fig. 8A); PDGFRB was mostly undetectable
in both groups (Fig. 8A).
Secondly, in the xenograft tumours of nude mice, the expression
levels of key factors of the Notch pathway and PDGFRA were
significantly increased in the tumours formed by anisomycin-treated
HuOCSCs compared with those in tumours formed by DMSO-treated cells
(Fig. 8B). The present results
suggested that anisomycin significantly inhibited the activation of
the Notch pathway and PDGFRs in HuOCSCs.
Anisomycin attenuates the molecular
sponge effect in the lncRNA-Meg3/miR-421/PDGFRA axis
Through in-depth analysis of the cDNA microarray
data, it was revealed that the expression levels of lncRNA-Meg3 in
the anisomycin-treated group were significantly lower compared with
that in the control group (Fig.
9A). Furthermore, qPCR results suggested an opposite trend in
expression between lncRNA-Meg3 and miR-421 expression levels in
both tumour samples of patients and subcutaneous xenograft tumour
tissues of nude mice (Fig. 9B and
C). In addition, after HuOCSCs were treated with anisomycin,
their endogenous miR-421 expression levels were significantly
higher compared with that of control cells (Fig. 9D).
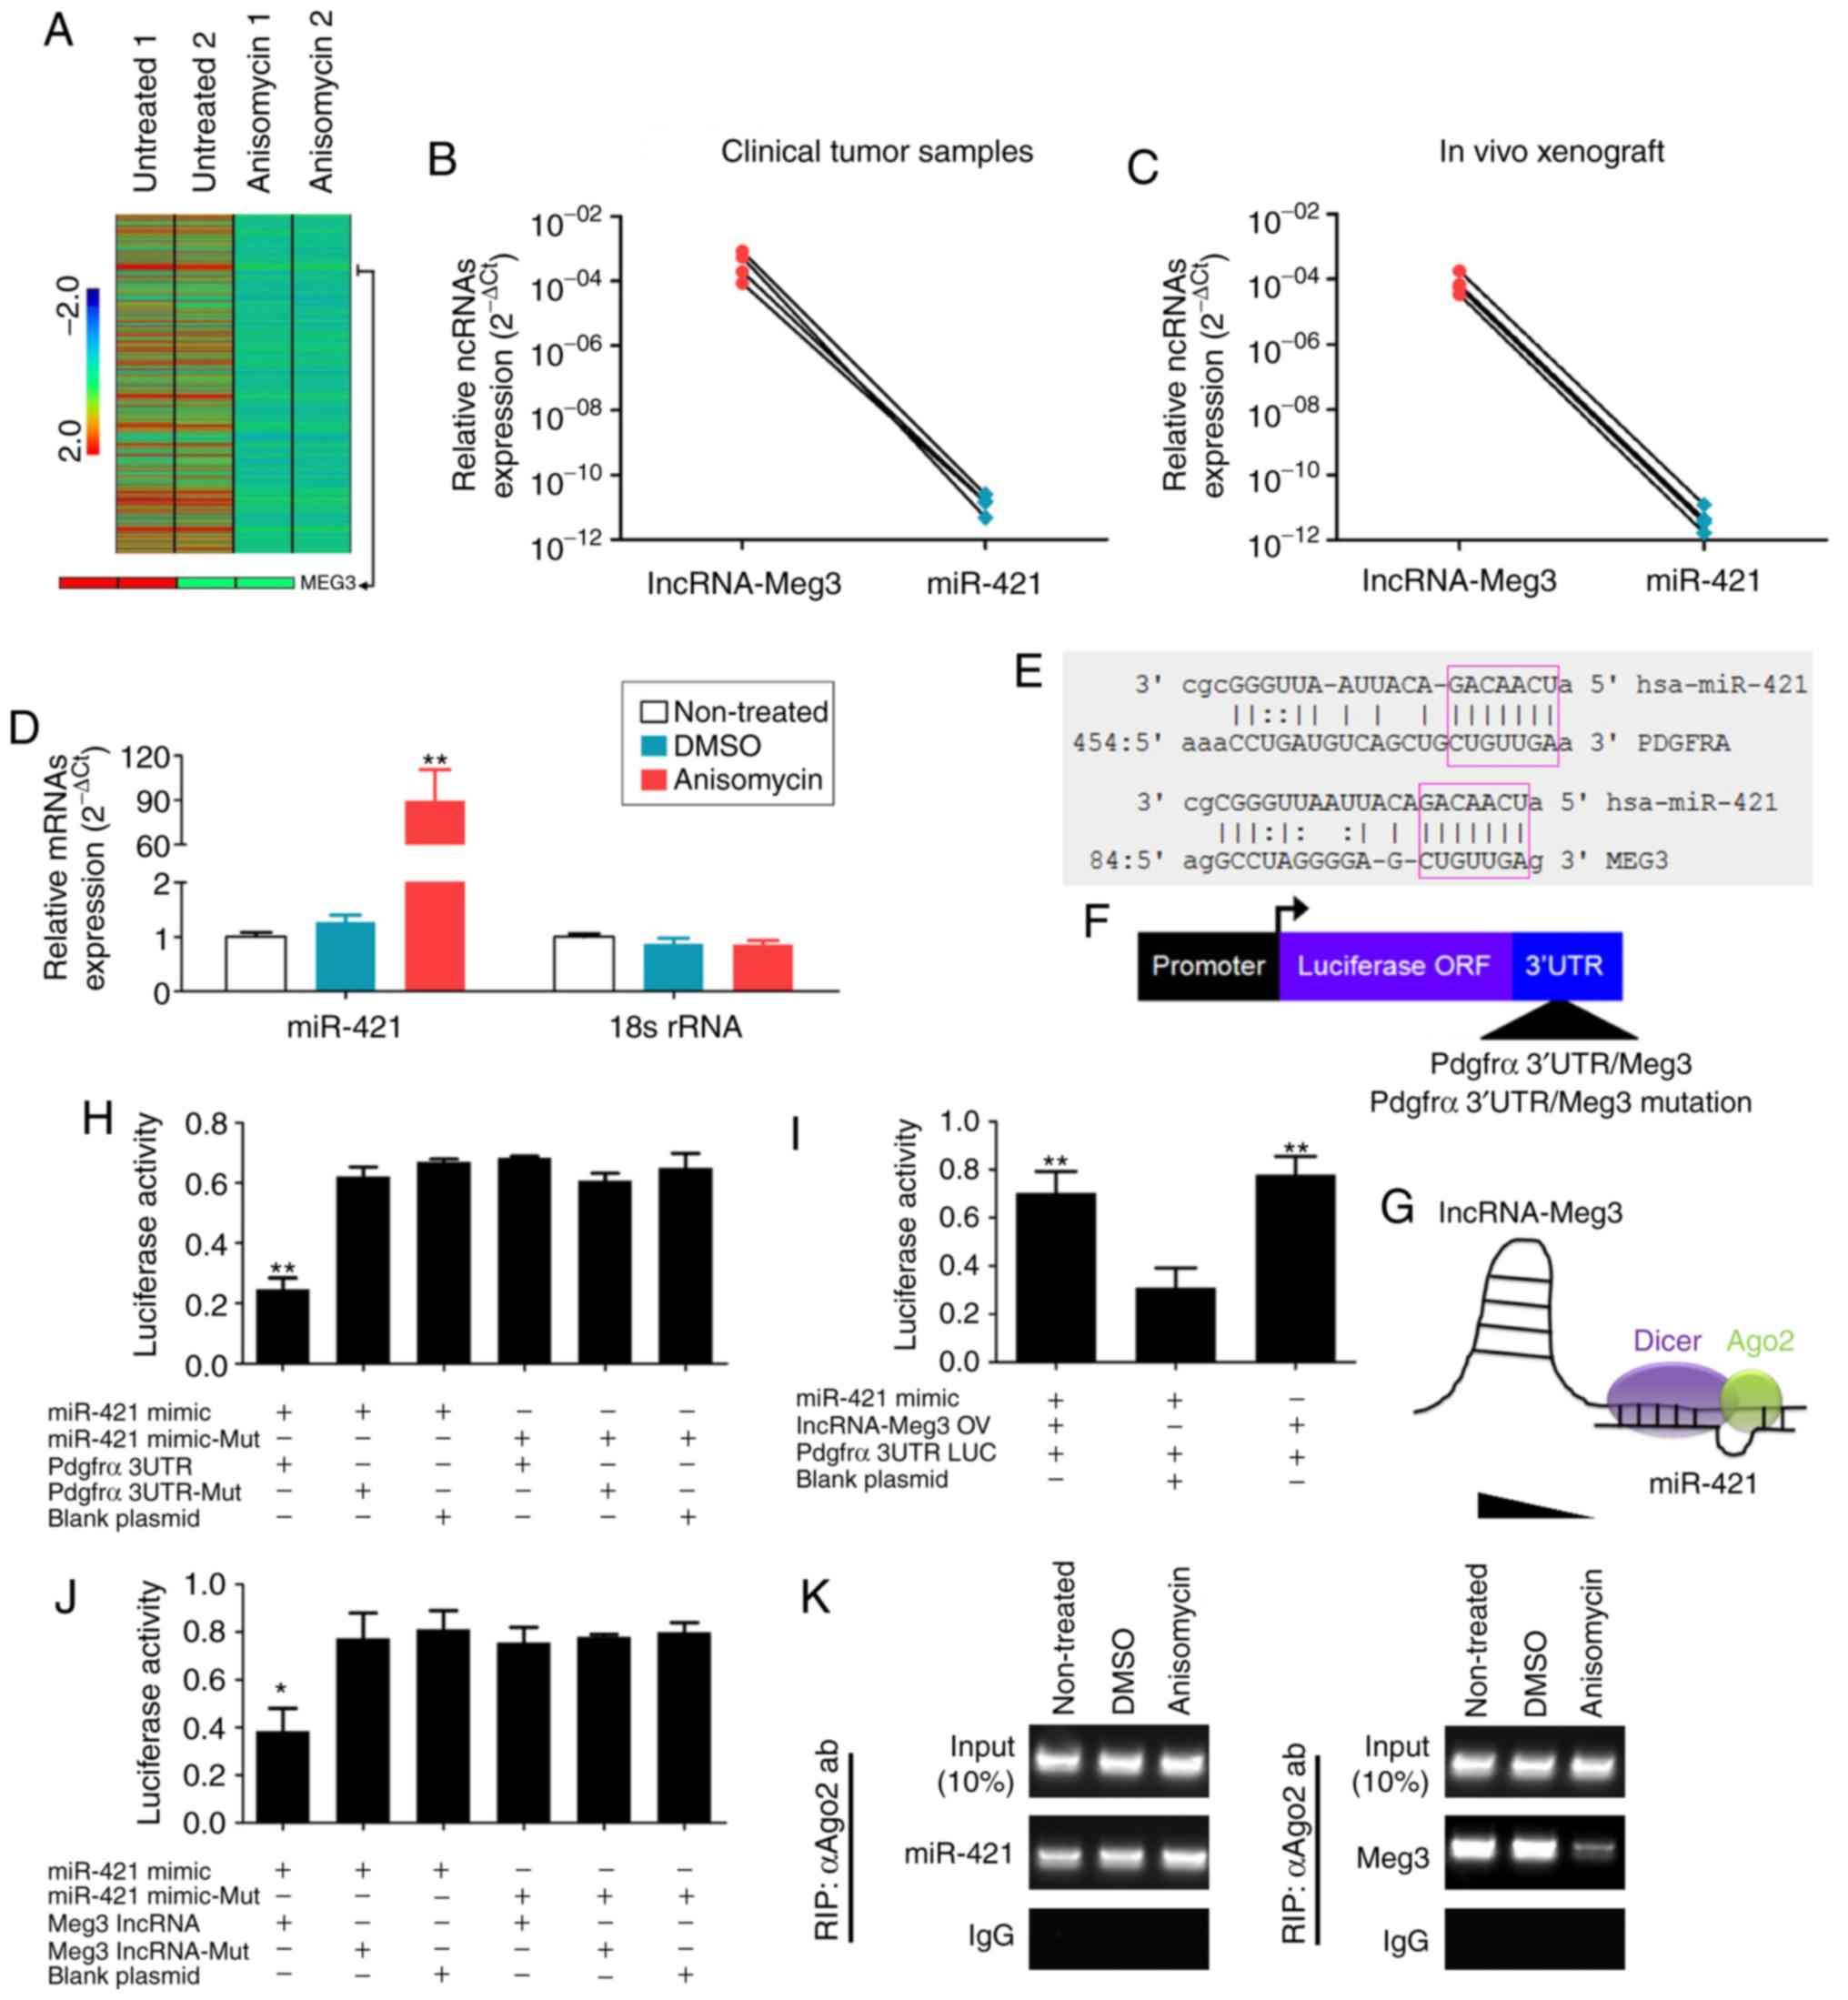 | Figure 9Anisomycin attenuates the molecular
sponge effect in the lncRNA-Meg3/miR-421/PDGFRA axis. (A) Heatmap
showing that the expression of lncRNA-Meg3 in the
anisomycin-treated group was significantly lower than that of the
control group. (B) Expression levels in clinical tumour samples and
(C) in xenograft tumours suggest an inverse trend in expression for
lncRNA-Meg3 and miR-421. (D) Expression levels of miR-421 in
HuOCSCs following anisomycin treatment. **P<0.01 vs.
non-treated (n=4). (E) Schematic of the complementary sites of
mature miR-421 and the 3'UTR of lncRNA-Meg3 and PDGFRA mRNA. (F)
Schematic of the structure of luciferase reporter plasmids. (G) The
molecular sponge effect of lncRNA-Meg3/miR-421/PDGFRA. (H-J)
Results of the luciferase reporter assays. **P<0.01
vs. blank plasmid (n=3). (K) RIP results revealed that the binding
between Meg3 and Ago2 decreased significantly following treatment
of HuOCSCs with anisomycin. lncRNA, long non-coding RNA; Meg3,
maternally expressed 3; miR, microRNA; PDGFRA, platelet derived
growth factor receptor α; HuOCSCs, human ovarian cancer stem cells;
RIP, RNA immunoprecipitation; Ago2, argonaute 2; ORF, open reading
frame; UTR, untranslated region; mut, mutant; IgG, immunoglobulin
G. |
Next, the effect of miR-421 overexpression was
investigated in HuOCSCs. First, RT-qPCR results confirmed that
miR-421 was successfully overexpressed following mimics
transfection, compared with a mutant control or untransfected cells
(Fig. S1). Following exogenous
miR-421 overexpression in HuOCSCs, RT-qPCR results indicated that
both expression levels of lncRNA-Meg3 and PDGFRA were significantly
reduced compared with control-transfected cells (Fig. S1). According to bioinformatics
analysis using TargetScanHuman (Version 7.0; http://www.targetscan.org), the mature miR-421
complementarily pairs with 7 bases at a specific site (97-104 bp)
of lncRNA-Meg3, suggesting that lncRNA-Meg3 may be one of the
targets of miR-421 (Fig. 9E). At
the same time, it was also identified that the mature miR-421
complementarily pairs with 7 bases at a specific site (471-477 bp)
of the 3′UTR of the PDGFRA gene, suggesting that PDGFRA may also be
one of the targets of miR-421 (Fig.
9E). To examine the potential regulatory effect of miR-421 on
lncRNA-Meg3 and PDGFRA, luciferase reporter plasmids were
constructed for these two genes (Fig.
9F). The results of the luciferase reporter assay demonstrated
that when miR-421 was overexpressed in cells, the luciferase
activity of the PDGFRA 3′UTR reporter was significantly decreased,
while the other plasmid combinations did not affect luciferase
activity (Fig. 9H). In the
aforementioned system, the luciferase activity did not decrease
significantly after overexpression of lncRNA-Meg3 (Fig. 9I). However, when miR-421 was
overexpressed in cells, expression of the luciferase gene carrying
wild-type Meg3 was significantly decreased, while the other plasmid
combinations did not affect luciferase activity (Fig. 9J). Finally, the results of RIP
assay indicated that binding between Meg3 and Ago2 decreased
significantly following treatment of HuOCSCs with anisomycin;
however, there was no significant change in the binding level
between miR-421 and Ago2 (Fig. 9G and
K). The present results suggested that lncRNA-Meg3 and PDGFRA
may be potential targets of miR-421; anisomycin downregulated the
expression of endogenous lncRNA-Meg3, leading to redundant miR-421,
which subsequently inhibited PDGFRA expression.
Overexpression of miR-421 significantly
enhances the inhibitory effect of anisomycin on HuOCSCs by
suppressing the activity of the Notch-1 pathway
MTT assay results showed that treating
miR-421-overexpressing HuOCSCs with anisomycin for 24 h resulted in
a significant inhibition of cell proliferation; the inhibition rate
of proliferation was significantly higher compared with that of
HuOCSCs overex-pressing miR-421 alone or HuOCSCs treated with
anisomycin alone (Fig. 10A). qPCR
results demonstrated that, following treatment of
miR-421-overexpressing HuOCSCs with aniso-mycin for 24 h, the mRNA
expression levels of endogenous lncRNA-Meg3, PDGFRA, Notch1, HES1
and RBPJ were significantly decreased; the expression levels were
significantly lower than those of HuOCSCs overexpressing miR-421
alone or HuOCSCs treated with anisomycin alone (Fig. 10B). These results suggested that
overexpression of miR-421 significantly enhanced the inhibitory
effect of anisomycin on HuOCSCs by suppressing the activity of the
Notch-1 pathway.
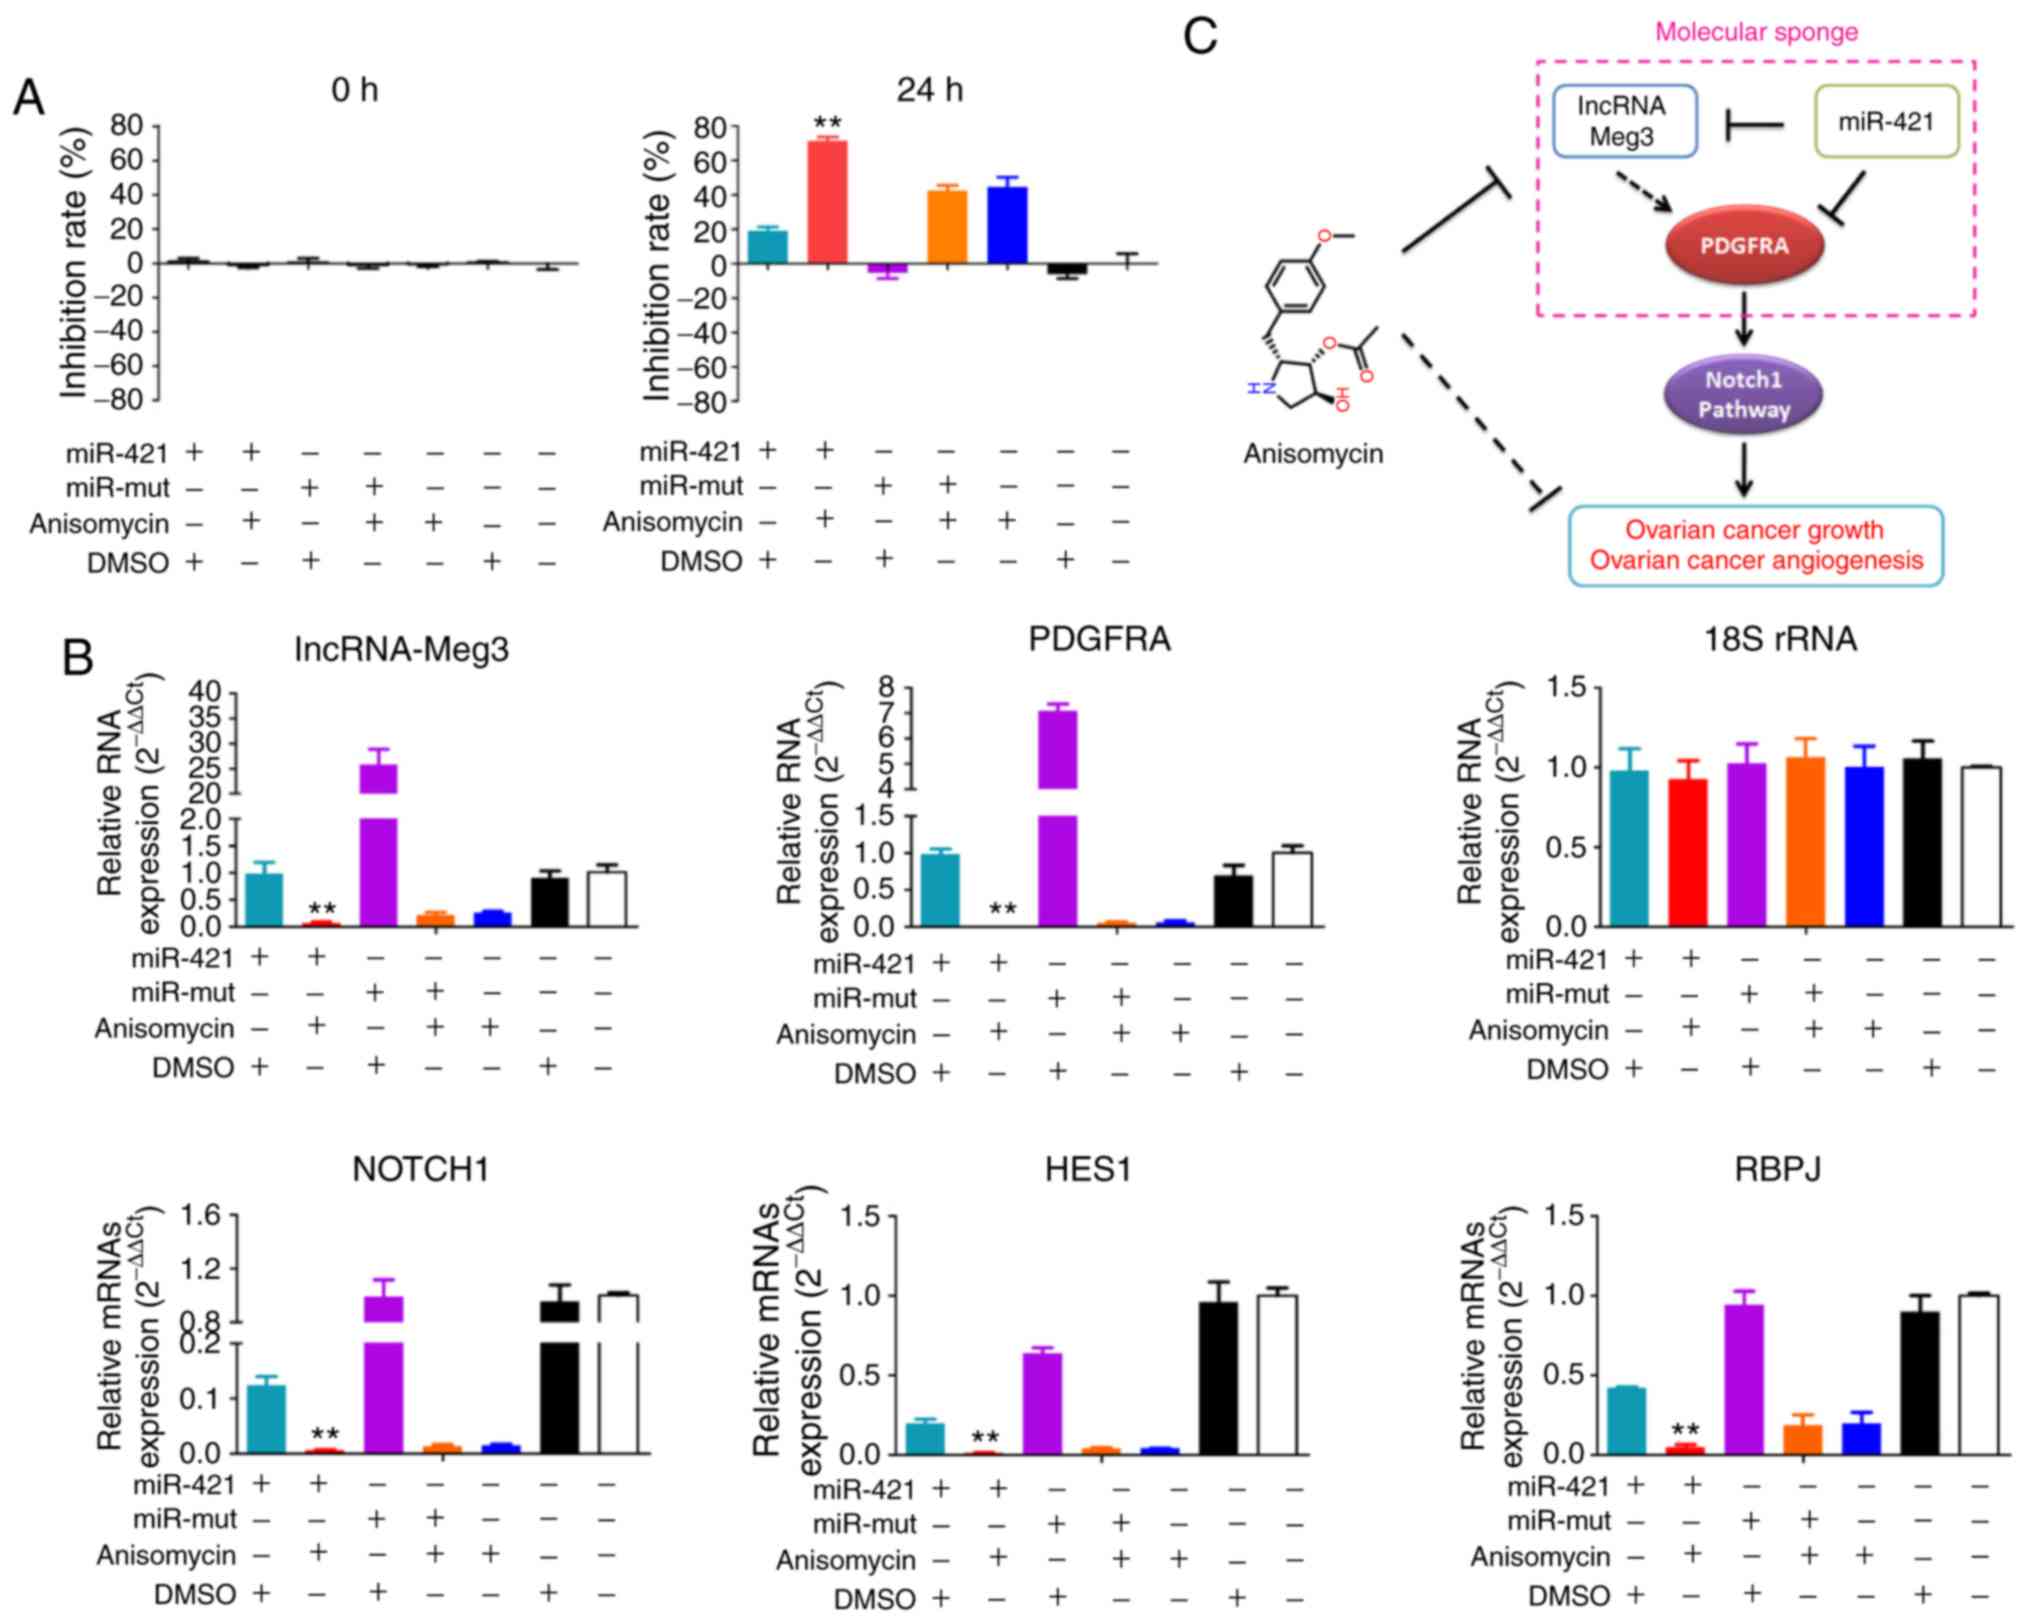 | Figure 10miR-421 enhances the inhibitory
effect of anisomycin on HuOCSCs. (A) MTT results showed that
overexpression of miR-421 and treatment with anisomycin resulted in
more severe proliferation inhibition of HuOCSCs, than either
treatment alone. **P<0.01 vs. DMSO group (n=4). (B)
Quantitative PCR results showed that overexpression of miR-421 and
treatment with anisomycin decreased the expression of lncRNA-Meg3,
PDGFRA, Notch1, HES1 and RBPJ. **P<0.01 vs. DMSO
group (n=4). (C) Schematic of the proposed molecular mechanism of
anisomycin inhibition of the activity and angiogenesis of ovarian
cancer cells, by attenuating the molecular sponge effect in the
lncRNA-Meg3/miR-421/PDGFRA axis. miR, microRNA; HuOCSCs, human
ovarian cancer stem cells; lncRNA, long non-coding RNA; Meg3,
maternally expressed 3; PDGFRA, platelet derived growth factor
receptor α; HES1, hes family bHLH transcription factor 1; RBPJ,
recombination signal binding protein for immunoglobulin κ J region;
mut, mutant. |
Discussion
Cancer stem cells exhibit a high proliferative and
invasive activity and resistance to various chemotherapeutic drugs,
which are important causes of tumour metastasis and recurrence
(13,25-28).
The discovery of cancer stem cells put forward new demands on
tumour chemotherapy. Since cancer stem cells are resistant to most
traditional chemotherapeutic drugs, such as cisplatin and
paclitaxel, it is necessary to develop more effective drugs for
tumour chemotherapy (21,29-31).
Anisomycin has been confirmed to have significant inhibitory
effects on a variety of solid tumours and is a promising
chemotherapeutic drug candidate (7-11).
Our previous report has revealed that anisomycin inhibits the
proliferation and invasion of ovarian cancer stem cells by
enhancing the activity of lncRNA-BACE1-AS and increasing the
release of endogenous Aβ42 (7).
The present study suggested that anisomycin may have the potential
to inhibit cancer stem cells. Based on the existing reports
(7-11), it was speculated that the
inhibitory effect of anisomycin on cancer stem cells may depend on
multi-target regulation. Therefore, it is meaningful to explore its
in-depth mechanism. The present study first compared the difference
in gene expression profiles between anisomycin-treated ovarian
cancer stem cells and control cells using cDNA microarrays.
Considering that the effect of anisomycin on tumour angiogen-esis
had not been reported previously, signalling pathways and molecules
related to tumour angiogenesis were selected as the main research
focus. The cDNA microarray results suggested that anisomycin
treatment significantly inhibited the expression of Notch pathway
components and of vascular endothelial cell markers. This result
strongly suggested the molecular biology basis for the inhibitory
effect of anisomycin on tumour angiogenesis. In order to confirm
this hypothesis in vitro, MTT, Transwell and 3-dimensional
angiogenesis assays were performed in vitro; in vivo,
an angiogenesis assay in transgenic zebrafish embryos and xenograft
tumour experiments in nude mice were performed. The results of
these experiments demonstrated that anisomycin could effectively
inhibit the angiogenic ability of ovarian cancer stem cells in
vitro and in vivo, thus confirming the hypothesis that
anisomycin can effectively inhibit angiogenesis in ovarian
cancer.
Subsequently, the present study aimed to
investigate how anisomycin inhibited the expression of the Notch-1
pathway components. After screening the data from the cDNA
micro-array analysis, the present study further focused on members
of the PDGFR family. In the anisomycin-treated group, the
expression of the PDGFRs was significantly decreased. PDGF is a
basic protein stored in the α particles in platelets and is a low
molecular weight mitogen (32-34).
PDGF can stimulate multiple cell types that are arrested in the
G0/G1 phase, including fibroblasts, glial cells and smooth muscle
cells, to enter the proliferative cycle (33-35).
PDGFRs are receptors for the PDGF family, located on the surface of
the cell membrane and they belong to the family of tyrosine kinase
receptors, with molecular weights of 170-180 kDa. There are two
subtypes of PDGFR, namely, PDGFRA and PDGFRB (32-34).
PDGFR is a peptide chain consisting of a domain specifically
recognized by PDGF at the extracellular N-terminus, an intermediate
hydrophobic domain of a single-stranded transmembrane sequence, and
a domain with tyrosine protein kinase activity at the intracellular
C-terminus (32-34). PDGF binds to PDGFR on the cell
membrane to form a dimeric complex, activates autophosphorylation
of the tyrosine residues of the intracellular domain, or promotes
phosphorylation of tyrosine residues that activate specific target
proteins, thereby transmitting signals into the cell, activating
downstream signalling pathways, and directly inducing cell
proliferation, differentiation, growth and development (35,36).
Although both PDGFRA and PDGFRB bind to PDGF, their affinity
differs greatly (32-34). The α subunit has a high affinity
for both the a chain and b chain of PDGF; the β subunit has a high
affinity only for the b chain (32-34).
Therefore, the α subunit can bind to PDGF-aa, PDGF-ab, and PDGF-bb,
while the β subunit can only bind to PDGF-bb and PDGF-ab (32-34).
It has been reported that, in tumour cells, PDGF binds to PDGFR to
form a dimer, which induces tumour cell proliferation, invasion,
metastasis and angiogenesis, by activating the downstream Notch-1
pathway, making it a very important signalling activator in tumour
angiogenesis events (32-34,37-39).
Using bioinformatics analysis, the present study systematically
predicted the correlation among Notch-1 signalling molecules,
angiogenesis markers and PDGFR family members, and mapped the
protein interaction network. The present results confirmed that
there was a close relationship among the three components.
Next, the present study investigated whether there
was a direct relationship between the inactivation of PDGFR and
anisomycin. Bioinformatics analysis predicted that the PDGFRA gene
may be one of the potential target genes of miR-421. The expression
levels of miR-421 were significantly increased in ovarian cancer
stem cells treated with anisomycin, while PDGFRA was significantly
decreased in anisomycin-treated cells, due to the RNA interfering
effect induced by miR-421. Furthermore, the expression levels of
endogenous lncRNA-Meg3 was significantly decreased in ovarian
cancer stem cells following treatment with anisomycin. Then, the
present study investigated the relationship between lncRNA-Meg3,
PDGFRA and miR-421. Bioinformatics analysis predicted that
lncRNA-Meg3 may also be a potential target gene of miR-421.
Therefore, miR-421 could silence both lncRNA-Meg3 and PDGFRA. This
regulatory network would be in agreement with the lncRNA-miRNA
'molecular sponge' effect (12,13,15,27).
An increasing number of studies have found that
there is some interaction between lncRNAs and miRNAs, and lncRNAs
can exert their regulatory effects on the miRNA network through the
competitive endogenous RNA (ceRNA) effect (13,30).
The ceRNA theory is based on classical miRNA regulation mechanisms.
miRNAs inhibit translation of target genes primarily by reducing
mRNA stability. In a cell, a gene is often regulated by multiple
miRNAs, and a miRNA can also regulate the expression of multiple
genes. The ceRNA theory proposes that lncRNAs within cells carry
miRNA binding sites of different types and amounts, and RNAs
carrying the same miRNA binding sites are called ceRNAs. ceRNAs can
compete with one another for binding to the same miRNA, reducing
the concentration of free miRNAs, thereby reducing the inhibition
efficiency of the miRNA to target genes to some extent (40-44).
Functional studies have shown that lncRNAs can act as ceRNAs
(13,17,40,44,45).
Each ceRNA in a cell may contain a large number of different miRNA
binding sites that can compete for binding to multiple miRNAs
(40-44). At the same time, since each miRNA
regulates a variety of different target genes, each ceRNA can
achieve a 'cross-talk' with a variety of gene regulation processes
through the regulatory network of miRNAs (40-44).
In this process, lncRNAs can act like 'sponges' to adsorb different
miRNAs and participate in the regulatory network of miRNAs. This
complex function has been termed as the 'molecular sponge effect'
of lncRNAs (40-44).
There have been many reports on the functions of
lncRNA-Meg3, PDGFRA and miR-421 in tumours, suggesting that these
three molecules have very important regulatory effects on tumour
proliferation and invasion (35,37,45-52).
However, there have been no reports discussing the three in
combination. The present study found an intrinsic association
between lncRNA-Meg3, PDGFRA and miR-421. A high expression of
lncRNA-Meg3 is present in ovarian cancer cells, which binds to and
consumes endogenous miRNA-421 and blocks its inhibitory effect on
target genes. Thus, PDGFRA can be stably expressed. However, after
ovarian cancer stem cells are treated with anisomycin, the
expression of lncRNA-Meg3 is inhibited by anisomycin, attenuating
its molecular sponge effect on miRNA-421; a large amount of miR-421
can then specifically bind to the target gene PDGFRA and inhibit
its expression (Fig. 10C).
In summary, the present study has elucidated a
novel mechanism underlying the anisomycin-mediated inhibition of
angiogenesis in ovarian cancer, by targeting the molecular sponge
effect in the lncRNA-Meg3/miR-421/PDGFRA axis.
Supplementary Data
Acknowledgments
We are very grateful to Professor Chuan Chen of the
Shanghai Geriatric Institute of Chinese Medicine for his guidance
on this study.
Funding
This work was supported by the Shanghai Natural
Science Foundation (grant no. 16ZR1434000), the Development Fund
for Shanghai Talents (grant no. 2017054), the Fund for Xinglin
Talents of Shanghai University of Traditional Chinese Medicine
(grant no. 201707081) and the National Natural Science Foundation
of China (grant no. 81973899).
Availability of data and materials
The datasets used or analysed during the current
study are available from the corresponding author on reasonable
request.
Authors' contributions
WY, ZN and SY performed the majority of the
experiments in the study. HP, YH and YX contributed to the analysis
of experimental data. TL contributed to the study design,
manuscript writing and provided experimental funding support.
Ethics approval and consent to
participate
The study involving human tissues was approved by
the Ethics Review Committee of Shanghai Geriatric Institute of
Chinese Medicine of Research in Human Production, authorized by
Shanghai Municipal Government; written informed consent was
provided by all patients, in accordance with The Declaration of
Helsinki. The study involving animals was approved (permit no.
SRCMR20160018) by the Animal Ethics Committee of Shanghai Research
Centre for Model Organisms, and the experimental protocols were in
compliance with the Experimental Animal Regulations of the Ministry
of Science and Technology National Science and Technology
Commission (Beijing, China).
Patient consent for publication
Not applicable.
Competing interests
The authors declare that they have no competing
interests.
References
|
1
|
Jain RK and Carmeliet P: SnapShot: Tumor
angiogenesis. Cell. 149:1408. e14012012. View Article : Google Scholar : PubMed/NCBI
|
|
2
|
Rivera LB and Bergers G: CANCER. Tumor
angiogenesis, from foe to friend. Science. 349:694–695. 2015.
View Article : Google Scholar : PubMed/NCBI
|
|
3
|
Melero-Martin JM and Dudley AC: Concise
review: Vascular stem cells and tumor angiogenesis. Stem Cells.
29:163–168. 2011. View Article : Google Scholar : PubMed/NCBI
|
|
4
|
Kuczynski EA, Vermeulen PB, Pezzella F,
Kerbel RS and Reynolds AR: Vessel co-option in cancer. Nat Rev Clin
Oncol. 16:469–493. 2019. View Article : Google Scholar : PubMed/NCBI
|
|
5
|
Ho IA, Toh HC, Ng WH, Teo YL, Guo CM, Hui
KM and Lam PY: Human bone marrow-derived mesenchymal stem cells
suppress human glioma growth through inhibition of angiogenesis.
Stem Cells. 31:146–155. 2013. View Article : Google Scholar
|
|
6
|
Apte RS, Chen DS and Ferrara N: VEGF in
signaling and disease: Beyond discovery and development. Cell.
176:1248–1264. 2019. View Article : Google Scholar : PubMed/NCBI
|
|
7
|
Chen Q, Liu X, Xu L, Wang Y, Wang S, Li Q,
Huang Y and Liu T: Long non-coding RNA BACE1-AS is a novel target
for anisomycin-mediated suppression of ovarian cancer stem cell
proliferation and invasion. Oncol Rep. 35:1916–1924. 2016.
View Article : Google Scholar : PubMed/NCBI
|
|
8
|
Li Y, Hu J, Song H and Wu T: Antibiotic
anisomycin selectively targets leukemia cell lines and patient
samples through suppressing Wnt/beta-catenin signaling. Biochem
Biophys Res Commun. 505:858–864. 2018. View Article : Google Scholar : PubMed/NCBI
|
|
9
|
Yu C, Xing F, Tang Z, Bronner C, Lu X, Di
J, Zeng S and Liu J: Anisomycin suppresses Jurkat T cell growth by
the cell cycle-regulating proteins. Pharmacol Rep. 65:435–444.
2013. View Article : Google Scholar : PubMed/NCBI
|
|
10
|
Seo BR, Min KJ, Kim S, Park JW, Park WK,
Lee TJ and Kwon TK: Anisomycin treatment enhances TRAIL-mediated
apoptosis in renal carcinoma cells through the down-regulation of
Bcl-2, c-FLIP(L) and Mcl-1. Biochimie. 95:858–865. 2013. View Article : Google Scholar
|
|
11
|
Liu Y, Ge J, Li Q, Gu L, Guo X, Ma ZG and
Zhu YP: Anisomycin induces apoptosis of glucocorticoid resistant
acute lymphoblastic leukemia CEM-C1 cells via activation of
mitogen-activated protein kinases p38 and JNK. Neoplasma.
60:101–110. 2013. View Article : Google Scholar
|
|
12
|
Liu T, Zhang H, Zheng J, Lin J, Huang Y,
Chen J, Yu Z, Guo L, Pan W, Xiong Y and Chen C: SPION-mediated
miR-141 promotes the differentiation of HuAESCs into dopaminergic
neuron-like cells via suppressing lncRNA-HOTAIR. J Cell Mol Med.
22:2299–2310. 2018. View Article : Google Scholar : PubMed/NCBI
|
|
13
|
Liu T, Chi H, Chen J, Chen C, Huang Y, Xi
H, Xue J and Si Y: Curcumin suppresses proliferation and in vitro
invasion of human prostate cancer stem cells by ceRNA effect of
miR-145 and lncRNA-ROR. Gene. 631:29–38. 2017. View Article : Google Scholar : PubMed/NCBI
|
|
14
|
Sarfi M, Abbastabar M and Khalili E: Long
noncoding RNAs biomarker-based cancer assessment. J Cell Physiol.
234:16971–16986. 2019. View Article : Google Scholar : PubMed/NCBI
|
|
15
|
Liu SJ and Lim DA: Modulating the
expression of long non-coding RNAs for functional studies. EMBO
Rep. 19:e469552018. View Article : Google Scholar : PubMed/NCBI
|
|
16
|
Zhu AD, Sun YY, Ma QJ and Xu F: lncRNA-ATB
promotes viability, migration, and angiogenesis in human
micro-vascular endothelial cells by sponging microRNA-195. J Cell
Biochem. 120:14360–14371. 2019. View Article : Google Scholar : PubMed/NCBI
|
|
17
|
Zhao J, Li L, Han ZY, Wang ZX and Qin LX:
Long noncoding RNAs, emerging and versatile regulators of
tumor-induced angiogenesis. Am J Cancer Res. 9:1367–1381.
2019.PubMed/NCBI
|
|
18
|
Sheng SR, Wu JS, Tang YL and Liang XH:
Long noncoding RNAs: Emerging regulators of tumor angiogenesis.
Future Oncol. 13:1551–1562. 2017. View Article : Google Scholar : PubMed/NCBI
|
|
19
|
Sun X, Huang T, Zhang C, Zhang S, Wang Y,
Zhang Q and Liu Z: Long non-coding RNA LINC00968 reduces cell
proliferation and migration and angiogenesis in breast cancer
through up-regulation of PROX1 by reducing hsa-miR-423-5p. Cell
Cycle. 18:1908–1924. 2019. View Article : Google Scholar : PubMed/NCBI
|
|
20
|
Cheng Y, Dai X, Yang T, Zhang N, Liu Z and
Jiang Y: Low long noncoding RNA growth arrest-specific transcript 5
expression in the exosomes of lung cancer cells promotes tumor
angiogenesis. J Oncol. 2019:24761752019. View Article : Google Scholar : PubMed/NCBI
|
|
21
|
Cheng W, Liu T, Wan X, Gao Y and Wang H:
MicroRNA-199a targets CD44 to suppress the tumorigenicity and
multidrug resistance of ovarian cancer-initiating cells. FEBS J.
279:2047–2059. 2012. View Article : Google Scholar : PubMed/NCBI
|
|
22
|
Zhang H, Zheng J, Lin J, Chen J, Yu Z,
Chen C and Liu T: miR-758 mediates oxLDL-dependent vascular
endothelial cell damage by suppressing the succinate receptor
SUCNR1. Gene. 663:1–8. 2018. View Article : Google Scholar : PubMed/NCBI
|
|
23
|
Livak KJ and Schmittgen TD: Analysis of
relative gene expression data using real-time quantitative PCR and
the 2(-Delta Delta C(T)) method. Methods. 25:402–408. 2001.
View Article : Google Scholar
|
|
24
|
Rodriguez-Hernandez A, Brea-Calvo G,
Fernandez-Ayala DJ, Cordero M, Navas P and Sanchez-Alcazar JA:
Nuclear caspase-3 and caspase-7 activation, and poly(ADP-ribose)
polymerase cleavage are early events in camptothecin-induced
apoptosis. Apoptosis. 11:131–139. 2006. View Article : Google Scholar
|
|
25
|
Si Y, Liu J, Shen H, Zhang C, Wu Y, Huang
Y, Gong Z, Xue J and Liu T: Fisetin decreases TET1 activity and
CCNY/CDK16 promoter 5hmC levels to inhibit the proliferation and
invasion of renal cancer stem cell. J Cell Mol Med. 23:1095–1105.
2019. View Article : Google Scholar :
|
|
26
|
Zhang H, Zheng J, Shen H, Huang Y, Liu T,
Xi H and Chen C: Curcumin suppresses in vitro proliferation and
invasion of human prostate cancer stem cells by modulating
DLK1-DIO3 imprinted gene cluster MicroRNAs. Genet Test Mol
Biomarkers. 22:43–50. 2018. View Article : Google Scholar
|
|
27
|
Fang K, Liu P, Dong S, Guo Y, Cui X, Zhu
X, Li X, Jiang L, Liu T and Wu Y: Magnetofection based on
superparamagnetic iron oxide nanoparticle-mediated low lncRNA
HOTAIR expression decreases the proliferation and invasion of
glioma stem cells. Int J Oncol. 49:509–518. 2016. View Article : Google Scholar : PubMed/NCBI
|
|
28
|
Liu T, Xu F, Du X, Lai D, Liu T, Zhao Y,
Huang Q, Jiang L, Huang W, Cheng W and Liu Z: Establishment and
characterization of multi-drug resistant, prostate
carcinoma-initiating stem-like cells from human prostate cancer
cell lines 22RV1. Mol Cell Biochem. 340:265–273. 2010. View Article : Google Scholar : PubMed/NCBI
|
|
29
|
Shao Y, Zhang L, Cui L, Lou W, Wang D, Lu
W, Jin D and Liu T: LIN28B suppresses microRNA let-7b expression to
promote CD44+/LIN28B+ human pancreatic cancer stem cell
proliferation and invasion. Am J Cancer Res. 5:2643–2659.
2015.PubMed/NCBI
|
|
30
|
Gao Y, Liu T and Huang Y: MicroRNA-134
suppresses endometrial cancer stem cells by targeting POGLUT1 and
Notch pathway proteins. FEBS Lett. 589:207–214. 2015. View Article : Google Scholar
|
|
31
|
Qin W, Xiong Y, Chen J, Huang Y and Liu T:
DC-CIK cells derived from ovarian cancer patient menstrual blood
activate the TNFR1ASK1-AIP1 pathway to kill autologous ovarian
cancer stem cells. J Cell Mol Med. 22:3364–3376. 2018. View Article : Google Scholar : PubMed/NCBI
|
|
32
|
Williams LT: Signal transduction by the
platelet-derived growth factor receptor. Science. 243:1564–1570.
1989. View Article : Google Scholar : PubMed/NCBI
|
|
33
|
Hoch RV and Soriano P: Roles of PDGF in
animal development. Development. 130:4769–4784. 2003. View Article : Google Scholar : PubMed/NCBI
|
|
34
|
Heldin CH: Targeting the PDGF signaling
pathway in tumor treatment. Cell Commun Signal. 11:972013.
View Article : Google Scholar : PubMed/NCBI
|
|
35
|
Chen H, Gu X, Liu Y, Wang J, Wirt SE,
Bottino R, Schorle H and Sage J: Kim SK. PDGF signalling controls
age-dependent proliferation in pancreatic β-cells. Nature.
478:349–355. 2011. View Article : Google Scholar : PubMed/NCBI
|
|
36
|
Choi MH, Lee IK, Kim GW, Kim BU, Han YH,
Yu DY, Park HS, Kim KY, Lee JS, Choi C, et al: Regulation of PDGF
signalling and vascular remodelling by peroxiredoxin II. Nature.
435:347–353. 2005. View Article : Google Scholar : PubMed/NCBI
|
|
37
|
Tam WL, Lu H, Buikhuisen J, Soh BS, Lim E,
Reinhardt F, Wu ZJ, Krall JA, Bierie B, Guo W, et al: Protein
kinase C α is a central signaling node and therapeutic target for
breast cancer stem cells. Cancer Cell. 24:347–364. 2013. View Article : Google Scholar : PubMed/NCBI
|
|
38
|
Wieland E, Rodriguez-Vita J, Liebler SS,
Mogler C, Moll I, Herberich SE, Espinet E, Herpel E, Menuchin A,
Chang-Claude J, et al: Endothelial notch1 activity facilitates
metastasis. Cancer Cell. 31:355–367. 2017. View Article : Google Scholar : PubMed/NCBI
|
|
39
|
Ramasamy SK, Kusumbe AP, Wang L and Adams
RH: Endothelial Notch activity promotes angiogenesis and
osteo-genesis in bone. Nature. 507:376–380. 2014. View Article : Google Scholar : PubMed/NCBI
|
|
40
|
Wang M, Mao C, Ouyang L, Liu Y, Lai W, Liu
N, Shi Y, Chen L, Xiao D, Yu F, et al: Long noncoding RNA LINC00336
inhibits ferroptosis in lung cancer by functioning as a competing
endogenous RNA. Cell Death Differ. 2019.Epub ahead of print.
View Article : Google Scholar
|
|
41
|
Luan W, Zhang X, Ruan H, Wang J and Bu X:
Long noncoding RNA OIP5-AS1 acts as a competing endogenous RNA to
promote glutamine catabolism and malignant melanoma growth by
sponging miR-217. J Cell Physiol. 2019.Epub ahead of print.
View Article : Google Scholar
|
|
42
|
Xu TP, Ma P, Wang WY, Shuai Y, Wang YF, Yu
T, Xia R and Shu YQ: KLF5 and MYC modulated LINC00346 contributes
to gastric cancer progression through acting as a competing
endogeous RNA and indicates poor outcome. Cell Death Differ.
2019.Epub ahead of print. View Article : Google Scholar
|
|
43
|
Dong H, Hu J, Zou K, Ye M, Chen Y, Wu C,
Chen X and Han M: Activation of LncRNA TINCR by H3K27 acetylation
promotes trastuzumab resistance and epithelial-mesenchymal
transition by targeting MicroRNA-125b in breast cancer. Mol Cancer.
18:32019. View Article : Google Scholar : PubMed/NCBI
|
|
44
|
Wu XS, Wang F, Li HF, Hu YP, Jiang L,
Zhang F, Li ML, Wang XA, Jin YP, Zhang YJ, et al: LncRNA-PAGBC acts
as a microRNA sponge and promotes gallbladder tumorigenesis. EMBO
Rep. 18:1837–1853. 2017. View Article : Google Scholar : PubMed/NCBI
|
|
45
|
Zhang X, Wu N, Wang J and Li Z: LncRNA
MEG3 inhibits cell proliferation and induces apoptosis in laryngeal
cancer via miR-23a/APAF-1 axis. J Cell Mol Med. 2019.Epub ahead of
print.
|
|
46
|
Joglekar-Javadekar M, Van Laere S, Bourne
M, Moalwi M, Finetti P, Vermeulen PB, Birnbaum D, Dirix LY, Ueno N,
Carter M, et al: Characterization and targeting of platelet-derived
growth factor receptor alpha (PDGFRA) in inflammatory breast cancer
(IBC). Neoplasia. 19:564–573. 2017. View Article : Google Scholar : PubMed/NCBI
|
|
47
|
Ong HS, Gokavarapu S, Tian Z, Li J, Xu Q,
Cao W and Zhang CP: PDGFRA mRNA is overexpressed in oral cancer
patients as compared to normal subjects with a significant trend of
overexpression among tobacco users. J Oral Pathol Med. 46:591–597.
2017. View Article : Google Scholar : PubMed/NCBI
|
|
48
|
Gao S, Li E and Gao H: Long non-coding RNA
MEG3 attends to morphine-mediated autophagy of HT22 cells through
modulating ERK pathway. Pharm Biol. 57:536–542. 2019. View Article : Google Scholar : PubMed/NCBI
|
|
49
|
Binabaj MM, Bahreyni A, Khazaei M, Avan A
and Hassanian SM: The prognostic value of long noncoding RNA MEG3
expression in the survival of patients with cancer: A
meta-analysis-response. J Cell Biochem. 2019.Epub ahead of print.
View Article : Google Scholar : PubMed/NCBI
|
|
50
|
Meng Q, Li S, Liu Y, Zhang S, Jin J, Zhang
Y, Guo C, Liu B and Sun Y: Circular RNA circSCAF11 accelerates the
glioma tumorigenesis through the miR-421/SP1/VEGFA axis. Mol Ther
Nucleic Acids. 17:669–677. 2019.Epub ahead of print. View Article : Google Scholar : PubMed/NCBI
|
|
51
|
Li Y, Han X, Li Q, Wang C, Lou Z and Wang
X: Long noncoding RNA HOXD-AS1 induces epithelial-mesenchymal
transition in breast cancer by acting as a competing endogenous RNA
of miR-421. J Cell Biochem. 120:10633–10642. 2019. View Article : Google Scholar : PubMed/NCBI
|
|
52
|
Yin Y, Xu L, Chang Y, Zeng T, Chen X, Wang
A, Groth J, Foo WC, Liang C, Hu H and Huang J: N-Myc promotes
therapeutic resistance development of neuroendocrine prostate
cancer by differentially regulating miR-421/ATM pathway. Mol
Cancer. 18:112019. View Article : Google Scholar : PubMed/NCBI
|