Introduction
The human genome produces coding and non-coding RNA
(ncRNA) transcripts; however, ncRNAs represent the predominant RNA
species (1). Long ncRNAs (lncRNAs)
are >200 nucleotides in length, have low protein-coding
potential, and often exhibit spatial- and temporal-specific
expression patterns (2). They are
important regulators of gene expression, acting through a range of
different mechanisms, in cis or trans (3,4).
Given their broad role in a diverse range of biological processes,
it is appreciated that they serve major roles in physiology and
disease (5). Notably, a large
number of lncRNAs have been reported to mediate cancer-associated
processes (3). However, the role
and expression patterns of the majority of lncRNAs in cancer remain
largely unknown.
Breast cancer is the most commonly diagnosed cancer
and a leading cause of cancer-associated mortality in women
(6). Given the significant
incidence of breast cancer in the population, there is a need to
explore the therapeutic potential of novel molecular targets,
particularly for triple-negative breast cancer, which is diagnosed
in 15% of patients with breast cancer (7). Due to a lack of targeted therapies,
these patients require more aggressive treatment regimens (7). Historically, molecular classification
and therapeutic targeting of breast cancer-associated genes has
focused on protein-coding genes, which represent <1% of the
genome (8). It is now appreciated
that many lncRNAs are feasible biomarkers and targets for molecular
therapies (9-12). A key example includes HOX
transcript antisense intergenic RNA (HOTAIR), which is
upregulated in primary and metastatic breast tumours (13-15).
Overexpression of HOTAIR in breast cancer activates an
oestrogen receptor (ER)-associated transcriptional program, to
enhance cancer growth and tamoxifen resistance in breast cancer
(16). Similarly, the highly
conserved and abundant lncRNA metastasis-associated lung
adenocarcinoma transcript 1 (MALAT1) is upregulated in a
broad range of tumour types, including metastatic breast cancer,
and stimulates cell proliferation and migration (17). Furthermore, targeting MALAT1
in a mouse model of mammary carcinoma using modified antisense
oligonucleotides (ASOs) significantly reduces breast cancer
metastasis and slows primary tumour growth (18). Taken together, these studies
highlight the value of studying the expression and function of
lncRNAs in breast cancer.
The lncRNA growth hormone secretagogue receptor
(GHSR) opposite strand (GHSROS) (19) is a single-exon gene antisense to
the intronic region of GHSR; GHSR is also known as
the ghrelin receptor gene (19).
Our previous study demonstrated that GHSROS expression is
elevated in non-small cell lung cancer and that its induced
overexpression increases migration in lung adenocarcinoma cell
lines (19). However, to the best
of our knowledge, the expression pattern and functional role of
GHSROS in breast cancer remains unknown. The present study
analysed the expression of GHSROS in breast tissues and
derived cell lines, and determined the effects of GHSROS
overexpression in vitro (MDA-MB-231 and MCF10A cell lines)
and in vivo (MDA-MB-231 tumour xenografts in mice).
Materials and methods
Cell culture
Cell lines were obtained from the American Type
Culture Collection (ATCC). The MDA-MB-231 (HTB-26), MDA-MB-468
(HTB-132) and MDA-MB-453 (HTB-131) breast cancer cell lines were
maintained in Dulbecco's modified Eagle's medium:Nutrient Mixture
F-12 medium (DMEM/F12) supplemented with 10% foetal bovine serum
(FBS), 100 U/ml penicillin G and 100 µg/ml streptomycin (all
from Thermo Fisher Scientific, Inc., Waltham, MA, USA). The MCF10A
breast-derived non-tumourigenic cell line (CRL-10317) was
maintained in DMEM/F12 supplemented with 5% heat-inactivated horse
serum, 50 U/ml penicillin G, 100 µg/ml streptomycin, 10
µg/ml bovine insulin (all from Thermo Fisher Scientific,
Inc.), 0.5 µg/ml hydrocortisone, 200 µg/ml cholera
toxin (both from Sigma Aldrich; Merck KGaA) and 20 ng/ml epidermal
growth factor (Thermo Fisher Scientific, Inc.). The T-47D (HTB-133)
and MCF-7 (HTB-22) cell lines were maintained in RPMI-1640 medium
supplemented with 10% FBS, 100 U/ml penicillin G, 100 µg/ml
streptomycin and 10 µg/ml bovine insulin (Thermo Fisher
Scientific, Inc.). The HMEC human mammary epithelial cell-derived,
non-malignant cell line (PCS-600-010) was grown in HuMEC Ready
Medium and Supplement kit (Thermo Fisher Scientific, Inc.). All
cell lines were maintained at 37°C in a humidified incubator
(Panasonic) containing 5% CO2; cells were grown in
tissue culture flasks (Corning, Inc.), and passaged at 2- to 3-day
intervals upon reaching 70% confluence using TrypLE Select (Thermo
Fisher Scientific, Inc.). Cell morphology and viability were
monitored by microscopic observation and regular Mycoplasma
testing was performed (Universal Mycoplasma Detection kit; ATCC).
Approval for cell line use was granted by the Queensland University
of Technology (QUT) Human Research Ethics Committee (Brisbane,
Australia).
Production of GHSROS-overexpressing cell
lines
For gain-of-function studies, full-length
GHSROS was generated as previously described (19). The full-length GHSROS
transcript, amplified from the A549 (CCL-185; ATCC) lung
adenocarcinoma cell line, was cloned into the pTargeT
mammalian expression vector (Promega Corporation). MDA-MB-231 and
MCF10A cell lines were transfected with 1 µg
GHSROS-pTargeT plasmid DNA or vector alone (empty
vector) using Lipofectamine LTX (Invitrogen; Thermo Fisher
Scientific, Inc.) as per the manufacturer's instructions. Cells
(2×10⁵/well) were seeded in a 6-well plate 24 h prior to
transfection. Following incubation at room temperature for 5 min,
cells were transfected for 24 h at 37°C in Lipofectamine LTX and
further selected with geneticin (G418; Invitrogen; Thermo Fisher
Scientific, Inc.) at concentrations of 500 µg/ml for MCF10A
and 600 µg/ml for MDA-MB-231 cells. Transfected cells were
grown in the presence of G418 for ≥2 weeks prior to the performance
of functional analyses. For in vivo xenograft experiments,
MDA-MB-231 cells stably overexpressing luciferase
pGL4.51[luc2/CMV/Neo] (MDA-MB-231luc) were obtained
(provided by Dr Eloïse Dray, QUT). pReceiver-Lv105
lentiviral vectors (containing full-length GHSROS or no
insert) pre-packaged in lentiviral particles were purchased from
GeneCopoeia, Inc. Briefly, to optimise transduction, a titration of
0.1-10 µl viral particles was performed in the PC3 prostate
cancer cell line (CRL-1435; ATCC) and the lowest, most viable dose
was used. MDA-MB-231 cells were seeded at 50-60% confluence and
were transduced with GHSROS or empty vector control
lentiviral constructs at a multiplicity of infection of 1 in the
presence of 8 µg/ml polybrene (Sigma-Aldrich; Merck KGaA)
according to the manufacturer's protocol. After 48 h at 37°C,
transduced cells were selected with 1 µg/ml puromycin
(Invitrogen; Thermo Fisher Scientific, Inc.) and expanded.
GHSROS expression was confirmed ~3 weeks after selection by
reverse transcription-quantitative polymerase chain reaction
(RT-qPCR), then every 2-3 weeks and prior to every functional
experiment.
RNA extraction and RT-qPCR
Cell lines were centrifuged at 133 × g for 5 min and
total RNA was extracted from cell pellets using an RNeasy Plus Mini
kit and a genomic DNA (gDNA) eliminator spin column (Qiagen GmbH).
Total RNA was quantified using a NanoDrop ND-1000 spectrophotometer
(NanoDrop Technologies; Thermo Fisher Scientific, Inc., Wilmington,
DE, USA), diluted 1:5 in RNase-free water, and frozen at -80°C
until further use. To remove contaminating gDNA, 1 µg RNA
was treated with DNase prior to cDNA synthesis with Superscript III
(Invitrogen; Thermo Fisher Scientific, Inc.); RT was performed
according to the manufacturer's protocol. RT-qPCR was performed
with SYBR-Green PCR Master Mix (Qiagen GmbH) using primers listed
in Table I on an AB7500 FAST
sequence detection thermal cycler (Applied Biosystems; Thermo
Fisher Scientific, Inc., Waltham, MA, USA) or a ViiA Real-Time PCR
system (Applied Biosystems; Thermo Fisher Scientific, Inc.). PCR
cycles were performed under the following conditions: 10 min at
95°C; 40 cycles of 15 sec at 95°C and 1 min at 60°C, followed by
melting curve analysis. All experiments were performed in
triplicate. A negative control (water instead of template) was used
for each primer set. Baseline and quantification cycle (Cq) values
were obtained using ABI 7500 Prism and the relative expression
levels of mRNA were calculated using the comparative
2−ΔΔCq method (20).
Expression was normalised to the housekeeping gene β-actin
(ACTB). Statistical analyses were performed using GraphPad
Prism v.6.01 software (GraphPad Software, Inc.).
 | Table IPrimer sequences used in the present
study. |
Table I
Primer sequences used in the present
study.
| Primer | Gene name | Primer sequence
(5′-3′) |
|---|
| GHSROS | Growth hormone
secretagogue receptor opposite strand | F:
ACATTCAGCAAATCCAGTTAATGACA
R: CGACTGGAGCACGAGGACACTTGA |
| GHSROS-RT
linker | Growth hormone
secretagogue receptor opposite strand |
CGACTGGAGCACGAGGACACTGACAACAGAATTCACTACTTCCCCAAA |
| ACTB | β-actin
(housekeeping gene) | F:
ACTCTTCCAGCCTTCCTTCCT
R: CAGTGATCTCCTTCTGCATCCT |
|
HLA-DRB3 | MHC class II, DR
β3 | QIAGEN QuantiTect
Primer Assay |
| HLA-DRA | MHC class II, DR
α | QIAGEN QuantiTect
Primer Assay |
|
HLA-DPB1 | MHC, class II, DP
β1 | QIAGEN QuantiTect
Primer Assay |
|
HLA-DPA1 | MHC class II, DP
α1 | QIAGEN QuantiTect
Primer Assay |
| TBX3 | T-box 3 | QIAGEN QuantiTect
Primer Assay |
| HTR1F | 5-hydroxytryptamine
receptor 1F | QIAGEN QuantiTect
Primer Assay |
| TENM1 | Teneurin
transmembrane protein 1 | QIAGEN QuantiTect
Primer Assay |
GHSROS expression in human tissue
specimens
The expression of GHSROS in human breast
tissue was quantified by RT-qPCR (as aforementioned) using cDNA
panels of breast tumour and normal breast tissue samples. Briefly,
TissueScan Cancer Survey Tissue qPCR panels BCRT101, BCRT102,
BCRT103 and BCRT104 were arrayed onto a single 384-well reaction
plate by OriGene Technologies, Inc. Data are expressed as mean
fold-change using the comparative 2−ΔΔCq method
(compared to non-malignant control tissue on the same plate and
normalised to ACTB).
Cell proliferation assays
Proliferation assays were performed using an
xCELLigence real-time cell analysis (RTCA) DP instrument (ACEA
Biosciences, Inc.). This system employs sensor impedance technology
to quantify the status of the cell using a unit-less parameter
termed the cell index (CI) (21).
The CI represents the status of the cell based on the measured
relative alterations in electrical impedance that occur in the
presence and absence of cells in the wells [generated by the
software, according to the formula CI =
(Zi-Z0)/15 Ω, where Zi is the
impedance at an individual point of time during the experiment and
Z0 is the impedance at the start of the experiment]
(21,22). Impedance is measured at three
different frequencies (10, 25 and 50 kHz). Briefly,
5×10³ cells were trypsinised, seeded into a 96-well
plate (E-plate) and grown for 48 h at 37°C in 150 µl growth
media. The CI was measured every 15 min and all experiments were
performed in triplicate, with at least three independent
repeats.
Cell migration assays
Migration assays were performed using an xCELLigence
RTCA DP instrument (ACEA Biosciences, Inc.), and cell invasion and
migration plates (CIM-Plate®; ACEA Biosciences, Inc.).
Briefly, 5×10⁴ cells/well in 150 µl serum-free
media were seeded on the upper electronically integrated Boyden
chamber above a membrane with a pore size of 8-µm. The lower
chamber contained 160 µl media supplemented with 10% FBS as
a chemoattractant. The CI was measured every 15 min for 18 h (as an
indication of the rate of cell migration onto the underside of the
top chamber). All experiments were performed in triplicate, with at
least three independent repeats.
Oligonucleotide microarray analysis
Oligonucleotide micro-array analysis was performed
using RNA extracted from MDA-MB-231 cell lines overexpressing
GHSROS or vector controls. The MDA-MB-231 breast cancer cell
line (three biological replicates) was transfected independently
three times with GHSROS-pTargeT or empty
pTargeT vector as aforementioned, and RNA was extracted and
its purity analysed using an Agilent 2100 Bioanalyzer (Agilent
Technologies, Inc.). Total RNA (500 ng) was processed and
hybridised to Affymetrix Human Gene Arrays 1.0 by the Ramaciotti
Centre for Gene Function Analysis (Sydney, Australia). The array
(n=3, GHSROS-pTargeT and empty control) was quantile
normalised and log2-transformed using the R statistical
programming language v3.12 (www.r-project.org). Gene annotations were obtained
from the National Center for Biotechnology Information (Platform
GPL6244; downloaded September 2017; www.ncbi.nlm.nih.gov/geo/query/acc.cgi?acc=GPL6244).
Differential expression was determined using R package 'limma'
v3.33.12 (23). Differentially
expressed genes were defined as an absolute fold-change ≥1.5 and
P≤0.05.
To identify associations between differentially
expressed genes, STRING (v10.5) functional analysis (24) was implemented. STRING integrates
predicted and experimentally confirmed relationships between
proteins that are likely to contribute to a common biological
purpose. Using default parameters, differentially expressed genes
were mapped into the STRING user interface and interactions were
partitioned into distinct clusters using k-means analysis (25). Interaction networks were exported
into Inkscape (v0.91; inkscape.org). To test for gene enrichment,
differentially expressed genes were analysed using the Kyoto
Encylopedia of Genes and Genomes (KEGG) (26) pathway database within the STRING
functional analysis tool. STRING categorises KEGG pathway terms and
calculates an 'enrichment score' or EASE score (a modified Fisher's
exact test-derived P-value).
Orthotopic mammary fat pad in vivo
xenografts in mice
Experiments were approved by the University of
Queensland (Brisbane, Australia) and QUT animal ethics committees
(TRI/QUT/328/16). Mice were housed under specific pathogen-free
conditions in individually ventilated cages (Tecniplast S.p.A.) at
room temperature (20-23°C), 40-60% relative humidity and under a
12-h light/dark cycle. Food and water were provided ad
libitum. MDA-MB-231-GHSROS or MDA-MB-231-Vector cell
lines were injected at a 1:1 ratio with growth factor-reduced
Matrigel (Corning, Inc.) (n=8-10/cell line) directly into the right
inguinal mammary fat pad of 3-week old female NOD.Cg-Prkdc SCID
IL-2rgtm1WjL/SzJ (NSG) mice (weight, 20-25 g; generated by the
Jackson Laboratory; provided by Animal Resource Centre). Tumour
growth was measured twice weekly with digital calipers (ProSciTech
Pty Ltd.) and tumour volume was calculated using a formula for the
volume of an ellipse: V = π/6(d1 × d2)3/2, where d1 and
d2 represent perpendicular tumour measurements (27). In addition, tumour size and growth
were monitored weekly by bioluminescent imaging (28). Briefly, mice were injected
intraperitoneally with 150 mg/kg firefly luciferase substrate
D-Luciferin (PerkinElmer, Inc.) diluted in PBS (Thermo Fisher
Scientific, Inc.) 10 min prior to imaging. Following anaesthesia
with isoflurane, bioluminescent imaging was performed using an IVIS
Spectrum in vivo imaging system (PerkinElmer, Inc.)
(28). Images were analysed using
the associated Living Image Software (PerkinElmer, Inc.; version
4.7.1). Briefly, total flux in photons/sec (p/s) was used as a
surrogate for primary tumour size and determined within a defined
region of interest, individually, for each mouse (28). Animals were sacrificed once tumour
volume reached 1,000 mm3, or earlier according to other
ethical endpoints.
Statistical analyses
Data are presented as the mean ± standard error of
the mean of at least two independent experiments, and were
evaluated by Student's t-test, one-way or two-way ANOVA with
Dunnett's or Bonferroni's post hoc test, Mann-Whitney-Wilcoxon test
or Kruskal-Wallis test with Dunn's post hoc test for multiple
groups. P≤0.05 was considered to indicate a statistically
significant difference. Statistical analyses were performed using
GraphPad Prism v.6.01 (GraphPad Software, Inc.).
Results
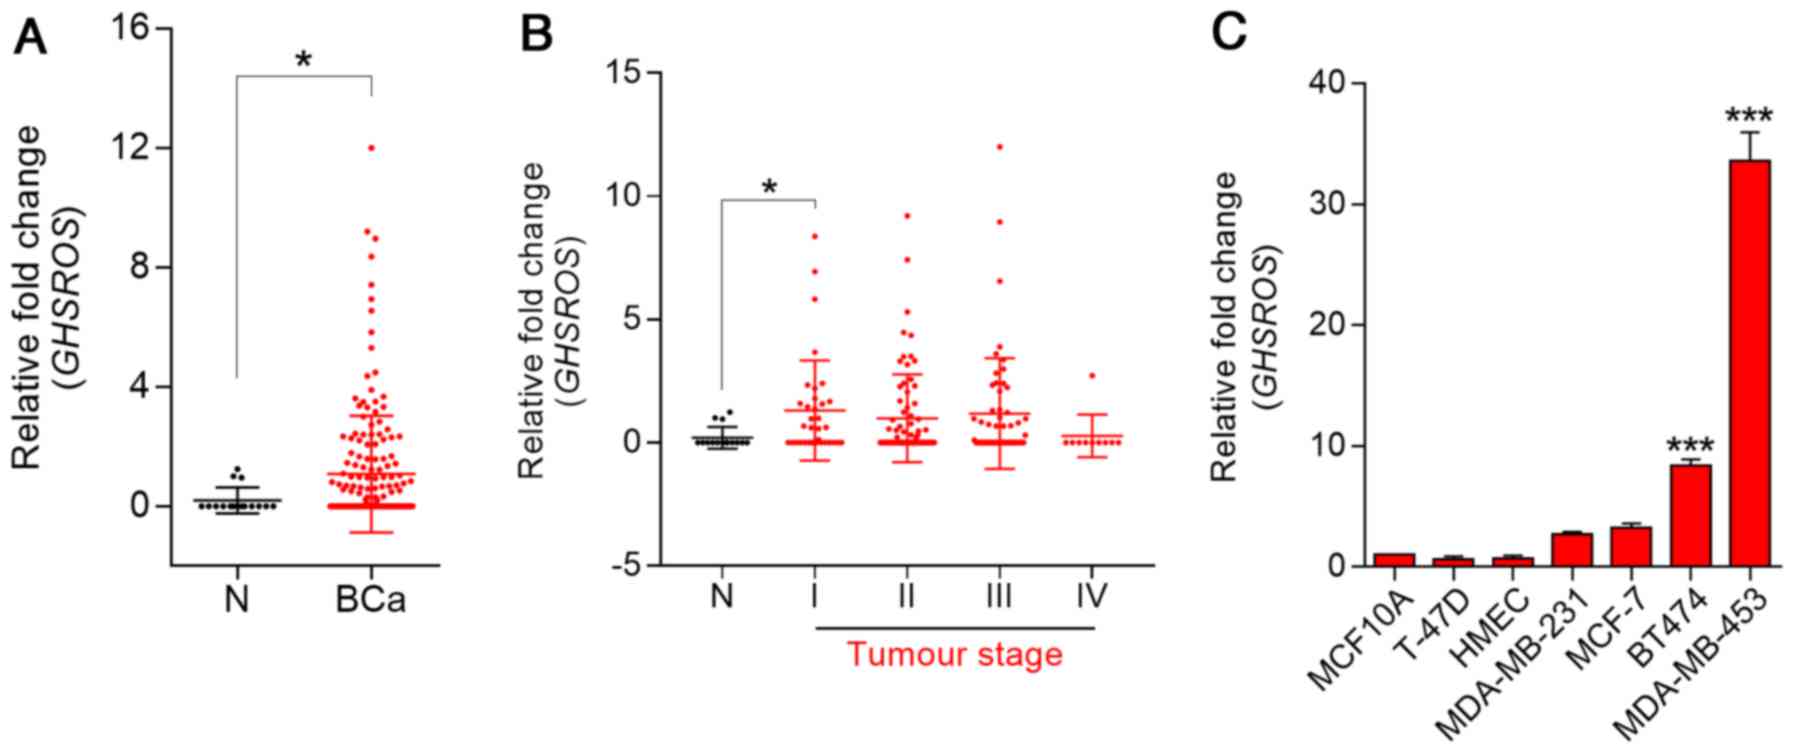
GHSROS expression is elevated in breast
cancer tissue and breast cancer-derived cell lines
To investigate the role of GHSROS in breast
cancer, RT-qPCR was performed on cDNA array panels of normal breast
and breast cancer tissues. GHSROS expression could be
detected in three out of 16 normal breast tissue samples (Fig. 1A). In contrast, 47% (83/176) of
tumours expressed GHSROS at significantly higher levels than
the normal breast tissues examined (P=0.030). In addition,
GHSROS was significantly elevated in stage I (P=0.0077)
breast cancer samples (Fig. 1B;
Table II). GHSROS
expression was not associated with a range of other clinical
parameters and features, including age, hormone receptor status
[ER, progesterone receptor (PR) and human epidermal growth factor
receptor 2 (HER2)] and metastasis (Table II). Similar to the normal tissue
specimens, very low levels of GHSROS expression were
observed in the MCF10A and HMEC non-malignant cell lines compared
with most breast cancer cell lines (Fig. 1C). GHSROS was expressed at
higher levels in triple-negative (ER−, PR−
and HER2−) MDA-MB-231 (2.71±0.27 fold-change, P=0.3601)
and MDA-MB-453 (33.60±3.33 fold-change, P=0.0001) cell lines, and
in the ER−/PR+/HER2+ BT474
(8.36±0.94 fold-change, P=0.0001) and
ER+/PR+/HER2+ MCF7 (3.28±0.65
fold-change, P=0.0652) cell lines compared with the MCF10A cell
line (Fig. 1C).
 | Figure 1GHSROS is expressed at low
levels in normal breast tissue and at higher levels in breast
cancer (BCa). (A) GHSROS expression in clinical BCa (n=176)
and N breast samples (n=16), as determined by RT-qPCR.
*P≤0.05, Mann-Whitney-Wilcoxon test. (B) GHSROS
expression stratified by clinical stage of BCa, as determined by
RT-qPCR. N (n=16), stage I (n=35), stage II (n=74), stage III
(n=57) and stage IV (n=10). *P≤0.05, Kruskal-Wallis with
Dunn's post hoc test. (C) GHSROS expression in the MCF10A
and HMLE normal-breast derived cell lines, and the MDA-MB-231,
MCF-7, T-47D, BT474 and MDA-MB-453 BCa cell lines compared to the
MCF-10A cell line, as determined by RT-qPCR. ***P≤0.001
vs. MCF-10A, one-way ANOVA with Dunnett's post hoc test. All
experiments were performed independently three times (n=3) with
three replicates per experiment (n=3). Data are presented as the
mean ± standard error of the mean, and relative expression levels
were determined using the comparative 2−ΔΔCq method.
Samples were normalised using β-actin. BCa, breast cancer;
GHSROS, growth hormone secretagogue receptor opposite
strand; N, normal; RT-qPCR, reverse transcription-quantitative
polymerase chain reaction. |
| Table IIGHSROS expression, as
determined by reverse transcription-quantitative polymerase chain
reaction, and clinicopathological parameters in breast cancer and
normal breast clinical specimens. |
Table II
GHSROS expression, as
determined by reverse transcription-quantitative polymerase chain
reaction, and clinicopathological parameters in breast cancer and
normal breast clinical specimens.
| Clinicopathological
parameters | Total number
(n) | Sample n
demonstrating expression | Sample %
demonstrating expression | P-value |
|---|
| N/T | 16/176 | 3/83 | 12.5/47.2 | 0.0300a |
| Clinical stage | | | | |
| N | 16 | 2 | 12.5 | NA |
| I | 35 | 20 | 57.1 | 0.0406a |
| II | 74 | 33 | 44.6 | 0.2364 |
| III | 57 | 27 | 47.4 | 0.1359 |
| IV | 10 | 1 | 10 | >0.9999 |
| Clinical
features | | | | |
|
ER+/ER− | 74/59 | 32/33 | 43.2/55.9 | 0.3829 |
|
PR+/PR− | 67/57 | 27/29 | 40.3/50.9 | 0.3402 |
|
HER2+/HER2− | 42/93 | 18/44 | 42.9/47.3 | 0.6185 |
| ER−,
PR−, HER2−/Other | 33/152 | 17/66 | 51.5/43.4 | 0.7110 |
| M/Non-M | 17/159 | 5/76 | 29.4/47.8 | 0.4236 |
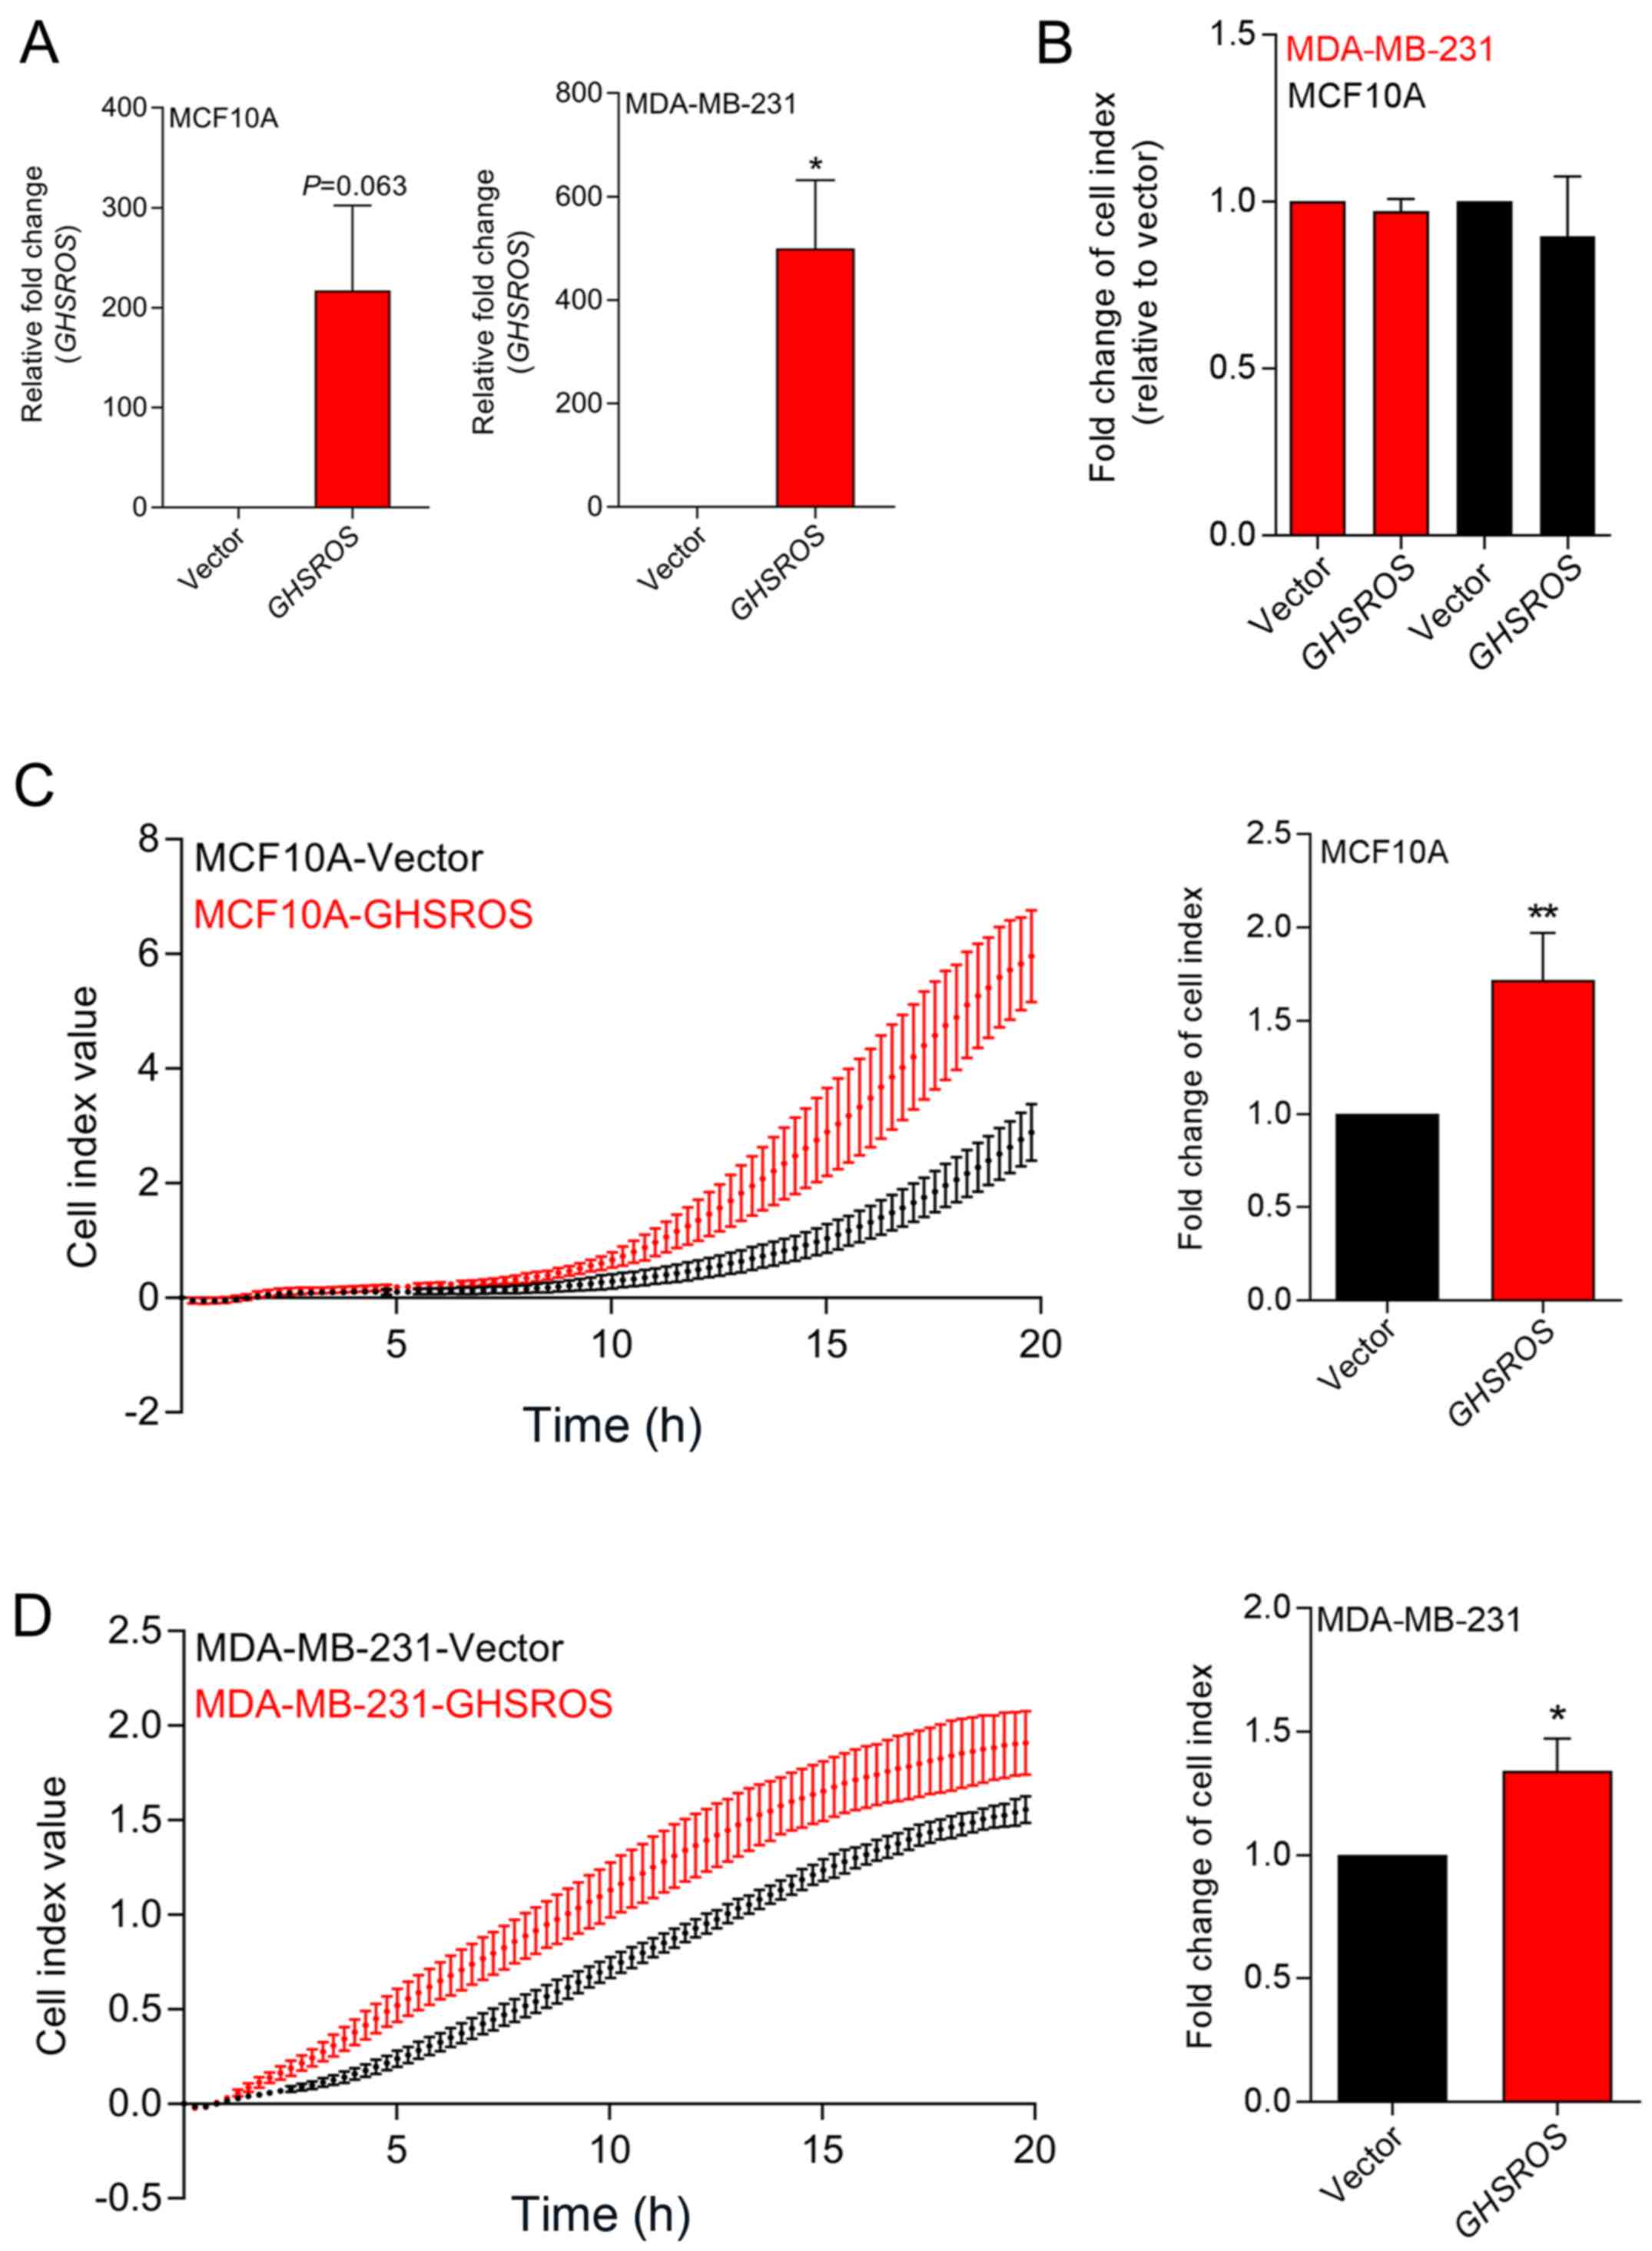
Ectopic overexpression of GHSROS in
breast-derived cell lines promotes in vitro migration, but not in
vitro proliferation
In order to investigate GHSROS function,
MCF10A normal breast-derived cells and MDA-MB-231 breast cancer
cells stably overexpressing full-length GHSROS
(MCF10A-GHSROS and MDA-MB-231-GHSROS), and corresponding vector
control cell lines (MCF10A-Vector and MDA-MB-231-Vector), were
generated (Fig. 2A). The
MDA-MB-231 cell line was chosen for overexpression studies as it
has relatively low endogenous levels of GHSROS. Using
real-time cell analysis (xCELLigence system), it was observed that
GHSROS overexpression did not significantly increase the
in vitro proliferation rate of cultured MCF10A (0.96±0.04
fold-change, P=0.18) and MDA-MD-231 cell lines (0.89±0.81
fold-change, P=0.29) over 72 h (Fig.
2B). Conversely, overexpression of GHSROS significantly
increased the rate of migration of MCF10A (1.71±0.43 fold-change,
P=0.040; Fig. 2C) and MDA-MB-231
(1.34±0.26 fold-change, P=0.045; Fig.
2D) cell lines over an 18-h period.
 | Figure 2GHSROS promotes cell
migration, but not cell proliferation, in MCF10A and MDA-MB-231
breast cancer cell lines in vitro. (A) Relative expression
of GHSROS in MDA-MD-231-GHSROS, MDA-MB-231-Vector,
MCF10A-GHSROS and MCF10A-Vector cell lines. Expression was
normalised to the housekeeping gene β-actin using the comparative
2−ΔΔCq method of quantification. Results are relative to
each vector control. (B) Proliferation was not significantly
increased in the MCF10A or MDA-MB-231 cell lines overexpressing
GHSROS compared to cells expressing vector alone when
assessed using an xCELLigence real-time cell analyser for 72 h. (C)
GHSROS overexpression increased MCF10A migration across a
porous membrane (pore size, 8 µM). Left panel,
representative plot of raw cell index impedance measurements from 0
to 20 h after cell seeding. Right panel, GHSROS
overexpression increased cell migration at 18 h. (D) GHSROS
overexpression increased MDA-MB-231 migration across a porous
membrane. Left panel, representative plot of raw cell index
impedance measurements from 0 to 20 h after overexpression of
GHSROS. Right panel, GHSROS overexpression increased
cell migration 18 h after passaging. Data are presented as the mean
± standard error of the mean (n=3). *P≤0.05,
**P≤0.01 vs. vector control; Student's t-test.
GHSROS, growth hormone secretagogue receptor opposite
strand. |
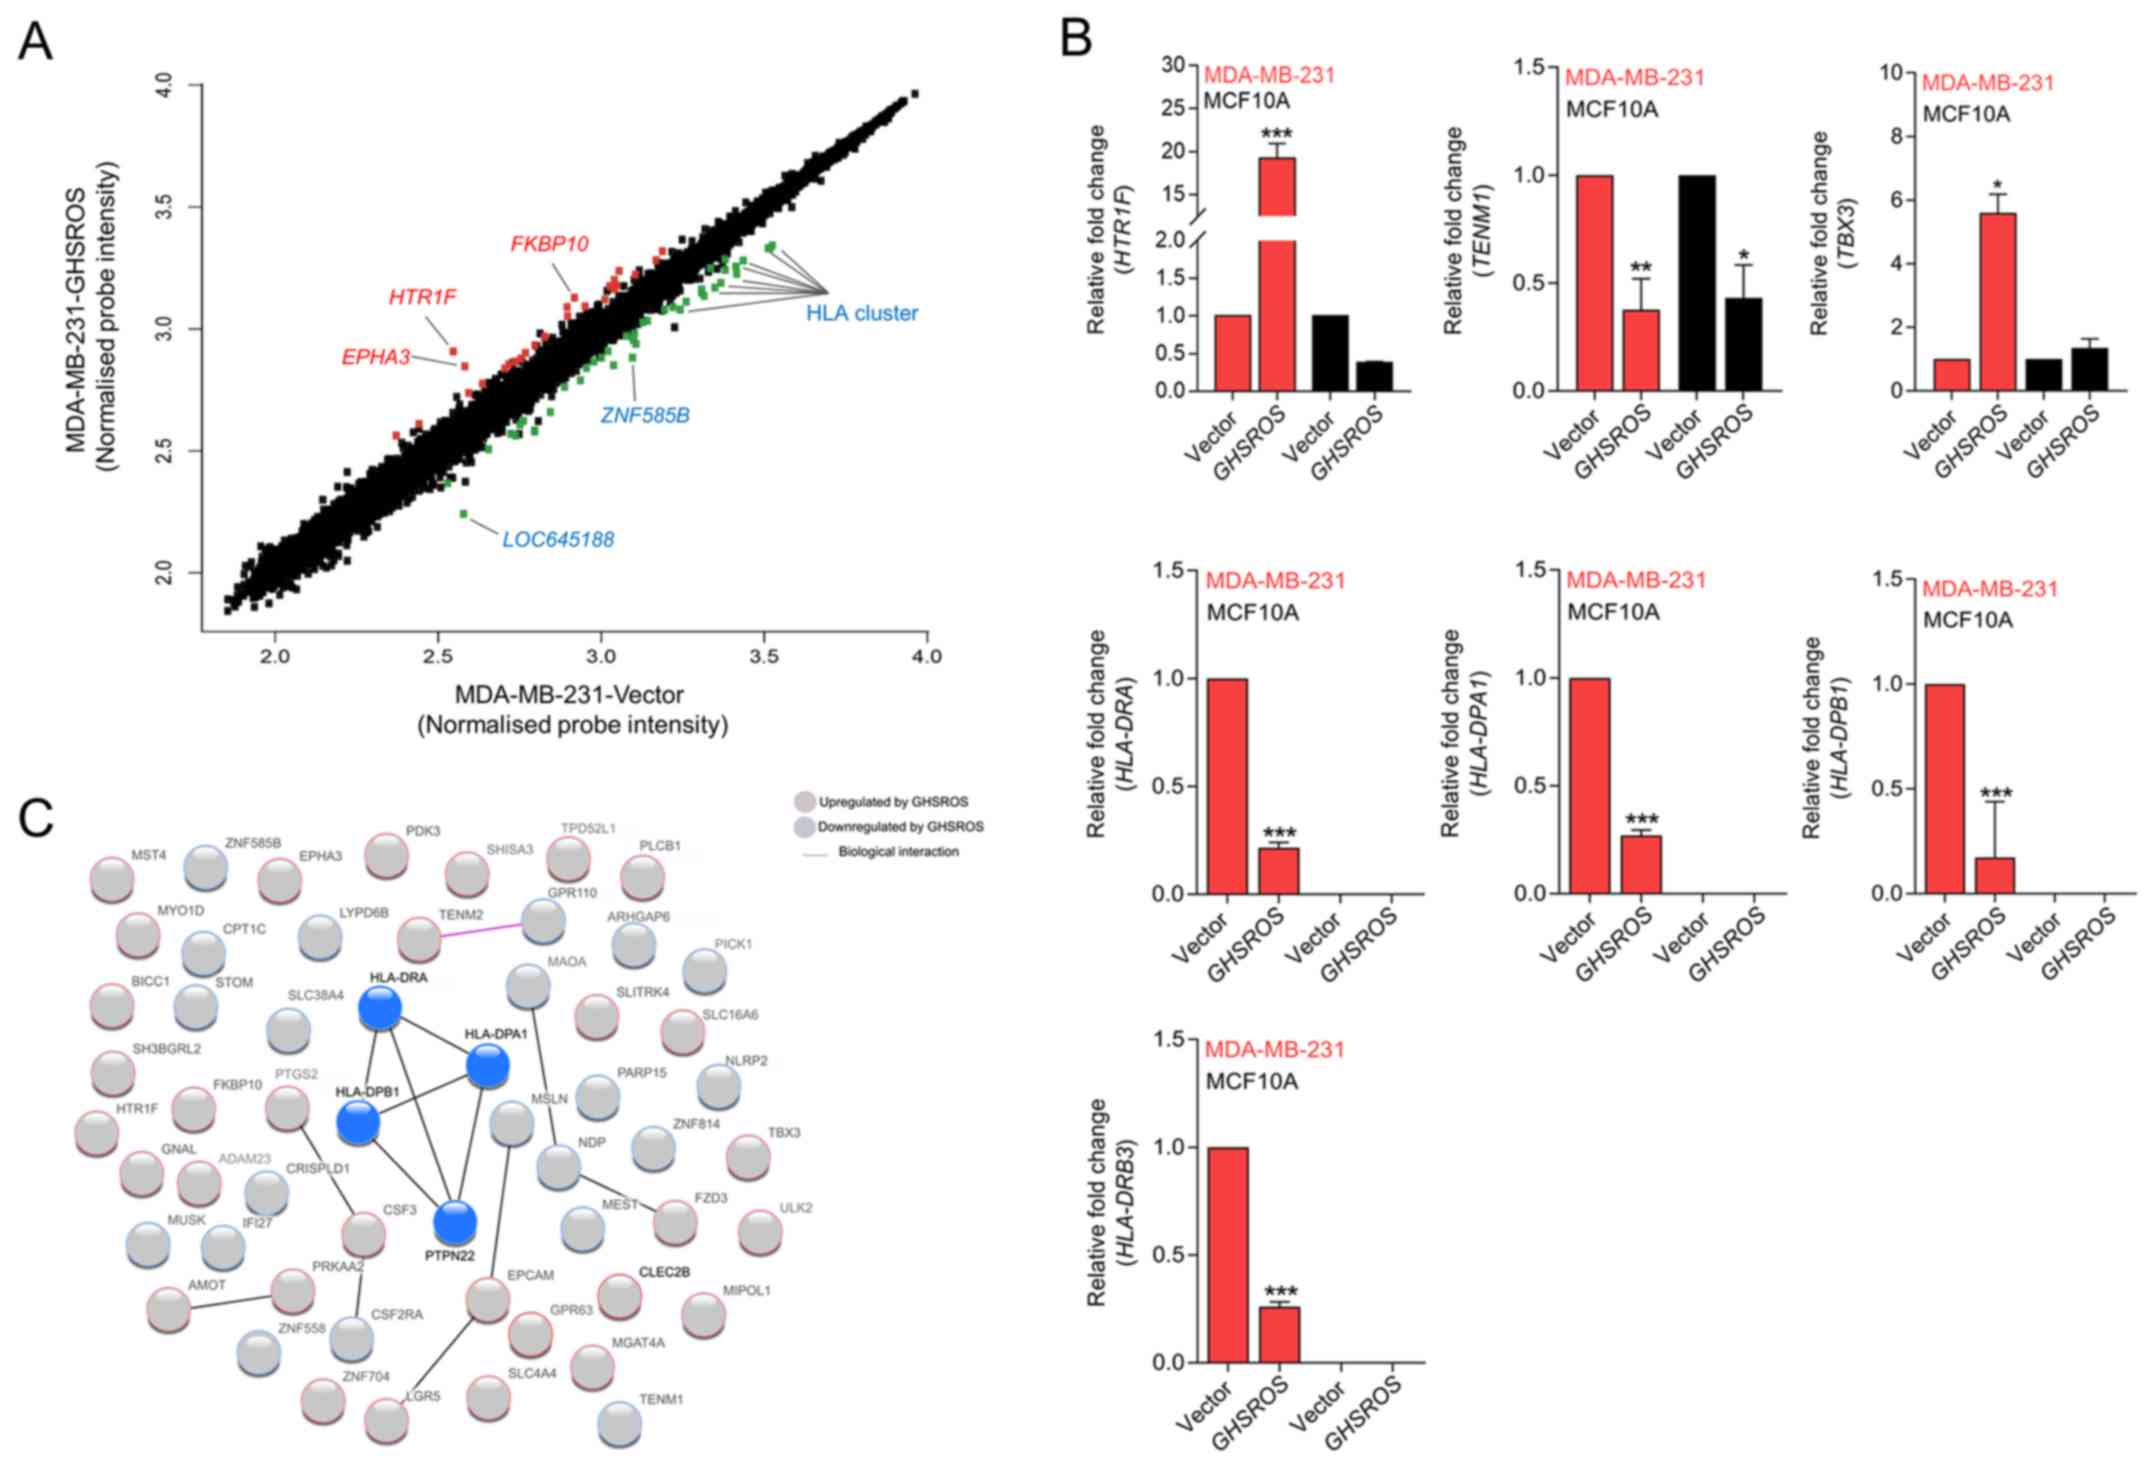
GHSROS regulates genes associated with
cancer and the immune response
To gain further insight into the function of
GHSROS in breast cancer, gene expression microarrays were
performed on RNA isolated from GHSROS-overexpressing
MDA-MB-231 cells and vector control cells. A total of 76 genes were
differentially regulated by >1.5-fold in MDA-MB-231 cells
overexpressing GHSROS (36 upregulated and 40 downregulated)
(Fig. 3A and Table III).
 | Figure 3GHSROS significantly
differentially regulates 76 genes in the MDA-MB-231 breast cancer
cell line. (A) Scatter plot visualization of induced (red) or
repressed (green) genes identified by microarray. The threshold was
set at as log2 1.5 fold-change and Q≤0.05 (Benjamini
Hochberg-adjusted P-value). EPHA3, HTR1F,
FKBP10, LOC645188, ZNF585B and HLA genes were
affected by GHSROS. (B) Expression levels of TBX3,
HTR1F, TENM1, HLA-DRA, HLA-DRB3,
HLA-DPA1 and HLA-DPB1 were measured in cultured
MDA-MB-231-GHSROS, MDA-MB-231-Vector, MCF10A-Vector and
MCF10A-GHSROS cells by reverse transcription-quantitative
polymerase chain reaction. Expression was normalised to the
housekeeping gene β-actin. Results are relative to the respective
vector control. Data are presented as the mean ± standard error of
the mean (n=2); ***P≤0.001 vs. vector control, two-way
ANOVA with Bonferroni's post hoc analysis. (C) STRING network
consisting of 56 proteins encoded by genes differentially expressed
in MDA-MB-231-GHSROS cells. Nodes represent differentially
expressed genes. Genes induced (red border) or repressed (blue
border) by GHSROS are indicated. Lines between protein nodes
indicate biological associations inferred or experimentally
demonstrated. Differentially expressed HLA genes are represented by
blue nodes in the centre of the cluster. EPHA3, EPH receptor
A3; FKBP10, FK506 binding protein 10; GHSROS, growth
hormone secretagogue receptor opposite strand; HLA-DRA, MHC,
class II, DR α; HLA-DRB3, MHC, class II, DR β3;
HLA-DPA1, MHC, class II, DP α1; HLA-DPB1, MHC, class
II, DP β1; HTR1F, 5-hydroxytryptamine receptor 1F; MHC,
major histocompatibility complex; TBX3, T-box 3;
TENM1, teneurin transmembrane protein 1; ZNF585B,
zinc finger protein 585B. |
| Table IIIDifferentially expressed genes in
MDA-MB-231-GHSROS cells compared with in empty vector control
cells. |
Table III
Differentially expressed genes in
MDA-MB-231-GHSROS cells compared with in empty vector control
cells.
| Gene symbol | Gene name | Fold-change | P-value | Affymetrix
probe |
|---|
|
HTR1F |
5-Hydroxytryptamine receptor
1F | 3.12 | 0.0040 | 8081067 |
|
EPHA3 | EPH receptor
A3 | 2.27 | 0.0190 | 8081081 |
|
FKBP10 | FK506 binding
protein 10 | 2.23 | 0.0032 | 8007154 |
|
SHISA3 | Shisa family
member 3 | 2.13 | 0.0046 | 8094870 |
|
MYO1D | Myosin
ID | 2.07 | 0.0111 | 8014115 |
|
STK26 | Serine/threonine
protein kinase 26 | 1.91 | 0.0008 | 8169949 |
|
BICC1 | BicC family RNA
binding protein 1 | 1.81 | 0.0021 | 7927681 |
|
PTGS2 |
Prostaglandin-endoperoxide synthase
2 | 1.79 | 0.0106 | 7922976 |
|
EPCAM | Epithelial cell
adhesion molecule | 1.77 | 0.0089 | 8098439 |
|
SH3BGRL2 | SH3 domain
binding glutamate rich protein like 2 | 1.70 | 0.0008 | 8120833 |
|
FZD3 | Frizzled class
receptor 3 | 1.68 | 0.0021 | 8145611 |
|
PRKAA2 | Protein kinase
AMP-activated catalytic subunit α2 | 1.63 | 0.0118 | 7901720 |
|
SLC16A6 | Solute carrier
family 16 member 6 | 1.63 | 0.0045 | 8017843 |
|
SLC4A4 | Solute carrier
family 4 member 4 | 1.63 | 0.0056 | 8095585 |
|
GPR63 | G
protein-coupled receptor 63 | 1.62 | 0.0092 | 8128316 |
|
MIPOL1 | Mirror-image
polydactyly 1 | 1.62 | 0.0013 | 7973985 |
|
LGR5 | Leucine rich
repeat containing G protein-coupled receptor 5 | 1.58 | 0.0184 | 7957140 |
|
PLCB1 | Phospholipase C
β1 | 1.58 | 0.0222 | 8060854 |
|
ADAM23 | ADAM
metallopeptidase domain 23 | 1.56 | 0.0083 | 8047788 |
|
SLITRK4 | SLIT and NTRK
like family member 4 | 1.52 | 0.0070 | 8175574 |
|
GNAL | G protein
subunit α L | 1.52 | 0.0006 | 8020164 |
|
AMOT |
Angiomotin | 1.52 | 0.0128 | 8174576 |
|
MGAT4A | mannosyl
(α-1,3-)-glycoprotein β-1,4-N-acetylglucosaminyltransferase,
isozyme A | 1.52 | 0.0418 | 8054135 |
|
ULK2 | Unc-51 like
autophagy activating kinase 2 | 1.50 | 0.0008 | 8013399 |
|
OR2A9P///OR2A20P | Olfactory
receptor family 2 subfamily A member 9 pseudogene///olfactory
receptor family 2 subfamily A member 20 pseudogene | 1.50 | 0.0373 | 8136983 |
|
ZNF704 | Zinc finger
protein 704 | 1.50 | 0.0032 | 8151496 |
|
TBX3 | T-box 3 | 1.49 | 0.0041 | 7966690 |
|
SUPT20HL1/// | SPT20 homolog,
SAGA complex component-like 1///SPT20 | 1.48 | 0.0245 | 8166509 |
|
SUPT20HL2 | homolog, SAGA
complex component-like 2 | | | |
|
SUPT20HL1/// | SPT20 homolog,
SAGA complex component-like 1///SPT20 | 1.48 | 0.0245 | 8171844 |
|
SUPT20HL2 | homolog, SAGA
complex component-like 2 | | | |
|
TENM2 | Teneurin
transmembrane protein 2 | 1.47 | 0.0391 | 8109752 |
|
PDK3 | Pyruvate
dehydrogenase kinase 3 | 1.47 | 0.0220 | 8166511 |
|
OR2A9P///OR2A20P | Olfactory
receptor family 2 subfamily A member 9 pseudogene///olfactory
receptor family 2 subfamily A member 20 pseudogene | 1.47 | 0.0334 | 8143629 |
|
TPD52L1 | Tumour protein
D52-like 1 | 1.46 | 0.0024 | 8121838 |
|
TMEM56-RWDD3/// | TMEM56-RWDD3
readthrough///transmembrane | 1.46 | 0.0363 | 7903162 |
|
TMEM56 | protein
56 | | | |
|
CLEC2B | C-type lectin
domain family 2 member B | 1.45 | 0.0498 | 7961083 |
|
CSF3 | Colony
stimulating factor 3 | 1.45 | 0.0052 | 8006999 |
| PICK1 | Protein interacting
with PRKCA 1 | −1.47 | 0.0386 | 8072989 |
| MAOA | Monoamine oxidase
A | −1.48 | 0.0217 | 8166925 |
|
CRISPLD1 | Cysteine rich
secretory protein LCCL domain containing 1 | −1.49 | 0.0009 | 8146967 |
| MSLN | Mesothelin | −1.50 | 0.0059 | 7992071 |
| ZNF558 | Zinc finger protein
558 | −1.53 | 0.0070 | 8033667 |
| PTPN22 | Protein tyrosine
phosphatase, non-receptor type 22 | −1.54 | 0.0004 | 7918657 |
| NDP | NDP, norrin cystine
knot growth factor | −1.54 | 0.0004 | 8172220 |
| IFI27 | Interferon α
inducible protein 27 | −1.56 | 0.0225 | 7976443 |
| ZNF814 | Zinc finger protein
814 | −1.56 | 0.0033 | 8039692 |
| PARP15 | poly(ADP-ribose)
polymerase family member 15 | −1.56 | 0.0147 | 8082086 |
| CPT1C | Carnitine
palmitoyltransferase 1C | −1.56 | 0.0267 | 8030448 |
| RNU5D-1 | RNA, U5D small
nuclear 1 | −1.57 | 0.0412 | 7915592 |
| ARHGAP6 | Rho GTPase
activating protein 6 | −1.58 | 0.0042 | 8171313 |
| MEST | Mesoderm specific
transcript | −1.63 | 0.0026 | 8136248 |
| STOM | stomatin | −1.67 | 0.0110 | 8163896 |
| NLRP2 | NLR family pyrin
domain containing 2 | −1.72 | 0.0001 | 8031398 |
| MUSK | Muscle associated
receptor tyrosine kinase | −1.79 | 0.0389 | 8157173 |
| CSF2RA | Colony stimulating
factor 2 receptor α subunit | −1.80 | 0.0030 | 8165735 |
| CSF2RA | Colony stimulating
factor 2 receptor α subunit | −1.80 | 0.0030 | 8176306 |
| LYPD6B | LY6/PLAUR domain
containing 6B | −1.97 | 0.0188 | 8045664 |
| TENM1 | Teneurin
transmembrane protein 1 | −1.97 | 0.0238 | 8174937 |
|
TGIF2LY/// | TGFB induced factor
homeobox 2 like, Y-linked///TGFB | −1.97 | 0.0002 | 8176397 |
| TGIF2LX | induced factor
homeobox 2 like, X-linked | | | |
|
HLA-DPB1 | Major
histocompatibility complex, class II, DP β1 | −1.99 | 0.0485 | 8118594 |
|
TGIF2LY/// | TGFB induced factor
homeobox 2 like, Y-linked///TGFB | −1.99 | 0.0002 | 8168646 |
| TGIF2LX | induced factor
homeobox 2 like, X-linked | | | |
| ADGRF1 | Adhesion G
protein-coupled receptor F1 | −2.00 | 0.0038 | 8126820 |
| SLC38A4 | Solute carrier
family 38 member 4 | −2.04 | 0.0081 | 7962559 |
|
HLA-DPB1 | Major
histocompatibility complex, class II, DP β1 | −2.07 | 0.0403 | 8178220 |
|
SPANXC///SPANXD | SPANX family member
C///SPANX family member D | −2.10 | 0.0027 | 8175558 |
|
HLA-DPA1 | Major
histocompatibility complex, class II, DP α1 | −2.22 | 0.0466 | 8125556 |
|
HLA-DPA1 | Major
histocompatibility complex, class II, DP α1 | −2.22 | 0.0466 | 8178891 |
|
HLA-DPA1 | Major
histocompatibility complex, class II, DP α1 | −2.22 | 0.0470 | 8180100 |
|
HLA-DPB1 | Major
histocompatibility complex, class II, DP β1 | −2.31 | 0.0391 | 8179519 |
| ZNF585B | zinc finger protein
585B | −2.31 | 0.0001 | 8036389 |
|
HLA-DRA/// | Major
histocompatibility complex, class II, DR α///major | −2.35 | 0.0065 | 8118548 |
|
HLA-DQA1 | histocompatibility
complex, class II, DQ α1 | | | |
|
HLA-DRA/// | Major
histocompatibility complex, class II, DR α///major | −2.36 | 0.0058 | 8179481 |
|
HLA-DQA1 | histocompatibility
complex, class II, DQ α1 | | | |
|
LOC645188 | Uncharacterised
LOC645188 | −2.39 | 0.0003 | 8170257 |
|
HLA-DRA/// | Major
histocompatibility complex, class II, DR α///major | −2.55 | 0.0072 | 8178193 |
|
HLA-DQA1 | histocompatibility
complex, class II, DQ α1 | | | |
|
LOC105369230/// | HLA class II
histocompatibility antigen, DRB1-7β chain///major | −2.62 | 0.0054 | 8180003 |
|
HLA-DRB6/// | histocompatibility
complex, class II, DR β6 (pseudogene)///major | | | |
|
HLA-DRB5/// | histocompatibility
complex, class II, DR β5///major | | | |
|
HLA-DRB4/// | histocompatibility
complex, class II, DR β4///major | | | |
|
HLA-DRB3/// | histocompatibility
complex, class II, DR β4///major | | | |
|
HLA-DRB1/// | histocompatibility
complex, class II, DR β3///major | | | |
|
LOC105369230/// | histocompatibility
complex, class II, DR β1///HLA class II | | | |
|
HLA-DRB5/// | histocompatibility
antigen, DRB1-7β chain///major | | | |
|
HLA-DRB4/// | histocompatibility
complex, class II, DR β5///major | | | |
|
HLA-DRB3/// | histocompatibility
complex, class II, DR β4///major | | | |
|
HLA-DRB1/// | histocompatibility
complex, class II, DR β3///major | | | |
|
HLA-DQB1 | histocompatibility
complex, class II, DR β1///major histocompatibility complex, class
II, DQ β1 | | | |
|
LOC105369230/// | HLA class II
histocompatibility antigen, DRB1-7 β chain///major | −2.66 | 0.0063 | 8178811 |
|
HLA-DRB6/// | histocompatibility
complex, class II, DR β6 (pseudogene)///major | | | |
|
HLA-DRB5/// | histocompatibility
complex, class II, DR β5///major | | | |
|
HLA-DRB4/// | histocompatibility
complex, class II, DR β4///major | | | |
|
HLA-DRB3/// | histocompatibility
complex, class II, DR β3///major | | | |
|
HLA-DRB1/// | histocompatibility
complex, class II, DR β1///HLA class II | | | |
|
LOC105369230/// | histocompatibility
antigen, DRB1-7β chain///major | | | |
|
HLA-DRB5/// | histocompatibility
complex, class II, DR β5///major | | | |
|
HLA-DRB4/// | histocompatibility
complex, class II, DR β4///major | | | |
|
HLA-DRB3/// | histocompatibility
complex, class II, DR β3///major | | | |
|
HLA-DRB1/// | histocompatibility
complex, class II, DR β1///major | | | |
|
HLA-DQB1 | histocompatibility
complex, class II, DQ β1 | | | |
|
LOC105369230/// | HLA class II
histocompatibility antigen, DRB1-7β chain///major | −2.71 | 0.0068 | 8178802 |
|
HLA-DRB6/// | histocompatibility
complex, class II, DR β6 (pseudogene)///major | | | |
|
HLA-DRB5/// | histocompatibility
complex, class II, DR β5///major | | | |
|
HLA-DRB4/// | histocompatibility
complex, class II, DR β4///major | | | |
|
HLA-DRB3/// | histocompatibility
complex, class II, DR β3///major | | | |
|
HLA-DRB1/// | histocompatibility
complex, class II, DR β1///HLA class II | | | |
|
LOC105369230/// | histocompatibility
antigen, DRB1-7β chain///major histocompatibility | | | |
|
HLA-DRB5/// | complex, class II,
DR β5///major histocompatibility complex, | | | |
|
HLA-DRB4/// | class II, DR
β4///major histocompatibility complex, class II, | | | |
|
HLA-DRB3/// | DR β3///major
histocompatibility complex, class II, DR β1///major | | | |
|
HLA-DRB1///HLA-DQB1 | histocompatibility
complex, class II, DQ β1 | | | |
The most upregulated genes in the microarray were
5-hydroxy-tryptamine (5-HT) receptor 1F (HTR1F, 3.1
fold-change, P=0.0040) and EPH receptor A3 (EPHA3, 2.3
fold-change, P=0.0190) (Table
III). Significant upregulation of HTR1F was verified by
RT-qPCR in the MDA-MB-231-GHSROS cell line (19.2±1.173 fold-change,
P=0.0002; Fig. 3B). Conversely,
HTR1F expression was reduced in MCF10A-GHSROS cells
(-2.68±0.002 fold-change, P>0.999; Fig. 3B), although this finding was not
statistically significant. Notably, a number of established
oncogenes were differentially expressed in the MDA-MB-231-GHSROS
microarray data. These included teneurin transmembrane protein 1
(TENM1), which was downregulated in MDA-MB-231-GHSROS cells
(-2.00 fold-change, P=0.0238. These data were validated by RT-qPCR
in MDA-MB-231-GHSROS cells (-2.65±0.286 fold-change, P=0.0048), and
TENM1 was similarly downregulated in MCF10A-GHSROS cells
(-2.31±0.262 fold-change, P=0.020; Fig. 3B). The T-box transcription factor
gene T-box 3 (TBX3) is associated with breast cancer cell
migration and growth (29) and was
upregulated (1.5 fold-change, P=0.0041; Table III) in the
MDA-MB-231-GHSROS microarray. Upregulation of TBX3
was confirmed by RT-qPCR in MDA-MB-231-GHSROS cells
(5.60±0.82 fold-change, P=0.025; Fig.
3B); however, TBX3 expression was not altered in
MCF10A-GHSROS cells (Fig. 3B).
In the present dataset, it was observed that a
single probe matched to several class II major histocompatibility
complex (MHC) genes. A number of MHC class II genes were
significantly repressed by GHSROS [including MHC, class II,
DR β3 (HLA-DRB3), -2.7 fold-change, P=0.0068; MHC, class II,
DR β1, -2.7 fold-change, P=0.0063; MHC, class II, DR α
(HLA-DRA), -2.4 fold-change, P=0.0058; MHC, class II, DP β1
(HLA-DPB1), -2.3 fold-change, P=0.039; Table III]. MHC gene loci are complex;
their exons are highly similar and person-to-person variation in
exon sequences can confound microarray probe hybridisation
(30,31). To firmly establish which MHC-II
genes were differentially expressed upon forced GHSROS
overexpression, selected genes were validated by RT-qPCR. Using
RT-qPCR, it was confirmed that GHSROS overexpression in
MDA-MB-231 cells induced downregulation of the MHC-II genes
HLA-DRA (-4.62±0.024 fold-change, P<0.0001),
HLA-DPB1 (-4.53±0.30 fold-change, P<0.0001), MHC, class
II, DP α1 HLA-DPA1 (-3.69±0.02 fold-change, P<0.0001) and
HLA-DRB3 (-3.84±0.02 fold-change, P<0.0001) (Fig. 3B). These transcripts were not
detected in the MCF10A-GHSROS or MCF10A-Vector cell lines, which is
consistent with the fact that normal breast epithelial tissue is
typically MHC-II negative (32).
Differentially expressed genes identified by
microarray analysis were interrogated for biological interactions
using the STRING tool (24).
Within the functional protein-protein interaction (PPI) network a
small, distinct interaction was detected between the MHC-II gene
set (HLA-DRA, HLA-DPA1 and HLA-DPB1) and
protein tyrosine phosphatase, non-receptor type 22 (lymphoid)
(Fig. 3C; expected interactions,
7; observed interactions, 15; PPI enrichment P=0.0099,
hypergeometric test). KEGG pathway analysis of 56 genes analysed in
STRING demonstrated that the 40 genes downregulated in
MDA-MB-231-GHSROS cells were enriched for pathways typically
associated with the expression of MHC-II genes (Fig. 3C; Table IV), including 'antigen processing
and presentation' [Benjamini-Hochberg corrected P-value,
Benjamini-Hochberg false discovery rate (BH-FDR)=0.0020], 'asthma'
(BH-FDR=0.0011) and 'graft-versus-host disease' (BH-FDR=0.0011)
pathways (Table IV).
| Table IVEnriched KEGG pathway terms for 40
genes downregulated in MDA-MB-231-GHSROS cells. |
Table IV
Enriched KEGG pathway terms for 40
genes downregulated in MDA-MB-231-GHSROS cells.
| KEGG ID | Pathway
description | Gene count | BH-FDR | Genes |
|---|
| 5310 | Asthma | 3 | 0.00107a | HLA-DPA1,
HLA-DPB1, HLA-DRA |
| 5330 | Allograft
rejection | 3 | 0.00107a | HLA-DPA1,
HLA-DPB1, HLA-DRA |
| 5332 | Graft-versus-host
disease | 3 | 0.00107a | HLA-DPA1,
HLA-DPB1, HLA-DRA |
| 4940 | Type I diabetes
mellitus | 3 | 0.00111a | HLA-DPA1,
HLA-DPB1, HLA-DRA |
| 4672 | Intestinal immune
network for IgA production | 3 | 0.00119a | HLA-DPA1,
HLA-DPB1, HLA-DRA |
| 5150 | Staphylococcus
aureus infection | 3 | 0.00132a | HLA-DPA1,
HLA-DPB1, HLA-DRA |
| 5320 | Autoimmune thyroid
disease | 3 | 0.00132a | HLA-DPA1,
HLA-DPB1, HLA-DRA |
| 5416 | Viral
myocarditis | 3 | 0.00146a | HLA-DPA1,
HLA-DPB1, HLA-DRA |
| 5321 | Inflammatory bowel
disease (IBD) | 3 | 0.00185a | HLA-DPA1,
HLA-DPB1, HLA-DRA |
| 4612 | Antigen processing
and presentation | 3 | 0.00201a | HLA-DPA1,
HLA-DPB1, HLA-DRA |
| 5140 | Leishmaniasis | 3 | 0.00209a | HLA-DPA1,
HLA-DPB1, HLA-DRA |
| 5323 | Rheumatoid
arthritis | 3 | 0.00356a | HLA-DPA1,
HLA-DPB1, HLA-DRA |
| 5322 | Systemic lupus
erythematosus | 3 | 0.00443a | HLA-DPA1,
HLA-DPB1, HLA-DRA |
| 5145 | Toxoplasmosis | 3 | 0.0069a | HLA-DPA1,
HLA-DPB1, HLA-DRA |
| 4514 | Cell adhesion
molecules | 3 | 0.0114a | HLA-DPA1,
HLA-DPB1, HLA-DRA |
| 4145 | Phagosome | 3 | 0.0121a | HLA-DPA1,
HLA-DPB1, HLA-DRA |
| 5164 | Influenza A | 3 | 0.0179a | HLA-DPA1,
HLA-DPB1, HLA-DRA |
| 5152 | Tuberculosis | 3 | 0.0181a | HLA-DPA1,
HLA-DPB1, HLA-DRA |
| 5168 | Herpes simplex
infection | 3 | 0.0183a | HLA-DPA1,
HLA-DPB1, HLA-DRA |
| 5169 | Epstein-Barr virus
infection | 3 | 0.0221a | HLA-DPA1,
HLA-DPB1, HLA-DRA |
| 5166 | HTLV-I
infection | 3 | 0.0465a | HLA-DPA1,
HLA-DPB1, HLA-DRA |
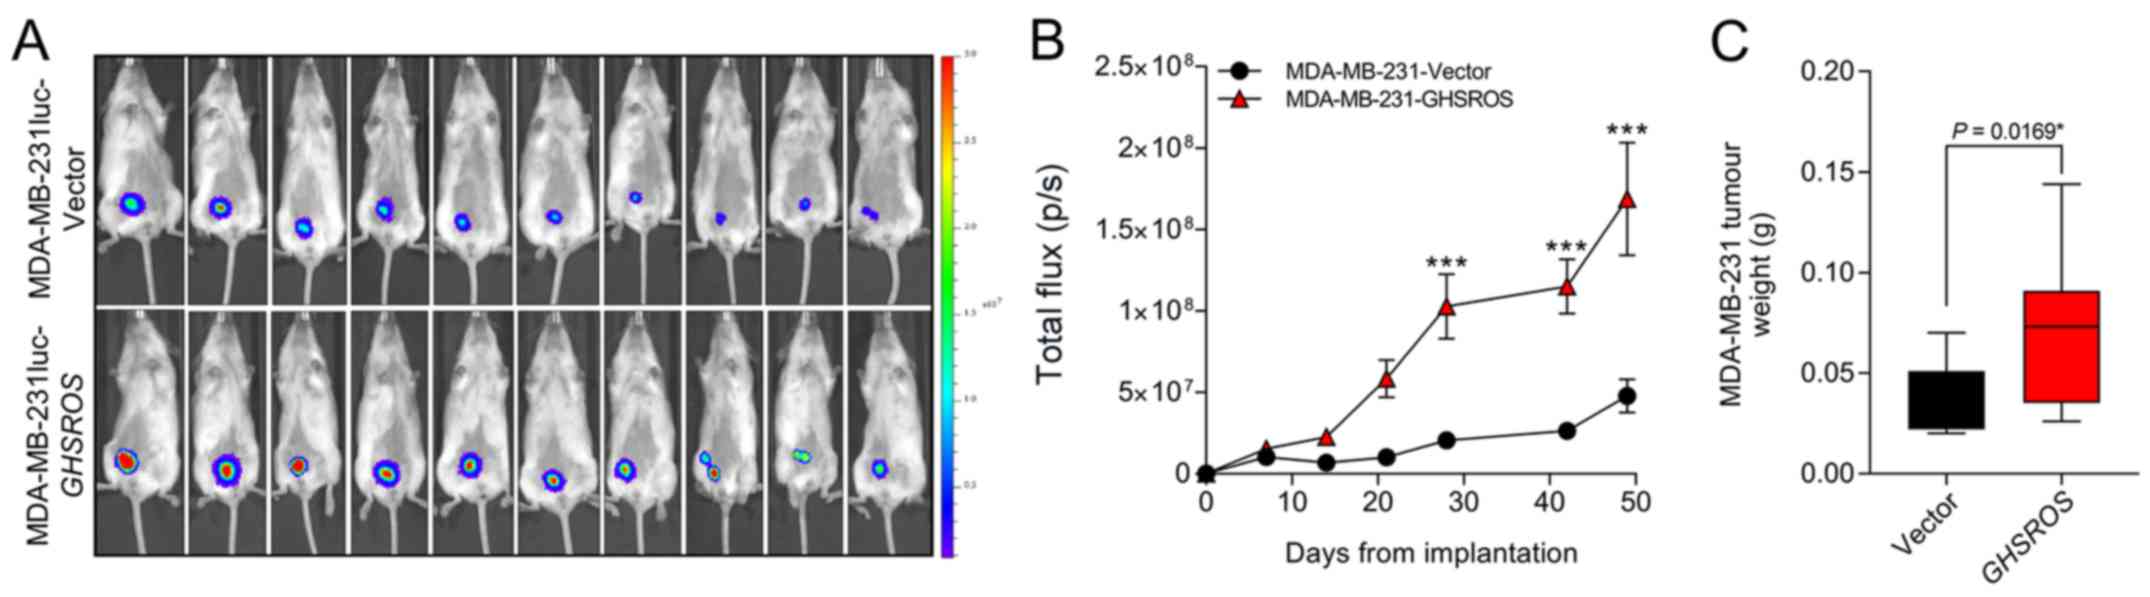
GHSROS increases orthotopic breast
xenograft growth
In order to investigate the effect of GHSROS
on tumour growth in vivo an orthotopic xenograft model was
used (33).
MDA-MB-231luc-GHSROS and MDA-MB-231luc-Vector cells were
injected into the mammary fat pad of NSG mice (Fig. 4A). Compared to vector controls,
mammary fat pad xenograft tumour volumes [measured by total flux
(p/s)] were significantly increased in MDA-MB-231luc-GHSROS
mice at day 28 post-implantation (Mann-Whitney, P=0.0002), day 42
post-implantation (P≤0.0001) and at the experimental (ethical)
endpoint (day 49, P≤0.0001) (Fig.
4B). No gross metastases were observed in either experimental
group. Upon excision, the MDA-MB-231luc-GHSROS tumours
weighed significantly more post mortem (Mann-Whitney-Wilcoxon test,
P=0.017; Fig. 4C).
Discussion
Our previous study demonstrated that GHSROS,
a lncRNA derived from a gene antisense to the ghrelin receptor
gene, is expressed by non-small cell lung tumours and increases
lung cancer cell migration in vitro (19). Similarly, in this study it was
demonstrated that GHSROS was expressed in breast cancer and
promoted in vitro cell line migration. GHSROS also
promoted MDA-MB-231 breast cancer cell xenograft tumour growth and
altered the expression of cancer-associated and immune genes. While
lncRNAs are rarely highly conserved, nor abundantly expressed, they
can serve integral regulatory roles in a large array of cellular
processes, including pathological conditions such as tumourigenesis
(34,35). In a previous study, genome-wide
RNA-seq profiling of 22 paired tumour and non-malignant tissues
from ER+ breast cancer samples demonstrated that the
expression of natural antisense transcript lncRNAs are increased in
tumour samples (36), suggesting
that they may have important regulatory roles.
A number of lncRNAs differentially expressed in
breast cancer function as critical mediators of breast cancer
tumourigenesis (35,37,38).
For example, the lncRNAs H19 (39), MALAT1 (40), HOTAIR (41) and taurine upregulated 1 (42) have a higher gene expression in
breast cancer tissues and derived cell lines (41,43).
lncRNAs have also been proposed as potential breast cancer
biomarkers. MALAT1 is an abundant and highly conserved
lncRNA that can be detected in the serum of patients with breast
cancer and at much higher levels than in patients with benign
breast disease (40). Although the
present study did not detect a direct relationship between
GHSROS expression and clinical parameters (including ER, PR
and HER2 status), further studies interrogating a larger patient
cohort are warranted.
GHSROS increased in vitro cell
migration, but not proliferation, of the MDA-MB-231 breast cancer
cell line and the non-tumourigenic, normal-breast derived MCF10A
cell line. Our previous study observed similar effects in
non-small-cell lung carcinoma cell lines overexpressing
GHSROS (19). MDA-MB-231
breast cancer cells metastasise from the mammary fat pads of NSG
mice, with gross tumours observed in multiple tissues, including
the lungs, lymph nodes and liver, 53 days after implantation
(44). This model is, therefore,
useful for investigating the effect of gene expression on
metastasis. In the current study, mice bearing
GHSROS-overexpressing xenografts were euthanised 49 days
after injection as they had reached the ethical endpoint. However,
gross metastases were not observed and therefore, it was not
possible to determine if GHSROS affected metastasis in these
animals.
Although no changes in proliferation were observed
in the present two-dimensional cell models, tumour size was
significantly greater in orthotopic MDA-MB-231-GHSROS xenograft
tumours. In vitro models of cell proliferation do not
replicate numerous aspects of cancer progression (33), including the tumour
microenvironment and growth factors, which are not present in an
in vitro system (45).
Microarray analysis of MDA-MB-231-GHSROS cells
cultured in vitro was conducted to reveal potential
GHSROS-regulated genes. The most highly upregulated gene,
HTR1F, belongs to a subgroup of 5-HT/serotonin receptors and
is significantly associated with breast cancer recurrence (46). This gene was downregulated in
GHSROS-overexpressing MCF10A cells, which also exhibited
increased in vitro migration, suggesting that HTR1F
is unlikely to play a major role in GHSROS-mediated cell
migration. Upregulation of the 5-HT signalling pathways in
metastatic breast cancer is pro-oncogenic, stimulating
pro-proliferative, invasive and anti-apoptotic pathways (46). Conversely, normal physiological
levels of the ligand, 5-HT, induce growth inhibition and apoptosis
in breast cancer cell lines, presumably by increased expression of
its receptors (47). TBX3
is a transcription factor that is considered a key driver of breast
cancer progression, which was elevated in
GHSROS-overexpressing breast cancer cells. TBX3 is
elevated in metastatic breast cancer, is correlated with reduced
metastasis-free survival, and potently promotes cell survival and
tumour growth in early-stage breast cancer cell models (29,48,49).
Additionally, TBX3 overexpression stimulates cell migration
in normal breast and breast cancer cells (49). Therefore, it was hypothesised that
TBX3 may represent a key mediator of the effects of
GHSROS in breast cancer.
Transcripts encoding a number of subunits of MHC-II
were repressed in MDA-MB-231 cells overexpressing GHSROS.
MHC-II genes encode cell surface proteins primarily involved in
antigen presentation and adaptive immunity (30,50,51).
Reduced tumour expression of the MHC-II complex increases breast
tumour aggressiveness and results in poor overall survival
(50,52). Conversely, increased MHC-II
expression is associated with a positive prognosis in
triple-negative breast cancer (50). Given that in vivo xenograft
models using human cell lines require immunocompromised or
syngeneic mice, the role of GHSROS in antitumour immunity is
currently challenging to investigate and could not be assessed in
the present xenograft model. Humanised mice that support human cell
lines and patient-derived xenografts (53,54)
will be critical in assessing if GHSROS overexpression
indeed facilitates immune system evasion. The present study
hypothesised that GHSROS, by downregulating critical
components of the acquired immune system, may promote breast tumour
cell survival.
There are several limitations to the present study.
Firstly, gene expression was not examined between tumours and
corresponding adjacent, normal tissue. Future studies will aim to
detect the expression of GHSROS in larger,
well-characterised clinical cohorts. Secondly, overexpression of
GHSROS should be complemented by knockdown experiments,
using, for example, short hairpin RNA or modified ASOs. We recently
generated ASOs targeting GHSROS, revealing that these
compounds reciprocally regulate GHSROS-mediated expression
and function of prostate cancer cell lines (Thomas et al,
unpublished data). We aim to assess these ASOs in a future breast
cancer study. Finally, 3D invasion assays, complementing the 2D
in vitro assays employed in this study, may provide critical
further insights into the function of GHSROS. 2D assays,
particularly invasion assays (22), are not fully representative of gene
function and may lead to discordant results, as observed when
comparing 2D in vitro proliferation assay data and in
vivo xenograft tumour growth in this study. 3D invasion assays
will be employed in a future study to further determine the
function of GHSROS.
In conclusion, the present study examined the
expression and function of the lncRNA GHSROS in breast
cancer, suggesting a potential role for GHSROS in breast
cancer cell migration and tumour growth. These data expand on
recent findings regarding GHSROS in lung cancer (19) and provide a rationale for further
investigations into this lncRNA in cancer.
Acknowledgments
The authors would like to acknowledge the
scientific and technical assistance of the Translational Research
Institute Preclinical Imaging Facility.
Funding
This work was supported by the National Health and
Medical Research Council Australia (grant nos. 1002255 and 1059021;
to LKC, ACH, RNV and IS), the Cancer Council Queensland (grant no.
1098565; to ACH, RNV, LKC and IS), the Australian Research Council
(grant no. DP140100249; to ACH and LKC), a QUT Vice-Chancellor's
Senior Research Fellowship (to IS), the Movember Foundation and the
Prostate Cancer Foundation of Australia through a Movember
Revolutionary Team Award, the Australian Government Department of
Health, and the Australian Prostate Cancer Research Centre,
Queensland (LKC and CCN), Queensland University of Technology. The
Translational Research Institute is supported by a grant from the
Australian Government.
Availability of data and materials
The datasets generated and/or analysed during the
current study are available in the Gene Expression Omnibus
repository, [https://www.ncbi.nlm.nih.gov/geo/query/acc.cgi?acc=GSE35001]
Authors' contributions
PBT, IS, PLJ and LKC conceived and designed the
study, and interpreted the data. PBT, AS, MM, IS, LKC and PLJ
performed laboratory experiments. IS and PBT performed
computational biology analyses. PBT, LKC, PLJ and IS wrote the
article. All authors (PBT, IS, PLJ, MDG, MM, GJC, AS, ETS, CW, EJW,
CCN, ACH, RML, RNV and LKC) contributed to the conception and
design of the study, interpretation of the data and writing of the
manuscript. LKC approved the final version of the manuscript.
Ethics approval and consent to
participate
Experiments were approved by the University of
Queensland and QUT animal ethics committees (TRI/QUT/328/16).
Approval for cell line use was granted by the QUT Human Research
Ethics Committee.
Patient consent for publication
Not applicable.
Competing interests
The authors declare that they have no competing
interests.
References
|
1
|
Mattick JS and Rinn JL: Discovery and
annotation of long noncoding RNAs. Nat Struct Mol Biol. 22:5–7.
2015. View Article : Google Scholar : PubMed/NCBI
|
|
2
|
Deveson IW, Hardwick SA, Mercer TR and
Mattick JS: The Dimensions, dynamics, and relevance of the
mammalian noncoding transcriptome. Trends Genet. 33:464–478. 2017.
View Article : Google Scholar : PubMed/NCBI
|
|
3
|
Hu X, Sood AK, Dang CV and Zhang L: The
role of long noncoding RNAs in cancer: The dark matter matters.
Curr Opin Genet Dev. 48:8–15. 2018. View Article : Google Scholar :
|
|
4
|
Quinn JJ and Chang HY: Unique features of
long non-coding RNA biogenesis and function. Nat Rev Genet.
17:47–62. 2016. View Article : Google Scholar
|
|
5
|
Sun M and Kraus WL: From discovery to
function: The expanding roles of long non-coding RNAs in physiology
and disease. Endocr Rev. Jan 7–2015.Epub ahead of print. View Article : Google Scholar
|
|
6
|
Jemal A, Bray F, Center MM, Ferlay J, Ward
E and Forman D: Global cancer statistics. CA Cancer J Clin.
61:69–90. 2011. View Article : Google Scholar : PubMed/NCBI
|
|
7
|
Australian Institute of Health and
Welfare: Cancer in Australia: Actual incidence data from 1982 to
2013 and mortality data from 1982 to 2014 with projections to 2017.
Asia Pac J Clin Oncol. 14:5–15. 2018. View Article : Google Scholar
|
|
8
|
ENCODE Project Consortium: The ENCODE
(ENCyclopedia Of DNA Elements) Project. Science. 306:636–640. 2004.
View Article : Google Scholar : PubMed/NCBI
|
|
9
|
Kumar M, DeVaux RS and Herschkowitz JI:
Molecular and cellular changes in breast cancer and new roles of
lncRNAs in breast cancer initiation and progression. Prog Mol Biol
Transl Sci. 144:563–586. 2016. View Article : Google Scholar : PubMed/NCBI
|
|
10
|
Amorim M, Salta S, Henrique R and Jerónimo
C: Decoding the usefulness of non-coding RNAs as breast cancer
markers. J Transl Med. 14:2652016. View Article : Google Scholar : PubMed/NCBI
|
|
11
|
Cerk S, Schwarzenbacher D, Adiprasito JB,
Stotz M, Hutterer GC, Gerger A, Ling H, Calin GA and Pichler M:
Current status of long non-coding RNAs in human breast cancer. Int
J Mol Sci. 17:172016. View Article : Google Scholar
|
|
12
|
Soudyab M, Iranpour M and Ghafouri-Fard S:
The role of long non-coding RNAs in breast cancer. Arch Iran Med.
19:508–517. 2016.PubMed/NCBI
|
|
13
|
Bhan A, Hussain I, Ansari KI, Kasiri S,
Bashyal A and Mandal SS: Antisense transcript long noncoding RNA
(lncRNA) HOTAIR is transcriptionally induced by estradiol. J Mol
Biol. 425:3707–3722. 2013. View Article : Google Scholar : PubMed/NCBI
|
|
14
|
He X, Bao W, Li X, Chen Z, Che Q, Wang H
and Wan XP: The long non-coding RNA HOTAIR is upregulated in
endometrial carcinoma and correlates with poor prognosis. Int J Mol
Med. 33:325–332. 2014. View Article : Google Scholar
|
|
15
|
Bhan A and Mandal SS: Estradiol-induced
transcriptional regulation of long non-coding RNA, HOTAIR. Methods
Mol Biol. 1366:395–412. 2016. View Article : Google Scholar
|
|
16
|
Xue X, Yang YA, Zhang A, Fong KW, Kim J,
Song B, Li S, Zhao JC and Yu J: LncRNA HOTAIR enhances ER signaling
and confers tamoxifen resistance in breast cancer. Oncogene.
35:2746–2755. 2016. View Article : Google Scholar :
|
|
17
|
Aiello A, Bacci L, Re A, Ripoli C,
Pierconti F, Pinto F, Masetti R, Grassi C, Gaetano C, Bassi PF, et
al: MALAT1 and HOTAIR long non-coding RNAs play opposite role in
estrogen-mediated transcriptional regulation in prostate cancer
cells. Sci Rep. 6:384142016. View Article : Google Scholar : PubMed/NCBI
|
|
18
|
Arun G, Diermeier S, Akerman M, Chang KC,
Wilkinson JE, Hearn S, Kim Y, MacLeod AR, Krainer AR, Norton L, et
al: Differentiation of mammary tumors and reduction in metastasis
upon Malat1 lncRNA loss. Genes Dev. 30:34–51. 2016. View Article : Google Scholar :
|
|
19
|
Whiteside EJ, Seim I, Pauli JP, O'Keeffe
AJ, Thomas PB, Carter SL, Walpole CM, Fung JN, Josh P, Herington
AC, et al: Identification of a long non-coding RNA gene, growth
hormone secretagogue receptor opposite strand, which stimulates
cell migration in non-small cell lung cancer cell lines. Int J
Oncol. 43:566–574. 2013. View Article : Google Scholar : PubMed/NCBI
|
|
20
|
Livak KJ and Schmittgen TD: Analysis of
relative gene expression data using real-time quantitative PCR and
the 2(-Delta Delta C(T)) method. Methods. 25:402–408. 2001.
View Article : Google Scholar
|
|
21
|
Ke N, Wang X, Xu X and Abassi YA: The
xCELLigence system for real-time and label-free monitoring of cell
viability. Methods Mol Biol. 740:33–43. 2011. View Article : Google Scholar : PubMed/NCBI
|
|
22
|
Limame R, Wouters A, Pauwels B, Fransen E,
Peeters M, Lardon F, De Wever O and Pauwels P: Comparative analysis
of dynamic cell viability, migration and invasion assessments by
novel real-time technology and classic endpoint assays. PLoS One.
7:e465362012. View Article : Google Scholar : PubMed/NCBI
|
|
23
|
Ritchie ME, Phipson B, Wu D, Hu Y, Law CW,
Shi W and Smyth GK: limma powers differential expression analyses
for RNA-sequencing and microarray studies. Nucleic Acids Res.
43:e472015. View Article : Google Scholar : PubMed/NCBI
|
|
24
|
Szklarczyk D, Morris JH, Cook H, Kuhn M,
Wyder S, Simonovic M, Santos A, Doncheva NT, Roth A, Bork P, et al:
The STRING database in 2017: Quality-controlled protein-protein
association networks, made broadly accessible. Nucleic Acids Res.
45:D362–D368. 2017. View Article : Google Scholar
|
|
25
|
Hartigan JA and Wong MA: Algorithm AS 136:
A k-means clustering algorithm. J R Stat Soc Ser C Appl Stat.
28:100–108. 1979.
|
|
26
|
Du J, Yuan Z, Ma Z, Song J, Xie X and Chen
Y: KEGG-PATH: Kyoto encyclopedia of genes and genomes-based pathway
analysis using a path analysis model. Mol Biosyst. 10:2441–2447.
2014. View Article : Google Scholar : PubMed/NCBI
|
|
27
|
Russell PJ, Raghavan D, Gregory P, Philips
J, Wills EJ, Jelbart M, Wass J, Zbroja RA and Vincent PC: Bladder
cancer xenografts: A model of tumor cell heterogeneity. Cancer Res.
46:2035–2040. 1986.PubMed/NCBI
|
|
28
|
Lim E, Modi KD and Kim J: In vivo
bioluminescent imaging of mammary tumors using IVIS spectrum. J Vis
Exp. Apr 29–2009.Epub ahead of print. View
Article : Google Scholar
|
|
29
|
Amir S, Simion C, Umeh-Garcia M, Krig S,
Moss T, Carraway KL III and Sweeney C: Regulation of the T-box
transcription factor Tbx3 by the tumour suppressor microRNA-206 in
breast cancer. Br J Cancer. 114:1125–1134. 2016. View Article : Google Scholar : PubMed/NCBI
|
|
30
|
Trowsdale J and Knight JC: Major
histocompatibility complex genomics and human disease. Annu Rev
Genomics Hum Genet. 14:301–323. 2013. View Article : Google Scholar : PubMed/NCBI
|
|
31
|
Boegel S, Löwer M, Schäfer M, Bukur T, de
Graaf J, Boisguérin V, Türeci O, Diken M, Castle JC and Sahin U:
HLA typing from RNA-Seq sequence reads. Genome Med. 4:1022012.
View Article : Google Scholar : PubMed/NCBI
|
|
32
|
Tabibzadeh SS, Sivarajah A, Carpenter D,
Ohlsson-Wilhelm BM and Satyaswaroop PG: Modulation of HLA-DR
expression in epithelial cells by interleukin 1 and estradiol-17
beta. J Clin Endocrinol Metab. 71:740–747. 1990. View Article : Google Scholar : PubMed/NCBI
|
|
33
|
Kocatürk B and Versteeg HH: Orthotopic
injection of breast cancer cells into the mammary fat pad of mice
to study tumor growth. J Vis Exp. Feb 8–2015.Epub ahead of print.
View Article : Google Scholar : PubMed/NCBI
|
|
34
|
Lanzós A, Carlevaro-Fita J, Mularoni L,
Reverter F, Palumbo E, Guigó R and Johnson R: Discovery of cancer
driver long noncoding RNAs across 1112 tumour genomes: New
candidates and distinguishing features. Sci Rep. 7:415442017.
View Article : Google Scholar : PubMed/NCBI
|
|
35
|
Qiu MT, Hu JW, Yin R and Xu L: Long
noncoding RNA: An emerging paradigm of cancer research. Tumour
Biol. 34:613–620. 2013. View Article : Google Scholar : PubMed/NCBI
|
|
36
|
Wenric S, ElGuendi S, Caberg JH, Bezzaou
W, Fasquelle C, Charloteaux B, Karim L, Hennuy B, Frères P,
Collignon J, et al: Transcriptome-wide analysis of natural
antisense transcripts shows their potential role in breast cancer.
Sci Rep. 7:174522017. View Article : Google Scholar : PubMed/NCBI
|
|
37
|
Nie L, Wu HJ, Hsu JM, Chang SS, Labaff AM,
Li CW, Wang Y, Hsu JL and Hung MC: Long non-coding RNAs: Versatile
master regulators of gene expression and crucial players in cancer.
Am J Transl Res. 4:127–150. 2012.PubMed/NCBI
|
|
38
|
Pan YF, Feng L, Zhang XQ, Song LJ, Liang
HX, Li ZQ and Tao FB: Role of long non-coding RNAs in gene
regulation and oncogenesis. Chin Med J (Engl). 124:2378–2383.
2011.
|
|
39
|
Collette J, Le Bourhis X and Adriaenssens
E: Regulation of human breast cancer by the long non-coding RNA
H19. Int J Mol Sci. 18:182017. View Article : Google Scholar
|
|
40
|
Miao Y, Fan R, Chen L and Qian H: Clinical
significance of long non-coding RNA MALAT1 expression in tissue and
serum of breast cancer. Ann Clin Lab Sci. 46:418–424.
2016.PubMed/NCBI
|
|
41
|
Avazpour N, Hajjari M and Tahmasebi
Birgani M: HOTAIR: A promising long non-coding RNA with potential
role in breast invasive carcinoma. Front Genet. 8:1702017.
View Article : Google Scholar :
|
|
42
|
Chiu HS, Somvanshi S, Patel E, Chen TW,
Singh VP, Zorman B, Patil SL, Pan Y, Chatterjee SS, Sood AK, et al
Cancer Genome Atlas Research Network: Pan-Cancer Analysis of lncRNA
regulation supports their targeting of cancer genes in each tumor
context. Cell Rep. 23:297–312.e12. 2018. View Article : Google Scholar : PubMed/NCBI
|
|
43
|
Iorns E, Drews-Elger K, Ward TM, Dean S,
Clarke J, Berry D, El Ashry D and Lippman M: A new mouse model for
the study of human breast cancer metastasis. PLoS One.
7:e479952012. View Article : Google Scholar : PubMed/NCBI
|
|
44
|
Nagini S: Breast Cancer: Current molecular
therapeutic targets and new players. Anticancer Agents Med Chem.
17:152–163. 2017. View Article : Google Scholar
|
|
45
|
Cavo M, Fato M, Peñuela L, Beltrame F,
Raiteri R and Scaglione S: Microenvironment complexity and matrix
stiffness regulate breast cancer cell activity in a 3D in vitro
model. Sci Rep. 6:353672016. View Article : Google Scholar : PubMed/NCBI
|
|
46
|
Kopparapu PK, Tinzl M, Anagnostaki L,
Persson JL and Dizeyi N: Expression and localization of serotonin
receptors in human breast cancer. Anticancer Res. 33:363–370.
2013.PubMed/NCBI
|
|
47
|
Pai VP, Marshall AM, Hernandez LL, Buckley
AR and Horseman ND: Altered serotonin physiology in human breast
cancers favors paradoxical growth and cell survival. Breast Cancer
Res. 11:R812009. View Article : Google Scholar : PubMed/NCBI
|
|
48
|
Li J, Weinberg MS, Zerbini L and Prince S:
The oncogenic TBX3 is a downstream target and mediator of the
TGF-β1 signaling pathway. Mol Biol Cell. 24:3569–3576. 2013.
View Article : Google Scholar : PubMed/NCBI
|
|
49
|
Peres J, Davis E, Mowla S, Bennett DC, Li
JA, Wansleben S and Prince S: The highly homologous T-Box
transcription factors, TBX2 and TBX3, have distinct roles in the
oncogenic process. Genes Cancer. 1:272–282. 2010. View Article : Google Scholar : PubMed/NCBI
|
|
50
|
Forero A, Li Y, Chen D, Grizzle WE, Updike
KL, Merz ND, Downs-Kelly E, Burwell TC, Vaklavas C, Buchsbaum DJ,
et al: Expression of the MHC Class II pathway in triple-negative
breast cancer tumor cells is associated with a good prognosis and
infiltrating lymphocytes. Cancer Immunol Res. 4:390–399. 2016.
View Article : Google Scholar : PubMed/NCBI
|
|
51
|
Doonan BP and Haque A: HLA Class II
antigen presentation in prostate cancer cells: A novel approach to
prostate tumor immu-notherapy. Open Cancer Immunol J. 3:1–7. 2010.
View Article : Google Scholar : PubMed/NCBI
|
|
52
|
Thibodeau J, Bourgeois-Daigneault MC and
Lapointe R: Targeting the MHC Class II antigen presentation pathway
in cancer immunotherapy. OncoImmunology. 1:908–916. 2012.
View Article : Google Scholar : PubMed/NCBI
|
|
53
|
Walsh NC, Kenney LL, Jangalwe S, Aryee KE,
Greiner DL, Brehm MA and Shultz LD: Humanized mouse models of
clinical disease. Annu Rev Pathol. 12:187–215. 2017. View Article : Google Scholar :
|
|
54
|
Zhao Y, Shuen TWH, Toh TB, Chan XY, Liu M,
Tan SY, Fan Y, Yang H, Lyer SG, Bonney GK, et al: Development of a
new patient-derived xenograft humanised mouse model to study
human-specific tumour microenvironment and immunotherapy. Gut.
67:1845–1854. 2018. View Article : Google Scholar : PubMed/NCBI
|