Introduction
Ovarian cancer (OC) is the most lethal type of tumor
of the female reproductive system and has the third highest
incidence rate amongst gynecological malignancies worldwide
(1). It accounted for 2.5% of all
malignancies in women and 5% of all cancer-associated mortalities
in females in the USA in 2018, due to a poor overall survival rate
(2). There were an estimated
22,240 new cases of OC and 14,070 OC-associated mortalities in the
USA in 2018 (3). Despite advances
in surgical techniques and adjunct therapies, the survival rate for
patients with OC has remained relatively unchanged. Therefore,
determining the precise oncogenic mechanisms and developing novel
effective therapies may improve the survival rates for patients
with OC.
ATPase family AAA domain-containing protein 2
(ATAD2), a member of the ATPase family, is a relatively recently
identified oncogene (4), which
contains two conserved domains; a bromodomain responsible for
histone binding and an ATPase domain that regulates ATPase activity
and protein multimerization (5).
The ATAD2 gene is located on chromosome 8q24.13, a region that is
frequently amplified in different types of tumor (6). ATAD2 expression is upregulated in
several different types of cancer, including breast (7), colorectal (8), endometrial (9), gastric (10) and liver cancer (11). Studies have demonstrated that ATAD2
promotes cell proliferation (7),
inhibits apoptosis (11) and
enhances metastasis (12,13) during tumorigenesis and progression.
Overexpression of ATAD2 is typically associated with poor clinical
outcomes and predicts unfavorable survival outcomes (8,10,14).
ATAD2 expression has also recently been reported to be upregulated
in male germ cells and embryonic stem cells, and facilitates
chromatin remodeling under normal physiological conditions
(15). Although ATAD2 drives cell
proliferation and cancer progression in several types of cancer,
its expression and significance in OC remains unclear.
In the present study, ATAD2 was identified to be
frequently amplified in OC and that upregulation of ATAD2 was
associated with OC tissues and sub-populations of cells within
tissues with increased proliferative capacity, and was correlated
with poorer clinical outcomes. Furthermore, CRISPR-Cas9-mediated
genomic disruption of the ATAD2 gene resulted in deactivation of
the mitogen-activated protein kinase (MAPK) pathway and reduced
proliferation of OC.
Materials and methods
Cell lines and culture conditions
The human OC cell lines SKOV3 and A2780 were
obtained from the National Infrastructure of Cell Line Resources.
The human embryonic kidney cell line 293T was obtained from
American Type Culture Collection. All cell lines were cultured in
DMEM (HyClone; GE Healthcare Life Sciences) with 10% FBS (Gibco;
Thermo Fisher Scientific, Inc.) at 37°C with 5% CO2 in a
humidified incubator.
Immunohistochemistry (IHC) analysis
A standard IHC protocol was performed on a
commercially obtained OC tissue microarray (OV802a) containing 60
primary OC tissues, 10 tissues of stomach metastases to the ovary
and 10 adjacent normal tissues from Alenabio to assess the protein
expression levels of ATAD2 in OC. Following IHC staining with a
specific antibody against ATAD2 (1:500; catalog no. HPA029424;
Sigma-Aldrich; Merck KGaA) overnight at 4°C, the samples were
stained with a horseradish peroxidase-conjugated secondary goat
anti-rabbit antibody (1:2,500; catalog no. ZB-2301; OriGene
Technologies, Inc.) for 1 h at room temperature. The
immunohistochemical signals were then observed under a light
microscope (magnification, ×200). The staining intensity was scored
as follows: 0, Negative; 1, weak; 2, moderate; and 3, strong. The
percentage of ATAD2-positive cells was also scored as follows: 0,
0-10%; 1, >10-25%; 2, >25-50%; 3, >50-75%; and 4,
>75-100%. The final immunoreactive score was determined by
multiplying the intensity and percentage scores, with a minimum
score of 0 and a maximum score of 12.
CRISPR-Cas9-mediated ATAD2 gene
disruption
CRISPR-Cas9 gene editing technology was used to
disrupt ATAD2 expression at the genome level. Two pairs of single
guide RNA (sgRNA) specifically targeting ATAD2 exon 6 and exon 2
were designed using the E-CRISP online tool (http://www.e-crisp.org/E-CRISP/designcrispr.html)
and cloned into the lentiCRISPRv2 vector (Addgene Inc.; catalog no.
52961). The lentiviruses for the ATAD2 sgRNAs or the vector control
were generated in 293T cells by co-transfection of the two
recombined lentiCRISPRv2 plasmids or the empty vector with the
packaging vectors pMD2G and psPAX2 (Addgene, Inc.) using
Lipofectamine 3000® (Invitrogen; Thermo Fisher
Scientific, Inc.). The cells were treated with 2 µg/ml
puromycin 72 h after lentiviral infection. The deletion of ATAD2
expression was determined by western blotting. The target sgRNA
sequences were as follows: sgRNA-ATAD2-1 forward,
5′-CACCGGAAACAACTGATAATCAAGA-3′ and reverse,
3′-CCTTTGTTGACTATTAGTTCTCAAA-5′; and sgRNA-ATAD2-2 forward,
5′-CACCGTAGGCAGTTGGCCAGACAGC-3′ and reverse,
3′-CATCCGTCAACCGGTCTGTCGCAAA-5′.
Real-time cell analyzer (RTCA)
An RTCA (xCELLigence; ACEA Biosciences, Inc.) was
used to monitor cell proliferation in real time as described
previously (16). The RTCA system
measures electrical impedance variations and presents the results
in the form of the cell index which reflects cellular
proliferation. For each cell line, 3×10³ cells/well were
seeded in an E-plate, which was placed in a RTCA device at 37°C
with 5% CO2. The cell index was recorded automatically
in 15-min intervals. The recorded curve is presented as the mean of
cell index ± standard error.
Colony formation assay
Cells were seeded in a 6-well plate at a density of
500 cells/well and allowed to grow at 37°C with 5% CO2
for 14 days after which, cells were stained with 0.5% crystal
violet (Sigma-Aldrich; Merck KGaA) at room temperature for 10 min.
The colonies in each well were observed and counted under a light
microscope (magnification, ×100). Three fields of view were
observed and only colonies containing >50 cells were
counted.
Western blot analysis
Whole-cell protein was extracted using RIPA lysis
buffer (Beijing Solarbio Science & Technology Co., Ltd.) and
quantified using a bicinchoninic acid assay protein assay kit
(Thermo Fischer Scientific, Inc.). Proteins (40 µg/lane)
were denatured, loaded on a 10% gel and resolved using SDS-PAGE.
Proteins were transferred to PVDF membranes using semi-dry transfer
at 15 V for 2 h (EMD Millipore). The membranes were probed with
primary antibodies against ATAD2 (1:500; catalog no. HPA029424l
Sigma-Aldrich; Merck KGaA), JNK (1:1,000; catalog no. 9252T; Cell
Signaling Technology, Inc.), phosphorylated (p)-JNK (1:1,000;
catalog no. 4668T; Cell Signaling Technology, Inc.), ERK (1:1,000;
catalog no. 4695T; Cell Signaling Technology, Inc.), p-ERK
(1:1,000; catalog no. 4370T; Cell Signaling Technology, Inc.), P38
(1:1,000; catalog no. 8690T; Cell Signaling Technology, Inc.),
p-P38 (1:1,000; catalog no. 4511T; Cell Signaling Technology, Inc.)
or GAPDH (1:3,000; catalog no. 5174S; Cell Signaling Technology,
Inc.) overnight at 4°C, followed by incubation with a horseradish
peroxidase-conjugated secondary goat anti-rabbit (catalog no.
sc-2004) or anti-mouse (catalog no. sc-2005) poly-clonal
immunoglobulin G antibody (both 1:8,000; Santa Cruz Biotechnology,
Inc.) at room temperature for 1 h. Signals were visualized using an
enhanced chemiluminescence kit (Applygen Technologies Inc.). The
results were analyzed using Image J 1.46r software (National
Institutes of Health).
Multiplex IHC staining
Multiplex IHC staining was performed to examine the
co-expression of ATAD2 and Ki-67 in OC tissue sections on a
commercially obtained OC tissue microarray (OV241c; containing 12
primary OC tissues) from Alenabio using an Opal™ 4-Color Manual IHC
kit (PerkinElmer, Inc.). Briefly, the sections were first incubated
with a specific ATAD2 antibody (1:1,000; catalog no. HPA029424;
Sigma-Aldrich; Merck KGaA) for 1 h at room temperature, followed by
incubation with a goat anti-rabbit immunoglobulin G antibody
(1:5,000; catalog no. NEL840001KT, PerkinElmer, Inc.) for 1 h at
room temperature and subsequently labeled with Opal 520 fluorophore
(PerkinElmer, Inc.). For Ki-67 staining, an anti-Ki67 antibody
(1:1,000; catalog no. ZM-0166; OriGene Technologies, Inc.) was used
at room temperature for 1 h and Opal 690 fluorophore (PerkinElmer,
Inc.) was used for labeling. Finally, nuclei were stained with DAPI
(PerkinElmer, Inc.) for 30 min at room temperature and mounted with
anti-fade medium. The inForm 2.4.2 software (PerkinElmer, Inc.) was
used to analyze the multispectral images.
Public databases and dataset
analyses
Data from public databases were used as provided,
without additional processing or normalization of the data, unless
otherwise indicated. To assess the expression of ATAD2 mRNA in OC,
the CSIOVDB database (version 1.0) (17) was used, which includes
transcriptomic profiles for 3,431 OC and normal ovary tissues. To
validate the upregulation of ATAD2 mRNA in OC compared with the
normal samples, expression of ATAD2 in four independent profiles
[GSE12470 (18), GSE14407
(19), GSE18520 (20) and GSE26712 (21)] from the Gene Expression Omnibus
(GEO) database (https://www.ncbi.nlm.nih.gov/geo) were analyzed using
the GEO2R online tool (ncbi.nlm.nih.gov/geo/geo2r/).
Putative copy-number calls determined using GISTIC
version 2.0 for The Cancer Genome Atlas (TCGA) datasets were
obtained for copy-number variation (CNV) analysis (22). Copy-number values were defined as
follows: −2, homozygous deletion; −1, hemizygous deletion; 0,
neutral / no change; 1, gain; and 2, high level amplification.
Comparison of the copy numbers in 607 OC tissues, 130 normal ovary
tissues and 431 paired normal blood specimens from TCGA dataset was
performed using Oncomine analysis (23). cBioPortal for Cancer Genomics
(cbioportal.org/) (24) was used for calculating the
association between ATAD2 mRNA expression and copy number values,
and also for plotting the CNV status of ATAD2 in cancer tissue
samples from TCGA and cell line samples from the Cancer Cell Line
Encyclopedia (CCLE; https://portals.broadinstitute.org/ccle).
The association between ATAD2 expression and OC
International Federation of Gynecology and Obstetrics (FIGO) grade
(25) or FIGO stage (25) was analyzed using the expression
data of OC cohorts from the CSIOVDB database and further validated
in the OC cohort of the GSE9811 dataset (26).
The prognostic value of ATAD2 for patients with OC
was analyzed using the Kaplan-Meier plotter online tool (27), which integrates gene expression
with disease-free survival (DFS) and overall survival (OS) data of
1,816 OC samples. The survival curves were calculated using the
Kaplan-Meier method, and statistical significance was assessed
using the log-rank test. The hazard ratio (HR) with 95% confidence
interval (CI) was calculated. For further validation, a
meta-analysis on ATAD2 HRs for OS and DFS in randomly selected
multiple OC cohorts with clinical OS and/or DFS data from the GEO
database, GSE30161 (28), GSE18520
(29), GSE 19829 (30), GSE63885 (31), GSE26193 (32), GSE9891 (33), GSE65986 (34) and GSE51373 (35), was performed.
For ATAD2 co-expressed genes analyses, the OC cohort
from TCGA (n=307) and another large OC cohort from GSE9891
(33) (n=285) were used to perform
co-expression data mining analysis using R2: Genomics Analysis and
Visualization Platform (r2.amc.nl). For Gene Ontology (GO) analysis
of the enriched biological processes, the Database for Annotation,
Visualization and Integrated Discovery (DAVID; version 6.8)
bioinformatics resource (36) was
used.
Statistical analysis
The data were analyzed by Mann-Whitney U test for
comparison of two groups and by Kruskal-Wallis test for multiple
groups followed by an uncorrected Dunn's multiple comparisons test
in GraphPad Prism version 7.0 (GraphPad Software, Inc.). The
expressional correlation analyses between ATAD2 and its correlated
genes in TCGA and GSE9891 (33)
datasets were conducted by Pearson's correlation analysis and a
false discovery rate test using resources within R2, and all data
statistical analyses on CSIOVDB samples were calculated
automatically by CSIOVDB (http://csibio.nus.edu.sg/CSIOVDB/CSIOVDB.html).
P<0.05 was considered to indicate a statistically significant
difference.
Results
ATAD2 protein expression is frequently
upregulated in OC compared with the non-cancerous normal
tissue
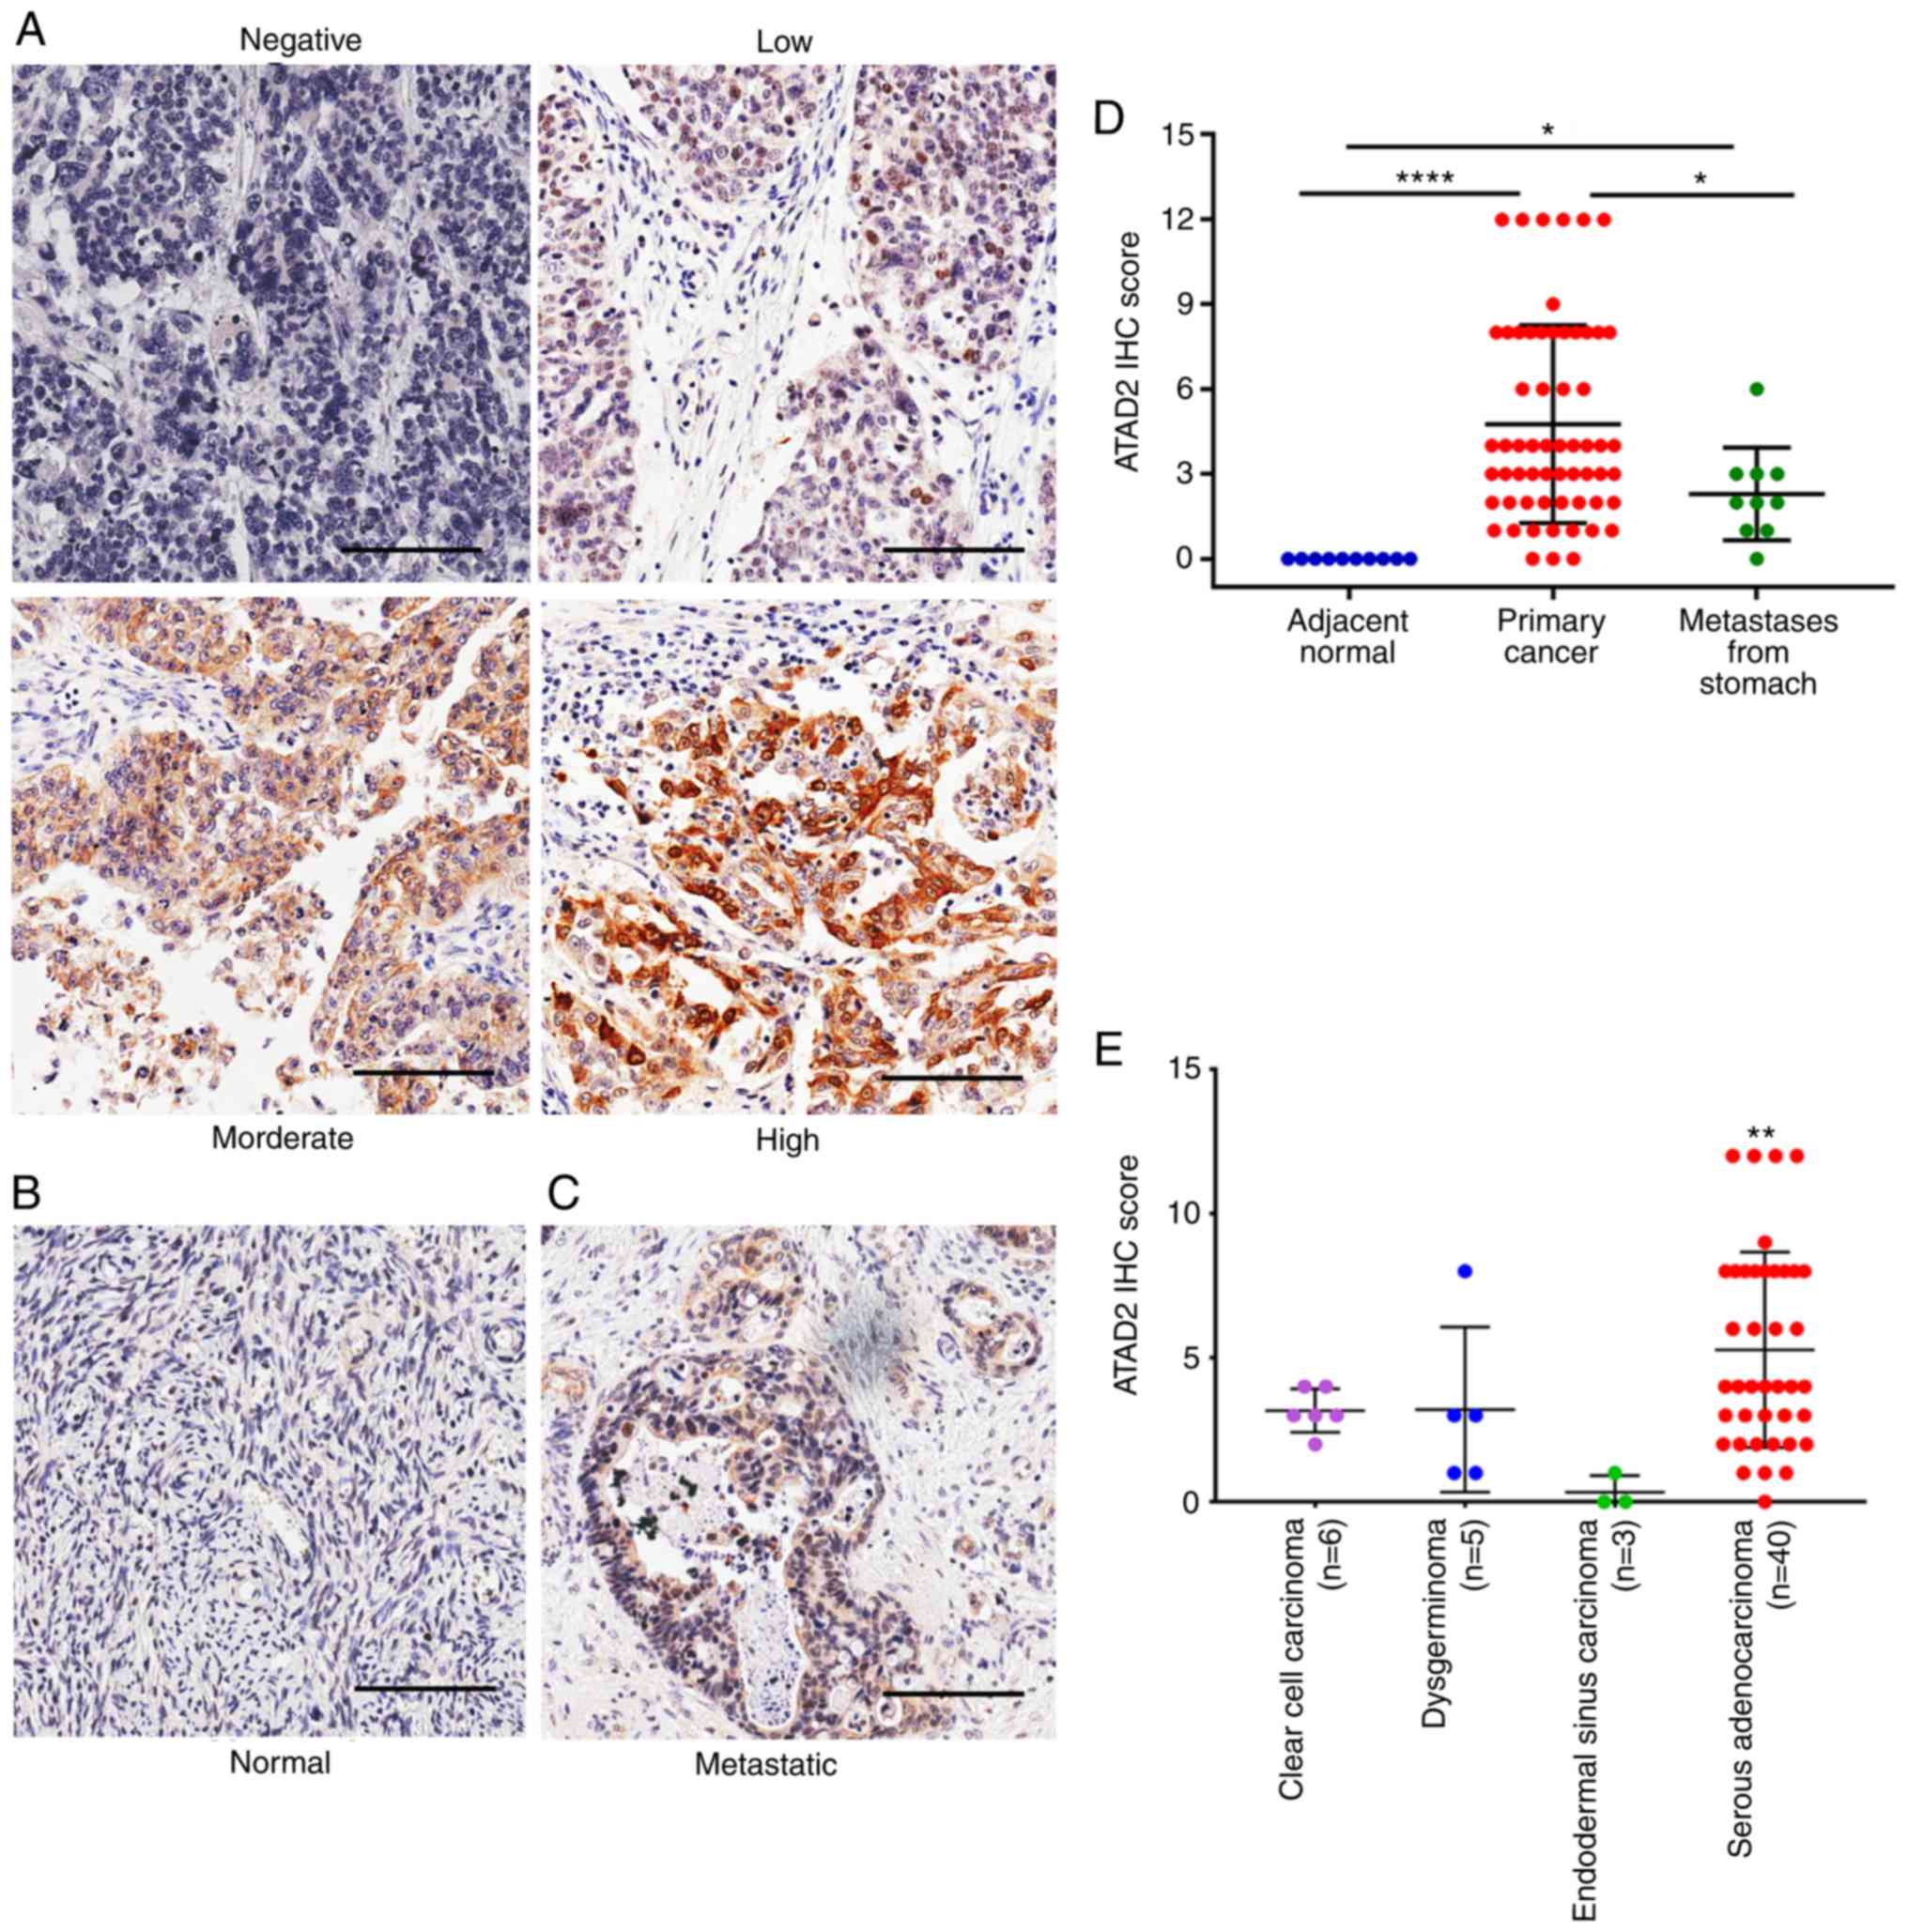
To assess the expression of ATAD2 in OC, IHC
analysis was performed on an OC tissue microarray containing 60
primary tissues, 10 metastatic tissues from the stomach and 10
adjacent normal ovary tissues. ATAD2 expression was positive in
83.3% (50/60) of primary OC tissues, including 46.67% of tissues
with low expression (28/60), 25.00% of tissues with moderate
expression (15/60) and 11.67% of tissues with high expression
(7/60) (Fig. 1A). By contrast,
none of the adjacent normal tissues (0/10) had detectable levels of
ATAD2 expression (Fig. 1B).
Metastatic OC from other primary malignancies accounted for 5-30%
of overall ovarian malignancies, and stomach cancer is one of the
most common primary origins (37).
ATAD2 was detectable in 70% (7/10) of the metastatic ovarian
malignancies from the stomach (Fig.
1C), with 60% (6/10) of cases exhibiting low expression and 10%
(1/10) of cases exhibiting moderate expression.
By comparing IHC scores, ATAD2 expression level in
primary OC was significantly higher compared with the adjacent
normal tissue (P<0.0001; Fig.
1D). ATAD2 expression in the metastatic ovarian malignancies
from stomach was also significantly higher compared with the
adjacent ovarian normal tissue (P<0.05), but significantly lower
compared with the primary OC tissues (P<0.05; Fig. 1D), suggesting that ATAD2 expression
may be used as a diagnostic marker to distinguish secondary ovarian
malignancies and primary OC. Regarding different OC subtypes, ATAD2
expression was significantly higher in serous adenocarcinoma
compared with endodemermal sinus carcinoma (P<0.01; Fig. 1E).
ATAD2 expression is upregulated in OC
based on multiple public datasets
To validate upregulation of ATAD2 in OC, ATAD2 mRNA
expression levels were assessed in the CSIOVDB dataset (17), which includes transcriptomic
profiles for 3,431 OC and normal ovary tissues. As presented in
Fig. 2A, ATAD2 mRNA expression
levels were significantly higher in OC compared with the normal
tissues. Significant upregulation of ATAD2 mRNA levels in OC
compared with normal tissues was further validated in four
independent GEO profiles, GSE12470 (Fig. 2B), GSE14407 (Fig. 2C), GSE18520 (Fig. 2D) and GSE26712 (Fig. 2E). Physiological expression levels
of ATAD2 in ovarian normal tissues and upregulation of expression
in cancerous tissues support the notion that ATAD2 may serve as a
biomarker in OC.
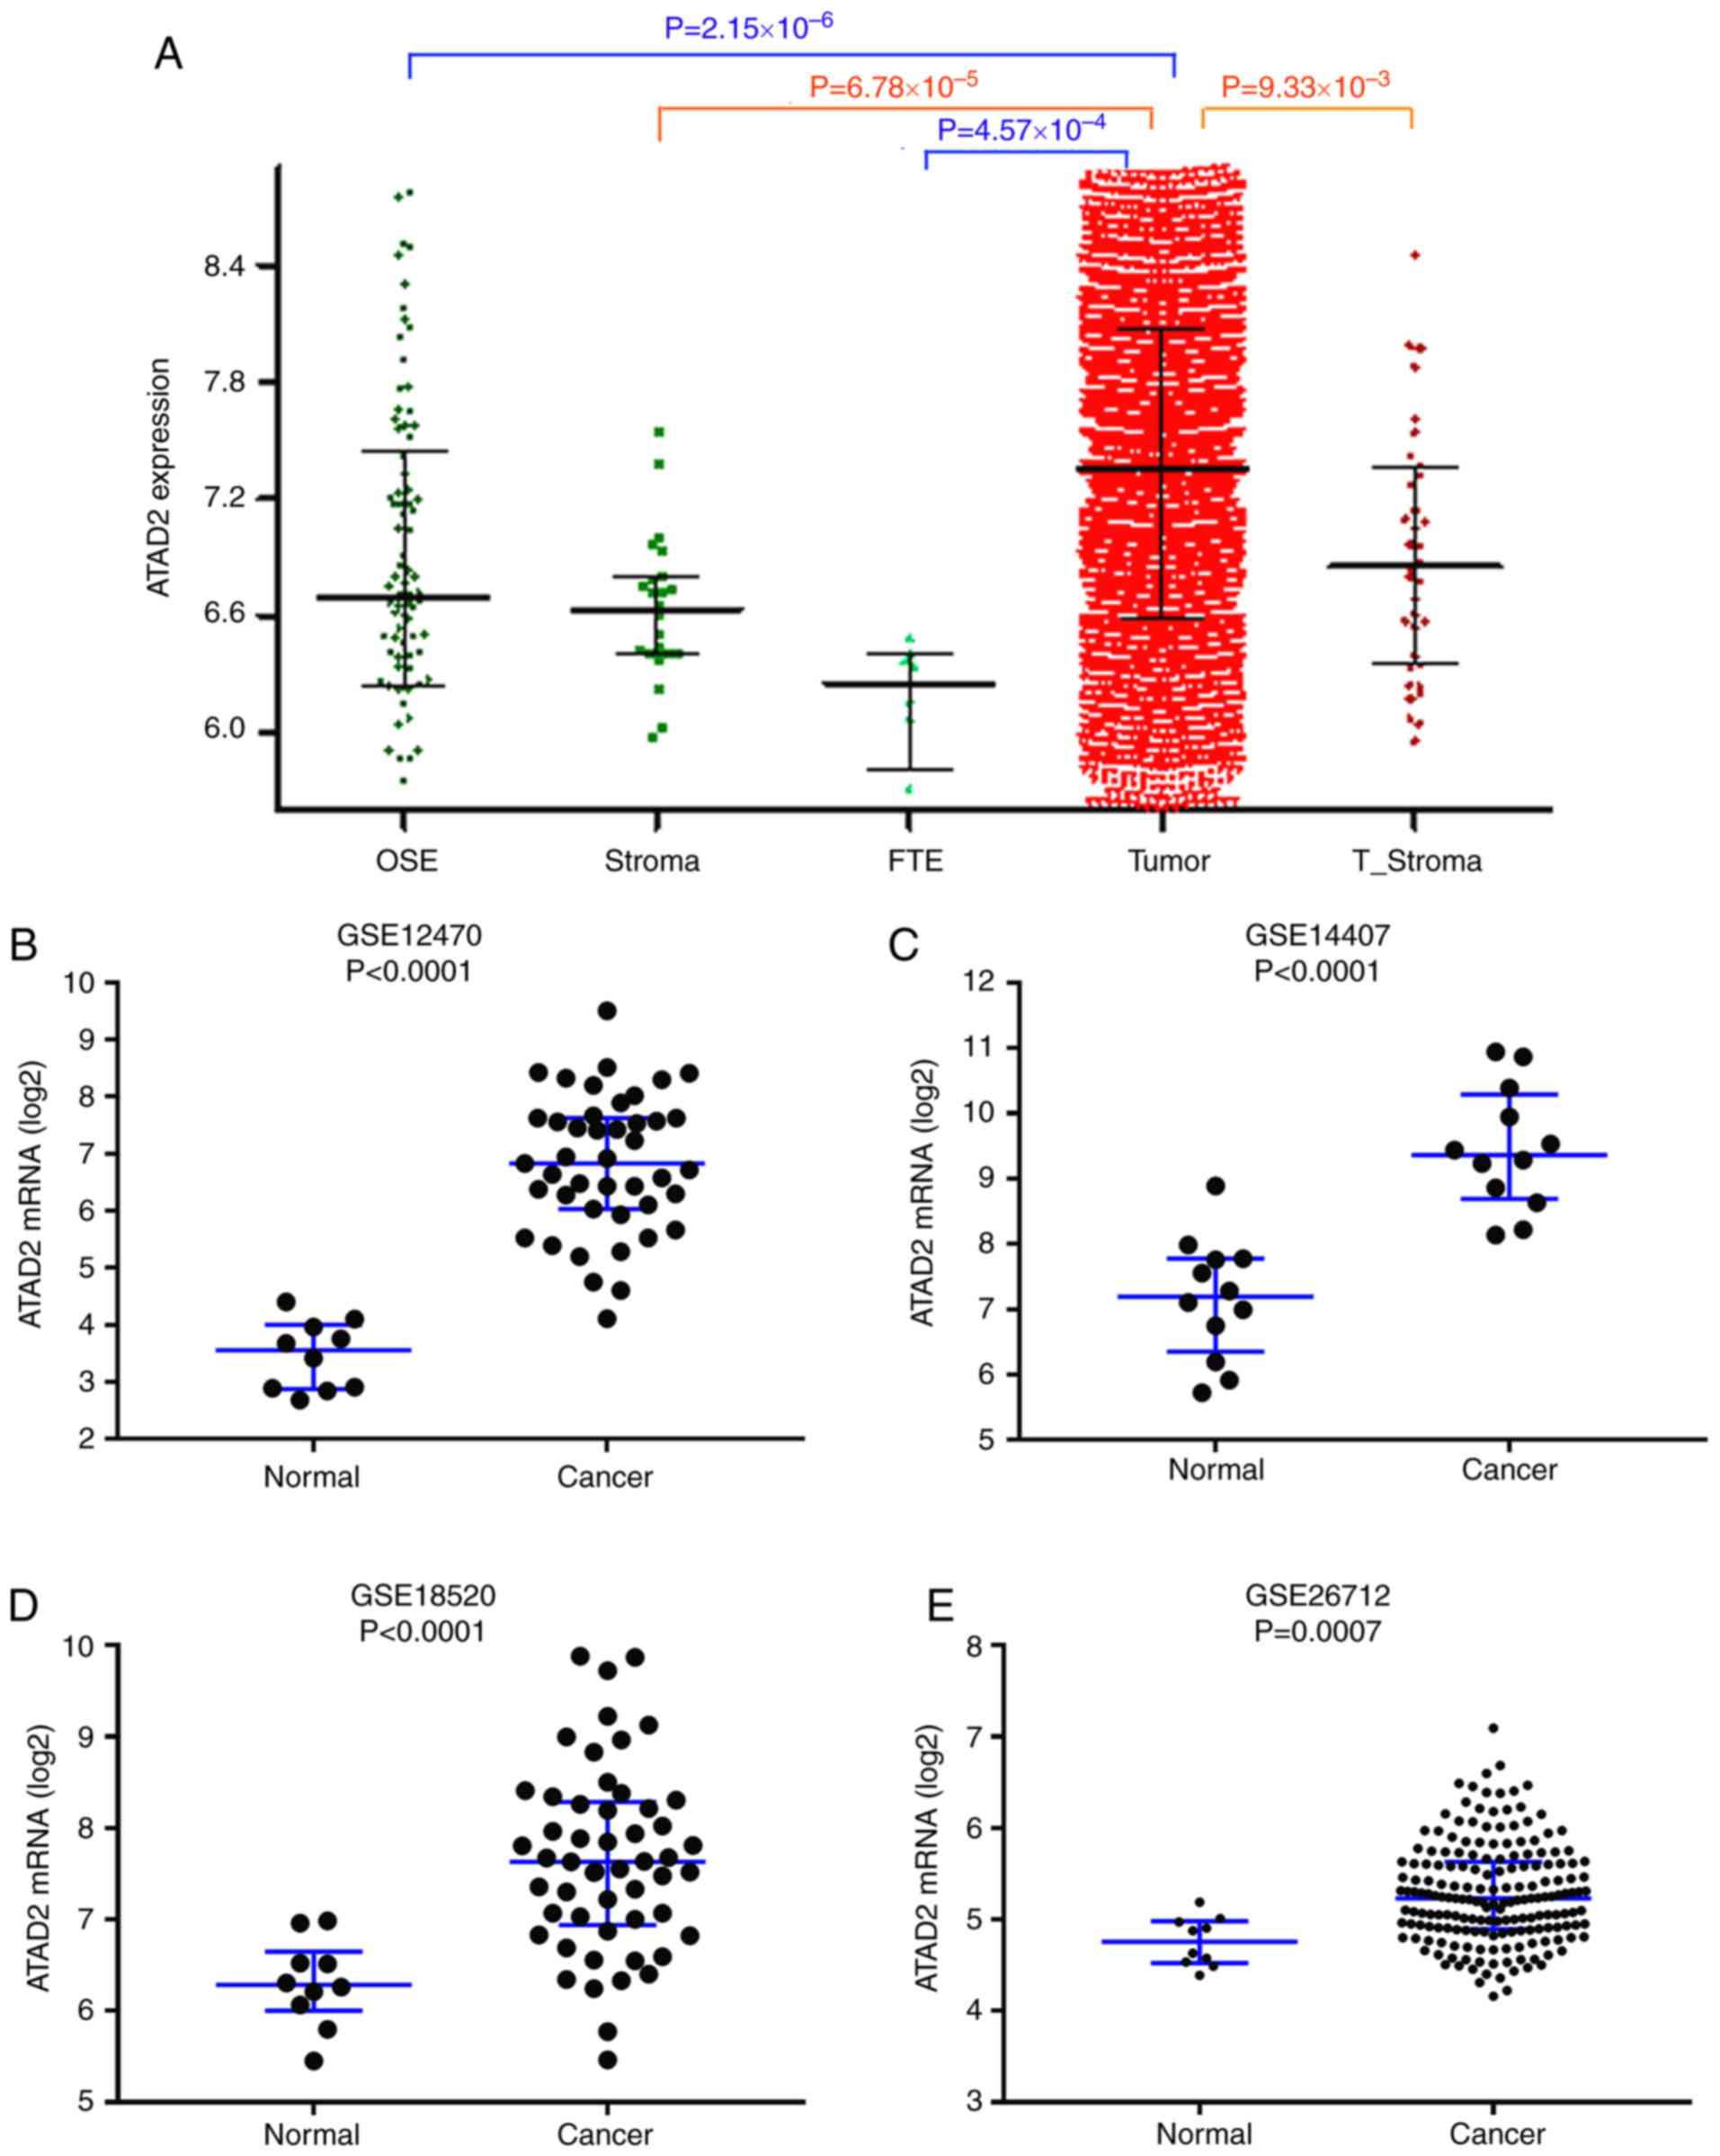 | Figure 2ATAD2 mRNA expression levels are
upregulated in OC. (A) ATAD2 expression levels in a series of
ovarian tissues including normal OSE, FTE, normal stroma, T_Stroma
and paired primary tumor tissues from patients with high grade OC
in the CSIOVDB database. mRNA expression levels of ATAD2 in OC and
non-cancerous normal tissues were further analyzed in four
independent mRNA microarray profiles, (B) GSE12470, (C) GSE14407,
(D) GSE18520 and (E) GSE26712. ATAD2 mRNA expression levels were
significantly upregulated in OC tissues. Data are presented as the
median ± interquartile range. OC, ovarian cancer; ATAD2, ATPase
family AAA domain-containing protein 2; OSE, ovarian surface
epithelium; FTE, normal fallopian tubes; T_Stroma, tumor
stroma. |
Increased copy numbers of the ATAD2 gene
is a primary cause of upregulation in OC
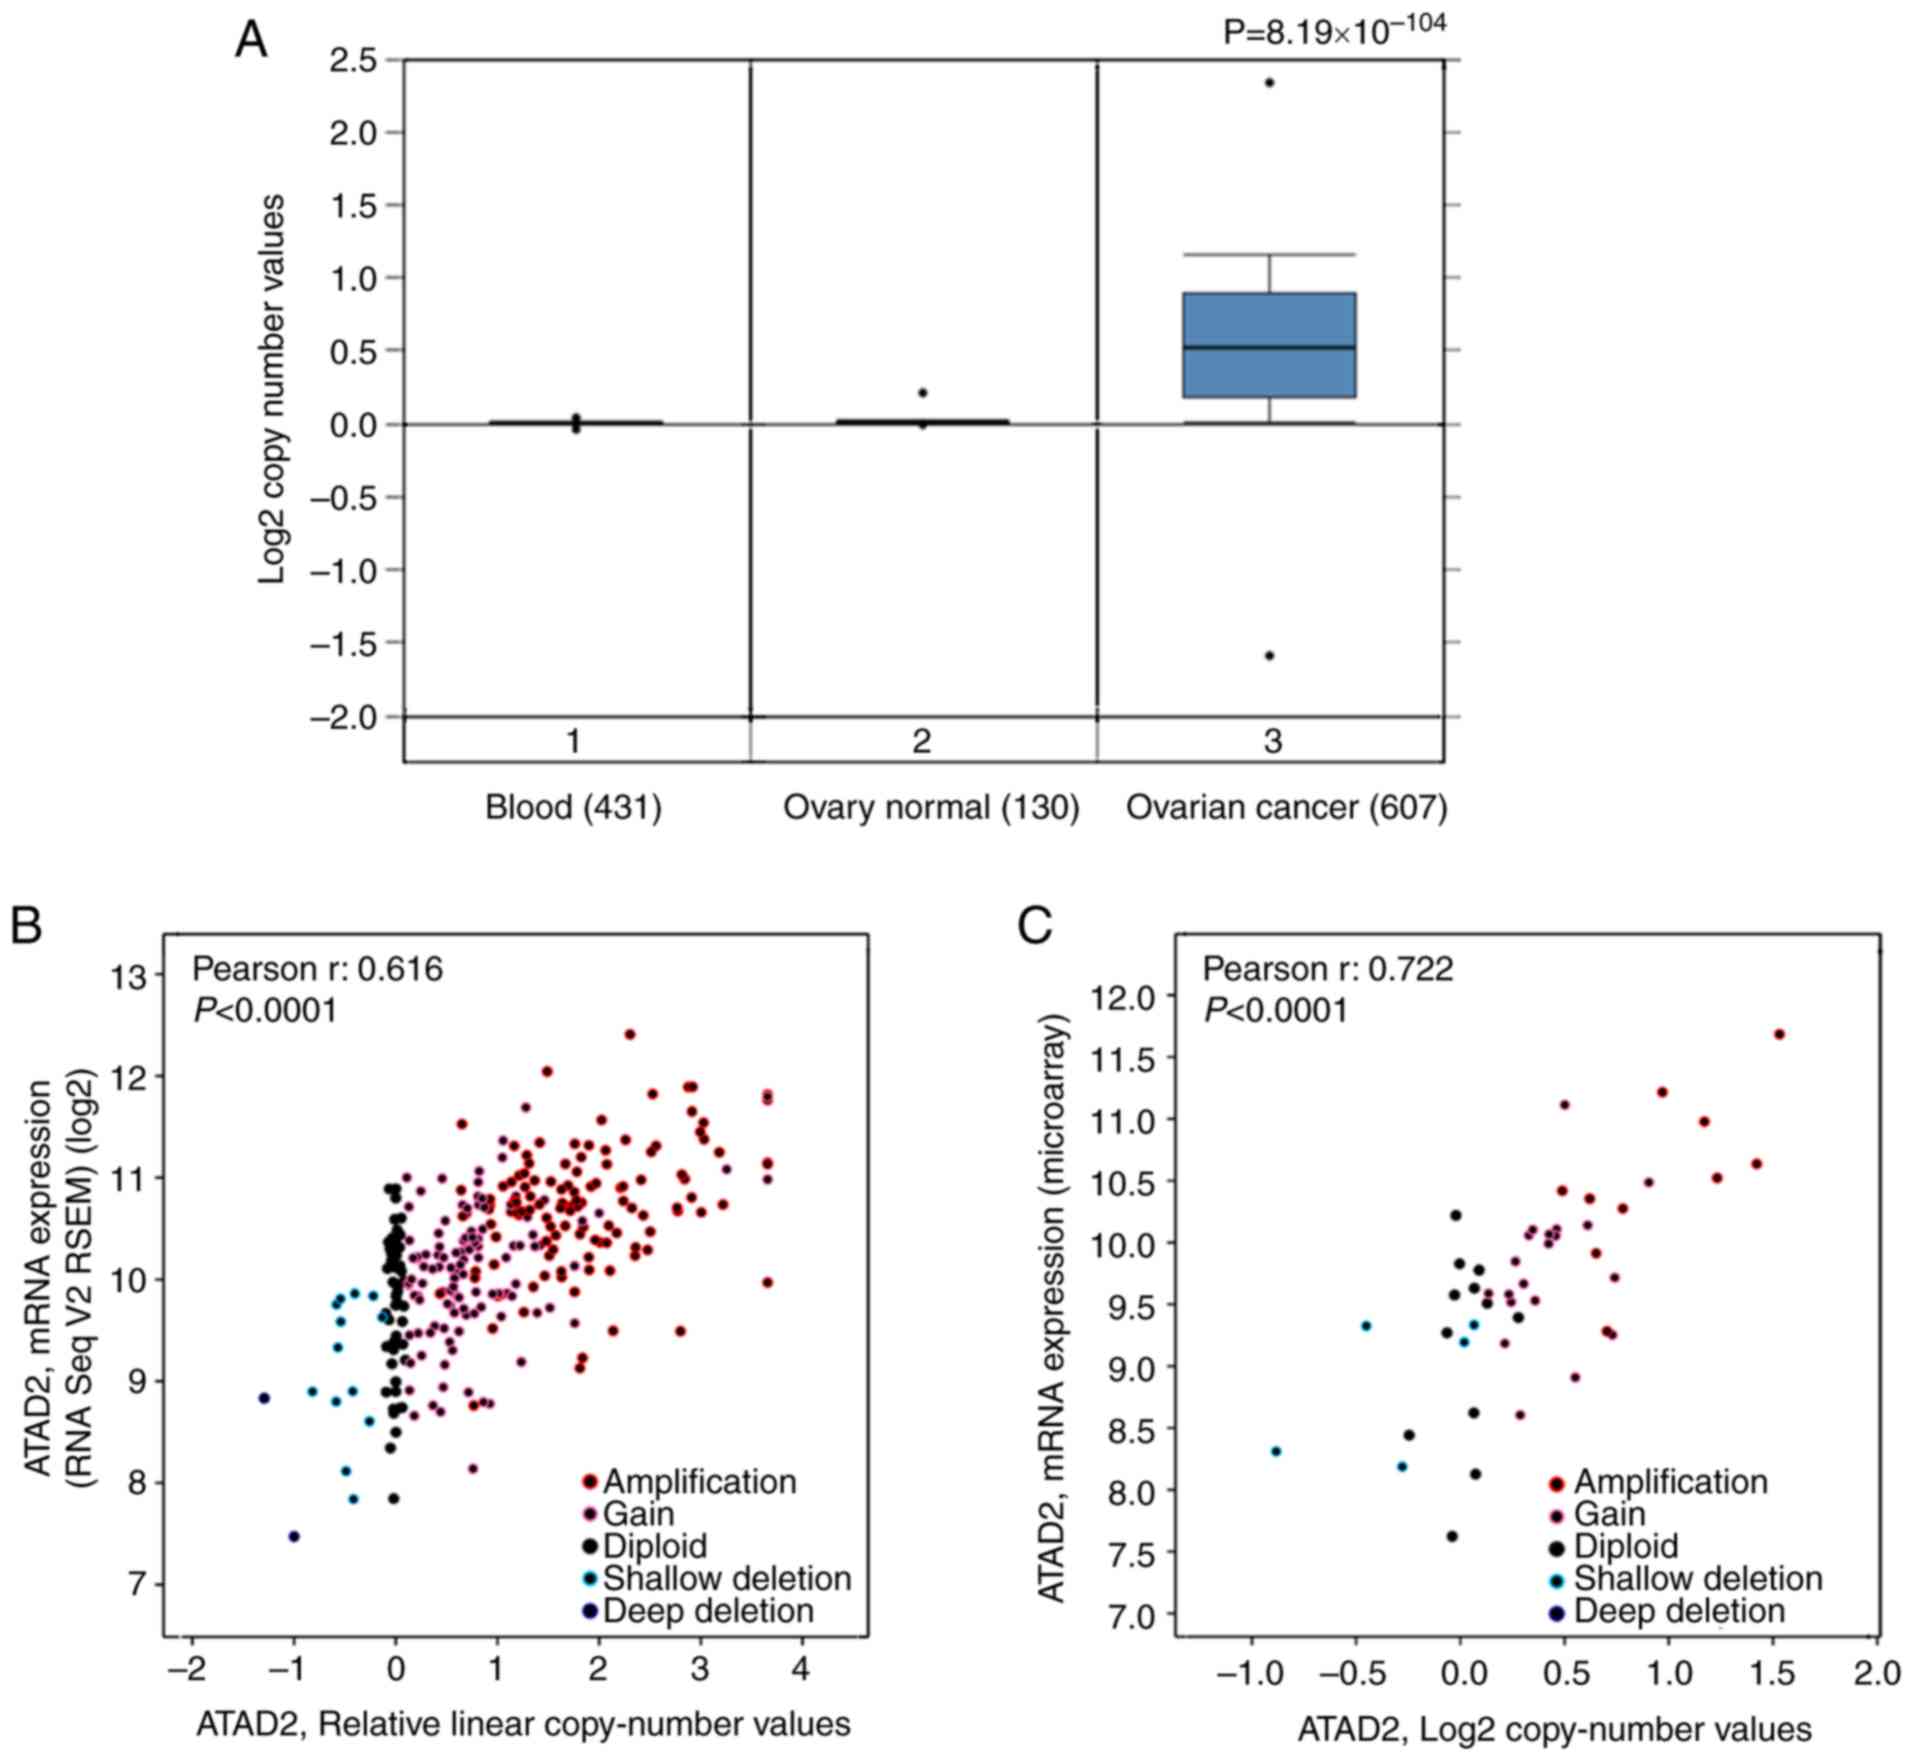
To address the cause resulting in upregulation of
ATAD2 in OC, the copy number of the ATAD2 gene in OC was determined
compared with the normal ovarian tissues based on data obtained
from TCGA. The results revealed that the copy number of ATAD2 in OC
tissues was significantly higher compared with the normal ovary
tissues and blood samples (P=8.19×10−104; Fig. 3A). To evaluate the contribution of
CNV to upregulation of ATAD2 during OC tumorigenesis, correlative
analysis of ATAD2 transcriptional levels and its copy number values
in OC was performed. ATAD2 copy number increases (gain or
amplification) was determined to be high in 74% (429/579) of
patients with OC based on the data from TCGA according to the
putative copy-number alterations from GISTIC. Additionally, ATAD2
mRNA levels were significantly correlated with the linear copy
number value (r=0.616, P<0.0001; Fig. 3B). ATAD2 copy number increase was
also found in 64% (30/47) of OC cell lines from the CCLE database,
and a significant correlation between ATAD2 mRNA expression levels
and copy number value (r=0.722, P<0.0001; Fig. 3C). These results indicate that CNV
is a primary cause responsible for upregulation of ATAD2 in OC.
Detailed analysis demonstrated that ATAD2 amplification (putative
copy-number alteration=2) was present in 34% of OC tissues
(Fig. 3D), as well as in 21% of OC
cell lines (Fig. 3E). Furthermore,
pan-cancer genomic alteration analysis in all types of cancer based
on data obtained from TCGA demonstrated that the highest frequency
of ATAD2 amplification was in OC (Fig.
3F), suggesting that ATAD2 amplification may be a genomic
signature of OC.
ATAD2 upregulation is associated with
advanced tumor progression and unfavorable outcomes in patients
with OC
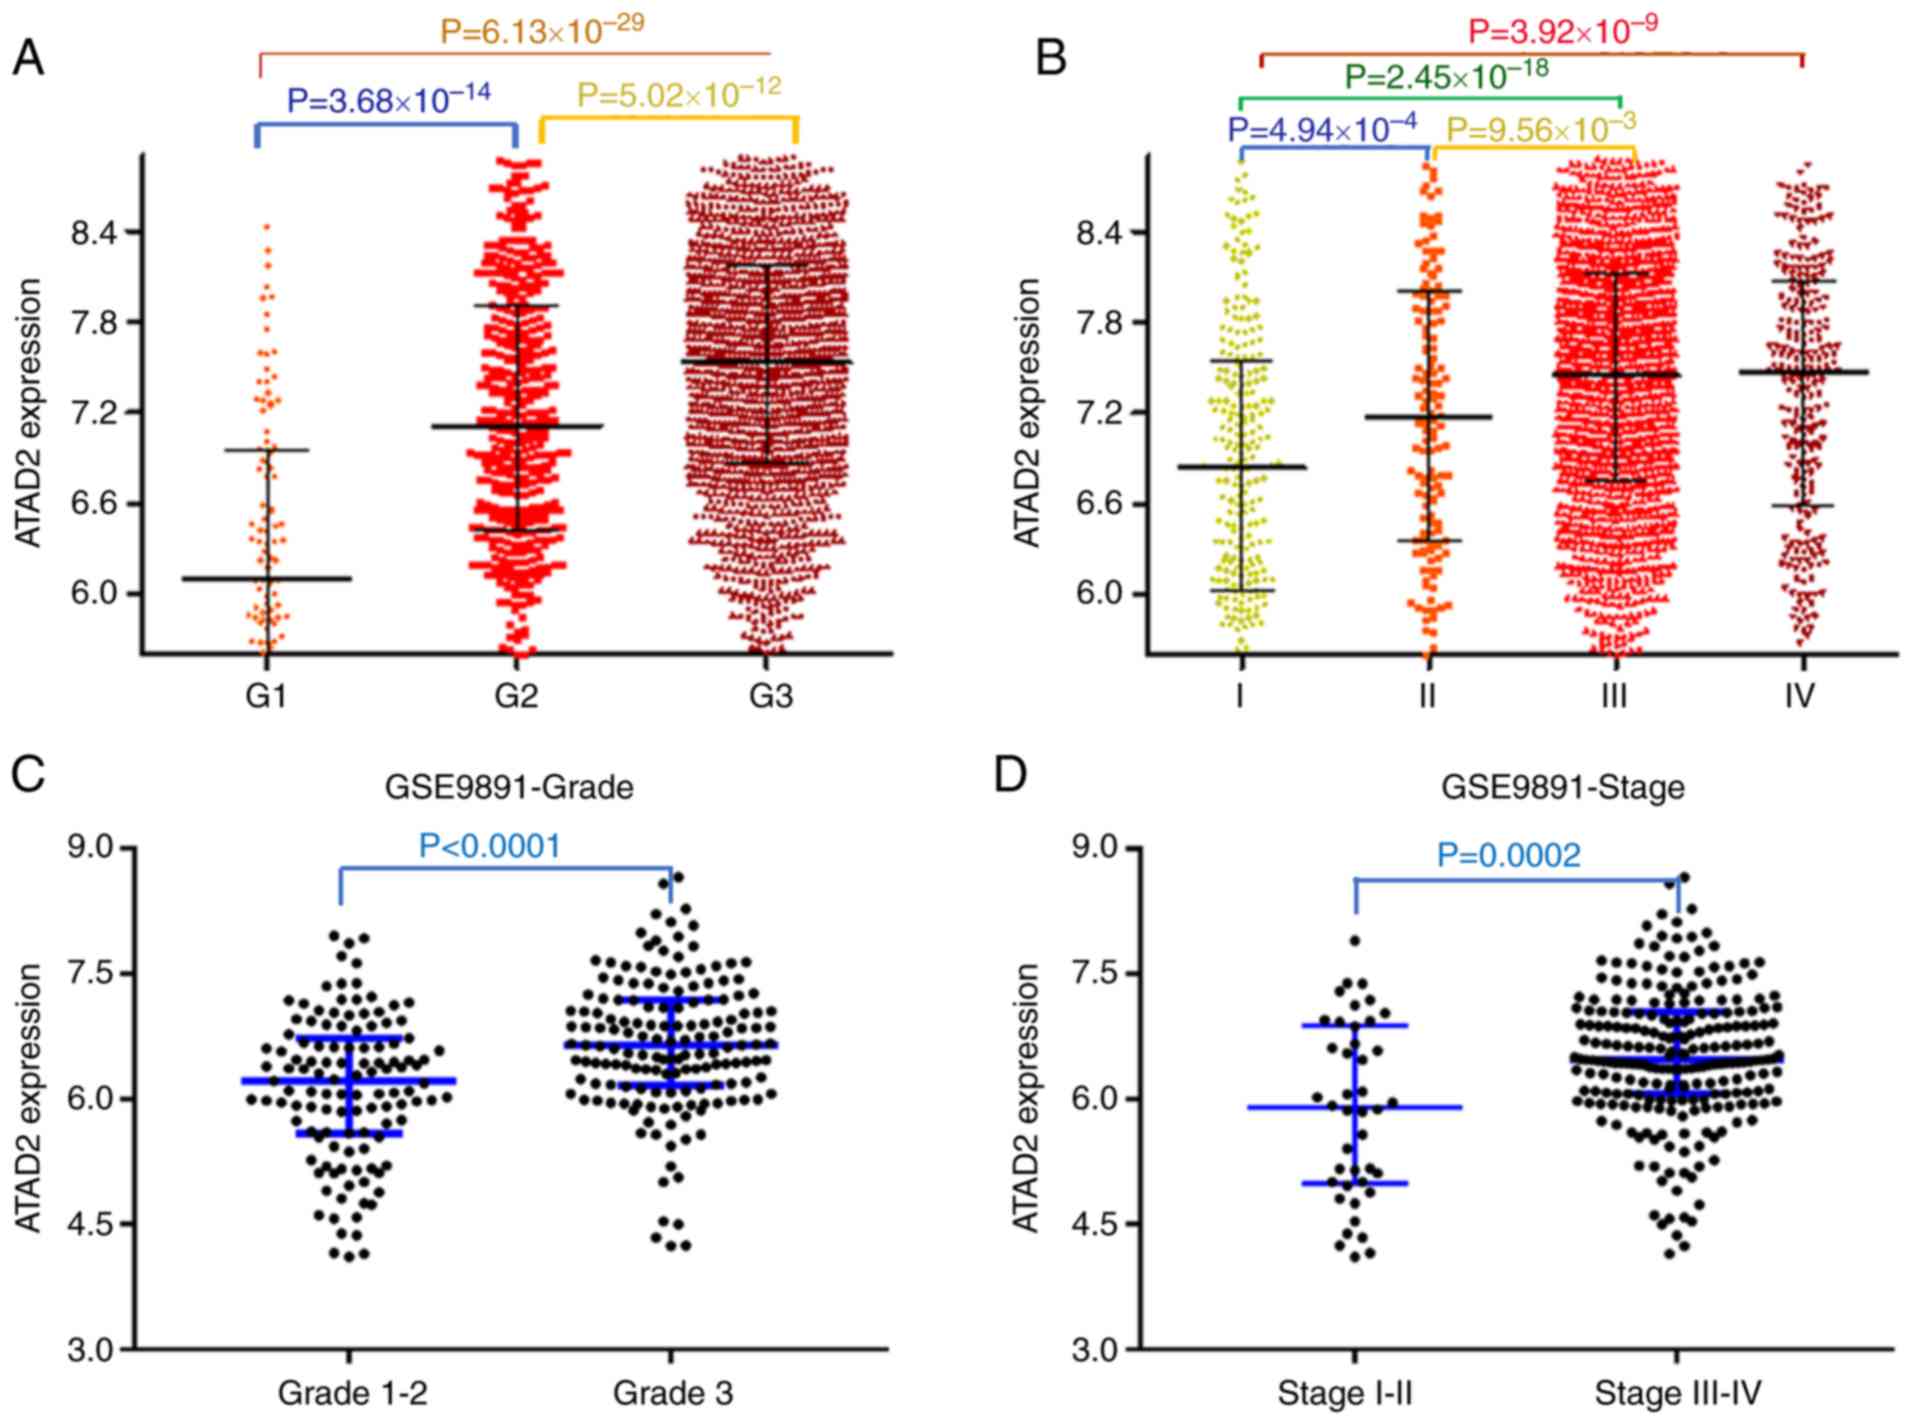
To examine the contribution of upregulation of ATAD2
in the progression of OC, the association between ATAD2 and
clinicopathological features of patients with OC was evaluated.
Data from the CSIOVDB database, which is comprised of
transcriptional data of 3,431 ovarian cancer cases, was first
analyzed. The results showed that upregulated ATAD2 expression was
associated with increasing tumor FIGO grade (Fig. 4A) and FIGO stage (Fig. 4B). The significant relevance of
ATAD2 expression with tumor grade and stage were further validated
in the OC cohorts from the GSE9891 GEO dataset, which contains
microarray transcription profiles of 285 patients with OC (FIGO
grade, P<0.0001; FIGO stage, P=0.0002; Fig. 4C and D, respectively).
The effects of ATAD2 expression on prognostic
outcomes were determined using Kaplan-Meier plotter (27). Based on this, upregulated
expression of ATAD2 predicted a significantly worse OS (HR, 1.8;
95% CI, 1.46-2.22; log-rank P=3.2×10⁻⁸; Fig. 4E) and DFS (HR,1.57; 95% CI,
1.29-1.90; log-rank P=6.4×10⁻⁶; Fig. 4F). The unfavorable effect of ATAD2
on OS (Fig. 4G) and DFS (Fig. 4H) outcomes were further confirmed
in the majority of the OC GEO datasets.
ATAD2 identifies a proliferation
signature in public OC datasets
To address the possible role of ATAD2 in OC, gene
co-expression network analysis was used. Gene co-expression
networks are useful to delineate gene function, identifying a set
of genes responding in a coordinated manner to environmental or
disease state, and highlighting regulatory associations (38,39).
The top 500 positively correlated genes in TCGA and GSE9891 OC
datasets were extracted according to the R-value, and they produced
a significant overlap in the genes that were co-expressed (260;
52.0%; Fig. 5A), indicating a high
reliability and sensitivity of the co-expression analysis. GO
analysis was performed on the overlapping 260 ATAD2 co-expressed
genes in DAVID, and yielded significant enrichment in fundamental
biological processes associated with cell proliferation, such as
'cell division', 'mitotic nuclear division', 'DNA replication',
'G1/S transition of mitotic cell cycle' and 'G2/M transition of
mitotic cell cycle' (Fig. 5B),
suggesting that ATAD2 may be involved in regulation of
proliferation of OC cells. The hypothesized role of ATAD2 on OC
proliferation was further supported by a significant association
with protein expression levels of classical proliferation makers,
including marker of proliferation Ki-67, proliferation cell nuclear
antigen and methylmalonyl-CoA mutase in OC tissues in both datasets
(Fig. 5C and D; Table SI) and in 47 cell lines from the
CCLE database (Table SI). As
ATAD2 expression was associated closely with the proliferation
index in both datasets (Fig. 5E),
this suggested that ATAD2 may be used to label OC tissues with a
potentially increased proliferative capacity.
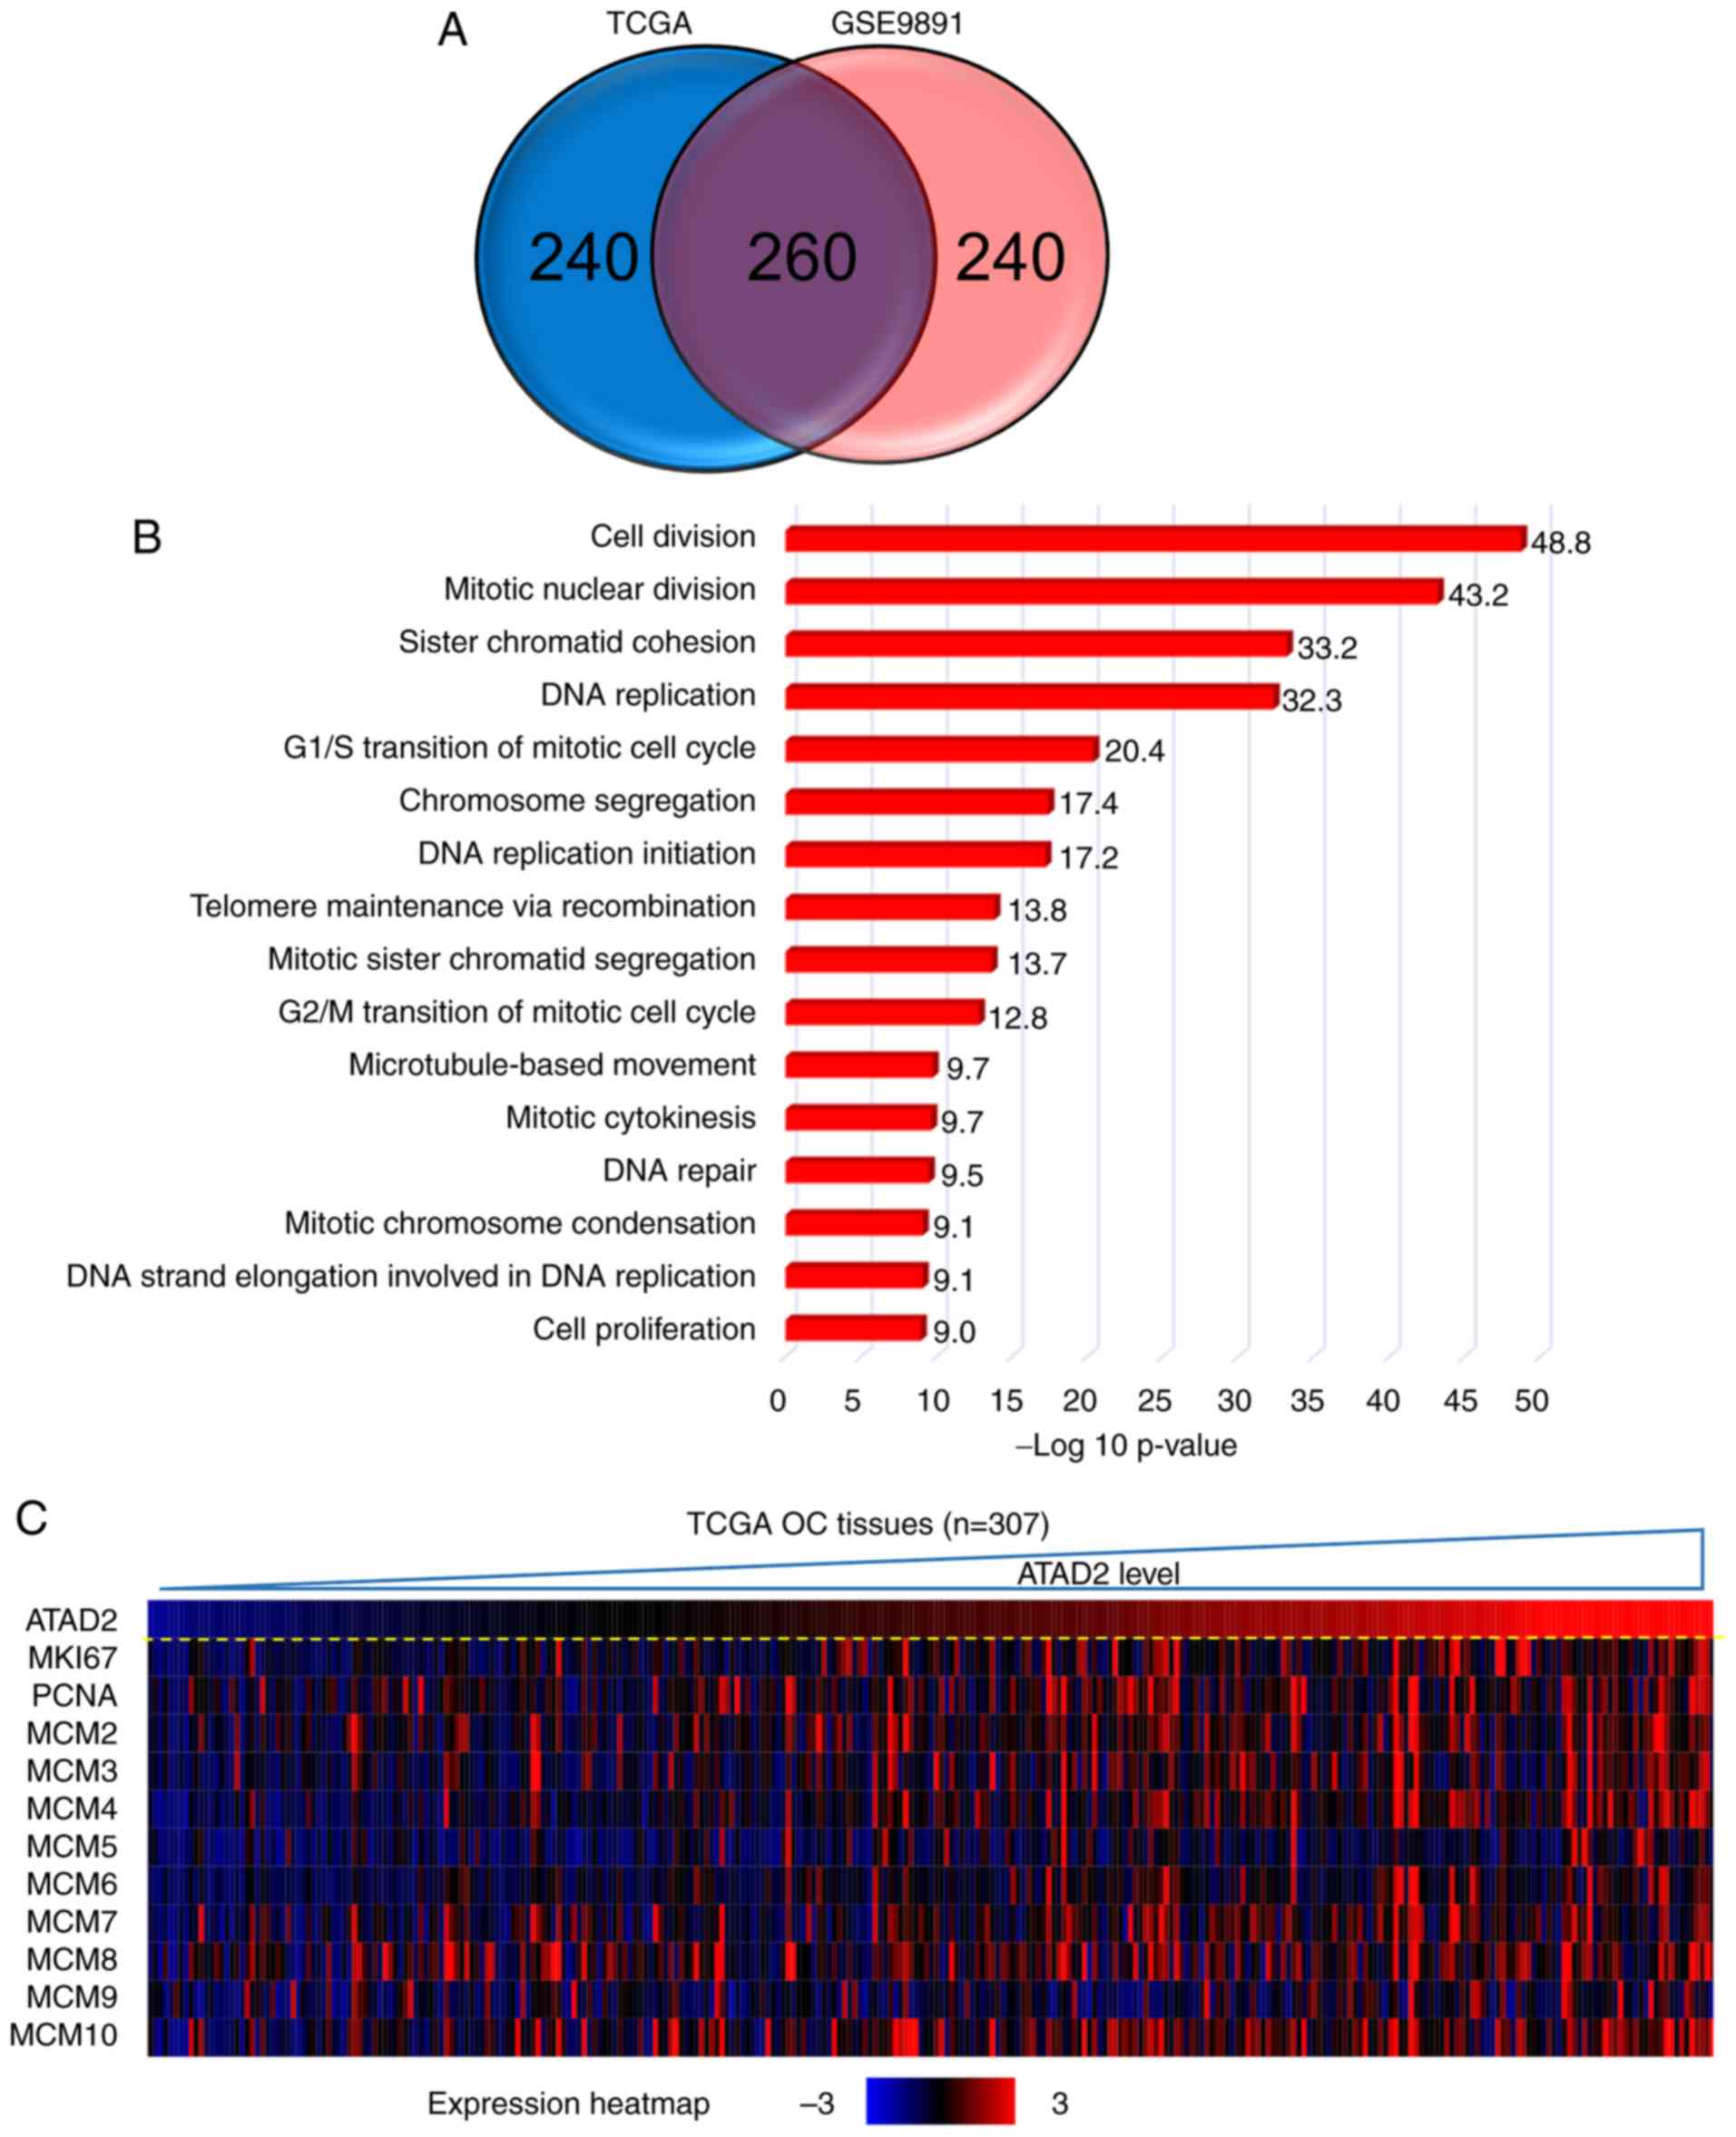 | Figure 5ATAD2 expression identified OC
tissues with increased proliferative capacities. (A) Venn diagram
showing the high degree of overlap between the ATAD2 co-expressed
genes in the two cohorts. (B) GO analysis of the 260 overlapping
ATAD2 co-expressed genes in DAVID. (C) Correlation heatmap showing
a significant positive correlation between ATAD2 expression with
proliferation markers. (D) Correlation analyses of ATAD2 expression
and individual proliferation markers. (E) ATAD2 was significantly
positively correlated with the proliferative index in both OC
cohorts. Proliferation index is represented by the sum of
expression values of proliferation markers including MKI67, PCNA
and MCM2-10. ATAD2, ATPase family AAA domain-containing protein 2;
OC, ovarian cancer; GO, Gene Ontology; DAVID, Database for
Annotation, Visualization and Integrated Discovery; TCGA, The
Cancer Genome Atlas; MIK67, marker of proliferation Ki-67; PCNA,
proliferation cell nuclear antigen; MCM, methylmalonyl-CoA
mutase. |
ATAD2 labels proliferating subpopulations
in clinical OC samples
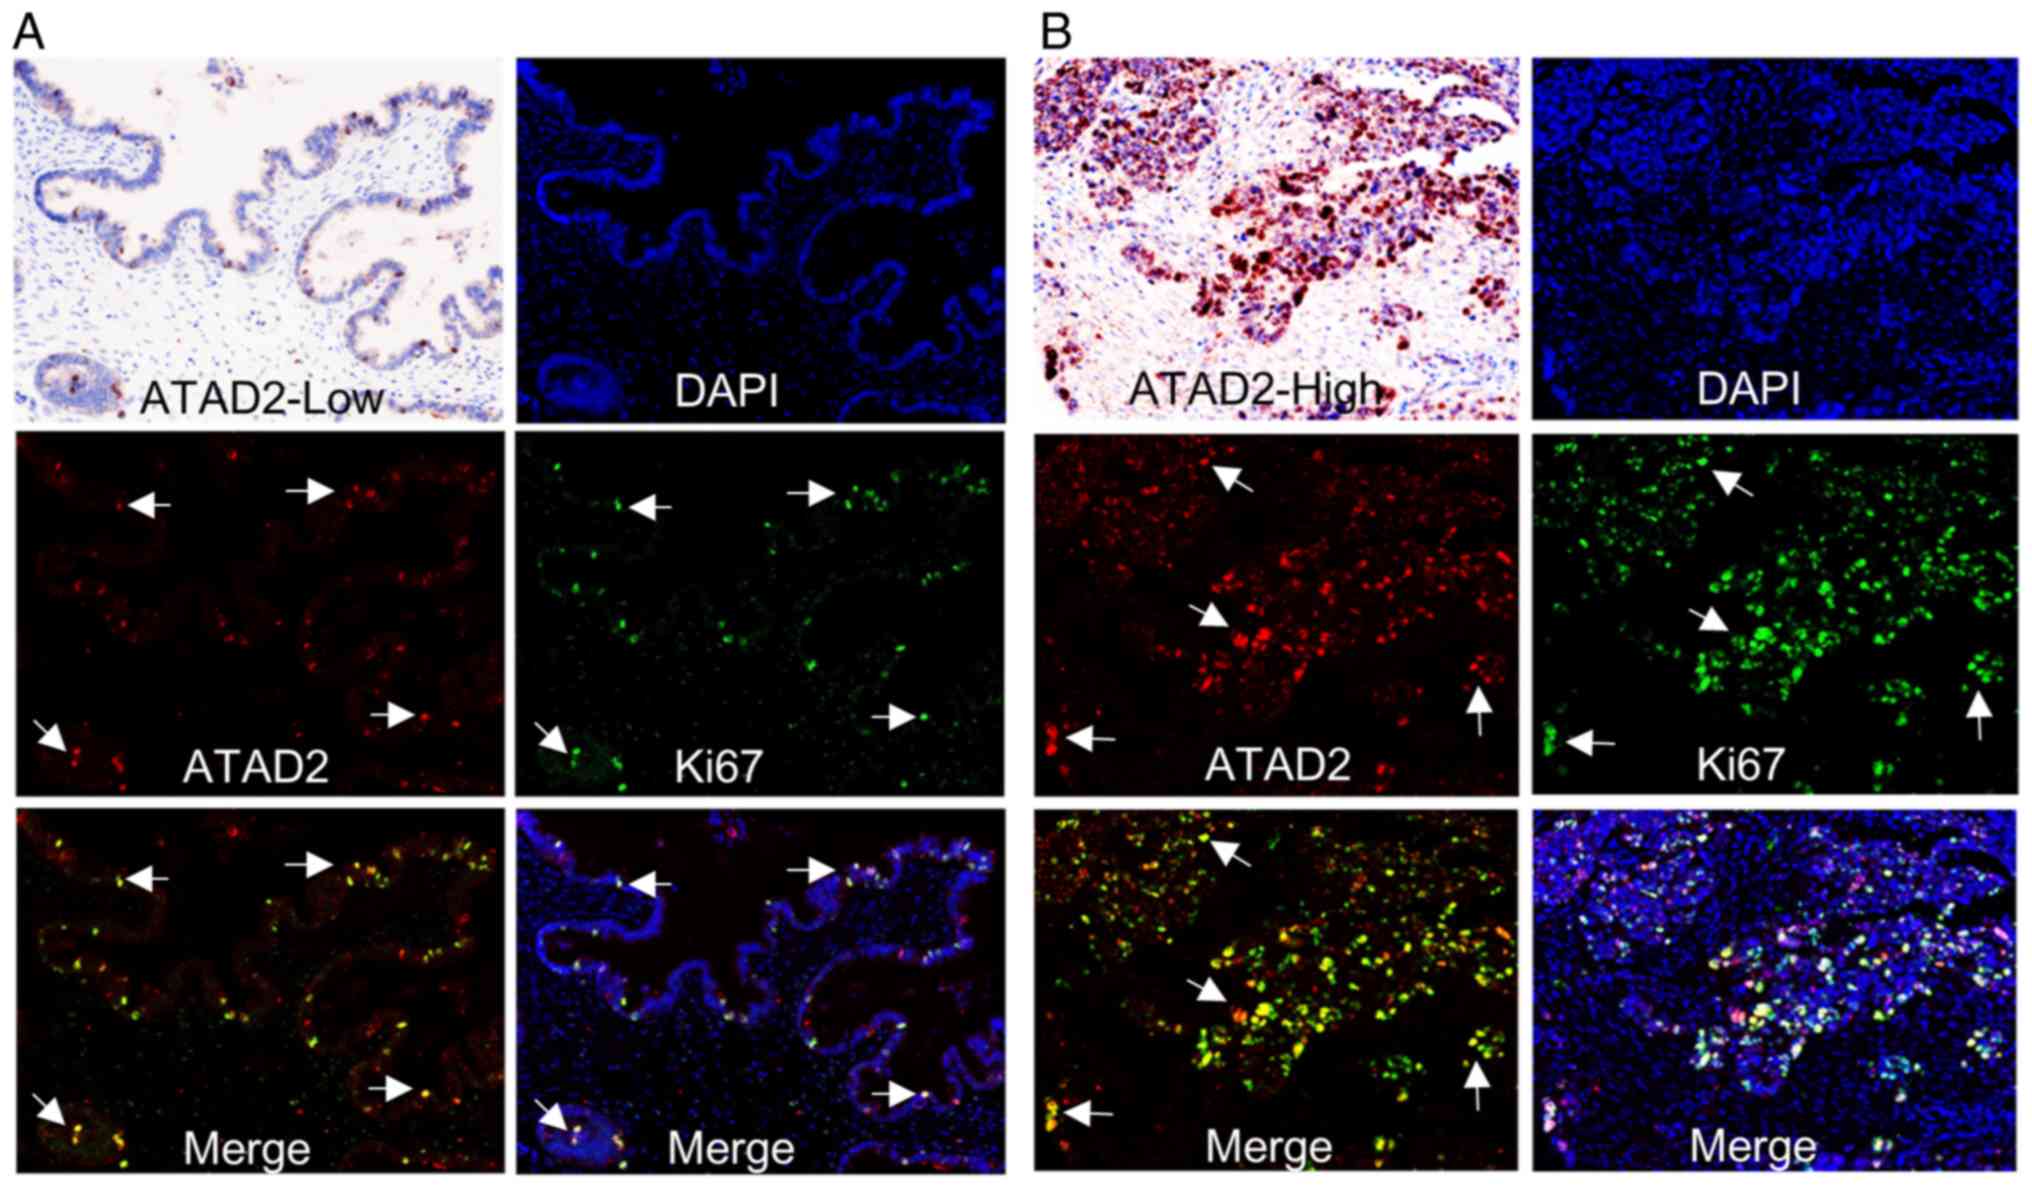
To demonstrate a direct association between ATAD2
expression and proliferation of OC, immunostaining of clinical OC
samples with specific antibodies against ATAD2 and cell
proliferation marker Ki-67 was performed. The staining showed that
samples with high levels of ATAD2 expression were also rich in
Ki-67 expression. Furthermore, ATAD2 specifically labeled
proliferative subpopulations with high levels of Ki-67 expression
in the tissues, regardless of whether an OC sample in totality
expressed low (Fig. 6A) or high
levels of ATAD2 (Fig. 6B).
Together, these results demonstrated that ATAD2 is a specific
marker for proliferating OC cells and suggest that ATAD2 may
increase proliferation of OC.
CRISPR-Cas9 mediated ATAD2 gene
disruption reduces proliferation and colony formation in OC cell
lines
To address whether ATAD2 is necessary for
proliferation of OC cells, the ATAD2 gene was disrupted in the
SKOV3 and A2780 OC cell lines using CRISPR-Cas9 genome editing
technology. RTCA and colony formation experiments were performed to
examine the effect of ATAD2 silencing on OC proliferation in
vitro. Results from the RTCA analysis showed that ATAD2
deficiency significantly reduced the proliferative ability of both
SKOV3 and A2780 cells (both P<0.0001; Fig. 7A). Consistent with the RTCA
analysis, colony formation analysis demonstrated that ATAD2
deletion significantly impaired the colony-forming capacity of
SKOV3 (P<0.01) and A2780 (P<0.05) cell lines (Fig. 7B and C). Together, these results
suggested that ATAD2 was necessary for proliferation of OC
cells.
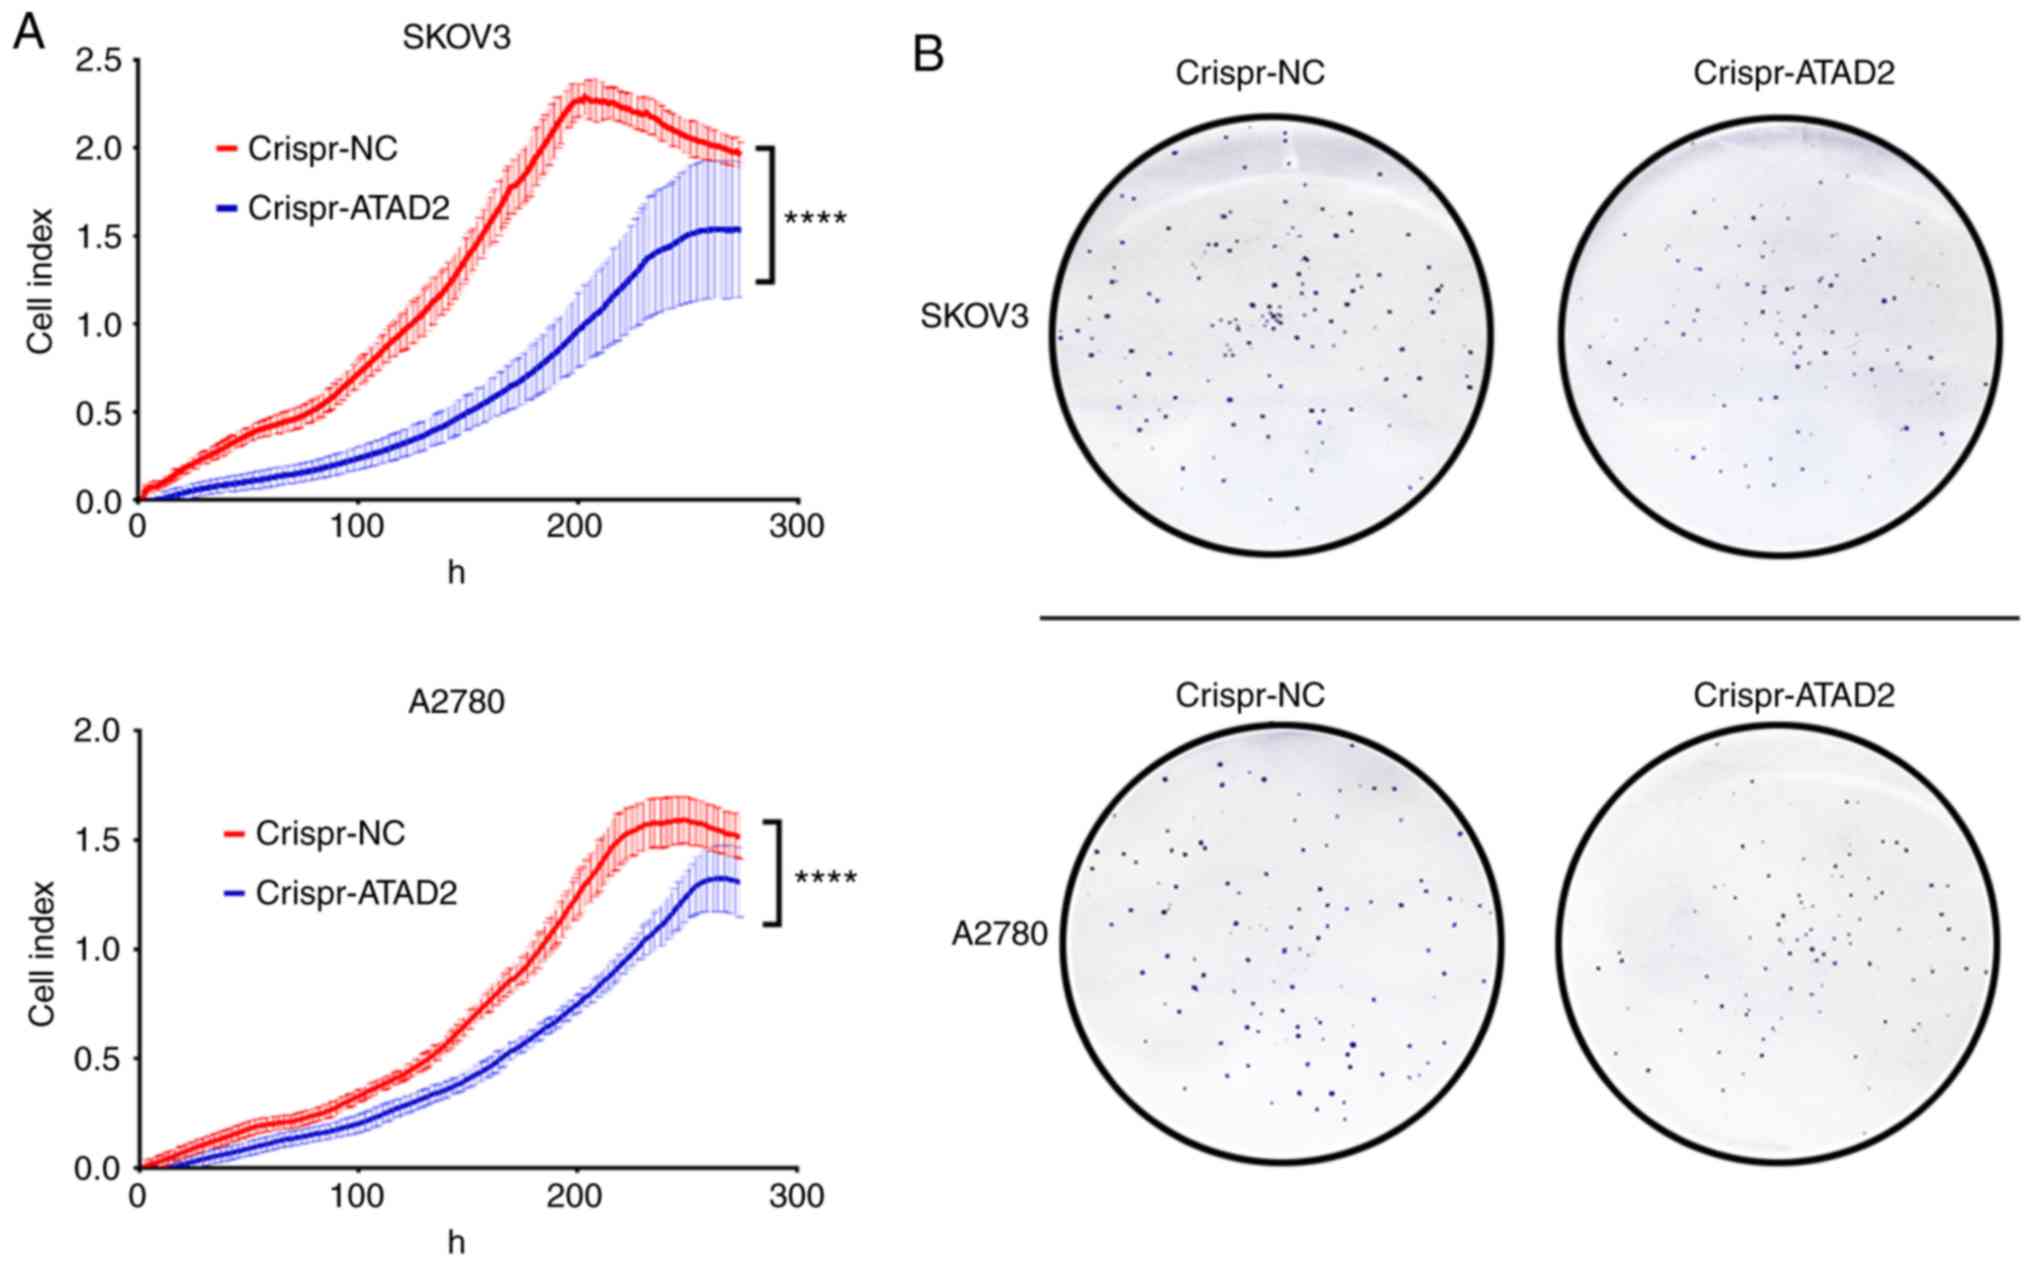 | Figure 7ATAD2 drives proliferation of OC by
targeting MAPK signaling pathways. (A) Real-time cell analyzer
analyses of the effect of ATAD2 silencing on the proliferative
capacity of SKOV3 and A2780 OC cell lines.
****P<0.0001. (B) Effect of ATAD2 deletion on colony
formation abilities. Magnification, ×100. ATAD2 drives
proliferation of OC by targeting MAPK signaling pathways. (C)
Statistical analysis of colony formation. Data are presented as the
mean ± standard deviation, *P<0.05,
**P<0.01. (D) Western blots showing the effect of
ATAD2 silencing on the MAPK pathway activation in the two OC cell
lines. (E) Quantitative analysis of the western blot results.
*P<0.05, **P<0.01,
****P<0.0001. ATAD2, ATPase family AAA
domain-containing protein 2; OC, ovarian cancer; p-,
phosphorylated; NC, negative control; MAPK, mitogen activated
protein kinase. |
ATAD2 deletion deactivates the JNK-MAPK
pathway
To decipher the mechanism by which ATAD2 results in
proliferation of OC cells, the effect of ATAD2 deletion on MAPK
pathways, which are frequently associated with increased
proliferation in various types of cancer (40), was examined. ATAD2 deletion
resulted in a marked decrease in phosphorylation levels of all
three crucial members of the MAPK sub-pathways, JNK, ERK and p-38
(all P<0.05), of which JNK (P<0.0001) was the most notably
affected in both OC cell lines (Fig.
7D). These experiments demonstrate that ATAD2 activates the
MAPK pathways, particularly the JNK-MAPK pathway, in OC cells, thus
providing a possible explanation for the role of ATAD2 in
increasing proliferation of OC.
Discussion
OC is the most lethal type of tumor of the female
reproductive system. Despite advances in surgery and chemotherapy
in recent years, relatively little progress has been made in
reducing the mortality rates of patients with OC (1). Deciphering the oncogenic mechanisms
underlying this disease may contribute to the design of more
precise and efficient therapeutic strategies.
In the present study, it was demonstrated that the
ATPase family member ATAD2 was significantly upregulated in primary
OC tissues compared with the adjacent normal tissues and gastric
metastases to the ovary, suggesting that ATAD2 may serve as a
diagnostic marker to distinguish primary OC from normal and
metastatic carcinomas.
Aberrant elevation of ATAD2 expression has also been
reported in several other types of cancer, including liver,
prostate, lung, colon and cervical cancer (4), emphasizing high oncogenic relevance
of ATAD2 expression in cancer.
Genetic alterations, particularly CNVs, are
frequently observed in dysregulation of cancer genes (41). Therefore, it was speculated that
CNV may underlie ATAD2 upregulation in OC. To address this
possibility, the copy numbers of the ATAD2 gene in OC were compared
with matched normal tissues, and a significant increase of ATAD2
copy numbers was shown in OC tissues. Further analysis revealed
that 74% of patients with OC had increased ATAD2 CNVs, 34% of which
were amplifications and 40% were gains. The association between
ATAD2 linear copy number values and expression levels in both
patients with OC tissues and cell lines suggested that CNV was the
primary cause for elevation of ATAD2 in OC. ATAD2 copy number
amplification was also demonstrated in a number of different types
of cancer in TCGA, such as esophageal and breast cancer. However,
ATAD2 amplification events were most frequently observed in OC,
accounting for ~34% of patients with OC, whereas in the next most
common cancer, ATAD2 amplification events were only seen in <20%
of cases, suggesting that ATAD2 amplification is a characteristic
genetic alteration in OC, and that patients with OC are most likely
to benefit from ATAD2-targeted genetic disruption therapeutic
strategies.
To dissect the role of ATAD2 in OC, the association
between ATAD2 expression with clinical features of patients with OC
was determined. ATAD2 upregulation was associated with advanced
tumor progression and unfavorable prognostic outcomes in patients
with OC patients in the majority of cohorts analyzed. Co-expression
network analysis suggested that ATAD2 was closely associated with
proliferation-related biological processes, including cell
division, DNA replication and mitotic cell cycle. ATAD2
specifically identified the patients with OC with evidence of
increased proliferation, and ATAD2 directly labeled the
proliferating cancer cells in clinical OC tissues, irrespective of
the level of proliferation seen overall in each tissue, suggesting
that ATAD2 is a specific proliferation marker in OC. To assess the
significance of ATAD2 deletion on proliferation of OC, the ATAD2
gene was ablated using CRISPR-Cas9 technology, which is considered
the most efficient means of gene editing. It was demonstrated that
ATAD2 gene targeting and silencing reduced the proliferation of OC
cells. Together, these results collectively indicate that ATAD2
acts as both a specific marker and a potent regulator of cell
proliferation in OC.
Although considerable advances in our understanding
of OC development and progression have been made in recent years,
relatively less is known about the underlying mechanisms of ATAD2
in tumorigenesis. ATAD2 is a direct target of the pRB/E2F pathway
and acts as a cofactor of MYC to regulate the Hedgehog pathway
(42,43). ATAD2 also acts as a transcriptional
co-regulator of estrogen and androgen receptors to induce the
expression of genes controlling proliferation and survival of
cancer cells (44,45). In the present study, to improve our
understanding of the mechanistic role of ATAD2 in proliferation,
the effect of ATAD2 on the MAPK pathway was assessed, a pivotal
signaling pathway in the control of proliferation. ATAD2 increased
phosphorylation of JNK, p38 and ERK, of which JNK was the most
notable target. Therefore, it is hypothesized that the MAPK pathway
is an important pathway for mediating ATAD2-driven proliferation of
OC. Collectively, the data suggest that the amplified and
upregulated expression of ATAD2 may be an attractive diagnostic and
prognostic marker for OC, and a potential therapeutic oncological
target for clinical intervention of OC progression.
Supplementary Data
Funding
This study was financially supported by grants from
the National Natural Science Foundation of China (grant nos.
81502384 and 81672338).
Availability of data and materials
The datasets used and/or analyzed during the current
study are available from the corresponding author on reasonable
request.
Authors' contributions
JL and TW designed and conceived the study. QL, HL,
LL and JL performed the experiments and generated the majority of
the data. XD, XR and XF performed the bioinformatics analyses. QL
and JL were major contributors in writing the manuscript. All
authors have read and approved the final version of this
manuscript.
Ethics approval and consent to
participate
Not applicable.
Patient consent for publication
Not applicable.
Competing interests
The authors declare that they have no competing
interests.
Acknowledgments
Not applicable.
References
|
1
|
Bray F, Ferlay J, Soerjomataram I, Siegel
RL, Torre LA and Jemal A: Global cancer statistics 2018: GLOBOCAN
estimates of incidence and mortality worldwide for 36 cancers in
185 countries. CA Cancer J Clin. 68:394–424. 2018. View Article : Google Scholar : PubMed/NCBI
|
|
2
|
Torre LA, Trabert B, DeSantis CE, Miller
KD, Samimi G, Runowicz CD, Gaudet MM, Jemal A and Siegel RL:
Ovarian cancer statistics, 2018. CA Cancer J Clin. 68:284–296.
2018. View Article : Google Scholar : PubMed/NCBI
|
|
3
|
Siegel RL, Miller KD and Jemal A: Cancer
statistics, 2018. CA Cancer J Clin. 68:7–30. 2018. View Article : Google Scholar : PubMed/NCBI
|
|
4
|
Hussain M, Zhou Y, Song Y, Hameed HMA,
Jiang H, Tu Y and Zhang J: ATAD2 in cancer: A pharmacologically
challenging but tractable target. Expert Opin Ther Targets.
22:85–96. 2018. View Article : Google Scholar
|
|
5
|
Boussouar F, Jamshidikia M, Morozumi Y,
Rousseaux S and Khochbin S: Malignant genome reprogramming by
ATAD2. Biochim Biophys Acta. 1829:1010–1014. 2013. View Article : Google Scholar : PubMed/NCBI
|
|
6
|
Pollack JR, Sørlie T, Perou CM, Rees CA,
Jeffrey SS, Lonning PE, Tibshirani R, Botstein D, Børresen-Dale AL
and Brown PO: Microarray analysis reveals a major direct role of
DNA copy number alteration in the transcriptional program of human
breast tumors. Proc Natl Acad Sci USA. 99:12963–12968. 2002.
View Article : Google Scholar : PubMed/NCBI
|
|
7
|
Kalashnikova EV, Revenko AS, Gemo AT,
Andrews NP, Tepper CG, Zou JX, Cardiff RD, Borowsky AD and Chen HW:
ANCCA/ATAD2 overexpression identifies breast cancer patients with
poor prognosis, acting to drive proliferation and survival of
triple-negative cells through control of B-Myb and EZH2. Cancer
Res. 70:9402–9412. 2010. View Article : Google Scholar : PubMed/NCBI
|
|
8
|
Hou M, Huang R, Song Y, Feng D, Jiang Y
and Liu M: ATAD2 overexpression is associated with progression and
prognosis in colorectal cancer. Jpn J Clin Oncol. 46:222–227. 2016.
View Article : Google Scholar : PubMed/NCBI
|
|
9
|
Krakstad C, Tangen IL, Hoivik EA, Halle
MK, Berg A, Werner HM, Ræder MB, Kusonmano K, Zou JX, Øyan AM, et
al: ATAD2 overexpression links to enrichment of B-MYB-translational
signatures and development of aggressive endometrial carcinoma.
Oncotarget. 6:28440–28452. 2015. View Article : Google Scholar : PubMed/NCBI
|
|
10
|
Zhang M, Zhang C, Du W, Yang X and Chen Z:
ATAD2 is overexpressed in gastric cancer and serves as an
independent poor prognostic biomarker. Clin Transl Oncol.
18:776–781. 2016. View Article : Google Scholar
|
|
11
|
Lu WJ, Chua MS and So SK: Suppression of
ATAD2 inhibits hepatocellular carcinoma progression through
activation of p53- and p38-mediated apoptotic signaling.
Oncotarget. 6:41722–41735. 2015. View Article : Google Scholar : PubMed/NCBI
|
|
12
|
Hong S, Bi M, Yan Z, Sun D, Ling L and
Zhao C: Silencing of ATPase family AAA domain-containing protein 2
inhibits migration and invasion of colorectal cancer cells.
Neoplasma. 63:846–855. 2016. View Article : Google Scholar : PubMed/NCBI
|
|
13
|
Zheng L, Li T, Zhang Y, Guo Y, Yao J, Dou
L and Guo K: Oncogene ATAD2 promotes cell proliferation, invasion
and migration in cervical cancer. Oncol Rep. 33:2337–2344. 2015.
View Article : Google Scholar : PubMed/NCBI
|
|
14
|
Caron C, Lestrat C, Marsal S, Escoffier E,
Curtet S, Virolle V, Barbry P, Debernardi A, Brambilla C, Brambilla
E, et al: Functional characterization of ATAD2 as a new
cancer/testis factor and a predictor of poor prognosis in breast
and lung cancers. Oncogene. 29:5171–5181. 2010. View Article : Google Scholar : PubMed/NCBI
|
|
15
|
Morozumi Y, Boussouar F, Tan M, Chaikuad
A, Jamshidikia M, Colak G, He H, Nie L, Petosa C, de Dieuleveult M,
et al: Atad2 is a generalist facilitator of chromatin dynamics in
embryonic stem cells. J Mol Cell Biol. 8:349–362. 2016. View Article : Google Scholar :
|
|
16
|
Liu J, Liu Z, Liu Q, Li L, Fan X, Wen T
and An G: CLEC3B is downregulated and inhibits proliferation in
clear cell renal cell carcinoma. Oncol Rep. 40:2023–2035.
2018.PubMed/NCBI
|
|
17
|
Tan TZ, Yang H, Ye J, Low J, Choolani M,
Tan DS, Thiery JP and Huang RY: CSIOVDB: A microarray gene
expression database of epithelial ovarian cancer subtype.
Oncotarget. 6:43843–43852. 2015. View Article : Google Scholar : PubMed/NCBI
|
|
18
|
Yoshihara K, Tajima A, Komata D, Yamamoto
T, Kodama S, Fujiwara H, Suzuki M, Onishi Y, Hatae M, Sueyoshi K,
et al: Gene expression profiling of advanced-stage serous ovarian
cancers distinguishes novel subclasses and implicates ZEB2 in tumor
progression and prognosis. Cancer Sci. 100:1421–1428. 2009.
View Article : Google Scholar : PubMed/NCBI
|
|
19
|
Bowen NJ, Walker LD, Matyunina LV, Logani
S, Totten KA, Benigno BB and McDonald JF: Gene expression profiling
supports the hypothesis that human ovarian surface epithelia are
multipotent and capable of serving as ovarian cancer initiating
cells. BMC Med Genomics. 2:712009. View Article : Google Scholar : PubMed/NCBI
|
|
20
|
Mok SC, Bonome T, Vathipadiekal V, Bell A,
Johnson ME, Wong KK, Park DC, Hao K, Yip DK, Donninger H, et al: A
gene signature predictive for outcome in advanced ovarian cancer
identifies a survival factor: Microfibril-associated glycoprotein
2. Cancer. Cell. 16:521–532. 2009.
|
|
21
|
Emanuelsson O, Nagalakshmi U, Zheng D,
Rozowsky JS, Urban AE, Du J, Lian Z, Stolc V, Weissman S, Snyder M
and Gerstein MB: Assessing the performance of different
high-density tiling microarray strategies for mapping transcribed
regions of the human genome. Genome Res. 17:886–897. 2007.
View Article : Google Scholar :
|
|
22
|
Mermel CH, Schumacher SE, Hill B, Meyerson
ML, Beroukhim R and Getz G: GISTIC2.0 facilitates sensitive and
confident localization of the targets of focal somatic copy-number
alteration in human cancers. Genome Biol. 12:R412011. View Article : Google Scholar : PubMed/NCBI
|
|
23
|
Rhodes DR, Yu J, Shanker K, Deshpande N,
Varambally R, Ghosh D, Barrette T, Pandey A and Chinnaiyan AM:
ONCOMINE: A cancer microarray database and integrated data-mining
platform. Neoplasia. 6:1–6. 2004. View Article : Google Scholar : PubMed/NCBI
|
|
24
|
Gao J, Aksoy BA, Dogrusoz U, Dresdner G,
Gross B, Sumer SO, Sun Y, Jacobsen A, Sinha R, Larsson E, et al:
Integrative analysis of complex cancer genomics and clinical
profiles using the cBio-Portal. Sci Signal. 6:pl12013. View Article : Google Scholar
|
|
25
|
Prat J; FIGO Committee on Gynecologic
Oncology: Staging classification for cancer of the ovary, fallopian
tube, and peritoneum: Abridged republication of guidelines from the
international federation of gynecology and obstetrics (FIGO).
Obstet Gynecol. 126:171–174. 2015. View Article : Google Scholar : PubMed/NCBI
|
|
26
|
Trimarchi JM, Stadler MB and Cepko CL:
Individual retinal progenitor cells display extensive heterogeneity
of gene expression. PLoS One. 3:e15882008. View Article : Google Scholar : PubMed/NCBI
|
|
27
|
Gyorffy B, Lánczky A and Szállási Z:
Implementing an online tool for genome-wide validation of
survival-associated biomarkers in ovarian-cancer using microarray
data from 1287 patients. Endocr Relat Cancer. 19:197–208. 2012.
View Article : Google Scholar : PubMed/NCBI
|
|
28
|
Ferriss JS, Kim Y, Duska L, Birrer M,
Levine DA, Moskaluk C, Theodorescu D and Lee JK: Multi-gene
expression predictors of single drug responses to adjuvant
chemotherapy in ovarian carcinoma: Predicting platinum resistance.
PLoS One. 7:e305502012. View Article : Google Scholar : PubMed/NCBI
|
|
29
|
Bonome T, Levine DA, Shih J, Randonovich
M, Pise-Masison CA, Bogomolniy F, Ozbun L, Brady J, Barrett JC,
Boyd J and Birrer MJ: A gene signature predicting for survival in
suboptimally debulked patients with ovarian cancer. Cancer Res.
68:5478–5486. 2008. View Article : Google Scholar : PubMed/NCBI
|
|
30
|
Konstantinopoulos PA, Spentzos D, Karlan
BY, Taniguchi T, Fountzilas E, Francoeur N, Levine DA and Cannistra
SA: Gene expression profile of BRCAness that correlates with
responsiveness to chemotherapy and with outcome in patients with
epithelial ovarian cancer. J Clin Oncol. 28:3555–3561. 2010.
View Article : Google Scholar : PubMed/NCBI
|
|
31
|
Lisowska KM, Olbryt M, Dudaladava V,
Pamuła-Piłat J, Kujawa K, Grzybowska E, Jarząb M, Student S,
Rzepecka IK, Jarząb B and Kupryjańczyk J: Gene expression analysis
in ovarian cancer-faults and hints from DNA microarray study. Front
Oncol. 4:62014. View Article : Google Scholar
|
|
32
|
Mateescu B, Batista L, Cardon M, Gruosso
T, de Feraudy Y, Mariani O, Nicolas A, Meyniel JP, Cottu P,
Sastre-Garau X and Mechta-Grigoriou F: miR-141 and miR-200a act on
ovarian tumorigenesis by controlling oxidative stress response. Nat
Med. 17:1627–1635. 2011. View Article : Google Scholar : PubMed/NCBI
|
|
33
|
Tothill RW, Tinker AV, George J, Brown R,
Fox SB, Lade S, Johnson DS, Trivett MK, Etemadmoghadam D, Locandro
B, et al: Novel molecular subtypes of serous and endometrioid
ovarian cancer linked to clinical outcome. Clin Cancer Res.
14:5198–5208. 2008. View Article : Google Scholar : PubMed/NCBI
|
|
34
|
Makii C, Oda K, Ikeda Y, Sone K, Hasegawa
K, Uehara Y, Nishijima A, Asada K, Koso T, Fukuda T, et al: MDM2 is
a potential therapeutic target and prognostic factor for ovarian
clear cell carcinomas with wild type TP53. Oncotarget.
7:75328–75338. 2016. View Article : Google Scholar : PubMed/NCBI
|
|
35
|
Koti M, Gooding RJ, Nuin P, Haslehurst A,
Crane C, Weberpals J, Childs T, Bryson P, Dharsee M, Evans K, et
al: Identification of the IGF1/PI3K/NF κB/ERK gene signalling
networks associated with chemotherapy resistance and treatment
response in high-grade serous epithelial ovarian cancer. BMC
Cancer. 13:5492013. View Article : Google Scholar
|
|
36
|
Huang da W, Sherman BT and Lempicki RA:
Systematic and integrative analysis of large gene lists using DAVID
bioinformatics resources. Nat Protoc. 4:44–57. 2009. View Article : Google Scholar : PubMed/NCBI
|
|
37
|
Lee SJ, Bae JH, Lee AW, Tong SY, Park YG
and Park JS: Clinical characteristics of metastatic tumors to the
ovaries. J Korean Med Sci. 24:114–119. 2009. View Article : Google Scholar : PubMed/NCBI
|
|
38
|
Saha A, Kim Y, Gewirtz ADH, Jo B, Gao C,
McDowell IC; GTEx Consortium; Engelhardt BE and Battle A:
Co-expression networks reveal the tissue-specific regulation of
transcription and splicing. Genome Res. 27:1843–1858. 2017.
View Article : Google Scholar : PubMed/NCBI
|
|
39
|
van Dam S, Võsa U, van der Graaf A, Franke
L and de Magalhães JP: Gene co-expression analysis for functional
classification and gene-disease predictions. Brief Bioinform.
19:575–592. 2018.
|
|
40
|
Zhang W and Liu HT: MAPK signal pathways
in the regulation of cell proliferation in mammalian cells. Cell
Res. 12:9–18. 2002. View Article : Google Scholar : PubMed/NCBI
|
|
41
|
Shlien A and Malkin D: Copy number
variations and cancer. Genome Med. 1:622009. View Article : Google Scholar : PubMed/NCBI
|
|
42
|
Ciró M, Prosperini E, Quarto M, Grazini U,
Walfridsson J, McBlane F, Nucifero P, Pacchiana G, Capra M,
Christensen J and Helin K: ATAD2 is a novel cofactor for MYC,
overexpressed and amplified in aggressive tumors. Cancer Res.
69:8491–8498. 2009. View Article : Google Scholar : PubMed/NCBI
|
|
43
|
Wu G, Lu X, Wang Y, He H, Meng X, Xia S,
Zhen K and Liu Y: Epigenetic high regulation of ATAD2 regulates the
Hh pathway in human hepatocellular carcinoma. Int J Oncol.
45:351–361. 2014. View Article : Google Scholar : PubMed/NCBI
|
|
44
|
Zou JX, Guo L, Revenko AS, Tepper CG, Gemo
AT, Kung HJ and Chen HW: Androgen-induced coactivator ANCCA
mediates specific androgen receptor signaling in prostate cancer.
Cancer Res. 69:3339–3346. 2009. View Article : Google Scholar : PubMed/NCBI
|
|
45
|
Zou JX, Revenko AS, Li LB, Gemo AT and
Chen HW: ANCCA, an estrogen-regulated AAA+ ATPase coactivator for
ERalpha, is required for coregulator occupancy and chromatin
modification. Proc Natl Acad Sci USA. 104:18067–18072. 2007.
View Article : Google Scholar : PubMed/NCBI
|