Introduction
Although thymic epithelial tumors (TETs) are rare,
they are the most common tumor of the anterior mediastinum
(1). The World Health Organization
(WHO) Consensus Committee (2015) proposed that TETs consist of
thymoma (types A, AB, B1, B2 and B3), thymic carcinoma (TC) and
neuroendocrine tumors of the thymus (NECTT) (2). Thymoma is defined as a low-grade
malignant tumor of the thymic epithelium with a variable population
of immature, but non-neoplastic T cells that is associated with
myasthenia gravis and other autoimmune diseases. However, TC is
defined as a malignant tumor with evidently atypical cells of an
invasive nature without immature T-cell infiltration and autoimmune
disease (3).
Previous studies have examined genetic alterations
in TETs (4-6). Wang et al performed a
comparative sequence analysis on 47 TC and 31 thymomas and revealed
that the incidence of somatic non-synonymous mutations was
significantly higher in TC (62%) than in thymoma (13%). They also
detected the enrichment of mutations in TP53, BAP1,
SETD2, CYLD and KIT (26-9%) in TC (4). Radovich et al reported that
GTF2IL424H mutations were unique and the most common in type A and
AB thymomas (type A, 100%; type AB, 70%), but rare in other TETs
(5).
Limited information is currently available on
epigenetic alterations in TETs (7,8). We
previously examined the aberrant DNA methylation of 4
cancer-related genes [the death-associated protein kinase
(DAPK), p16, O-6-methylguanine-DNA
methyltransferase (MGMT) and hyperpigmentation,
progressive, 1 (HPP1) genes] in 26 thymomas and 6 TCs
and demonstrated that aberrant methylation was significantly more
frequent in TC (86%) than in thymoma (29%) (7). We also investigated the DNA
methylation of the MGMT gene in 44 thymomas and 23 TCs, and
found that MGMT methylation was significantly more frequent
in TCs (74%) than in thymomas (29%). A correlation has been
reported between MGMT methylation and the loss of its protein
expression (8).
To clarify whether the DNA methylation of certain
genes is related to malignant behavior in TET, we herein performed
the systematic and genome-wide screening of aberrantly methylated
CpG islands (CGI) in thymoma and TC.
Materials and methods
Patients and tissue samples
Forty-six TET samples and 20 paired thymic tissues
were obtained from patients with histologically proven TET who
underwent surgery at Tokushima University Hospital (Tokushima,
Japan) between 1990 and 2016. Thymic tissues that were located far
from the tumor were obtained during surgery. The patient
characteristics are presented in Tables I and SI. All TETs were classified according to
the WHO histological classification system (2). The representative pathology of TETs
(type A, B1, B2, and B3 thymomas and TC) is illustrated in Fig. S1. The breakdown of TET samples by
diagnosis was as follows: 30 cases of thymoma, 12 TC and 4 NECTT.
The clinical stage of each TET was identified according to the
criteria of Masaoka-Koga staging (9). The frequencies of advanced cases
(stages III and IV) of thymoma and TC + NECTT were 33 and 50%,
respectively. No significant differences were observed in their
frequencies between both groups (Table
I, chi-squared test).
 | Table ICharacteristics of patients. |
Table I
Characteristics of patients.
| Variable and
category | No. of cases
Period | Percentage
|
|---|
| Mean | Median |
|---|
| Age | 28-84 | 60.1 | 63 |
| Sex | | | |
| Male | 20 | (43.5) | |
| Female | 26 | (56.5) | |
| WHO histological
classification | | | |
| Thymoma | 30 | (65.2) | |
| A | 5 | (10.9) | |
| AB | 2 | (4.3) | |
| B1 | 4 | (8.7) | |
| B2 | 10 | (21.7) | |
| B3 | 9 | (19.6) | |
| Thymic
carcinoma | 12a | (26.1) | |
| NECTT | 4 | (8.7) | |
| Typical
carcinoid | 2 | (4.3) | |
| Atypical
carcinoid | 1 | (2.2) | |
| Small cell
carcinoma | 1 | (2.2) | |
| | | Masaoka-Koga
staging |
| Masaoka-Koga
staging (TETs) | | | Thymoma | Carcinoma including
NECTT |
| I | 11 | (23.9) | 10 | (33.3) | 1 | (6.3) |
| II | 17 | (37.0) | 10 | (33.3) | 7 | (43.8) |
| III | 8 | (17.4) | 4 | (13.3) | 4 | (25.0) |
| IVA | 5 | (10.9) | 4 | (13.3) | 1 | (6.3) |
| IVB | 5 | (10.9) | 2 | (6.7) | 3 | (18.8) |
| Myasthenia
gravis | 9 | (19.6) | | | | |
The present study was performed in accordance with
the principles outlined in the Declaration of Helsinki. Following
the approval of all aspects of this study by the local Ethics
Committee (Tokushima University Hospital, approval numbers 2205-4),
formal written consent was obtained from all patients.
DNA preparation and bisulfite conversion
of genomic DNA
Tumors were snap-frozen and stored at -80°C until
DNA analyses. DNA was extracted using standard methods. The
bisulfite conversion of DNA was conducted using the EZ DNA
Methylation Gold kit (Zymo Research).
Global methylation analysis
A HumanMethylation450 K BeadChip (Illumina) analysis
was performed according to the manufacturer's instructions. The
default settings of the GenomeStudio software DNA methylation
module (Illumina) were applied to calculate the methylation levels
of CpG sites as β-values (β-intensity methylated/intensity
methylated + unmethylated). Data were further normalized using the
peak correction algorithm embedded in the Illumina Methylation
Analyzer (IMA) R package (10). To
identify CGI differentially methylated in B3 type thymoma and TC
samples in the discovery set, median-averaged β-differences in
CGI-based regions were calculated based on a matrix of
β-differences, in which the β-values of TC samples were subtracted
from those of B3 thymoma samples. The characteristics of B3
thymomas and TCs in patients are presented in Table SI. The significance of the
differences was evaluated using Welch's t-test in IMA. Multiple
testing corrections were performed using the Benjamini-Hochberg
approach, with significantly differential methylation being defined
as a false discovery rate (FDR)-adjusted P-value <0.05. The
following criteria were used for differentially methylated CGI:
β-difference >0.5 and FDR-adjusted P-value <0.05. Significant
methylated CpG sites were selected by the Bonferroni's test.
Methylation data for the discovery cohort were deposited in the
Gene Ontology Database under accession number GSE94769.
Bisulfite pyrosequencing
Bisulfite-treated genomic DNA was amplified using a
set of primers designed with PyroMark Assay Design software
(version 2.0.01.15; Qiagen; Table
SII). PCR product pyrosequencing and methylation quantification
were performed with a PyroMark 24 Pyrosequencing System, version
2.0.6 (Qiagen) with sequencing primers designed according to the
manufacturer's instructions (Table
SII).
Statistical analysis
The Shapiro-Wilk test was used to evaluate whether
the numerical datasets were normally distributed. Parametric tests
(paired or unpaired t-test) were used when numerical datasets were
normally distributed. On the other hand, non-parametric tests (the
Wilcoxon signed rank test or Mann-Whitney test) were used when
numerical datasets were not normally distributed. Continuous data
are expressed as medians and ranges or interquartile ranges (IQR,
25 to 75th percentile). We used ANOVA and a post hoc test
(Tukey-Kramer) for multiple comparisons in histology and stage. The
unpaired t-test was used for age distribution, Fisher's exact test
for sex, histology and stage distribution, and the Chi-square test
for myasthenia gravis distribution. The area under the receiver
operating characteristic (ROC) curve [AUC; ranging between 0.5
(chance) and 1.0 (perfect discrimination or accuracy)] was measured
to characterize the accuracy of the DNA methylation signature to
discriminate TC from thymoma. Survival curves were estimated using
the Kaplan-Meier method and were compared with the log-rank
test.
All statistical analyses were performed using two
software programs (SPSS, version 24.0; SPSS, Inc.) and JMP, version
12.2; SAS Institute Inc.). A P-value <0.05 was considered to
indicate a statistically significant difference.
Results
Screening of aberrantly methylated CGI in
tumor samples
We initially screened 7 TC and 8 B3 thymoma samples
obtained from freshly frozen specimens (Table SI) with Illumina
HumanMethylation450 K BeadChip to identify differentially
methylated CGI in a genome-wide manner. Fig. S2 depicts a volcano plot of the
differential CGI methylation profiles of thymoma and TC samples.
The x-axis indicates the average β-value difference (methylation
level). The y-axis indicates the -log10 value of the adjusted
Welch's test P-value for each CGI. Red points are significant
methylated CpG sites determined by the Bonferroni's test. The plots
on the right show more methylated CGI in TC than in B3 thymoma
(Fig. S2, arrow), while those on
the left show more methylated CGI in B3 thymoma than in TC.
In total, 92 CGI were identified as differentially
hyper-methylated in the TC samples in relation to the B3 thymoma
samples [FDR <0.05 and β-difference (TC-B3 thymoma) >0.5].
Table SIII shows the top 29 CGI
significantly hypermethylated in TCs in relation to B3 thymomas. We
investigated whether the DNA methylation of the 29 genes was
related to cancer using the PubMed database and selected G
protein subunit gamma 4 (GNG4), growth hormone secretagogue
receptor (GHSR), homeobox D9 (HOXD9) and spalt like
transcription factor 3 (SALL3).
CGI methylation status of GHSR, GNG4,
HOX9 and SALL3 between TCs and B3 thymomas in an Illumina
HumanMethylation450 K BeadChip array
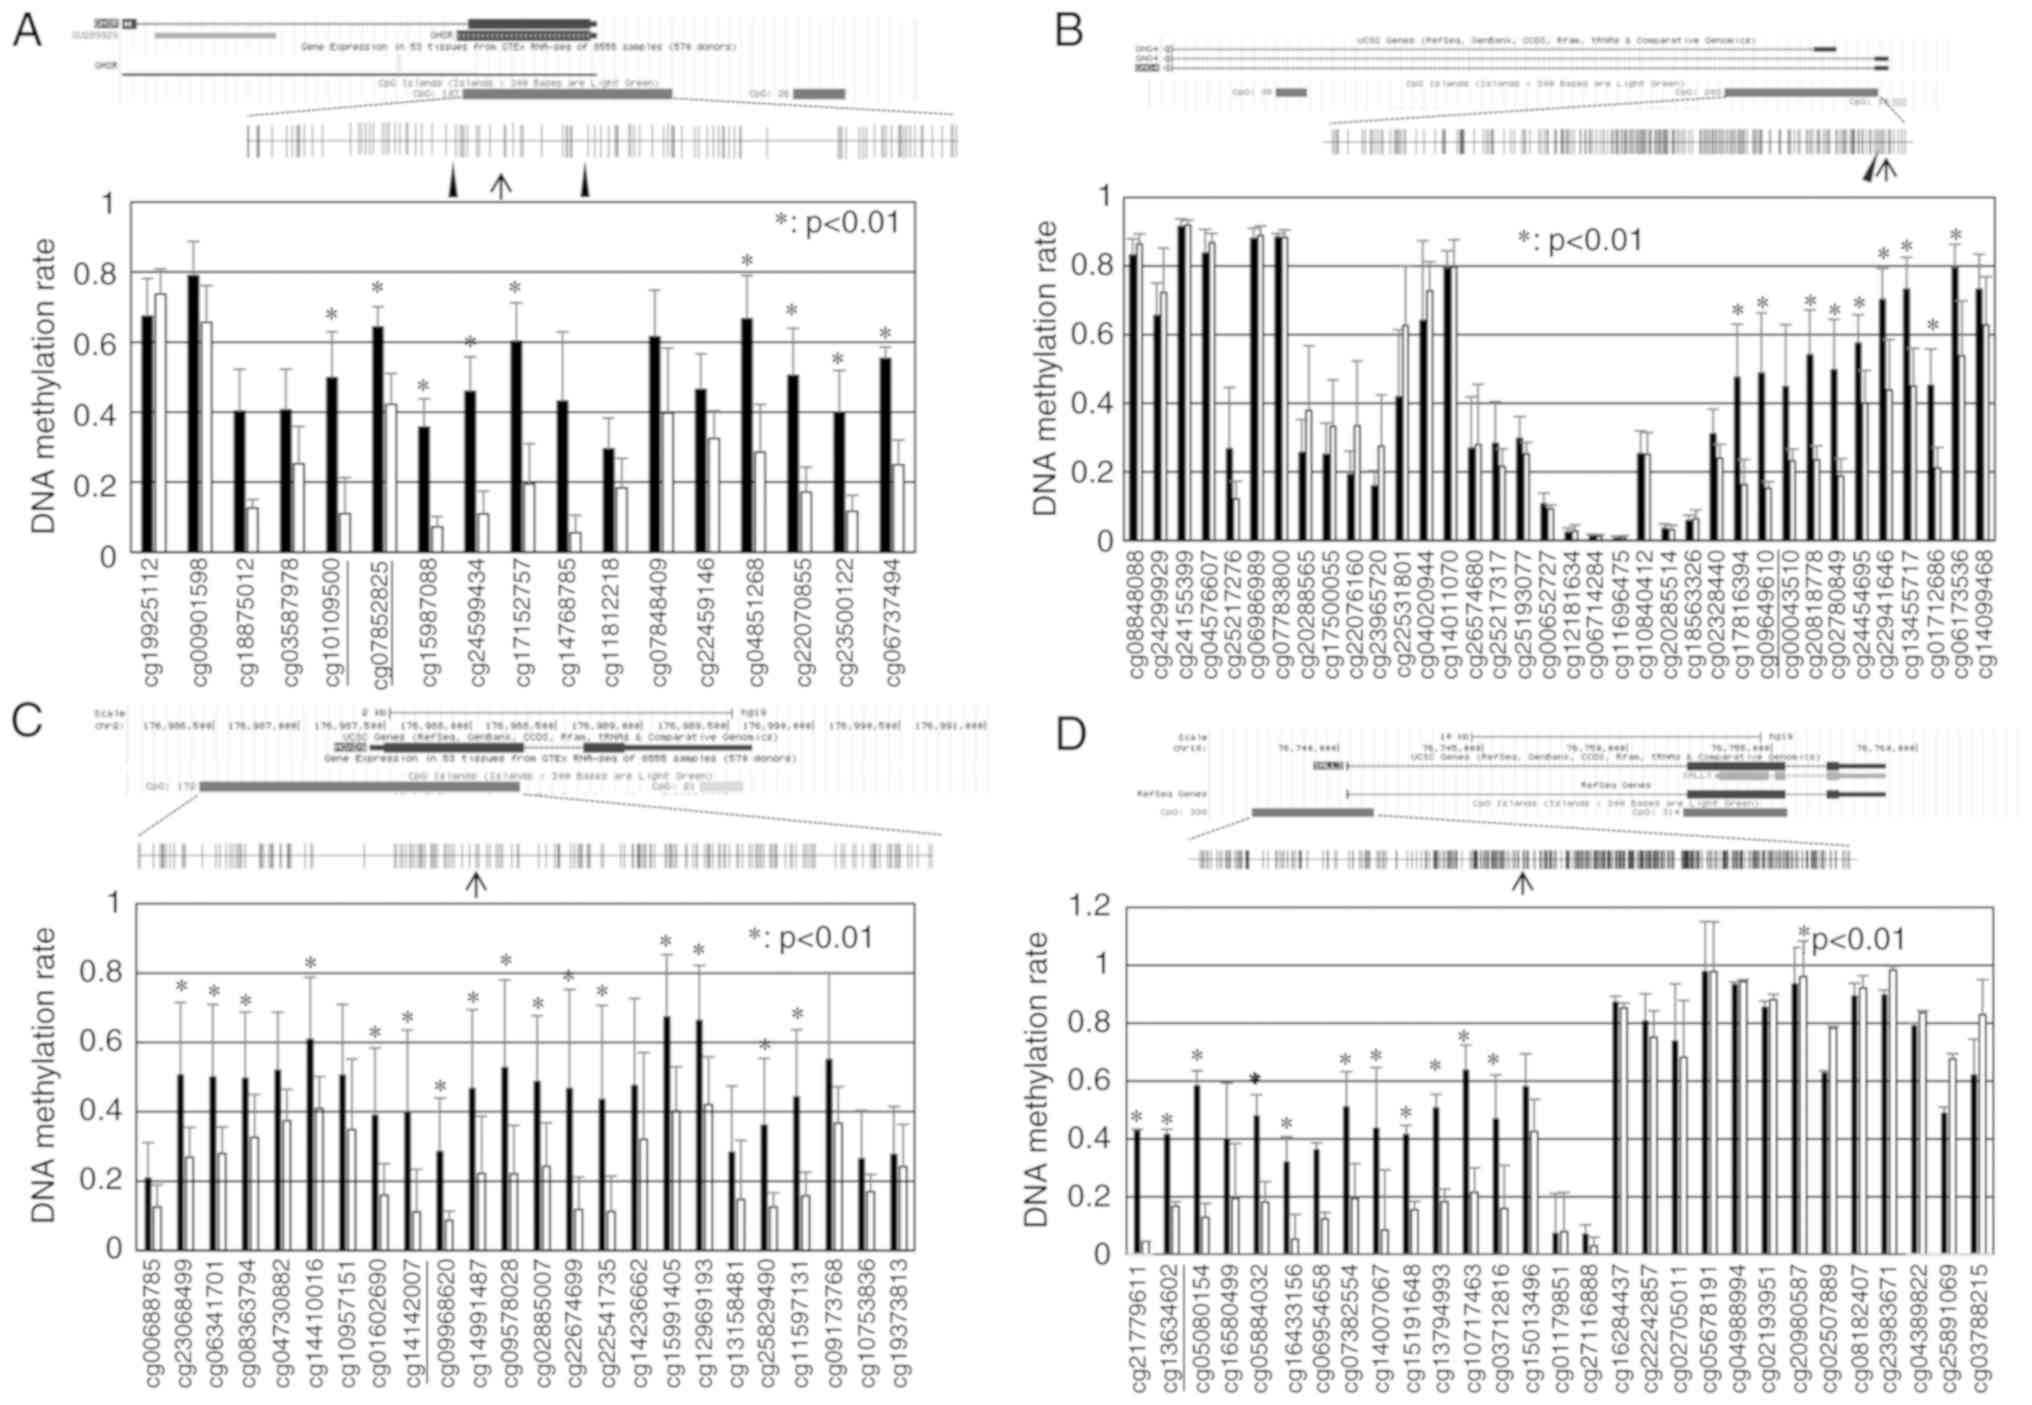
A schematic diagram of the GHSR structure and
CpG sites around exon 1 is presented in Fig. 1A. Using an Illumina
HumanMethylation450 K BeadChip array, CGI including 107 CpG sites
within the GHSR gene was the 16th CGI significantly
hypermethylated in TCs in relation to B3 thymomas (Table SIII). CpG sites within CGI in TCs
exhibited higher levels of methylation than in B3 thymomas. Two CGI
regions (from cg10109500 to cg17152757 and from cg04851268 to
cg06737494) exhibited significantly higher methylation levels in
the TC samples (P<0.01; Fig.
1A). A schematic diagram of the GNG4 structure is shown
in Fig. 1B. CGI, including 203 CpG
sites within the GNG4 gene was the 7th CGI significantly
hypermethylated in TCs in relation to type B3 thymomas (Table SIII). The DNA methylation rate of
CpG sites from cg17816394 to cg06173536 within CGI in TCs was
significantly higher than that in B3 thymomas (P<0.01; Fig. 1B). A schematic diagram of the
HOXD9 structure is shown in Fig. 1C. CGI, including 172 CpG sites
within the HOXD9 gene was the 23th CGI significantly
hypermethylated in TCs in relation to type B3 thymomas (Table SIII). The DNA methylation rate of
CpG sites from cg23068499 to cg11597131 within CGI in TCs was
significantly higher than that in B3 thymomas (P<0.01). A
schematic diagram of the SALL3 structure is presented in
Fig 1D. CGI, including 338 CpG
sites within the SALL3 gene was the 26th CGI significantly
hypermethylated in TCs in relation to type B3 thymomas (Table SIII). The DNA methylation rate of
CpG sites from cg21779611 to cg03712816 within CGI in TCs was
significantly higher than that in B3 thymomas (P<0.01).
CGI methylation status of GHSR, GNG4,
HOX9 and SALL3 in TETs and paired thymic samples in
pyrosequencing
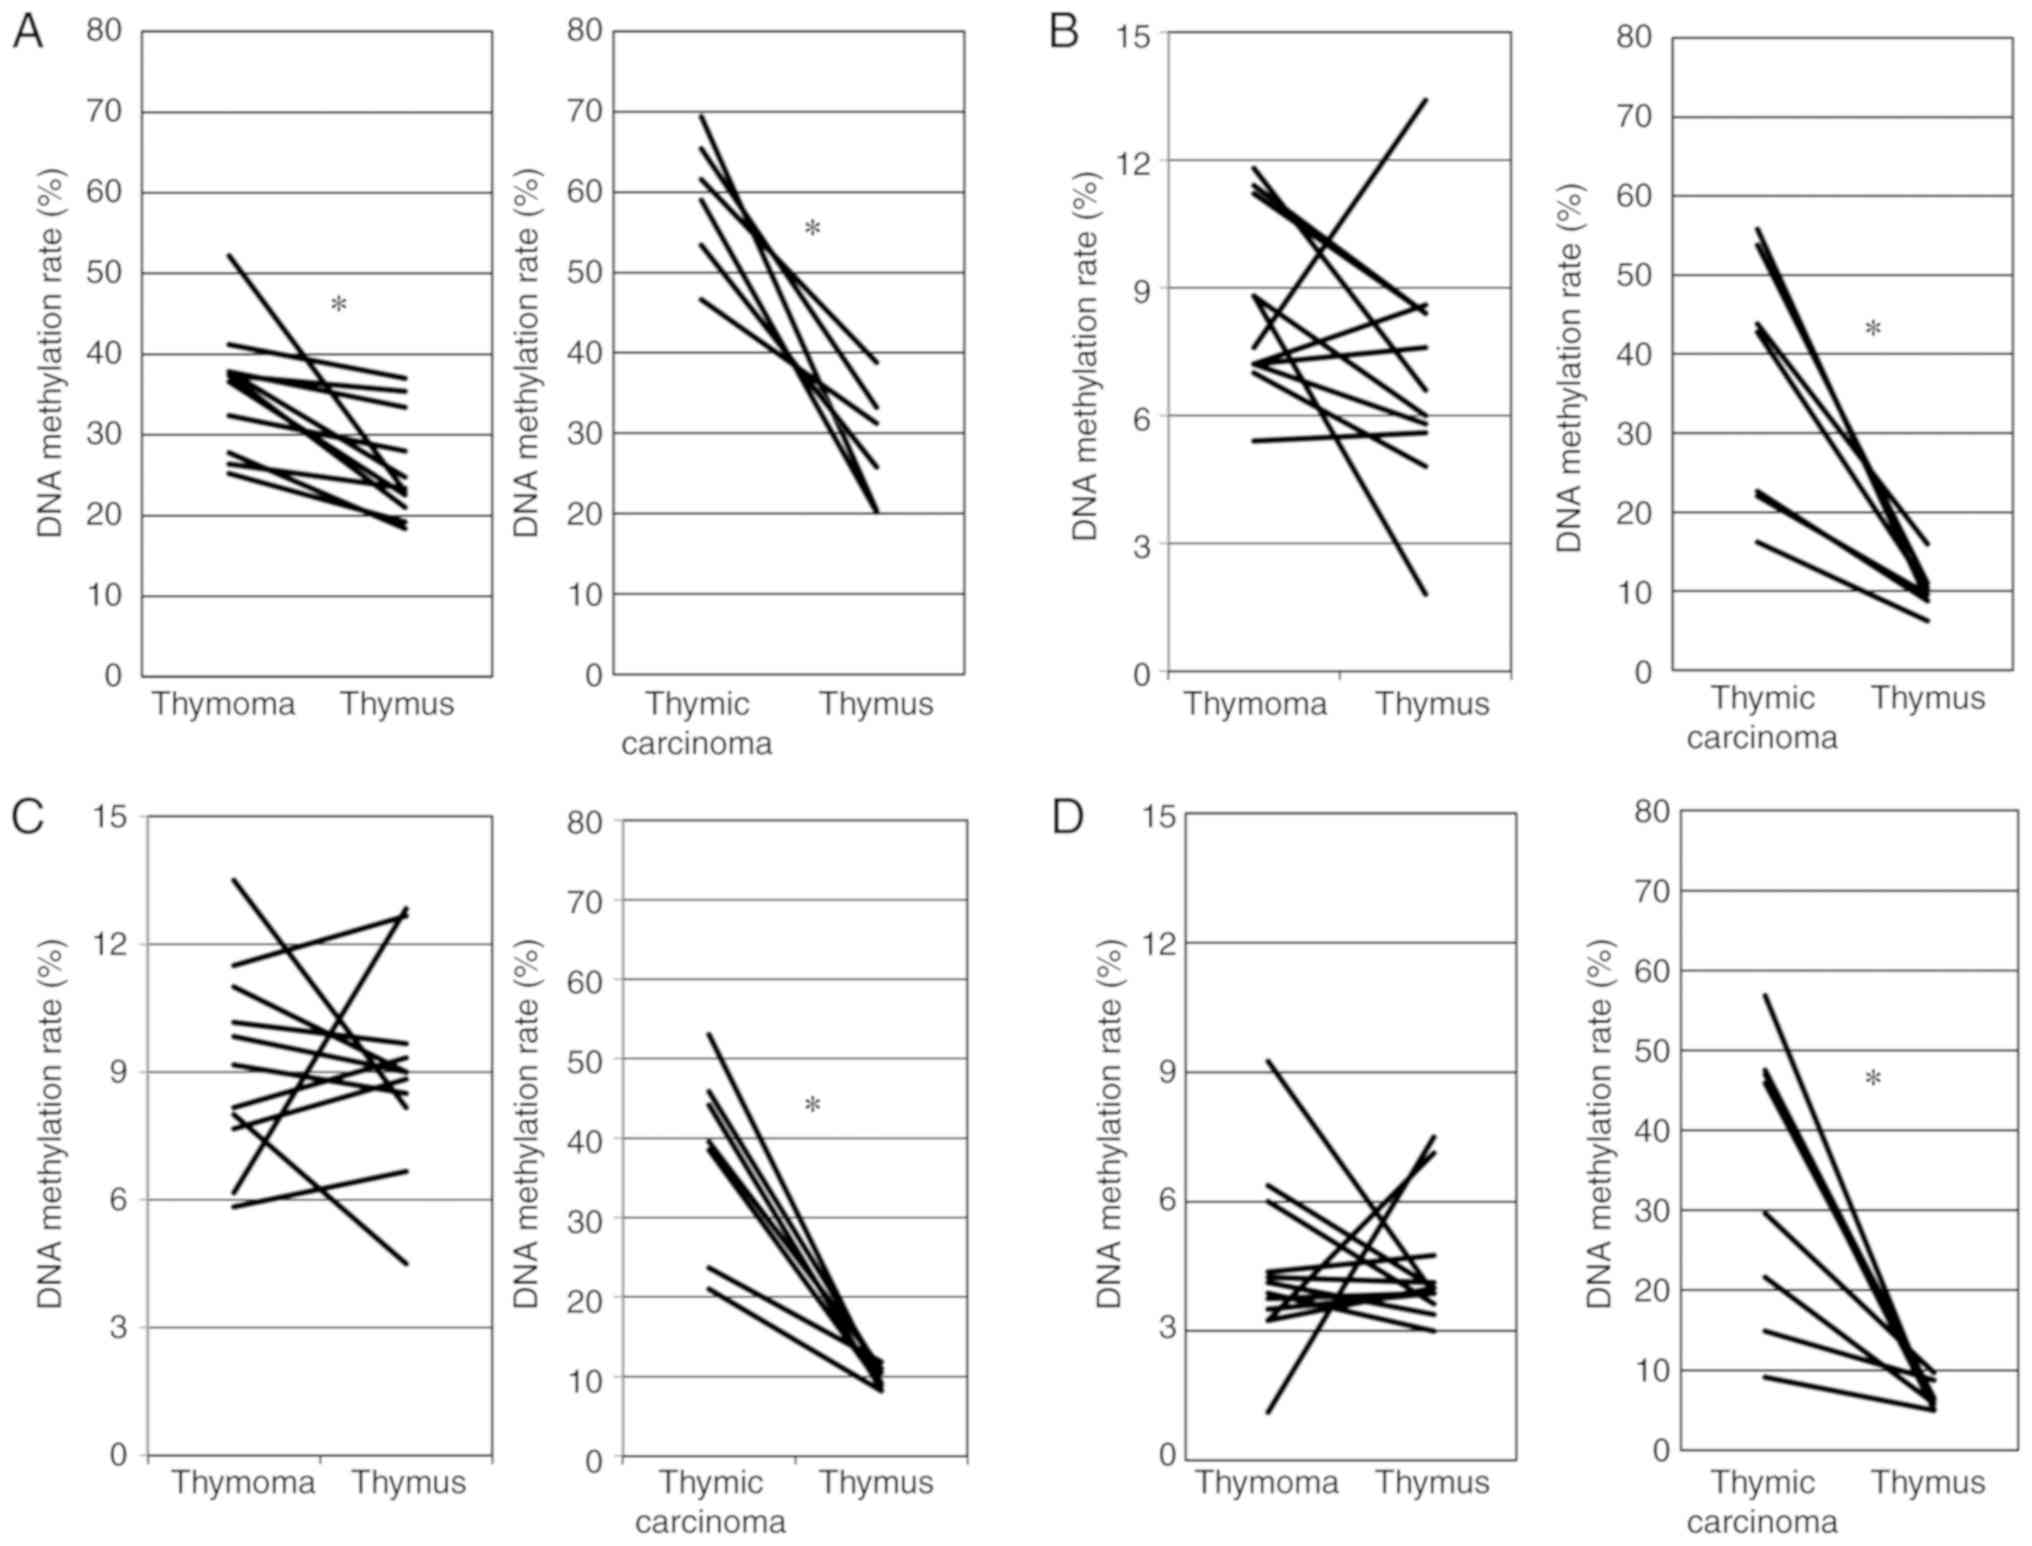
To confirm the data obtained using Illumina
HumanMethylation450 K BeadChip, we examined the DNA methylation of
CpG sites (+242, +249, +251, +257 and +259 from the transcription
start site) of GHSR between cg10109500 (+350) and cg07852825
(+52) using pyrosequencing (Fig.
1A). Moskalev et al reported that CpG sites in this
region frequently exhibited a higher DNA methylation in various
cancers than in healthy tissue (11). Fig.
2A shows the association for the DNA methylation rate of 5 CpG
sites in the GHSR gene between thymoma and the thymus. The
DNA methylation rate was significantly higher for thymoma than for
the thymus (paired t-test, P=0.003). Fig. 2A also shows the association for the
DNA methylation rate of the GHSR gene between TC and the
thymus. The DNA methylation rate was significantly higher for TC
than for the thymus (paired t-test, P=0.0003).
We examined the DNA methylation of CpG sites of
GNG4 around cg09649610 (+350 from TSS) using pyro-sequencing
(Fig. 1B). Pal et al
previously reported that CpG sites in this region frequently
exhibited higher DNA methylation in glioblastoma than in healthy
tissue (12). As shown in Fig. 2B, no significant differences in the
DNA methylation rate of the GNG4 gene were observed between
thymoma and the thymus (paired t-test, P=0.176). Fig. 2B also shows that the DNA
methylation rate was significantly higher for TC than for the
thymus (Wilcoxon signed rank test, P=0.018).
We examined the DNA methylation of CpG sites of
HOXD9 around cg14142007 (-753 from TSS) using
pyrose-quencing (Fig. 1C). Marzese
et al reported that CpG sites in this region frequently
exhibited higher DNA methylation in malignant melanoma with
metastasis than in healthy tissue and malignant melanoma without
metastasis (13). As shown in
Fig. 2C, no significant
differences in the DNA meth-ylation rates of the HOXD9 gene
were observed between thymoma and the thymus (paired t-test,
P=0.861). Fig. 2C also shows that
the DNA methylation rate was significantly higher for TC than for
the thymus (Wilcoxon signed rank test, P=0.018).
We examined the DNA methylation of CpG sites of the
SALL3 gene around cg13634602 (-1095 from TSS) using
pyrosequencing. Misawa et al reported that CpG sites from
-319 to 184 frequently showed DNA methylation in head and neck
cancer (14). In this study, we
attempted to create pyrosequence primers, but were unsuccessful;
therefore, we created suitable primers for PCR and sequencing on
the upstream side (-1,095). As shown in Fig. 2D, no significant differences in the
DNA methylation rate of the SALL3 gene were observed between
thymoma and the thymus (Wilcoxon signed rank test, P=0.906).
Fig. 2D also shows that the DNA
methylation rate was significantly higher for TC than for the
thymus (Wilcoxon signed rank test, P=0.0117).
CGI methylation status of GHSR, GNG4,
HOX9 and SALL3 in the pyrosequencing of TETs according to the WHO
histological classification
Fig. 3A shows the
median DNA methylation rate of the GHSR gene in TETs
according to the WHO histological classification. The median DNA
methylation rates in A+AB+B1, B2, B3 and TCs + NECTT were 32.4,
36.5, 38.0 and 55.4, respectively. The median DNA methylation rate
was significantly higher for TCs including NECTT than for thymoma
(55.4 vs. 36.5) (unpaired t-test, P<0.001). No significant
differences were observed in the median DNA methylation rate
according to the WHO histological classification for thymomas
(A+AB+B1 vs. B2, B2 vs. B3, and A+AB+B1 vs. B3, ANOVA and
Tukey-Kramer tests). The median DNA methylation rate was
significantly higher for TCs than for each group of thymoma
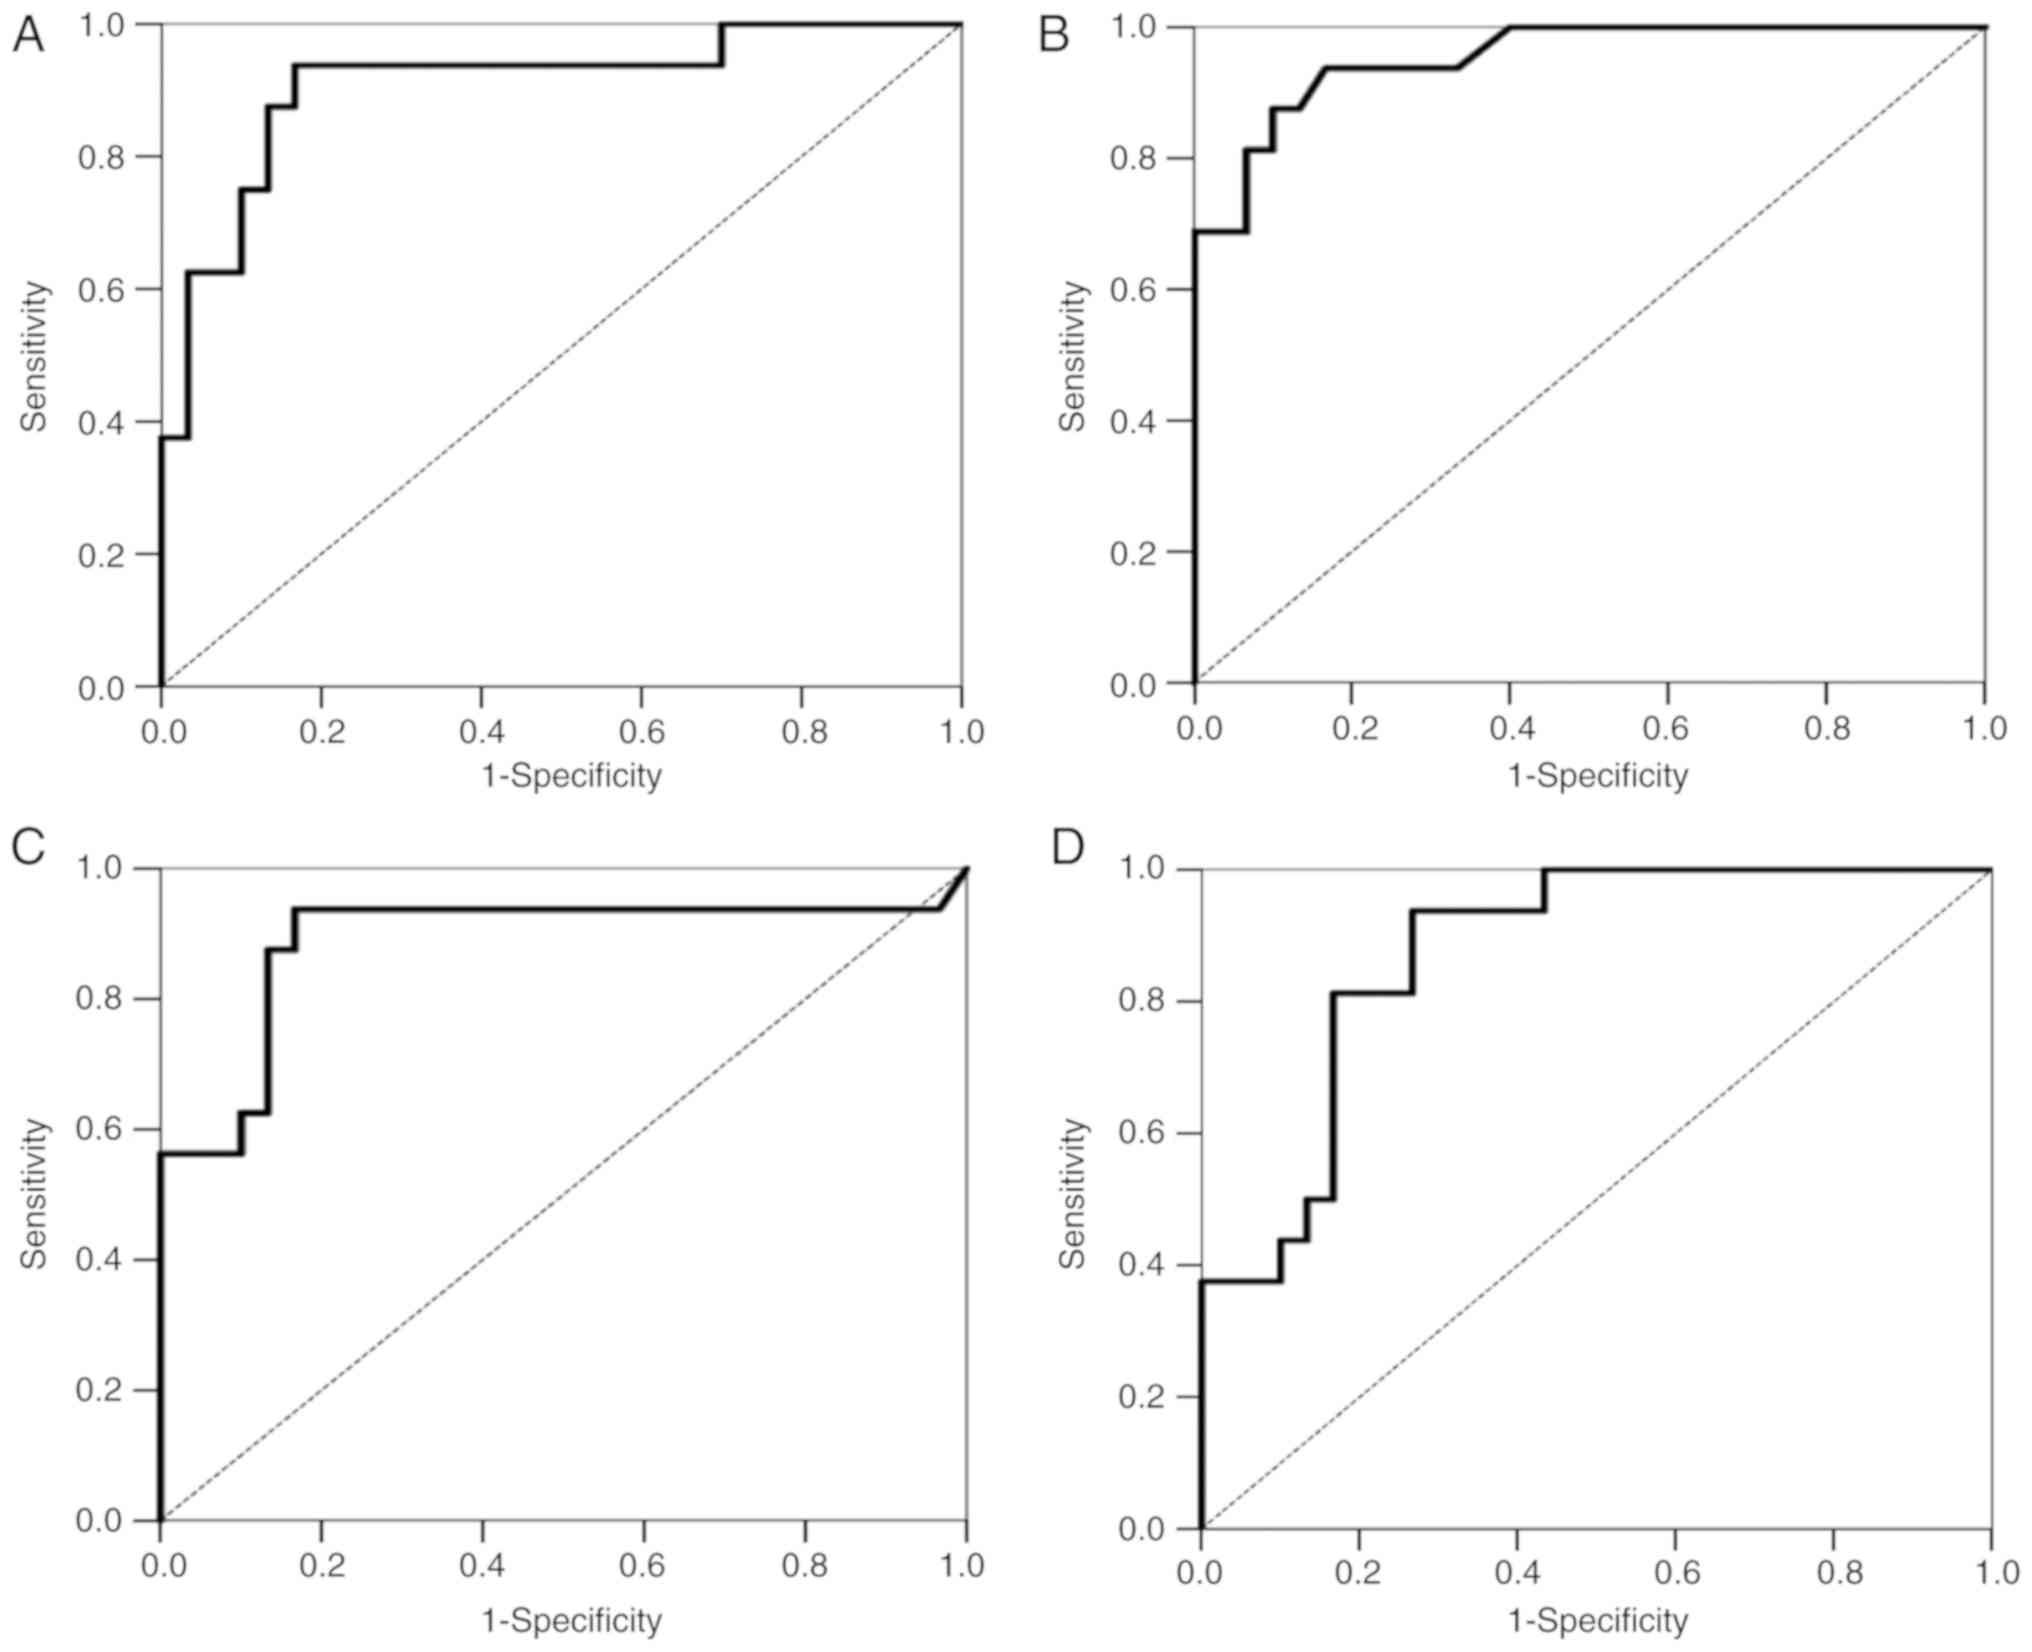
(A+AB+B1, B2 and B3, ANOVA and Tukey-Kramer tests) (P<0.001). We
examined the accuracy of the methylation signature of 4 genes for
the detection of TCs using a ROC curve analysis. We used AUC as the
criterion of accuracy, which may range in value from 0.5 (chance)
to 1.0 (perfect discrimination or accuracy). Fig. 4A shows the ROC curve for the
accuracy of the GHSR methylation signature for TC detection
from all tumors. It revealed high degrees of sensitivity and
specificity for discriminating TCs and thymomas (AUC=0.908).
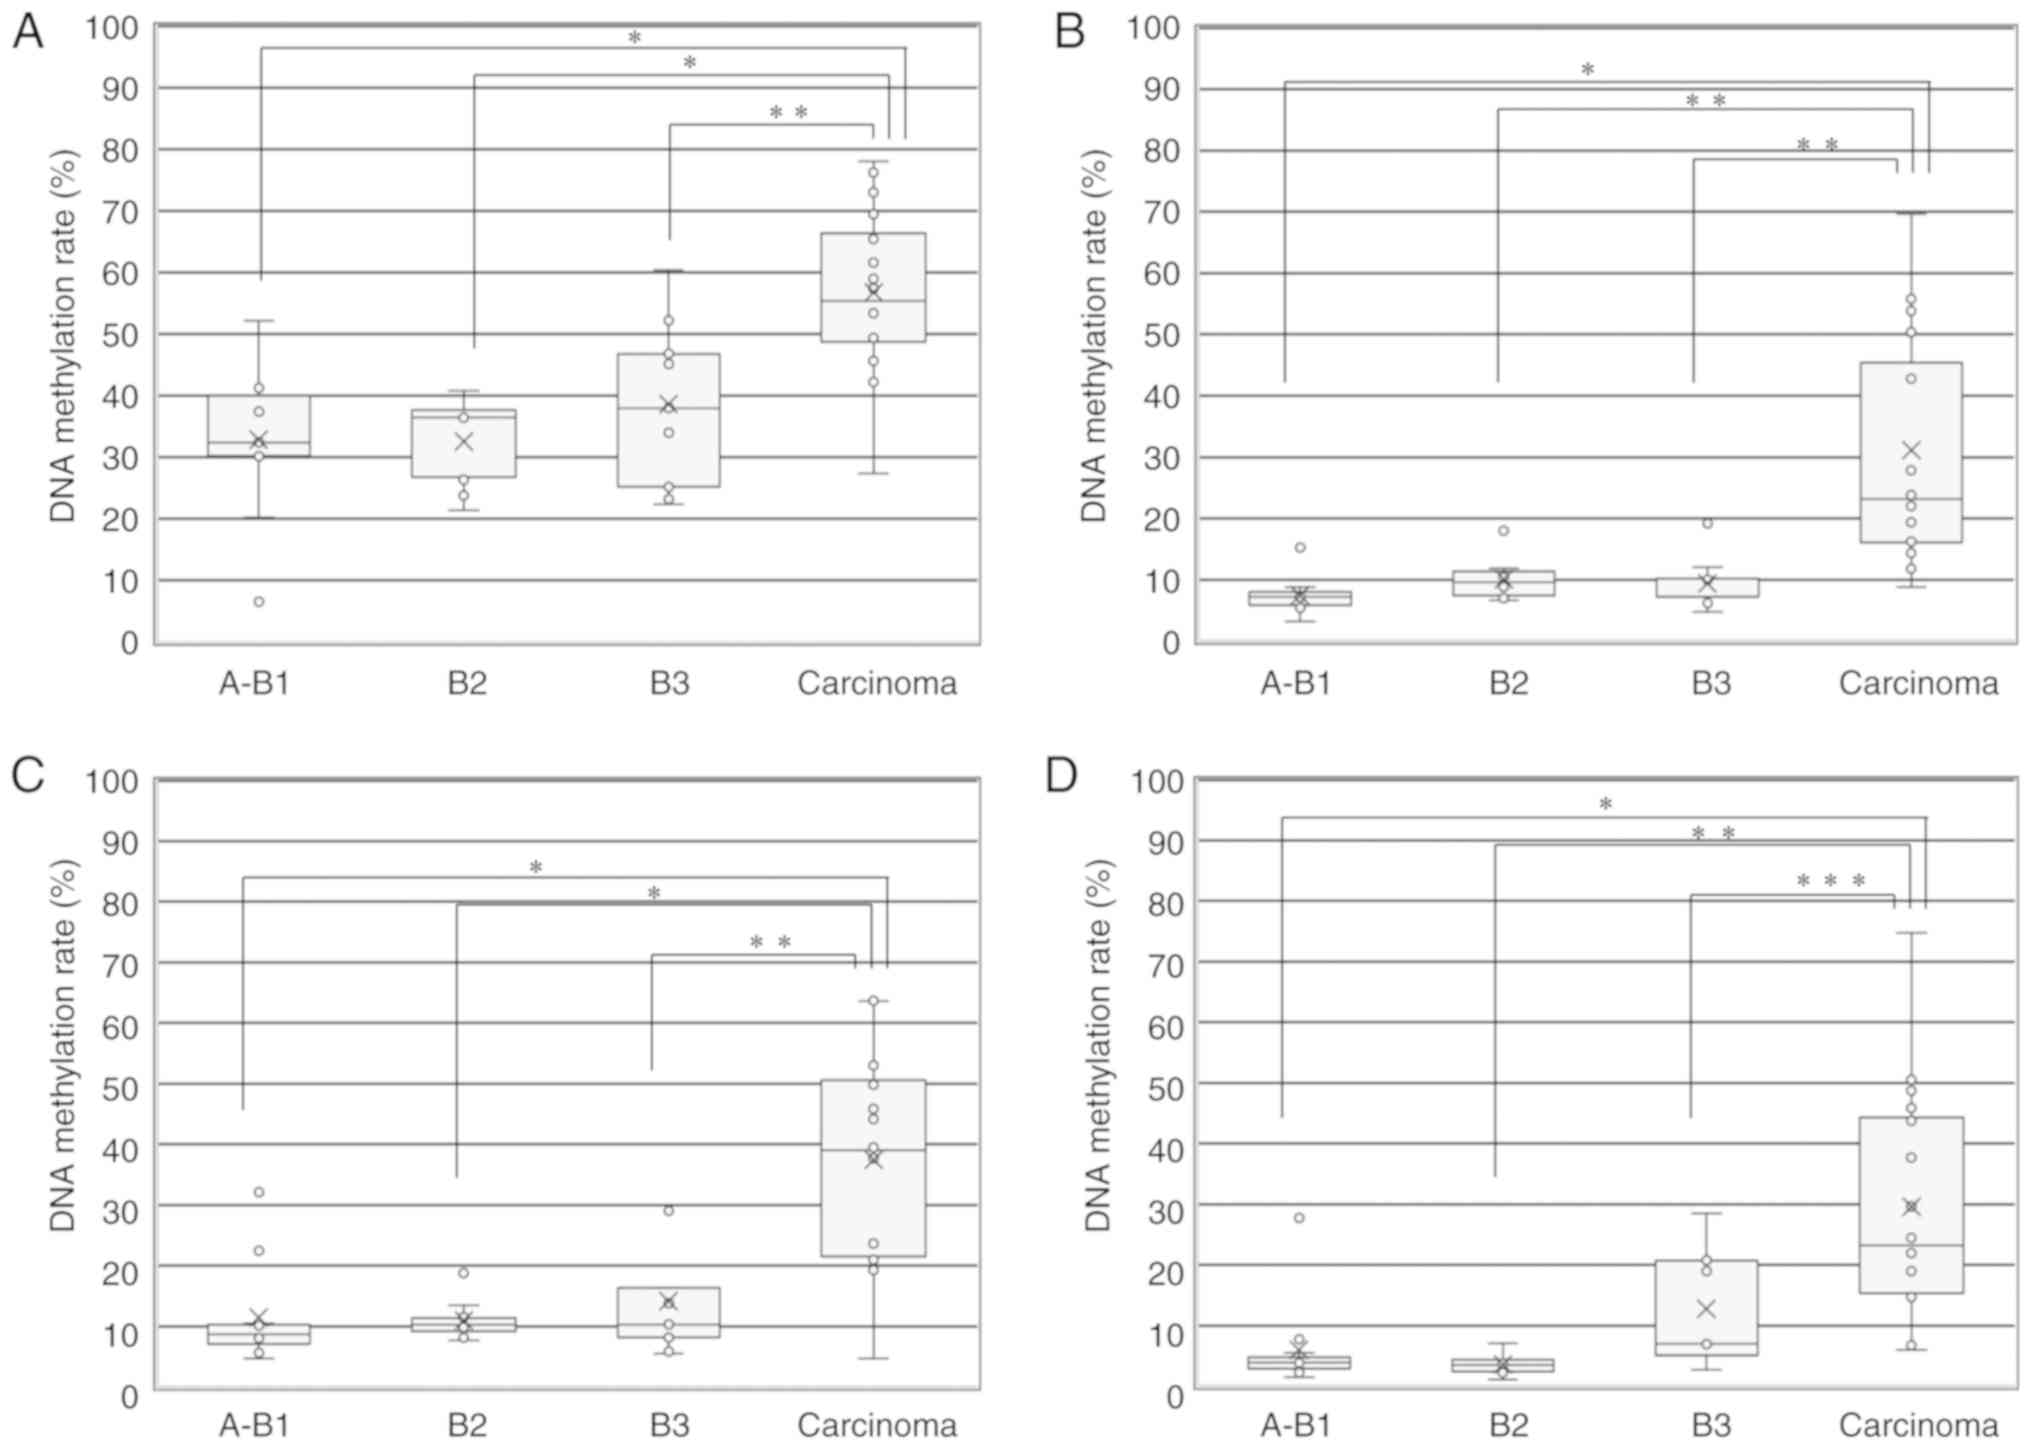 | Figure 3DNA methylation rate of 4 genes in
TETs according to the WHO histological classification. (A) DNA
methylation rate of the GHSR gene in TETs according to the
WHO histological classification (A+AB+B1, B2, B3 and TCs + NECTT).
The upper and lower ends of the whiskers, the upper and lower edges
of the boxes, the horizontal lines across each box, 'x' marks and
the circles outside the boxes represent the upper and lower
extremes, the upper (75th) and lower (25th) quartiles, medians,
means and data outliers, respectively. Median DNA methylation rates
in A+AB+B1, B2, B3, and TCs + NECTT were 32.4 (range, 6.6-52.2;
IQR, 30.2-40), 36.5 (range, 21.4-40.8; IQR, 26.8-37.7), 38.0
(range, 22.4-60.4; IQR, 25.2-46.8) and 55.4 (range, 27.4-78.0; IQR,
48.7-66.4), respectively. The DNA methylation rate of the
GHSR gene between TCs + NECTT and thymomas (A+AB+B1+B2+B3)
was 55.4 (range, 27.4-78.0; IQR, 48.7-66.4) vs. 36.5 (range,
6.6-60.4; IQR, 26.8-40.3). The median DNA methylation rate was
significantly higher for TCs than for each group of thymoma (ANOVA:
P<0.0001 and Tukey-Kramer tests: A+AB+B1 vs. carcinoma,
P<0.0001; B2 vs. carcinoma, P<0.0001; B3 vs. carcinoma,
P=0.0049). (B) DNA methylation rate of the GNG4 gene in TETs
according to the WHO histological classification (A+AB+B1, B2, B3
and TCs + NECTT). Median DNA methylation rates in A+AB+B1, B2, B3,
and TCs + NECTT were 7.2 (range, 3.2-15.2; IQR, 5.8-8.0), 9.6
(range, 6.6-18.0; IQR, 7.5-11.4), 7.2 (range, 4.8-19.2; IQR,
7.2-10.2) and 23.2 (range, 8.8-69.6; IQR, 16.1-45.5), respectively.
The DNA methylation rate of the GNG4 gene between TCs +
NECTT and thymomas was 23.2 (range, 8.8-69.6; IQR, 16.1-45.5) vs.
7.7 (range, 3.2-19.2; IQR, 6.7-10.4). The median DNA methylation
rate was significantly higher for TCs than for each group of
thymoma (ANOVA: P<0.0001 and Tukey-Kramer tests: A+AB+B1 vs.
carcinoma, P<0.0001; B2 vs. carcinoma, P=0.0003; B3 vs.
carcinoma, P=0.0003). (C) DNA methylation rate of the HOXD9
gene in TETs according to the WHO histological classification
(A+AB+B1, B2, B3 and TCs + NECTT). The median DNA methylation rates
in A+AB+B1, B2, B3, and TCs + NECTT were 8.7 (range, 4.7-32.2; IQR,
7.1-10.3), 10.3 (range, 7.7-18.8; IQR, 9.2-11.4), 10.3 (range,
5.5-30.0; IQR, 8.2-16.3) and 39.0 (range, 4.7-63.7; IQR,
21.5-50.6), respectively. The DNA methylation rate of the
HOXD9 gene between TCs + NECTT and thymomas was 39.0 (range,
4.7-63.7; IQR, 21.5-50.6) vs. 9.6 (range, 4.7-32.2; IQR, 8.1-13.0).
The median DNA methylation rate was significantly higher for TCs
than for each group of thymoma (ANOVA: P<0.0001 and Tukey-Kramer
tests: A+AB+B1 vs. carcinoma, P<0.0001; B2 vs. carcinoma,
P<0.0001; B3 vs. carcinoma, P=0.0002). (D) DNA methylation rate
of the SALL3 gene in TETs according to the WHO histological
classification (A+AB+B1, B2, B3 and TCs + NECTT). The median DNA
methylation rates in A+AB+B1, B2, B3, and TCs + NECTT were 3.9
(range, 1.5-27.8; IQR, 2.9-4.8), 3.5 (range, 1.1-7.1; IQR,
2.4-4.4), 7.0 (range, 2.8-28.5; IQR, 5.1-20.8) and 23.3 (range,
6.0-74.8; IQR 15.3-44.3), respectively. The DNA methylation rate of
the SALL3 gene between TCs + NECTT and thymomas was 23.3
(range, 6.0-74.8; IQR, 15.3-44.3) vs. 4.2 (range, 1.1-28.5; IQR,
3.1-7.0). The median DNA methylation rate was significantly higher
for TCs than for each group of thymoma (ANOVA: P<0.0001 and
Tukey-Kramer tests: A+AB+B1 vs. carcinoma, P<0.0001; B2 vs.
carcinoma, P=0.0001; B3 vs. carcinoma, P=0.0138). TET, thymic
epithelial tumor; TC, thymic carcinoma; NECTT, neuroendocrine tumor
of the thymus. *P<0.0001, **P<0.001,
***P<0.005, as indicated. |
Fig. 3B shows the
median DNA methylation rate of 5 CpG sites in the GNG4 gene
in TETs according to the WHO histological classification. The
median DNA methylation rates in A+AB+B1, B2, B3 and TCs + NECTT
were 7.2, 9.6, 7.2 and 23.2, respectively. The median DNA
methylation rate was significantly higher for TCs, including NECTT
than for thymoma (23.2 vs. 7.7). No significant differences were
observed in the median DNA methylation rate according to the WHO
histological classification of thymomas (ANOVA and Tukey-Kramer
tests). The median DNA methylation rate was significantly higher
for TCs than for each group of thymoma (ANOVA and Tukey-Kramer
tests). Fig. 4B shows the ROC
curve for the accuracy of the GNG4 methylation signature for
TC detection from all tumors. It revealed high degrees of
sensitivity and specificity for discriminating TCs and thymomas
(AUC=0.953).
Fig. 3C shows the
median DNA methylation rate of 5 CpG sites in the HOXD9 gene
in TETs according to the WHO histological classification. The
median DNA methylation rates in A+AB+B1, B2, B3, and TCs + NECTT
were 8.7, 10.3, 10.3 and 39.0, respectively. The median DNA
methylation rate was significantly higher for TCs, including NECTT
than for thymoma (39.0 vs. 9.6). No significant differences were
observed in the mean DNA methylation rate according to the WHO
histological classification of thymomas (ANOVA and Tukey-Kramer
tests). The median DNA methylation rate was significantly higher
for TCs than for each group of thymoma (ANOVA and Tukey-Kramer
tests). Fig. 4C shows the ROC
curve for the accuracy of the HOXD9 methylation signature
for TC detection from all tumors. It revealed high degrees of
sensitivity and specificity for discriminating TCs and thymomas
(AUC=0.889).
Fig. 3D shows the
median DNA methylation rate of 5 CpG sites in the SALL3 gene
in TETs according to the WHO histological classification. The
median DNA methylation rates in A+AB+B1, B2, B3, and TCs + NECTT
were 3.9, 3.5, 7.0 and 23.3, respectively. The median DNA
methylation rate was significantly higher for TCs including NECTT
than for thymomas (23.3 vs. 4.2). No significant differences were
observed in the median DNA methylation rate according to the WHO
histological classification of thymomas (ANOVA and Tukey-Kramer
tests). The median DNA methylation rate was significantly higher
for TCs than for each group of thymomas (ANOVA and Tukey-Kramer
tests). Fig. 4D shows the ROC
curve for the accuracy of the SALL3 methylation signature
for TC detection from all tumors. It revealed high degrees of
sensitivity and specificity for discriminating TCs and thymomas
(AUC=0.873).
CGI methylation status of GHSR, GNG4,
HOX9 and SALL3 in pyrosequencing for TETs according to the
Masaoka-Koga clinical stage
Fig. S3A shows the
median DNA methylation rate of the GHSR gene in TETs
according to the Masaoka-Koga clinical stage. The median DNA
methylation rates in stages I, II, III, IVA and IVB were 32.4,
37.8, 39.8, 40.8 and 73.0, respectively. No significant differences
were observed in the DNA methylation rate of the GHSR gene
between each stage (ANOVA and Tukey-Kramer tests). Fig. S3B shows the median DNA methylation
rate of the GNG4 gene in TETs according to the Masaoka-Koga
clinical stage. The median DNA methylation rates in stages I, II,
III, IVA and IVB were 7.6, 11.8, 10.2, 10.2 and 27.8, respectively.
There was only significant difference between stage I and IVB
(ANOVA and Tukey-Kramer tests). Fig.
3C shows the median DNA methylation rate of the HOXD9
gene in TETs according to the Masaoka-Koga clinical stage. The
median DNA methylation rates in stages I, II, III, IVA and IVB were
10.2, 13.5, 14.8, 18.8 and 8.2, respectively. No significant
differences were observed in the DNA methylation rate of the
HOXD9 gene between each stage (ANOVA and Tukey-Kramer
tests). Fig. 3D shows the median
DNA methylation rate of the SALL3 gene in TETs according to
the Masaoka-Koga clinical stage. The median DNA methylation rates
in stages I, II, III, IVA and IVB were 5.0, 6.4, 9.3, 32.4 and 5.3,
respectively. No significant differences were observed in the DNA
methylation rate of the SALL3 gene between each stage (ANOVA
and Tukey-Kramer tests).
Characteristics of patients grouped by
the median value of each gene
Patients with TETs were divided into 2 groups
according to the median value of the frequency of the DNA
methylation of each gene. In total, 23 patients had a median value
of the frequency of DNA methylation of the GHSR gene
>38.4 (higher DNA methylation level), while that for the
remaining 23 patients was ≤38.4 (lower DNA methylation level). In
total, 23 patients had a median value of the frequency of the DNA
methylation of the GNG4 gene >10.3 (higher DNA
methylation level), while that for the remaining 23 patients was
≤10.3 (lower DNA methylation level). A total of 23 patients had a
median value of the frequency of the DNA methylation of the
HOX9 gene >12.5 (higher DNA methylation level), while
that for the remaining 23 patients was ≤12.5 (lower DNA methylation
level). A total of 23 patients had a median value of the frequency
of the DNA methylation of the SALL3 gene >7.75 (higher
DNA methylation level), while that for the remaining 23 patients
was ≤7.75 (lower DNA methylation level). The characteristics of
patients grouped by the median value of each gene are shown in
Table II.
| Table IICharacteristics of patients grouped
by the median value of DNA methylation of each gene. |
Table II
Characteristics of patients grouped
by the median value of DNA methylation of each gene.
| Variable and
category | GNG4
| HOXD9
| GHSR
| SALL3
|
|---|
| Higher | Lower | P-value | Higher | Lower | P-value | Higher | Lower | P-value | Higher | Lower | P-value |
|---|
| Age | 61.6±10.4 | 58.6±13.9 | 0.405a | 58.7±12.4 | 61.4±12.2 | 0.461a | 62.1±11.6 | 58.1±12.8 | 0.272a | 61.0±11.5 | 59.1±13.1 | 0.602a |
| Male | 11 | 9 | | 12 | 8 | | 11 | 9 | | 12 | 8 | |
| 47.8% | 39.1% | 0.383b | 52.2% | 34.8% | 0.186b | 47.8% | 39.1% | 0.383b | 52.2% | 34.8% | 0.186b |
| MG | 2 | 7 | | 5 | 4 | | 3 | 6 | | 2 | 7 | |
| 8.7% | 30.4% | 0.063c | 21.7% | 17.4% | 0.71c | 13.0% | 26.1% | 0.265c | 8.7% | 30.4% | 0.063c |
| Thymoma | 8 | 22 | | 8 | 22 | | 8 | 22 | | 8 | 22 | |
| 34.8% | 95.7% | | 34.8% | 95.7% | | 34.8% | 95.7% | | 34.8% | 95.7% | |
| A, AB, B1 | 1 | 10 | | 2 | 9 | | 3 | 8 | | 2 | 9 | |
| 4.3% | 43.5% | | 8.7% | 39.1% | | 13.0% | 34.8% | | 8.7% | 39.1% | |
| B2 | 5 | 5 | | 2 | 8 | | 1 | 9 | | 0 | 10 | |
| 21.7% | 21.7% | | 8.7% | 34.8% | | 4.3% | 39.1% | | 0.0% | 43.5% | |
| B3 | 2 | 7 | | 4 | 5 | | 4 | 5 | | 6 | 3 | |
| 8.7% | 30.4% | | 17.4% | 21.7% | | 17.4% | 21.7% | | 26.1% | 13.0% | |
| Thymic
carcinoma | 15 | 1 | | 15 | 1 | | 15 | 1 | | 15 | 1 | |
| 65.2% | 4.3% | <0.001b | 65.2% | 4.3% | <0.001b | 65.2% | 4.3% | <0.001b | 65.2% | 4.3% | <0.001b |
| Stage | | 0.618b | | 0.382b | | 0.382b | | 0.183b | | | | |
| Early stage
(I+II) | 14 | 14 | | 13 | 15 | | 13 | 15 | | 12 | 16 | |
| 63.6% | 60.9% | | 56.5% | 65.2% | | 56.5% | 65.2% | | 52.2% | 69.6% | |
| Advanced stage
(III+IV) | 9 | 9 | | 10 | 8 | | 10 | 8 | | 11 | 7 | |
| 39.1% | 39.1% | | 43.5% | 34.8% | | 43.5% | 34.8% | | 47.8% | 30.4% | |
The proportion of patients with TC was significantly
higher in the higher DNA methylation group (65.2%) than in the low
DNA methylation group (4.3%, P<0.001). No significant
differences were observed in age, sex, the presence of MG, or
Masaoka-Koga staging between the 2 groups. There were 12 TETs
without genes with DNA methylation, 12 TETs with 1 gene with DNA
methylation, 2 TETs with 2 genes with DNA methylation, 4 TETs with
3 genes with DNA methylation, and 16 TETs with 4 genes with DNA
methylation (data not shown).
Relapse-free survival curve of TETs with
higher and lower levels of DNA methylation for GHSR, GNG4, HOX9 and
SALL3
In all TET cases (n=46), the median follow-up time
was 44.1 months (6.7-272.7 months). Two patients died from their
tumors and one from another disease. A total of 16 patients had
recurrence: Pleural dissemination in 9, lung metastasis in 4, lymph
node metastasis in 1 and multiple organ metastasis in 2. In thymoma
cases (n=30), the median follow-up time was 48.4 months (6.7-272.7
months). One patient died from another disease. A total of 6
patients had recurrence: Pleural dissemination in 4 and lung
metastasis in 2.
Fig. 5A shows the
relapse-free survival curve of TETs with a higher level (>38.4)
and lower level (≤38.4) of DNA methylation in GHSR. A
significant difference was observed in survival between the higher
and lower level groups (P=0.029, log-rank test). Fig. 5B shows the relapse-free survival
curve of TETs with a higher level (>10.3) and lower level
(≤10.3) of DNA methylation in GNG4. A significant difference
was observed in survival between the higher and lower level groups
(P=0.002). Fig. 5C shows the
relapse-free survival curve of TETs with a higher level (>12.5)
and lower level (≤12.5) of DNA methylation in HOX9. A
significant difference was observed in survival between the higher
and lower level groups (P=0.003). Fig.
5D shows the relapse-free survival curve of TETs with a higher
level (>7.75) and lower level (≤7.75) of DNA methylation in
SALL3. A significant difference was observed in survival
between the higher and lower level groups (P=0.014).
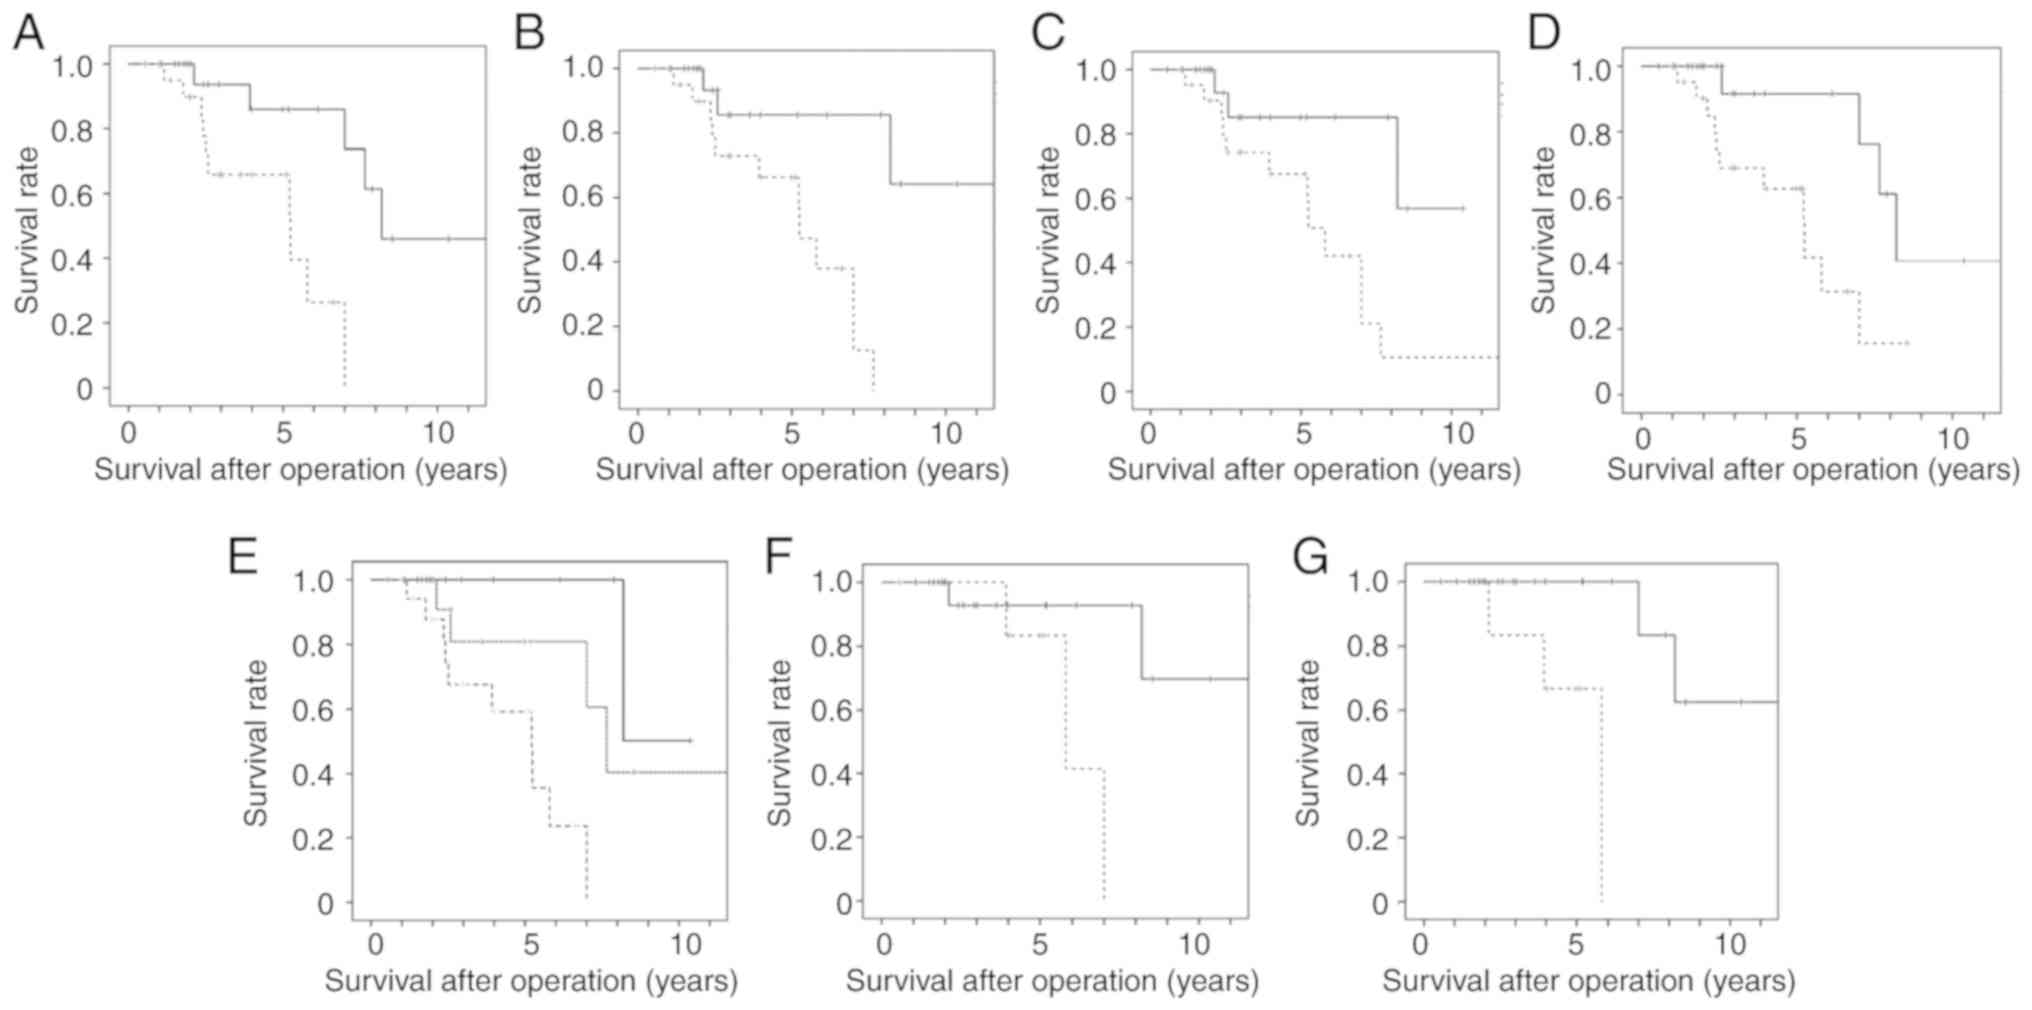 | Figure 5Survival curve of TETs with higher
and lower levels of DNA methylation. (A) Relapse-free survival
curve of TETs with higher and lower levels of DNA methylation in
GHSR. The median value (38.4) of the frequency of the DNA
methylation of GHSR was divided into higher (dotted line) and lower
level groups (solid line). A significant difference was observed in
survival between the higher and lower level groups (P=0.029,
log-rank test). (B) Relapse-free survival curve of TETs with higher
and lower levels of DNA methylation in GNG4. The median
value (10.3) of the frequency of the DNA methylation of GNG4
was divided into higher (dotted line) and lower level groups (solid
line). A significant difference was observed in survival between
the higher and lower level groups (P=0.002, log-rank test). (C)
Relapse-free survival curve of TETs with higher and lower levels of
DNA methylation in HOXD9. The median value (12.5) of the
frequency of the DNA methylation of HOXD9 was divided into
higher (dotted line) and lower level groups (solid line). A
significant difference was observed in survival between the higher
and lower level groups (P=0.003, log-rank test). (D) Relapse-free
survival curve of TETs with higher and lower levels of DNA
methylation in SALL3. The median value (7.75) of the
frequency of the DNA methylation of SALL3 was divided into
higher (dotted line) and lower level groups (solid line). A
significant difference was observed in survival between the higher
and lower level groups (P=0.014, log-rank test). (E) Relapse-free
survival curve of TETs with 3 or 4 genes with DNA methylation, 1 or
2 genes with DNA methylation, and no genes with DNA methylation. A
significant difference was observed in survival between TETs with 3
or 4 genes with DNA methylation (broken line) and 1 or 2 genes with
DNA methylation (dotted line) (P=0.031, log-rank test) and between
TETs with 3 or 4 genes with DNA methylation (broken line) and no
genes with DNA methylation (solid line) (P=0.003, log-rank test).
(F) Relapse-free survival curve of thymomas with higher and lower
levels of DNA methylation in HOX9. The mean value (11.9) of
the frequency of the DNA methylation of HOX9 was divided
into higher (n=7, dotted line) and lower level groups (n=21, solid
line). A significant difference was observed in survival between
the higher and lower level groups (P=0.036, log-rank test). (G)
Relapse-free survival curve of thymomas with higher and lower
levels of DNA methylation in SALL3. The mean value (9.56) of
the frequency of the DNA methylation of SALL3 was divided
into higher (n=6, dotted line) and lower level groups (n=22, solid
line). A significant difference was observed in survival between
the higher and lower level groups (P=0.003, log-rank test). TET,
thymic epithelial tumor. |
We examined the association between the number of
genes with DNA methylation and relapse-free survival. TETs were
divided into 3 groups: Tumors without a gene with DNA methylation,
a tumor with 1 or 2 genes with DNA methylation, and a tumor with 3
or 4 genes with DNA methylation. Fig.
5E shows the relapse-free survival curve of TETs with 3-4 genes
with DNA methylation, 1-2 genes with DNA methylation, and no genes
with DNA methylation. A significant difference was observed in
survival between TETs with 3-4 genes with DNA methylation and 1-2
genes with DNA methylation (P=0.031, log-rank test) and between
TETs with 3-4 genes with DNA methylation and no genes with DNA
methylation (P=0.003).
In the thymoma cases, when the median value of the
frequency of the DNA methylation of each gene divided thymomas into
higher and lower level groups, no significant differences were
observed in relapse-free survival between these groups for each
gene (data not shown). However, when the mean value of the
frequency of the DNA methylation of each gene divided thymomas into
higher and lower level groups, a significant difference was noted
in relapse-free survival between these groups for HOX9 and
SALL3. The mean value (11.9) of the frequency of the DNA
methylation of HOX9 was divided into higher and lower level
groups. Fig. 5F shows the
relapse-free survival curve of thymomas with higher and lower
levels of DNA methylation in HOX9. A significant difference
was observed in survival between the higher and lower level groups
(P=0.036). The mean value (9.56) of the frequency of the DNA
methylation of SALL3 was divided into higher and lower level
groups. Fig. 5G shows the
relapse-free survival curve of thymomas with higher and lower
levels of DNA methylation in SALL3. A significant difference
was observed in survival between the higher and lower level groups
(P=0.003).
Discussion
Thymoma exhibits a weak malignant behavior, while TC
is a more aggressive and refractory tumor (1-3).
Although surgery is the optimal treatment option for operable TC,
the treatment for advanced TC is limited to chemotherapy, which is
generally not curative (1). The
development of an optimal therapy for advanced TC has been hampered
by insufficient knowledge on genetic and epigenetic alterations in
TC (4). Recent studies have
comprehensively examined genetic alterations using next generation
sequencing (4-6). However, limited information is
currently available on epigenetic alterations (7,8). In
this study, we performed the genome-wide screening of aberrantly
methylated CGI in TETs and identified 92 CGI that were
significantly hypermethylated in TC. We examined the promoter
methylation of GNG4, GHSR, HOXD9, and SALL3 in 46
TETs and 20 paired thymic samples using bisulfite pyrosequencing to
identify a rational targeted therapy.
GHSR is a receptor of 'Ghrelin' that is
involved in the modulation of functions, such as hormone secretion,
energy balance and gastric acid release (15). GHSR encodes a member of the
G-protein coupled receptor (GPCR) family and has transcript
variants, GHSR 1a and 1b (16). Previous studies have demonstrated
that GHSR is aberrantly hypermethylated in a number of
cancers (e.g., lung, breast, prostate, pancreatic and colorectal
cancers, glioblastoma, and B-cell chronic lymphocytic leukemia) and
its methylation levels may be used to discriminate between cancer
and healthy tissue, with GHSR hypermethylation being an
early cancer event (11,17,18).
GPCR, comprising α, β, and γ subunits, responds to various
extracellular stimuli, such as hormones, growth factors and sensory
stimulating signals. GNG4 is one of fourteen γ subunit proteins of
GPCR (19). Pal et al
reported that the promoter region of GNG4 was significantly
hypermethylated and that its transcript level was significantly
downregulated in glioblastoma and renal cell carcinoma (12). It functions as a tumor suppressor
gene. Homeobox (HOX) genes have 4 HOX gene clusters:
HOXA, HOXB, HOXC and HOXD. HOXD9 is a
HOXD gene that participates in the development and
patterning of the forelimb and axial skeleton (21,22).
Previous studies have revealed that HOXD9 promoter
methylation is higher in tumors than in healthy tissue, and that
DNA methylation levels correlate with the expression of
HOXD9 mRNA and protein in malignant melanoma and glioma
(13,23). Lv et al demonstrated that
HOXD9 was strongly expressed and functioned as an oncogene
in hepatocellular carcinoma (24).
SALL3 is one of 4 mammalian members of the sal-like (sall)
gene family, which are involved in embryonic development (25). It encodes a C2H2-type zinc-finger
protein (26). Recent studies have
investigated the association between SALL3 expression and
carcinogenesis in hepatocellular carcinoma, head and neck carcinoma
and cervical carcinoma, and have demonstrated that it functions as
a tumor suppressor gene; the hypermethylation of CGI in the
promoter region of SALL3 reduced SALL3 mRNA levels
(14,27-29).
The results of the present study revealed that
promoter methylation was significantly higher in TC than in
thymoma, and demonstrated highly discriminatory ROC profiles that
clearly distinguished TCs from thymomas in all 4 genes.
Furthermore, the promoter methylation of all 4 genes was higher in
TC than that in the thymus. The DNA methylation of these 4 genes
has been shown to be significantly higher in several types of
cancer than in corresponding healthy tissues. GNG4 and
SALL3 function as tumor suppressor genes (12,14,20,27-29)
and HOXD9 acts as an oncogene (24). These genes are a common epigenetic
alteration of high diagnostic value in TC. As shown in Table II, 15 (94%) out of 16 thymic
carcinomas had a high level of DNA methylation on each gene. The
rate of diagnosis of thymic carcinoma was not more sensitive by
combining the methylation of 4 genes. The characteristics and
behavior of TC, but not thymoma, are similar to those of other
types of cancer. This result indicated that the epigenetic pattern
of TC significantly differed from that of thymoma. Recent
comprehensive genetic analyses using next-generation sequencing
have also revealed that the incidence of somatic non-synonymous
mutations is significantly higher in TC than in thymomas (4-6).
Clinically, TC entirely differs from thymoma from a pathological
aspect, its malignant behavior, complications of autoimmune
diseases and prognosis (1-3). Genetic and epigenetic differences
between TC and thymoma may influence their clinical
differences.
We propose two mechanisms based on the result that
TC frequently exhibits a higher methylation of the promoter region
of cancer-related genes than thymoma. In one mechanism, we found
that SALL3 methylation was significantly higher in TC than in
thymoma and the thymus. Shikauchi et al revealed that SALL3
binds to DNMT3A by a direct interaction between the double zinc
finger motif of SALL3 and the PWWP domain of DNMT3A in
hepatocellular carcinoma, and that SALL3 has the ability to inhibit
DNMT3A-mediated DNA methylation (28). We thus hypothesized that SALL3
promoter methylation reduces SALL3 protein levels, which, in turn,
inhibits methylation promotion by DNMT3A. Reduced SALL3 protein
levels enhance DNMT3A activity and the CGI of cancer-related genes
are hypermethylated in TC. In the other mechanism, Wang et
al revealed that the incidence of somatic non-synonymous
mutations of epigenetic regulatory genes (chromatin remodeling,
histone modifications and DNA methylation) was significantly higher
in TC (38%) than in thymoma (10%) (4). Mutated epigenetic regulatory genes in
TC may induce higher levels of the promoter methylation of
cancer-related genes. A clearer understanding of the mechanisms
through which alterations in epigenetic regulation play a role in
TC will contribute to the future tailoring of drugs to tumors with
specific epigenetic alterations.
Although GHSR promoter methylation was
significantly higher in thymoma than in the thymus, no significant
differences were observed in promoter methylation for the other 3
genes. Furthermore, no significant differences were noted in the
methylation of genes among the thymoma subtypes. These results
suggest that epigenetic alterations in the 3 genes are not involved
in the tumorigenesis of thymoma. The frequency of GHSR
methylation increased in the order of the thymus, thymoma and TC.
Jandaghi et al reported that GHSR hypermethylation is a
pan-cancer marker regardless of the tissue from which the tumor
originates (18). GHSR may
be involved in TC and thymoma. The promoter methylation of the 4
genes was not significantly higher in advanced-stage tumors (III
and IV) than in early-stage tumors (I and II) in all TETs. Moskalev
et al revealed no significant differences in GHSR
hypermethylation between the early and advanced stages of lung,
breast, and pancreatic cancers (11). These findings suggest that the
hypermethylation of cancer-related genes is an early cancer
event.
Promoter methylation is related to malignant
behavior and the relapse-free survival of tumors. Since there were
a few deaths due to tumors, we used the relapse-free survival of
tumors as a prognostic factor. In all 4 genes, relapse-free
survival was significantly worse in tumors with a higher DNA
methylation than in those with a lower DNA methylation in all TETs.
Moreover, relapse-free survival was significantly worse in thymomas
with a higher DNA methylation of HOXD9 or SALL3 than
in those with a lower DNA methylation. Marzese et al
revealed that patients with HOXD9 hypermethylation in
malignant melanoma had a poorer disease-free and overall survival
(13). SALL3 methylation was
identified as an independent predictor of poor survival in head and
neck cancer (14). Relapse-free
survival was worse in tumors with more genes with higher DNA
methylation than in those with less genes with higher DNA
methylation (Fig. 5E). These
findings suggest that the relapse-free survival in TETs is related
to the combination of the methylation of 4 genes.
There were some limitations to the present study.
We examined the promoter methylation of GHSR, GNG4,
HOX9 and SALL3 in 46 TETs and 20 thymic samples using
bisulfite pyrosequencing. TC and NECT case numbers were lower (12
for TC and 4 for NECTT) as these tumors are very rare. Thymomas are
stratified into 5 entities (types A, AB, B1, B2 and B3) based on
the morphology of epithelial cells and the lymphocyte-to-epithelial
cell ratio, and the ratio of lymphocytes to tumor cells is high in
AB, B1 and B2 thymomas. Since we were unable to separate tumor
cells from lymphocytes prior to DNA extraction, the presence of
lymphocytes in resected AB, B1 and B2 thymomas may have influenced
the promoter methylation rate.
In conclusion, promoter methylation was
significantly higher in TC than in thymoma and the thymus and
exhibited high discrimination between TC and thymoma in all 4
genes. As regardsall 4 genes, relapse-free survival was
significantly worse in tumors with a higher DNA methylation than in
those with a lower DNA methylation in all TETs. The combination of
4 genes was not more sensitive than the individual genes alone for
diagnosis, but may be superior for prognosis. These genes are a
common epigenetic alterations of high diagnostic value in TC, which
may be involved in the carcinogenesis of TC. However, epigenetic
alterations in the 3 genes, apart from GHSR, are not
involved in the tumorigenesis of thymoma.
Supplementary Data
Funding
No funding was received.
Availability of data and materials
The datasets used and/or analyzed during the
present study are available from the corresponding author on
reasonable request.
Authors' contributions
RK, KKo, SS, MT and KKa analyzed and interpreted
patient data regarding DNA methylation using pyrosequencing. YK,
NK, TS, HTo and MY collected patient frozen materials for tumor and
thymic tissue and patient clinical data. KKo, HTa and AT designed
and carried out this project. KKo and HTa performed the
histological examination of thymic epithelial tumors, and RK, KKo
and AT were major contributors in the writing of the manuscript.
All authors have read and approved the final manuscript.
Ethics approval and consent to
participate
The present study was performed in accordance with
the principles outlined in the Declaration of Helsinki. Following
the approval of all aspects of this study by the local Ethics
Committee (Tokushima University Hospital, approval numbers.
2205-4), formal written consent was obtained from all patients. In
addition, formal written consent for the publication of any
associated data was obtained from all patients.
Patient consent for publication
Not applicable.
Competing interests
The authors declare that they have no competing
interests.
Acknowledgments
The authors would like to thank Dr. Yoshihiro
Okayama, Clinical Trial Center For Developmental Therapeutics,
Tokushima University Hospital for the statistical analysis.
Abbreviations:
|
TET
|
thymic epithelial tumor
|
|
TC
|
thymic carcinoma
|
|
WHO
|
World Health Organization
|
|
CGI
|
CpG island
|
|
NECTT
|
neuroendocrine tumor of the
thymus
|
|
ROC curve
|
receiver operating characteristic
curve
|
References
|
1
|
Kondo K: Therapy for thymic epithelial
tumors. Gen Thorac Cardiovasc Surg. 62:468–474. 2014. View Article : Google Scholar : PubMed/NCBI
|
|
2
|
Travis WD, Brambilla E, Burke AP, Marx A
and Nicholson AG: WHO classification of tumours of the lung,
pleura, thymus and heart. World Health Organization classification
of tumours. Bosman FT, Jaffe ES, Lakhani SR and Ohgaki H: 4th
edition. IARC Press; Lyon: pp. 183–243. 2015
|
|
3
|
Shimosato Y, Mukai K and Matsuno Y: Tumors
of the mediastinum. AFIP Atlas of tumor pathology, Series 4. Armed
Forces Institute of Pathology Washington, DC: 2010
|
|
4
|
Wang Y, Thomas A, Lau C, Rajan A, Zhu Y,
Killian JK, Petrini I, Pham T, Morrow B, Zhong X, et al: Mutations
of epigenetic regulatory genes are common in thymic carcinomas. Sci
Rep. 4:73362014. View Article : Google Scholar : PubMed/NCBI
|
|
5
|
Radovich M, Pickering CR, Felau I, Ha G,
Zhang H, Jo H, Hoadley KA, Anur P, Zhang J, McLellan M, et al: The
integrated genomic landscape of thymic epithelial tumors. Cancer
Cell. 33:244–258.e10. 2018. View Article : Google Scholar : PubMed/NCBI
|
|
6
|
Petrini I, Meltzer PS, Kim IK, Lucchi M,
Park KS, Fontanini G, Gao J, Zucali PA, Calabrese F, Favaretto A,
et al: A specific missense mutation in GTF2I occurs at high
frequency in thymic epithelial tumors. Nat Genet. 46:844–849. 2014.
View Article : Google Scholar : PubMed/NCBI
|
|
7
|
Hirose Y, Kondo K, Takizawa H, Nagao T,
Nakagawa Y, Fujino H, Taba H, Kenzaki K, Sakiyama S and Tangoku A:
Aberrant methylation of tumour-related genes in thymic epithelial
tumours. Lung Cancer. 64:155–159. 2009. View Article : Google Scholar
|
|
8
|
Mokhtar M, Kondo K, Namura T, Ali AH,
Fujita Y, Takai C, Takizawa H, Nakagawa Y, Toba H, Kajiura K, et
al: Methylation and expression profiles of MGMT gene in thymic
epithelial tumors. Lung Cancer. 83:279–287. 2014. View Article : Google Scholar : PubMed/NCBI
|
|
9
|
Detterbeck FC, Nicholson AG, Kondo K, Van
Schil P and Moran C: The Masaoka-Koga stage classification for
thymic malignancies: Clarification and definition of terms. J
Thorac Oncol. 6(7 Suppl 3): S1710–S1716. 2011. View Article : Google Scholar : PubMed/NCBI
|
|
10
|
Kajiura K, Masuda K, Naruto T, Kohmoto T,
Watanabe M, Tsuboi M, Takizawa H, Kondo K, Tangoku A and Imoto I:
Frequent silencing of the candidate tumor suppressor TRIM58 by
promoter methylation in early-stage lung adenocarcinoma.
Oncotarget. 8:2890–2905. 2017. View Article : Google Scholar :
|
|
11
|
Moskalev EA, Jandaghi P, Fallah M,
Manoochehri M, Botla SK, Kolychev OV, Nikitin EA, Bubnov VV, von
Knebel Doeberitz M, Strobel O, et al: GHSR DNA hypermethylation is
a common epigenetic alteration of high diagnostic value in a broad
spectrum of cancers. Oncotarget. 6:4418–4427. 2015. View Article : Google Scholar : PubMed/NCBI
|
|
12
|
Pal J, Patil V, Mondal B, Shukla S, Hegde
AS, Arivazhagan A, Santosh V and Somasundaram K: Epigenetically
silenced GNG4 inhibits SDF1α/CXCR4 signaling in mesenchymal
glioblastoma. Genes Cancer. 7:136–147. 2016.PubMed/NCBI
|
|
13
|
Marzese DM, Scolyer RA, Huynh JL, Huang
SK, Hirose H, Chong KK, Kiyohara E, Wang J, Kawas NP, Donovan NC,
et al: Epigenome-wide DNA methylation landscape of melanoma
progression to brain metastasis reveals aberrations on homeobox D
cluster associated with prognosis. Hum Mol Genet. 23:226–238. 2014.
View Article : Google Scholar
|
|
14
|
Misawa K, Mochizuki D, Imai A, Misawa Y,
Endo S, Mima M, Kawasaki H, Carey TE and Kanazawa T: Epigenetic
silencing of SALL3 is an independent predictor of poor survival in
head and neck cancer. Clin Epigenetics. 9:642017. View Article : Google Scholar :
|
|
15
|
Kojima M, Hosoda H, Date Y, Nakazato M,
Matsuo H and Kangawa K: Ghrelin is a growth-hormone-releasing
acylated peptide from stomach. Nature. 402:656–660. 1999.
View Article : Google Scholar : PubMed/NCBI
|
|
16
|
Howard AD, Feighner SD, Cully DF, Arena
JP, Liberator PA, Rosenblum CI, Hamelin M, Hreniuk DL, Palyha OC,
Anderson J, et al: A receptor in pituitary and hypothalamus that
functions in growth hormone release. Science. 273:974–977. 1996.
View Article : Google Scholar : PubMed/NCBI
|
|
17
|
Lin TC and Hsiao M: Ghrelin and cancer
progression. Biochim Biophys Acta Rev Cancer. 1868:51–57. 2017.
View Article : Google Scholar : PubMed/NCBI
|
|
18
|
Jandaghi P, Hoheisel JD and Riazalhosseini
Y: GHSR hyper-methylation: A promising pan-cancer marker. Cell
Cycle. 14:689–690. 2015. View Article : Google Scholar :
|
|
19
|
Clapham DE and Neer EJ: G protein beta
gamma subunits. Annu Rev Pharmacol Toxicol. 37:167–203. 1997.
View Article : Google Scholar : PubMed/NCBI
|
|
20
|
Maina EN, Morris MR, Zatyka M, Raval RR,
Banks RE, Richards FM, Johnson CM and Maher ER: Identification of
novel VHL target genes and relationship to hypoxic response
pathways. Oncogene. 24:4549–4558. 2005. View Article : Google Scholar : PubMed/NCBI
|
|
21
|
McGinnis W and Krumlauf R: Homeobox genes
and axial patterning. Cell. 68:283–302. 1992. View Article : Google Scholar : PubMed/NCBI
|
|
22
|
Shah N and Sukumar S: The Hox genes and
their roles in oncogenesis. Nat Rev Cancer. 10:361–371. 2010.
View Article : Google Scholar : PubMed/NCBI
|
|
23
|
Tabuse M, Ohta S, Ohashi Y, Fukaya R,
Misawa A, Yoshida K, Kawase T, Saya H, Thirant C, Chneiweiss H, et
al: Functional analysis of HOXD9 in human gliomas and glioma cancer
stem cells. Mol Cancer. 10:602011. View Article : Google Scholar : PubMed/NCBI
|
|
24
|
Lv X, Li L, Lv L, Qu X, Jin S, Li K, Deng
X, Cheng L, He H and Dong L: HOXD9 promotes epithelial-mesenchymal
transition and cancer metastasis by ZEB1 regulation in
hepatocellular carcinoma. J Exp Clin Cancer Res. 34:1332015.
View Article : Google Scholar : PubMed/NCBI
|
|
25
|
Kohlhase J, Hausmann S, Stojmenovic G,
Dixkens C, Bink K, Schulz-Schaeffer W, Altmann M and Engel W:
SALL3, a new member of the human spalt-like gene family, maps to
18q23. Genomics. 62:216–222. 1999. View Article : Google Scholar : PubMed/NCBI
|
|
26
|
Strathdee G, Sutherland R, Jonsson JJ,
Sataloff R, Kohonen-Corish M, Grady D and Overhauser J: Molecular
characterization of patients with 18q23 deletions. Am J Hum Genet.
60:860–868. 1997.PubMed/NCBI
|
|
27
|
Yang XX, Sun JZ, Li FX, Wu YS, Du HY, Zhu
W, Li XH and Li M: Aberrant methylation and downregulation of sall3
in human hepatocellular carcinoma. World J Gastroenterol.
18:2719–2726. 2012. View Article : Google Scholar : PubMed/NCBI
|
|
28
|
Shikauchi Y, Saiura A, Kubo T, Niwa Y,
Yamamoto J, Murase Y and Yoshikawa H: SALL3 interacts with DNMT3A
and shows the ability to inhibit CpG island methylation in
hepatocellular carcinoma. Mol Cell Biol. 29:1944–1958. 2009.
View Article : Google Scholar : PubMed/NCBI
|
|
29
|
Wei X, Zhang S, Cao D, Zhao M, Zhang Q,
Zhao J, Yang T, Pei M, Wang L, Li Y and Yang X: Aberrant
hypermethylation of SALL3 with HPV involvement contributes to the
carcinogenesis of cervical cancer. PLoS One. 10:e01457002015.
View Article : Google Scholar : PubMed/NCBI
|