Introduction
Aberrant metabolism in cancer cells, referred to as
the Warburg effect, has been demonstrated in various types of
tumor, including glioblastoma (GBM). GBM is the most common and
aggressive type of brain tumor and is associated with an extremely
poor prognosis in adults, with a median survival time of 9-12
months and a 5-year overall survival rate of <5% (1,2).
Similar to numerous other malignancies, GBM is a highly
metabolically active malignancy, where glycolysis is the major
pathway for energy metabolism (3),
although both of the two major energy metabolism pathways,
mitochondrial oxidative phosphorylation and aerobic glycolysis
exist in these cancer cells (4).
This metabolic pattern shift or energy metabolism reprogramming
towards glycolysis provides cancer cells with not only a sufficient
source of energy, but also with numerous metabolic intermediates
and products that are essential for biosynthesis and various
malignant behaviors (5). Although
the mechanism underlying metabolic reprogramming remains
incompletely understood, research has indicated the involvement of
mutational and epigenetic alterations of glucose transporters
(Gluts) (6,7) and key enzymes of glycolysis and
associated metabolic pathways in cancer cells as well as damage to
mitochondrial structure and function (8).
Metabolic pathways have received increasing
attention as promising potential targets for treatment of cancer. A
ketogenic diet (KD) consists of high-fat foods and appropriate
proteins with only minimal carbohydrate intake, leading to
physiological ketosis by lowering blood glucose levels and
increasing the levels of blood ketone bodies following
administration (5,9). Studies have shown that a KD exhibits
promising anti-tumor effects against GBM due to its induction of
physiological ketosis (10-12).
It is hypothesized that a KD targets the glycolytic phenotype of
GBM cells and modulates oxidative stress in tumors (13). However, a complete understanding of
the effects, as well as the underlying mechanisms of a KD in GBM
have not been well characterized.
GBM is comprised of heterogeneous tumor cell
subpopulations including glioma stem-like cells (GSCs), which are
tumor cells with stem cell characteristics, including upregulated
expression of stem cell markers, enhanced self-renewal and
tumorigenic ability, and multi-lineage differentiation potential
(14,15). GSCs have been shown to be
responsible for drug-resistance and tumor-recurrence in GBM
(16), and research has shown that
GSCs undergo a unique pattern of metabolic reprogramming that is
essential for maintenance of their stemness in processes including
proliferation, self-renewal, lineage specification and aging
(17). Within this unique pattern,
glycolysis is increased notably, suggesting that the Warburg effect
may be a driving force in tumor heterogeneity (18,19),
and targeting of the metabolic reprogramming of GSCs may be a
promising treatment for GBM (20-22).
In the present study, GSCs were cultured in a ketogenic environment
achieved using glucose-restricted, β-hydroxybutyrate
(BHB)-containing medium (BHB-Glow) and investigated the
effects of KD treatment on GSCs as well as the underlying
mechanisms. In the present study, it was hypothesized that a KD may
exhibit inhibitory effects on GSC proliferation and compromise GSC
stemness, possibly by disturbing metabolic balance and
mitochondrial function.
Materials and methods
Cell culture
The GSC line NCH421k was kindly provided by
Professor C. Herold-Mende (Ruprecht Karl University of Heidelberg,
Heidelberg-Baden, Germany) (23).
Normal neural stem-like cells (NSCs) were isolated from brain
cortices of mice at embryonic day 14.5 as described in our previous
study (24) and used as the
control cells.
For primary culture, tumor tissues (Supplementary
methods) were dissociated mechanically, and single-cell suspensions
were cultured in serum-free DMEM/F12 medium (Gibco; Thermo Fisher
Scientific, Inc.) supplemented with 20 ng/ml epidermal growth
factor, 20 ng/ml basic fibroblast growth factor (Pepro Tech, Inc.)
and B-27 supplements (1:100; Gibco; Thermo Fisher Scientific,
Inc.). To mimic a KD, cells were cultured in low glucose (2.5 mM)
medium (Gibco; Thermo Fisher Scientific, Inc.) supplemented with 0,
1, 5 or 10 mM BHB (Sigma-Aldrich; Merck KGaA) and termed
BHB-Glow with or without 5 mM (reactive oxygen species)
ROS scavenger N-acetylcysteine (NAC) (Sigma-Aldrich; Merck
KGaA).
Primary tumor spheres of NCH421k cells and patient
derived GSCs were counted under a microscope on day 7 following
plating. For re-plating, the primary spheres were mechanically
dissociated into single-cell suspensions and re-plated at a density
of 1×10⁵ cells/ml for culture as described above for
another 7 days until secondary tumor spheres were observed. NCH421k
cell culture, tumor spheroid formation and the re-plating assay was
performed as described previously (25).
In vivo glioma model
Athymic nude mice (nu/nu), 4-6-weeks-old, were
housed in a specific-pathogen-free facility. Nude mice were
anesthetized with 3% isoflurane and anesthesia was maintained with
3.5% chloral hydrate, 350 mg/kg. After confirming, anesthesia (lack
of pain and blink reflexes), the procedure was performed. To obtain
cells for in situ inoculation, NCH421k cells were expanded
in culture under low glucose medium with or without 10 mM BHB for 7
days, and 5×10⁵ viable cells were injected
intracranially into mice as described previously (23). The mice were observed once every 2
days and maintained until they exhibited neurological symptoms,
such as lethargy, ataxia, seizures and/or paralysis, or until their
body weight was reduced by 20% compared with the initial value. A
total of 8 weeks later, all mice were sacrificed. The mice brains
were harvested, fixed in 4% paraformaldehyde (PFA) at room
temperature (RT) overnight, and embedded in paraffin for further
analyses. All animal procedures were performed in accordance with
protocols approved by the Ethics Committee of Fourth Military
Medical University (approval no. XJ20151231).
Hematoxylin and eosin staining
The 2-3 µm slides were deparaffinized using
xylene and rehydrated with a graded ethanol series (100, 95 and
80%). Subsequently, each slide was incubated with eosin (Thermo
Fisher Scientific, Inc.) for a few seconds at RT and washed with
ddH2O. Next, the sections were counterstained with
hematoxylin (Thermo Fisher Scientific, Inc.) at RT for a few
seconds and mounted on cover slips. Brightfield microscopy was used
to image the tissues using an Olympus BX51 microscope (Olympus
Corporation) at ×4 or ×20 magnification.
Cell viability and proliferation
A Cell Counting Kit-8 (CCK8) assay kit (Dojindo
Molecular Technologies, Inc.) was used to examine cell viability.
Tumor spheres were seeded in 96-well plates (2×10⁴
cells/well) with medium containing 2.5 mM glucose and 0 or 10 mM
BHB. Cells cultured in medium containing 25 mM glucose was used as
the control. For analysis of viability at the end of the culture
experiments, cells were incubated with 10 µl CCK8 reaction
solution (per 100 µl culture medium) at 37°C for 40 min, and
the optical density at 450 nm was measured using a Bio-Rad 680
microplate reader (Bio-Rad Laboratories, Inc.).
A 5-ethynyl-2′-deoxyuridine (EdU) assay was used to
evaluate cell proliferation. Briefly, cells were incubated with 50
µM EdU (Guangzhou RiboBio Co., Ltd.) in medium for 2 h and
then fixed with 4% PFA at room temperature for 30 min, followed by
staining with Apollo® 567 (Guangzhou RiboBio Co., Ltd.)
at RT for 30 min. Positively stained cells were imaged using
fluorescence microscopy (Olympus, BX51) at ×10 or ×20
magnification.
Flow cytometry
For FACS analysis, single-cell suspensions of GSCs
were stained with specific antibodies (Table SI) according to the
manufacturer’s protocols. Flow cytometry was performed using a
FACSCalibur™ flow cytometer (BD Immunocytometry Systems). FlowJo
version X.0.6 (FlowJo LLC) was used for data analysis, and dead
cells were excluded based on their staining with propidium iodide
(PI) (BD Biosciences) at RT for 5 min.
Annexin V-FITC staining (BD Biosciences) was
performed to evaluate cell apoptosis. Briefly, single-cell
suspensions of GSCs were staining with 5 µl Annexin V-FITC
at RT for 15 min. After washing with binding buffer, samples were
analyzed using flow cytometry as described above.
For ROS and mitochondrial staining, DCFH-DA
(Beyotime Institute of Biotechnology) and MitoTacker (Invitrogen;
Thermo Fisher Scientific, Inc.) were used, respectively, according
to the manufacturer’s protocols. Samples were analyzed using flow
cytometry as described above.
Glucose transport assay
The fluorescent D-glucose analog
v2-[N-(7-nitrobenz-2-oxa-1,3-diaxol-4-yl)
amino]-2-deoxy-glucose (2-NBDG; BioVision, Inc.) was used as a
fluorescence probe for measurement of glucose transport. For
evaluation of 2-NBDG uptake, 2×10⁵ cells/well were
seeded in 6-well plates and maintained in culture for 5 days. For
fluorescence labeling, cells were first pre-incubated in
glucose-free Krebs-Ringer bicarbonate (KRB) buffer (Beijing
Solarbio Science & Technology Co., Ltd.) for 15 min, and
subsequently in fresh KRB buffer supplemented with 50 µM
2-NBDG for 30 min at 37°C in a humidified incubator with 5%
CO2/95% air. Stained cells were quantitatively analyzed
using flow cytometry.
Mitochondrial function
For mitochondrial membrane potential (ΔΨm) analysis,
cells in culture medium were stained at RT with 10 µg/ml
JC-1 (Beyotime Institute of Biotechnology) for 30 min before
washing with binding buffer, according to the manufacturer’s
protocol. Cells were visualized using laser scanning confocal
microscopy (FV-1000, Olympus Corporation) at ×10 or ×20
magnification.
The oxygen consumption rate (OCR) was assayed using
an OCR assay kit (cat. no. 600800; MitoXpress® Xtra HS;
Cayman Chemical Company) according to the manufacturer’s protocol.
Briefly, 5×10⁴ cells/well were seeded into a black,
clear bottom 96-well plate (Corning, Inc.) and maintained in cell
culture medium for 5 days. Subsequently, MitoXpress®
Xtra probe, 0.1 mg glucose oxidase and 10 µl antimycin A
were added to each well, separately, and overlaid with HS mineral
oil (MitoXpress® Xtra HS; Cayman Chemical Company), The
signal from the cells was monitored for 100 min in 10 min intervals
at 37°C, with 360 nm excitation/645 nm emission wavelengths.
Transmission electron microscopy
(TEM)
For examination by TEM, cells were harvested and
fixed in 2.5% glutaraldehyde (PBS, pH 7.4) at 4°C overnight.
Post-fixation was performed using 1% buffered osmium tetroxide at
room temperature for 2 h before dehydration through a graded series
of ethanol solutions (30, 50, 90 and 100%) and eventual embedding
in Poly/Bed (Polysciences, Inc.) for 24 h at 60°C. Ultra-thin
sections (50 nm) were cut using an ultra-microtome and mounted on
copper grids (200 meshes; Chemical Laboratory Equipment Co., Ltd.).
After double staining of samples with uranyl acetate 20 min and
lead citrate 10 min both at RT, TEM was performed using a
JEM-2000EX electron microscope (JEOL Ltd.) at ×5,000 and ×30,000
magnification. The size of the mitochondria were calculated and
analyzed using the following formula: Mitochondrial
size=4/3xπx(axb); where a is the long axis radius and b is the
short axis radius. For each sample, three randomly chosen fields of
view were used, and three independent experimental repeats were
performed.
Reverse transcription-quantitative
(RT-q)PCR
From the different groups of cultured GSCs, total
RNA was extracted using TRIzol® reagent (Invitrogen;
Thermo Fisher Scientific, Inc.). RT was performed using PrimeScript
RT Master mix (Takara Bio, Inc.), and qPCR was performed using SYBR
Select Master mix (Takara Bio, Inc.) on an ABI Prism 7500 Real-Time
PCR system (version 2.0.4; Applied Biosystems; Thermo Fisher
Scientific, Inc.), as described previously (25). GAPDH was used as the internal
control. All RT-qPCR experiments were repeated at least three
times, and the results are presented as a fold difference in the
mRNA levels. The sequences of the primers used were: Sox2 forward,
5′-ACA CCA ATC CCA TCC ACA CT-3′ and reverse, 5′-GCA AAC TTC CTG
CAA AGC TC-3′; Nanog Sox2 forward, 5′-CAG ATG CAA GAA CTC TCC A-3′
and Sox2 forward, 5′-GTA GGA AGA GTA AAG GCT G-3′; Oct4 forward,
5′-ACA CCA ATC CCA TCC ACA CT-3′ and reverse, Oct4
forward,5′-ACACCAATCCCATCCACACT-3′ and reverse,
5′-GCAAACTTCCTGCAAAGCTC-3′; and GAPDH forward, 5′-GCA CCG TCA AGG
CTG AGA AC-3′ and reverse 5′-TGG TGA AGA CGC CAG TGG A-3′.
Western blotting
Whole cell lysates were obtained from cultured GSCs
using RIPA lysis buffer (Beyotime Institute of Biotechnology)
supplemented with complete protease inhibitor cocktail (Roche
Diagnostics) at 4°C for 30 min. A bicinchoninic acid protein assay
kit (Thermo Fisher Scientific, Inc.) was used to measure total
protein concentration. Protein samples (20 µg) were loaded
on 10% SDS gels and resolved using SDS-PAGE. After resolving,
proteins were transferred to PVDF membranes and probed with the
primary at 4°C for 12 h and subsequently with secondary antibodies
at RT for 2 h (Table SI). Signals were visualized using an enhanced
chemiluminescence detection system (GE Healthcare). Protein
expression was analyzed using ImageJ version 1.45 (National
Institutes of Health) and normalized to β-actin.
Biochemical analyses
To measure ATP production, GSCs were seeded in
96-well plates at a density of 2×10⁴ cells/well for
treatment with various concentrations of BHB. After treatment, the
ATP content of the GSCs was measured using a
CellTiter-Glo® assay kit (cat. no. G7570; Promega
Corporation) according to the manufacturer’s protocol.
To evaluate metabolic enzyme activity in cultured
GSCs, cells were lysed in isolation buffers provided in the
respective assay kits for phosphofructokinase (PFK), pyruvate
kinase (PK) and lactate dehydrogenase (LDH) activity (all from
Nanjing Jiancheng Bioengineering Institute), and the kits were used
according to the manufacturer’s protocols. For each enzyme, total
enzyme activity was normalized to the concentration of the
respective protein in the cell lysate. In addition, lactate
production by GSCs was determined using a lactic acid assay kit
(Nanjing Jiancheng Bioengineering Institute).
Statistical analysis
Data are expressed as the mean ± standard deviation.
GraphPad Prism version 5.0 (GraphPad Software, Inc.) was used for
all data analysis. Statistical analysis was performed using
repeated measures ANOVA with a post hoc Tukey’s test. Data between
two groups were compared using a two-sample t-test. P<0.05 was
considered to indicate a statistically significant difference.
Results
BHB inhibits the proliferation of GSCs
but not normal NSCs in vitro
To investigate the effect of KD treatment on GSCs,
BHB-Glow culture medium which contained a low glucose
concentration (2.5 mM, in contrast to 25 mM in normal medium) as
well as different concentrations of BHB, the major component of
ketone bodies was used. As a control experiment, NSCs derived from
E14.5 mouse embryos were cultured in normal medium (Ctrl), low
glucose medium (Glow) or BHB-Glow. The number
of spheres formed were increased in NSCs grown in Glow.
In addition, as the BHB concentration was increased, the number of
NSC spheres formed were increased (Fig. 1A). These results suggest that
BHB-Glow could support the growth of normal NSCs.
NCH421k cells and patient-derived GSCs, both of which expressed the
stemness markers CD133 and Nestin (Fig. S1) were cultured in Ctrl,
Glow, or BHB-Glow medium with different
concentrations of BHB for 7 days. In contrast to the NSCs, the
number and size of NCH421k GSC spheres were inversely associated
with BHB concentration, decreasing significantly as the BHB
concentration was increased (Fig.
1B-D). Furthermore, primary GSCs from glioma biopsies
(Supplementary file; Table SII), which stained positively for
Nestin and CD133 (Fig. S1B and
D), were cultured in the three different mediums. Consistent
with the results obtained for the NCH421k cells, the primary GSCs
formed significantly fewer and smaller tumor spheres in
BHB-Glow medium containing 10 mM BHB compared with
Glow medium (Fig.
S2A-C). These results suggest that BHB significantly inhibited
the growth of GSCs under low glucose conditions.
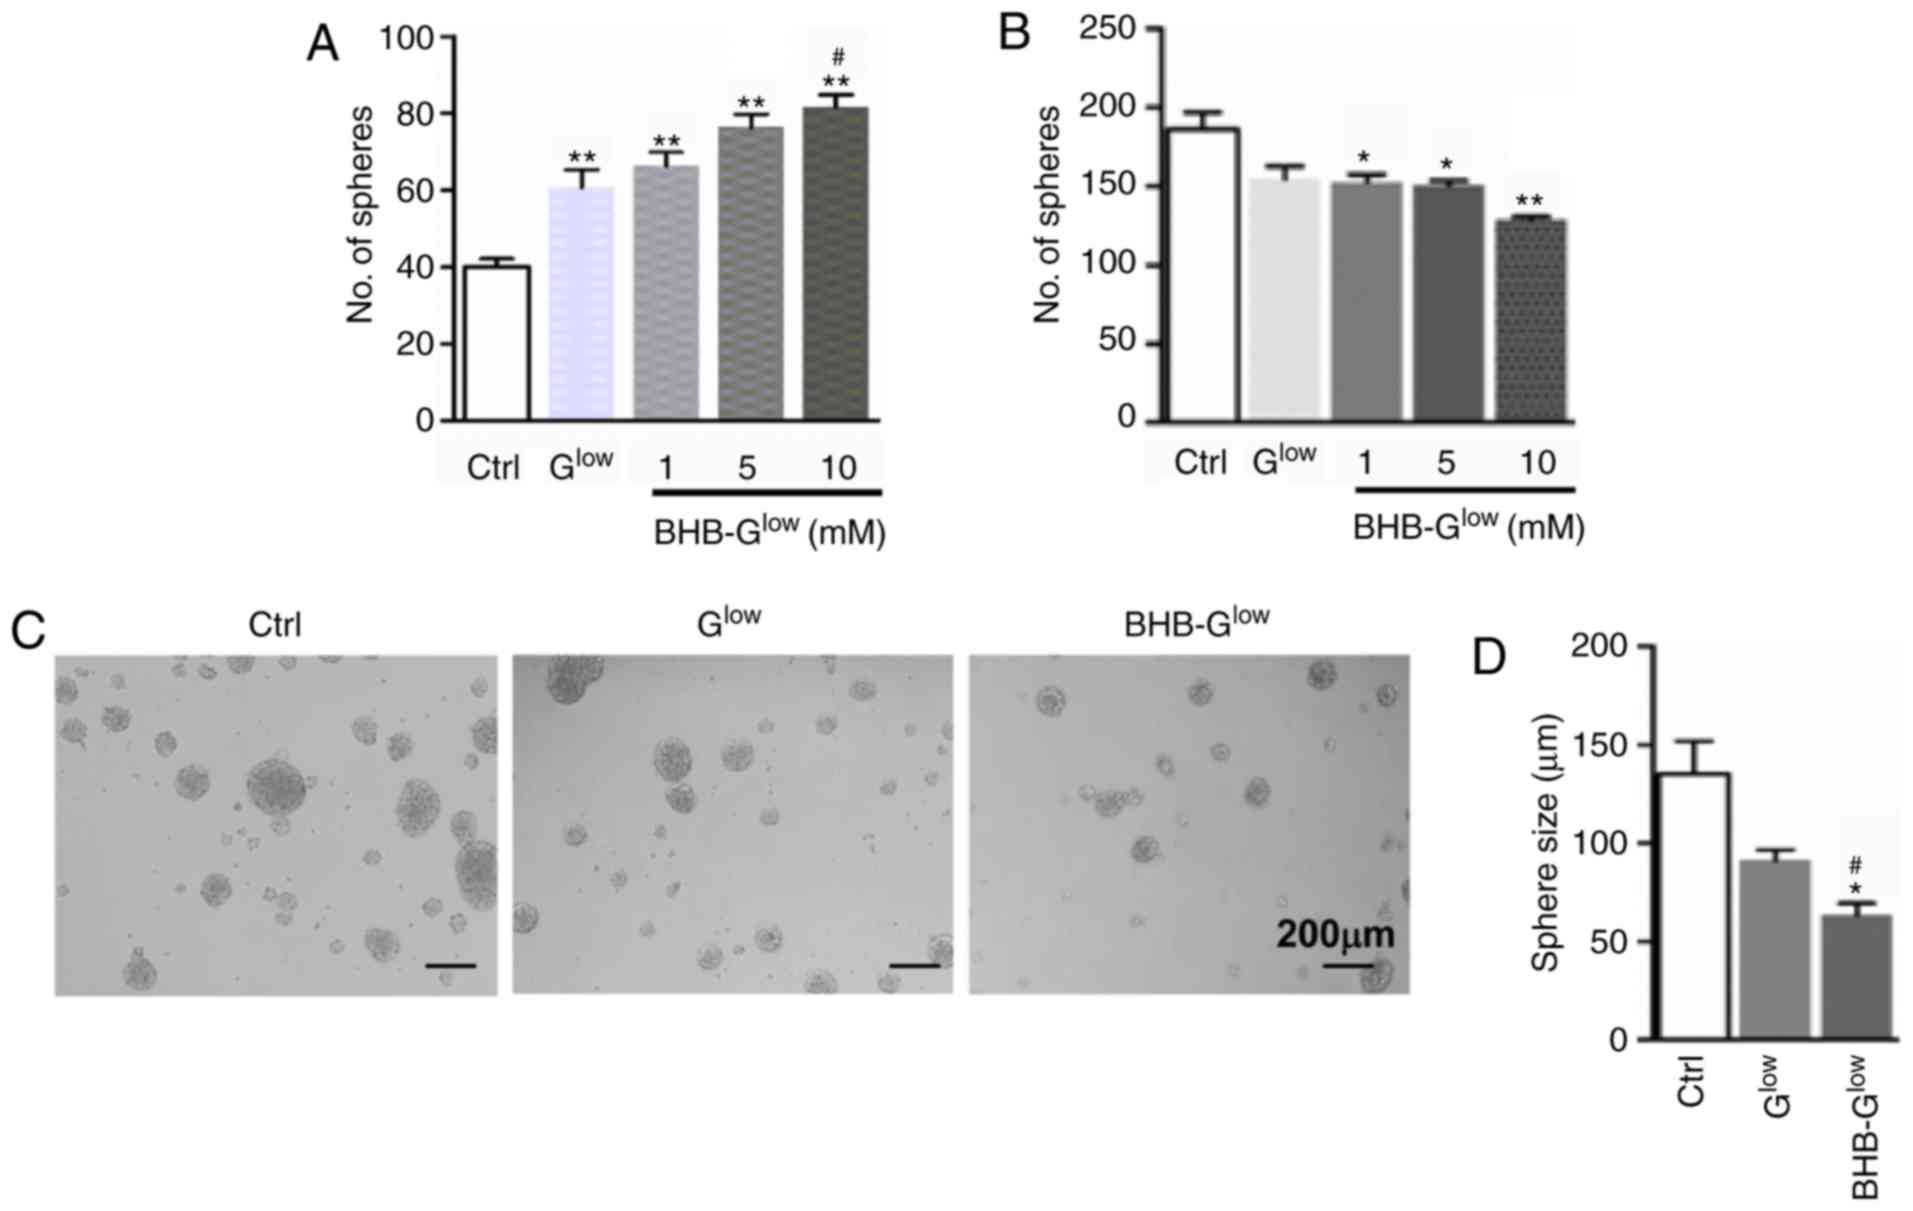 | Figure 1Effect of BHB on normal NSCs and
GSCs. (A) NSCs derived from embryonic day 14.5 mouse embryos were
cultured in Ctrl, Glow, or BHB-Glow
containing either 1, 5 or 10 mM of BHB for 7 days. Neurospheres
were counted under a microscope. (B) A patient-derived GSC line
NCH421k was cultured in Ctrl, Glow, or
BHB-Glow containing either 1, 5 or 10 mM of BHB for 7
days. Tumor spheres were counted and compared. (C and D) NCH421k
cells were cultured as in (B) with 10 mM BHB for 7 days. (C) Tumor
spheres were imaged using a microscope. Magnification, ×10. Scale
bar, 200 µm. Diameters of tumor spheres formed in the
different growth media (D). Data are presented as the mean ±
standard deviation of three repeats. *P<0.05,
**P<0.01 vs. Ctrl; #P<0.05 vs.
Glow. BHB, β-hydroxybutyrate; NSC, neural stem-like
cell; GSC, glioma stem-like cell; Ctrl, control medium with 25 mM
glucose; Glow, medium with 2.5 mM glucose;
BHB-Glow, Glow + BHB. |
BHB inhibits GSC proliferation and
promotes GSC apoptosis
The effects of KD treatment on the proliferation and
apoptosis of GSCs was next assessed. Consistent with the reduction
in GSC sphere growth, culture medium containing 10 mM BHB resulted
in significantly reduced viability of NCH421k cells compared with
the control (Fig. 2A).
Furthermore, the results of the EdU incorporation assay indicated
that BHB inhibited the proliferation of primary GSCs compared with
cells grown in the control medium (Fig. S2D-E). In addition, there was a
significant time-dependent decrease in the percentage of
EdU+ GSCs in the NCH421k cells (Fig. 2B). Annexin V staining of GSCs
cultured in BHB-Glow revealed that BHB treatment
significantly induced apoptosis in NCH421k cells compared with
cells grown in the control medium (Fig. 2C and D). Furthermore,
cleaved-caspase 3 expression was significantly increased in the
GSCs cultured in BHB-Glow compared with the control
group (Fig. 2E). Together, these
data suggest that BHB inhibited GSC proliferation whilst increasing
GSC apoptosis under glucose deprivation.
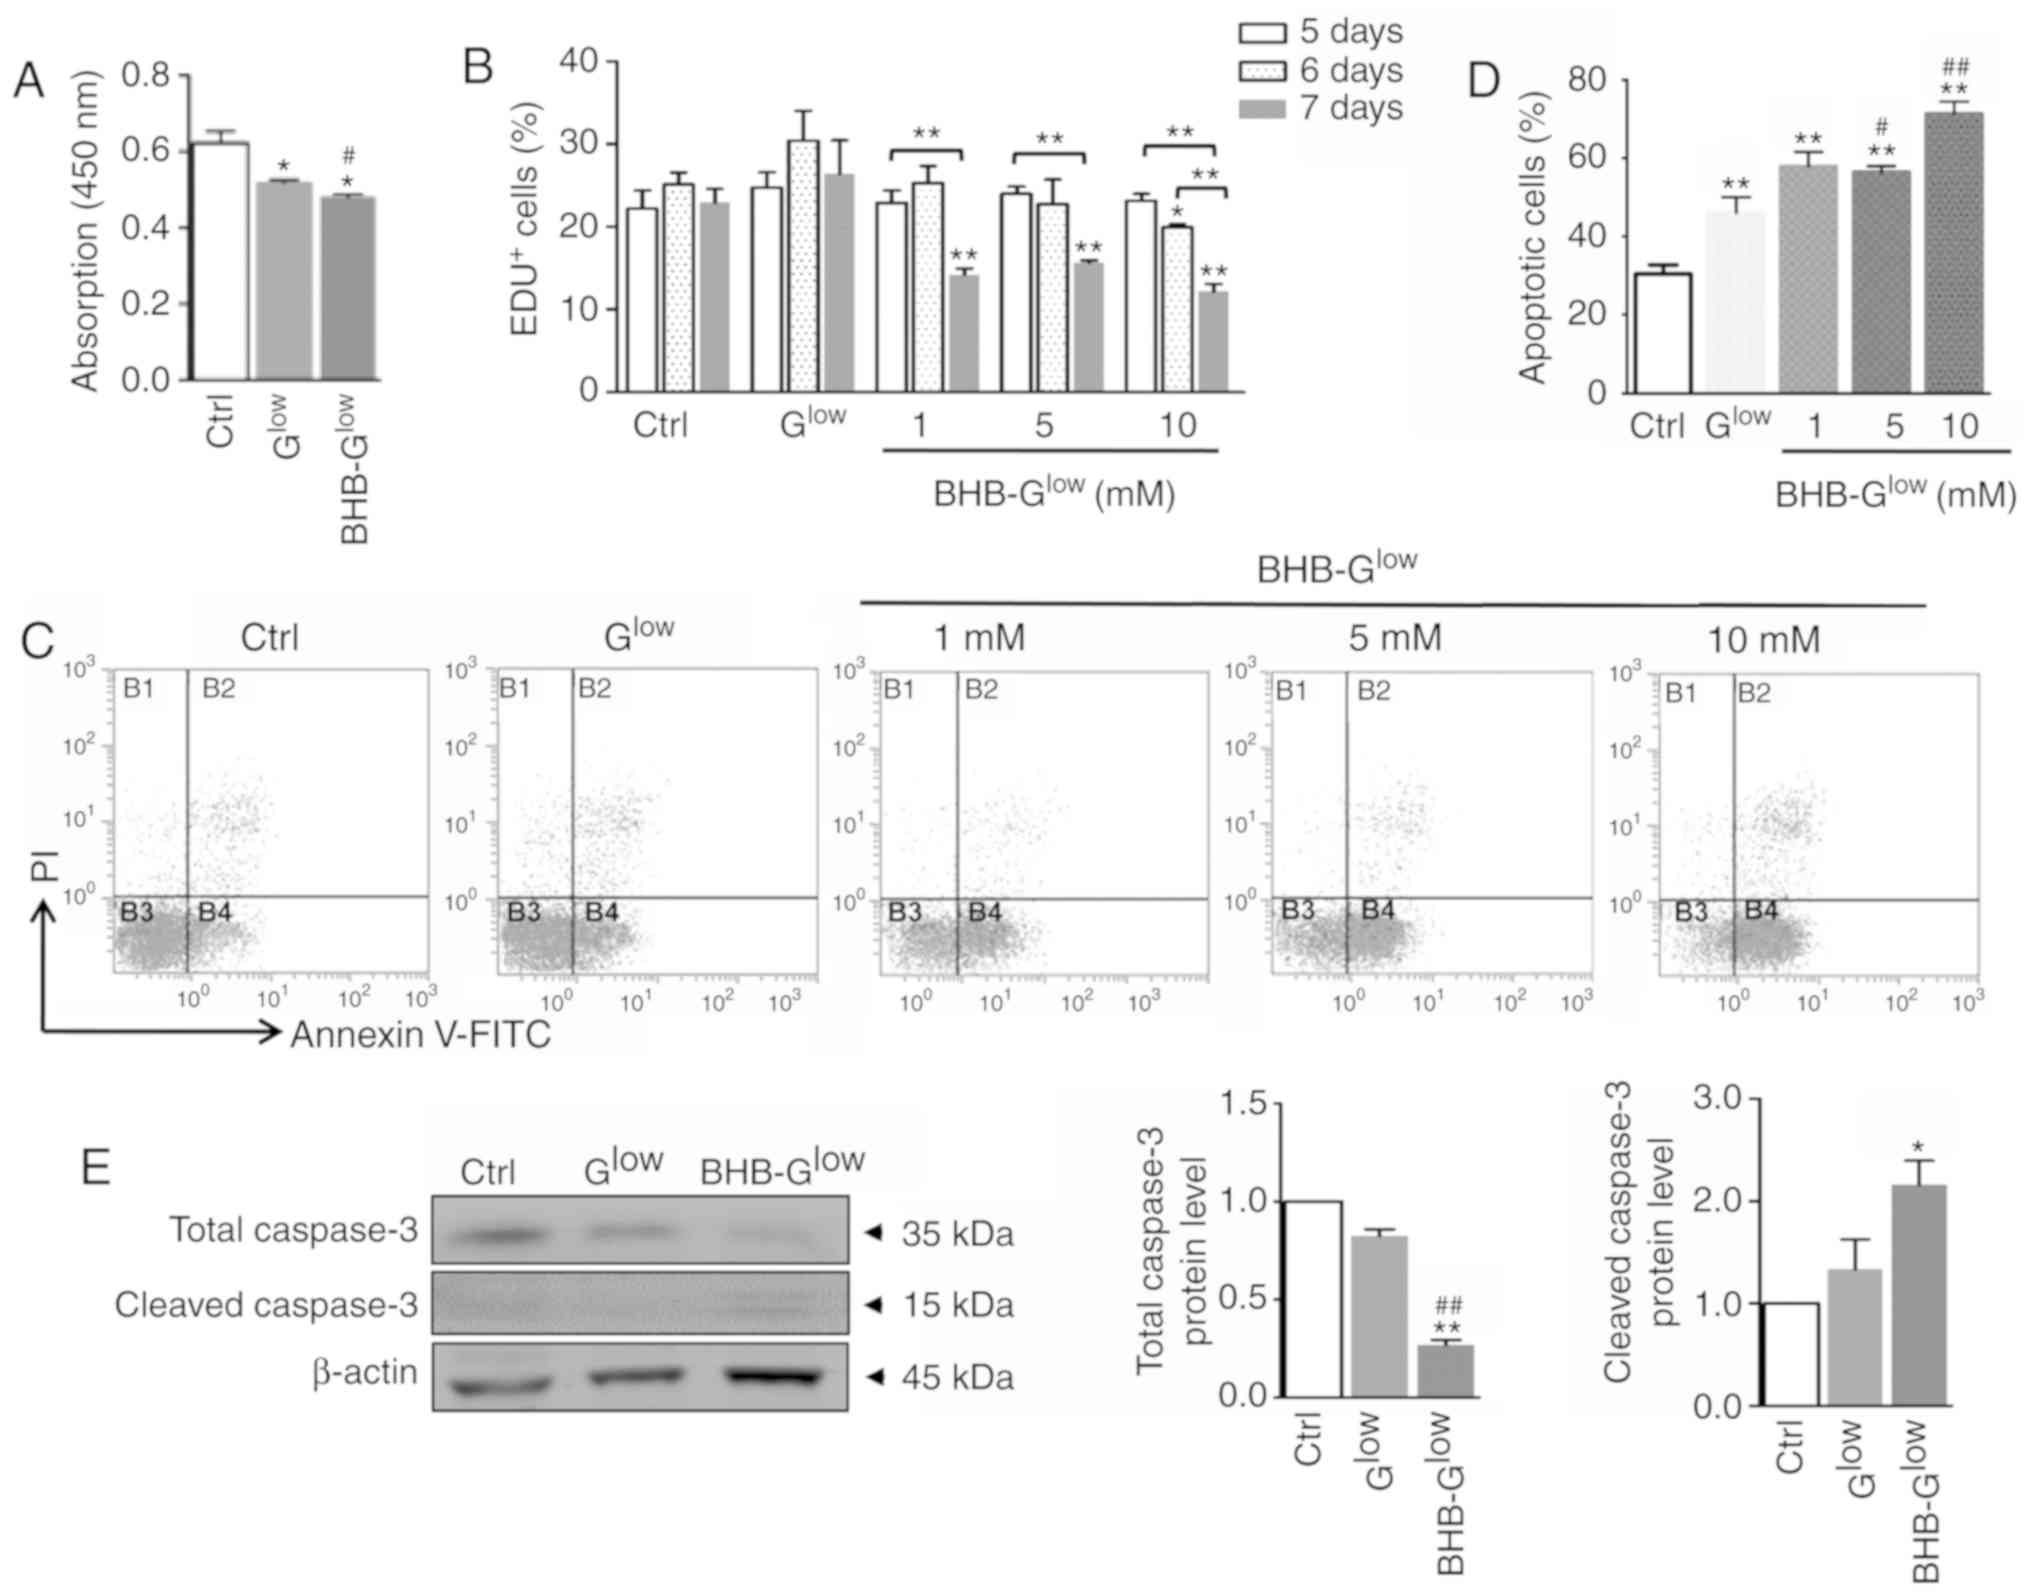 | Figure 2BHB inhibits proliferation of GSCs
and promotes GSC apoptosis. (A) Cell viability was determined using
Cell Counting Kit-8 analysis. (B) NCH421k cells were cultured in
Ctrl, Glow, or BHB-Glow medium with 1, 5 or
10 mM, for either 5, 6 or 7 days. Cell proliferation was determined
using an EdU assay. (C) Apoptosis was determined using Annexin V
staining followed by FACS analysis and (D) the results were
quantitatively compared. (E) Expression levels of total-caspase 3
and cleaved-caspase 3 were determined by western blot analysis (E).
Data are presented as the mean ± standard deviation of three
repeats. *P<0.05, **P<0.01 vs. Ctrl;
#P<0.05, ##P<0.01 vs. Glow.
GSC, glioma stem-like cell; EdU, 5-ethynyl-2′-deoxyuridine; BHB,
β-hydroxybutyrate; Ctrl, control medium with 25 mM glucose;
Glow, medium with 2.5 mM glucose; BHB-Glow,
Glow + BHB. |
BHB attenuates the stemness of GSCs
The effect of BHB on the stemness of GSCs was
assessed. As shown in Fig. 3A-C,
BHB treatment reduced the number and size of secondary tumor
spheres. The expression of the stemness marker, CD133 was
determined following BHB treatment using FACS. The results showed
that BHB-Glow significantly decreased CD133 expression
compared with the cells grown in the control medium (Fig. 3D). In addition, the expression of
stemness regulators, Nanog, Oct4 and Sox2, were assessed following
BHB treatment using RT-qPCR and western blotting. The results
showed that BHB significantly decreased Nanog, Oct4 and Sox2
expression at the mRNA level, and reduced Sox2 protein expression
in NCH421k cells under glucose deprivation (Fig. 3E and F).
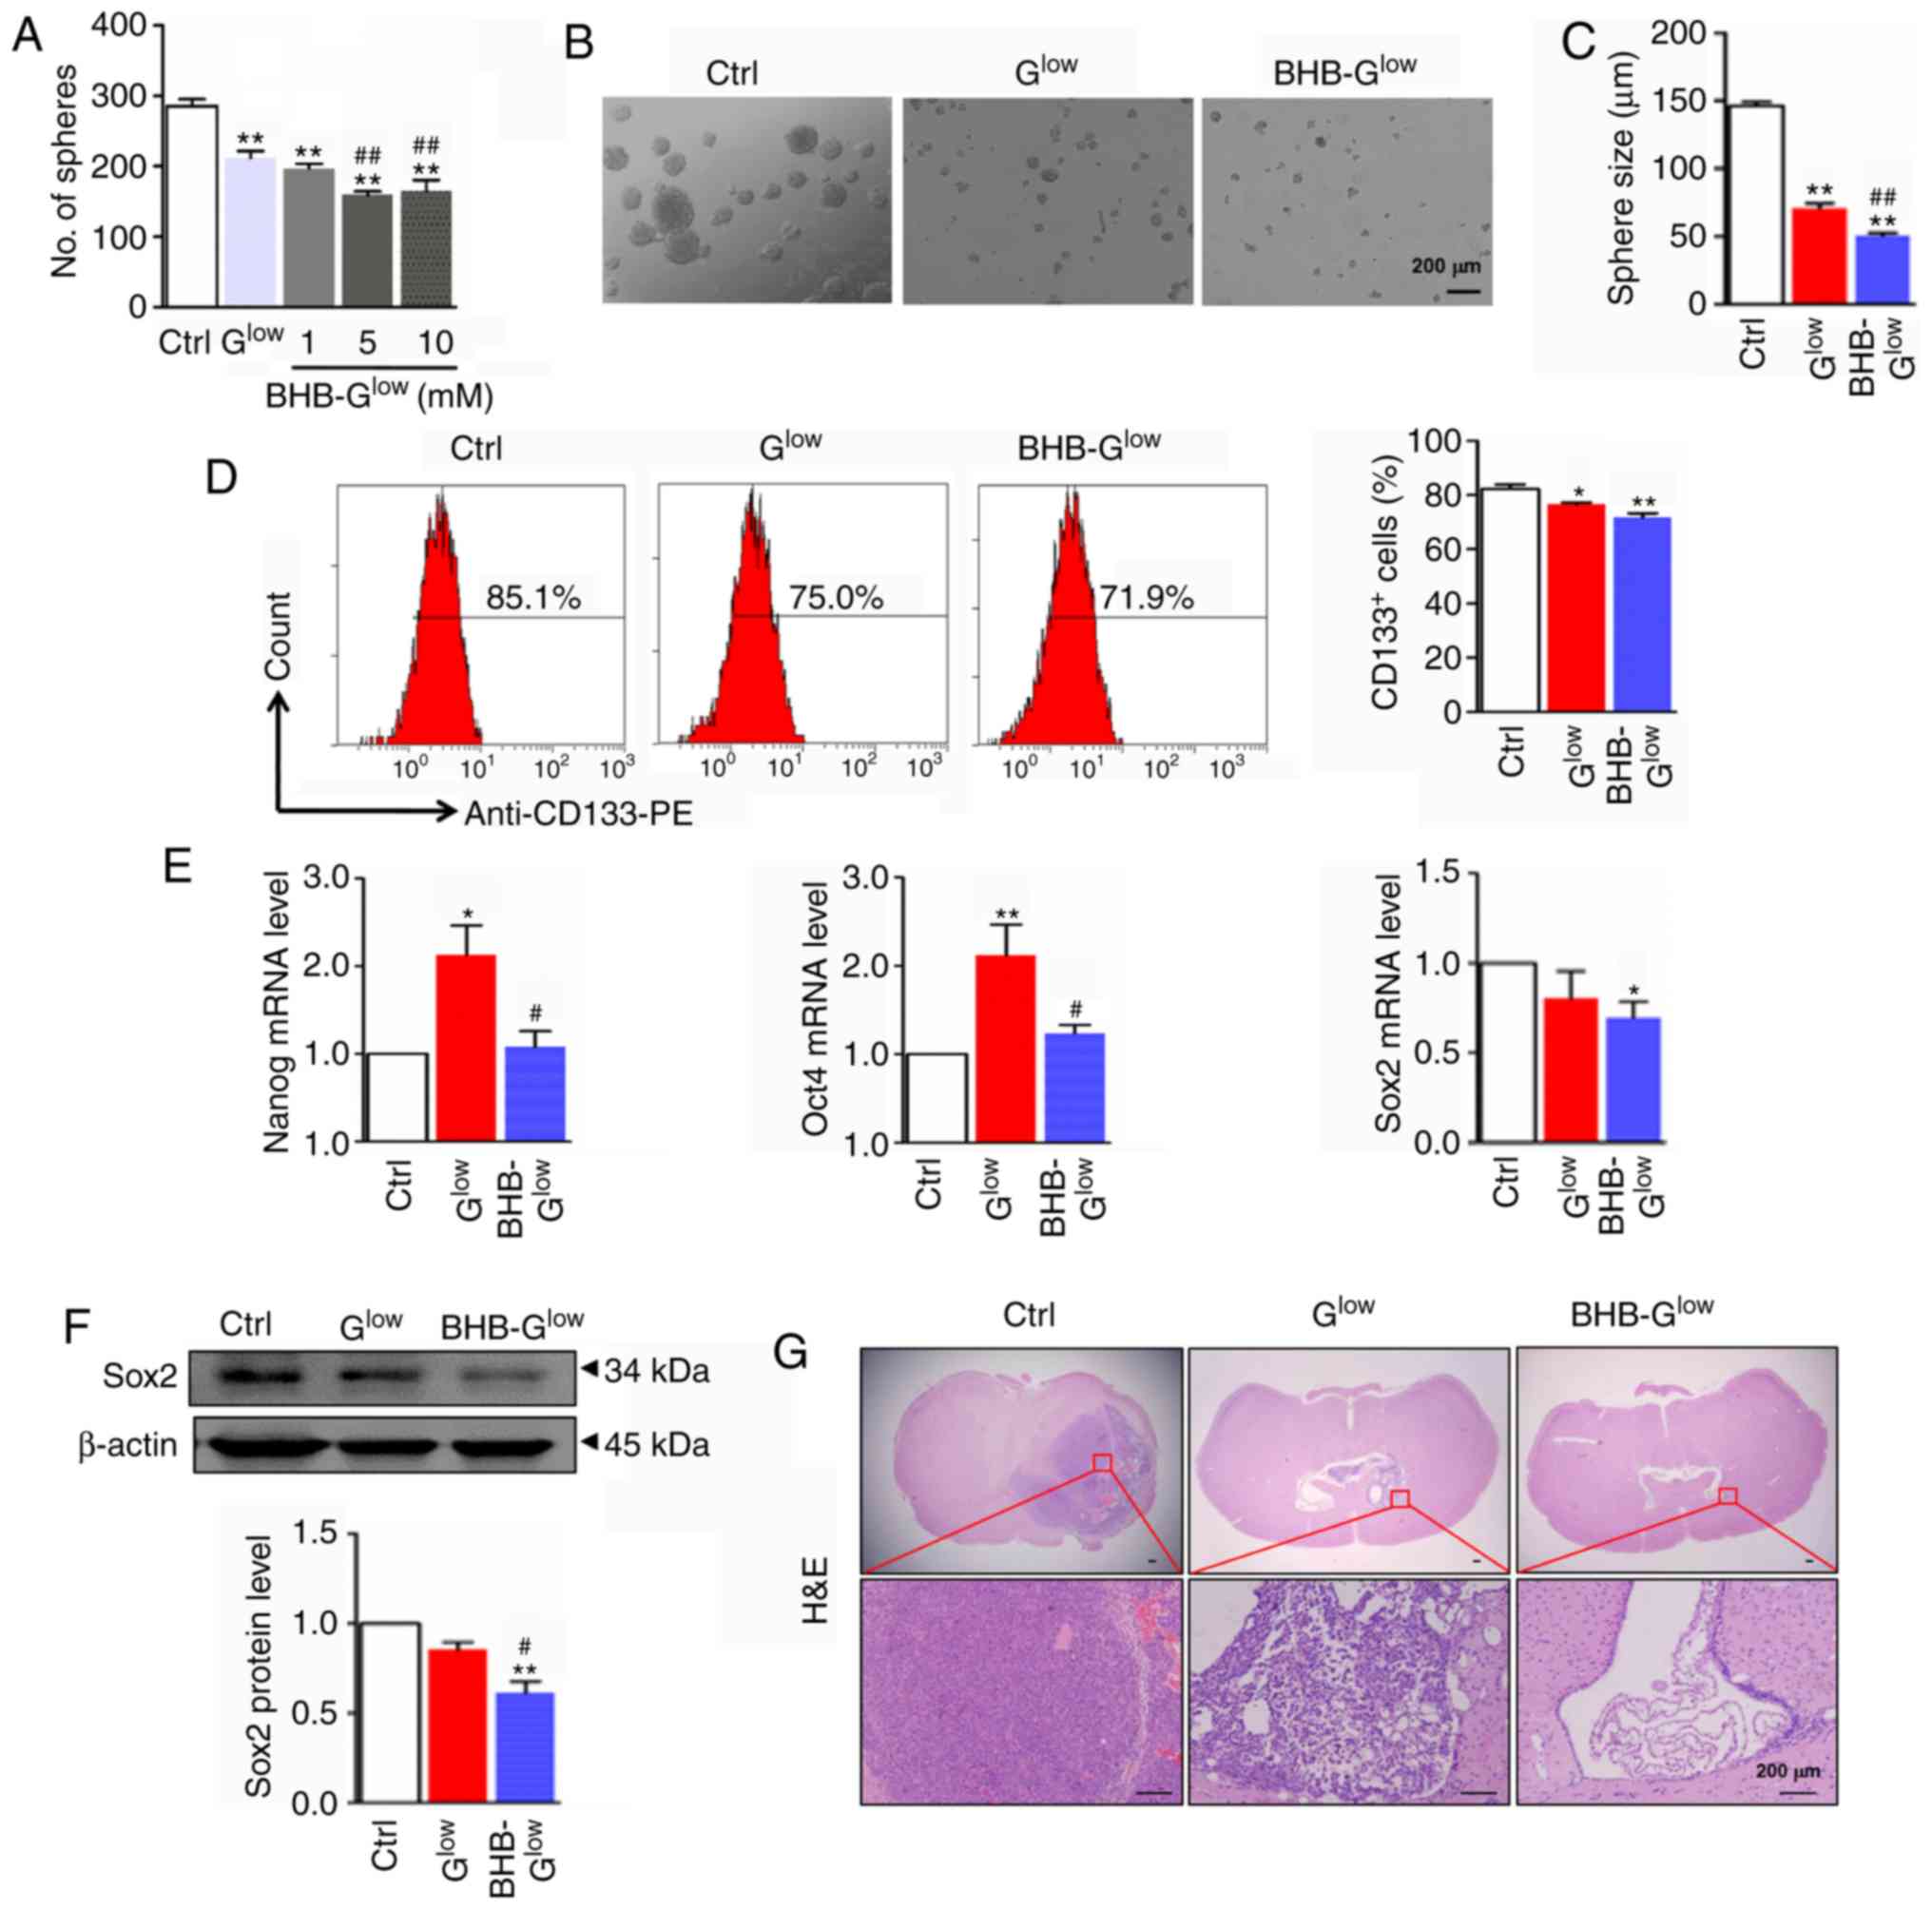 | Figure 3BHB attenuates stemness of GSCs.
Secondary tumor spheres formed by NCH421k cells were (A) counted,
(B) imaged and (C) the diameter of tumor spheres were compared.
Scale bar, 200 µm. (D) Secondary tumor spheres formed in
Ctrl, Glow and 10 mM BHB-Glow culture medium
were dispersed and analyzed by flow cytometry for CD133 and
CD133+ cells were quantitatively compared. (E) mRNA
expression levels of stemness regulators Nanog, Oct4 and Sox2. (F)
Western blot and densitometry analysis of Sox2 expression in the
secondary tumor spheres grown in Ctrl, Glow and 10 mM
BHB-Glow medium (n=3). (G) Secondary tumor spheres grown
in Ctrl, Glow and 10 mM BHB-Glow culture
medium were dispersed and orthotopically implanted into the right
side of the brain of nude mice (n=4). Tumor tissues were examined
by hematoxylin and eosin staining. Scale bar, 200 µm. Data
are presented as the mean ± standard deviation.
*P<0.05, **P<0.01 vs. Ctrl;
#P<0.05, ##P<0.01 vs. Glow.
GSC, glioma stem-like cell; BHB, β-hydroxybutyrate; Ctrl, control
medium with 25 mM glucose; Glow, medium with 2.5 mM
glucose; BHB-Glow, Glow + BHB. |
To investigate the effects of BHB on GSC behavior
in vivo, NCH421k-derived secondary spheres were cultured in
Ctrl, Glow or 10 mM BHB-Glow medium and
transplanted into nude mice using an orthotopic xenograft model
(Fig. S2F). The tumorigenic
capacity of NCH421k cells cultured in BHB-Glow medium
was reduced in vivo (4, 2 and 1 total tumors formed in the
Ctrl, Glow and 10 mM BHB-Glow groups,
respectively; n=4 per group, data not shown). In addition,
hematoxylin and eosin staining revealed that the volume of the
tumor formed by the BHB-treated GSCs was smaller compared with the
tumors formed from cells grown in the Ctrl and Glow
media (Fig. 3G). These data
suggest that BHB attenuated the stemness of GSCs under glucose
deprivation.
BHB treatment inhibits glycolysis
Tumor cells undergo metabolic reprogramming to adopt
a metabolic pattern of aerobic glycolysis, a process known as the
Warburg effect (5). BHB is
oxidized in the mitochondria, and therefore, to investigate the
mechanisms of its effects on GSCs, energy metabolism within NCH421k
cells treated with BHB was assessed. An upregulation of Glut1 and
several glycolysis-associated enzymes including HK2, PKM2 and LDHA
in tumor tissues was observed compared with the paratumoral
'normal’ brain tissues (Fig.
S3A-B). Expression of pyruvate dehydrogenase (PDH), which is
associated with the tricarboxylic acid cycle flux, was decreased
significantly. The expression of glycolysis-associated enzymes in
GSCs cultured in normal, Glow or BHB-Glow
medium was assessed by western blotting. The results showed that
BHB significantly reduced the expression of Glut1, HK1/2, PKM2,
LDHA and PDH, but the protein levels of PFKP were not altered
(Fig. 4A and B). The activity of
PFK, PK and LDH were assessed, and it was demonstrated that BHB
treatment suppressed the activity of these glycolysis enzymes under
glucose deprivation (Fig. 4C).
Furthermore, transmembrane glucose transport was assessed using a
fluorescent derivative of glucose 2-NBDG (26). Cells cultured in
BHB-Glow medium reduced glucose uptake in NCH421k cells
as evidenced by the decreased percentage of these cells that
exhibited 2-NBDG fluorescence (Fig.
4D). Consistently, BHB treatment significantly reduced ATP
production in NCH421k cells under glucose deprivation (Fig. 4E). Taken together, these results
suggest that BHB attenuated glycolysis, which likely resulted in an
energy crisis in the GSCs.
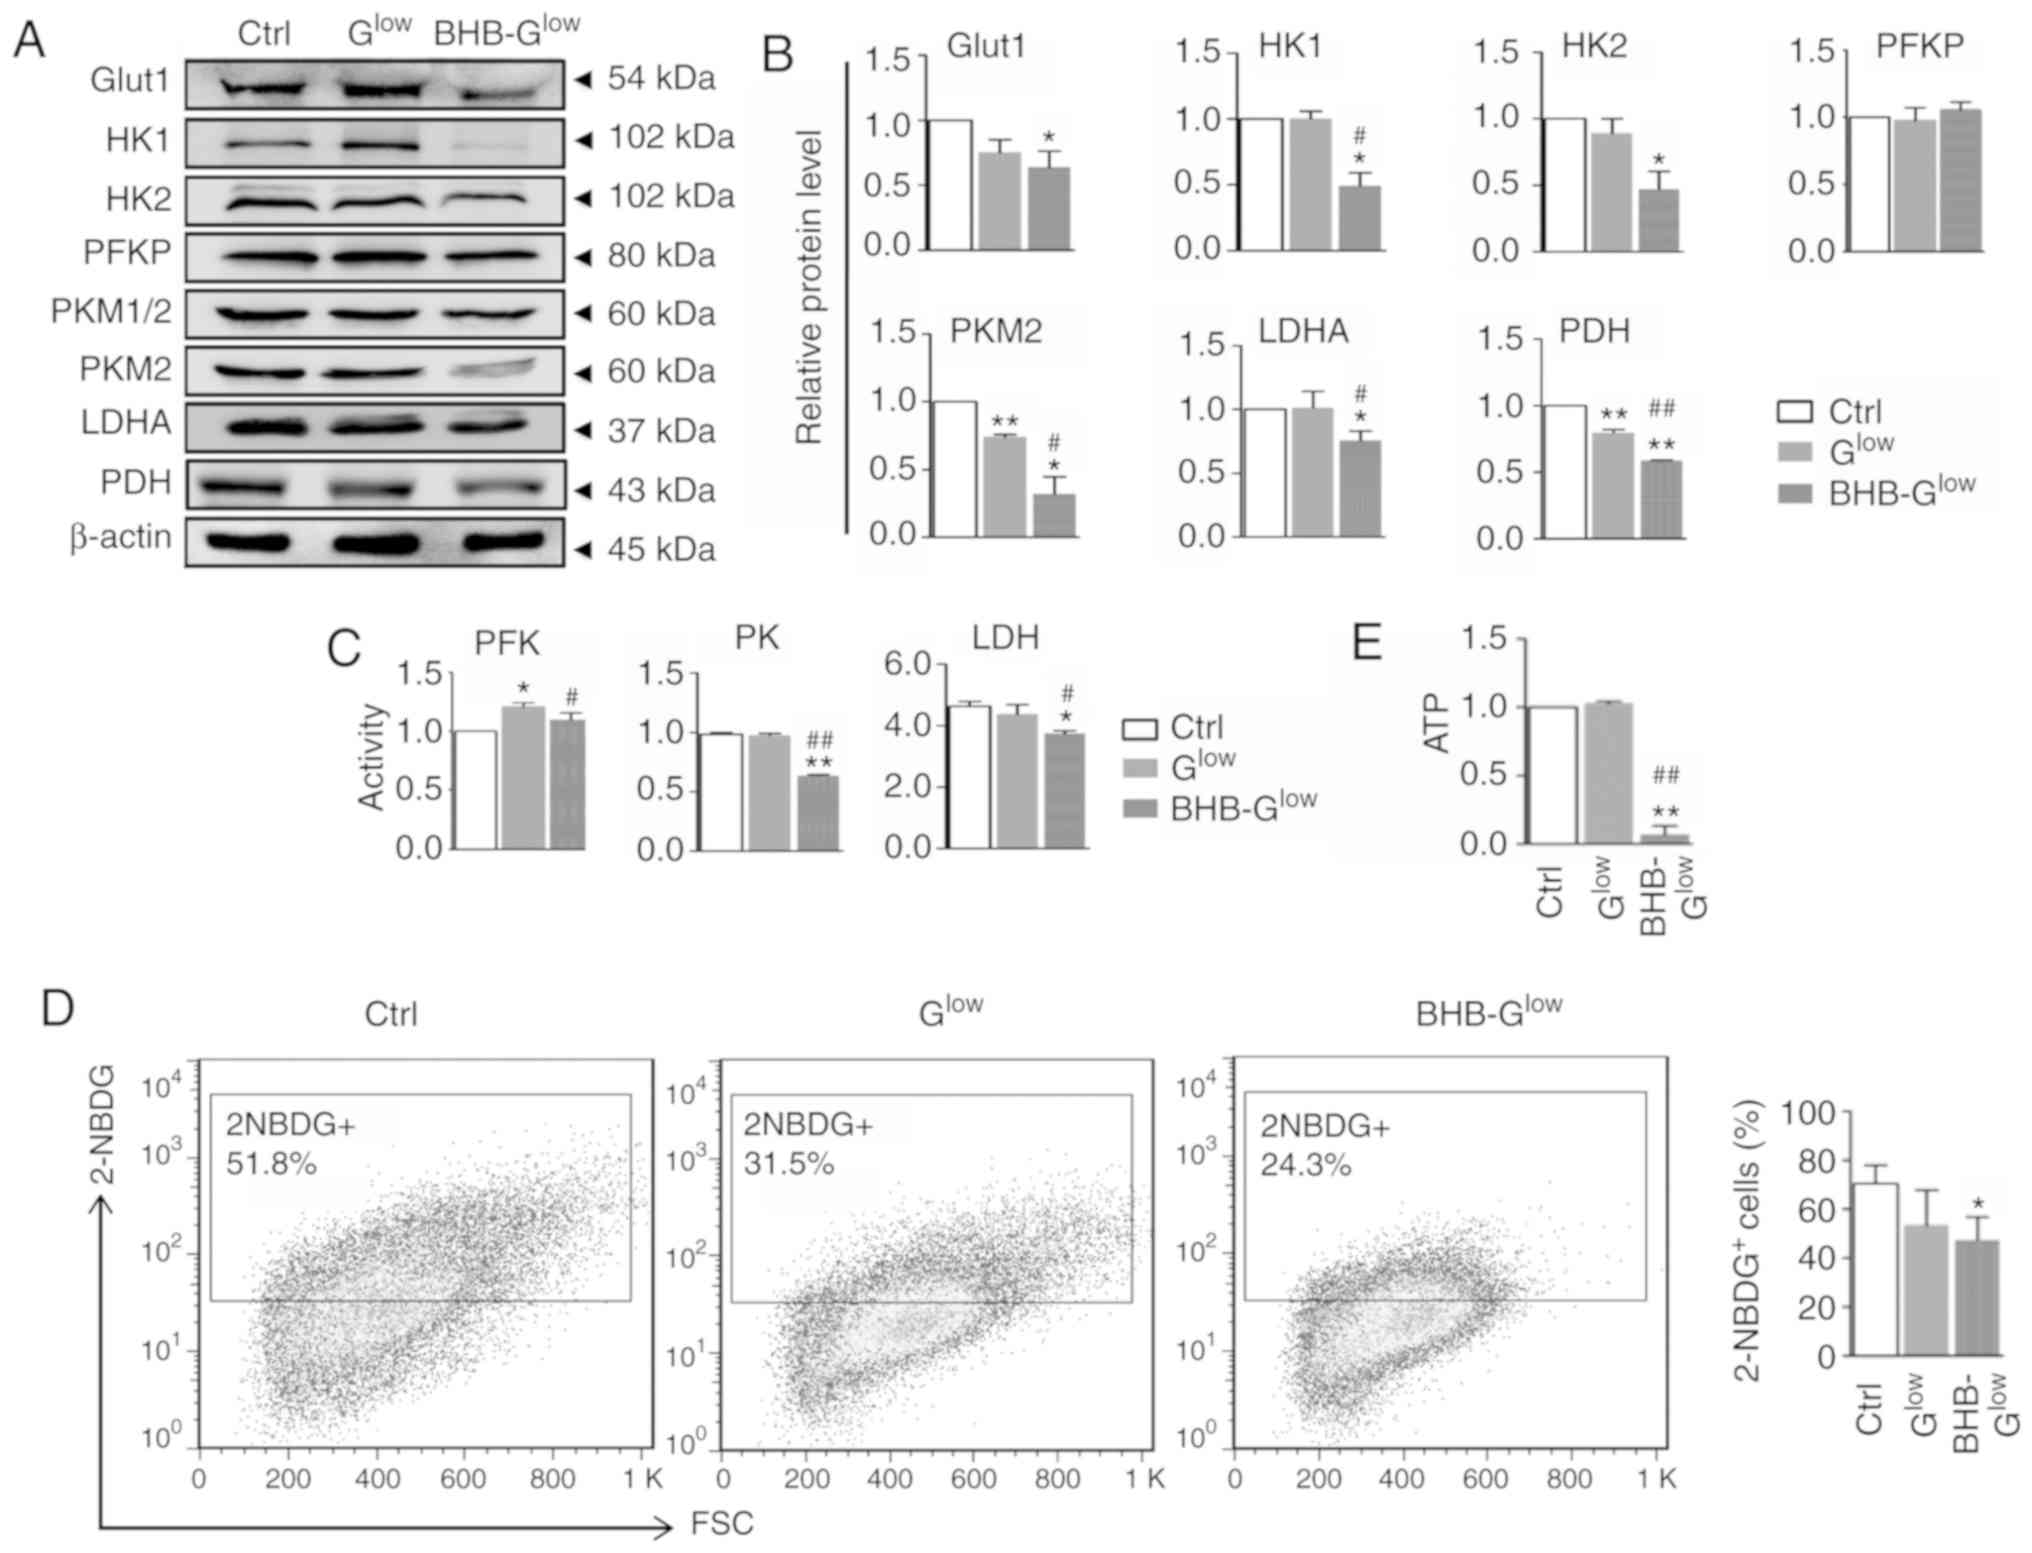 | Figure 4BHB inhibits glycolysis in GSCs.
Protein expression levels of Glut1 and glycolysis-related enzymes,
HK1 and 2, PFKP, PKM1/2, PKM2, LDHA and PDH, were determined by (A)
western blotting and (B) quantitatively compared using β-actin
expression for normalization. (C) Activity of PFK, PK and LDH were
determined. (D) Glucose transport was determined by 2-NBDG staining
followed by FACS and quantitatively compared. (E) ATP production of
cells grown in the different culture mediums were compared. Data
are presented as the mean ± standard deviation of three repeats.
*P<0.05, **P<0.01 vs. Ctrl;
#P<0.05, ##P<0.01 vs. Glow;
Ctrl, control medium with 25 mM glucose; Glow, medium
with 2.5 mM glucose; BHB-Glow, Glow + BHB.
GSC, glioma stem-like cell; BHB, β-hydroxybutyrate; Ctrl, control
medium with 25 mM glucose; Glow, medium with 2.5 mM
glucose; BHB-Glow, Glow + BHB; Glut1, glucose
transport 1; HK1/2, hexokinase1/2; PK, pyruvate kinase; PKM1/2,
M1/2 isoform of pyruvate kinase; PFKP, phosphofructokinase
platelet-type; LDHA, lactate dehydrogenase A; 2-NBDG,
v2-[N-(7-nitrobenz-2-oxa-1,3-diaxol-4-yl)
amino]-2-deoxyglucose; FSC, forward scatter. |
BHB causes mitochondrial damage in
GSCs
The Warburg effect is often associated with
mitochondrial damage (27,28). Therefore, mitochondrial function
and morphology was assessed in NCH421k cells cultured in
BHB-Glow medium. BHB treatment increased the OCR and
lactate production in GSCs, suggesting impaired oxidative
phosphorylation (Fig. 5A and B).
TEM revealed decreased mitochondrial size in NCH421k cells treated
with BHB under glucose deprivation (Fig. 5C). Furthermore, the alterations in
the mitochondrial transmembrane potential was determined using JC-1
staining. The results showed that BHB treatment induced
depolarization of the mitochondrial membrane potential in GSCs
under glucose deprivation (Fig.
5D). These results suggested that BHB impaired mitochondrial
structure and function in glucose deprived GSCs.
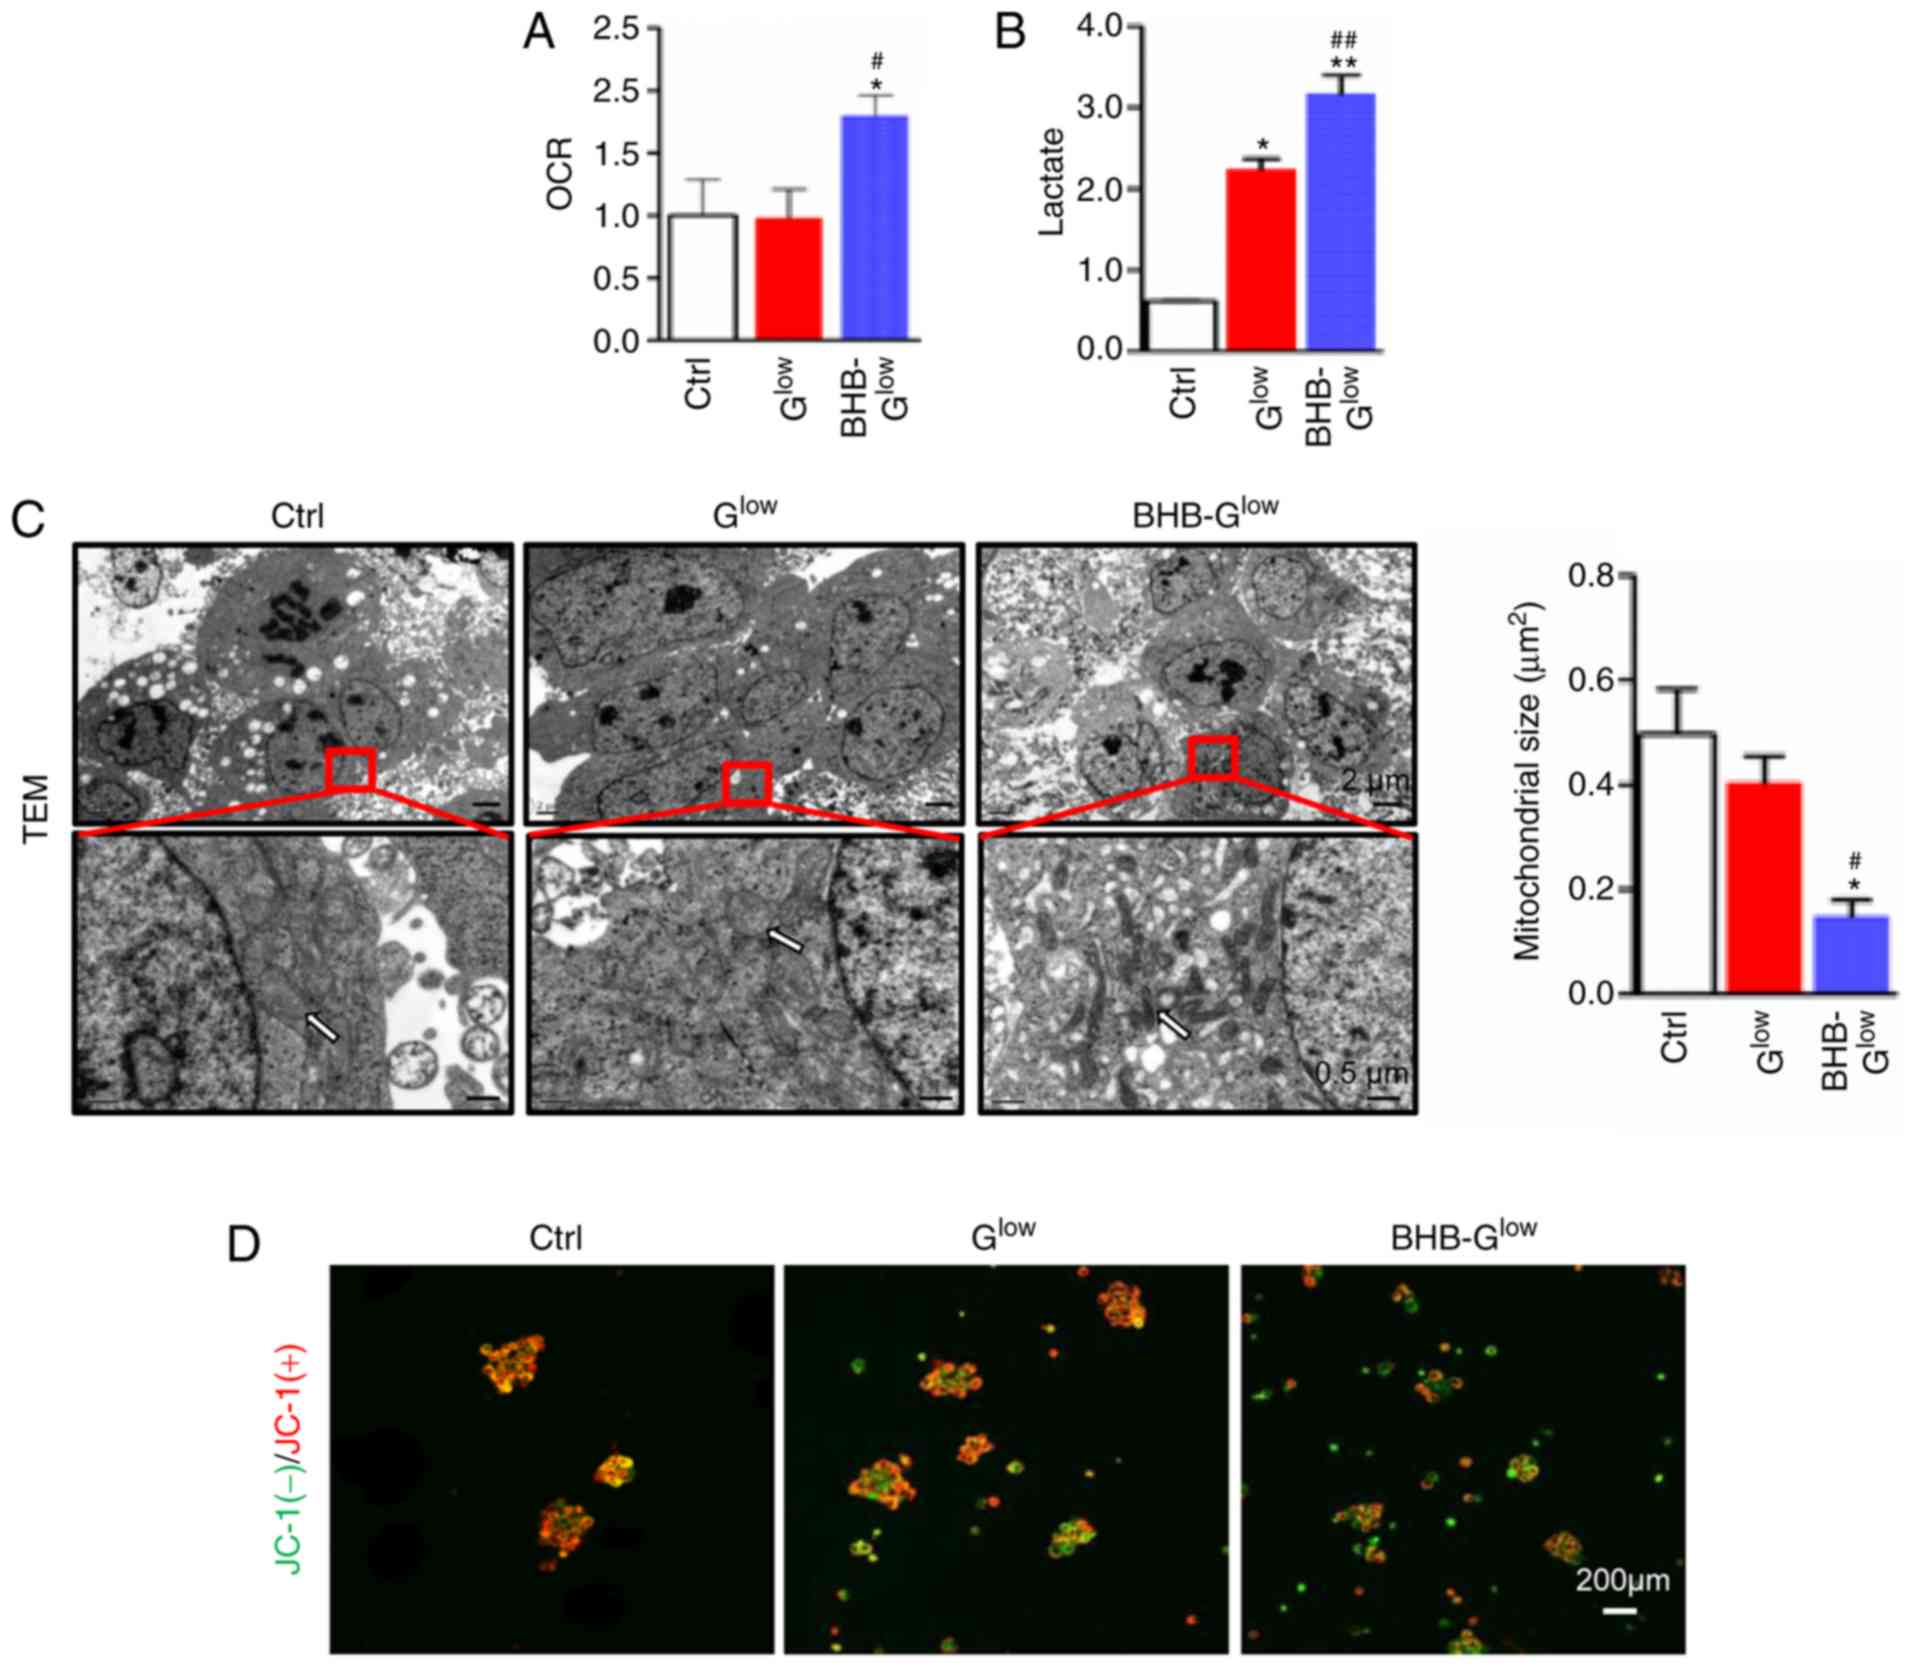 | Figure 5BHB induces mitochondrial damage in
GSCs. (A) OCR (fold change relative to the control) and (B) lactate
production of NCH421k cells cultured in Ctrl, Glow or 10
mM BHB-Glow medium for 5 days (n=3). (C) Morphology of
mitochondria (white arrows) was observed by TEM and (B)
mitochondrial size was quantified. Scale bar, 2 µm (top) or
0.5 µm (bottom). (D) Mitochondrial membrane potential was
analyzed using JC-1 staining and fluorescence microscopy. Red,
JC-1(+); green, JC-1(-). Scale bar, 200 µm. Data are
presented as the mean ± standard deviation. *P<0.05,
**P<0.01 vs. Ctrl; #P<0.05,
##P<0.01 vs. Glow. GSC, glioma stem-like
cell; BHB, β-hydroxybutyrate; Ctrl, control medium with 25 mM
glucose; Glow, medium with 2.5 mM glucose;
BHB-Glow, Glow + BHB; TEM, transmission
electron microscopy. |
BHB treatment increases ROS production in
GSCs
Mitochondrial dysfunction is often associated with
increased ROS production. ROS production was assessed in NCH421k
cells cultured in the different media conditions. Culturing cells
in Glow and BHB-Glow medium resulted in
significantly increased ROS production in GSCs (Fig. 6A). Activity of the anti-oxidative
enzymes catalase (CAT) and superoxide dismutase (SOD), as well as
the concentration of reduced-glutathione (GSH) and oxidized
glutathione (GSSG) were measured. The results showed that BHB
significantly decreased the activity of CAT and SOD and the
concentration of GSH, in addition to increasing the concentration
of GSSG (Fig. S4A). Furthermore,
staining with an ROS probe, DCFH-DA, and labeling mitochondria with
MitoTracker followed by FACS analysis indicated that the increased
ROS levels originated from the mitochondria. In addition, BHB
increased mitochondrial-generated ROS levels, compared with
Glow (Fig. 6B). NCH421k
cells could be separated into two subpopulations using MitoTracker
with respect to mitochondrial mass. The number of cells with a
larger mitochondrial mass, which were recognized as GSCs (29) and appeared to be major contributors
of ROS, were increased in the Glow and
BHB-Glow groups (Fig.
6B). Double staining with the ROS probe and CD133 antibody
indicated that although the low glucose conditions increased ROS
production in CD133+ GSCs, BHB treatment further
increased ROS production in CD133+ GSCs compared with
Glow (Fig. 6C). The
expression levels of mTOR, hypoxia-inducible factor 1α (HIF-1α) and
B-cell lymphoma 2 (Bcl2), which are all associated with cell
metabolism and survival, were reduced significantly in NCH421k
cells following treatment with BHB-Glow (Fig. 6D). Together, these results
suggested that BHB promoted ROS production in GSCs, which may serve
a critical role in the BHB-induced attenuation of GSC stemness and
proliferation as well as in the increase in GSC apoptosis.
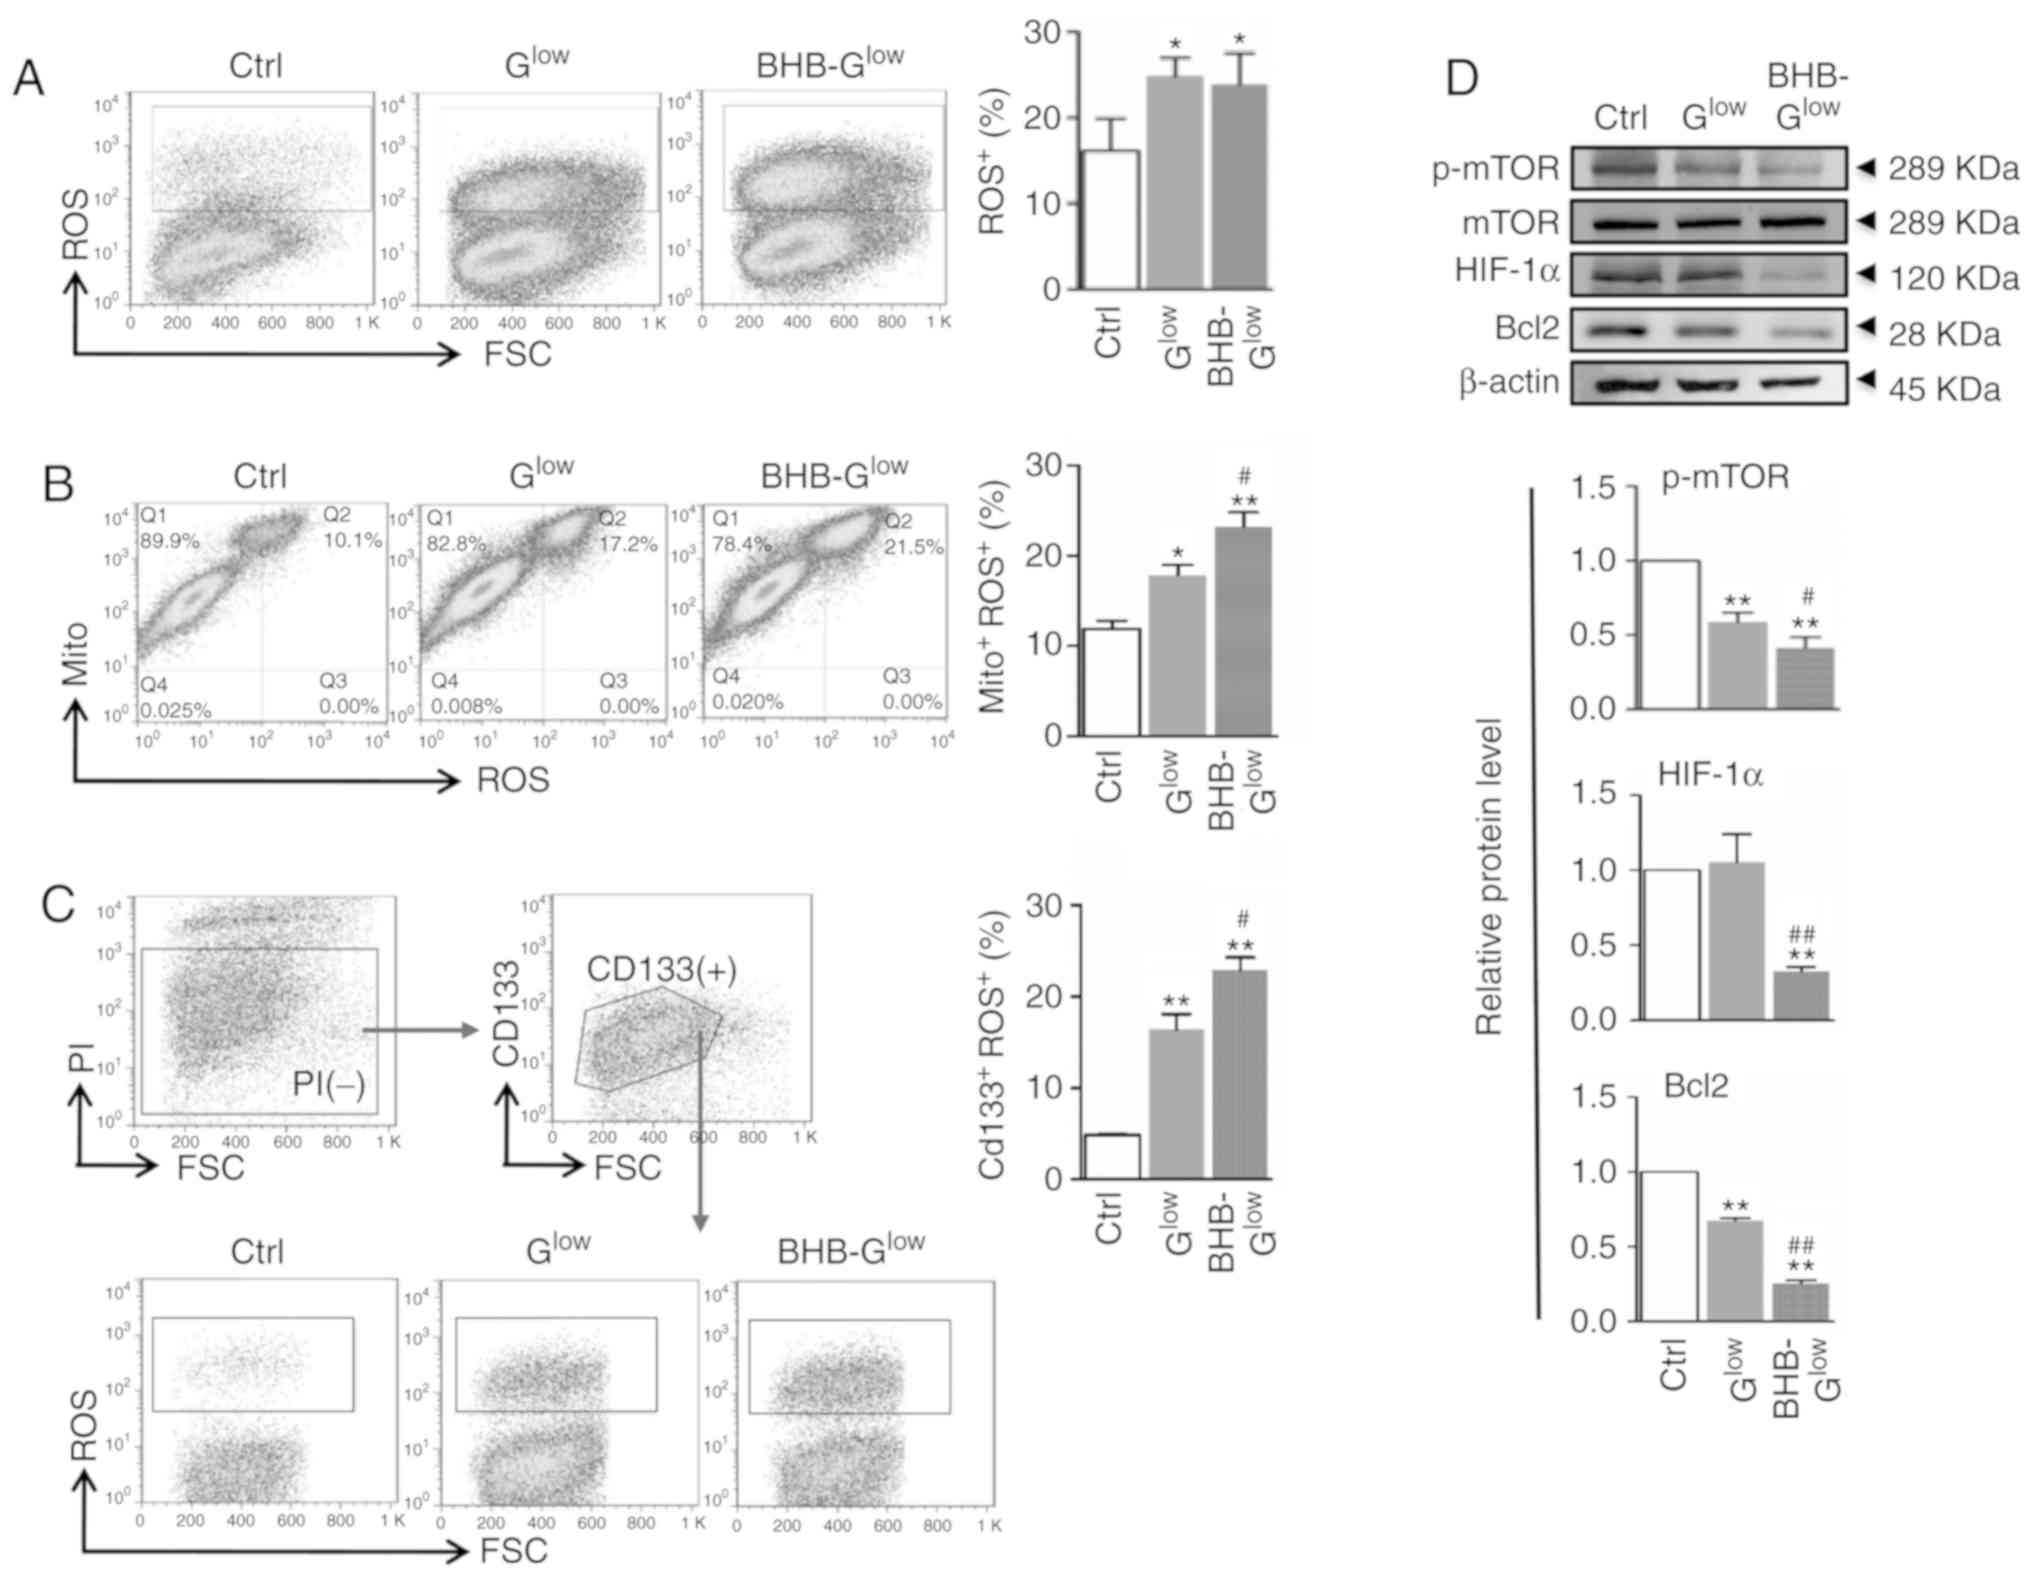 | Figure 6ROS production is increased in GSCs
treated with BHB. (A) ROS production was evaluated using FACS in
cells after staining with DCFH-DA and quantitatively compared. (B)
Cells in (A) were stained with MitoTracker and DCFH-DA and analyzed
by FACS. The MitoTracker+ROS+ populations
were quantitatively compared. (C) Cells in (A) were stained with
anti-CD133 and DCFH-DA and analyzed by FACS. The
CD133+ROS+ cells were quantitatively
compared. (D) Cells in (A) were analyzed by western blotting for
p-mTOR, mTOR, HIF-1α and Bcl2, with β-actin used as the internal
control. Data are presented as the mean ± standard deviation.
*P<0.05, **P<0.01 vs. Ctrl;
#P<0.05, ##P<0.01 vs. Glow.
GSC, glioma stem-like cell; BHB, β-hydroxybutyrate; Ctrl, control
medium with 25 mM glucose; Glow, medium with 2.5 mM
glucose; BHB-Glow, Glow + BHB; ROS, reactive
oxygen species; DCFH-DA, dichloro-dihydro-fluorescein diacetate;
Mito, MitoTracker; p-, phospho; mTOR, mammalian target of
rapamycin; FSC, forward scatter; PI, propidium iodide; HIF-1α,
hypoxia-inducible factor 1α; Bcl-2, B-cell lymphoma 2. |
ROS scavenging reverses the effects of
BHB on GSCs
To further demonstrate the role of ROS in
BHB-mediated inhibition of GSC proliferation, the effects of the
ROS scavenger N-acetylcysteine (NAC) were determined on GSCs
treated with BHB. The results showed that NAC reversed the
inhibition of BHB on an unidentified anti-oxidative signaling
pathway by increasing the activity of SOD, CAT and the
concentrations of GSH, as well as decreasing the concentration of
GSSG (Fig. S4B). Additionally,
NAC increased tumor sphere formation in NCH421k cells at
concentrations ≤25 mM (Fig. S3C).
In the presence of NAC, the number and size of tumor spheres that
were formed from by NCH421k cells treated with BHB, as well as cell
viability within the spheres, was increased (Fig. 7A-C). In addition, western blotting
revealed that NAC treatment increased the expression of Sox2 in
NCH421k cells treated with BHB (Fig.
7D). Subsequently, metabolic changes in cells treated with NAC
were determined. Intake of glucose was increased when ROS were
scavenged in NCH421k cells cultured in BHB-Glow medium,
as shown by the 2-NBDG assay results (Fig. 7E). TEM showed that the size of the
mitochondria was increased in NCH421k cells treated with NAC
(Fig. 7F). These data suggest that
ROS scavenging partly rescued the inhibitory effects of BHB in
NCH421k cells.
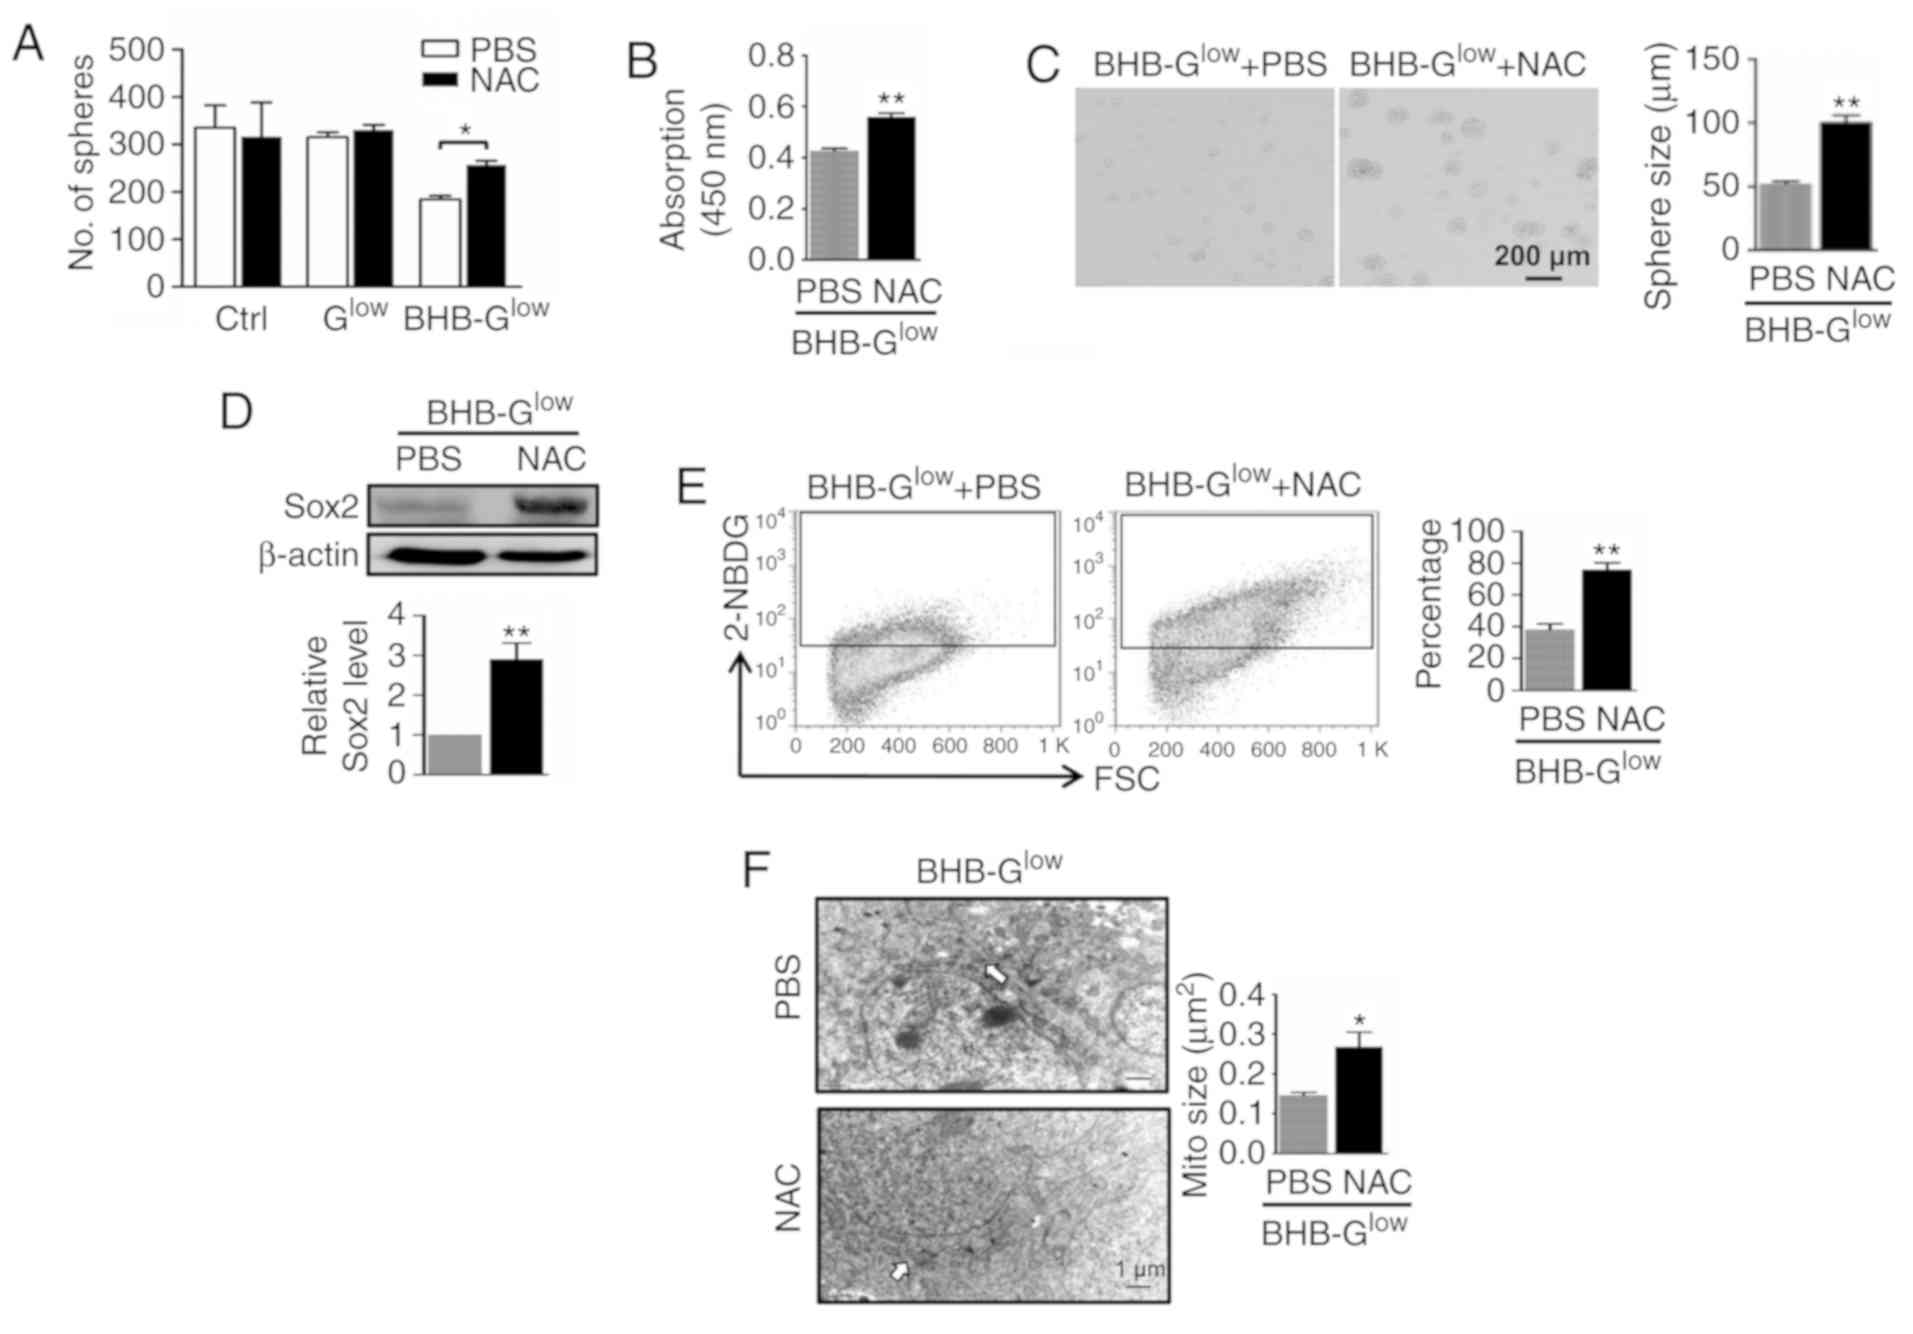 | Figure 7ROS scavenging rescues BHB-induced
GSC inhibition. NCH421k cells were cultured in Ctrl,
Glow or 10 mM BHB-Glow medium for 7 days with
or without 5 mM NAC. (A) Sphere formation and (B) cell viability
were determined. (C) Tumor spheres were imaged, and the diameter of
the spheres compared. Scale bar, 200 µm. (D) Expression of
Sox2 in cells in (C) was determined by western blotting and
quantitatively compared. (E) Glucose transport in cells in (C) for
5 days was determined using 2-NBDG staining followed by FACS. (F)
Cells in (C) for 5 days was imaged by transmission electron
microscopy and the size of the mitochondria (white arrows) were
quantitatively compared. Scale bar, 1 µm. Data are presented
as the mean ± standard deviation. *P<0.05,
**P<0.01 vs. Ctrl. GSC, glioma stem-like cell; BHB,
β-hydroxybutyrate; Ctrl, control medium with 25 mM glucose;
Glow, medium with 2.5 mM glucose; BHB-Glow,
PBSlow + BHB; ROS, reactive oxygen species; 2-NBDG,
v2-[N-(7-nitrobenz-2-oxa-1,3-diaxol-4-yl)
amino]-2-deoxyglucose; FSC, forward scatter; NAC, N-acetylcysteine;
Mito, MitoTracker. |
Discussion
Abnormal metabolism, as represented by the Warburg
effect, is one of the hallmarks of cancer and is critically
involved in cancer initiation, malignant growth, metastasis and
therapy resistance (8,17). It has been reported that mutational
and/or epigenetic modifications in cancer cells results in enhanced
glycolysis even under aerobic conditions to meet the increased
demands for energy, biosynthesis and gene expression regulation in
cancer cells (5). Therefore, it is
hypothesized, and to certain extent demonstrated, that cancer cells
are dependent on glycolysis, and disruption of this glycolysis
dependence could serve as potential anti-tumor therapy strategy
(3). Ketone bodies, which are
composed of acetoacetate, BHB, and acetone, are a degradation
product of fatty acids produced in the liver and utilized by
neuronal cells. While normal neuronal cells can oxidize ketone
bodies in the mitochondria, glioma cells cannot, due to their
metabolic reprogramming. Therefore, as a potentially effective
therapy against glioma, the objective of a KD is to nourish normal
neuronal cells with ketone bodies under glucose deprived
conditions. In the brain, BHB is generated from oxidation of fatty
acids or catabolism of amino acids in astrocytes, which can be
metabolized in the mitochondria of all brain cell types although
uptake across the blood brain barrier is a metabolic control point
(30). Under glucose deprived
conditions, cells will increase BHB usage as an alternative energy
resource (31). However, glucose
deprived glioma cells will starve, as they cannot not utilize
ketone bodies. Glucose deprivation, a basic principle of a KD, is
now considered as an adjuvant anti-glioma therapy based on in
vitro and in vivo studies of its effectiveness (10,12,32,33).
However, the specific molecular mechanisms underlying the
effectiveness of this approach against GBM, specifically GSCs, have
remained elusive.
In the present study, the effects of a KD model on
GSCs, specialized GBM cells with stem-like cell properties that
have been shown to be responsible for drug resistance and tumor
recurrence, were assessed. As BHB is the major component of ketone
bodies under physiological ketosis, GSCs were cultured with BHB in
low glucose medium. Based on clinical ketoacidosis and the
blood-brain barrier, which restricts molecule exchange between the
cerebral and peripheral compartments (5,20),
ketosis was mimicked using 2.5 mM glucose and <15 mM BHB in the
culture medium. The results showed that BHB supported the growth of
normal mouse NSCs but inhibited the formation and growth of tumor
spheres derived from GSCs. Additionally, BHB inhibited GSC
proliferation and promoted GSC apoptosis under glucose deprived
conditions, thus providing an explanation for the reduced sphere
formation. The stemness of GSCs was also attenuated by BHB under
the low glucose conditions. Together, these data provide further
in vitro evidence supporting the therapeutic use of a KD for
treatment of glioma; that is, normal NSCs and GSCs respond to a KD
differently due to the intrinsic metabolic reprogramming in GSCs,
and thus a KD can reduce GSC activity without significantly
impairing normal NSC activity.
It is possible that BHB reduces GSC activity under
glucose deprived conditions by restricting glycolysis-dependent
metabolism (20,34,35),
a hallmark of GSCs (36). In the
in vitro culture system, BHB reduced the expression and
activity of Glut1 and several enzymes critical for glycolysis. This
may result in an energy crisis in GSCs due to their dependence on
glycolysis (37), as supported by
the observed reduction in ATP production. Reduced ATP production
hampers proliferation of cells and induces apoptosis in GSCs.
Interestingly, inconsistent with the attenuation of glycolysis,
lactate production was increased in BHB-treated cells. These
findings suggest that BHB not only inhibits glycolysis, but also
damages mitochondria in GSCs, and thus further demonstrate the
anti-tumor effects of a KD (13).
Damage to the mitochondria results in oxidative stress, which
disturbs the intracellular balance between antioxidants and the
extent of ROS generation, initiating a wide array of cellular
responses via multiple signaling pathways, including the
anti-oxidative enzymes SOD, CAT, and GSH (38). Consistent with this notion, ROS
production was increased alongside the decreased activity and
concentration of anti-oxidative enzymes in GSCs treated with BHB.
Additionally, morphological changes were observed in the
mitochondria, most notably a reduction in mitochondrial size, and
the mitochondrial transmembrane potential was reduced. Antioxidant
treatment with a ROS scavenger abrogated the inhibition of cell
proliferation and self-renewal mediated by BHB, further
demonstrating that increased ROS production serves an important
role in the BHB-induced inhibition of GSCs. GSCs presented higher
levels of ROS compared with NSCs and scavenging ROS under glucose
deprived conditions did not significantly affect proliferation
(Fig. 7A), indicating that other
elements in the microenvironment, not ROS, prolonged cell survival
during glucose deprivation in GSCs.
The complete mechanism underlying BHB-induced GSC
inhibition may be more complicated. ROS can directly regulate
multiple signaling pathways such as the Akt-mTOR-HIF-1α pathway,
leading to changes in cell proliferation and apoptosis (39). BHB treatment reduced the levels of
mTOR phosphorylation as well as the expression of HIF-1α and Bcl2.
Furthermore, previous studies have shown that BHB is an intrinsic
histone deacetylase inhibitor, and thus regulates large-scale
alterations in gene expression through histone modification,
resulting in multiple cellular changes (40,41).
BHB-induced ROS production appeared to be greater in
CD133+ GSCs compared with those negative for CD133,
suggesting that a KD may target different GSC populations with
differing efficacies. The pathogenesis of glioma is complicated,
and involves numerous signaling pathways (7). Thus, additional studies on the
effects of a KD on GSCs are warranted, given the critical roles of
GSCs in the progression of glioma. In addition, the present study,
the effect of a KD on GSCs in conditions of physiological ketosis
in vitro were examined. However, the clinical significance
is unknown based on the results of the present study. This is
partly because the level of ketone bodies in the circulating blood,
or 'ketosis’ limits the concentration in the brain (5,13).
Under physiological conditions, the concentration of blood ketone
bodies is inversely proportional to the concentration of blood
glucose. Generally, cells including GSCs, are have sufficient
glucose as an energy resource. If glucose supplies are limited,
other metabolites, such as ketone bodies, serve as the energy
source. The effective management of the balance between glucose and
ketone bodies influences the therapeutic effects of the ketogenic
diet in both cell lines and animal experiments (10,42).
One limiting factor in the use of a KD is treatment compliance,
which is unsatisfactory, particularly in adults. Considering the
adherence and ketogenic management in patients (43), in vivo studies are required
to further optimize KD treatment for clinical use.
In conclusion, the results of the present study,
together with those of published studies, support the hypothesis
that GSCs have a unique metabolic profile that differs from that of
normal NSCs and is highly dependent on glycolysis as an energy
source. A KD which supplies ketone bodies combined with low glucose
levels disturbs the metabolic balance in GSCs, leading to an energy
crisis and thus, oxidative stress, which in turn reduces cell
proliferation and stemness and even induces apoptosis. Therefore,
by targeting GSCs, a KD may serve as an adjuvant therapy for
treatment of patients with GBM.
Supplementary Data
Funding
The present study was supported by grants from the
National Natural Science Foundation (grant nos. 31671523 and
31101054), the Innovation Military Project of China and the First
Affiliated Hospital Program (grant no. 2018QN-09).
Availability of data and materials
The datasets used and/or analyzed during the present
study are available from the corresponding author on reasonable
request.
Authors’ contributions
HH and ZF designed the study. FW supervised the
study. CJ, YH, CG, LL and BG performed the GSC in vitro
experiments and analyzed the data. CJ, YR and XC performed the GSC
in vivo experiments and analyzed the data. CJ, JL, MZ and SL
analyzed the immunofluorescence, transmission electron microscopy
and hematoxylin and eosin staining data. CJ, LL BG wrote the
manuscript. All authors read and approved the final manuscript.
Ethics approval and consent to
participate
The use of human samples was approved by the Ethics
Committee of Xijing Hospital (Xi’an, China) and procedures were
performed in accordance with the Declaration of Helsinki. Written
informed consent was obtained from all patients involved.
Patient consent for publication
Not applicable.
Competing interests
The authors declare that they have no competing
interests.
Abbreviations:
|
mTOR
|
mammalian target of rapamycin
|
|
Glut1
|
glucose transport 1
|
|
HK1/2
|
hexokinase1/2
|
|
PK
|
pyruvate kinase
|
|
PKM1/2
|
M1/2 isoform of pyruvate kinase
|
|
PFK
|
phosphofructokinase
|
|
PFKP
|
phosphofructokinase platelet-type
|
|
LDHA
|
lactate dehydrogenase A
|
|
PDH
|
pyruvate dehydrogenase
|
|
NAC
|
N-acetylcysteine
|
Acknowledgments
The authors would like to thank Dr. Kewei Fang of
Shenzhen Children’s Hospital (Shenzhen, China) for his assistance
with the ketogenic diet treatment protocol.
References
|
1
|
Poteet E, Choudhury GR, Winters A, Li W,
Ryou MG, Liu R, Tang L, Ghorpade A, Wen Y, Yuan F, et al: Reversing
the Warburg effect as a treatment for glioblastoma. J Biol Chem.
288:9153–9164. 2013. View Article : Google Scholar : PubMed/NCBI
|
|
2
|
Stupp R, Mason WP, van den Bent MJ, Weller
M, Fisher B, Taphoorn MJ, Belanger K, Brandes AA, Marosi C, Bogdahn
U, et al: Radiotherapy plus concomitant and adjuvant temozolomide
for glioblastoma. N Engl J Med. 352:987–996. 2005. View Article : Google Scholar : PubMed/NCBI
|
|
3
|
Maurer GD, Brucker DP, Bähr O, Harter PN,
Hattingen E, Walenta S, Mueller-Klieser W, Steinbach JP and Rieger
J: Differential utilization of ketone bodies by neurons and glioma
cell lines: A rationale for ketogenic diet as experimental glioma
therapy. BMC Cancer. 11:3152011. View Article : Google Scholar : PubMed/NCBI
|
|
4
|
Vander Heiden MG, Cantley LC and Thompson
CB: Understanding the Warburg effect: The metabolic requirements of
cell proliferation. Science. 324:1029–1033. 2009. View Article : Google Scholar : PubMed/NCBI
|
|
5
|
Seyfried TN, Flores R, Poff AM, D’Agostino
DP and Mukherjee P: Metabolic therapy: A new paradigm for managing
malignant brain cancer. Cancer Lett. 356:289–300. 2015. View Article : Google Scholar
|
|
6
|
Hoskin PJ, Sibtain A, Daley FM and Wilson
GD: GLUT1 and CAIX as intrinsic markers of hypoxia in bladder
cancer: Relationship with vascularity and proliferation as
predictors of outcome of ARCON. Br J Cancer. 89:1290–1297. 2003.
View Article : Google Scholar : PubMed/NCBI
|
|
7
|
Ward PS and Thompson CB: Metabolic
reprogramming: A cancer hallmark even warburg did not anticipate.
Cancer Cell. 21:297–308. 2012. View Article : Google Scholar : PubMed/NCBI
|
|
8
|
Shen YA, Wang CY, Hsieh YT, Chen YJ and
Wei YH: Metabolic reprogramming orchestrates cancer stem cell
properties in naso-pharyngeal carcinoma. Cell Cycle. 14:86–98.
2015. View Article : Google Scholar
|
|
9
|
Klement RJ, Bandyopadhyay PS, Champ CE and
Walach H: Application of Bayesian evidence synthesis to modelling
the effect of ketogenic therapy on survival of high grade glioma
patients. Theor Biol Med Model. 15:122018. View Article : Google Scholar : PubMed/NCBI
|
|
10
|
Augur ZM, Doyle CM, Li M, Mukherjee P and
Seyfried TN: Nontoxic targeting of energy metabolism in preclinical
VM-M3 experimental glioblastoma. Front Nutr. 5:912018. View Article : Google Scholar : PubMed/NCBI
|
|
11
|
Champ CE, Palmer JD, Volek JS,
Werner-Wasik M, Andrews DW, Evans JJ, Glass J, Kim L and Shi W:
Targeting metabolism with a ketogenic diet during the treatment of
glioblastoma multiforme. J Neurooncol. 117:125–131. 2014.
View Article : Google Scholar : PubMed/NCBI
|
|
12
|
Martuscello RT, Vedam-Mai V, McCarthy DJ,
Schmoll ME, Jundi MA, Louviere CD, Griffith BG, Skinner CL, Suslov
O, Deleyrolle LP and Reynolds BA: A supplemented high-fat
low-carbohydrate diet for the treatment of glioblastoma. Clin
Cancer Res. 22:2482–2495. 2016. View Article : Google Scholar
|
|
13
|
Poff A, Koutnik AP, Egan KM, Sahebjam S,
D’Agostino D and Kumar NB: Targeting the Warburg effect for cancer
treatment: Ketogenic diets for management of glioma. Semin Cancer
Biol. 56:135–148. 2017. View Article : Google Scholar
|
|
14
|
Ito K and Suda T: Metabolic requirements
for the maintenance of self-renewing stem cells. Nat Rev Mol Cell
Biol. 15:243–256. 2014. View Article : Google Scholar : PubMed/NCBI
|
|
15
|
Sell S: On the stem cell origin of cancer.
Am J Pathol. 176:2584–2594. 2010. View Article : Google Scholar : PubMed/NCBI
|
|
16
|
Batlle E and Clevers H: Cancer stem cells
revisited. Nat Med. 23:1124–1134. 2017. View Article : Google Scholar : PubMed/NCBI
|
|
17
|
Folmes CD, Dzeja PP, Nelson TJ and Terzic
A: Metabolic plasticity in stem cell homeostasis and
differentiation. Cell Stem Cell. 11:596–606. 2012. View Article : Google Scholar : PubMed/NCBI
|
|
18
|
Nakano I: Therapeutic potential of
targeting glucose metabolism in glioma stem cells. Expert Opin Ther
Targets. 18:1233–1236. 2014. View Article : Google Scholar : PubMed/NCBI
|
|
19
|
Cairns RA, Harris IS and Mak TW:
Regulation of cancer cell metabolism. Nat Rev Cancer. 11:85–95.
2011. View Article : Google Scholar : PubMed/NCBI
|
|
20
|
Flavahan WA, Wu Q, Hitomi M, Rahim N, Kim
Y, Sloan AE, Weil RJ, Nakano I, Sarkaria JN, Stringer BW, et al:
Brain tumor initiating cells adapt to restricted nutrition through
preferential glucose uptake. Nat Neurosci. 16:1373–1382. 2013.
View Article : Google Scholar : PubMed/NCBI
|
|
21
|
Agnihotri S and Zadeh G: Metabolic
reprogramming in glioblastoma: The influence of cancer metabolism
on epigenetics and unanswered questions. Neuro Oncol. 18:160–172.
2016. View Article : Google Scholar :
|
|
22
|
Zhou Y, Zhou Y, Shingu T, Feng L, Chen Z,
Ogasawara M, Keating MJ, Kondo S and Huang P: Metabolic alterations
in highly tumorigenic glioblastoma cells: Preference for hypoxia
and high dependency on glycolysis. J Biol Chem. 286:32843–32853.
2011. View Article : Google Scholar : PubMed/NCBI
|
|
23
|
Campos B, Wan F, Farhadi M, Ernst A,
Zeppernick F, Tagscherer KE, Ahmadi R, Lohr J, Dictus C, Gdynia G,
et al: Differentiation therapy exerts antitumor effects on
stem-like glioma cells. Clin Cancer Res. 16:2715–2728. 2010.
View Article : Google Scholar : PubMed/NCBI
|
|
24
|
Gao F, Zhang YF, Zhang ZP, Fu LA, Cao XL,
Zhang YZ, Guo CJ, Yan XC, Yang QC, Hu YY, et al: miR-342-5p
regulates neural stem cell proliferation and differentiation
downstream to Notch signaling in mice. Stem Cell Reports.
8:1032–1045. 2017. View Article : Google Scholar : PubMed/NCBI
|
|
25
|
Hu YY, Fu LA, Li SZ, Chen Y, Li JC, Han J,
Liang L, Li L, Ji CC, Zheng MH and Han H: Hif-1α and Hif-2α
differentially regulate Notch signaling through competitive
interaction with the intracellular domain of Notch receptors in
glioma stem cells. Cancer Lett. 349:67–76. 2014. View Article : Google Scholar : PubMed/NCBI
|
|
26
|
Ilkhanizadeh S and Weiss WA: Starvation
favors glioma stem cells. Nat Neurosci. 16:1359–1361. 2013.
View Article : Google Scholar : PubMed/NCBI
|
|
27
|
Bassoy EY, Kasahara A, Chiusolo V,
Jacquemin G, Boydell E, Zamorano S, Riccadonna C, Pellegatta S,
Hulo N, Dutoit V, et al: ER-mitochondria contacts control surface
glycan expression and sensitivity to killer lymphocytes in glioma
stem-like cells. EMBO J. 36:1493–1512. 2017. View Article : Google Scholar : PubMed/NCBI
|
|
28
|
Halabe Bucay A: The biological
significance of cancer: Mitochondria as a cause of cancer and the
inhibition of glycolysis with citrate as a cancer treatment. Med
Hypotheses. 69:826–828. 2007. View Article : Google Scholar : PubMed/NCBI
|
|
29
|
Mischel PS: HOT Models in flux:
Mitochondrial glucose oxidation fuels glioblastoma growth. Cell
Metab. 15:789–790. 2012. View Article : Google Scholar : PubMed/NCBI
|
|
30
|
Bernini A, Masoodi M, Solari D, Miroz JP,
Carteron L, Christinat N, Morelli P, Beaumont M, Abed-Maillard S,
Hartweg M, et al: Modulation of cerebral ketone metabolism
following traumatic brain injury in humans. J Cereb Blood Flow
Metab. October 24–2018.Epub ahead of print. PubMed/NCBI
|
|
31
|
Fusco S, Leone L, Barbati SA, Samengo D,
Piacentini R, Maulucci G, Toietta G, Spinelli M, McBurney M, Pani G
and Grassi C: A CREB-Sirt1-Hes1 circuitry mediates neural stem cell
response to glucose availability. Cell Rep. 14:1195–1205. 2016.
View Article : Google Scholar : PubMed/NCBI
|
|
32
|
Rieger J, Bähr O, Maurer GD, Hattingen E,
Franz K, Brucker D, Walenta S, Kämmerer U, Coy JF, Weller M and
Steinbach JP: ERGO: A pilot study of ketogenic diet in recurrent
glioblastoma. Int J Oncol. 44:1843–1852. 2014. View Article : Google Scholar : PubMed/NCBI
|
|
33
|
Woolf EC, Curley KL, Liu Q, Turner GH,
Charlton JA, Preul MC and Scheck AC: The ketogenic diet alters the
hypoxic response and affects expression of proteins associated with
angiogenesis, invasive potential and vascular permeability in a
mouse glioma model. PLoS One. 10:e1303572015. View Article : Google Scholar
|
|
34
|
Klement RJ and Champ CE: Calories,
carbohydrates, and cancer therapy with radiation: Exploiting the
five R’s through dietary manipulation. Cancer Metastasis Rev.
33:217–229. 2014. View Article : Google Scholar : PubMed/NCBI
|
|
35
|
Venneti S and Thompson CB: Metabolic
modulation of epigenetics in gliomas. Brain Pathol. 23:217–221.
2013. View Article : Google Scholar : PubMed/NCBI
|
|
36
|
Singer E, Judkins J, Salomonis N, Matlaf
L, Soteropoulos P, McAllister S and Soroceanu L: Reactive oxygen
species-mediated therapeutic response and resistance in
glioblastoma. Cell Death Dis. 6:e16012015. View Article : Google Scholar : PubMed/NCBI
|
|
37
|
Fu X, Chin RM, Vergnes L, Hwang H, Deng G,
Xing Y, Pai MY, Li S, Ta L, Fazlollahi F, et al: 2-Hydroxyglutarate
Inhibits ATP Synthase and mTOR Signaling. Cell Metab. 22:508–515.
2015. View Article : Google Scholar : PubMed/NCBI
|
|
38
|
Sharma PK, Bhardwaj R, Dwarakanath BS and
Varshney R: Metabolic oxidative stress induced by a combination of
2-DG and 6-AN enhances radiation damage selectively in malignant
cells via non-coordinated expression of antioxidant enzymes. Cancer
Lett. 295:154–166. 2010. View Article : Google Scholar : PubMed/NCBI
|
|
39
|
Zhao Y, Hu X, Liu Y, Dong S, Wen Z, He W,
Zhang S, Huang Q and Shi M: ROS signaling under metabolic stress:
Cross-talk between AMPK and AKT pathway. Mol Cancer. 16:792017.
View Article : Google Scholar : PubMed/NCBI
|
|
40
|
Shimazu T, Hirschey MD, Newman J, He W,
Shirakawa K, Le Moan N, Grueter CA, Lim H, Saunders LR, Stevens RD,
et al: Suppression of oxidative stress by β-hydroxybutyrate, an
endogenous histone deacetylase inhibitor. Science. 339:211–214.
2013. View Article : Google Scholar
|
|
41
|
Benjamin JS, Pilarowski GO, Carosso GA,
Zhang L, Huso DL, Goff LA, Vernon HJ, Hansen KD and Bjornsson HT: A
keto-genic diet rescues hippocampal memory defects in a mouse model
of Kabuki syndrome. Proc Natl Acad Sci USA. 114:125–130. 2017.
View Article : Google Scholar
|
|
42
|
Poff AM, Ari C, Arnold P, Seyfried TN and
D’Agostino DP: Ketone supplementation decreases tumor cell
viability and prolongs survival of mice with metastatic cancer. Int
J Cancer. 135:1711–1720. 2014. View Article : Google Scholar : PubMed/NCBI
|
|
43
|
Chung H and Park YK: Rationale,
feasibility and acceptability of ketogenic diet for cancer
treatment. J Cancer Prev. 22:127–134. 2017. View Article : Google Scholar : PubMed/NCBI
|


