Introduction
Renal cell carcinoma (RCC) is one of the most common
malignancies of the urinary system and accounts for 2-3% of adult
malignant neoplasms, ~80% of which are clear cell RCC (ccRCC)
(1). Despite significant progress
in the systematic therapy of this type of tumor, the reduction of
mortality remains an arduous task, with challenges such as a lack
of clinically available biomarkers, and insufficient understanding
of the underlying molecular mechanism of ccRCC (2-4).
Therefore, it is evident that a better understanding of potential
therapeutic targets and biomarkers of ccRCC will facilitate the
improvement of survival in patients with ccRCC.
The β-thymosin family primarily consists of thymosin
β4 (TMSB4), TMSB15 and TMSB10, which perform a vital function as
actin-binding proteins to control the cytoskeletal microfilament
system (5). Efforts have been made
to investigate the biological roles of β-thymosin; β-thymosin is
shown to exhibit various physiological roles, including tissue
regeneration, inflammatory regulation and central nervous
development (6). Notably,
β-thymosin has been found to be involved in tumorigenesis and tumor
progression (7). For instance,
TMSB4 exhibits oncogenic functions in various types of cancer,
including colorectal cancer, breast cancer and pancreatic cancer
(8-14). Furthermore, TMSB15 can act as a
potential biomarker for prostate cancer progression (15). However, opinion is still divided
over whether TMSB10 plays a tumor-suppressive or oncogenic role. In
papillary thyroid carcinoma, non-small cell lung cancer, breast
cancer and hepatocellular carcinoma, it is reported that TMSB10 is
upregulated, and that overexpression of TMSB10 predicts poor
outcome and promotes cancer progression (16-20).
By contrast, in ovarian cancer and cholangiocarcinoma,
overexpression of TMSB10 induces apoptosis and reduces tumor
proliferation (21,22). To the best of our knowledge, the
functional role and clinical significance of TMSB10 in ccRCC
remains poorly understood.
In the present study, the aim was to investigate the
association between the expression of TMSB10 and the clinical
characteristics of patients with ccRCC. Additionally, a functional
analysis of TMSB10 in ccRCC was performed in vitro.
Materials and methods
Screening the differentially expressed
genes and candidate genes associated with survival
In this study, the Gene Expression Omnibus (GEO)
microarray datasets GSE40435, GSE53000, GSE53757, GSE105261 and
GSE15641 were included for further analysis (23-27).
The online tool GEO2R (https://www.ncbi.nlm.nih.gov/geo/) was used to detect
the differentially expressed genes between normal kidney samples
and ccRCC samples with the cutoff criteria of adjusted P-value
<0.05 and logFC >1. A Venn diagram was drawn to depict the
extraction of commonly upregulated genes present in more than two
datasets. Furthermore, the online survival analysis tool OncoLnc
(http://www.oncolnc.org/) was utilized to screen
candidate genes associated with patient survival.
Bioinformatics analysis of TMSB10 in
ccRCC
The TMSB10 mRNA expression level and The Cancer
Genome Atlas Kidney Renal Clear Cell Carcinoma (TCGA-KIRC) clinical
data, including age, sex, grade, stage, T stage, N stage, M stage,
overall survival (OS) time and disease-free survival (DFS) time
were downloaded from the TCGA data portal (https://tcga-data.nci.nih.gov/tcga/). Patients with
corresponding gene expression were included in the present study,
while those with missing OS or DFS data were excluded. The Yusenko
Renal, Lenburg Renal, Jones Renal, Gumz Renal and Beroukhim Renal
datasets were obtained from the Oncomine database (https://www.onco-mine.org/). Furthermore, to elucidate
the possible role of TMSB10 in ccRCC pathogenesis, the online
STRING database (https://string-db.org/) was used to acquire biological
processes, Kyoto Encyclopedia of Genes and Genomes (KEGG) pathways
and Reactome data of TMSB10 (28).
Furthermore, a gene set enrichment analysis (GSEA) was conducted
using GSEA software (http://www.broadinstitute.org/gsea). A false discovery
rate <25% and P-value <0.05 were considered to indicate
statistical significance.
Human renal cancer tissue samples
Between January 2016 and January 2019, 80 pairs of
adjacent normal renal tissue and ccRCC tumor tissue were collected
from patients who underwent partial or radical nephrectomy at the
Wuhan Union Hospital (Wuhan, China) for subsequent western blotting
and immunohistochemistry (IHC) experiments. All patients did not
receive any adjuvant therapy and provided written informed consent
before surgery (Table SI). As a
prolonged follow-up was not performed, the DFS and OS of these
patients was not known. In future, the present research team plan
to conduct a strict and scheduled follow-up to obtain complete
clinical characteristics of the patients. The Human Research Ethics
Committee of Huazhong University of Science and Technology (Wuhan,
China) approved the present study and experimental procedures. The
study methodologies conformed to the standards set by the
Declaration of Helsinki.
Cell culture and transient transfection
assay
The cell lines ACHN, 786-O, Caki-1, A-498 and HK-2
were purchased from the American Type Culture Collection.
Dulbecco's modified Eagle's medium (DMEM; Gibco; Thermo Fisher
Scientific, Inc.) containing 10% fetal bovine serum (Gibco; Thermo
Fisher Scientific, Inc.) and 1% streptomycin-penicillin was used to
culture cells. Cells were cultivated in a 5% CO2 and
37˚C environment. Small interfering (si)RNA oligonucle-otide
sequences specifically targeting TMSB10 (si-TMSB10) and negative
control siRNA (si-NC) were constructed by Guangzhou RiboBio Co.,
Ltd. The si-TMSB10 sequence was as follows: 5′-GAG AAG CGG AGT GAA
ATT T-3′ and the si-NC sequence was: 5′-TTC TCC GAA CGT GTC ACG TdT
dT-3′. For transfection, ccRCC cells were seeded in 6-well plates
at 50-70% confluence; cells were transfected with 100 pmol siRNA
using Lipofectamine® 2000 (Invitrogen; Thermo Fisher
Scientific, Inc.). After 48 h transfection, subsequent assays were
conducted.
Western blotting assays
Cells and tissues were lysed with RIPA buffer
(Beyotime Institute of Biotechnology) and the protein concentration
was determined using a bicinchoninic acid kit (Beyotime Institute
of Biotechnology). Subsequently, 30 µg total proteins/lane were
separated using 10% SDS-PAGE. Then, the gel system was transferred
to a polyvinylidene fluoride (PVDF) membrane (EMD Millipore) for 90
min at 90 V, after which the PVDF membrane was blocked with 5%
non-fat milk dissolved in PBS for 1 h at room temperature and then
incubated with antibodies against TMSB10 (1:2,000; ab14338; Abcam),
vascular endothelial growth factor (VEGF; 1:3,000; 66828-1-Ig;
ProteinTech Group, Inc.), phosphorylated (P-)PI3K (1:1,000; AP0854;
ABclonal Biotech Co., Ltd.), PI3K (1:1,000; ab32089; Abcam) and
β-actin (1:3,000; ab8226; Abcam) at 4˚C overnight. The next day,
the membrane was washed and incubated with secondary antibodies
(1:3,000; GB23303; Servicebio, Inc.) for 2 h at room temperature.
The proteins were then developed with WesternBright™ ECL (Advansta,
Inc.) and visualized with ChemiDoc XRS+ (Bio-Rad
Laboratories, Inc.).
IHC of ccRCC and adjacent normal
tissues
Ten paired ccRCC tissues and adjacent normal tissues
were fixed in 4% formalin at room temperature for 12 h, dehydrated
and embedded in paraffin. Blocking was performed with xylene and
paraffin (1:1) for 2 h at room temperature. The tissue sections (4
µm) were then incubated in primary rabbit TMSB10 polyclonal
antibody (1:100; ab14338; Abcam) at 4˚C overnight. After rinsing
three times with PBS, the sections were incubated at room
temperature for 2 h with goat anti-rabbit secondary antibodies
(K5007; Dako; Agilent Technologies, Inc.). The sections were then
viewed using a light microscope.
Cell proliferation analysis
ACHN cells were transfected with si-NC or si-TMSB10
at 48 h before the experiment as described by Cao et al
(29). Subsequently, the cells
were inoculated on 96-well plates at a cell density of
1×10³ cells/well. The cell proliferation rate was
determined using a Cell Counting kit-8 (CCK-8; Dojindo Molecular
Technologies, Inc.) every 24 h for a total of 96 h based on the
manufacturer's instructions. In brief, 10 µl CCK-8 solution was
added to each well. After incubation for 3 h at 37˚C, the optical
density of each well was measured at 450 nm to evaluate the
quantity of living cells. Finally, the number of cells were plotted
over 4 days to reflect the rate of cell proliferation using
GraphPad Prism 7.0 (GraphPad Software, Inc.).
Cell migration and invasion assays
As described above, ACHN cells was transfected with
si-NC or si-TMSB10 48 h prior to the experiment. In addition,
before the migration and invasion assays, cells were cultivated in
DMEM without serum for 6-8 h to starve the cells. Boyden Transwell
chambers (Corning Inc.) containing 8-µm membrane filters were
utilized. Cells (1×10⁴) in serum-free medium were seeded
to the upper chamber, whereas the bottom chamber was filled with
DMEM containing 10% FBS (BD Biosciences). Following incubation at
37˚C for 24 h, the cells on the lower chamber were fixed with 100%
methanol for 10 min at room temperature, and then stained with
0.05% crystal violet for 30 min at room temperature. Finally, five
random fields were counted under a light microscope (Olympus
CX41-32C02; Olympus Corporation) at ×100 magnification. Three
independent experiments were conducted. With regard to invasion
assays, Matrigel (BD Biosciences) was precoated into the upper
chamber for 6-8 h. Then, cells (2×10⁴) were inoculated
into the upper chamber in serum-free medium. The remaining
procedure was the same as that of the migration assay.
Statistical analysis
All statistical analyses were performed using
GraphPad Prism and SPSS Statistics (version 22.0; IBM Corp.).
Numerical data are presented as the mean ± SD. Tukey's test was
used to detect the differences between groups. A paired sample
t-test was used for the analysis of differences between paired
samples. The associations between TMSB10 expression and various
clinicopathological characteristics in patients with ccRCC were
evaluated using Pearson's χ2 test. Receiver operator
characteristic (ROC) curves and areas under the curve (AUC) were
used to assess the diagnostic value of TMSB10 expression in
patients with ccRCC. The association between TMSB10 expression
level and either OS or DFS was analyzed using Kaplan-Meier curves
with log-rank tests. P<0.05 was considered to indicate a
statistically significant result.
Results
Four genes are associated with OS
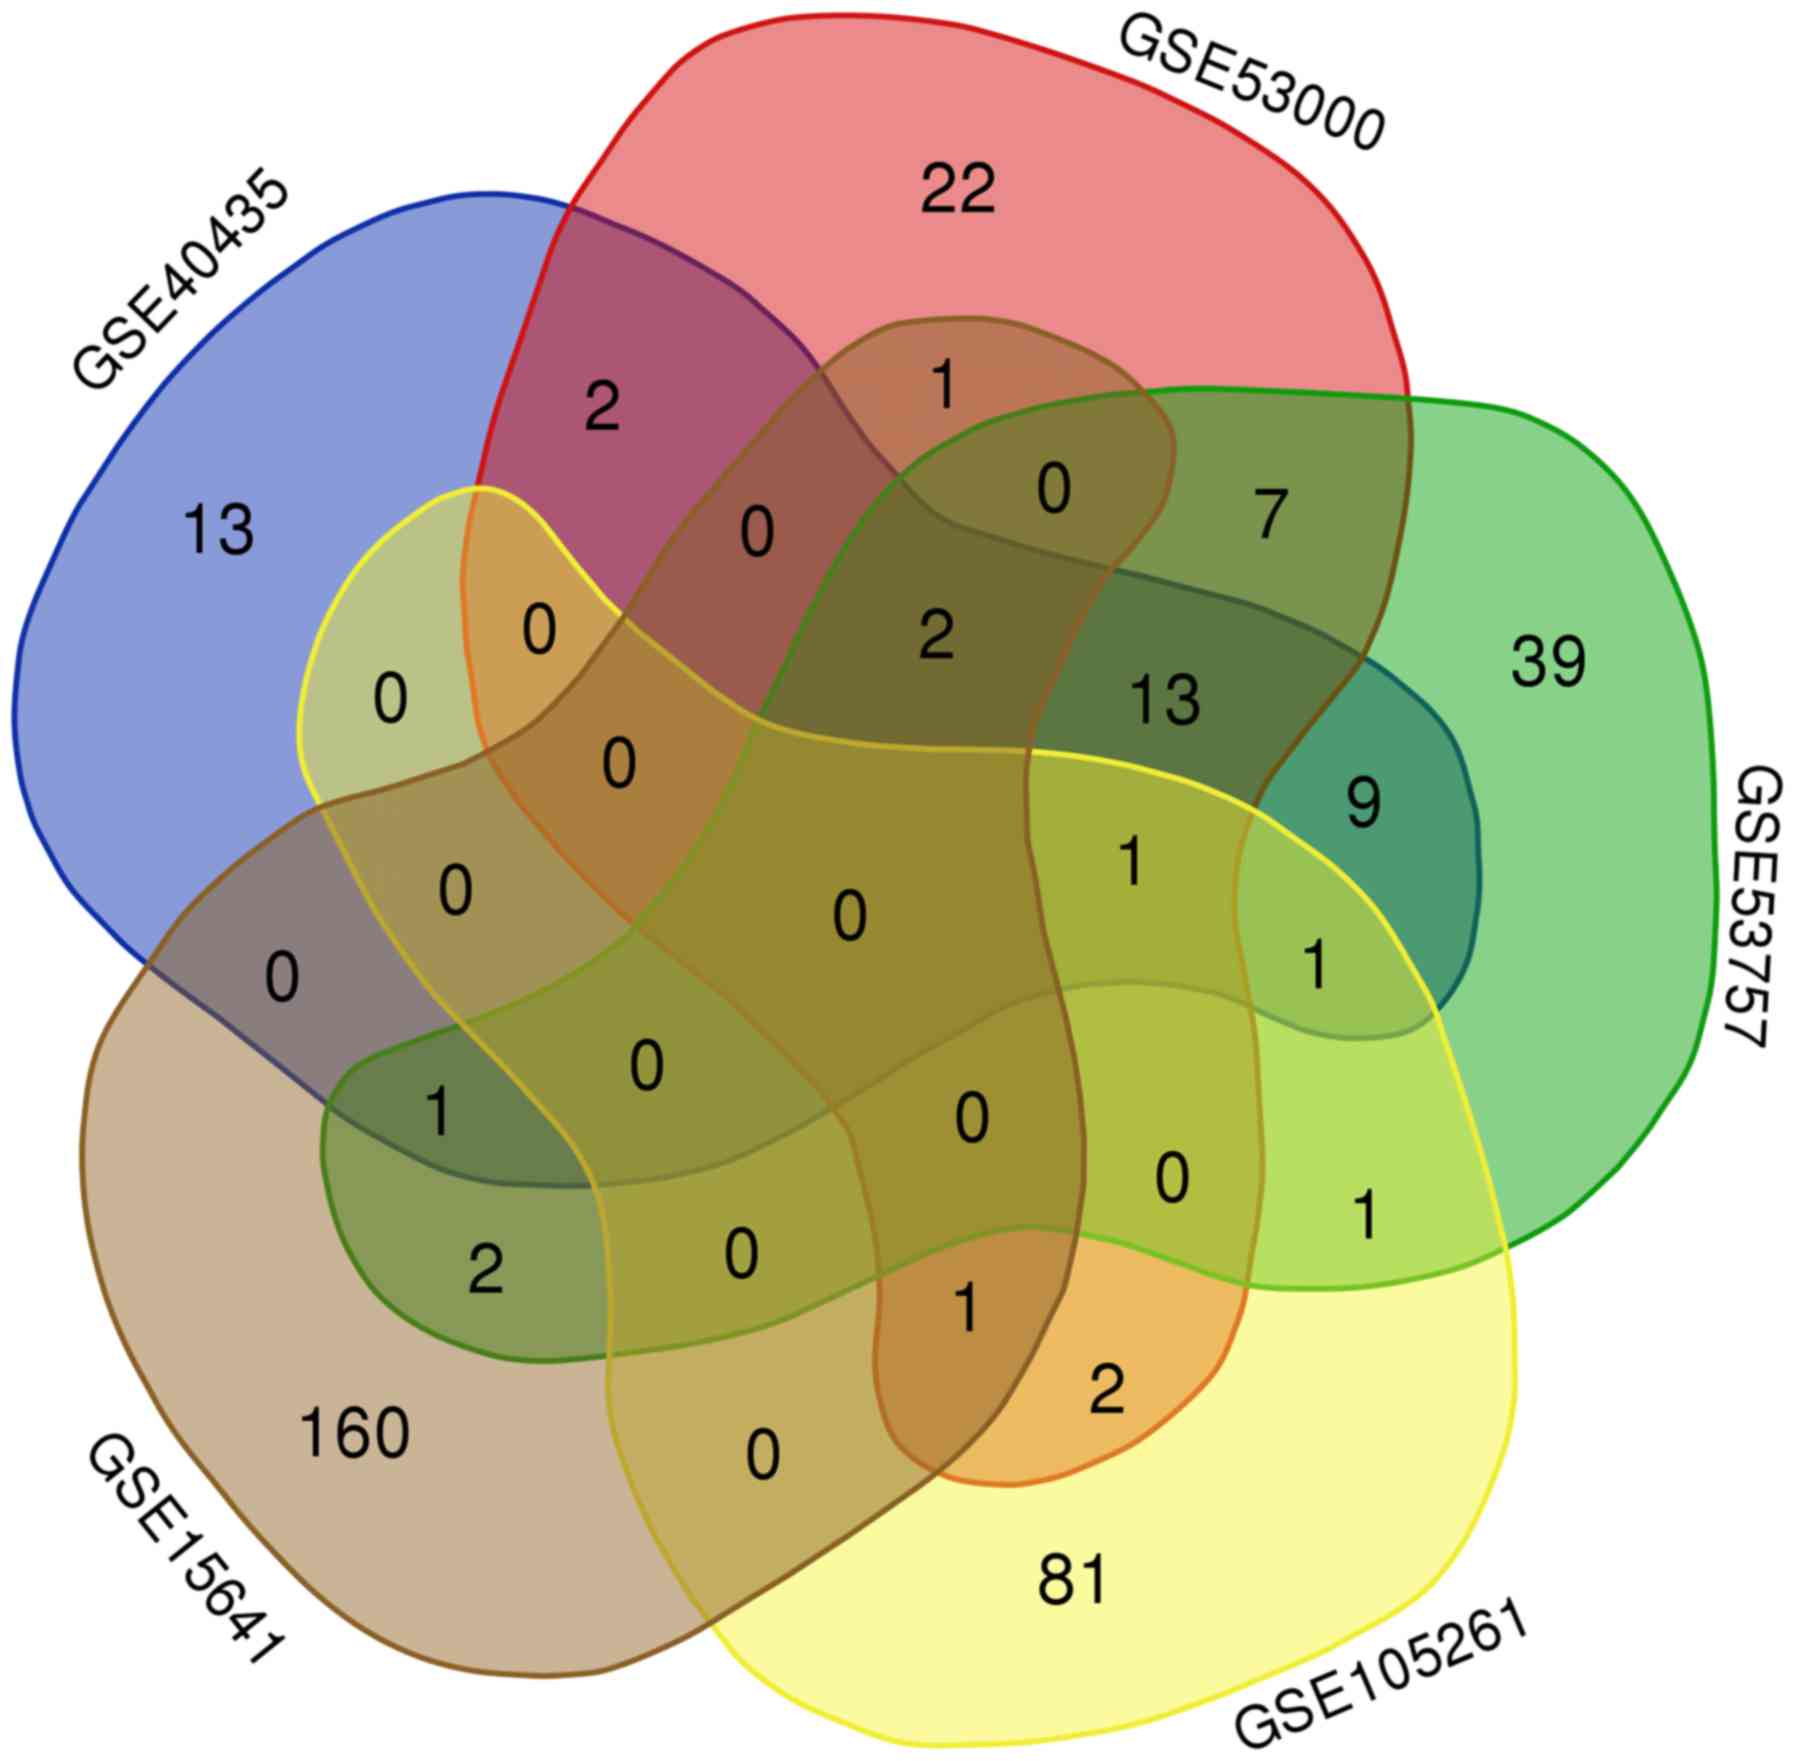
As shown by the Venn diagram in Fig. 1, 19 genes were commonly upregulated
in three of the five GEO microarray datasets. Survival analysis of
these genes based on the OncoLnc online database revealed that high
expression of TMSB10, ENO2 and NNMT indicated poor prognosis, while
high expression of ST8SIA4 indicated a favorable outcome (Fig. 2A-D). However, the expression levels
of the other 15 genes, namely CAV1, ANGPTL4, BHLHE41, CA9, CAV2,
EGLN3, HILPDA, IGFBP3, NDUFA4L2, PRKCDBP, SAP30, SCARB1, SLC15A4,
SLC16A3 and SPAG4 were not associated with OS in ccRCC (Fig. 2E-S).
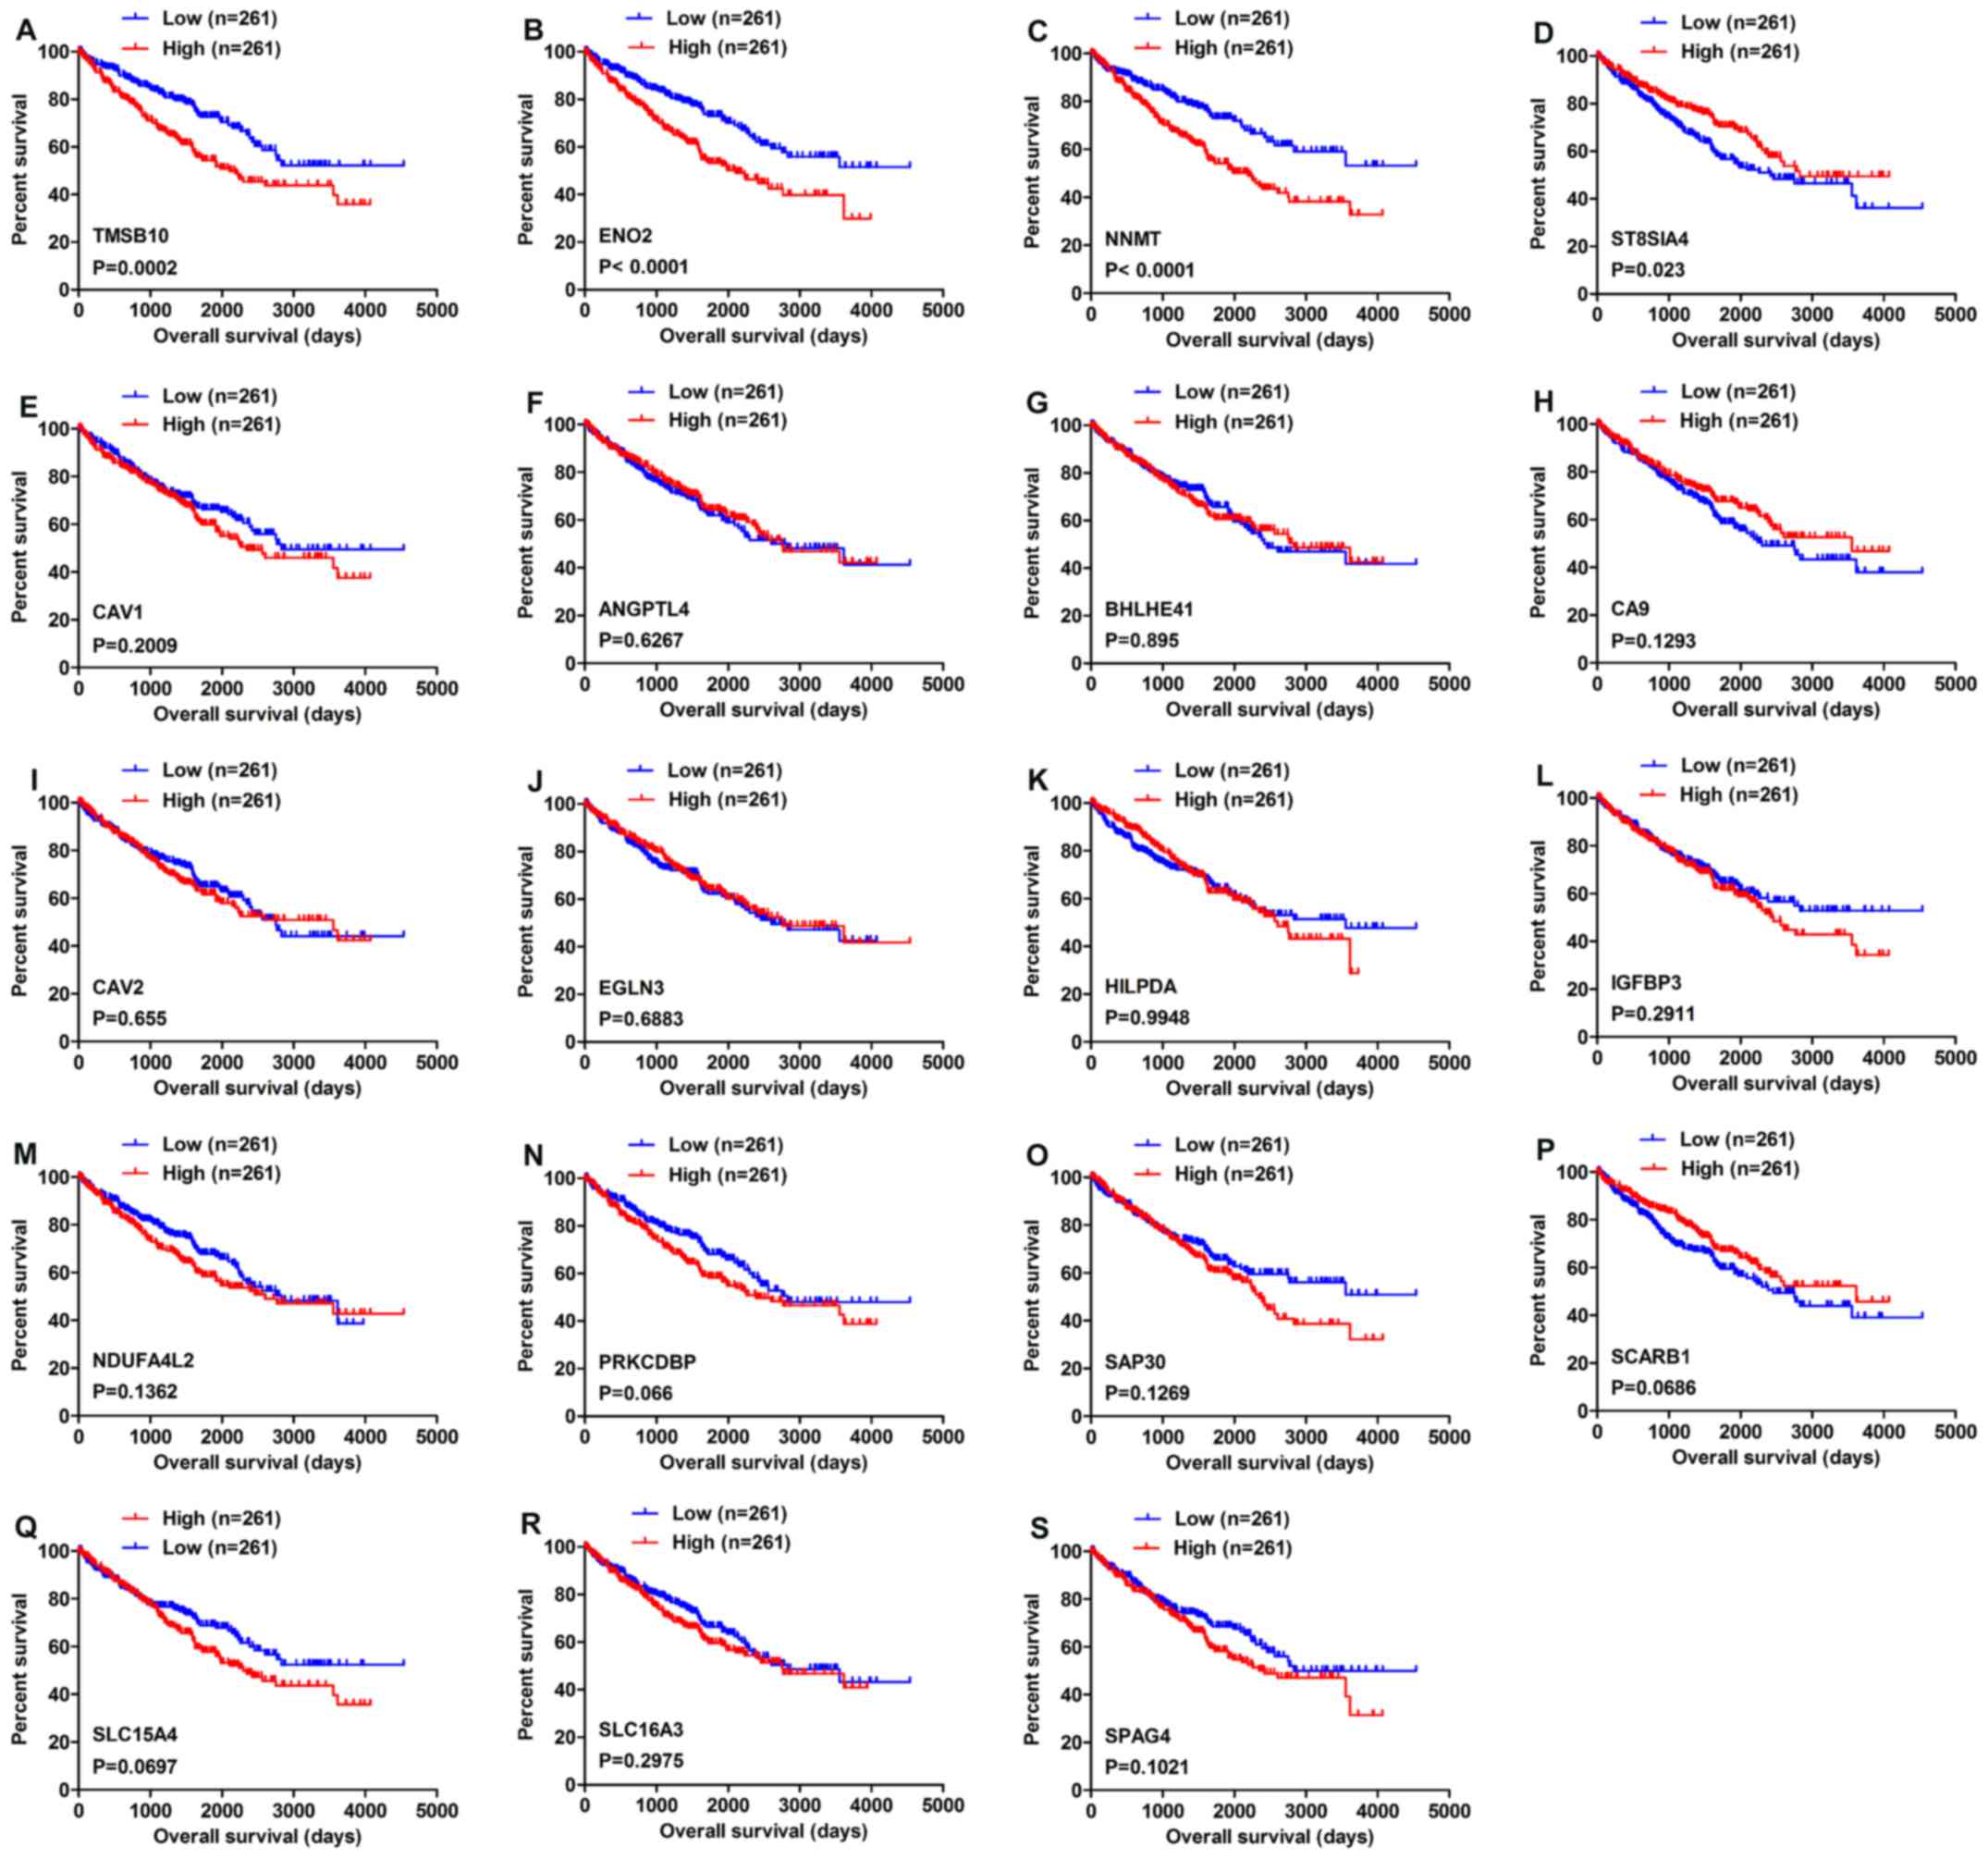 | Figure 2Overall survival analysis of 19
commonly upregulated genes conducted using the OncoLnc database.
(A) TMSB10, (B) ENO2, (C) NNMT, (D) ST8SIA4, (E) CAV1, (F) ANGPTL4,
(G) BHLHE41, (H) CA9, (I) CAV2, (J) EGLN3, (K) HILPDA, (L) IGFBP3,
(M) NDUFA4L2, (N) PRKCDBP, (O) SAP30, (P) SCARB1, (Q) SLC15A4, (R)
SLC16A3 and (S) SPAG4. P<0.05 was regarded as statistically
significant by log-rank test. Blue lines indicate low gene
expression, while red lines represent high gene expression. |
TMSB10 is upregulated and associated with
various clinicopathological parameters in ccRCC tissues
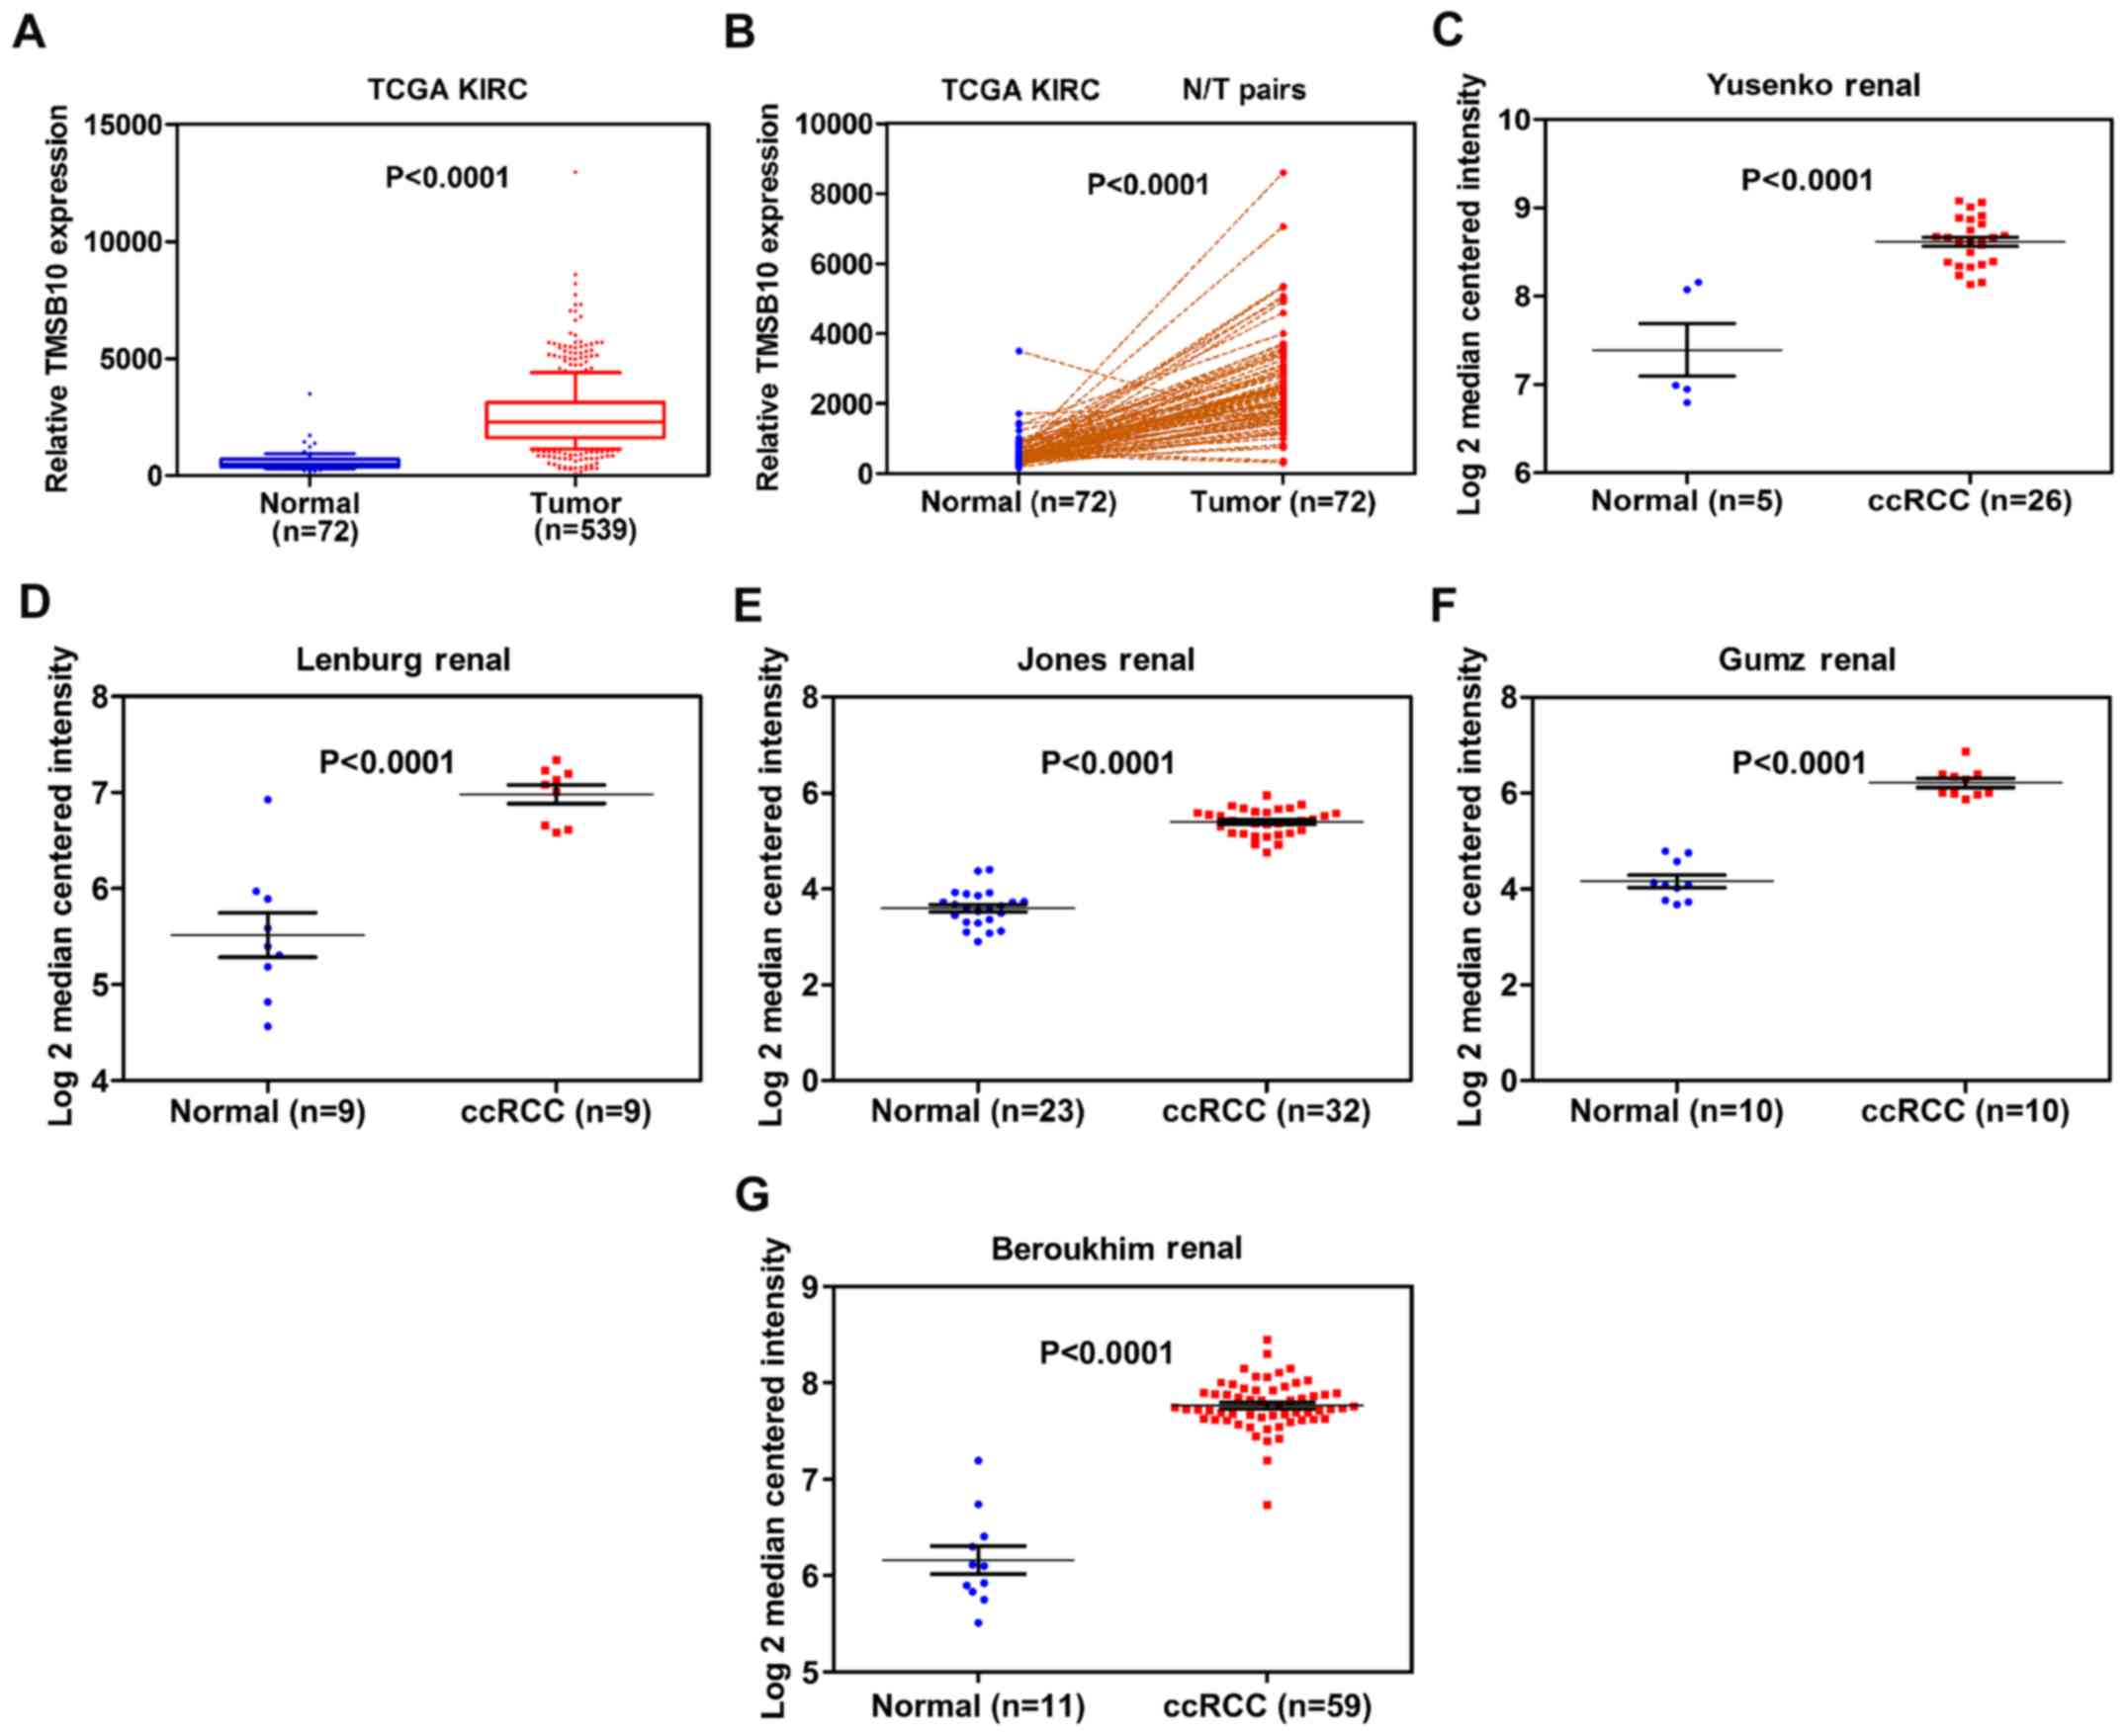
To fully investigate the role of TMSB10 in ccRCC
development, the association between the mRNA expression level of
TMSB10 and various clinicopathological factors was explored. The
TMSB10 expression level was found to be significantly higher in
tumor tissues than in normal tissues from the TCGA database
(Fig. 3A and B). To further verify
these findings, TMSB10 expression levels in patients with ccRCC
were retrieved from the Oncomine database. Studies by Yusenko et
al (30), Lenburg et al
(31), Jones et al
(32), Gumz et al (33) and Beroukhim et al (34) showed consistent results (Fig. 3C-G). Subsequently, the present
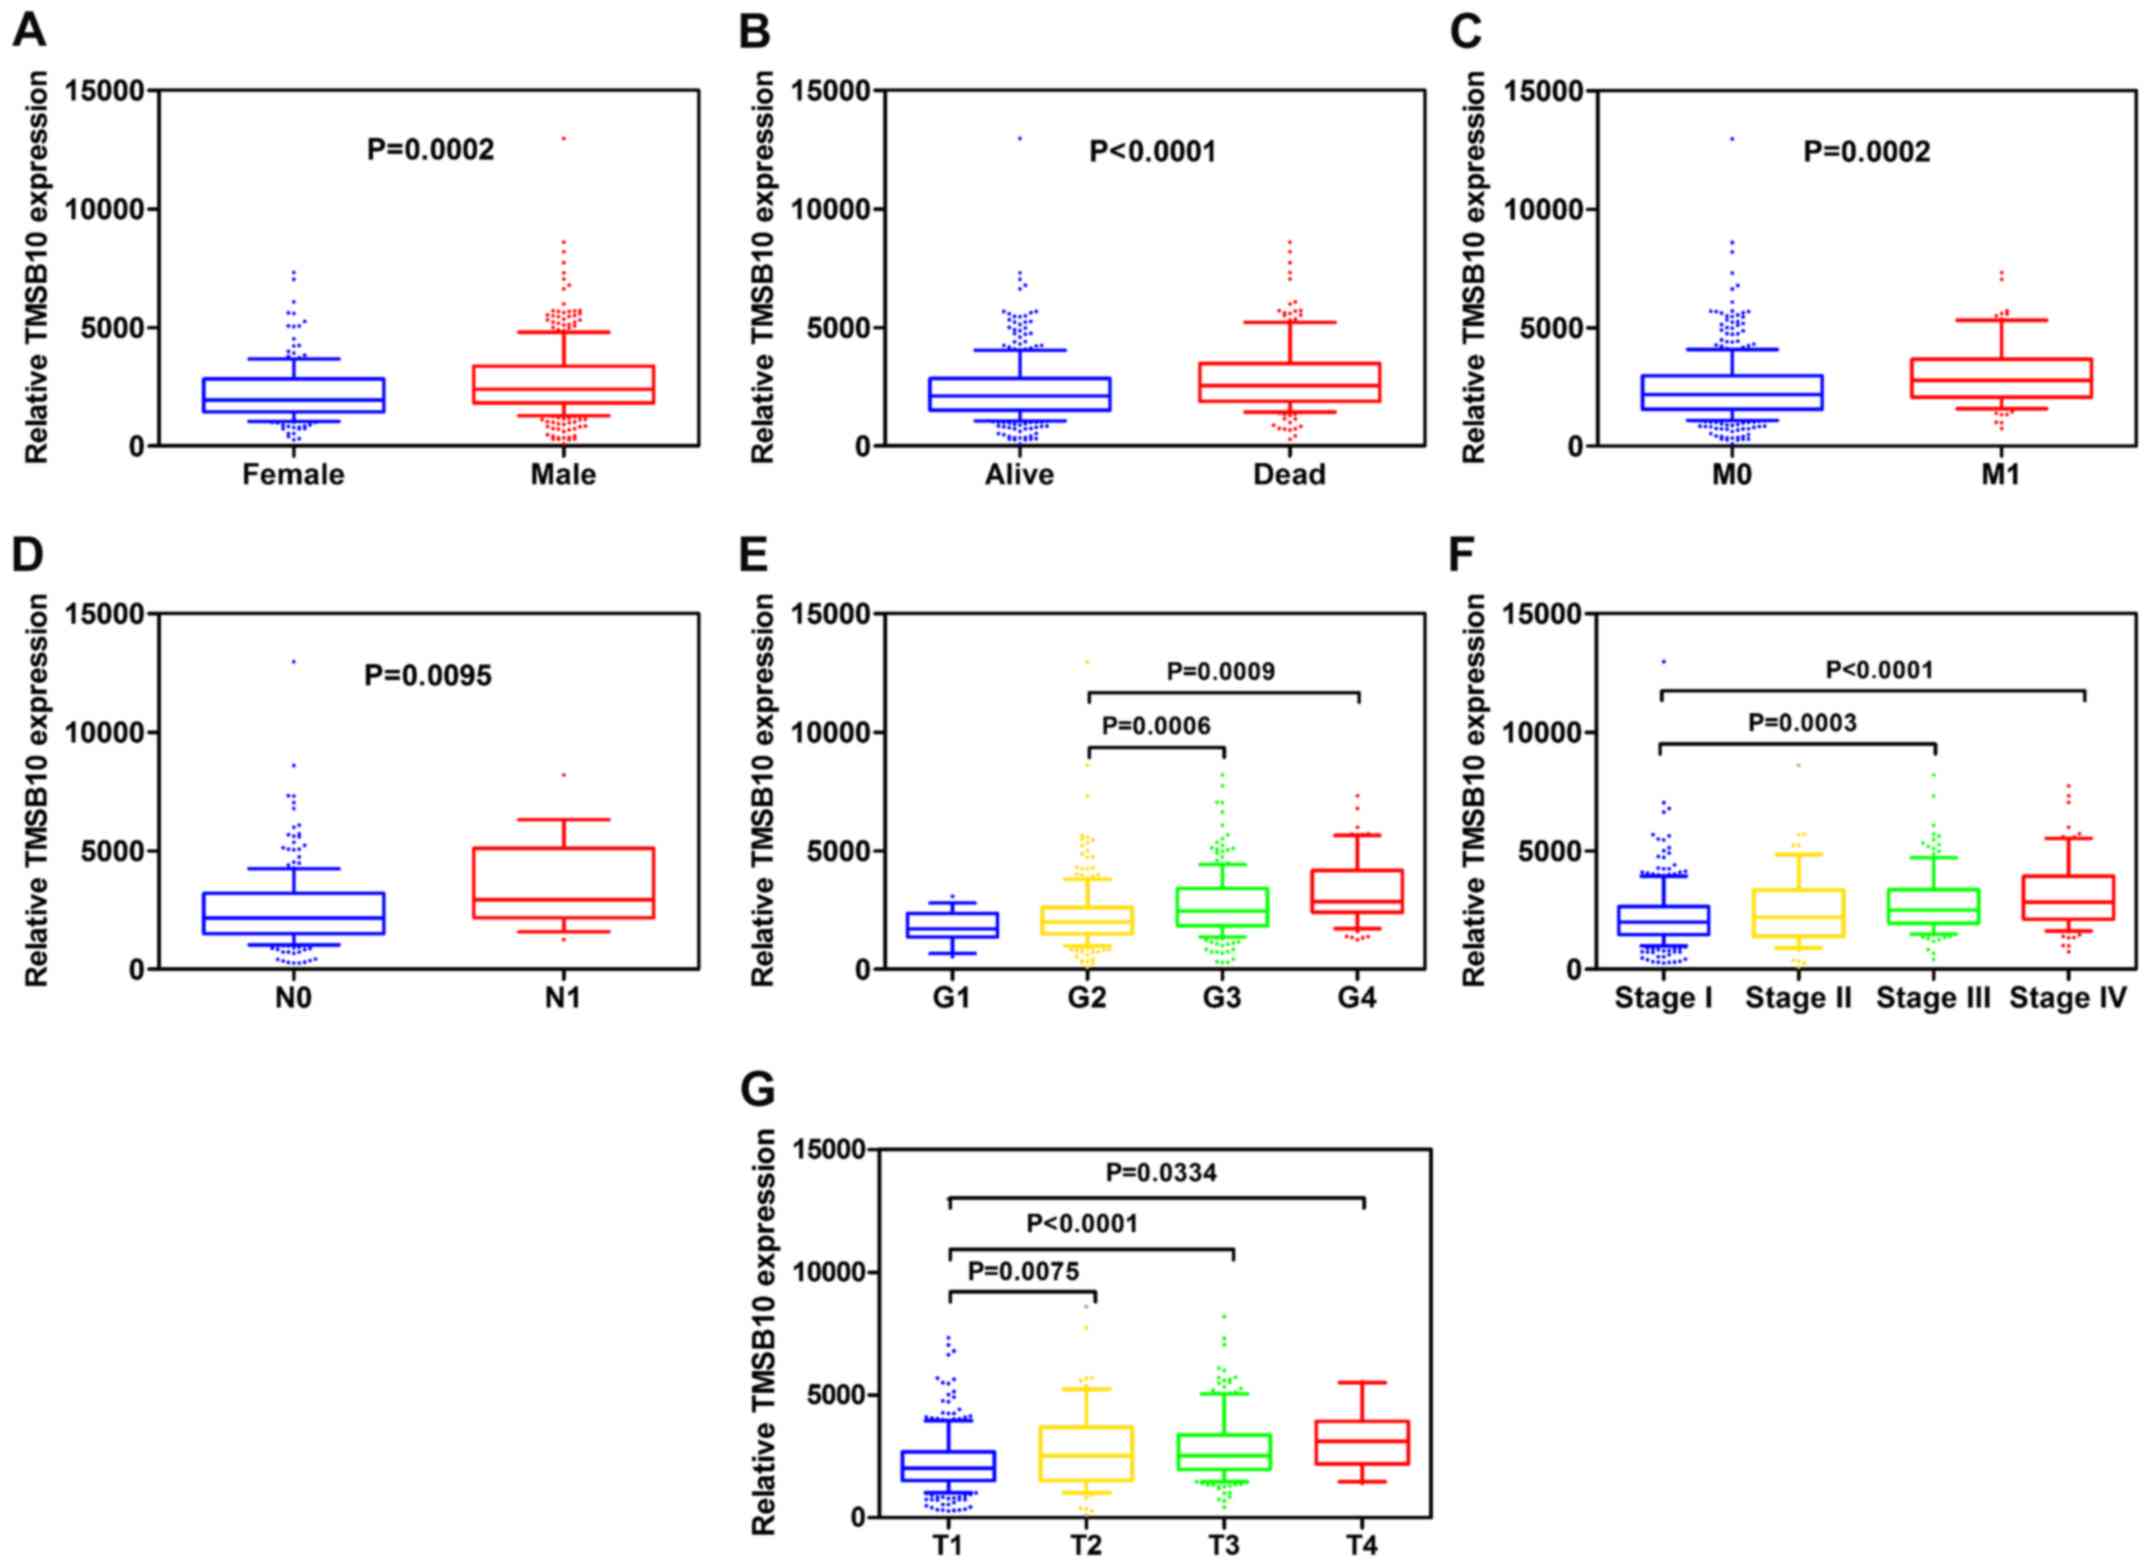
study analyzed the association of the TMSB10 expression levels of
530 cases from the TCGA database with different clinicopathological
parameters. Pearson's χ2 test revealed that the
expression level of TMSB10 was significantly associated with
patients' sex, histological grade, TNM stage, T stage, N stage, M
stage and vital status (Table I).
Furthermore, subgroup analysis confirmed that higher expression
levels of TMSB10 were significantly associated with higher
pathological TNM stage, higher tumor T stage, distant metastasis,
lymph node metastasis, and higher histological grade in ccRCC
(Fig. 4). However, no association
was observed between TMSB10 expression levels and patients' age
(data not shown). These results demonstrated that TMSB10 was
overex-pressed and closely associated with sex, G grade, TNM stage,
T stage, N stage, M stage and vital status in ccRCC. To further
support the association between TMSB10 expression level and
clinicopathological factors, verification was conducted in the GEO
database. In GSE53757 (23), the
expression of TMSB10 increased with increasing tumor stage, and in
GSE40435 (25), the expression of
TMSB10 increased with increasing histological grade (Fig. S1). However, future multi-center
studies with a larger sample size are required to verify the
results.
 | Table IAssociation between TMSB10 mRNA
expression and clinicopathological parameters of patients with
clear cell renal cell carcinoma. |
Table I
Association between TMSB10 mRNA
expression and clinicopathological parameters of patients with
clear cell renal cell carcinoma.
| Parameters | Number | TMSBIOmRNA
expression
| P value |
|---|
| Low (n=265) | High (n=265) |
|---|
| Age (years) | | | | 0.794 |
| <60 | 245 | 121 | 124 | |
| ≥60 | 285 | 144 | 141 | |
| Sex | | | | 0.004 |
| Female | 1S6 | 109 | 77 | |
| Male | 344 | 156 | 188 | |
| Histological
grade | | | | <0.001 |
| G1+G2 | 249 | 160 | 89 | |
| G3+G4 | 281 | 105 | 176 | |
| Stage | | | | <0.001 |
| i+n | 322 | 189 | 133 | |
| m+rv | 208 | 76 | 132 | |
| T stage | | | | <0.001 |
| T1+T2 | 340 | 193 | 147 | |
| T3+T4 | 190 | 72 | 118 | |
| N* stage | | | | |
| NO | 514 | 261 | 253 | 0.042 |
| N1 | 16 | 4 | 12 | |
| M stage | | | | <0.001 |
| MO | 452 | 240 | 212 | |
| Ml | 78 | 24 | 54 | |
| Vital status | | | | <0.001 |
| Dead | 1W | 59 | 105 | |
| Alive | 366 | 206 | 160 | |
Upregulation of TMSB10 expression
indicates a poor clinical outcome
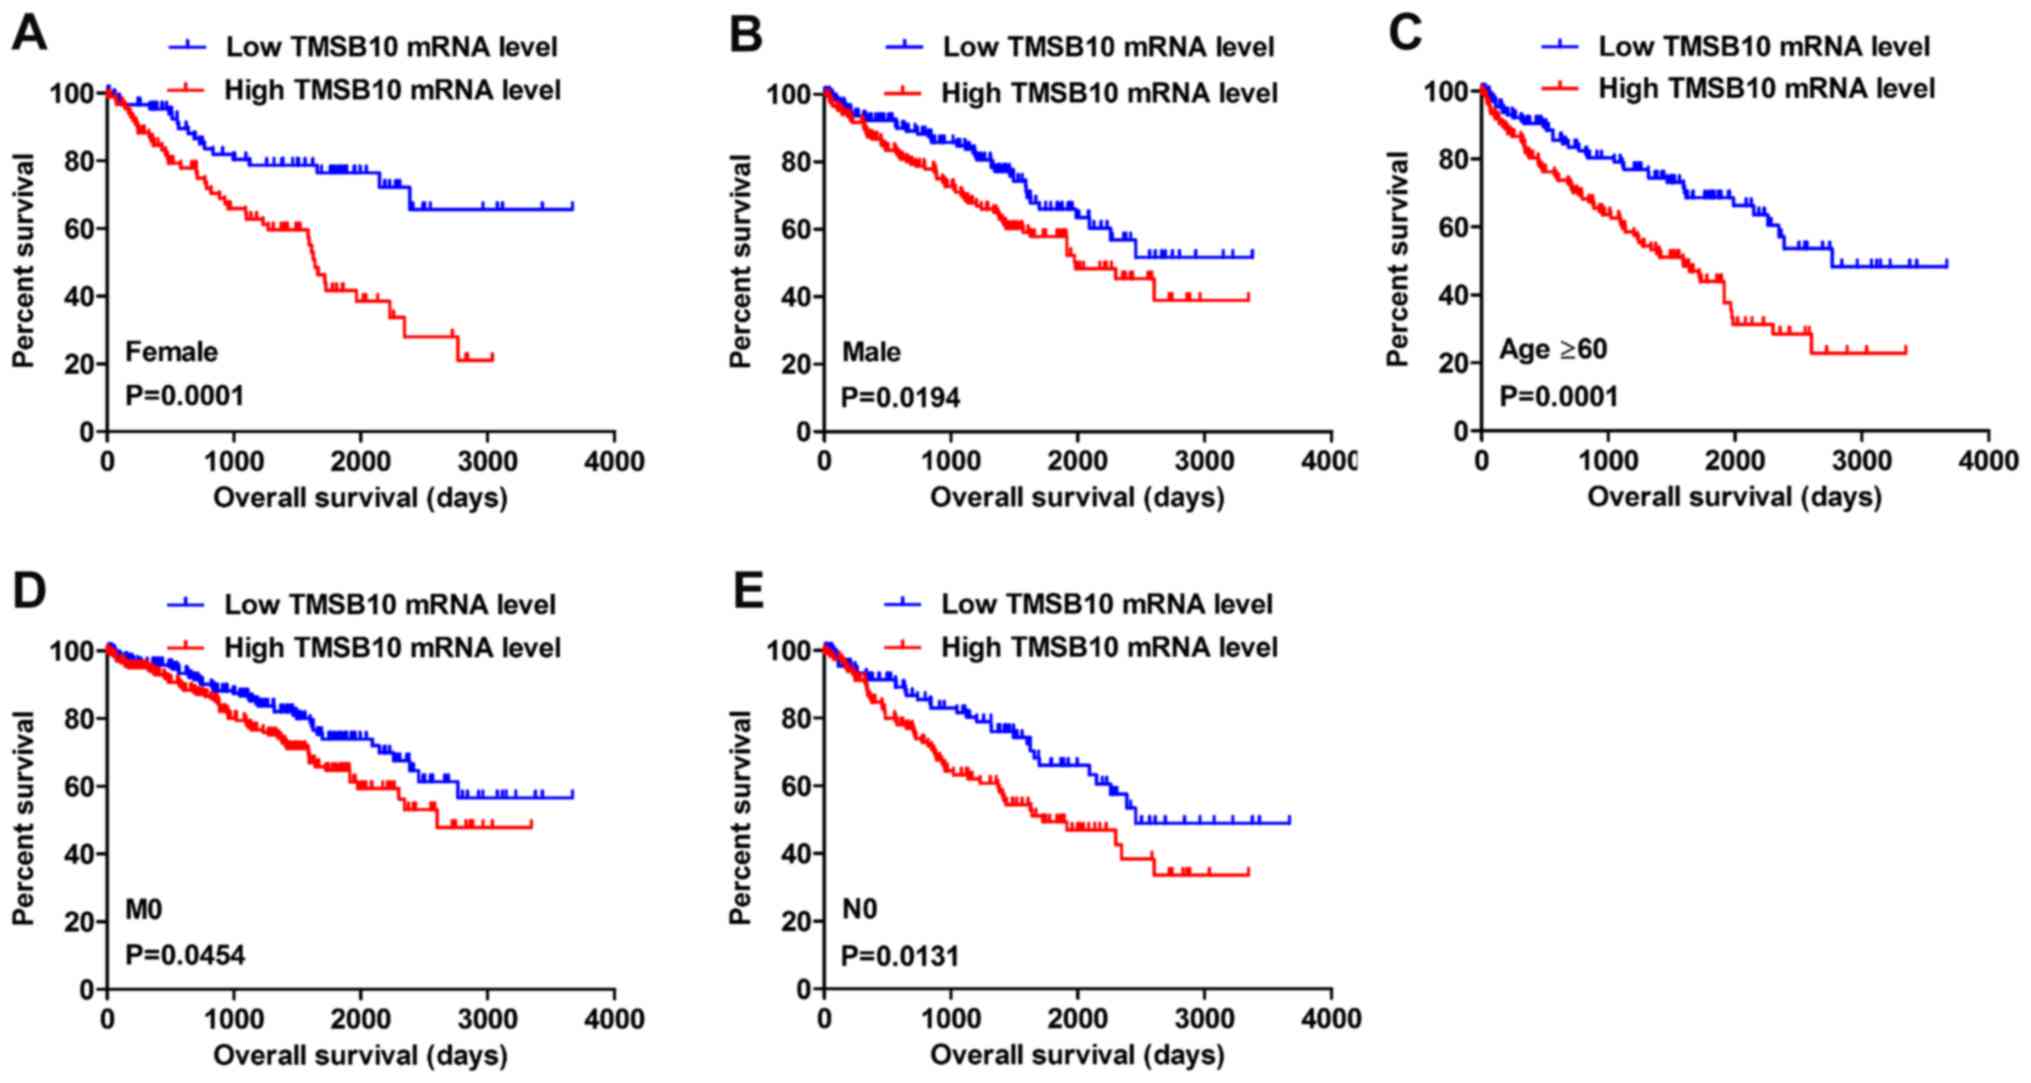
Kaplan-Meier survival analysis and a log-rank test
were applied to determine the OS and DFS in different subgroups of
patients according to their TMSB10 expression level. The results
demonstrated that TMSB10 may be a potential prognostic biomarker
for patients with the following characteristics: Female (Fig. 5A), male (Fig. 5B), age ≥60 years (Fig. 5C), M0 stage (Fig. 5D) and N0 stage (Fig. 5E). Furthermore, the present study
analyzed the relationship between TMSB10 expression and DFS. The
results for low and high TMSB10 expression relative to median
expression indicated that patients with low TMSB10 expression
tended to have a more favorable DFS compared with those with high
TMSB10 expression (Fig. 6A).
Moreover, DFS analysis in subgroups of patients with ccRCC revealed
that high expression of TMSB10 was a useful prognostic indicator
for ccRCC patients with the following features: Age <60 or ≥60
years (Fig. 6B and C), female
(Fig. 6D) or male (Fig. 6E), G1+G2 grade (Fig. 6F), G3+G4 grade (Fig. 6G), N0 stage (Fig. 6H), M0 stage (Fig. 6I), T1+T2 stage (Fig. 6J) and stage I+II (Fig. 6K).
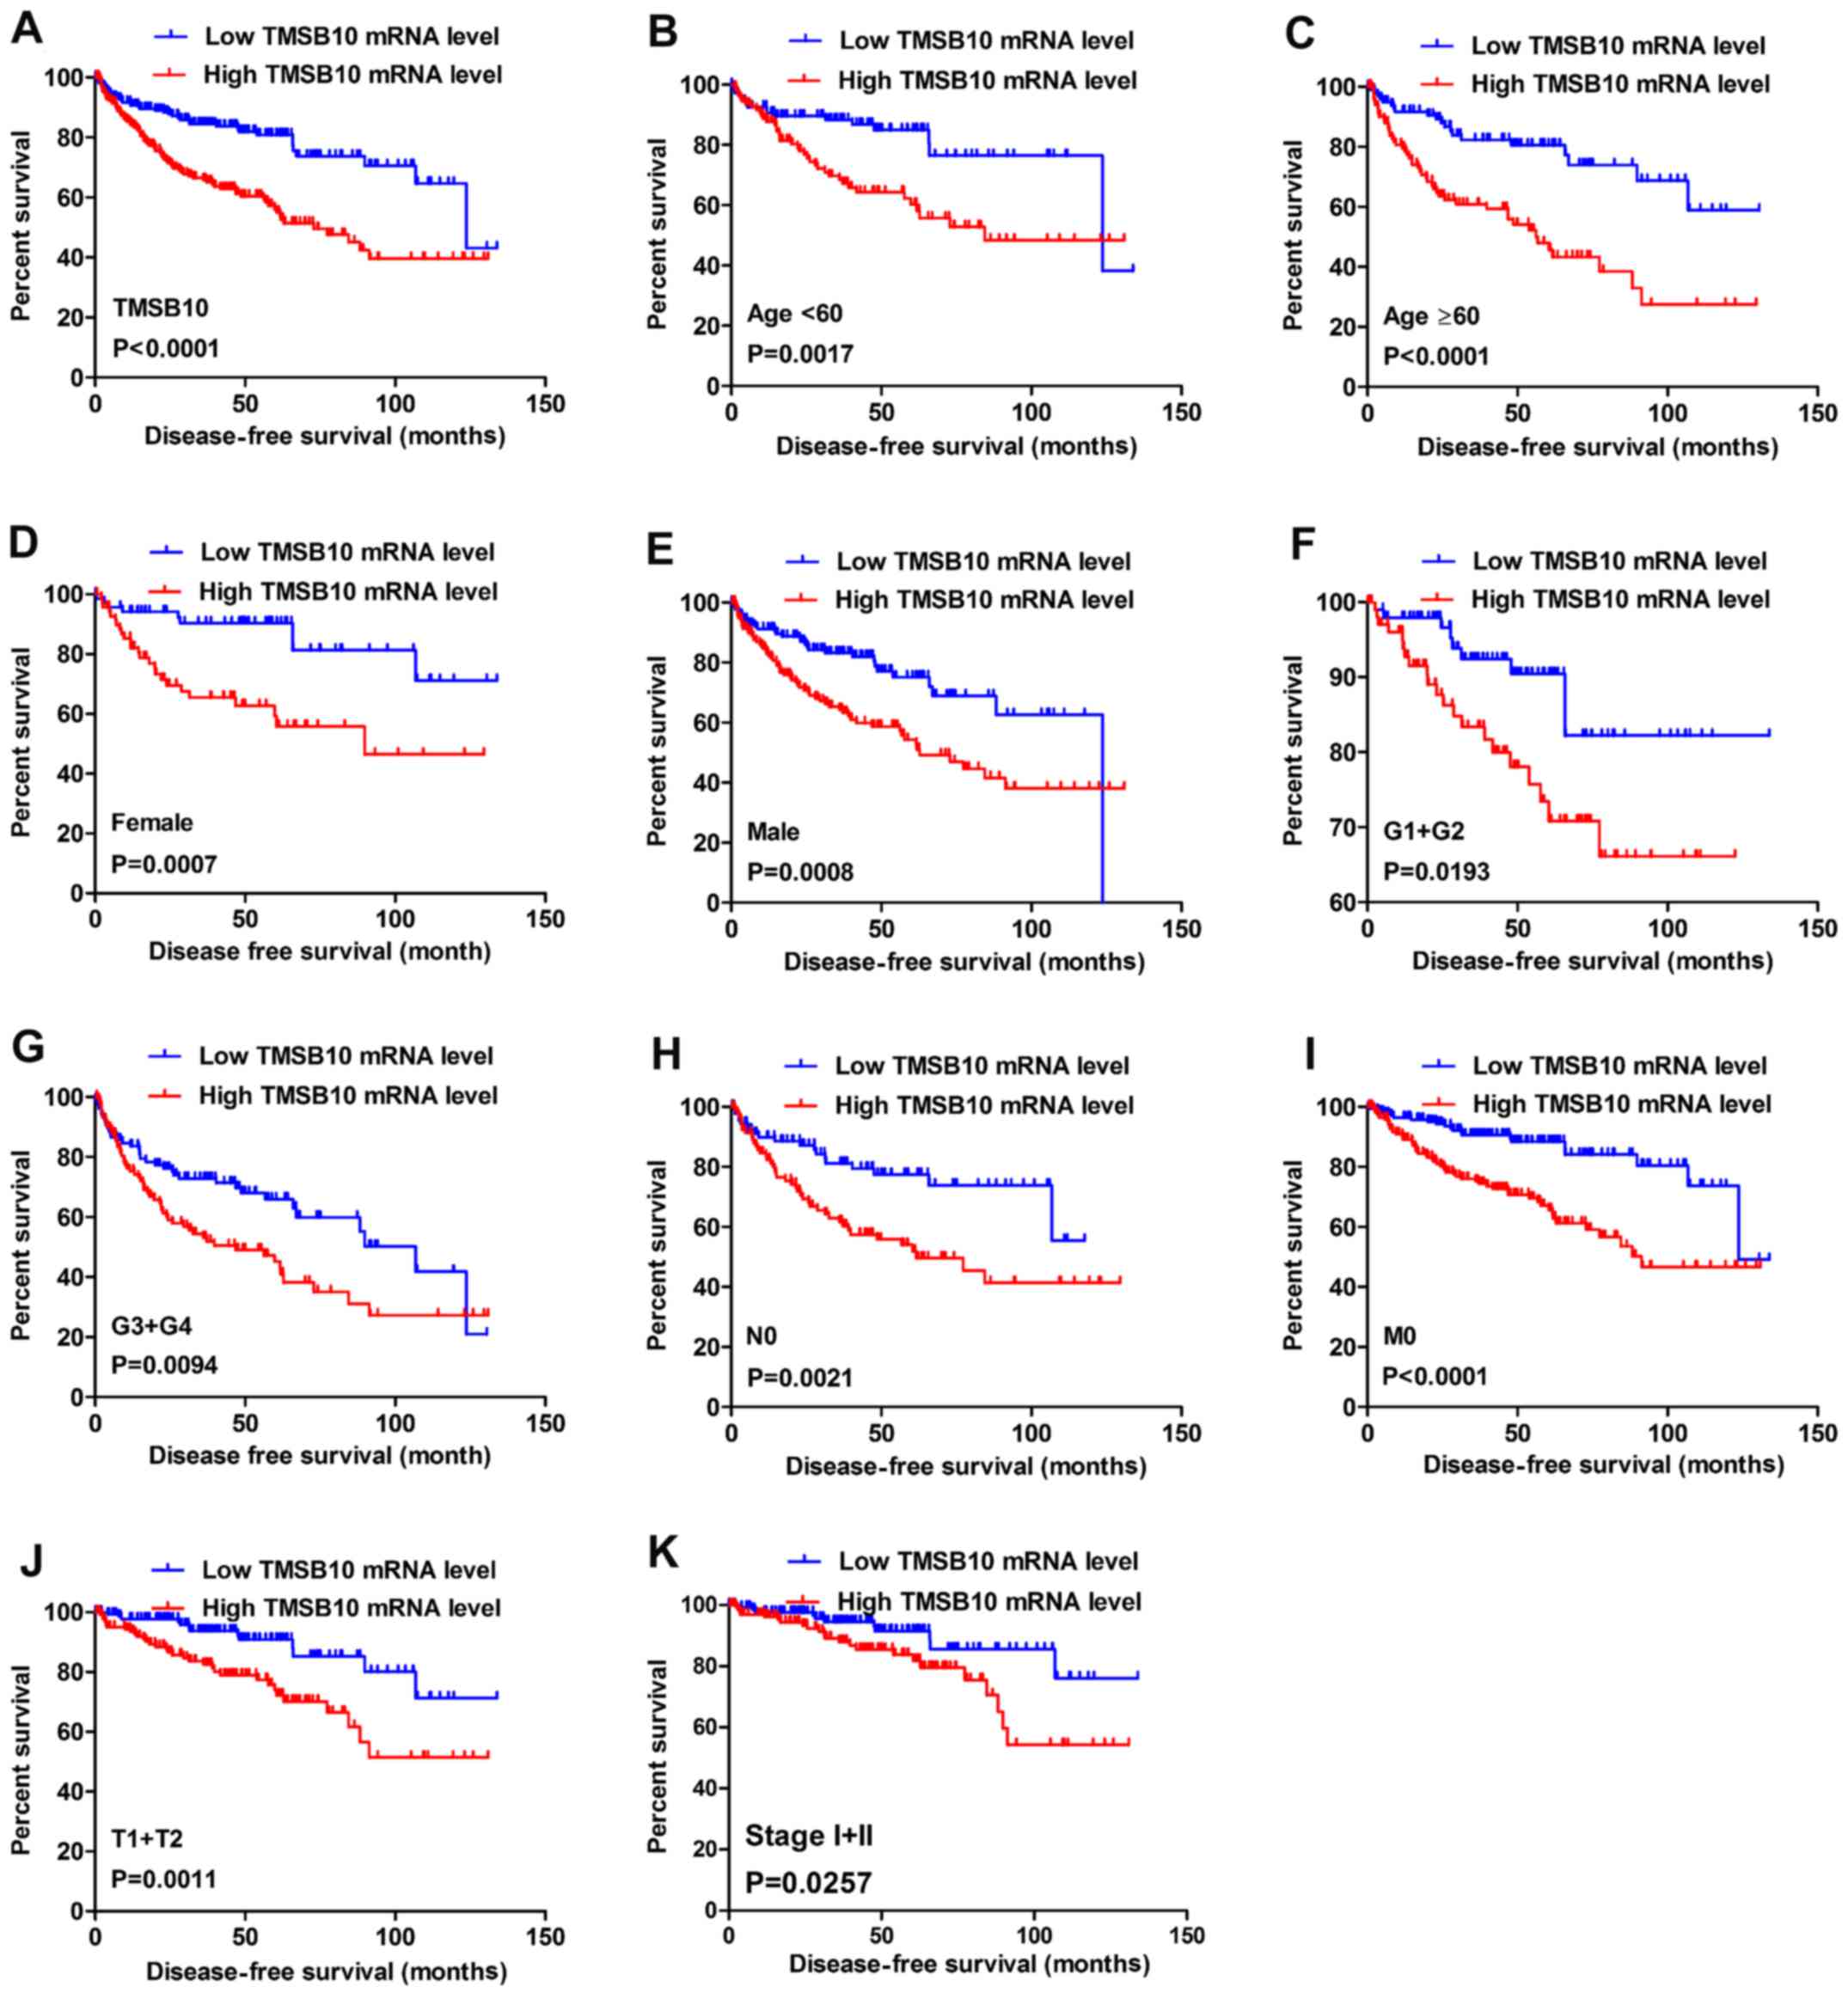 | Figure 6High TMSB10 mRNA expression predicts
poor DFS in patients with ccRCC. Patient samples from The Cancer
Genome Atlas were separated into two groups: Those with low TMSB10
expression and those with high TMSB10 expression. (A) DFS of
patients with ccRCC was associated with TMSB10 expression. DFS
subanalysis with regard to TMSB10 expression was preformed in
subgroups of patients with ccRCC. (B) age <60 years, (C) age ≥60
years, (D) female, (E) male, (F) G1+G2 grade, (G) G3+G4 grade, (H)
N0 stage, (I) M0 stage, (J) T1+T2 stage and (K) stage I+II. ccRCC,
clear cell renal cell carcinoma; DFS, disease-free survival;
TMSB10, thymosin β10. |
TMSB10 expression may serve as a valuable
diagnostic factor for patients with ccRCC
To investigate the association between TMSB10
expression and the diagnosis of patients with ccRCC, ROC curve
analysis of various clinicopathological factors was performed. The
results indicated that TMSB10 could adequately distinguish patients
with ccRCC with an AUC of 0.9543 (P<0.0001; Fig. 7A). Additionally, the TMSB10
expression level also exhibited diagnostic value for subgroups of
patients with ccRCC as follows: Alive vs. dead (AUC=0.6176,
P<0.0001; Fig. 7B), recurrence
vs. disease-free (AUC=0.6733, P<0.0001; Fig. 7C), M0 vs. M1 stage (AUC=0.6146,
P=0.00768; Fig. 7D), N0 vs. N1
stage (AUC=0.6943, P=0.0197; Fig.
7E), stage I+II vs. stage III+IV (AUC=0.6577, P<0.0001;
Fig. 7F), T1+T2 vs. T3+T4 stage
(AUC=0.6251, P<0.0001; Fig. 7G)
and G1+G2 vs. G3+G4 grade (AUC=0.6642, P<0.0001; Fig. 7H).
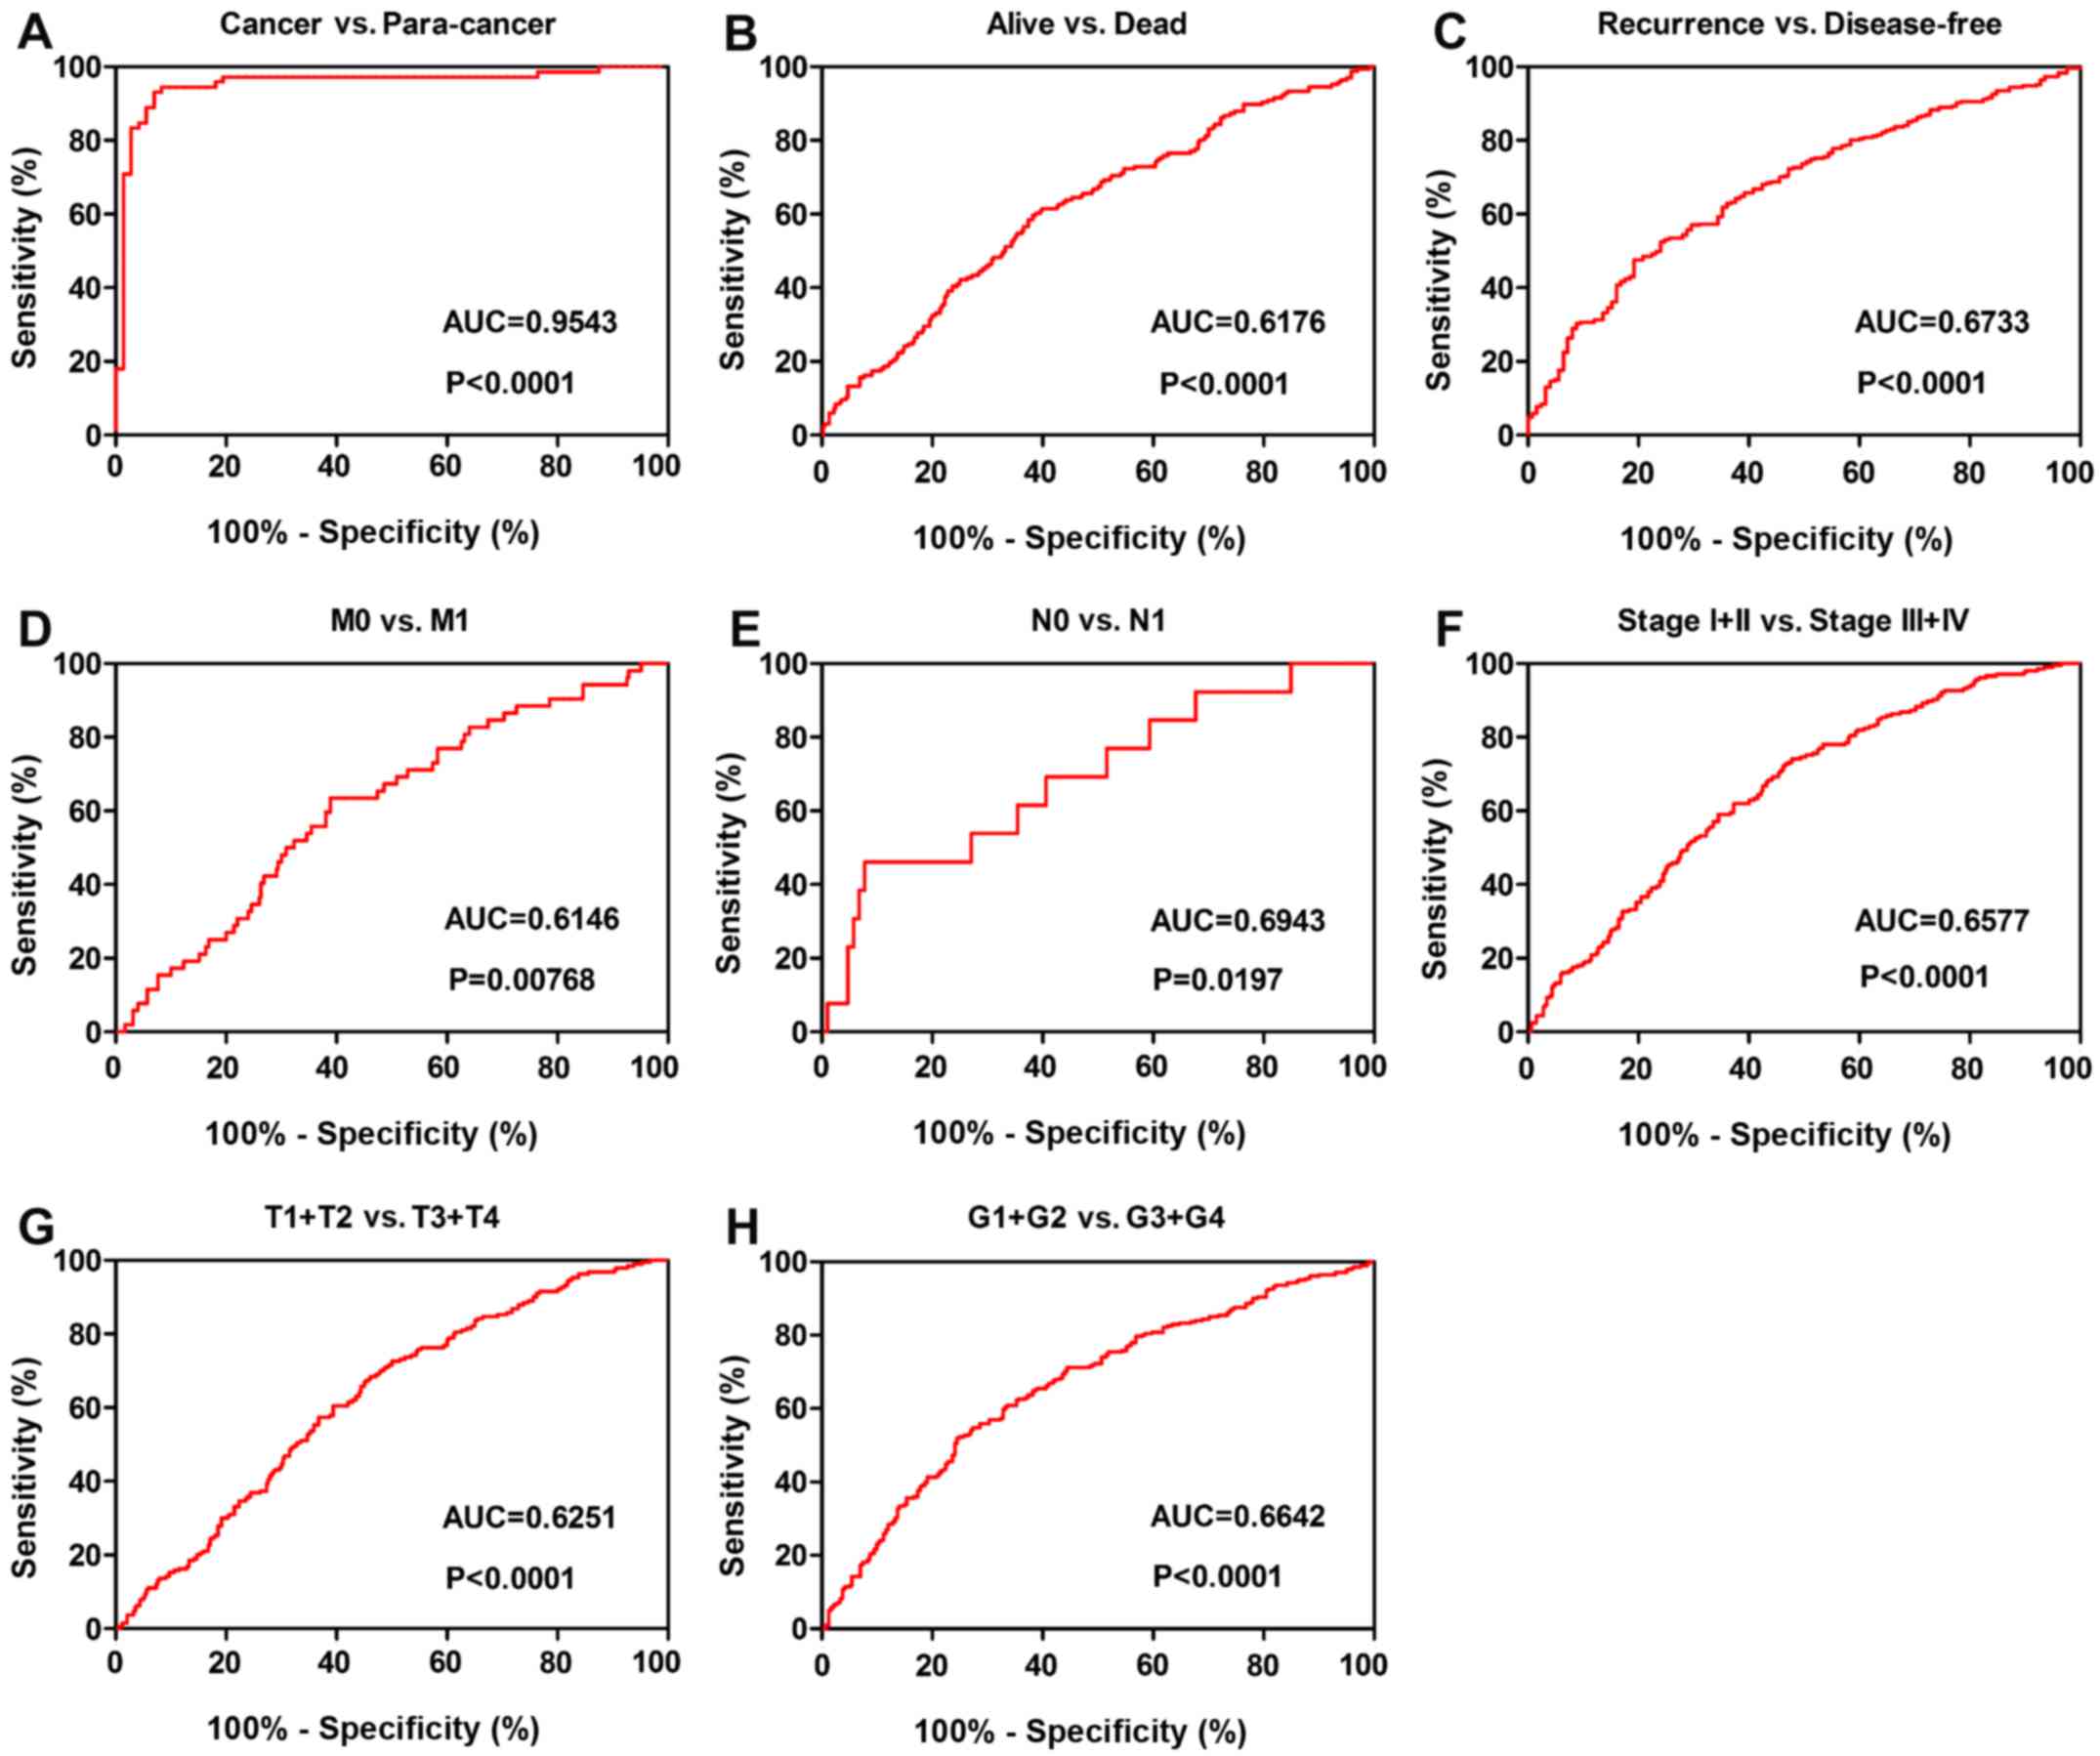 | Figure 7TMSB10 expression may act as a
diagnostic biomarker in patients with ccRCC. (A) TMSB10 effectively
distinguished between ccRCC and paired normal tissues. ROC curve
subanalysis was conducted regarding the following subgroups of
patients with ccRCC: (B) Vital status, (C) DFS status, (D) distant
metastases, (E) lymph node metastasis, (F) TNM stage, (G) T stage
and (H) G grade. ccRCC, clear cell renal cell carcinoma; AUC, area
under the curve; ROC, receiver operating characteristic; DFS,
disease-free survival; TMSB10, thymosin β10. |
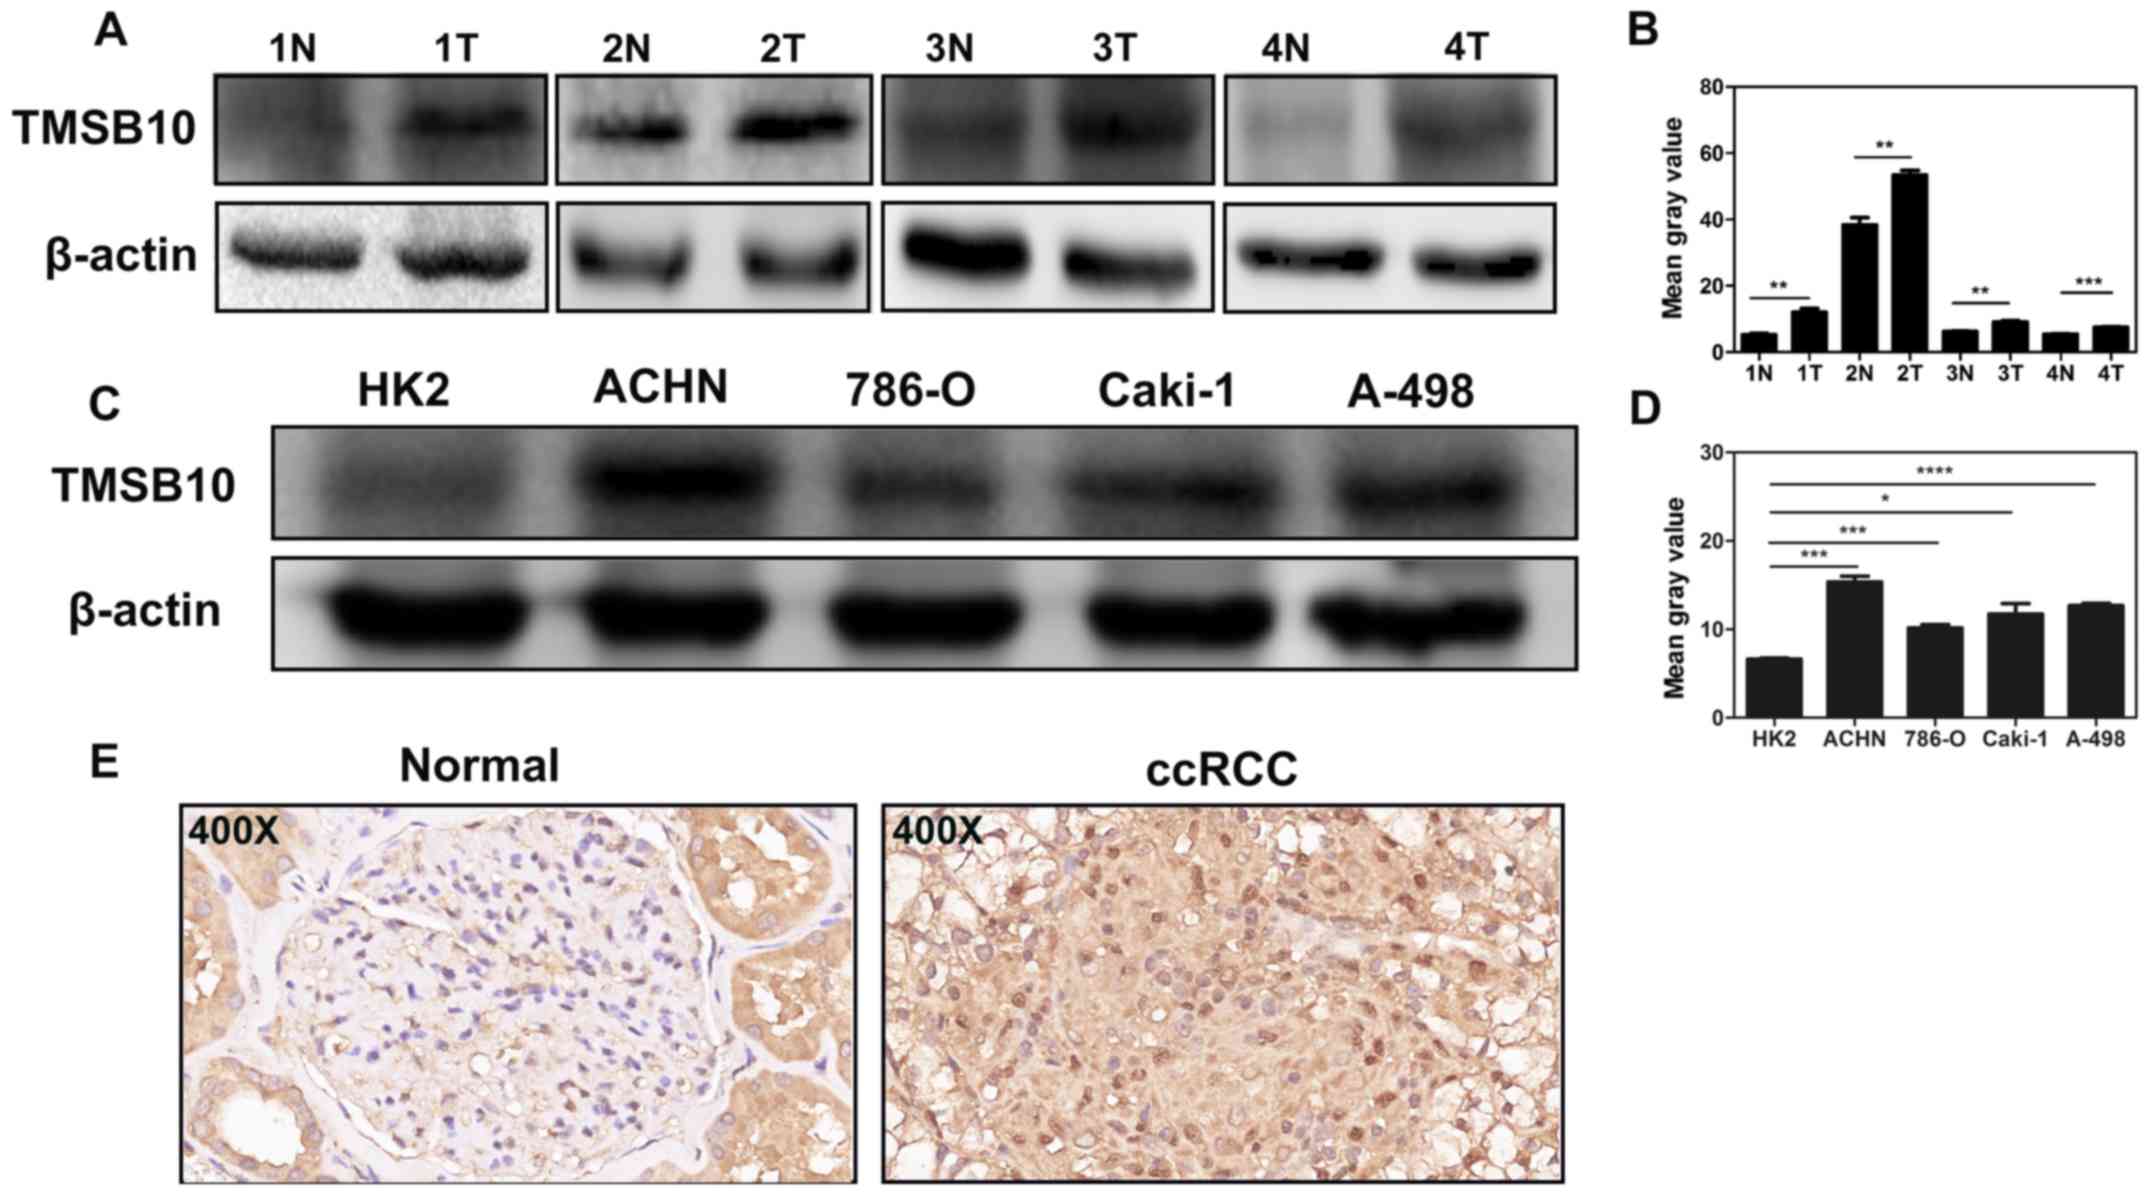
Overexpression of TMSB10 is further
validated in ccRCC cells and tissues
Western blotting analysis and IHC were conducted to
verify the results of public databases. Western blotting assays
revealed that the protein level of TMSB10 in tumor tissues was
upregulated compared with that in normal tissues (Fig. 8A), and the expression level in
ACHN, 786-O, Caki-1 and A-498 cells was elevated compared with that
in HK-2 cells (Fig. 8B). Moreover,
IHC analysis showed that TMSB10 was principally located at the
membranes of cancer cells, cytoplasm and renal tubular epithelial
cells, and the protein expression was distinctly detected in tumor
tissues (Fig. 8C).
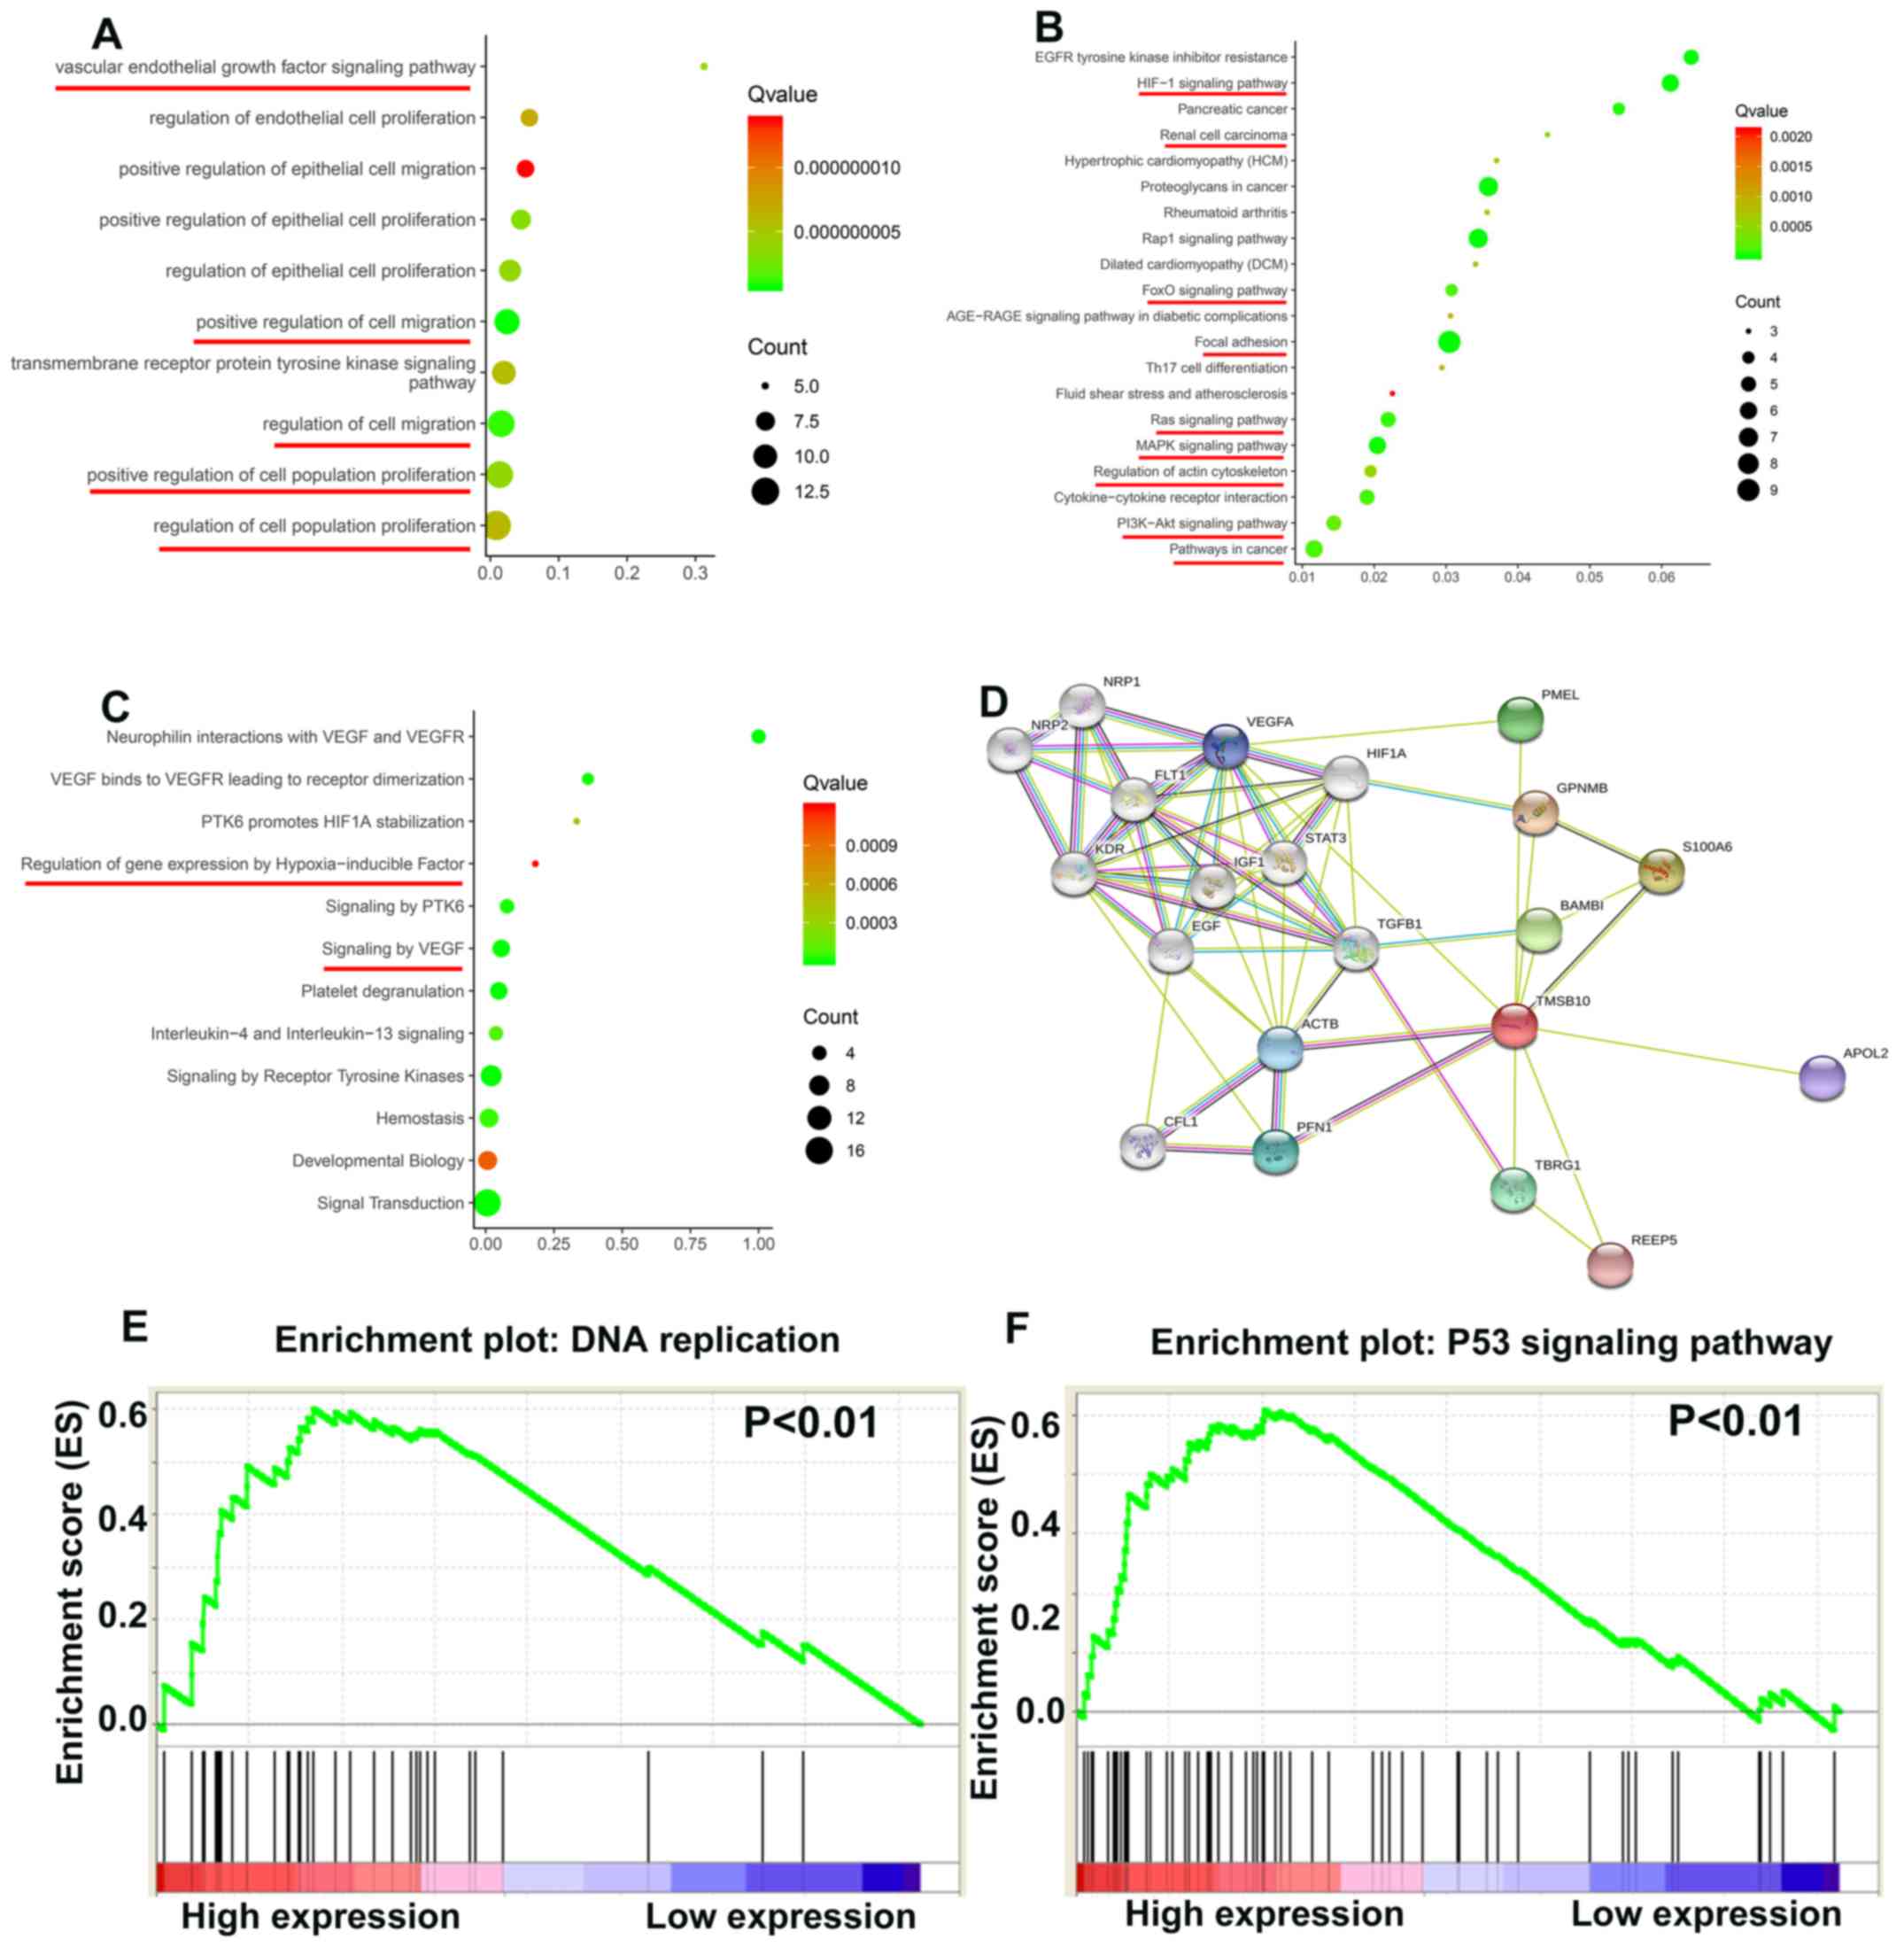
TMSB10 participates in various important
biological path- ways during ccRCC tumorigenesis
To elucidate how TMSB10 participates in ccRCC
pathogenesis, biological processes of TMSB10 were retrieved from
the STRING database and GSEA analysis was performed in the TCGA
database. The main Gene Ontology terms included 'vascular
endothelial growth factor signaling pathway', 'regulation of cell
population proliferation' and 'regulation of cell migration'
(Fig. 9A; Table II). The KEGG pathways primarily
consisted of 'HIF-1 signaling pathway', 'FoxO signaling pathway',
'focal adhesion', 'Ras signaling pathway', 'MAPK signaling
pathway', 'regulation of actin cytoskeleton', 'PI3K-Akt signaling
pathway' and 'pathways in cancer' (Fig. 9B; Table III). The Reactome terms
principally included 'regulation of gene expression by
hypoxia-inducible factor' and 'signaling by VEGF' (Fig. 9C; Table IV). The protein-protein
interaction network in Fig. 9D
indicated that many proteins interact with TMSB10. Moreover, the
GSEA results demonstrated that the activated gene sets 'DNA
replication' and 'P53 signaling pathway' were associated with
patients having a higher TMSB10 expression level (Fig. 9E and F).
| Table IIBiological processes of TMSB10
retrieved from the STRING database. |
Table II
Biological processes of TMSB10
retrieved from the STRING database.
| Term ED | Term
description | Observed gene
count | Background gene
count | FDR | Matching
proteins |
|---|
| 00:0030335 | Positive regulation
of cell migration | 11 | 452 |
7.02×10⁻¹⁰ | EGF. FLIT. GPNMB.
HIF1A. IGF1. NRP1, NRP2.PFN1. TGFB1. KDR. VEGFA |
| 00:0030334 | Regulation of cell
migration | 12 | 753 |
1.06×10⁻⁹ | EGF. FLT1, GPNMB.
MF1A. IGF1.NRP1.NRP2.PFNT. KDR. STAT3. TGFB 1. VEGFA |
| 00:0050678 | Regulation of
epithelial cell proliferation | 9 | 311 |
3.90×10⁻⁹ | FLT1.HIF1A. IGF1.
KDR. NRP1. NRP2. STAT3. TGFB 1. VEGFA |
| 00:0042127 | Regulation of cell
population proliferation | 14 | 1.594 |
6.17×10⁻⁹ | BAMBI. EGF. FLT1.
GPNMB. H3F1A. IGF1. KDR. NRP1.NRP2, S100A6. STAT3, TBRG1.TGFB1.
VEGFA |
| 00:0050679 | Positive regulation
of epithelial cell proliferation | 8 | 178 |
3.20×10⁻⁹ | H3F1A. IGF1. KDR.
NRP1.NRP2, STAT3. TGFB 1. VEGFA |
| 00:0038084 | Vascular
endothelial growth factor signaling pathway | 5 | 16 |
3.90×10⁻⁹ | FLU. KDR.
NRP1.NRP2. VEGFA |
| 00:0001936 | Regulation of
endothelial cell proliferation | 7 | 122 |
7.05×10⁻⁹ | FLT1.HCF1A. KDR.
NRP1. NRP2. STAT3. VEGFA |
| 00:0010634 | Positive regulation
of epithelial cell migration | 7 | 136 |
1.37×10⁻⁹ | H3F1A. KDR.
NRP1.NRP2. PFN1. TGFB 1. VEGFA |
| 00:0008284 | Positive regulation
of cell population proliferation | 12 | 878 |
3.90×10⁻⁹ | BAMBI. EGF. FLT1.
HIF1A. IGF1. S100A6. NRP1. NRP2. STAT3. TGFB1. KDR. VEGFA |
| 00:0007169 | Transmembrane
receptor protein tyrosine kinase signaling pathway | 10 | 499 |
5.81×10⁻⁹ | ACTB. EGF. FLT1.
IGF1. STAT3. TGFB 1. VEGFA. NRP1. KDR. NRP2 |
| Table IIIKEGG pathways of TMSB10 retrieved
from the STRING database. |
Table III
KEGG pathways of TMSB10 retrieved
from the STRING database.
| Term ED | Term
description | Observed gene
count | Background gene
count | FDR | Matching
proteins |
|---|
| hsa04015 | Rapl signaling
pathway | 7 | 203 |
1.04×l0−7 | ACTB, EGF, FLT1,
IGF1, KDR, PFNT, VEGFA |
| hsa04066 | HIF-1 signaling
pathway | 6 | 98 |
1.04×l0−7 | EGF, FLT1, HEF1A,
IGF1, STAT3,VEGFA |
| hsa05205 | Proteoglycans in
cancer | 7 | 195 |
1.04×10⁻⁷ | ACTB, H3F1A, IGF1,
KDR, STAT3, TGFB1, VEGFA |
| hsa01521 | EGFR tyrosine
kinase inhibitor resistance | 5 | 78 |
6.18×l0−7 | EGF, IGF1, KDR,
STAT3, VEGFA |
| hsa04510 | Focal adhesion | 6 | 197 |
1.16×10⁻⁶ | ACTB, EGF, FLT1,
IGF1, KDR, VEGFA |
| hsa04010 | MAPK signaling
pathway | 6 | 293 |
9.51×10⁻⁶ | EGF, FLT1, IGF1,
KDR, TGFB1, VEGFA |
| hsa05212 | Pancreatic
cancer | 4 | 74 |
2.00×10⁻⁵ | EGF, STAT3, TGFB1,
VEGFA |
| hsa04014 | Ras signaling
pathway | 5 | 228 |
5.27×10⁻⁵ | EGF, FLT1, IGF1,
KDR, VEGFA |
| hsa04060 | Cytokine-cytokine
receptor interaction | 5 | 263 |
9.25×10⁻⁵ | EGF, FLT1, KDR,
TGFB 1, VEGFA |
| hsa0406S | FoxO signaling
pathway | 4 | 130 | 0.00012 | EGF, IGF1, STAT3,
TGFB1 |
| hsa05200 | Pathways in
cancer | 6 | 515 | 0.00013 | EGF, HIF1A, IGF1,
STAT3, TGFB1, VEGFA |
| hsa04151 | PI3K-Akt signaling
pathway | 5 | 348 | 0.00026 | EGF, FLT1, IGF1,
KDR, VEGFA |
| hsa05211 | Renal cell
carcinoma | 3 | 68 | 0.00047 | HIF1A, T GFB1,
VEGFA |
| hsa04S10 | Regulation of actin
cytoskeleton | 4 | 205 | 0.0005 | ACTB, CFL1, EGF,
PFN1 |
| hsa05410 | Hypertrophic
cardiomyopathy (HCM) | 3 | 81 | 0.00068 | ACTB, IGF1,
TGFB1 |
| hsa05323 | Rheumatoid
arthritis | 3 | 84 | 0.0007 | FLT1, TGFB 1,
VEGFA |
| hsa05414 | Dilated
cardiomyopathy (DCM) | 3 | 88 | 0.00076 | ACTB, IGF1,
TGFB1 |
| hsa04659 | Thl7 cell
differentiation | 3 | 102 | 0.001 | HIF1A, STAT3,
TGFB1 |
| hsa05418 | Fluid shear stress
and atherosclerosis | 3 | 133 | 0.0021 | ACTB, KDR,
VEGFA |
| hsa04933 | AGE-RAGE signaling
pathway in diabetic complications | 3 | 98 | 0.00097 | STAT3, TGFB1,
VEGFA |
| Table IVReactome pathways of TMSB10 retrieved
from the STRING database. |
Table IV
Reactome pathways of TMSB10 retrieved
from the STRING database.
| Term ID | Term
description | Observed gene
count | Background gene
count | FDR | Matching
proteins |
|---|
| HSA-194138 | Signaling by
VEGF | 6 | 104 | 7.83E-08 | ACTB, FLT1, KDR,
NRP1, NRP2, VEGFA |
| HSA-114608 | Platelet
degranulation | 6 | 125 | 1.80E-07 | CFL1, EGF, IGF1,
PFN1, TGFB1, VEGFA |
| HSA-8848021 | Signaling by
PTK6 | 4 | 51 | 7.26E-06 | EGF, GPNMB, HEFIA,
STAT3 |
| HSA-109582 | Hemostasis | 7 | 601 | 4.02E-05 | ACTB, CFL1, EGF,
IGF1, PFN1, TGFB 1, VEGFA |
| HSA-6785807 | Interleukin-4 and
Interleukin-13 signaling | 4 | 106 | 9.10E-05 | HEFIA, STAT3, TGFB
1, VEGFA |
| HSA-8857538 | PTK6 promotes HEFIA
stabilization | 2 | 6 | 0.00049 | GPNMB, HIF1A |
| HSA-1266738 | Developmental
biology | 7 | 1,023 | 0.001 | ACTB, CFL1, NRP1,
NRP2, PFN1, STAT3, TGFB1 |
| HSA-162582 | Signal
transduction | 16 | 2,605 | 1.54E-08 | IGF1, KDR, NRP1,
NRP2, PFN1, REEP5, STAT3, TGFB 1, ACTB, BAMBI, CFL1, EGF, FLT1,
GPNMB, HEFIA, VEGFA |
| HSA-9006934 | Signaling by
receptor tyrosine kinases | 9 | 437 | 2.64E-08 | ACTB, EGF, FLT1,
IGF1, KDR, NRP1, NRP2, STAT3, VEGFA |
| HSA-194306 | Neurophilin
interactions with VEGF and VEGFR | 4 | 4 | 1.54E-08 | FLT1, KDR, NRP1,
NRP2 |
| HSA-1234158 | Regulation of gene
expression by hypoxia inducible factor | 2 | 11 | 0.0012 | HEFIA, VEGFA |
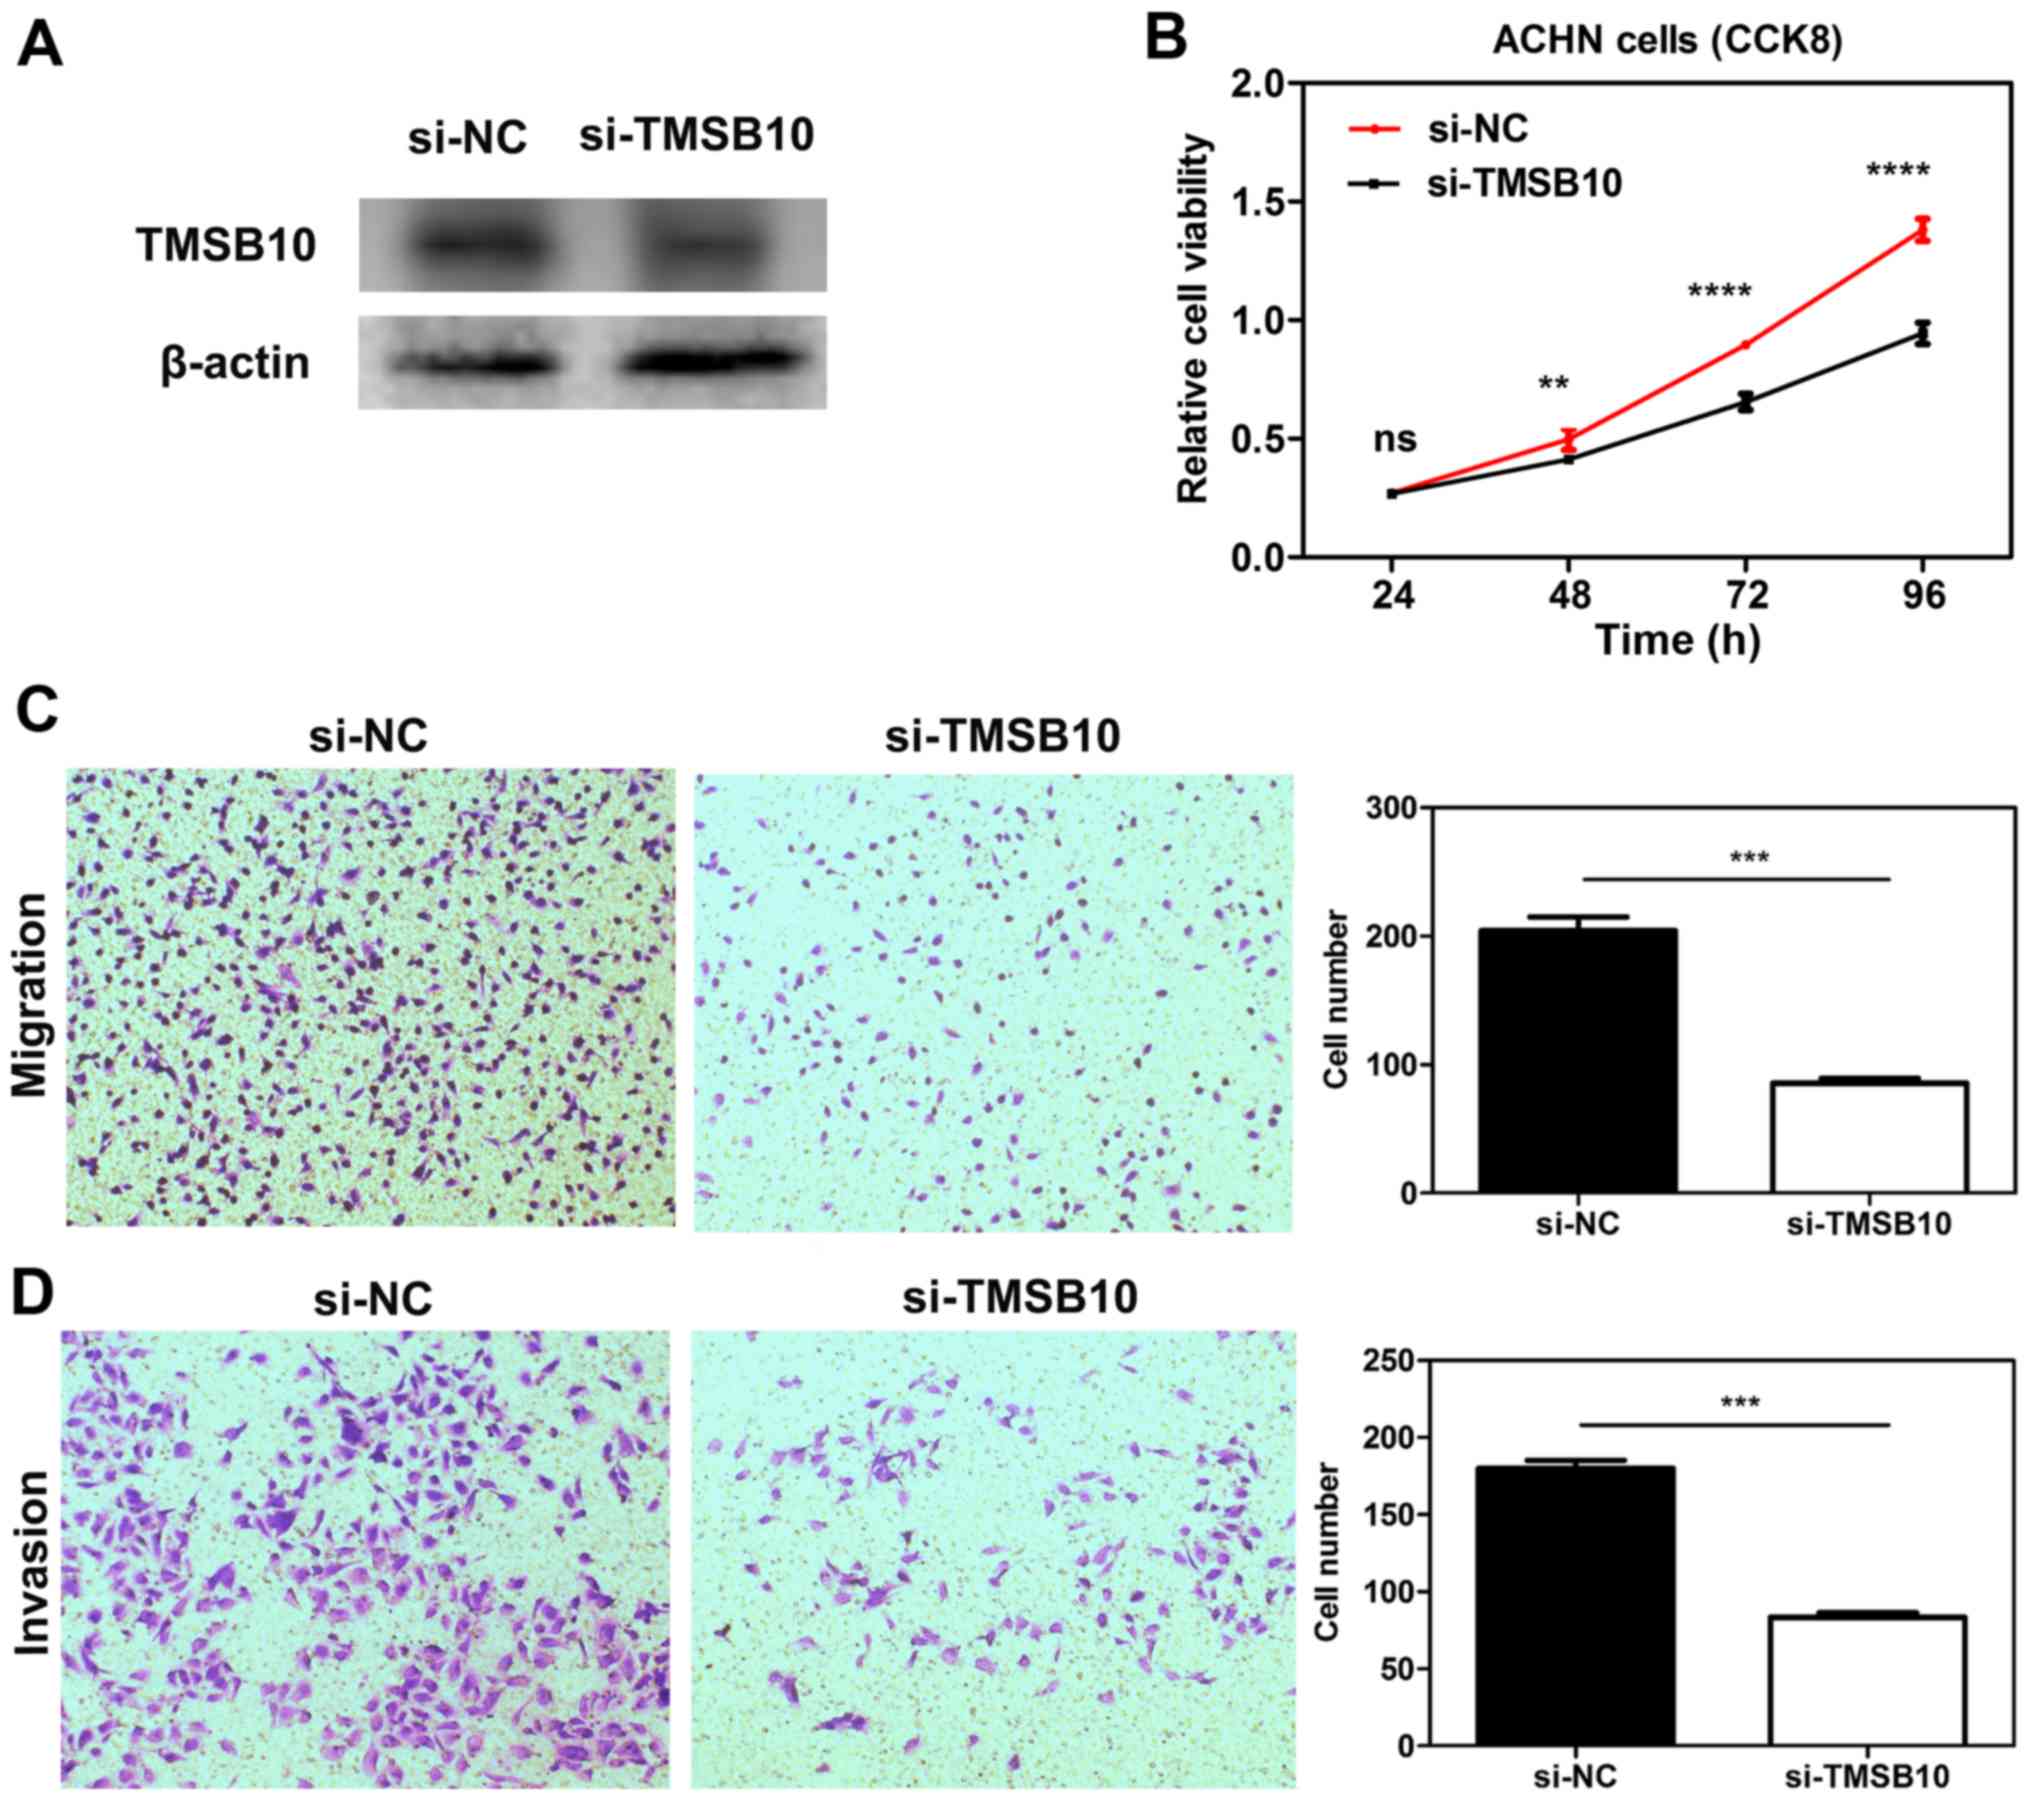
Knockdown of TMSB10 impairs the
proliferation, migration and invasion of ccRCC cell lines, and
downregulates the expression of P-PI3K and VEGF
To elucidate the functional role of TMSB10 in ccRCC,
TMSB10 was knocked down in ACHN cells through transfection with
si-TMSB10. After transfection with si-TMSB10, decreased TMSB10
protein expression was observed in ACHN cells (Fig. 10A). CCK-8 assays demonstrated that
transfection with si-TMSB10 significantly reduced the proliferation
of the cells (Fig. 10B).
Furthermore, Transwell assays revealed that downregulation of
TMSB10 significantly attenuated the migration and invasion ability
of the cells compared with that in the si-NC group (Fig. 10C and D). Furthermore, knockdown
of TMSB10 down-regulated the P-PI3K/total PI3K ratio and VEGF
expression level (Fig. S2).
Discussion
In the present study, commonly upregulated genes in
ccRCC were identified through mining the GEO database, and four
candidate genes that were associated with survival were finally
selected by screening. ENO2 is an important HIF-responsive gene,
and Zhang et al (35)
discovered that in a xenograft model, lack of ENO2 expression had
no effect on the tumor growth of ccRCC. With regard to NNMT,
Campagna et al (36)
revealed that transforming growth factor β1 is involved in the
transcriptional regulation of NNMT and resulted in the high level
of NNMT observed in ccRCC; Tang et al (37) suggested that NNMT exhibited a vital
role in cellular invasion through activating matrix
metalloproteinase-2 expression in ccRCC. ST8SIA4 has previously
been demonstrated to be upregulated in RCC tissues and RCC cell
lines (38), and modulated the
proliferation, migration and invasion of RCC cells.
TMSB10 is a member of the β-thymosin family, which
consists of three members, namely TMSB4, TMSB15 and TMSB10. The
β-thymosin family comprises highly conserved acidic N-terminally
acetylated peptides consisting of 40-44 amino acid residues. They
are reported to be involved not only in normal cells, but also in
tumor progression (5). Multiple
studies have reported TMSB10 to be significantly upregulated in
papillary thyroid carcinoma, non-small cell lung cancer and breast
cancer (16,19,20,39,40),
and suggest that TMSB10 may emerge as a critical factor in the
tumor progression. Furthermore, in 1991, Hall (41) revealed that TMSB10 genes were
constitutively expressed at higher levels in RCC compared with
normal/benign tissues. In 1994, Hall (42) further found that the elevated
expression of TMSB10 mRNA in human RCC was
amplification-independent. Since then, to the best of our
knowledge, no related research concerning TMSB10 in RCC have been
published. The clinical significance and functional role of TMSB10
in ccRCC remains largely unknown. Therefore, TMSB10 was selected
for subsequent investigation in the present study.
TMSB10 expression data and clinical data were
downloaded from the TCGA-KIRC and Oncomine databases. Then, a
comprehensive assessment of the associations between TMSB10
expression level and various clinicopathological parameters of
patient subgroups, OS and DFS was conducted. The present results
demonstrated that TMSB10 was upregulated in ccRCC, and the
expression level increased as the degree of malignancy increased;
this revealed that higher expression of TMSB10 predicted poorer OS
and DFS compared with that of patients with a lower TMSB10
expression level. Together, these results indicated that TMSB10
probably has an onco-genic role in ccRCC and promotes renal cancer
progression. Furthermore, to validate the present hypothesis,
STRING database and GSEA analyses revealed that TMSB10 participated
in a number of tumor-associated pathways, including 'regulation of
cell proliferation', 'regulation of cell migration', 'Ras signaling
pathway', 'MAPK signalling pathway', 'PI3K-Akt signaling pathway',
'HIF-1 signaling pathway', 'FoxO signaling pathway', 'signaling by
VEGF', 'DNA replication' and 'P53 signaling pathway'. Furthermore,
the in vitro experiments demonstrated that knockdown of the
expression of TMSB10 impaired cell proliferation, cell migration
and invasion. However, in the present study, one limitation should
be mentioned; the exact mechanism by which TMSB10 promotes ccRCC
progression was not investigated. Previous studies focusing on the
thymosin family may suggest the underlying mechanism. TMSB4 serves
a positive role in angiogenesis and does not bind to RAS; it was
associated with induction of VEGF expression (6). By contrast, Lee et al
(43) reported that overexpression
of TMSB10 inhibited VEGF-induced endothe-lial cell proliferation,
invasion and migration via inhibition of the RAS pathway (43). Also, another study revealed that
TMSB10 inhibited VEGF expression and tube formation in monkey
choroid-retinal endothelial cells in hypoxic conditions (44). In this regard, TMSB10 exhibited
different effects on angiogenesis compared with TMSB4. Moreover,
TMSB4 was found to promote tumor progression by inducing
epithelial-mesenchymal transition via the activation of AKT in
colorectal cancer (8).
Overexpression of TMSB4 in SW480 colon cells also caused a marked
decrease in E-cadherin, and promoted invasiveness (11). Furthermore, SNU668 gastric
adenocarcinoma cells, which are characterized by highly expressed
TMSB4, exhibited a higher rate of cell migration than SNU638 cells
that have a low level of E-cadherin (45). Therefore, TMSB4 may be a novel
regulator of the Wnt signaling pathway. Although the present study
demonstrated that silencing TMSB10 reduced PI3K phosphorylation and
VEGF expression, further studies of the underlying molecular
mechanism of TMSB10 in ccRCC are required in the future.
To investigate the diagnostic role of TMSB10 in
ccRCC, ROC analysis was performed in the present study. The results
indicated that it could be a satisfactory diagnostic biomarker for
patients with ccRCC, or to distinguish between ccRCC patients with
different clinicopathological features.
In summary, the present study first established the
functional role of TMSB10 in ccRCC tumorigenesis and progression.
The results demonstrated that TMSB10 expression was significantly
elevated in ccRCC tissues and cells, and that TMSB10 expression was
associated with various crucial clinicopathological parameters in
patients with ccRCC. High expression of TMSB10 predicted poor
prognosis and promoted tumor progression. However, future
multi-center studies with a larger sample size are required to
verify the results. These findings indicate that TMSB10 could be a
novel prognostic and diagnostic biomarker for patients with ccRCC.
Additionally, it may be a potential therapeutic target in the
future.
Supplementary Data
Funding
This study was supported by grants from the National
Natural Science Foundation of China (grant nos. 81671216 and
81371379).
Availability of data and materials
The datasets used and/or analyzed during the current
study are available from the corresponding author on reasonable
request.
Authors' contributions
BL and GC designed the study. QP carried out data
acquisition and analysis. QP, GC performed the majority of the
experiments. QP wrote the manuscript. HZ conducted IHC analyses. YL
and TX collected the clinical samples and managed the clinical
data. TX and HZ contributed to bioinformatics analysis. HZ and YL
were involved in project management, and contributed to preparing
and making figures and tables. BL supervised the study. All authors
read and approved the final manuscript.
Ethics approval and consent to
participate
The present study and experimental procedures were
approved by the Human Research Ethics Committee of Huazhong
University of Science and Technology (Wuhan, China). Written
informed consent was obtained from all patients, and also from the
patients' families in certain cases. The study was conducted
according to the principles outlined in the Declaration of
Helsinki.
Patient consent for publication
Written informed consent was obtained from the
patients or the patients' families.
Competing interests
The authors declare that they have no competing
interests.
Acknowledgements
The authors would like to thank Dr Yan Xu of the
Department of Ultrasound, Second Affiliated Hospital of Nanchang
University for her selfless help.
References
|
1
|
Siegel RL, Miller KD and Jemal A: Cancer
Statistics, 2017. CA Cancer J Clin. 67:7–30. 2017. View Article : Google Scholar : PubMed/NCBI
|
|
2
|
Ferlay J, Steliarova-Foucher E,
Lortet-Tieulent J, Rosso S, Coebergh JW, Comber H, Forman D and
Bray F: Cancer incidence and mortality patterns in Europe:
Estimates for 40 countries in 2012. Eur J Cancer. 49:1374–1403.
2013. View Article : Google Scholar : PubMed/NCBI
|
|
3
|
Torre LA, Bray F, Siegel RL, Ferlay J,
Lortet-Tieulent J and Jemal A: Global cancer statistics, 2012. CA
Cancer J Clin. 65:87–108. 2015. View Article : Google Scholar : PubMed/NCBI
|
|
4
|
Niinivirta M, Enblad G, Lindskog C, Ponten
F, Dragomir A and Ullenhag GJ: Tumoral pyruvate kinase l/r as a
predictive marker for the treatment of renal cancer patients with
sunitinib and sorafenib. J Cancer. 10:3224–3231. 2019. View Article : Google Scholar : PubMed/NCBI
|
|
5
|
Huff T, Muller CS, Otto AM, Netzker R and
Hannappel E: beta-Thymosins, small acidic peptides with multiple
functions. Int J Biochem Cell Biol. 33:205–220. 2001. View Article : Google Scholar : PubMed/NCBI
|
|
6
|
Sribenja S, Wongkham S, Wongkham C, Yao Q
and Chen C: Roles and mechanisms of β-thymosins in cell migration
and cancer metastasis: An update. Cancer Invest. 31:103–110. 2013.
View Article : Google Scholar : PubMed/NCBI
|
|
7
|
Chen C, Li M, Yang H, Chai H, Fisher W and
Yao Q: Roles of thymosins in cancers and other organ systems. World
J Surg. 29:264–270. 2005. View Article : Google Scholar : PubMed/NCBI
|
|
8
|
Hsiao HL, Wang WS, Chen PM and Su Y:
Overexpression of thymosin beta-4 renders SW480 colon carcinoma
cells more resistant to apoptosis triggered by FasL and two
topoisomerase II inhibitors via downregulating Fas and upregulating
Survivin expression, respectively. Carcinogenesis. 27:936–944.
2006. View Article : Google Scholar
|
|
9
|
Huang HC, Hu CH, Tang MC, Wang WS, Chen PM
and Su Y: Thymosin beta4 triggers an epithelial-mesenchymal
transition in colorectal carcinoma by upregulating integrin-linked
kinase. Oncogene. 26:2781–2790. 2007. View Article : Google Scholar
|
|
10
|
Kobayashi T, Okada F, Fujii N, Tomita N,
Ito S, Tazawa H, Aoyama T, Choi SK, Shibata T, Fujita H and
Hosokawa M: Thymosin-beta4 regulates motility and metastasis of
malignant mouse fibrosarcoma cells. Ame J Pathol. 160:869–882.
2002. View Article : Google Scholar
|
|
11
|
Larsson LI and Holck S: Occurrence of
thymosin beta4 in human breast cancer cells and in other cell types
of the tumor microen-vironment. Hum Pathol. 38:114–119. 2007.
View Article : Google Scholar
|
|
12
|
Wang WS, Chen PM, Hsiao HL, Ju SY and Su
Y: Overexpression of the thymosin beta-4 gene is associated with
malignant progression of SW480 colon cancer cells. Oncogene.
22:3297–3306. 2003. View Article : Google Scholar : PubMed/NCBI
|
|
13
|
Wang ZY, Zeng FQ, Zhu ZH, Jiang GS, Lv L,
Wan F, Dong R, Xiao XY and Xing SA: Evaluation of thymosin β4 in
the regulation of epithelial-mesenchymal transformation in
urothelial carcinoma. Urol Oncol. 30:167–176. 2012. View Article : Google Scholar
|
|
14
|
Zhang Y, Feurino LW, Zhai Q, Wang H,
Fisher WE, Chen C, Yao Q and Li M: Thymosin Beta 4 is overexpressed
in human pancreatic cancer cells and stimulates proinflammatory
cytokine secretion and JNK activation. Cancer Biol Ther. 7:419–423.
2008. View Article : Google Scholar
|
|
15
|
Chakravatri A, Zehr EM, Zietman AL,
Shipley WU, Goggins WB, Finkelstein DM, Young RH, Chang EL and Wu
CL: Thymosin beta-15 predicts for distant failure in patients with
clinically localized prostate cancer-results from a pilot study.
Urology. 55:635–638. 2000. View Article : Google Scholar : PubMed/NCBI
|
|
16
|
Feher LZ, Pocsay G, Krenacs L, Zvara A,
Bagdi E, Pocsay R, Lukács G, Győry F, Gazdag A, Tarkó E and Puskás
LG: Amplification of thymosin beta 10 and AKAP13 genes in
metastatic and aggressive papillary thyroid carcinomas. Pathol
Oncol Res. 18:449–458. 2012. View Article : Google Scholar
|
|
17
|
Gu Y, Wang C, Wang Y, Qiu X and Wang E:
Expression of thymosin beta10 and its role in non-small cell lung
cancer. Hum Pathol. 40:117–124. 2009. View Article : Google Scholar
|
|
18
|
Santelli G, Bartoli PC, Giuliano A,
Porcellini A, Mineo A, Barone MV, Busiello I, Trapasso F, Califano
D and Fusco A: Thymosin beta-10 protein synthesis suppression
reduces the growth of human thyroid carcinoma cells in semisolid
medium. Thyroid. 12:765–772. 2002. View Article : Google Scholar : PubMed/NCBI
|
|
19
|
Song C, Su Z and Guo J: Thymosin β 10 is
overexpressed and associated with unfavorable prognosis in
hepatocellular carcinoma. Biosci Rep. 39:pii: BSR20182355. 2019.
View Article : Google Scholar
|
|
20
|
Zhang X, Ren D, Guo L, Wang L, Wu S, Lin
C, Ye L, Zhu J, Li J, Song L, et al: Thymosin beta 10 is a key
regulator of tumorigen-esis and metastasis and a novel serum marker
in breast cancer. Breast Cancer Res. 19:152017. View Article : Google Scholar
|
|
21
|
Lee SH, Zhang W, Choi JJ, Cho YS, Oh SH,
Kim JW, Hu L, Xu J, Liu J and Lee JH: Overexpression of the
thymosin beta-10 gene in human ovarian cancer cells disrupts
F-actin stress fiber and leads to apoptosis. Oncogene.
20:6700–6706. 2001. View Article : Google Scholar : PubMed/NCBI
|
|
22
|
Sribenja S, Sawanyawisuth K, Kraiklang R,
Wongkham C, Vaeteewoottacharn K, Obchoei S, Yao Q, Wongkham S and
Chen C: Suppression of thymosin β10 increases cell migration and
metastasis of cholangiocarcinoma. BMC Cancer. 13:4302013.
View Article : Google Scholar
|
|
23
|
Wozniak MB, Le Calvez-Kelm F,
Abedi-Ardekani B, Byrnes G, Durand G, Carreira C, Michelon J,
Janout V, Holcatova I, Foretova L, et al: Integrative genome-wide
gene expression profiling of clear cell renal cell carcinoma in
Czech Republic and in the United States. PLoS One. 8:e578862013.
View Article : Google Scholar : PubMed/NCBI
|
|
24
|
Gerlinger M, Horswell S, Larkin J, Rowan
AJ, Salm MP, Varela I, Fisher R, McGranahan N, Matthews N, Santos
CR, et al: Genomic architecture and evolution of clear cell renal
cell carcinomas defined by multiregion sequencing. Nat Genet.
46:225–233. 2014. View
Article : Google Scholar : PubMed/NCBI
|
|
25
|
von Roemeling CA, Radisky DC, Marlow LA,
Cooper SJ, Grebe SK, Anastasiadis PZ, Tun HW and Copland JA:
Neuronal pentraxin 2 supports clear cell renal cell carcinoma by
activating the AMPA-selective glutamate receptor-4. Cancer Res.
74:4796–4810. 2014. View Article : Google Scholar : PubMed/NCBI
|
|
26
|
Nam HY, Chandrashekar DS, Kundu A, Shelar
S, Kho EY, Sonpavde G, Naik G, Ghatalia P, Livi CB, Varambally S
and Sudarshan S: Integrative epigenetic and gene expression
analysis of renal tumor progression to metastasis. Mol Cancer Res.
17:84–96. 2019. View Article : Google Scholar
|
|
27
|
Jones J, Out H, Spentzos D, Kolia S, Inan
M, Beecken WD, Fellbaum C, Gu X, Joseph M, Pantuck AJ, et al: Gene
signatures of progression and metastasis in renal cell cancer. Clin
Cancer Res. 11:5730–5739. 2005. View Article : Google Scholar : PubMed/NCBI
|
|
28
|
Szklarczyk D, Franceschini A, Wyder S,
Forslund K, Heller D, Huerta-Cepas J, Simonovic M, Roth A, Santos
A, Tsafou KP, et al: STRING v10: Protein-protein interaction
networks, integrated over the tree of life. Nucleic Acids Res.
43:D447–D452. 2015. View Article : Google Scholar
|
|
29
|
Cao Q, Ruan H, Wang K, Song Z, Bao L, Xu
T, Xiao H, Wang C, Cheng G, Tong J, et al: Overexpression of PLIN2
is a prognostic marker and attenuates tumor progression in clear
cell renal cell carcinoma. Int J Oncol. 53:137–147. 2018.PubMed/NCBI
|
|
30
|
Yusenko MV, Zubakov D and Kovacs G: Gene
expression profiling of chromophobe renal cell carcinomas and renal
onco-cytomas by Affymetrix GeneChip using pooled and individual
tumours. Int J Biol Sci. 5:517–527. 2009. View Article : Google Scholar : PubMed/NCBI
|
|
31
|
Lenburg ME, Liou LS, Gerry NP, Frampton
GM, Cohen HT and Christman MF: Previously unidentified changes in
renal cell carcinoma gene expression identified by parametric
analysis of microarray data. BMC Cancer. 3:312003. View Article : Google Scholar : PubMed/NCBI
|
|
32
|
Jones J, Out H, Spentzos D, Kolia S, Inan
M, Beecken WD, Fellbaum C, Gu X, Joseph M, Pantuck AJ, et al: Gene
signatures of progression and metastasis in renal cell cancer. Clin
Cancer Res. 11:5730–5739. 2005. View Article : Google Scholar : PubMed/NCBI
|
|
33
|
Gumz ML, Zou H, Kreinest PA, Childs AC,
Belmonte LS, LeGrand SN, Wu KJ, Luxon BA, Sinha M, Parker AS, et
al: Secreted frizzled-related protein 1 loss contributes to tumor
phenotype of clear cell renal cell carcinoma. Clin Cancer Res.
13:4740–4749. 2007. View Article : Google Scholar : PubMed/NCBI
|
|
34
|
Beroukhim R, Brunet JP, Di Napoli A, Mertz
KD, Seeley A, Pires MM, Linhart D, Worrell RA, Moch H, Rubin MA, et
al: Patterns of gene expression and copy-number alterations in
von-hippel lindau disease-associated and sporadic clear cell
carcinoma of the kidney. Cancer Res. 69:4674–4681. 2009. View Article : Google Scholar : PubMed/NCBI
|
|
35
|
Zhang T, Niu X, Liao L, Cho EA and Yang H:
The contributions of HIF-target genes to tumor growth in RCC. PLoS
One. 8:e805442013. View Article : Google Scholar : PubMed/NCBI
|
|
36
|
Campagna R, Cecati M, Pozzi V, Fumarola S,
Pompei V, Milanese G, Galosi AB, Sartini D and Emanuelli M:
Involvement of transforming growth factor beta 1 in the
transcriptional regulation of nicotinamide N-methyltransferase in
clear cell renal cell carcinoma. Cell Mol Biol. 64:51–55. 2018.
View Article : Google Scholar : PubMed/NCBI
|
|
37
|
Tang SW, Yang TC, Lin WC, Chang WH, Wang
CC, Lai MK and Lin JY: Nicotinamide N-methyltransferase induces
cellular invasion through activating matrix metalloproteinase-2
expression in clear cell renal cell carcinoma cells.
Carcinogenesis. 32:138–145. 2011. View Article : Google Scholar
|
|
38
|
Pan Y, Wu Y, Hu J, Shan Y, Ma J, Ma H, Qi
X and Jia L: Long noncoding RNA HOTAIR promotes renal cell
carcinoma malignancy through alpha-2, 8-sialyltransferase 4 by
sponging microRNA-124. Cell Prolif. 51:e125072018. View Article : Google Scholar : PubMed/NCBI
|
|
39
|
Chiappetta G, Pentimalli F, Monaco M,
Fedele M, Pasquinelli R, Pierantoni GM, Ribecco MT, Santelli G,
Califano D, Pezzullo L and Fusco A: Thymosin beta-10 gene
expression as a possible tool in diagnosis of thyroid neoplasias.
Oncol Rep. 12:239–243. 2004.PubMed/NCBI
|
|
40
|
Verghese-Nikolakaki S, Apostolikas N,
Livaniou E, Ithakissios DS and Evangelatos GP: Preliminary findings
on the expression of thymosin beta-10 in human breast cancer. Br J
Cancer. 74:1441–1444. 1996. View Article : Google Scholar : PubMed/NCBI
|
|
41
|
Hall AK: Differential expression of
thymosin genes in human tumors and in the developing human kidney.
Int J Cncer. 48:672–677. 1991. View Article : Google Scholar
|
|
42
|
Hall AK: Amplification-independent
overexpression of thymosin beta-10 mRNA in human renal cell
carcinoma. Ren Fail. 16:243–254. 1994. View Article : Google Scholar : PubMed/NCBI
|
|
43
|
Lee SH, Son MJ, Oh SH, Rho SB, Park K, Kim
YJ, Park MS and Lee JH: Thymosin {beta}(10) inhibits angiogenesis
and tumor growth by interfering with Ras function. Cancer Res.
65:137–148. 2005.PubMed/NCBI
|
|
44
|
Zhang T, Li X, Yu W, Yan Z, Zou H and He
X: Overexpression of thymosin beta-10 inhibits VEGF mRNA
expression, autocrine VEGF protein production, and tube formation
in hypoxia-induced monkey choroid-retinal endothelial cells.
Ophthalmic Res. 41:36–43. 2009. View Article : Google Scholar
|
|
45
|
Ryu YK, Lee YS, Lee GH, Song KS, Kim YS
and Moon EY: Regulation of glycogen synthase kinase-3 by thymosin
beta-4 is associated with gastric cancer cell migration. Int J
Cancer. 131:2067–2077. 2012. View Article : Google Scholar : PubMed/NCBI
|