Introduction
Cbl-associated protein (CAP) is encoded by the
sorbin and SH3 domain-containing 1 (SORBS1) gene. CAP contains a
conserved Sorbin homology (SoHo) domain and three SH3 domains. Upon
insulin stimulation, CAP and c-Cbl are recruited by adapter protein
with pleckstrin homology and Src homology 2 domains to the insulin
receptor, and c-Cbl is phosphorylated by tyrosine (1). CAP-c-Cbl complexes are then recruited
to rafts by means of an interaction of the SoHo domain of CAP with
Flot-1, which is involved in a specific signaling pathway
associated with glucose transporter 4 (GLUT4) translocation
(2). Translocation of GLUT4 is
pathologically associated with diabetes mellitus (DM). Type 2 DM is
a type of metabolic disease in which hyperglycemia exists for a
prolonged period. Metformin is generally recommended to treat type
2 DM; this drug works by increasing sensitivity to insulin and
decreasing the hepatic production of glucose. The function of
metformin, including increasing sensitivity to insulin, is
speculated to regulate GLUT expression on the tissue surface. A
potential mechanism by which metformin might increase sensitivity
to insulin is by regulating CAP (3,4).
CAP is an adaptor protein that is associated with
the actin cytoskeleton, receptor tyrosine kinase signaling and cell
adhesion via three SH3 domains (5). These three SH3 domains (referred to
as SH3-A, -B and -C) are in the C-terminus of CAP and have
different functions (6). The SH3-B
domain has been reported to bind with c-Cbl and focal adhesion
kinase, whereas the SH3-A and SH3-B domains are mediated by
interaction with vinculin (7,8).
SORBS1 expression in metastatic colorectal cancer cell lines has
been reported to be higher than that in primary colorectal cancer
cell lines (9). It is possible
that SORBS1 provides favorable conditions for metastasis, including
cell viability, proliferation and motility. Although CAP has been
reported to possess a number of functions, this protein has only
been reported in the specific field of signaling pathways (2,10)
and its role in cancer remains to be elucidated.
c-Cbl is the 120-kDa cellular homolog of the
transforming v-Cbl oncogene (11,12).
c-Cbl is phosphorylated in response to activation by numerous
tyrosine kinases, including v-Abl and Bcr-Abl (13). c-Cbl is composed of a long
proline-rich region in the C-terminus that binds the SH3 domains of
the adapters Grb2 and Nck, and Fyn and Lck tyrosine kinases
(14-17). These results suggest that c-Cbl may
have an important role in signal transduction of tyrosine kinases.
Therefore, it is possible that the CAP-Cbl complex is associated
with other oncoproteins related to tyrosine kinases, including
receptor tyrosine kinase.
This study hypothesized that CAP may have diverse
roles, not only in complexing with c-Cbl but also with binding
other signaling molecules. Therefore, this study aimed to elucidate
the role of CAP in colorectal cancer by binding to proteins with
functions related to cancer metastasis.
Materials and methods
Cell culture
The cells used in this study were obtained from the
Korean Cell Line Bank. All colorectal cancer cell lines (SNU-61,
SNU-81, SNU-175, SNU-283, SNU-407, SNU-503, SNU-769A, SNU-769B,
SNU-1033, SNU-1040, SNU-1197, SNU-C1, SNU-C2A, SNU-C4, SNU-1047,
SNU-C5, CaCo2, Colo201, Colo205, Colo320, DLD1, HCT-15, HCT-116,
HT29, Lovo, Ls174T, NCI H716, SW403, SW480, SW620, SW116 and WiDr),
and MDA-MB-231 and MCF7 cells were routinely cultured in RPMI1640
media (Gibco; Thermo Fisher Scientific, Inc.) supplemented with 10%
fetal bovine serum (FBS; Gibco; Thermo Fisher Scientific, Inc.),
100 U/ml penicillin and 100 µg/ml streptomycin (Gibco; Thermo
Fisher Scientific, Inc.). All cell lines were cultured in a
humidified incubator at 37˚C containing 5% CO2 and 95%
air. WiDr is a derivative of HT29 cells; therefore, both cell lines
were authenticated by STR profiling.
Cell treatment
Insulin solution (200 nM; 11.5 mg/ml; cat. no.
I9278; Merck KGaA) was used to treat HT29 cells at 37˚C for 1, 4
and 8 h. Metformin (cat. no. S1950; Selleck Chemicals) was used as
a GLUT activator. Briefly, 1 mM metformin was used to treat HT29
cells at 37˚C for 2 h in an atmosphere containing 5% CO2
and 95% air. HCT116 and SNU-C4 cells were treated with a serial
dilution (0-15 mM) of 5-fluorouracil (5-Fu; cat. no. S1209; Selleck
Chemicals) for 72 h at 37˚C in an atmosphere containing 5%
CO2 and 95% air.
Cloning and transfection of SORBS1
SORBS1-pENTR 221 clone containing the open reading
frame (ORF) and control empty vector [pcDNA3.1 (+) vector] were
purchased from Invitrogen; Thermo Fisher Scientific, Inc. The ORF
of SORBS1 (ID: IOH27642; Thermo Fisher Scientific, Inc.) was
amplified by reverse transcription (RT)-PCR using i-Taq™ DNA
polymerase (cat. no. 25022; Intron Biotechnology, Inc.,) and
primers (forward, 5'-CCG CTC GAG ATG AGT TCT GAA TGT GAT GG-3',
reverse, 5'CCC AAG CTT TTA TAG ATA CAA AGG TTT T3'; Bioneer
Corporation) containing the restriction enzyme sites HindIII
and XhoI (New England Biolabs), respectively. These two
primers were designed based on the SORBS1 sequence. The conditions
for PCR were as follows: Denaturation at 94˚C for 1 min, annealing
at 60˚C for 1 min and extension at 72˚C for 1 min. The SORBS1 ORF
and pcDNA3.1 (+) vector were cut with HindIII and
XhoI, and ligated. The ligated SORBS1-pcDNA3.1 vector was
then transformed into DH5α competent cells (1.5×10⁵
cells; Thermo Fisher Scientific, Inc.) for isolation of the SORBS1
recombinant DNA plasmid. HT29 cells were seeded at
1.5×10⁵ cells/well in 6-well plates for 24 h prior to
transfection. The SORBS1 recombinant DNA plasmid, at a final
concentration of 40 nM in Opti-MEM (Thermo Fisher Scientific,
Inc.), was transfected into cells using Lipofectamine®
2000 (Invitrogen; Thermo Fisher Scientific, Inc.) for 24 h at 37˚C
in an atmosphere containing 5% CO2 and 95% air.
Subsequently, the medium was replaced with an equal volume of
RPMI1640 medium.
Knockdown of SORBS1 by small interfering
RNA (siRNA) and short hairpin RNA (shRNA)
HT29 cells were seeded at 1.5×10⁵
cells/well in 6-well plates for 24 h before siRNA trans-fection.
Scrambled siRNA (AccuTarget™ Negative control siRNA; cat. no.
SN-1011) and SORBS1 siRNA were purchased from Bioneer Corporation
(SORBS1 siRNA: Forward, 5'-CAU UCA UGA ACC GAU CUU U-3', reverse,
5'AAA GAU CGG UUC AUG AAU G-3'). SW620 cell lines were transfected
with SORBS1 siRNA, at a final concentration of 40 nM in Opti-MEM,
for 6 h using Lipofectamine® 2000, at which time the
medium was replaced with an equal volume of RPMI1640 medium.
293FT cells (5.0×10⁵; Korean Cell Line
Bank), cultured in Opti-MEM at 37˚C in an atmosphere containing 5%
CO2 and 95% air, were transfected with SORBS1 shRNA. The
protocol for SORBS1 shRNA transfection was the same as the protocol
for SORBS1 siRNA transfection proceed. Empty control vector
(MISSION® shRNA Plasmid DNA) and SORBS1 shRNA plasmid
DNA (5'-CCG GCC GGA ACA CTG AGA GAT CAA ACT CGA GTT TGA TCT CTC AGT
GTT CCG GTT TTT G-3') were purchased from Merck KGaA. Lentiviruses
containing SORBS1 shRNA or shRNA control were harvested from the
culture medium of transfected 293FT cells. Subsequently, the
HCT-116 and SNU-C4 cells were seeded at 1×10⁵ cells/well
in 12-well plates for 24 h before shRNA transduction. HCT-116 and
SNU-C4 cells were transduced with lentivirus using vira-ductin
(cat. no. LTV-201; Cell Biolabs, Inc.), according to the
manufacturer's instructions.
RT-PCR
For the analysis of mRNA expression, RNA was
extracted using the RNeasy kit (Qiagen, Inc.). cDNA was generated
from RNA using a RT kit (cat. no. 205313; Qiagen, Inc.). Briefly, 1
µg RNA was added to the mixture contacting 4 µl RT buffer (5X), 1
µl RT primer mix and 1 µl reverse tran-scriptase; the mixture was
incubated at 42˚C for 50 min and at 95˚C for 2 min. cDNA was
amplified in a 15-µl PCR mix containing 1.5 µl cDNA, 1 pM/µl
primers and 1.5 units i-Taq™ DNA polymerase (cat. no. 25022; Intron
Biotechnology, Inc.). PCR amplification was performed with cDNA
primers specific for a 550-bp amplicon of SORBS1 (forward, 5'-TCA
AGA GGT CGG CCA CAC TA-3' and reverse, 5'-AAG CTA GTG AGA TCC CCA
GG-3') and a 301-bp amplicon of β-actin (forward, 5'-GAC CAC ACC
TTC TAC AAT GAG-3' and reverse, 5'-GCA TAC CCC TCG TAG ATG GG-3').
The PCR amplification was performed according to the following
conditions: Initial denaturation for 2 min at 94˚C; 25 cycles of
denaturation at 94˚C for 30 sec, annealing at 54˚C for 30 sec and
extension at 72˚C for 1 min; followed by a final extension step for
5 min at 74˚C. PCR amplification was performed in a programmable
thermal cycler (PCR system 9700; Thermo Fisher Scientific, Inc.).
The amplified DNA fragments were fractionated on a 1.5% agarose gel
and stained with ethidium bromide (final concentration 0.2-0.5
µg/ml; Bio-Rad Laboratories, Inc.).
Western blot analysis
Cells were lysed with RIPA lysis buffer (ATTO
Corporation) and protein concentrations were determined using the
SMART™ Micro BCA Protein Assay kit (Intron Biotechnology, Inc.).
Proteins (10 µg) were loaded on Mini-PROTEAN® TGX
Precast Gels (Bio-Rad Laboratories, Inc.) with 2X SDS buffer and
transferred to PVDF membranes using the Trans-Blot Turbo™ Transfer
Pack (Bio-Rad Laboratories, Inc.). The membranes were blocked at
room temperature for 1 h with 2% skim milk in TBS-0.05% Tween (BD
Biosciences) and were then exposed to primary antibodies for 1-2 h
at room temperature against SORBS1 (cat. no. HPA027559; 1:250;
Merck KGaA), AHNAK nucleoprotein (AHNAK; cat. no. sc-134252; 1:200;
Santa Cruz Biotechnology, Inc.), ERK (cat. no. 9102; 1:1,000; Cell
Signaling Technology, Inc.), phosphorylated (p)-ERK (cat. no. 9101;
1:250; Cell Signaling Technology, Inc.), Rho-associated coiled-coil
containing protein kinase 1 (ROCK1; cat. no. ab45171; 1:500;
Abcam), Lamin B (cat. no. sc-374015; 1:100; Santa Cruz
Biotechnology, Inc.), and β-actin (cat. no. sc-47778; 1:100; Santa
Cruz Biotechnology, Inc.). Subsequently, membranes were incubated
with anti-mouse IgG (H+L) secondary antibody, HRP (cat. no.
G-21040; 1:5,000; Thermo Fisher Scientific, Inc.) and anti-rabbit
IgG (H+L) secondary antibody, HRP (cat. no. G-21234; 1:5,000;
Thermo Fisher Scientific, Inc.). ECL reagent (Pierce™ ECL Western
Blotting Substrate; cat. no. 32106; Thermo Fisher Scientific, Inc.)
was used for visualization. In addition, nuclear and cytosolic
proteins were isolated from the cells using the Nucleus Cytosol
Fractionation kit (cat. no. AKR-171; Cell Biolabs, Inc.), according
to the manufacturer's protocol. Nuclear and cytosolic proteins also
underwent western blotting. Lamin B was used as a nuclear marker,
indicating that cytoplasmic proteins did not contaminate the amount
of AHNAK, which is known to be a nuclear protein. β-actin was used
as a loading control for each lane.
Cell migration assay
HCT116 and SNU-C4 cell suspensions containing
5×10⁵ cells/ml, were prepared in serum-free RPMI 1640
medium. MDA-MB-231 cells were analyzed as a positive control and
MCF7 cells were analyzed as a negative control. Complete medium
(500 µl) was added to the lower chamber of the migration plate
(24-well plate) and a 300-µl cell suspension solution was added to
the upper chamber, which contained a 24-well insert (polycarbonate
membrane; pore size, 8.0 µm; Cell Biolabs, Inc.). The cells were
incubated for 24 h in a cell culture incubator, after which, the
cells attached to the insert in the upper chamber were removed
using a cotton-tipped swab. The lower side of the insert membrane
was stained with crystal violet for 10 min at room temperature. The
insert was then washed several times in water and air-dried.
Finally, the insert was transferred to an empty well and 200 µl
dimethyl sulfoxide was added at room temperature for 15 min, after
which, a 100-µl aliquot of dimethyl sulfoxide was transferred to a
96-well plate and the absorbance was measured at 560 nm. ImageJ
(ver. 64-bit Java 1.8.0_112; National Institutes of Health) was
used for accurate identification of migrated cells.
Cell proliferation assay
A total of 2×10⁴ cells were seeded in
each well of a 96-well plate and incubated for 24 h at 37˚C in an
atmosphere containing 5% CO2 and 95% air. Insulin
solution (200 nM; 11.5 mg/ml; cat. no. I9278; Merck KGaA) was used
to treat HT29 cells at 37˚C for 1, 4 and 8 h. Cell growth was
measured via a colorimetric assay using water-soluble tetrazolium
(WST-1; Dongin Biotech Co., Ltd.). Briefly, 10 µl WST-1 reagent was
added to cells and incubated for 2 h at 37˚C in an atmosphere
containing 5% CO2 and 95% air. The colorimetric optical
density (OD) value of cell growth was measured at 450 nm. To
confirm the direct proportion between OD value of cells and the
number of cells, the WST-1 OD value was compared with the number of
cells obtained by manual cell counting.
Colony formation assay
Cells were harvested using trypsinization and washed
with PBS. Cells (50-100 cells/well) were then suspended with 4%
agarose gel (pre-warmed; cat. no. 18300012; Thermo Fisher
Scientific, Inc.) and seeded in a 96-well plate. Cells were
incubated in RPMI 1640 media supplemented with 10% FBS, 100 U/ml
penicillin and 100 µg/ml streptomycin for 96 h at 37˚C in an
atmosphere containing 5% CO2 and 95% air. Subsequently,
medium was removed and 0.5% crystal violet (cat. no. V5265; Merck
KGaA) was added for 30 min at 37˚C in an atmosphere containing 5%
CO2 and 95% air. The plates were rinsed with water and
the number of colonies was counted.
Cell viability assay
Cell proliferation was measured via a colorimetric
WST-1 assay. A total of 4×10⁴ cells were seeded into
each well of a 96-well plate and incubated at 37˚C in an atmosphere
containing 5% CO2 and 95% air for 24 h. The seeded cells
were then treated with a serial dilution (0-15 mM) of 5-Fu (cat.
no. S1209; Selleck Chemicals) for 72 h at 37˚C in an atmosphere
containing 5% CO2 and 95% air. Subsequently, cells were
treated with 10 µl WST-1 reagent and incubated for 2 h at 37˚C in
an atmosphere containing 5% CO2 and 95% air. The cell
viability was measured based on the colorimetric OD value at 450
nm. The OD value of the cells treated with 0 µM drug was set at
100. The viability of cells under the drug treatment condition was
calculated as ODdrug/ODcontrol ×100. The half maximal effective
concentration was calculated using GraphPad Prism version 5.03
(GraphPad Software, Inc.).
Immunocytochemistry
HCT-116 and SNU-C4 cells (5×10⁵ cells/ml;
0.5 µl) were placed on rounded glass cover-slips and incubated for
24 h. Subsequently, the cells were fixed with 3.7% formaldehyde at
room temperature for 15 min and were permeablilized with 0.25%
Triton X-100. PBS-0.1% Tween-20 containing 1% bovine serum albumin
(Thermo Fisher Scientific, Inc.) was added to the fixed cells for
30 min at 4˚C. After this blocking step, the cells were incubated
with primary antibodies against SORBS1 (cat. no. HPA027559; 1:100;
Merck KGaA) and AHNAK (cat. no. sc-134252; 1:50; Santa Cruz
Biotechnology, Inc.) for 2 h at room temperature, and Alexa
Fluor® 488 (cat. no. A32731; 1:500) and 568 (cat. no.
A11031, 1:500) antibodies (Thermo Fisher Scientific, Inc.) were
then added to the cells. Finally, the cells were incubated with 1X
DAPI solution for 20 min at room temperature. A confocal microscope
(LSM800; Zeiss AG) was used to identify the stained cellular
proteins.
Cell cycle analysis
HT29 and SW620 cells (1×10⁶ cells/ml; 2
ml) were trypsinized and fixed in cold 70% ethanol for 30 min at
4˚C. The cells were centrifuged (500 x g) at 4˚C for 5 min and the
supernatant aspirated to avoid cell loss. To remove RNA and ensure
that only DNA was stained, PBS containing 50 µl 100 µg/ml RNase
stock (cat. no. EN0531; Thermo Fisher Scientific, Inc.) was added
to the cells and 250 µg/ml prop-idium iodide was added. After
staining, cells were analyzed by flow cytometry (FACS Canto II; BD
Biosciences) to determine the percentage of cells in each of the
different cell phases. The absorbance of dyed cells was measured at
an OD of 605 nm.
Immunoprecipitation
Immunoprecipitation was performed using the
Immunoprecipitation kit (cat. no. K286; BioVision, Inc.), according
to the manufacturer's instructions (18). Briefly, HCT-116 and SNU-C4 cells
were rinsed with ice-cold PBS and lysed in 500 µl RIPA lysis
buffer. To pre-clear the cell lysate, 100 µl protein A or G beads
were incubated with the cell lysate at 4˚C for 30 min with gentle
agitation; the protein A or G beads were removed by centrifugation
at 14,000 x g at 4˚C for 10 min. Pre-cleared lysates were
immunoprecipitated with primary anti-SORBS1 antibody (3 µg; cat.
no. HPA027559; Merck KGaA) overnight at 4˚C, and the
immunoprecipitation complexes with beads were collected and washed
with washing buffer three times. The beads were neutralized by
washing two times with 150 µl RIPA lysis buffer and 20-40 µl 2X SDS
buffer (cat. no. LC2676; Thermo Fisher Scientific, Inc.) was added
at 95˚C for 5 min. For western blotting to confirm
immunoprecipitation, PVDF membranes (Trans-Blot Turbo™ Transfer
Pack; cat. no. 1704156; Bio-Rad Laboratories, Inc.) were probed
with SORBS1 (cat. no. HPA027559; 1:250; Merck KGaA) and AHNAK (cat.
no. sc-134252; 1:200; Santa Cruz Biotechnology, Inc.) antibodies.
The western blotting protocol was the same as aforementioned.
Liquid chromatography-mass
spectrometry/mass spec- trometry (LC-MS/MS) analysis and database
search
Immunoprecipitation products of HCT-116 and SNU-C4
cells were analyzed by LC-MS/MS. LC-MS/MS was conducted according
to a previously described protocol (19). Tryptic-digested peptides were
analyzed using the Q Exactive™ Hybrid Quadrupole-Orbitrap™ mass
spectrometer (Thermo Fisher Scientific, Inc.) coupled with an
Ultimate™ 3000 RSLCnano system (Thermo Fisher Scientific, Inc.).
The tryptic-digested peptides (0.2 µg/µl, 3 µl) were loaded onto a
trap column (100 µm x2 cm) packed with Acclaim PepMap100 C18 resin
and were eluted with a linear gradient of solvent B from 5-30%
(0.1% formic acid in acetonitrile) for 120 min at a flow rate of
300 nl/min. The eluted peptides separated by the analytical column
(75 µm x15 cm) were sprayed into a nano-electrospray ionization
source with an electrospray voltage of 2.4 kV. The Q Exactive™
Hybrid Quadrupole-Orbitrap™ mass spectrometer was operated using a
top 10 data-dependent method. Full MS scans were acquired over a
m/z range of 300-2,000 with a mass resolution of 70,000 (at m/z
200). The automatic gain control target value was 1.00E+06. The 10
most intense peaks with a charge state ≥2 were fragmented in the
higher-energy collisional dissociation collision cell with a
normalized collision energy of 25%, and tandem mass spectra were
acquired in the Orbitrap mass analyzer with a mass resolution of
17,500 at m/z 200.
Database searching of all raw data files was
performed using Proteome Discoverer 1.4 software (Thermo Fisher
Scientific, Inc.). MASCOT 2.3.2 (Matrix Science, Inc.) and SEQUEST
(Comet, release 2018.01 rev. 3; http://comet-ms.sourceforge.net/) were used for
database searching against the Uniprot database (UniRef100;
https://www.uniprot.org/uniref/).
Database searching against the corresponding reversed database was
also performed to evaluate the false discovery rate (FDR) of
peptide identification. The database searching parameters included
up to two missed cleavages for full tryptic digestion, a precursor
ion mass tolerance of 10 ppm, a fragment ion mass tolerance of 0.02
Da, fixed modification for carbamidomethyl cysteine and variable
modifications for methionine oxidation, and N/Q deamination. An FDR
of <1% was obtained on the peptide level and filtered with high
peptide confidence.
Statistical analysis
SORBS1 was the key word searched for using The Human
Protein Atlas (https://www.proteinatlas.org) database, which was used
to confirm SORBS1 expression and its association with survival rate
according to cancer type (20).
Data were analyzed using Microsoft Excel 2016 (Microsoft
Corporation) and GraphPad Prism version 5.03 and are expressed as
the mean ± standard deviation. Data were analyzed with a two-tailed
unpaired t-test. All experiments were repeated three to five times.
P<0.05 was considered to indicate a statistically significant
difference.
Results
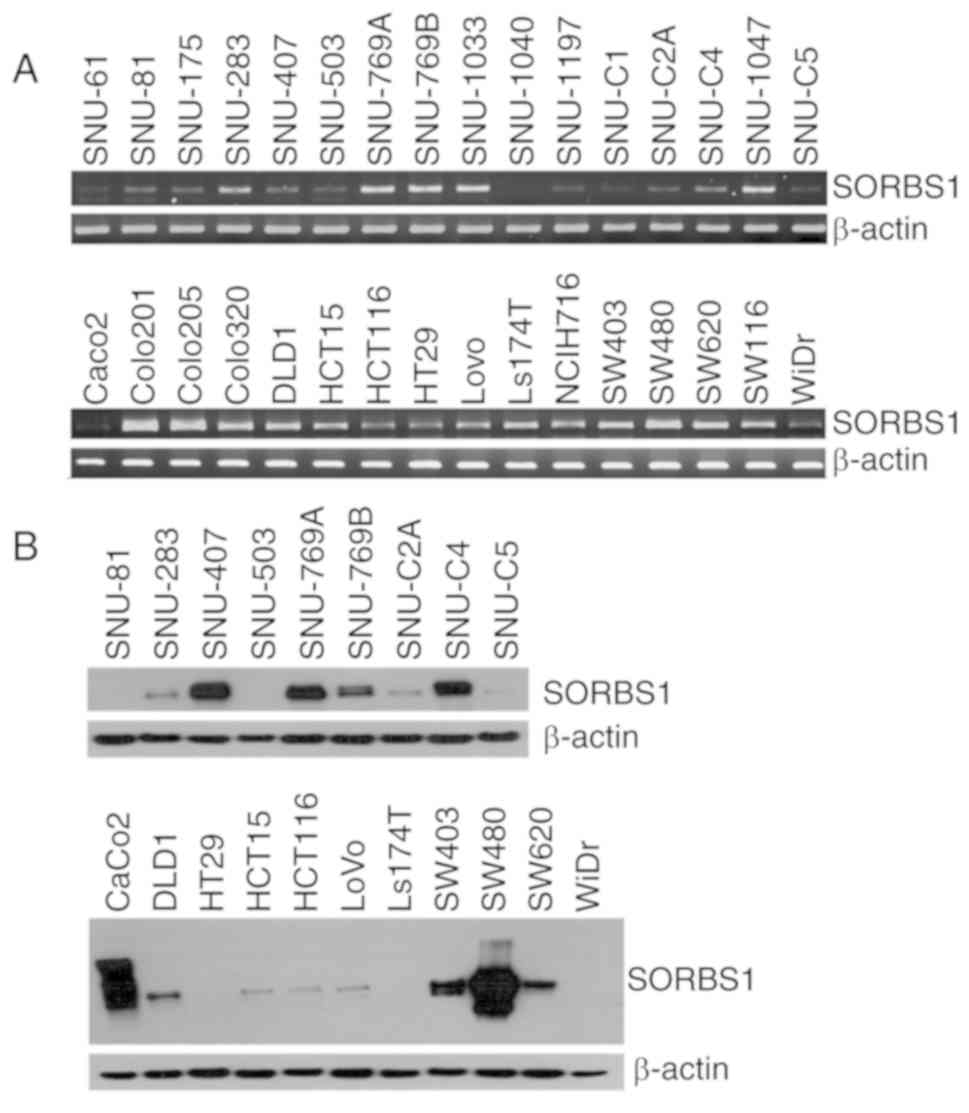
SORBS1 is expressed at various levels in
a number of colorectal cancer cell lines
SORBS1 expression was analyzed by RT-PCR and western
blotting in 32 colorectal cancer cell lines. The results
demonstrated that the mRNA and protein expression levels of SORBS1
varied in all of the cell lines, even though they were derived from
the same colorectal cancer type (Fig.
1A). Additionally, the protein expression levels were similar
between the cell lines derived from primary cancer and metastatic
cancer (Fig. 1B). Both SNU-769A
and SNU-769B, and SW480 and SW620 are primary-metastasis sets of
cancer cell lines. The protein expression levels of CAP (encoded by
SORBS1) were higher in SNU-769A and SW480 cells than in SNU-769B
and SW620 cells.
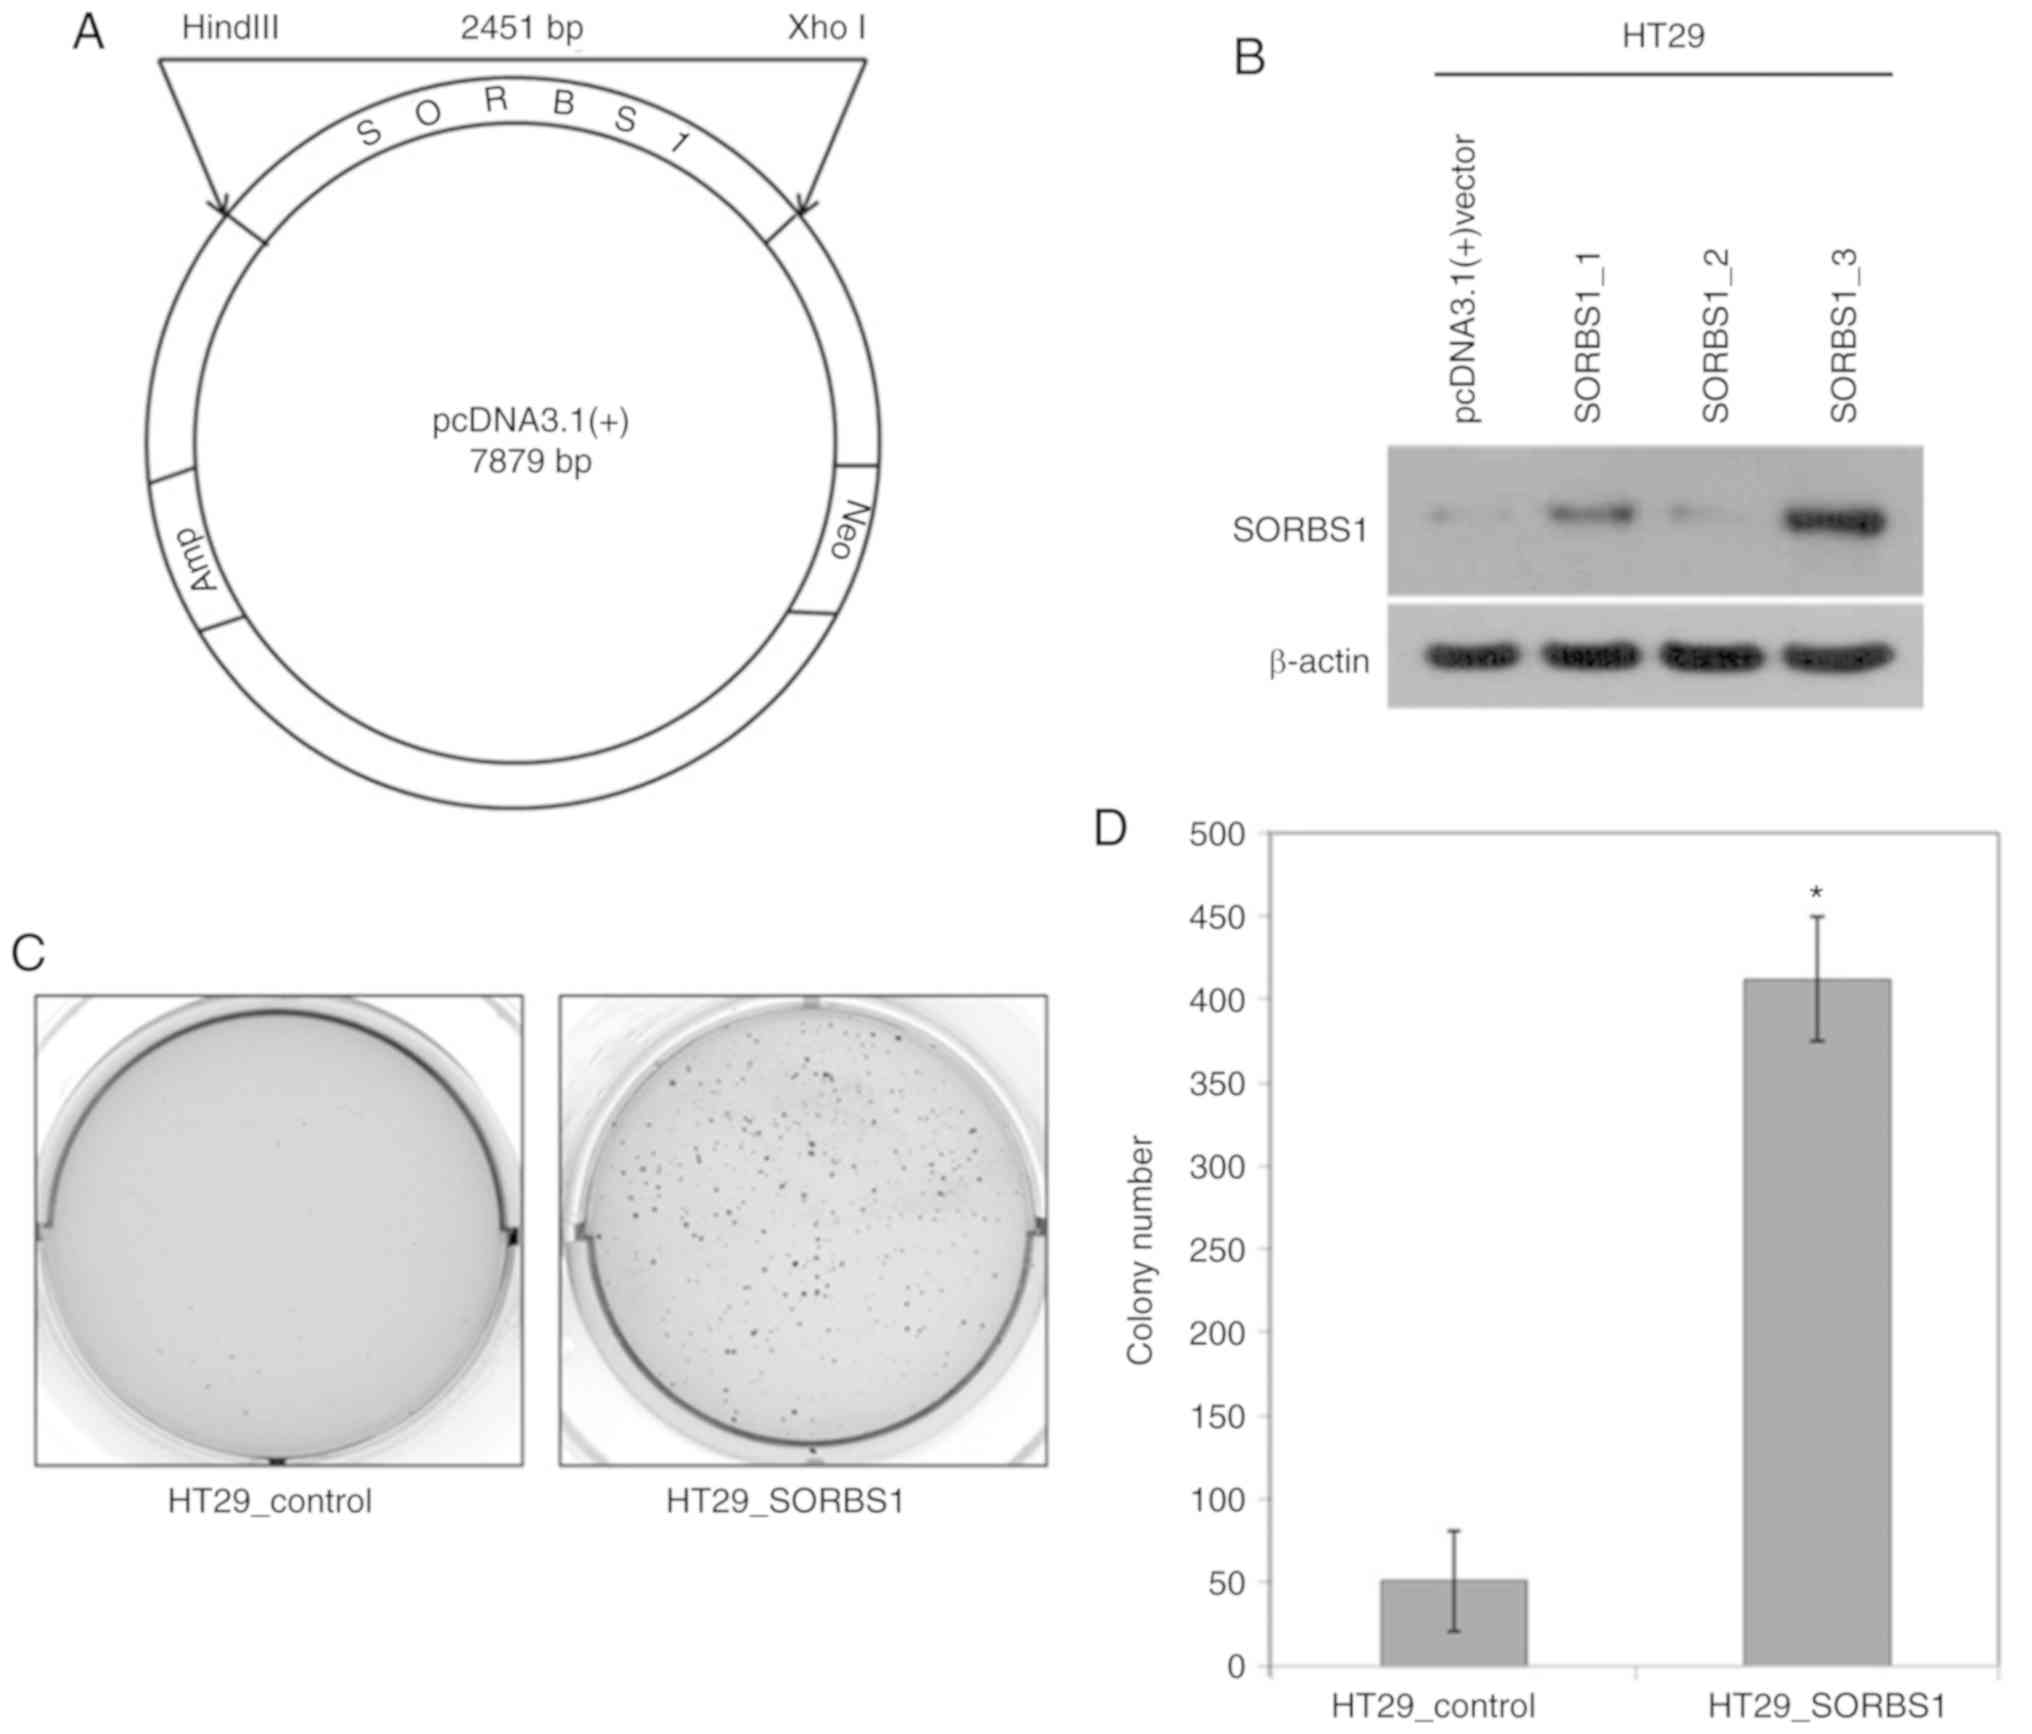
Overexpression of SORBS1 increases cell
proliferation
SORBS1 expression in the HT29 cell line was lower
than in the other cell lines (Fig.
1B). A 1,880-bp portion of the SORBS1 gene was inserted into
pcDNA 3.1 (+) (Fig. 2A). The
manipulated vector was used to overexpress SORBS1-encoded protein
in HT29 cells (Fig. 2B). The
number of colonies in the SORBS1-overexpressed group, as determined
using the colony formation assay, was significantly increased
compared with the control group (Fig.
2C and D); the overexpression group formed >8-fold more
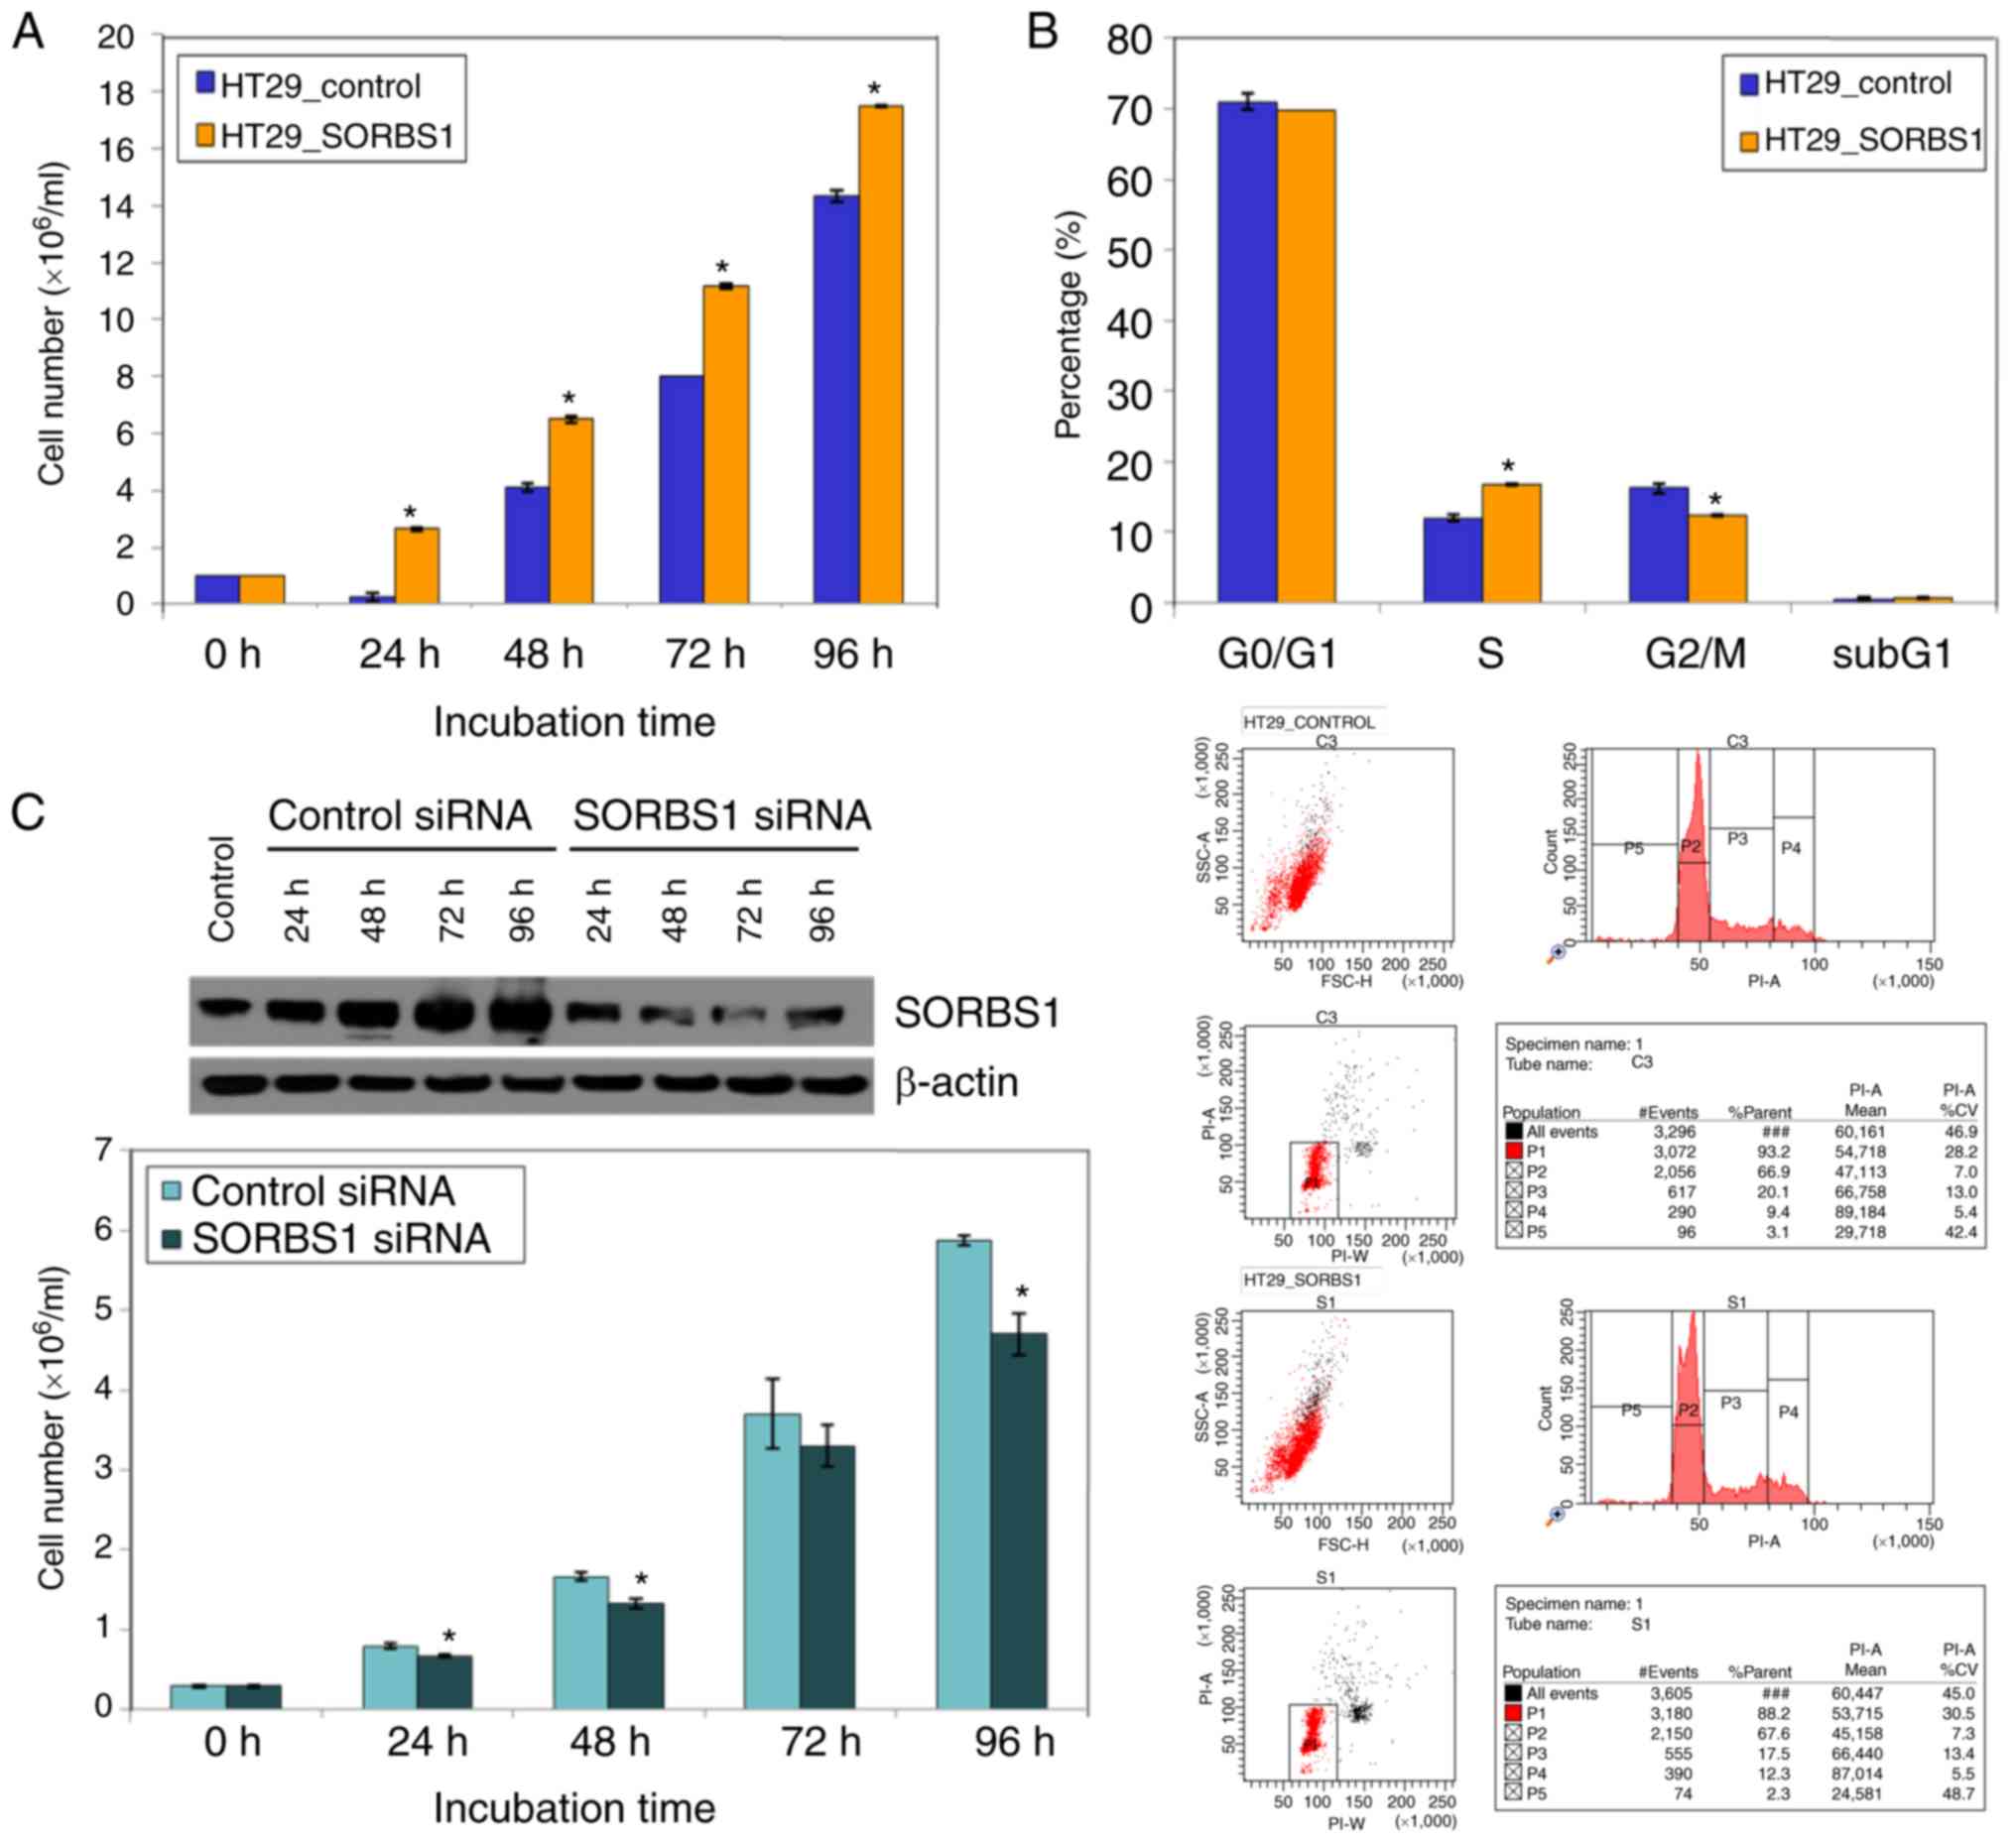
colonies than the control group. Moreover, the proliferative
ability was increased in the SORBS1 overexpression group compared
with the control group. The proliferative ability of the
overexpression group was significantly increased over the entire
incubation time (Fig. 3A). The
proportion of cells in S phase of the cell cycle was increased in
the SORBS1-overexpressed group compared with the control group.
Conversely, the proportion of cells in G2/M phase was
reduced in the SORBS1-overexpressed group compared with the control
group (Fig. 3B). These findings
indicated that SORBS1 overexpression induced an increase in cells
at S phase and activation of S phase may induce acceleration of
cell proliferation.
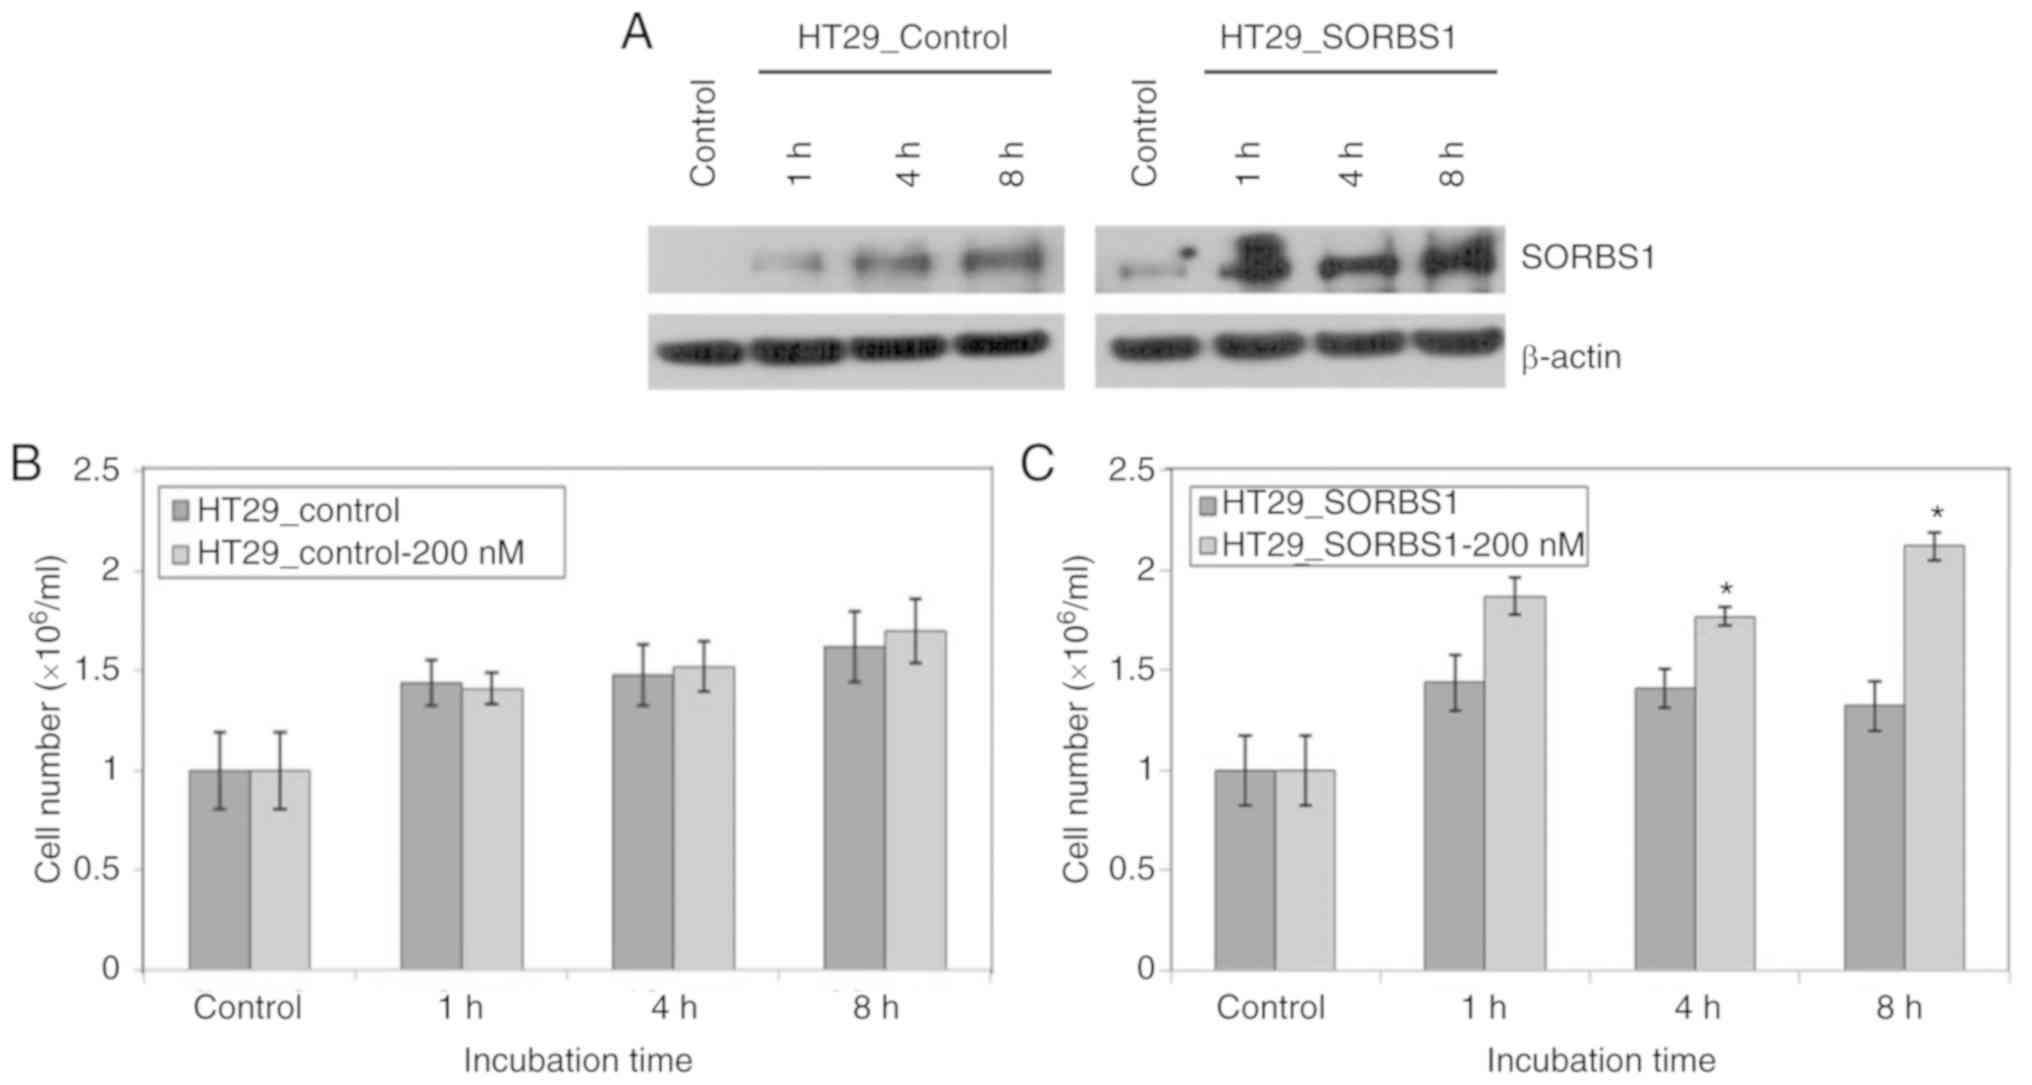
Furthermore, the proliferation of cells in the
SORBS1-overexpressed group was significantly higher than that of
the control group following treatment with 200 nM insulin, a known
SORBS1 activator (Fig. 4A-C).
Suppression of SORS1 decreased cell
proliferation
Transient knockdown of SORBS1 in HT29 cells using
siRNA for 96 h inhibited cell proliferation. Cell proliferation in
the SORBS1-knockdown group was reduced compared with that in the
control group. The difference was significant between the knockdown
group and the control group at all incubation time points, with the
exception of 72 h (Fig. 3C). To
elucidate the effect of consistent SORBS1 suppression on cell
functions, HCT-116 and SNU-C4 cell lines were transduced with
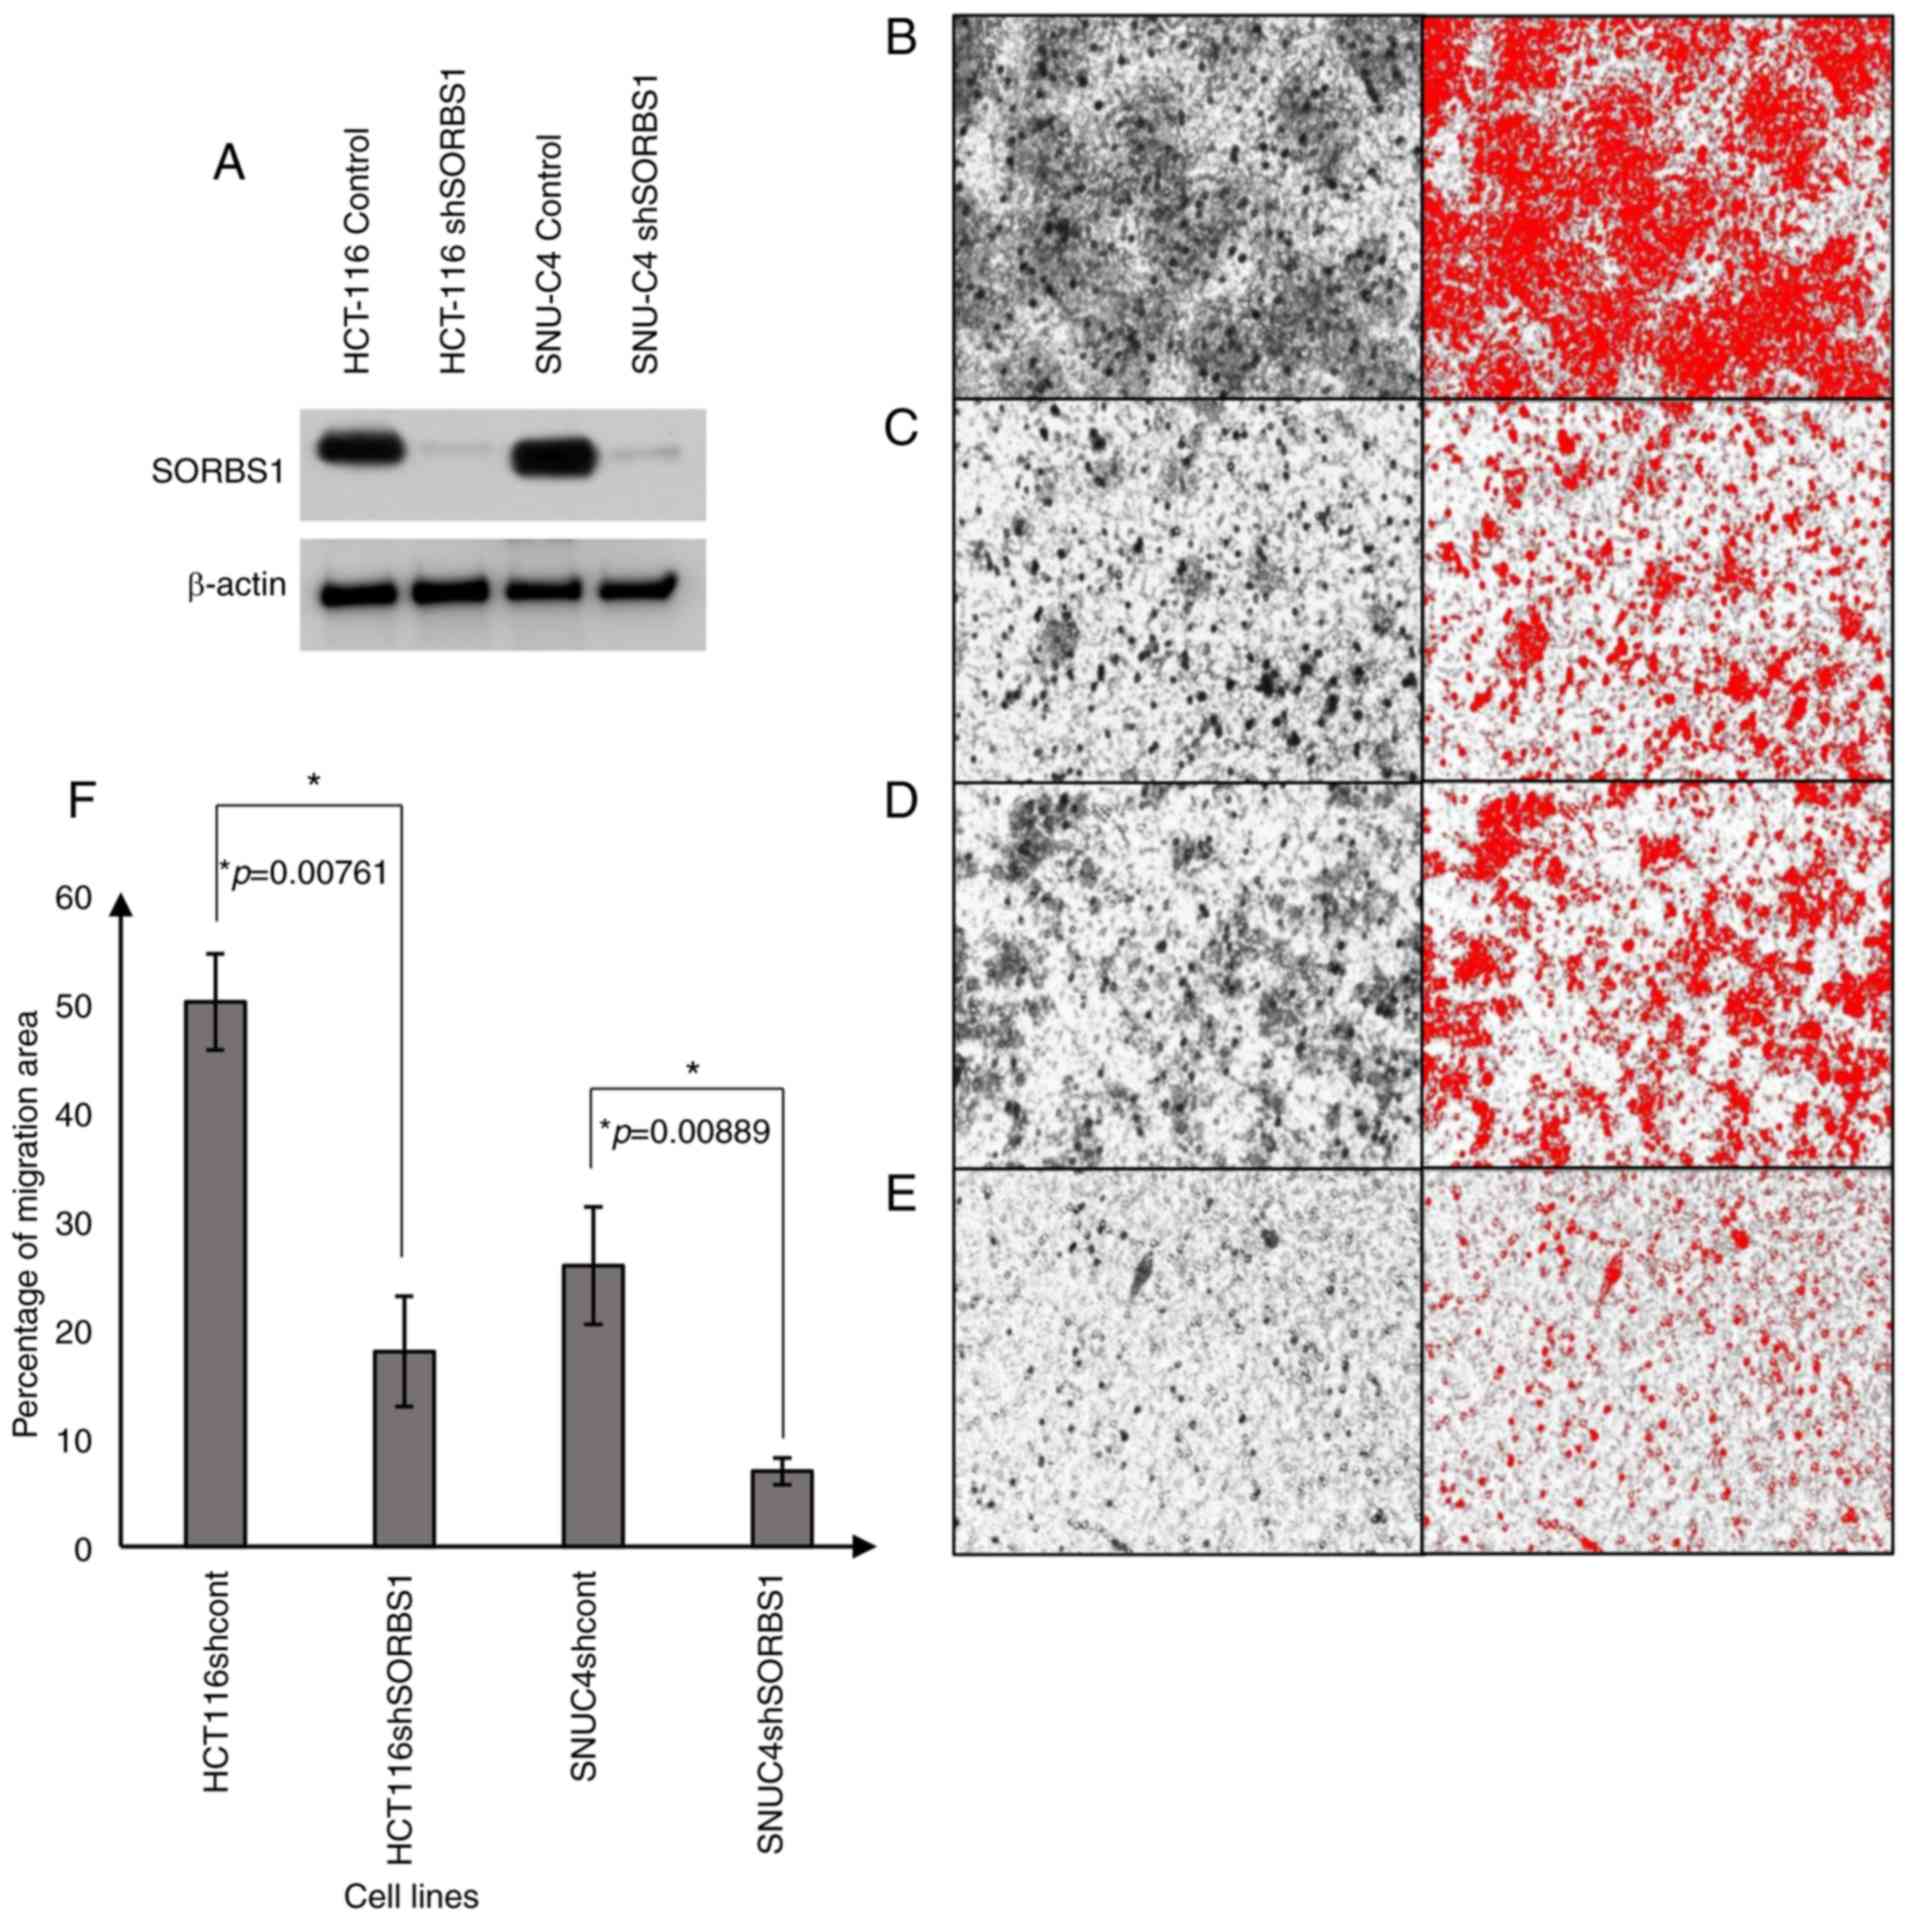
shRNA. SORBS1 expression was reduced in the knockdown group
compared with the control group in both cell lines (Fig. 5A). Cell migration assays revealed
that the number of migrated cells was reduced in the
SORBS1-knockdown groups compared with in the control groups in both
HCT-116 and SNU-C4 cell lines (Fig.
5B-E). The migration area of SORBS1-knockdown HCT-116 and
SNU-C4 cells was decreased by 31 and 26%, respectively (Fig. 5F). Additionally, following
treatment with 5-Fu, there was no significant difference in cell
viability between the control and SORBS1-knockdown groups (Fig. S1).
SORBS1-AHNAK complex regulates cell
proliferation and migration
AHNAK protein was detected by immu-noprecipitation
and was shown to be a promising candidate protein with numerous
SORBS1-binding proteins (Table I).
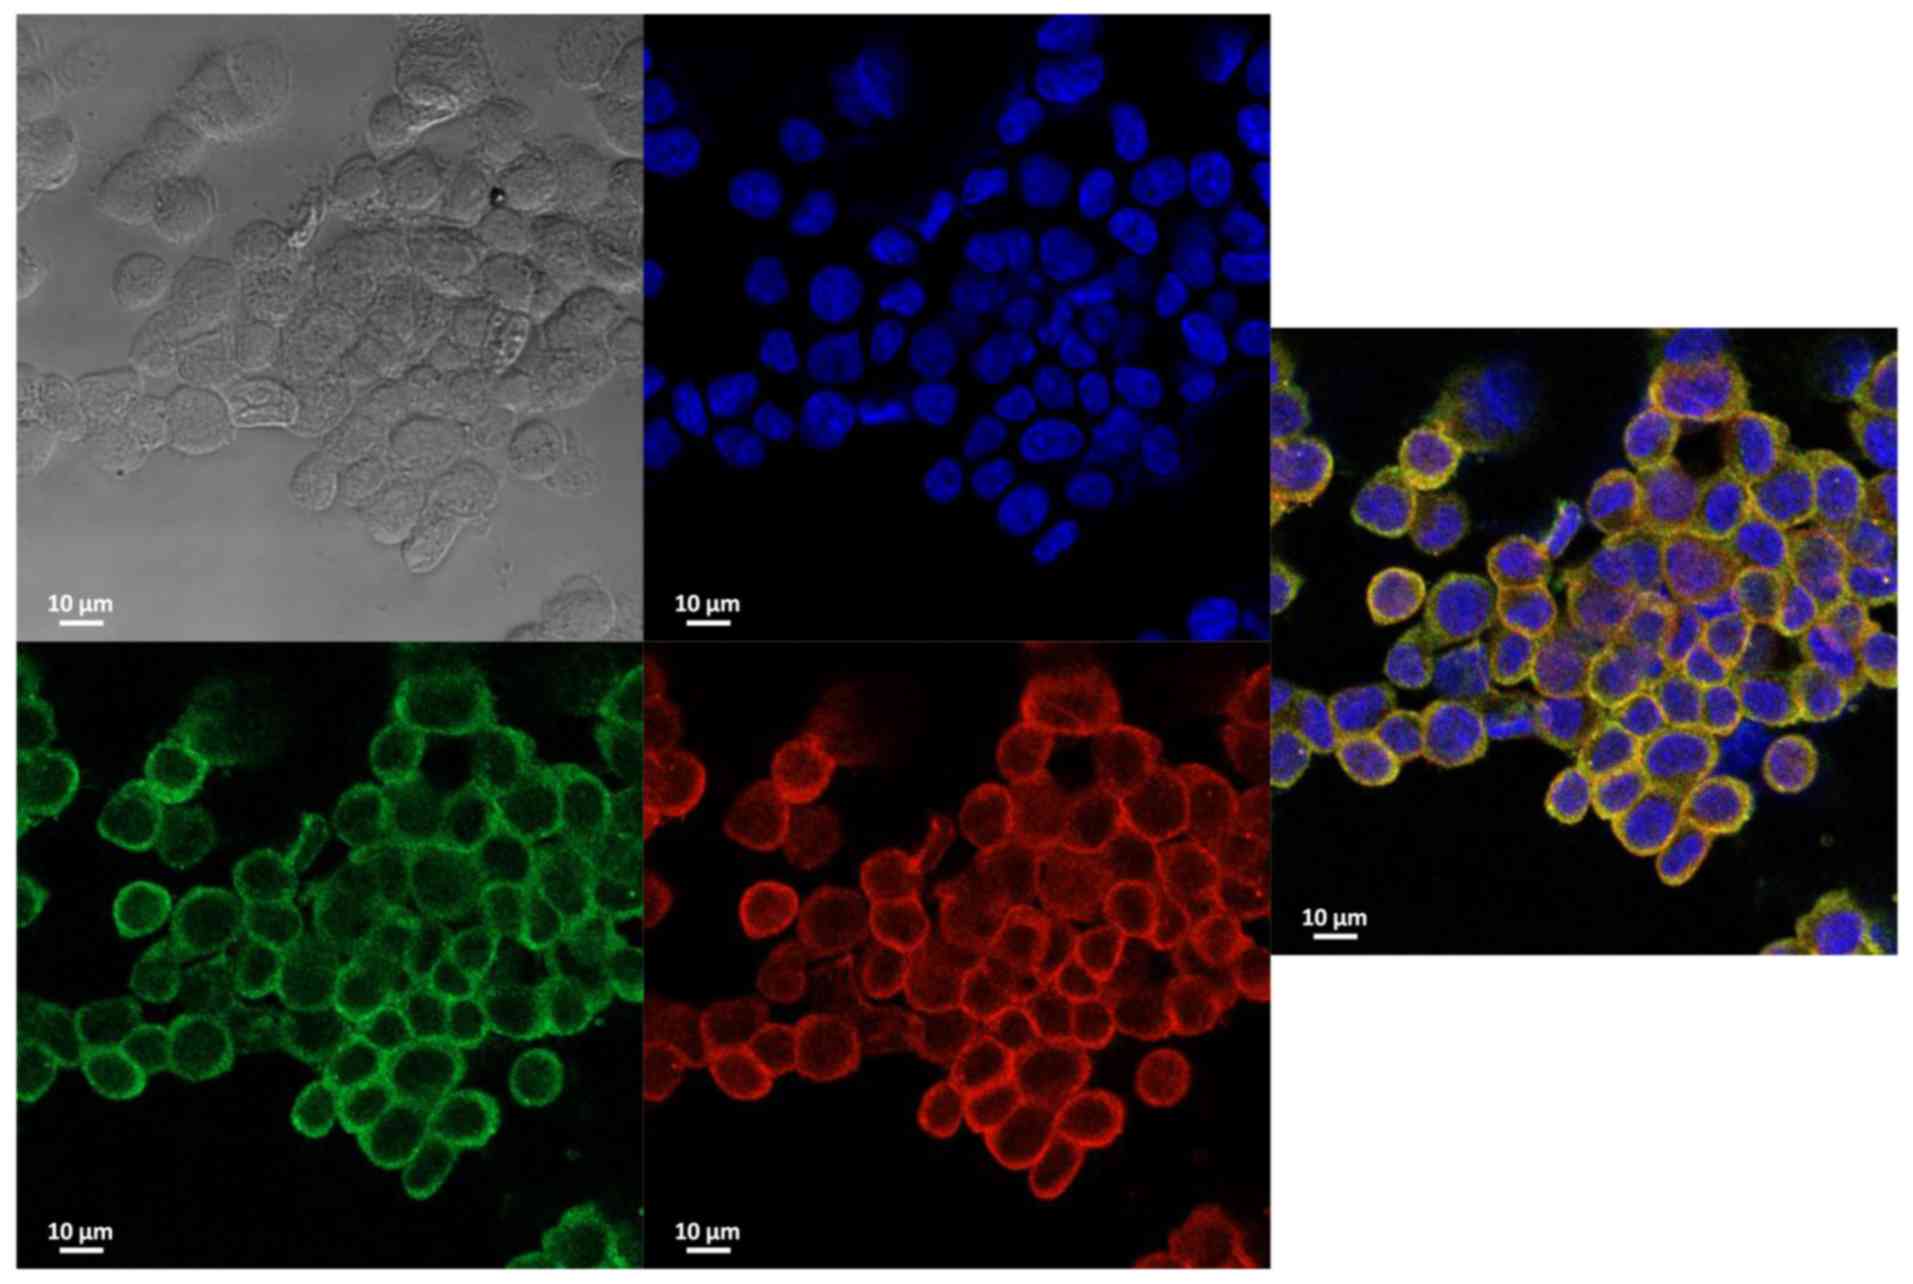
Co-localization between SORBS1 and AHNAK was confirmed using a
co-immunoprecipitation assay (Fig.
S2). Immunocytochemistry revealed that SORBS1 and AHNAK were
co-localized in the cytoplasm (Fig.
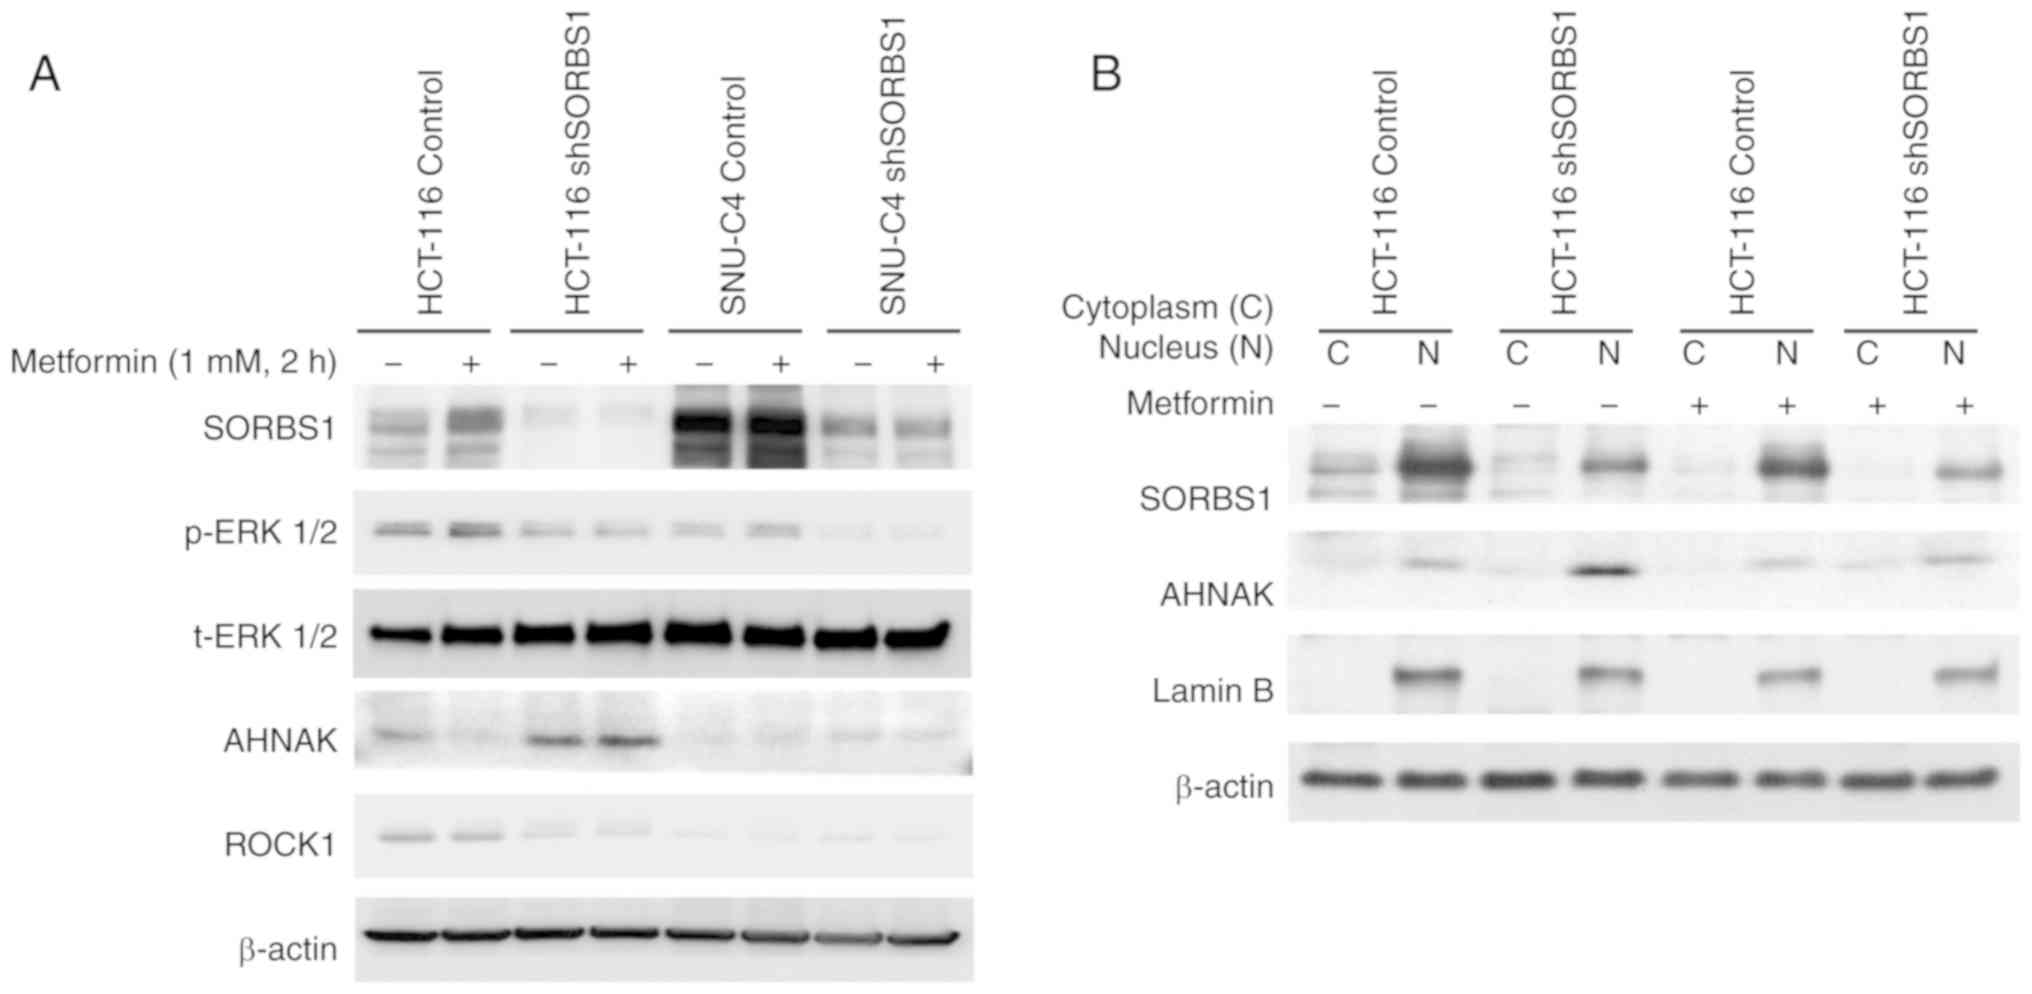
6). Metformin did not affect ROCK1 expression, but it induced
expression of SORBS1 in the control group of both cell lines
(Fig. 7A). Both p-ERK and ROCK1
were inhibited by suppression of SORBS1. SORBS1 was increased by
metformin treatment, which induced ERK phosphorylation; however,
the expression of AHNAK was decreased as SORBS1 expression
increased. AHNAK expression was negatively associated with SORBS1
expression, regardless of metformin treatment of whole cell lysates
(Fig. 7A). AHNAK expression was
enhanced by SORBS1 knockdown and this enhancement originated from
the nucleus (Fig. 7B).
 | Table IList of CAP-binding proteins. |
Table I
List of CAP-binding proteins.
| Accession no. | Description | Score | Coverage | Proteins | Unique
peptides | Peptides | PSMs | AAs | MW [kDa] | calc.pl |
|---|
| Q09666 | Neuroblast
differentiation-associated protein AHNAK
OS =Homo sapiens GN=AHNAK PE=1
SV=2- [AHNK_HUMAN] | 28.59 | 7.76 | 1 | 6 | 6 | 19 | 5,890 | 628.7 | 6.15 |
| P46940 | Ras
GTPase-activating-like protein IQGAP1
OS=Homo sapiens GN=IQGAP1 PE=1
SV= 1-[IQGA1_HUMAN] | 27.62 | 7.06 | 4 | 9 | 9 | 11 | 1,657 | 189.1 | 6.48 |
| A0A087WTA5 | Translation
initiation factor eIF-2B subunit δ
OS=Homo sapiens GN=EIF2B4 PE=4
SV= 1-[A0A087WTA5_HUMAN] | 4.30 | 2.12 | 5 | 1 | 1 | 2 | 520 | 57.5 | 9.38 |
| P02647 | Apolipoprotein
A-I
OS=Homo sapiens GN=APOAl PE=1
SV=l-[APOAl_HUMAN] | 70.87 | 43.45 | 2 | 12 | 12 | 23 | 267 | 30.8 | 5.76 |
| K7ES69 | Calponin-2 OS
=Homo sapiens GN=CNN2 PE=1
SV=1-[K7ES69_HUMAN] | 2.09 | 7.43 | 8 | 1 | 1 | 1 | 148 | 16.5 | 9.04 |
| Q5JR06 | Rho-related
GTP-binding protein RhoC (Fragment)
OS =Homo sapiens GN=RHOC PE=3 SV=3-
[Q5JR06_HUMAN] | 2.13 | 18.48 | 13 | 1 | 1 | 1 | 92 | 10.3 | 4.41 |
| Q9NR31 | GTP-binding protein
SAR1a
OS=Homo sapiens GN=SAR1A PE=1
SV=1-[SAR1A_HUMAN] | 133.12 | 59.09 | 5 | 6 | 9 | 33 | 198 | 22.4 | 6.68 |
| Q9Y6B6 | GTP-binding protein
SARlb
OS=Homo sapiens GN=SAR1B PE=1
SV=1-[SAR1B_HUMAN] | 69.94 | 66.16 | 7 | 5 | 8 | 19 | 198 | 22.4 | 6.11 |
| X1WI22 | GTP-binding protein
SARI a (Fragment)
OS=Homo sapiens GN=SAR1 A PE=4
SV=2-[X1WI22_HUMAN] | 2.04 | 21.57 | 7 | 1 | 1 | 1 | 51 | 5.8 | 9.25 |
Nuclear SORBS1 expression was greater than
cytoplasmic SORBS1 expression. AHNAK, a nucleoprotein, is localized
in the nucleus. The nuclear expression of AHNAK was also greater
than cytoplasmic AHNAK expression. The nuclear expression levels of
AHNAK in the SORBS1-knockdown group were higher than in the control
group, regardless of metformin treatment (Fig. 7B). The expression levels of SORBS1
and AHNAK were also negatively associated in both the cytoplasmic
and nuclear extracts. These findings indicated that SORBS1 may
inhibit AHNAK.
Discussion
CAP is encoded by SORBS1 and is a member of the SoHo
family of proteins. SoHo proteins interact with various signaling
molecules involved with cell migration (2,7,21,22),
and have been implicated in numerous cellular processes, including
insulin-stimulated glucose transport (2,23).
SORBS1 has been reported to be differentially
expressed in newly established cell lines derived from patients
with primary colorectal cancer compared with in metastatic
colorectal cancer cells through microarray analysis. In this
previous study, variable expression of SORBS1 was observed in a
number of colorectal cancer cell lines derived from primary cancer
and metastatic cancer (9). The
mRNA expression levels of SORBS1 in Caco2 cells were very low,
whereas the protein expression levels of SORBS1 in this cell line
were very high. mRNA and protein expression levels were often
inconsistent in this study, and the present results revealed that
SNU-C4 had lower mRNA expression levels than SNU-769A; however,
protein expression levels were higher in SNU-C4 cells than in
SNU-769A cells. The discrepancy between the mRNA and protein
expression levels in these cells may be due to post-transcriptional
modification. To elucidate the endogenous role of SORBS1, the
expression of SORBS1 was manipulated in several colorectal cancer
cell lines. Colony formation ability and proliferation were
enhanced by overexpression of SORBS1 in the HT29 cell line.
Conversely, the transient suppression of SORBS1 inhibited cell
proliferation. Furthermore, the constant suppression of SORBS1 in
the HCT-116 and SNU-C4 cell lines impeded cell migration. These
findings suggested that SORBS1 suppression decreased important
properties involved in cancer cell proliferation and migration,
indicating that SORBS1 may have an important role in sustaining
cell proliferation and in cancer metastasis.
Since SORBS1 is known as an adaptor protein
(1,6), immunoprecipitation of SORBS1 was
performed to search for numerous binding components that may affect
proliferation and migration. The results identified AHNAK as a
convincing candidate protein that may bind to SORBS1. Several
studies have reported that AHNAK functions as a cell cycle
regulator by binding to specific signaling molecules, including
TGFβ/Smad (24-27).
Notably, SORBS1 suppression simultaneously reduced
p-ERK expression, downregulated ROCK1 and upregulated AHNAK. As
aforementioned, SORBS1 and AHNAK were co-localized through direct
interaction; therefore, it may be hypothesized that SORBS1 and
AHNAK can bind each other as a protein complex. Furthermore, AHNAK,
a known nucleoprotein was abundantly activated when SORBS1 was
suppressed. It has previously been reported that AHNAK was a
negative regulator of cell growth and acted as a tumor suppressor
via modulation of the TGFβ/Smad signaling pathway (26). Additionally, ROCK1 may regulate
cell migration ability (28).
Indeed, in the present study, AHNAK was increased in response to
SORBS1 knockdown, and ERK phosphorylation and ROCK1 expression were
inhibited. These findings indicated that AHNAK may inhibit the
characteristics associated with cancer metastasis.
The protein expression of SORBS1 was relatively high
in SNU-C4 cells. Therefore, the expression of AHNAK was difficult
to observe due to the high expression of SORBS1. Notably, more
clear results were obtained from HCT-116 cells compared with SNU-C4
cells. It was revealed that the expression levels of SORBS1 and
AHNAK were negatively associated in HCT116 and SNU-C4 cell lines.
AHNAK suppression might activate ERK phosphorylation and ROCK1
expression. Cell proliferation and migration could subsequently be
induced by p-ERK and ROCK1, respectively (29,30).
SORBS1 knockdown decreased cell proliferation and migration; this
may be because SORBS1 could no longer act as an AHNAK inhibitor.
Additionally, according to the Human Protein Atlas results
(http://www.proteinatlas.org) for
patients with colorectal cancer, the high SORBS1 expression group
(n=120) had a lower survival rate than the low expression group
(n=477). These results are consistent with the present findings
that SORBS1, which inhibits AHNAK, may increase proliferation and
migration of colorectal cancer cells through ERK phosphorylation
and ROCK1 activation.
In conclusion, these results indicated that SORBS1
was normally complexed with AHNAK. AHNAK may function as a tumor
suppressor through the inhibition of p-ERK and ROCK1. Therefore,
SORBS1 could serve a key role in cancer cell growth and migration
via inhibition of AHNAK expression. Taken together, it was
hypothesized that SORBS1 may be a potential therapeutic target, the
suppression of which could inhibit metastasis of colorectal
cancer.
Supplementary Data
Funding
The Korean Cell Line Research Foundation and Mr.
Woo-Cheol Cho received a scholarship from the BK21-plus education
program provided by the NRF.
Availability of data and materials
The datasets generated and/or analyzed during the
current study are not publicly available due to an ongoing study
but are available from the corresponding author on reasonable
request.
Authors' contributions
WCC and JEJ performed the majority of experiments
and analyzed the data. KHK and BCY performed the
immuno-precipitation investigation. JLK designed and coordinated
the research. WCC and JLK wrote the paper. All authors read and
approved the final manuscript.
Ethics approval and consent to
participate
Not applicable.
Patient consent for publication
Not applicable.
Competing interests
The authors declare that they have no competing
interests.
Acknowledgements
Not applicable.
References
|
1
|
Ahn MY, Katsanakis KD, Bheda F and Pillay
TS: Primary and essential role of the adaptor protein APS for
recruitment of both c-Cbl and its associated protein CAP in insulin
signaling. J Biol Chem. 279:21526–21532. 2004. View Article : Google Scholar : PubMed/NCBI
|
|
2
|
Baumann CA, Ribon V, Kanzaki M, Thurmond
DC, Mora S, Shigematsu S, Bickel PE, Pessin JE and Saltiel AR: CAP
defines a second signalling pathway required for insulin-stimulated
glucose transport. Nature. 407:202–207. 2000. View Article : Google Scholar : PubMed/NCBI
|
|
3
|
Collier CA, Bruce CR, Smith AC, Lopaschuk
G and Dyck DJ: Metformin counters the insulin-induced suppression
of fatty acid oxidation and stimulation of triacylglycerol storage
in rodent skeletal muscle. Am J Physiol Endocrinol Metab.
291:E182–E189. 2006. View Article : Google Scholar : PubMed/NCBI
|
|
4
|
Rojas LB and Gomes MB: Metformin: An old
but still the best treatment for type 2 diabetes. Diabetol Metab
Syndr. 5:62013. View Article : Google Scholar : PubMed/NCBI
|
|
5
|
Mandai K, Nakanishi H, Satoh A, Takahashi
K, Satoh K, Nishioka H, Mizoguchi A and Takai Y: Ponsin/SH3P12: An
l-afadin- and vinculin-binding protein localized at cell-cell and
cell-matrix adherens junctions. J cell Biol. 144:1001–1017. 1999.
View Article : Google Scholar : PubMed/NCBI
|
|
6
|
Kioka N, Ueda K and Amachi T: Vinexin,
CAP/ponsin, ArgBP2: A novel adaptor protein family regulating
cytoskeletal organi-zation and signal transduction. Cell Struct
Funct. 27:1–7. 2002. View
Article : Google Scholar : PubMed/NCBI
|
|
7
|
Ribon V, Printen JA, Hoffman NG, Kay BK
and Saltiel AR: A novel, multifunctional c-Cbl binding protein in
insulin receptor signaling in 3T3-L1 adipocytes. Mol Cell Biol.
18:872–879. 1998. View Article : Google Scholar : PubMed/NCBI
|
|
8
|
Ribon V, Herrera R, Kay BK and Saltiel AR:
A role for CAP, a novel, multifunctional Src homology 3
domain-containing protein in formation of actin stress fibers and
focal adhesions. J Biol Chem. 273:4073–4080. 1998. View Article : Google Scholar : PubMed/NCBI
|
|
9
|
Kim SC, Hong CW, Jang SG, Kim YA, Yoo BC,
Shin YK, Jeong SY, Ku JL and Park J: Establishment and
characterization of paired primary and peritoneal seeding human
colorectal cancer cell lines: Identification of genes that mediate
metastatic potential. Transl Oncol. 11:1232–1243. 2018. View Article : Google Scholar : PubMed/NCBI
|
|
10
|
Yang WS, Lee WJ, Huang KC, Lee KC, Chao
CL, Chen CL, Tai TY and Chuang LM: mRNA levels of the
insulin-signaling molecule SORBS1 in the adipose depots of
nondiabetic women. Obes Res. 11:586–590. 2003. View Article : Google Scholar : PubMed/NCBI
|
|
11
|
Blake TJ, Heath KG and Langdon WY: The
truncation that generated the v-cbl oncogene reveals an ability for
nuclear transport, DNA binding and acute transformation. EMBO J.
12:2017–2026. 1993. View Article : Google Scholar : PubMed/NCBI
|
|
12
|
Blake TJ, Shapiro M, Morse HC III and
Langdon WY: The sequences of the human and mouse c-cbl
proto-oncogenes show v-cbl was generated by a large truncation
encompassing a proline-rich domain and a leucine zipper-like motif.
Oncogene. 6:653–657. 1991.PubMed/NCBI
|
|
13
|
Andoniou CE, Thien CB and Langdon WY:
Tumour induction by activated abl involves tyrosine phosphorylation
of the product of the cbl oncogene. EMBO J. 13:4515–4523. 1994.
View Article : Google Scholar : PubMed/NCBI
|
|
14
|
Buday L, Khwaja A, Sipeki S, Farago A and
Downward J: Interactions of Cbl with two adapter proteins, Grb2 and
Crk, upon T cell activation. J Biol Chem. 271:6159–6163. 1996.
View Article : Google Scholar : PubMed/NCBI
|
|
15
|
Fukazawa T, Reedquist KA, Trub T, Soltoff
S, Panchamoorthy G, Druker B, Cantley L, Shoelson SE and Band H:
The SH3 domain-binding T cell tyrosyl phosphoprotein p120.
Demonstration of its identity with the c-cbl protooncogene product
and in vivo complexes with Fyn, Grb2, and phosphati-dylinositol
3-kinase. J Biol Chem. 270:19141–19150. 1995. View Article : Google Scholar : PubMed/NCBI
|
|
16
|
Odai H, Sasaki K, Iwamatsu A, Hanazono Y,
Tanaka T, Mitani K, Yazaki Y and Hirai H: The proto-oncogene
product c-Cbl becomes tyrosine phosphorylated by stimulation with
GM-CSF or Epo and constitutively binds to the SH3 domain of
Grb2/Ash in human hematopoietic cells. J Biol Chem.
270:10800–10805. 1995. View Article : Google Scholar : PubMed/NCBI
|
|
17
|
Rivero-Lezcano OM, Sameshima JH, Marcilla
A and Robbins KC: Physical association between Src homology 3
elements and the protein product of the c-cbl proto-oncogene. J
Biol Chem. 269:17363–17366. 1994.PubMed/NCBI
|
|
18
|
Zhang X, Ozawa Y, Lee H, Wen YD, Tan TH,
Wadzinski BE and Seto E: Histone deacetylase 3 (HDAC3) activity is
regulated by interaction with protein serine/threonine phosphatase
4. Genes Dev. 19:827–839. 2005. View Article : Google Scholar : PubMed/NCBI
|
|
19
|
Myung JK, Yeo SG, Kim KH, Baek KS, Shin D,
Kim JH, Cho JY and Yoo BC: Proteins that interact with calgranulin
B in the human colon cancer cell line HCT-116. Oncotarget.
8:6819–6832. 2017. View Article : Google Scholar :
|
|
20
|
Uhlen M, Fagerberg L, Hallström BM,
Lindskog C, Oksvold P, Mardinoglu A, Sivertsson Å, Kampf C,
Sjöstedt E, Asplund A, et al: Proteomics. Tissue-based map of the
human proteome. Science. 347:12604192015. View Article : Google Scholar : PubMed/NCBI
|
|
21
|
Zhang M, Liu J, Cheng A, Deyoung SM, Chen
X, Dold LH and Saltiel AR: CAP interacts with cytoskeletal proteins
and regulates adhesion-mediated ERK activation and motility. EMBO
J. 25:5284–5293. 2006. View Article : Google Scholar : PubMed/NCBI
|
|
22
|
Cestra G, Toomre D, Chang S and De Camilli
P: The Abl/Arg substrate ArgBP2/nArgBP2 coordinates the function of
multiple regulatory mechanisms converging on the actin
cytoskeleton. Proc Natl Acad Sci USA. 102:1731–1736. 2005.
View Article : Google Scholar : PubMed/NCBI
|
|
23
|
Liu J, Kimura A, Baumann CA and Saltiel
AR: APS facilitates c-Cbl tyrosine phosphorylation and GLUT4
translocation in response to insulin in 3T3-L1 adipocytes. Mol Cell
Biol. 22:3599–3609. 2002. View Article : Google Scholar : PubMed/NCBI
|
|
24
|
Davis TA, Loos B and Engelbrecht AM:
AHNAK: The giant jack of all trades. Cell Signal. 26:2683–2693.
2014. View Article : Google Scholar : PubMed/NCBI
|
|
25
|
Dumitru CA, Bankfalvi A, Gu X, Zeidler R,
Brandau S and Lang S: AHNAK and inflammatory markers predict poor
survival in laryngeal carcinoma. PLoS One. 8. pp. e564202013,
View Article : Google Scholar
|
|
26
|
Lee IH, Sohn M, Lim HJ, Yoon S, Oh H, Shin
S, Shin JH, Oh SH, Kim J, Lee DK, et al: Ahnak functions as a tumor
suppressor via modulation of TGFβ/Smad signaling pathway. Oncogene.
33:4675–4684. 2014. View Article : Google Scholar : PubMed/NCBI
|
|
27
|
Shankar J, Messenberg A, Chan J, Underhill
TM, Foster LJ and Nabi IR: Pseudopodial actin dynamics control
epithelial-mesen-chymal transition in metastatic cancer cells.
Cancer Res. 70:3780–3790. 2010. View Article : Google Scholar : PubMed/NCBI
|
|
28
|
Xi ZW, Xin SY, Zhou LQ, Yuan HX, Wang Q
and Chen KX: Downregulation of rho-associated protein kinase 1 by
miR-124 in colorectal cancer. World J Gastroenterol. 21:5454–5464.
2015. View Article : Google Scholar : PubMed/NCBI
|
|
29
|
Mebratu Y and Tesfaigzi Y: How ERK1/2
activation controls cell proliferation and cell death: Is
subcellular localization the answer? Cell Cycle. 8:1168–1175. 2009.
View Article : Google Scholar : PubMed/NCBI
|
|
30
|
Hu C, Zhou H, Liu Y, Huang J, Liu W, Zhang
Q, Tang Q, Sheng F, Li G and Zhang R: ROCK1 promotes migration and
invasion of nonsmallcell lung cancer cells through the
PTEN/PI3K/FAK pathway. Int J Oncol. 55:833–844. 2019.PubMed/NCBI
|