Introduction
Metabolic reprogramming of cancer cells has become a
hot topic in cancer research (1,2). In
1924, Otto Warburg proposed that cancer cells rely predominantly on
aerobic glycolysis rather than the more efficient oxidative
phosphorylation of mitochondria to produce ATP, even when there is
sufficient oxygen supply. The use of aerobic glycolysis leads to an
increase in both glucose uptake and lactate production in cancer
cells and is termed the Warburg Effect (3,4).
Glucose uptake and the demand for metabolic intermediates increases
significantly in cancer cells to support rapid cell growth
(5). Previously, it was considered
that mitochondrial dysfunction in tumor cells leads to a
significant decrease of ATP production, thus resulting in a
compensatory increase of glycolysis (6-9).
However, to the best of our knowledge, the definitive mechanism of
the Warburg Effect and how it affects biosynthesis in tumor cells
remain unknown. With the development of modern biotechnology,
researchers found that in addition to aerobic glycolysis, other
metabolic pathways, such as the Krebs cycle (10,11),
fatty acid metabolism (12),
glutamine metabolism (13-15) and the pentose-phosphate pathway
(16), are abnormally regulated in
tumor cells. In addition, some studies considered that the aberrant
expression of oncogenes and tumor suppressor genes leads to
metabolic reprogramming in tumor cells (17-22).
CD38 has dual activities as a ADP-ribosyl cyclase
and cyclic ADP-ribose hydrolase (23,24).
CD38 is expressed in a variety of cells and regulates diverse
activities, such as signal transduction (23), cell adhesion (25), cyclic ADP-ribose synthesis
(26), and cell differentiation
and activation (27). CD38 is also
involved in regulating mitochondria functions (28,29).
Our previous study demonstrated that CD38 could promote cell
proliferation and inhibit cell apoptosis, probably by regulating
mitochondrial function (30). We
also identified that CD38 is highly expressed in cervical cancer
and is associated with the phosphatidylinositol-4,5-bisphosphate
3-kinase (PI3K)/Akt serine/threonine kinase (AKT) signaling
pathway. This indicates that CD38 plays an important role in the
energy metabolism of cancer cells and is also closely associated
with cervical cancer. However, the detailed role and mechanism of
CD38 in the carcinogenesis of cervical cancer remains unclear.
The present study aimed to investigate the potential
mechanism of CD38 in cervical cancer cells. First, liquid
chromatography-tandem mass spectrometry (LC-MS/MS) technology was
used to screen for proteins that were differentially abundant in
response to CD38 overexpression. Subsequently, the effect of CD38
on key molecules in the PI3K/AKT/mechanistic target of rapamycin
(mTOR) signaling pathway was detected. The effects of CD38 on ATP,
lactic acid and other metabolites in cervical cancer cells were
also analyzed. To clarify whether CD38 could promote cervical
cancer through the PI3K/AKT/mTOR signaling pathway, cells were
treated with the mTOR inhibitor rapamycin, and the functional
changes induced by CD38 after blocking the PI3K/AKT/mTOR signaling
pathway were analyzed. The results demonstrated that CD38 is
involved in cellular energy metabolism via activating the
PI3K/AKT/mTOR signaling pathway in cervical cancer cells.
Materials and methods
Cell lines and cell culture
conditions
The cervical cancer cell lines CaSki and HeLa were
maintained in the Molecular Genetics Laboratory (Central South
University, Changsha, China). Cervical cancer cells were cultured
in Roswell Park Memorial Institute (RPMI)-1640 medium containing
10% fetal bovine serum (FBS; both from Gibco; Thermo Fisher
Scientific, Inc.) with 5% CO2 at 37°C. The
CD38‑overexpressing cell lines (CaSki-CD38 and HeLa-CD38) and the
control cell lines (CaSki-vector and HeLa-vector) were transfected
with the CD38-overexpressing plasmid pEGFP-N1-CD38 and the control
plasmid pEGFP-N1 using Lipofectamine 2000 (Invitrogen; Thermo
Fisher Scientific, Inc.), according to the manufacturer's protocol,
as described previously (30,31).
The transfected cell lines were grown in RPMI-1640 supplemented
with 10% FBS and G418 (500 µg/ml). Following 3 weeks, the
stable cells were used for subsequent experiments.
Protein extraction and digestion
Protein extraction and digestion were performed as
previously described (32).
Briefly, cells were lysed using a protein extraction buffer
consisting of 50 nM Tris (pH 7.4), 150 mM NaCl, 1% Triton X-100, 1%
sodium deoxycholate, 0.1% SDA and sodium orthovanadate, sodium
fluoride, EDTA, leupeptin supplemented with 1X halt protease
inhibitor cocktail (CWBio) and 1X halt phosphatase inhibitor
cocktail (BestBio). The protein concentration was estimated using
the bicinchoninic acid (BCA) method using a Micro BCA™ Protein
assay kit (Thermo Fisher Scientific, Inc.). Then, cell lysates (50
µg of each sample) were loaded onto 10% SDS-PAGE gels and
separated electrophoretically at 80 volts for 40 min and then 120
volts for 60 min (PowerPac Universal; Bio-Rad Laboratories, Inc.).
Protein bands were visualized using Coomassie brilliant blue G-250
(Sigma-Aldrich; Merck KGaA) and excised from the gel into eight
slices. The proteins were destained using 15 mM
K4Fe(CN)6, and then 50 mM sodium thiosulfate
and 1.25 µg trypsin (1:20 enzyme/substrate ratio) were added
to each slice and in‑gel‑digestion was performed at 37°C overnight
for ~16 h. The generated peptides were extracted by sonication (15
min, with ice cooling) from the gel pieces in ~20 µl 50%
acetonitrile in 0.1% formic acid, twice. Following extraction, the
peptides were dried using vacuum centrifugation at room temperature
for 30 min to ensure the complete removal of acetonitrile and
reconstituted in 20 µl 0.1% formic acid.
LC‑MS/MS analysis of peptides
LC-MS/MS analysis was performed as previously
described (32). Briefly, peptides
were diluted using 0.1% formic acid. Then, peptides were
pre-concentrated. The analytes were transferred to the analytical
column and separated using a binary system. The mass spectrometer
was operated in the data-dependent mode. Normalized collision
energy was set to 35% and an isolation width of 2 m/z was
chosen.
Protein identification and
quantification
Protein identification and quantification were
performed as previously described (32,33).
Briefly, proteins were identified using Proteome Discoverer 1.4
software (Thermo Fisher Scientific, Inc.). Thermo raw files were
imported and used to conduct a search of the UniProt proteomes-Homo
sapiens database (UP000005640; https://www.uniprot.org/taxonomy/960). For database
searches, mass tolerances were set to 10 ppm and 0.8 Da for
precursor and fragment ions, respectively. Peptides identified with
false discovery rates <1% (q-value <0.01) were discarded. A
common contaminants database was also included for quality control.
Proteins that met the following criteria were considered
differentially expressed proteins: i) proteins had ≥2 peptides with
≥95% confidence; ii) proteins were considered downregulated when
the protein levels demonstrated an average fold‑change ≤0.5 in the
LC‑MS/MS analyses; and iii) proteins were considered upregulated
when the protein levels demonstrated an average fold‑change ≥2 in
the LC-MS/MS analyses (33).
Measurement of glucose concentration
Cells were trypsinized and inoculated into 6-well
cell culture plates (1×10⁶ cells/well), and then
incubated at 37°C in the presence of 5% CO2. Following
24-48 h, when the density of cells had reached ~80%, the culture
medium supernatant was transferred into a new centrifuge tube and
centrifuged at 1,000 × g for 5 min at 4°C to remove insoluble
materials. The supernatant was transferred into specific tubes to
detect the glucose concentration using an ADVIA 1650 automatic
biochemical analyzer (Siemens AG). Meanwhile, the cells in the
culture plate were trypsinized, washed with cold 1× PBS solution
and placed in microcentrifuge tubes. Following ultrasonication on
ice for 3 min, the samples were centrifuged at 12,000 × g for 20
min at 4°C. The supernatant was transferred into specific tubes to
detect the intracellular glucose concentration using the ADVIA 1650
automatic biochemical analyzer (Siemens AG). All values were
normalized on the basis of cell number.
Measurement of the cellular ATP
concentration
The cellular ATP concentration was measured using an
ATP detection assay kit (catalog no. S0026; Beyotime Institute of
Biotechnology), according to the manufacturer's protocol. Cells
were trypsinized, seeded into 6-well cell culture plates
(1×10⁶ cells/well) and incubated at 37°C in the presence
of 5% CO2. Following 24 h, when the cell density reached
~80%, the culture medium was aspirated from the plate and 200
µl ATP lysis buffer was added into each well. The lysis
buffer and cells were pipetted repeatedly to homogenize the cells
on ice for 5 min. The cell lysate was transferred into new
pre-cooled tubes and centrifuged at 12,000 × g for 15 min at 4°C.
The supernatant was transferred into new pre-cold tubes and kept on
ice. The ATP standard buffer and ATP detection buffer were
prepared. The ATP detection buffer was added into the wells of a
96-well plate (100 µl/well) and kept at room temperature for
5 min. The samples or ATP standard buffer were then added into the
wells (20 µl/well) and incubated in the dark for 5 min at
room temperature. The luminescence emitted by the samples was
detected using a Paradigm Detection Platform (Beckman Coulter,
Inc.). The concentration of cellular ATP (nmol/mg) was calculated
based on a standard curve. All values were normalized to the
protein concentration.
Measurement of the lactate
concentration
The lactate concentration was detected using a
Lactate assay kit (catalog no. MAK064; Sigma-Aldrich; Merck KGaA),
according to the manufacturer's protocol. Briefly, cells were
trypsinized and seeded into 6-well cell culture plates
(1×10⁶ cells/well). The cells were incubated at 37°C in
the presence of 5% CO2. Following 24-48 h, when the cell
density reached ~80%, the culture medium supernatant was
transferred into new centrifuge tubes, and centrifuged at 12,000 ×
g for 20 min at 4°C to remove insoluble materials. The supernatant
was transferred into 10 kDa cut‑off spin filters to deproteinize
the samples to remove enzymes that may consume lactate. The
filtrate was transferred into new tubes and kept on ice to detect
the lactate concentration in the medium. Meanwhile, cells in the
culture plate were digested and washed with cold 1× PBS solution
and the resuspended cells were placed in microcentrifuge tubes.
Following ultrasonication on ice for 3 min, the samples were
centrifuged at 12,000 × g for 20 min at 4°C. The supernatant was
transferred into 10 kDa cut‑off spin filters to deproteinize the
samples. The filtrate was transferred into new tubes and kept on
ice to detect the intracellular lactate concentration. Then, 50
µl samples were placed into the wells of a 96-well plate, 50
µl Master Reaction mix was added to each sample, and the
plate was incubated in the dark for 30 min at room temperature. The
absorbance value at 570 nm was detected with a microplate reader
and analyzed with SoftMAx Pro 6.4 (Beckman Coulter). The lactate
concentration was calculated based on a standard curve. All values
were normalized on the basis of cell number.
Western blotting analysis
Western blotting was performed as described
previously (30,31). The cells were trypsinized and then
lysed using RIPA lysate buffer (CWBio). Samples were centrifuged at
12,000 × g for 15 min at 4°C to remove insoluble materials. The
protein concentration estimated using the BCA method, and each
protein sample (50 µg) was electrophoresed using a 10%
SDS-PAGE gel at 80 volt for 40 min and then at 120 volt for 60 min
(PowerPac Universal; Bio-Rad Laboratories, Inc.). The separated
proteins were transferred onto a polyvinylidene fluoride membrane
(HyClone; GE Healthcare Life Sciences) at 100 volt for 90 min and
then the membranes were blocked for 1-2 h using 5% non-fat milk
dissolved in PBS-0.1% Tween 20. The membranes were then incubated
overnight with primary antibodies at 4°C. The following primary
antibodies were used: Anti-CD38 (catalog no. YM0122; ImmunoWay
Biotechnology Company), anti-3-phos-phoinositide dependent protein
kinase 1 (catalog no. YT3645; ImmunoWay Biotechnology Company),
anti-PI3K P110 (catalog no. YT3709; ImmunoWay Biotechnology
Company), anti-AKT (catalog no. YT0173; ImmunoWay Biotechnology
Company), anti-phosphorylated (p)-AKT T308 (catalog no. YP0590;
ImmunoWay Biotechnology Company), anti-mTOR (catalog no. YT2913;
ImmunoWay Biotechnology Company), anti-p-mTOR (catalog no. YP0716;
ImmunoWay Biotechnology Company), anti-lactate dehydrogenase A
(LDH-A; catalog no. 19987-1-AP; ProteinTech Group, Inc.) and
anti-ATP synthase peripheral stalk subunit D (ATP5H; catalog no.
YT0406; ImmunoWay Biotechnology Company). These antibodies were
stored at ‑20°C, and the dilution used for all antibodies was
1:1,000. The membranes were then washed and incubated with the
following horseradish peroxidase‑conjugated secondary antibodies
for 1 h at 37°C: Anti-rabbit secondary antibody (catalog no.
sc-2004; Santa Cruz Biotechnology. Inc.; 1:3,000) and anti-mouse
secondary antibody (catalog no. sc-2005; Santa Cruz Biotechnology.
Inc.; 1:3,000). The immunoreactive protein bands were then
visualized using ECL luminescent liquid (EMD Millipore) and
analyzed using Molecular Imager® Gel Dox XR System
(Bio-Rad Laboratories). Rabbit anti-GAPDH (catalog no. 2118; Cell
Signaling Technology, Inc.; 1:5,000), rabbit anti-β-actin (catalog
no. T0022; Affinity Biosciences; 1:5,000) and rabbit anti-β‑tubulin
antibody (catalog no. T0028; Affinity Biosciences; 1:5,000) were
used as controls. ImageJ (v 1.51; National Institutes of Health)
was used to quantitatively analyze the results.
Clonogenic assay
Cervical cancer cells were transfected with the
empty vector and the CD38 overexpression vector and then seeded at
a density of 800 cells/well in a 6-well plate. Following adherence,
the cells in the wells were treated with 0.1 µM DMSO and 0.1
µM rapamycin (catalog no. S1039; Selleck Chemicals) at 37°C
for 24 h. When the clone was visible to the naked eye, the culture
was terminated. The culture medium was discarded and the cells were
washed three times with PBS buffer. The cells were treated with
paraformaldehyde for 30 min at room temperature, washed with 1×
PBS, stained with 0.1% crystal violet for 30 min at room
temperature and washed with tap water. Images were then obtained
and the cells were counted.
Cell apoptosis experiment
A Hoechst33342/propidium iodide (PI) double staining
kit (catalog no. bb-4131; Bestbio) was used to detect cell
apoptosis according to the recommended protocol. The CD38
overexpression vector and the blank vector were transfected into
CaSki and HeLa cells. The cells were seeded in 6‑well plates and
cultured at 37°C with 5% CO2. After adhering to the
wall, the cells were treated with DMSO and rapamycin. Following 24
h, the cells were digested with 0.25% trypsin, collected, and
washed twice with PBS. The cells were resuspended in 0.5-1.0 ml
staining buffer, and Hoechst33342 staining solution A (5-10
µl) was then added. Following gentle mixing, the cells were
incubated at 4°C in the dark for 10 min, and 5-10 µl PI was
then added. Staining solution B was added (5-10 µl), the
samples were gently mixed, and then incubated at 4°C in dark for
5‑10 min. Finally, the cells were washed with PBS, resuspended in
PBS and detected using flow cytometry. Analysis was performed using
Summit v5.2 software (Beckman Coulter, Inc.).
Statistical analysis
Data are presented as the mean ± standard deviation
of three independent experiments. Differences in parametric
variables were analyzed using ANOVA followed by
Student-Newman-Keuls post hoc test, and differences in quantitative
variables between groups were analyzed by Kruskal-Wallis followed
by Bonferroni's test. Statistical analyses were performed with the
EPI Info software (version 3.2.2; www.CDC.gov/epiinfo/). P<0.05 was considered to
indicate a statistically significant difference.
Results
Identification of differentially abundant
proteins in CD38‑overexpressing cervical cancer cells using
LC‑MS/MS analysis
Our previous study demonstrated that CD38 expression
is upregulated in cervical cancer. In vitro experiments
revealed that CD38 could inhibit the apoptosis of cervical cancer
cells and promote their proliferation. The previous results also
demonstrated that CD38 affects the intracellular calcium
concentration, mitochondrial membrane potential and intracellular
reactive oxygen species in cervical cancer cells (30). Therefore, it was speculated that
CD38 may be associated with the metabolism of cervical cancer
cells.
To investigate if CD38 affects the metabolism of
cervical cancer cells, LC-MS/MS technology was first used to screen
and identify differentially abundant proteins between
CD38-overexpressing cervical cancer cells and the control groups.
Proteins were identified using Proteome Discoverer 1.4 software and
analyzed by the UniProtKB/Swiss-Prot database. It was identified
that 573 proteins were downregulated in CaSki-CD38 cells compared
with the control cells and 274 proteins were downregulated in
HeLa-CD38 cells compared with the control cells. Among these
proteins, 40 proteins were consistently downregulated in both
CaSki-CD38 and HeLa-CD38 cells. These 40 overlapping downregulated
proteins are listed in Table I. By
contrast, 357 proteins were found to be upregulated in CaSki-CD38
cells and 359 proteins were upregulated in HeLa-CD38 cells compared
with the control cells. Among these, 36 proteins were consistently
upregulated both in CaSki-CD38 and HeLa-CD38 cells. These 36
overlapping upregulated proteins are listed in Table II.
 | Table IDownregulated proteins in
CD38-overexpressing HeLa and CaSki cells. |
Table I
Downregulated proteins in
CD38-overexpressing HeLa and CaSki cells.
| Gene symbol | Description | Molecular weight,
kDa | Score
| Proteins
| Unique Peptides
| Area
| Ratio (CD38/vector)
|
|---|
| HeLa | CaSki | HeLa | CaSki | HeLa | CaSki | HeLa | CaSki | HeLa | CaSki |
|---|
| ANXA2 | Annexin A2 | 38.6 | 13.33 | 854.96 | 15 | 25 | 1 | 19 |
9.669×10⁻⁶ |
1.148×10⁻⁹ | −∞ | 0.39 |
| APOL2 | Apolipoprotein
L2 | 37.1 | 15.02 | 46.67 | 3 | 2 | 2 | 1 |
3.064×10⁻⁶ |
2.250×10⁻⁷ | −∞ | −∞ |
| ATP5H-2 | Isoform 2 of ATP
synthase subunit d, mitochondrial | 15.8 | 17.04 | 56.32 | 3 | 3 | 5 | 3 |
4.994×10⁻⁷ |
5.160×10⁻⁷ | −∞ | −∞ |
| CACYBP-3 | Isoform 3 of
Calcyclin-binding protein | 21.2 | 17.34 | 65.16 | 2 | 2 | 4 | 6 |
4.295×10⁻⁷ |
1.098×10⁻⁸ | −∞ | 0.29 |
| CAST | Calpastatin | 69.7 | 26.61 | 12.04 | 24 | 24 | 6 | 2 |
2.353×10⁻⁷ |
1.906×10⁻⁷ | −∞ | −∞ |
| CBX1 | Chromobox protein
homolog 1 | 19.3 | 28.43 | 22.72 | 5 | 4 | 1 | 1 |
2.859×10⁻⁷ |
8.815×10⁻⁶ | −∞ | −∞ |
| CIAPIN1 | Anamorsin | 26.4 | 21.27 | 21.12 | 8 | 8 | 5 | 3 |
1.054×10⁻⁷ |
5.068×10⁻⁷ | −∞ | 0.17 |
| CYB5B | Cytochrome b5 type
B | 15.7 | 18.73 | 185.99 | 5 | 4 | 3 | 2 |
5.577×10⁻⁷ |
2.809×10⁻⁷ | −∞ | 0.08 |
| CYC1 | Cytochrome c1, heme
protein, mitochondrial | 35.4 | 17.89 | 89.35 | 1 | 1 | 3 | 5 |
1.092×10⁻⁷ |
6.530×10⁻⁷ | −∞ | −∞ |
| DDX5 | Probable
ATP-dependent RNA helicase DDX5 | 69.0 | 10.06 | 70.39 | 18 | 11 | 3 | 6 |
1.540×10⁻⁷ |
4.064×10⁻⁷ | −∞ | −∞ |
| DYNLL1 | Dynein light chain
1, cytoplasmic | 10.4 | 10.92 | 10.21 | 4 | 2 | 3 | 1 |
7.299×10⁻⁷ |
9.664×10⁻⁶ | −∞ | −∞ |
| EFTUD2 | Isoform 2 of 116
kDa U5 small nuclear ribonucleoprotein component | 105.3 | 111.66 | 16.21 | 11 | 5 | 20 | 4 |
1.554×10⁻⁸ |
2.739×10⁻⁸ | 0.44 | 0.10 |
| EIF4H | Isoform Short of
Eukaryotic translation initiation factor 4H | 25.2 | 16.74 | 20.08 | 4 | 2 | 5 | 2 |
5.969×10⁻⁷ |
1.011×10⁻⁸ | −∞ | −∞ |
| EIF5A | Eukaryotic
translation initiation factor 5A-1 | 16.8 | 19.21 | 211.61 | 9 | 9 | 4 | 8 |
1.297×10⁻⁸ |
1.356×10⁻⁸ | −∞ | 0.27 |
| FUS | Isoform Short of
RNA-binding protein FUS | 53.3 | 21.91 | 95.35 | 3 | 4 | 2 | 2 |
1.216×10⁻⁸ |
1.705×10⁻⁸ | 0.15 | 0.26 |
| H2AFY | Isoform 1 of Core
histone macro-H2A.1 | 39.2 | 117.80 | 136.46 | 7 | 6 | 11 | 8 |
1.660×10⁻⁸ |
9.296×10⁻⁷ | 0.08 | 0.22 |
| HINT2 | Histidine triad
nucleotide-binding protein 2, mitochondrial | 17.2 | 10.06 | 12.34 | 1 | 1 | 1 | 2 |
8.954×10⁻⁶ |
2.045×10⁻⁷ | −∞ | −∞ |
| HNRNPC | Heterogeneous
nuclear ribonucleoproteins C1/C2 | 32.2 | 13.07 | 315.90 | 18 | 21 | 2 | 15 |
1.685×10⁻⁷ |
3.672×10⁻⁸ | −∞ | 0.04 |
| HRNR | Hornerin | 282.2 | 75.21 | 32.15 | 1 | 1 | 7 | 1 |
9.596×10⁻⁶ |
1.220×10⁻⁶ | 0.35 | −∞ |
| KIN27 | Protein kinase
A-α | 23.9 | 28.71 | 35.58 | 4 | 22 | 1 | 3 |
8.691×10⁻⁶ |
2.172×10⁻⁷ | −∞ | 0.14 |
| KRT1 | Keratin, type II
cytoskeletal 1 | 66.0 | 425.90 | 330.85 | 11 | 4 | 31 | 9 |
1.600×10⁻⁹ |
5.650×10⁻⁸ | 0.48 | 0.33 |
| KRT14 | Keratin, type I
cytoskeletal 14 | 51.5 | 126.63 | 152.66 | 20 | 27 | 7 | 1 |
7.759×10⁻⁸ |
1.496×10⁻⁸ | 0.33 | 0.19 |
| KRT17 | Keratin, type I
cytoskeletal 17 | 48.1 | 109.58 | 1,637.92 | 19 | 24 | 6 | 22 |
6.925×10⁻⁸ |
2.812×10⁻⁹ | 0.29 | 0.31 |
| KRT19 | Keratin, type I
cytoskeletal 19 | 44.1 | 38.97 | 367.82 | 18 | 17 | 1 | 14 |
6.925×10⁻⁸ |
1.904×10⁻⁹ | 0.29 | −∞ |
| KRT2 | Keratin, type II
cytoskeletal 2 epidermal | 65.4 | 332.61 | 42.55 | 9 | 10 | 27 | 2 |
1.426×10⁻⁹ |
2.842×10⁻⁸ | 0.41 | 0.11 |
| KRT9 | Keratin, type I
cytoskeletal 9 | 62.0 | 165.84 | 84.36 | 10 | 3 | 20 | 7 |
5.603×10⁻⁸ |
5.234×10⁻⁸ | 0.41 | 0.08 |
| LAP3-2 | Isoform 2 of
Cytosol aminopeptidase | 52.7 | 14.49 | 14.49 | 3 | 2 | 4 | 1 |
3.518×10⁻⁷ |
1.044×10⁻⁷ | −∞ | −∞ |
| LMNB1 | Lamin-B1 | 66.4 | 84.41 | 204.23 | 2 | 2 | 17 | 14 |
9.464×10⁻⁷ |
2.144×10⁻⁸ | −∞ | 0.49 |
| NHP2L1 | NHP2-like protein
1 | 14.2 | 11.00 | 19.55 | 2 | 2 | 3 | 1 |
4.704×10⁻⁷ |
3.376×10⁻⁷ | −∞ | −∞ |
| PGM1 |
Phosphoglucomutase-1 | 61.4 | 14.77 | 22.73 | 3 | 1 | 4 | 2 |
1.094×10⁻⁷ |
2.162×10⁻⁷ | −∞ | −∞ |
| RPA3 | Replication protein
A 14 kDa subunit | 9.2 | 11.46 | 17.31 | 2 | 2 | 2 | 1 |
6.931×10⁻⁶ |
3.638×10⁻⁷ | −∞ | −∞ |
| RSU1-2 | Isoform 2 of Ras
suppressor protein 1 | 25.5 | 11.15 | 25.85 | 2 | 2 | 3 | 1 |
6.186×10⁻⁶ |
2.227×10⁻⁷ | −∞ | −∞ |
| SNRNP70 | U1 small nuclear
ribonucleoprotein 70 kDa | 51.5 | 17.17 | 10.53 | 6 | 5 | 8 | 4 |
5.932×10⁻⁷ |
2.184×10⁻⁷ | −∞ | −∞ |
| SNRPB2 | U2 small nuclear
ribonucleoprotein B'' | 25.5 | 14.06 | 33.19 | 2 | 1 | 2 | 1 |
3.940×10⁻⁷ |
7.255×10⁻⁷ | −∞ | 0.20 |
| SNRPN | Small nuclear
ribonucleoprotein-associated protein N | 17.5 | 10.49 | 49.27 | 6 | 8 | 1 | 4 |
7.569×10⁻⁶ |
1.164×10⁻⁸ | −∞ | 0.13 |
| SPCS3 | Signal peptidase
complex subunit 3 | 20.3 | 16.23 | 14.11 | 1 | 1 | 3 | 1 |
1.722×10⁻⁷ |
3.031×10⁻⁷ | −∞ | −∞ |
| SUMO2‑2 | Isoform 2 of Small
ubiquitin‑related modifier 2 | 8.1 | 10.68 | 27.72 | 8 | 8 | 2 | 1 |
1.739×10⁻⁷ |
7.480×10⁻⁷ | −∞ | −∞ |
| TOP1 | DNA topoisomerase
1 | 90.7 | 18.64 | 18.78 | 4 | 1 | 6 | 2 |
2.874×10⁻⁷ |
3.670×10⁻⁷ | −∞ | 0.49 |
| TPD52L2 | Tumor protein
D54 | 22.2 | 59.28 | 70.49 | 7 | 7 | 7 | 5 |
2.723×10⁻⁷ |
6.694×10⁻⁷ | −∞ | −∞ |
| UQCRQ | Cytochrome b-c1
complex subunit 8 | 9.9 | 11.66 | 38.20 | 1 | 1 | 3 | 2 |
9.185×10⁻⁶ |
2.085×10⁻⁷ | −∞ | −∞ |
| Table IIUpregulated proteins in
CD38-overexpressing HeLa and CaSki cells. |
Table II
Upregulated proteins in
CD38-overexpressing HeLa and CaSki cells.
| Gene symbol | Description | Molecular weight,
kDa | Score
| Proteins
| Unique Peptides
| Area
| Ratio (CD38/vector)
|
|---|
| HeLa | CaSki | HeLa | CaSki | HeLa | CaSki | HeLa | CaSki | HeLa | CaSki |
|---|
| ACTN4 | α-actinin-4 | 104.8 | 400.05 | 95.62 | 8 | 15 | 29 | 8 |
7.067×10⁻⁸ |
1.631×10⁻⁸ | +∞ | +∞ |
| ALB | Serum albumin | 51.5 | 16.01 | 14.40 | 7 | 6 | 3 | 1 |
2.196×10⁻⁷ |
9.413×10⁻⁷ | +∞ | +∞ |
| ANXA8 | Annexin A8 | 36.9 | 87.26 | 50.34 | 8 | 7 | 1 | 1 |
2.059×10⁻⁸ |
2.769×10⁻⁸ | 4.60 | +∞ |
| ATP5H | ATP synthase
subunit d, mitochondrial | 18.5 | 26.15 | 16.71 | 3 | 3 | 6 | 3 |
4.464×10⁻⁷ |
1.107×10⁻⁷ | +∞ | 2.23 |
| BRI3BP | BRI3-binding
protein | 27.8 | 15.27 | 12.05 | 1 | 1 | 1 | 1 |
3.833×10⁻⁶ |
6.763×10⁻⁶ | +∞ | +∞ |
| C11orf73 | Protein
Hikeshi | 21.6 | 12.95 | 11.72 | 3 | 3 | 2 | 1 |
6.308×10⁻⁶ |
4.914×10⁻⁶ | +∞ | +∞ |
| C14orf166 | UPF0568 protein
C14orf166 | 28.1 | 71.06 | 36.01 | 3 | 4 | 9 | 4 |
5.128×10⁻⁷ |
7.655×10⁻⁷ | 2.08 | +∞ |
| CAP1 | Adenylyl
cyclase-associated protein 1 | 51.8 | 51.38 | 17.70 | 13 | 2 | 11 | 1 |
1.100×10⁻⁸ |
1.790×10⁻⁷ | +∞ | +∞ |
| CAST | Calpastatin | 80.2 | 43.11 | 31.49 | 26 | 29 | 8 | 6 |
3.266×10⁻⁷ |
4.783×10⁻⁷ | +∞ | 19.79 |
| CCT5 | T-complex protein 1
subunit ε | 53.8 | 38.71 | 133.43 | 7 | 5 | 7 | 10 |
3.470×10⁻⁷ |
9.606×10⁻⁷ | +∞ | 2.31 |
| CCT6A | T-complex protein 1
subunit ζ | 53.3 | 16.37 | 59.71 | 3 | 2 | 5 | 2 |
3.856×10⁻⁷ |
1.040×10⁻⁷ | +∞ | +∞ |
| CTH | Cystathionine
γ-lyase | 41.2 | 31.91 | 130.38 | 3 | 3 | 9 | 6 |
1.187×10⁻⁸ |
8.673×10⁻⁷ | +∞ | +∞ |
| DPYSL2 |
Dihydropyrimidinase-related protein 2 | 58.1 | 50.58 | 58.45 | 10 | 9 | 11 | 6 |
8.961×10⁻⁷ |
8.716×10⁻⁷ | +∞ | +∞ |
| EIF1B | Eukaryotic
translation initiation factor 1b | 12.8 | 18.85 | 13.22 | 3 | 3 | 2 | 1 |
2.936×10⁻⁷ |
5.935×10⁻⁶ | +∞ | +∞ |
| ENO1 | α-enolase | 47.1 | 25.63 | 2,229.68 | 16 | 15 | 5 | 21 |
2.494×10⁻⁷ |
1.813×10⁻⁹ | 2.25 | 2.71 |
| ERLIN1 | Erlin-1 | 38.9 | 14.11 | 13.10 | 2 | 1 | 5 | 1 |
2.928×10⁻⁷ |
3.914×10⁻⁶ | 3.00 | +∞ |
| FDPS | Farnesyl
pyrophosphate synthase | 40.5 | 51.69 | 10.00 | 2 | 2 | 7 | 3 |
7.822×10⁻⁷ |
8.732×10⁻⁶ | 2.62 | +∞ |
| FOLR1 | Folate receptor
α | 29.8 | 41.13 | 41.24 | 1 | 1 | 4 | 4 |
6.228×10⁻⁷ |
2.162×10⁻⁷ | 2.19 | +∞ |
| G3BP1 | Ras
GTPase-activating protein-binding protein 1 | 52.1 | 53.68 | 21.62 | 9 | 8 | 8 | 4 |
7.747×10⁻⁷ |
4.863×10⁻⁷ | +∞ | +∞ |
| HDLBP | Vigilin | 141.4 | 44.35 | 11.47 | 20 | 7 | 12 | 2 |
4.235×10⁻⁷ |
2.881×10⁻⁷ | +∞ | +∞ |
| HMGA1 | High mobility group
protein HMG-I/HMG-Y | 11.7 | 13.39 | 10.07 | 5 | 2 | 4 | 1 |
1.666×10⁻⁷ |
3.360×10⁻⁶ | +∞ | +∞ |
| HPRT1 |
Hypoxanthine-guanine
phosphoribosyltransferase | 24.6 | 43.47 | 49.96 | 3 | 1 | 7 | 4 |
4.142×10⁻⁷ |
8.836×10⁻⁶ | 13.13 | +∞ |
| IDH3A | Isocitrate
dehydrogenase [NAD] subunit α, mitochondrial | 39.6 | 36.15 | 31.58 | 9 | 6 | 8 | 2 |
3.817×10⁻⁷ |
1.053×10⁻⁷ | +∞ | +∞ |
| IGF2BP3 | Insulin-like growth
factor 2 mRNA-binding protein 3 | 63.7 | 20.20 | 18.59 | 10 | 10 | 7 | 4 |
8.757×10⁻⁷ |
8.333×10⁻⁶ | +∞ | +∞ |
| KIF5B | Kinesin-1 heavy
chain | 109.6 | 48.65 | 37.58 | 6 | 1 | 14 | 4 |
3.696×10⁻⁷ |
1.802×10⁻⁷ | +∞ | +∞ |
| LARP1 | La-related protein
1 | 116.4 | 16.90 | 20.93 | 11 | 2 | 4 | 2 |
9.720×10⁻⁶ |
4.039×10⁻⁶ | +∞ | +∞ |
| LDHA | L-lactate
dehydrogenase A chain | 36.7 | 331.93 | 55.05 | 22 | 14 | 17 | 2 |
1.391×10⁻⁹ |
3.780×10⁻⁷ | +∞ | +∞ |
| MATR3 | Matrin-3 | 94.6 | 71.75 | 86.38 | 19 | 20 | 16 | 9 |
1.343×10⁻⁸ |
1.201×10⁻⁷ | +∞ | +∞ |
| NQO2 |
Ribosyldihydronicotinamide dehydrogenase
[quinone] | 21.5 | 11.46 | 25.45 | 4 | 3 | 2 | 4 |
2.330×10⁻⁷ |
6.835×10⁻⁸ | +∞ | +∞ |
| RTFDC1 | Protein RTF2
homolog | 31.1 | 17.51 | 18.12 | 4 | 3 | 4 | 1 |
5.713×10⁻⁶ |
7.041×10⁻⁶ | +∞ | +∞ |
| S100A16 | Protein
S100-A16 | 11.8 | 14.33 | 10.57 | 1 | 1 | 3 | 1 |
1.088×10⁻⁷ |
1.025×10⁻⁷ | +∞ | +∞ |
| SF3B2 | Splicing factor 3B
subunit 2 | 100.2 | 62.01 | 24.23 | 7 | 6 | 13 | 4 |
5.639×10⁻⁷ |
2.069×10⁻⁷ | +∞ | +∞ |
| SRM | Spermidine
synthase | 33.8 | 16.80 | 21.80 | 4 | 3 | 5 | 2 |
5.120×10⁻⁷ |
1.488×10⁻⁷ | 2.76 | +∞ |
| SRP68 | Signal recognition
particle subunit SRP68 | 66.1 | 38.11 | 11.91 | 7 | 5 | 8 | 3 |
3.360×10⁻⁷ |
2.642×10⁻⁶ | +∞ | +∞ |
| SRPRB | Signal recognition
particle receptor subunit β | 29.7 | 59.44 | 18.29 | 3 | 2 | 10 | 3 |
4.774×10⁻⁷ |
1.030×10⁻⁷ | 2.05 | 3.72 |
| TSN | Translin | 25.6 | 32.74 | 33.60 | 4 | 4 | 7 | 4 |
6.090×10⁻⁷ |
1.872×10⁻⁷ | 2.04 | +∞ |
Gene Ontology (GO) analysis of biological
processes and Kyoto Encyclopedia of Genes and Genomes (KEGG)
analysis of differentially expressed proteins in
CD38‑overexpressing cervical cancer cells
The results of the LC-MS/MS analysis revealed that
ATP5H-2, cytochrome B5 type B (CYB5B), cytochrome C1 (CYC1) and
other protein molecules were upregulated in CD38-overexpressing
cervical cancer cells, while BRI3 binding protein (BRI3BP) and
other protein molecules were downregulated. To further analyze the
biological processes and signaling pathways that involve these
differentially abundant proteins, GO and KEGG analyses were
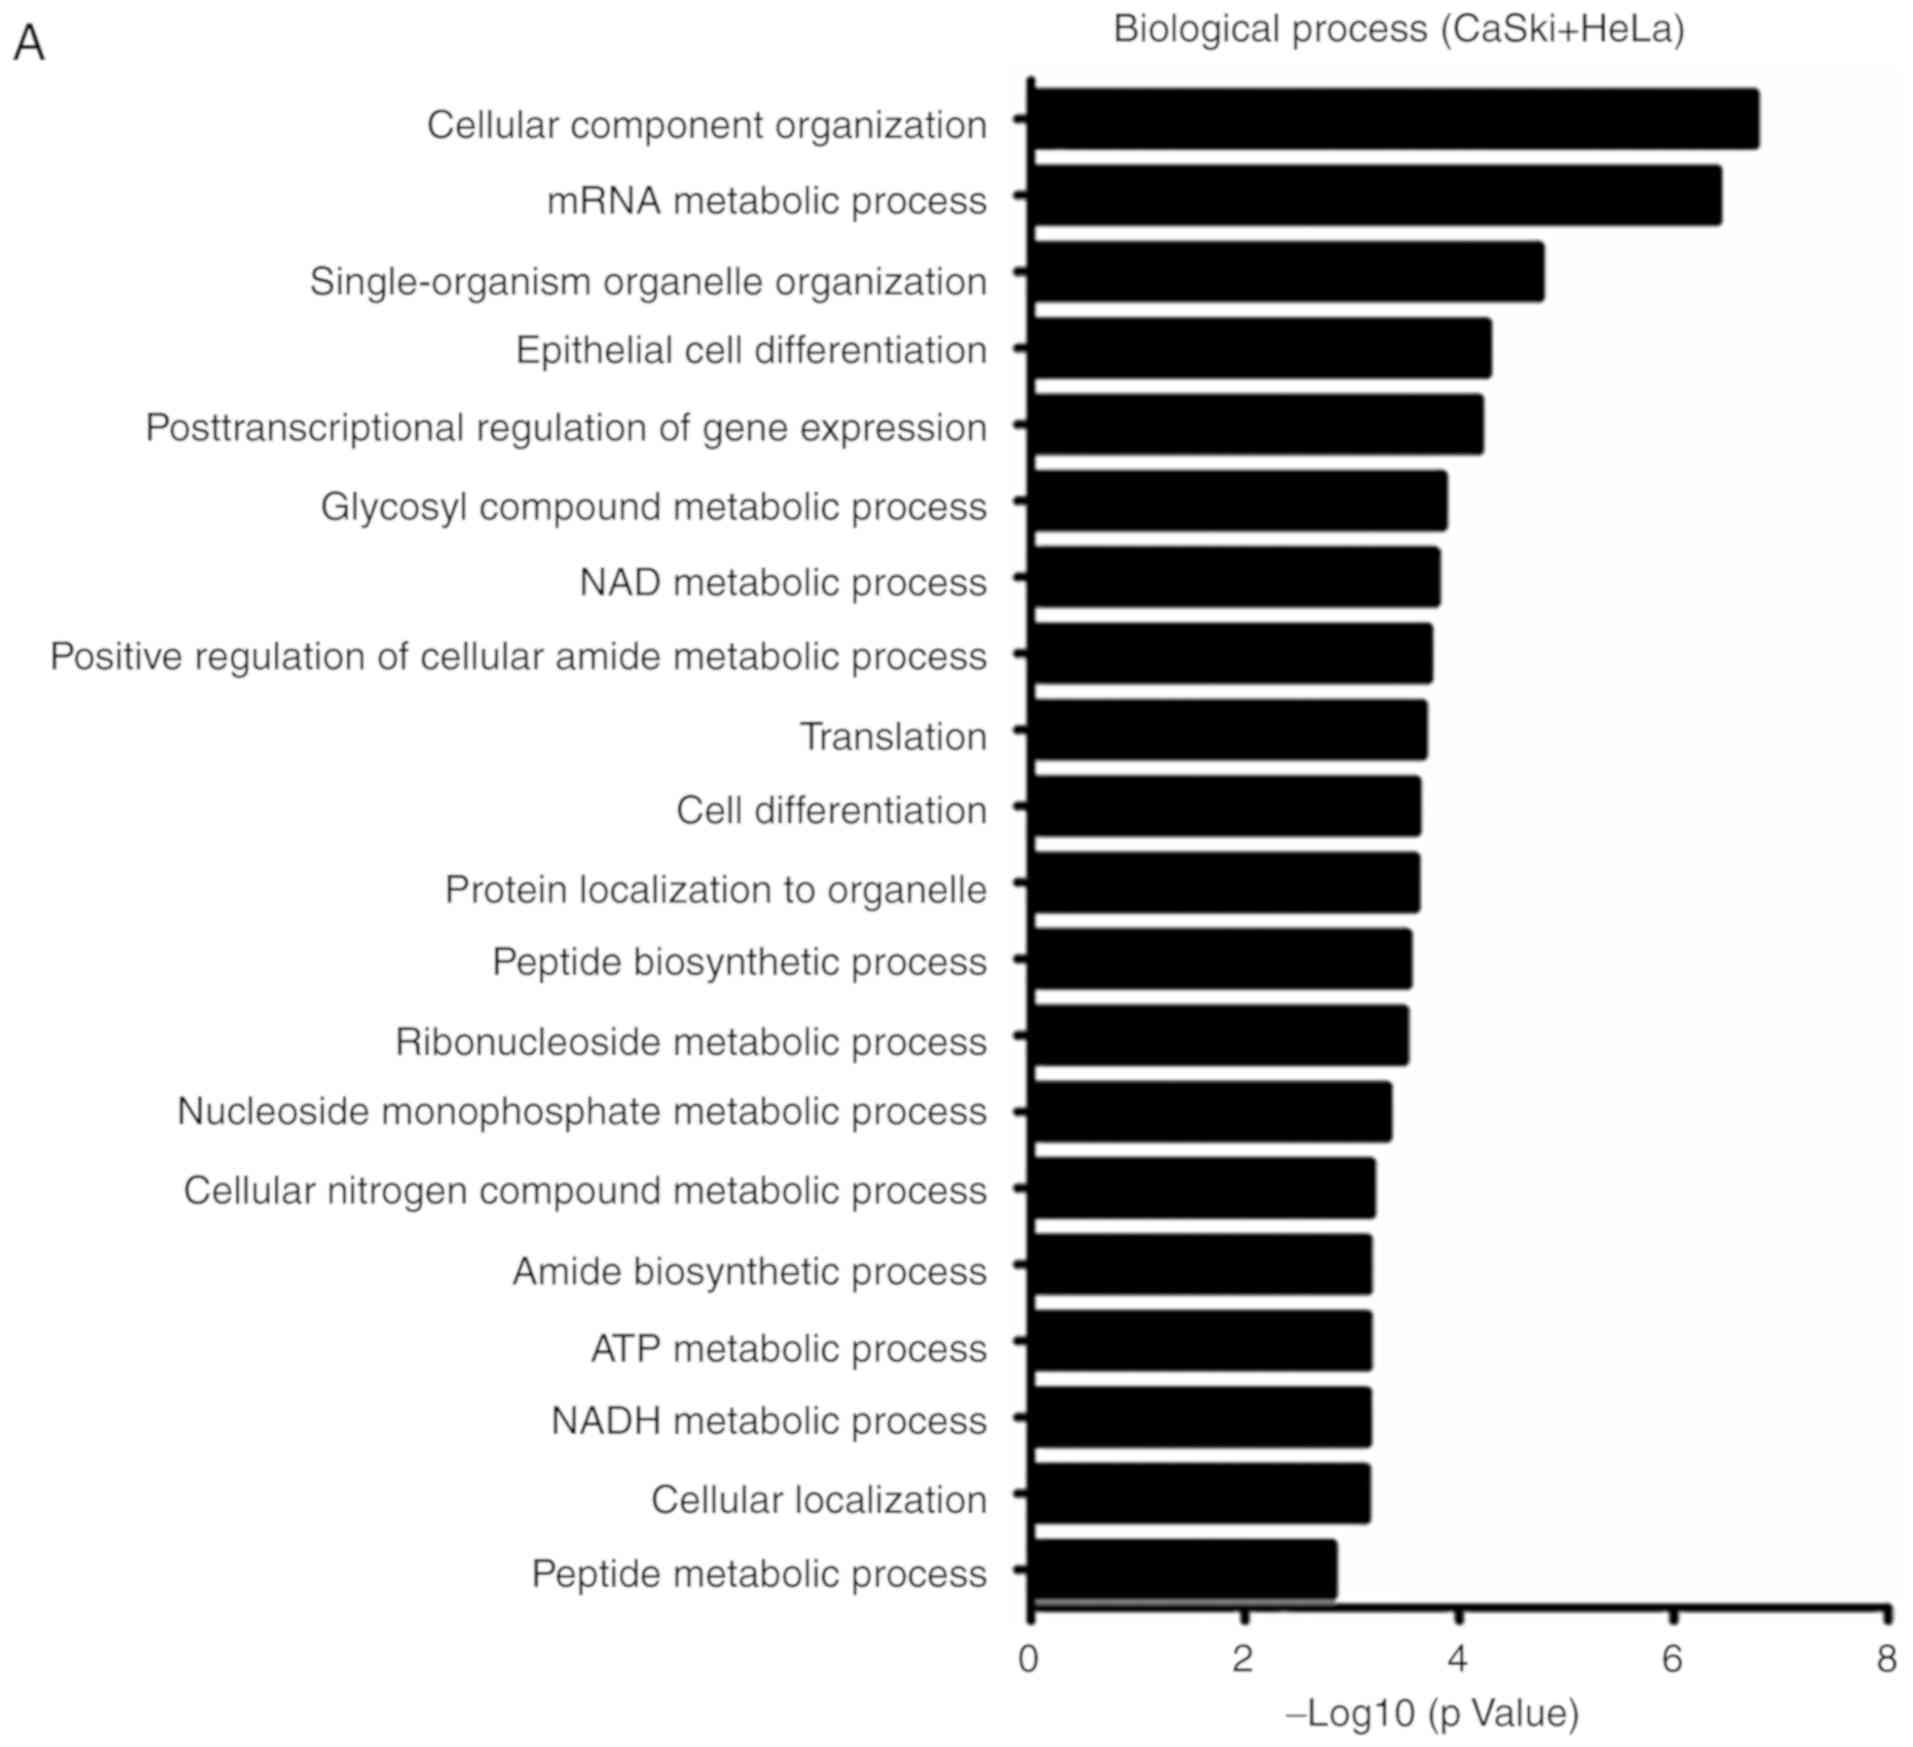
performed. As presented in Fig. 1,
the differentially abundant proteins were annotated to be involved
in the following biological processes: 'Glucose catabolic process
to pyruvate', 'oxidation-reduction process', 'glucose metabolic
process', 'nucleoside monophosphate metabolic process', 'glycosyl
compound metabolic process', 'NAD/NADH metabolic process' and
'ATP/ADP metabolic process'. This indicates that these proteins are
predominantly involved in glycolytic pathways, oxidative
phosphorylation and NAD/NADH metabolic processes. KEGG analysis
demonstrated that CD38 overexpression was associated with 'pyruvate
metabolism', 'glycolysis/gluconeogenesis', 'metabolic pathways' and
'fatty acid elongation'. Thus, it can be suggested that CD38 is
involved in regulating cellular energy metabolism in cervical
cancer cells.
CD38 increases glucose uptake, ATP
production, and lactic acid accumulation in cervical cancer
cells
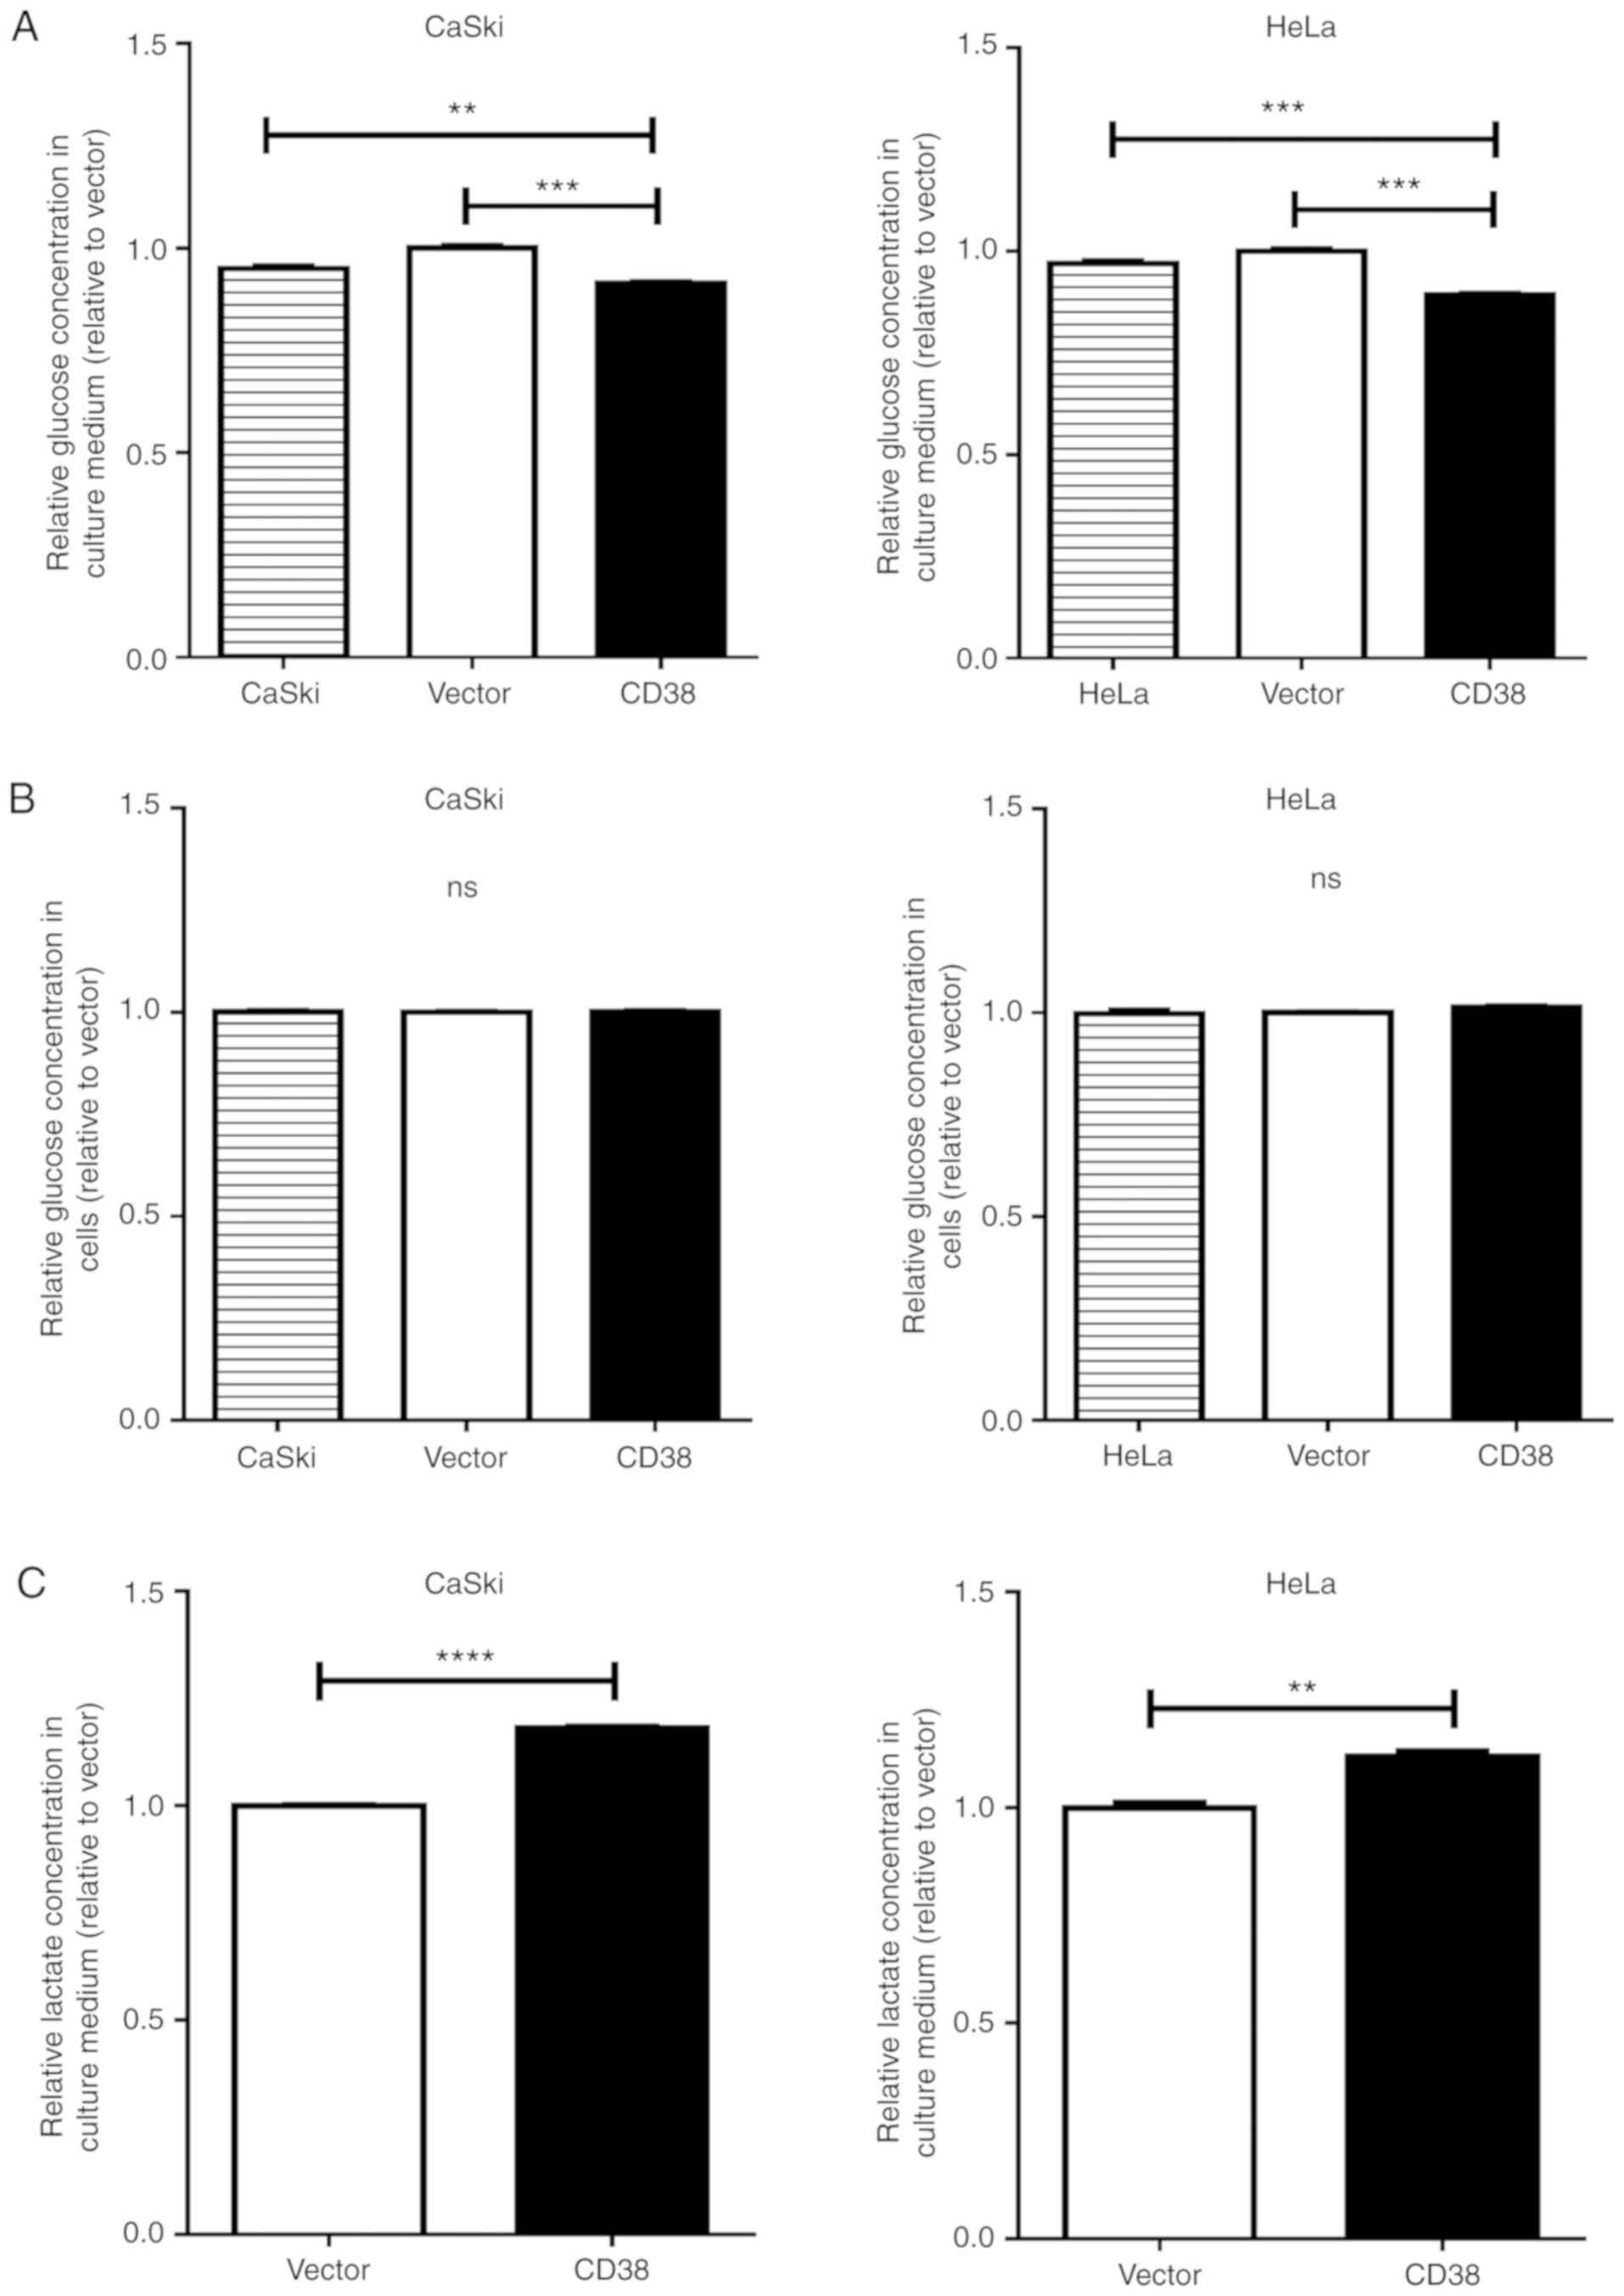
To test the hypothesis that that CD38 is involved in
regulating cellular energy metabolism in cervical cancer cells, the
effects of CD38 over-expression on glucose uptake, intracellular
ATP production and intracellular lactic acid concentration in
cervical cancer cells were investigated. The glucose concentration
in the culture medium was significantly decreased in CaSki‑CD38 and
HeLa-CD38 cells compared with vector-transfected cells (P=0.0002
and P<0.0001, respectively; Fig.
2A). The intracellular glucose concentration showed no
significant difference between CD38-overexpressing cervical cancer
cells and the control groups (Fig.
2B). It was speculated that, to a certain extent, CD38 promotes
glucose consumption in cervical cancer cells. The lactate
concentration in the culture medium was significantly increased in
CaSki‑CD38 and HeLa‑CD38 cells compared with vector-transfected
cells (P<0.0001 and P=0.0021, respectively; Fig. 2C). The intracellular lactate
concentration was also significantly increased in CaSki‑CD38 and
HeLa-CD38 compared with vector-transfected cells (P<0.0001 and
P=0.019; Fig. 2D).
Further research revealed that CD38 overexpression
significantly increased the intracellular ATP concentration in
CaSki cells (P=0.001; Fig. 2E) and
HeLa cells (P=0.003; Fig. 2F).
These results suggest that CD38 is involved in regulating the
glucose concentration and can lead to an accumulation of lactate in
cervical cancer cells.
CD38 affects cellular energy metabolism
by activating the PI3K/AKT/mTOR signaling pathway in cervical
cancer cells
To investigate the possible effects and mechanism of
CD38 on the energy metabolism in cervical cancer cells, key
molecules of the PI3K/AKT/mTOR signaling pathway were investigated
in CaSki and HeLa cells. In CaSki cells, CD38 overexpression
significantly increased the expression levels of PI3K, PDK1, ATP5H
and LDHA. CD38 overexpression also significantly increased the
ratios of p-AKT/AKT and p-mTOR/mTOR (Fig. 3A). These results suggest that CD38
had a significant effect on the phosphorylation of AKT and mTOR. To
confirm that CD38 is involved in the regulation of energy
metabolism in cervical cancer cells via the PI3K/AKT/mTOR signaling
pathway, the cervical cancer cells were treated with rapamycin.
Following treatment with DMSO, the expression levels of LDHA and
ATP5H were significantly higher in CaSki‑CD38 cells compared with
the control CaSki-vector cells. In addition, the p-mTOR/mTOR ratio
was significantly higher in CaSki-CD38 cells compared with the
control cells following treatment with DMSO. After treatment with
rapamycin, the expression levels of LDHA and ATP5H were
significantly lower in CaSki-CD38 cells compared with the control
CaSki-vector cells. In addition, the p-mTOR/mTOR ratio was
significantly decreased (Fig. 3B).
These results suggest that rapamycin can block the effects of CD38
on LDHA, ATP5H and mTOR. ATP5H and LDH-A affect the concentration
of ATP and lactic acid in CaSki cells (34). To determine whether rapamycin
alters the effects of CD38 on ATP and lactic acid in CaSki cells,
the concentration of ATP and lactic acid were measured in
rapamycin-treated cells. The results demonstrated that rapamycin
could significantly reverse the effects of CD38 overexpression on
ATP and lactic acid levels in CaSki cells (Fig. 3C and D).
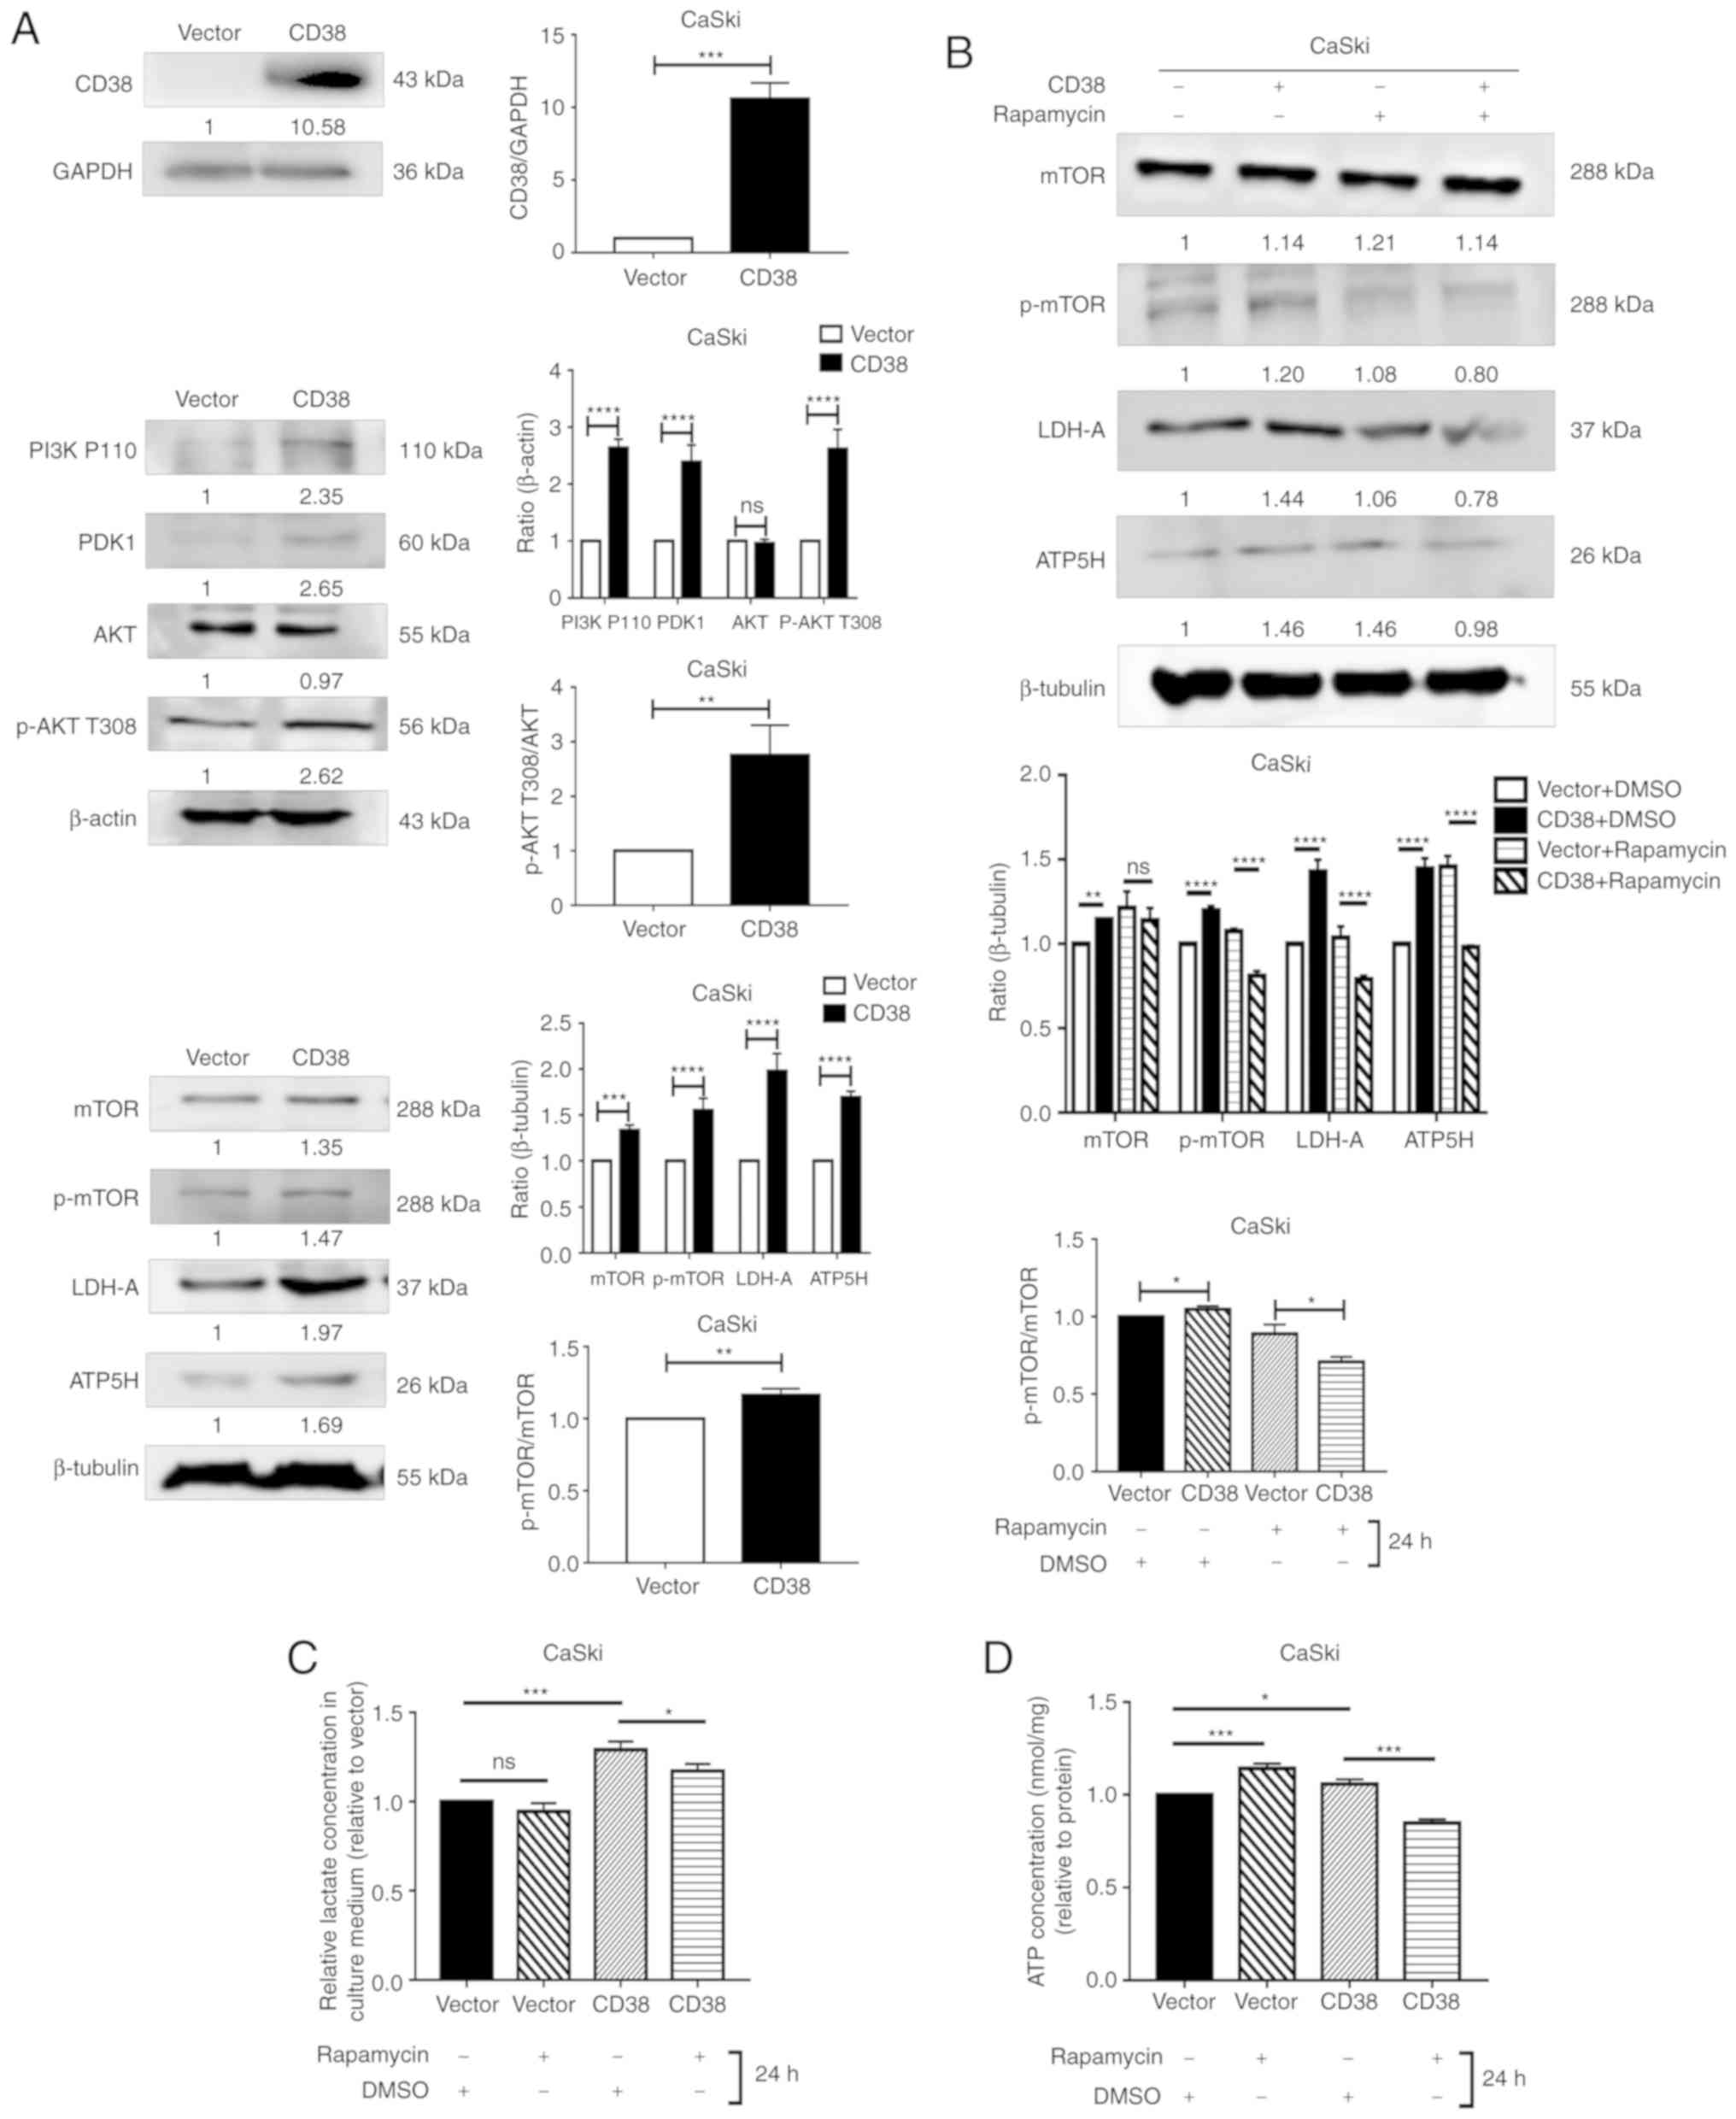 | Figure 3Detection of the levels of key
molecules in the PI3K/AKT/mTOR signaling pathway in CaSki cells.
(A) Western blot analysis of PDK1, PI3K P110, AKT, p-AKT T308,
p-AKT S473, m-TOR, p-mTOR, LDH-A and ATP5H following CD38
overexpression. Images are representative of three independent
experiments. (B) Western blotting analysis of m-TOR, p-mTOR, LDH-A
and ATP5H in cells treated with rapamycin for 24 h. (C) The lactate
concentration in the culture medium of CaSki cells treated with
rapamycin for 24 h. All values were normalized on the basis of cell
number. (D) ATP concentration in the culture medium of CaSki cells
treated with rapamycin for 24 h. All values were normalized on the
basis of cell number. Data are presented as the mean ± standard
deviation of three independent experiments. *P<0.05,
**P<0.01, ***P<0.001 and
****P<0.0001. ns, not significant; PI3K,
phosphatidylinositol‑4,5‑bisphosphate 3-kinase; PDK1,
phosphoinositide dependent protein kinase 1; AKT, Akt
serine/threonine kinase; mTOR, mammalian target of rapamycin;
LDH-A, lactate dehydrogenase A; ATP5H, ATP synthase peripheral
stalk subunit D; p-, phosphorylated. |
Furthermore, the protein levels of mTOR, p-mTOR,
LDH-A and ATP5H were detected in HeLa cells. In HeLa cells, CD38
overexpression significantly increased the levels of p‑mTOR and
LDHA, but no difference was observed for total mTOR or ATP5H.
However, CD38 significantly increased the ratio of p‑mTOR/total
mTOR, indicating that CD38 has a significant effect on the
phosphorylation of mTOR (Fig. 4A).
Similarly, following treatment with DMSO, the expression levels of
LDHA and ATP5H were significantly higher in HeLa‑CD38 cells
compared with the control HeLa-vector cells. In addition, the ratio
of p-mTOR/mTOR was increased in HeLa-CD38 cells. Following
treatment with rapamycin, the expression levels of LDHA and ATP5H
in HeLa‑CD38 cells were significantly lower compared with the
control HeLa-vector cells. Furthermore, the p‑mTOR/mTOR ratio was
significantly lower in HeLa‑CD38 cells compared with HeLa-vector
cells following treatment with rapamycin (Fig. 4B). These results were consistent
with the results in CaSki cells. The effects of rapamycin on the
ATP and lactic acid levels in HeLa-CD38 cells were consistent with
those observed in CaSki-CD38 cells (Fig. 4C and D). Therefore, the mTOR
signaling pathway may serve a role in the effects of CD38 on the
energy metabolism of cervical cancer cells.
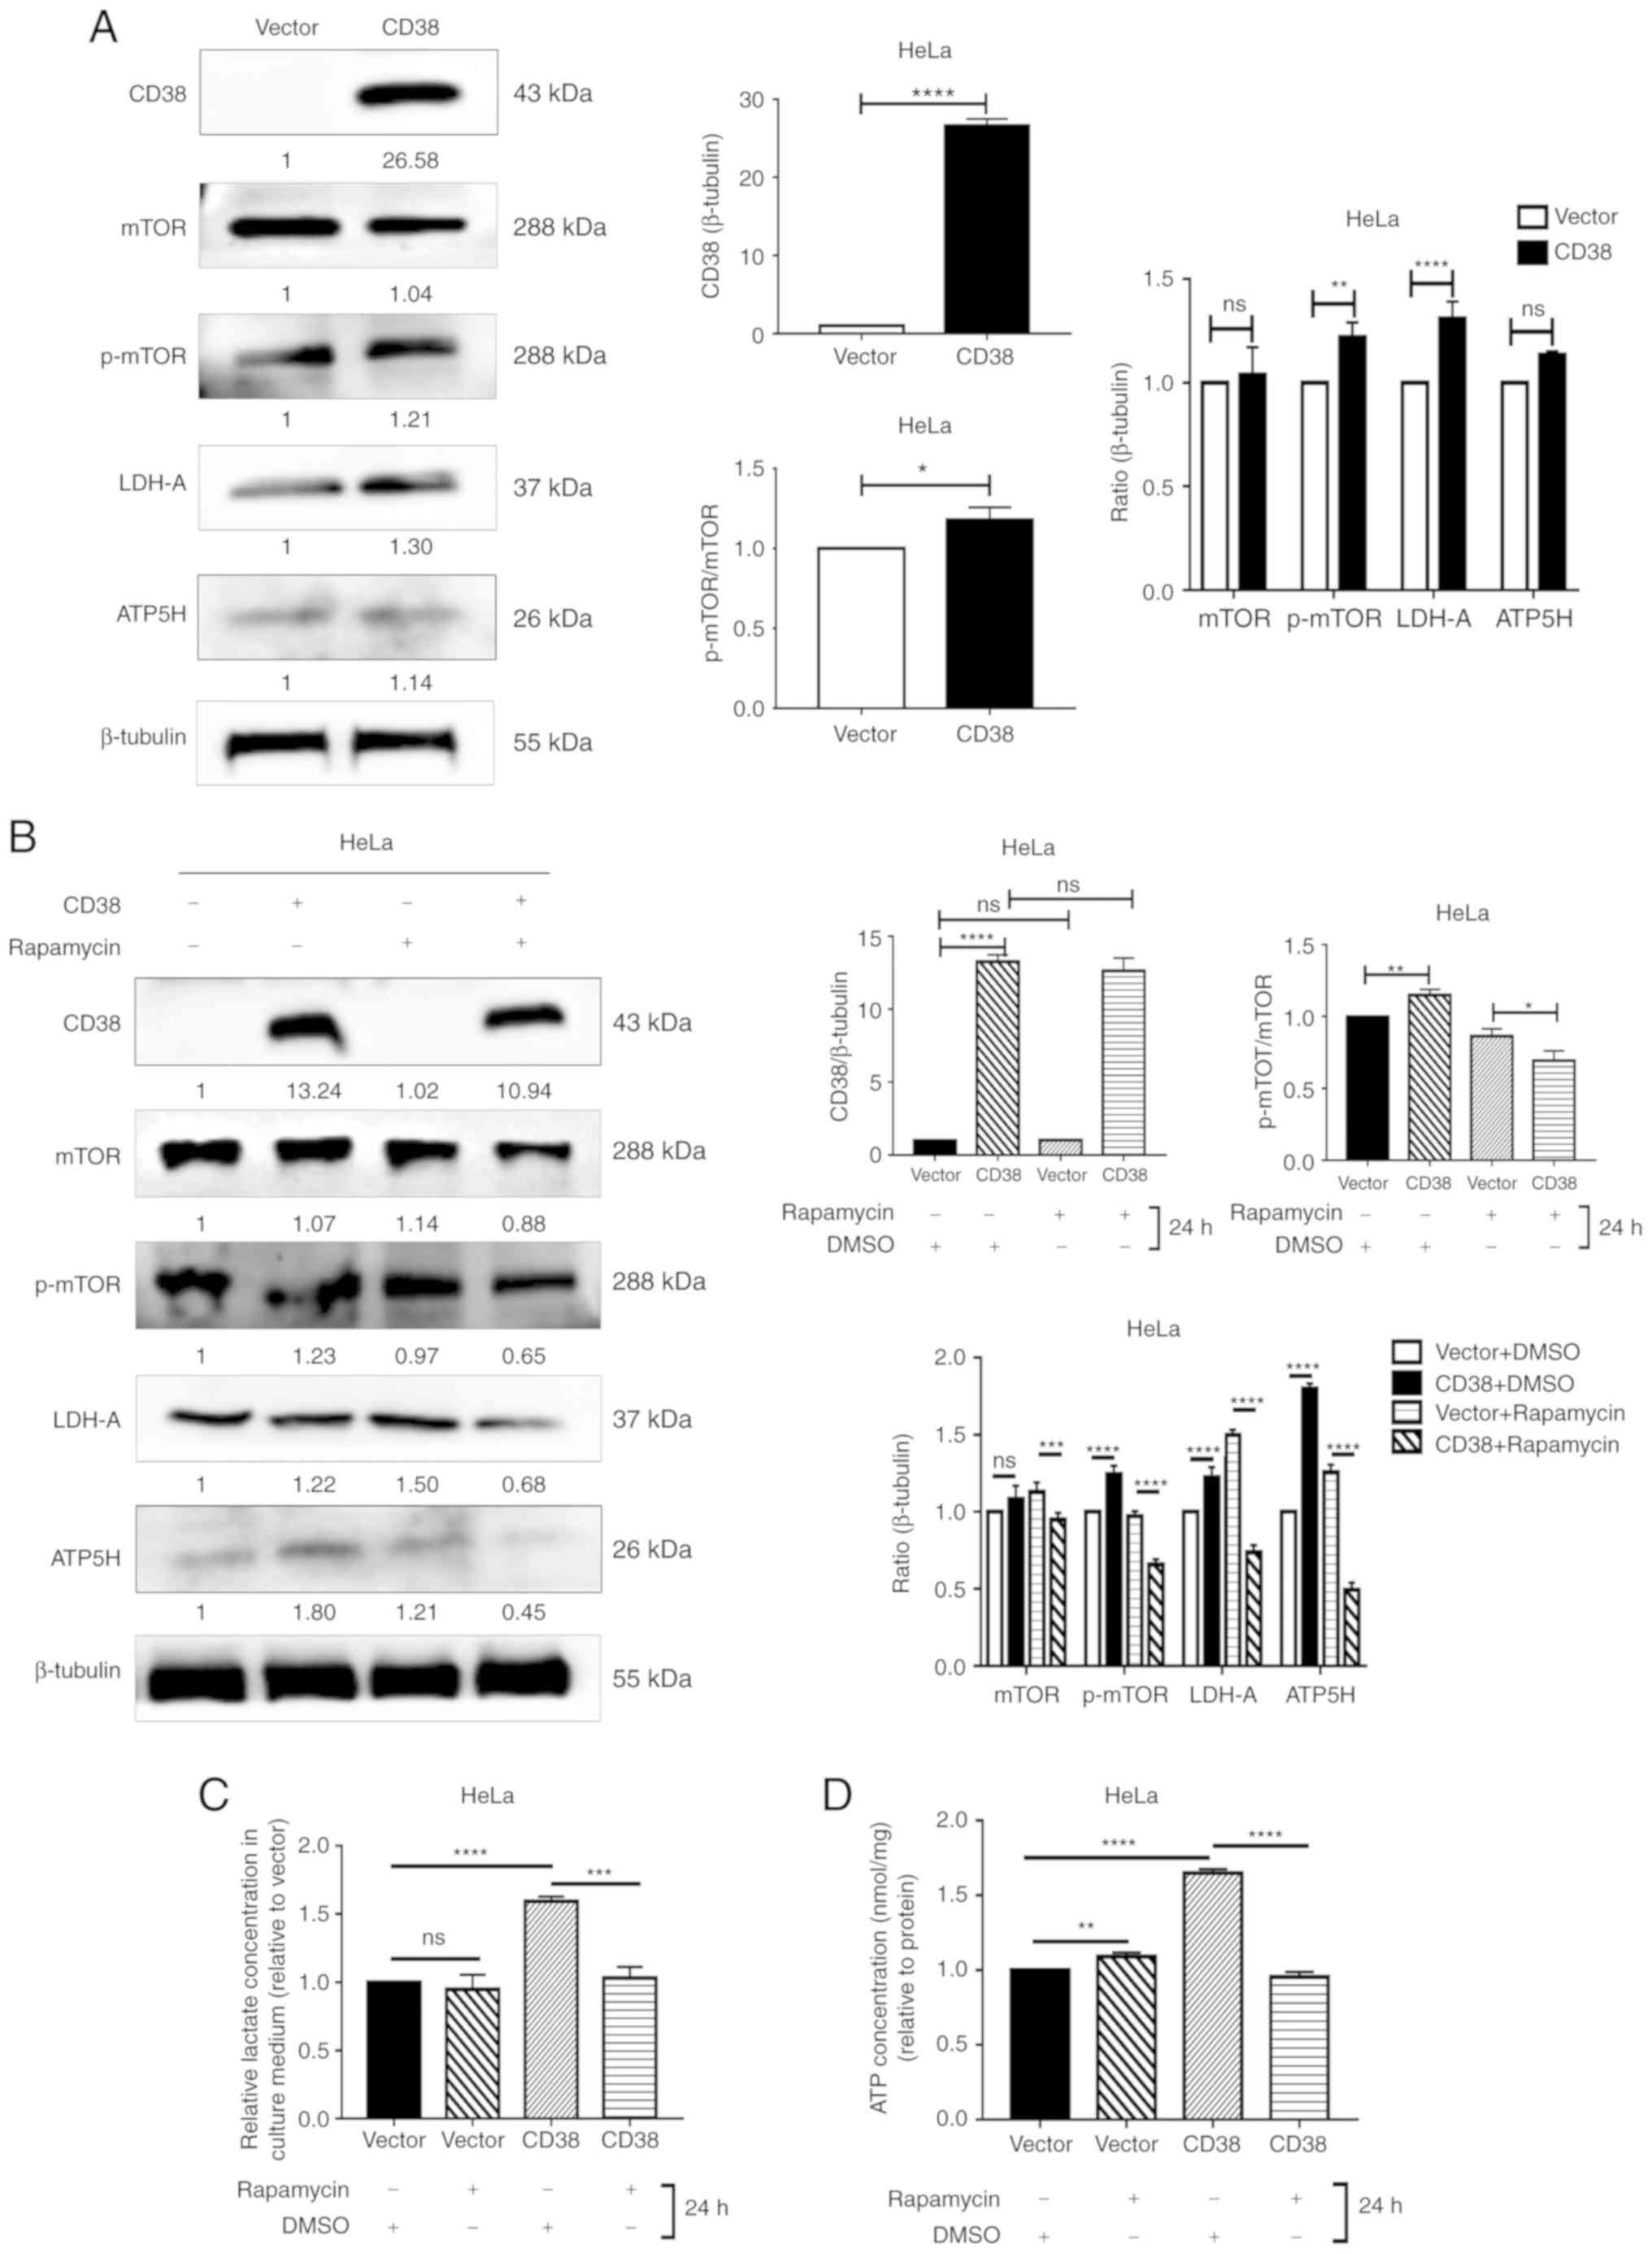 | Figure 4Detection of the levels of key
molecules in the PI3K/AKT/mTOR signaling pathway in HeLa cells. (A)
Western blotting analysis of mTOR, p-mTOR, LDH-A and ATP5H
following CD38 overexpression in HeLa cells. Images are
representative of three independent experiments. (B) Western
blotting analysis of m-TOR, p-mTOR, LDH-A and ATP5H in HeLa cells
treated with rapamycin for 24 h. (C) The lactate concentration in
the culture medium of HeLa cells treated with rapamycin for 24 h.
All values were normalized on the basis of cell number. (D) ATP
concentrations in the culture medium of HeLa cells treated with
rapamycin for 24 h. All values were normalized on the basis of cell
number. Data are presented as the mean ± standard deviation of
three independent experiments. *P<0.05,
**P<0.01, ***P<0.001 and
****P<0.0001. ns, not significant; mTOR, mammalian
target of rapamycin; LDH‑A, lactate dehydrogenase A; ATP5H, ATP
synthase peripheral stalk subunit D; p-, phosphorylated. |
CD38 affects cell proliferation and
apoptosis by activating the PI3K/AKT/mTOR signaling pathway in
cervical cancer cells
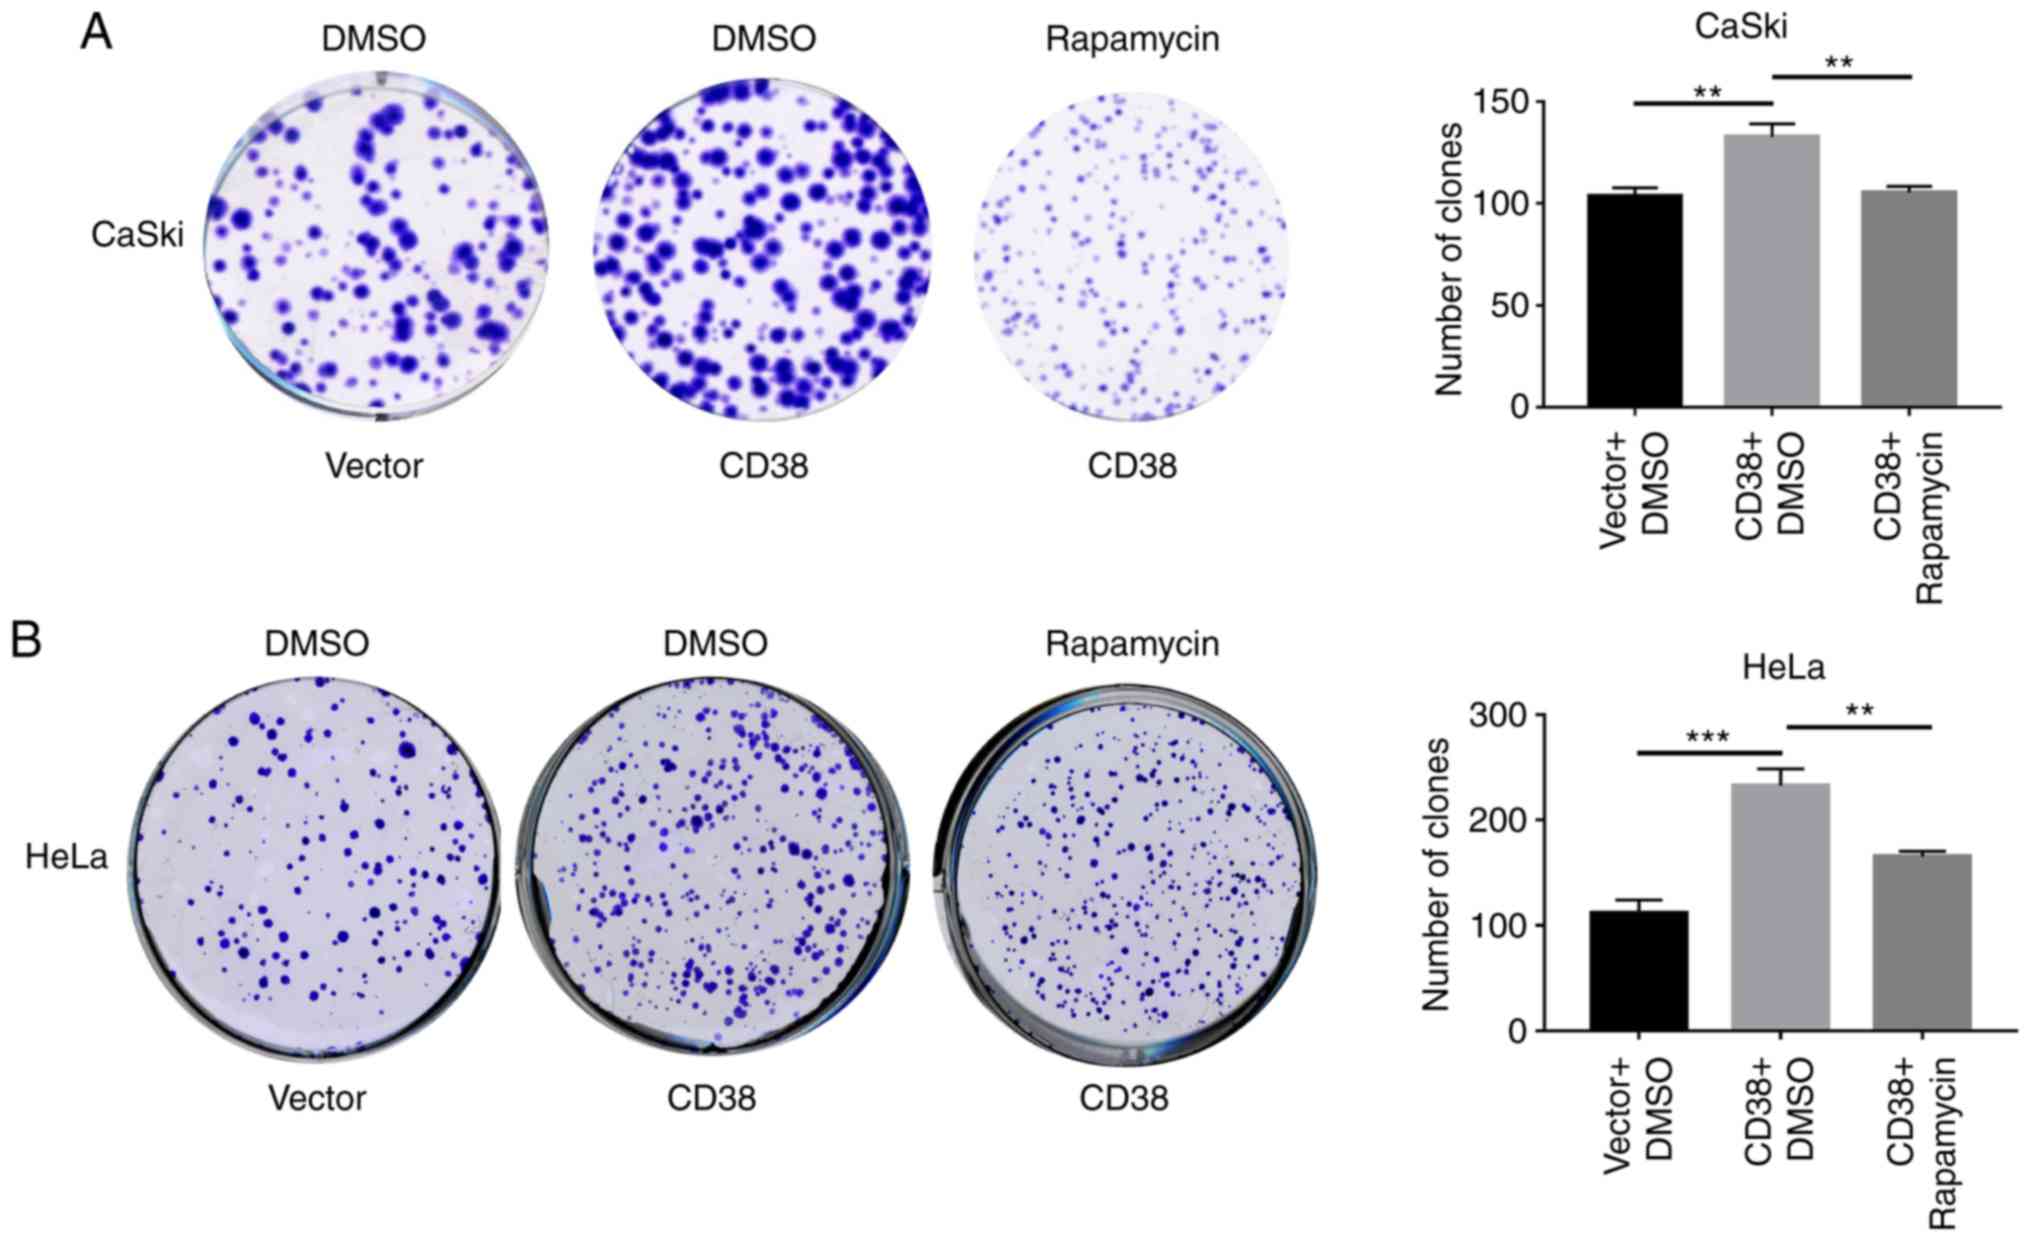
The levels of lactic acid and ATP metabolites are
closely associated with cell proliferation. To determine whether
CD38 promotes the proliferation of cervical cancer cells by
activating the PI3K/AKT/mTOR signaling pathway, cells were treated
with rapamycin and the effect of CD38 overexpression on cell
proliferation was detected using clone formation experiments.
Following CD38 overexpression, the number of clones of CaSki cells
treated with DMSO was significant increased, whereas following
treatment with rapamycin the number of clones of CaSki‑CD38 cells
was significantly decreased compared with those treated with DMSO
(Fig. 5A). Similar results were
obtained in HeLa cells (Fig. 5B).
This indicates that CD38 affects the proliferation of cervical
cancer cells via the PI3K/AKT/mTOR signaling pathway.
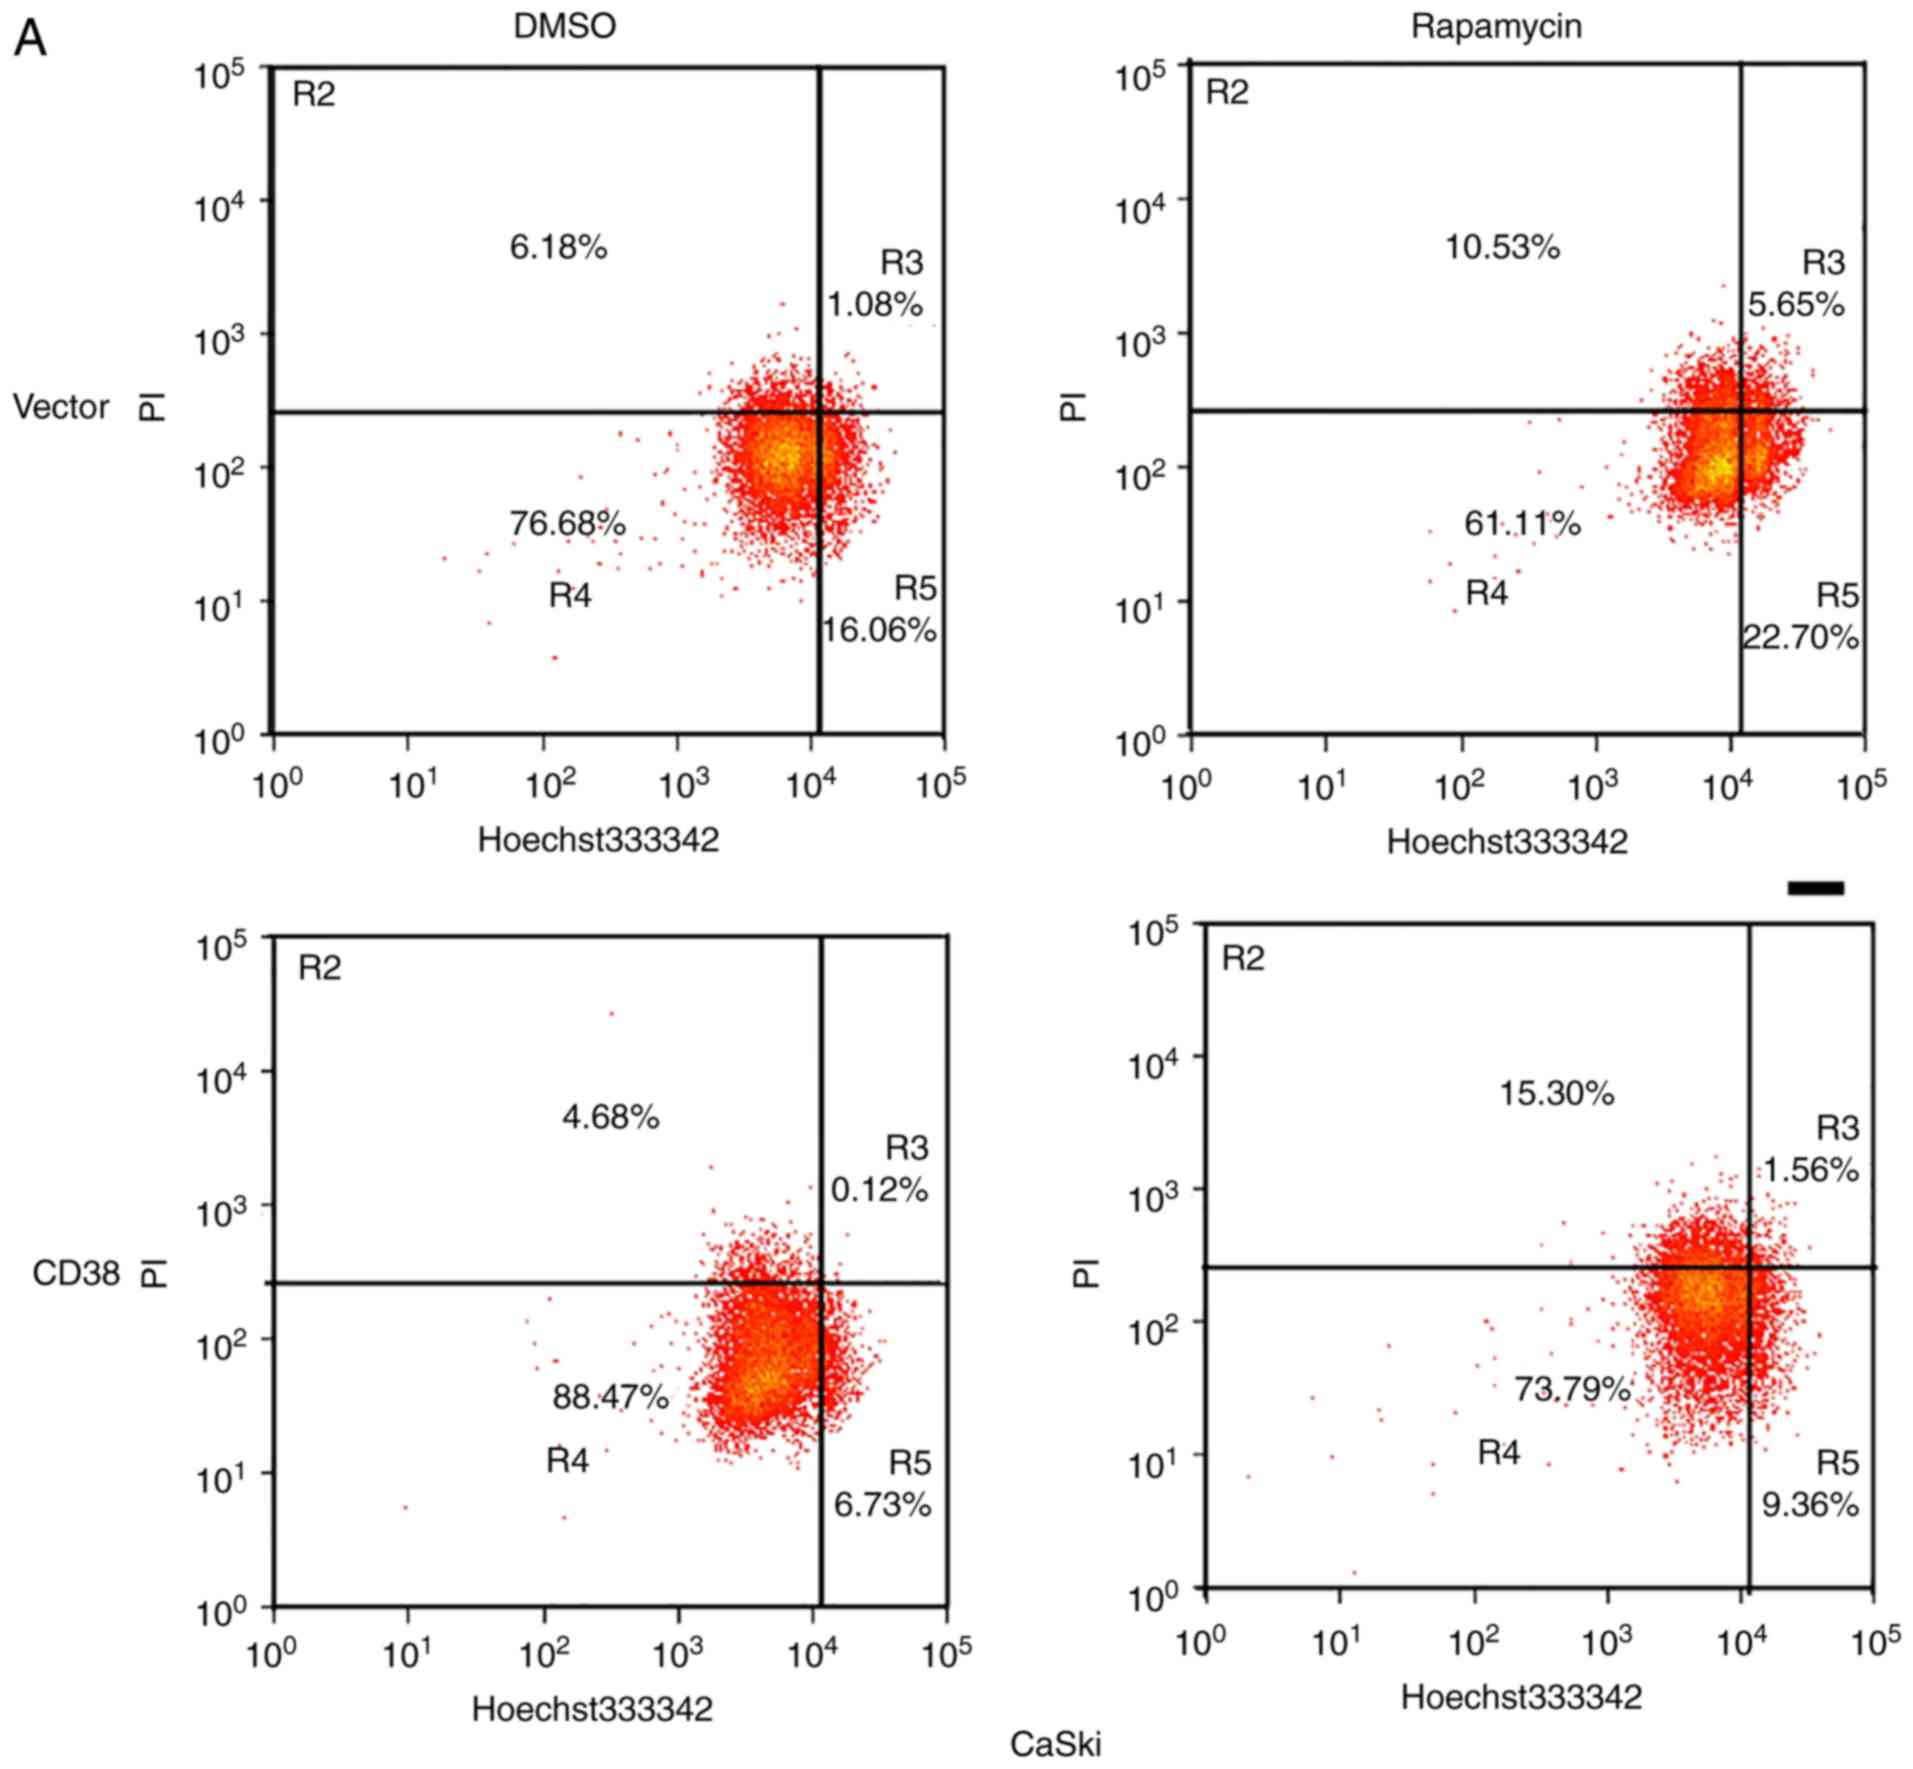
Furthermore, apoptosis of rapamycin and DMSO-treated
CaSki-CD38 and HeLa-CD38 cells was assessed. It was identified that
CD38 inhibited the apoptosis of DMSO‑treated cervical cancer cells
(P<0.01), and compared with the CD38-overexpressed cells treated
with DMSO, the apoptosis rate of CD38-overexpressed cells treated
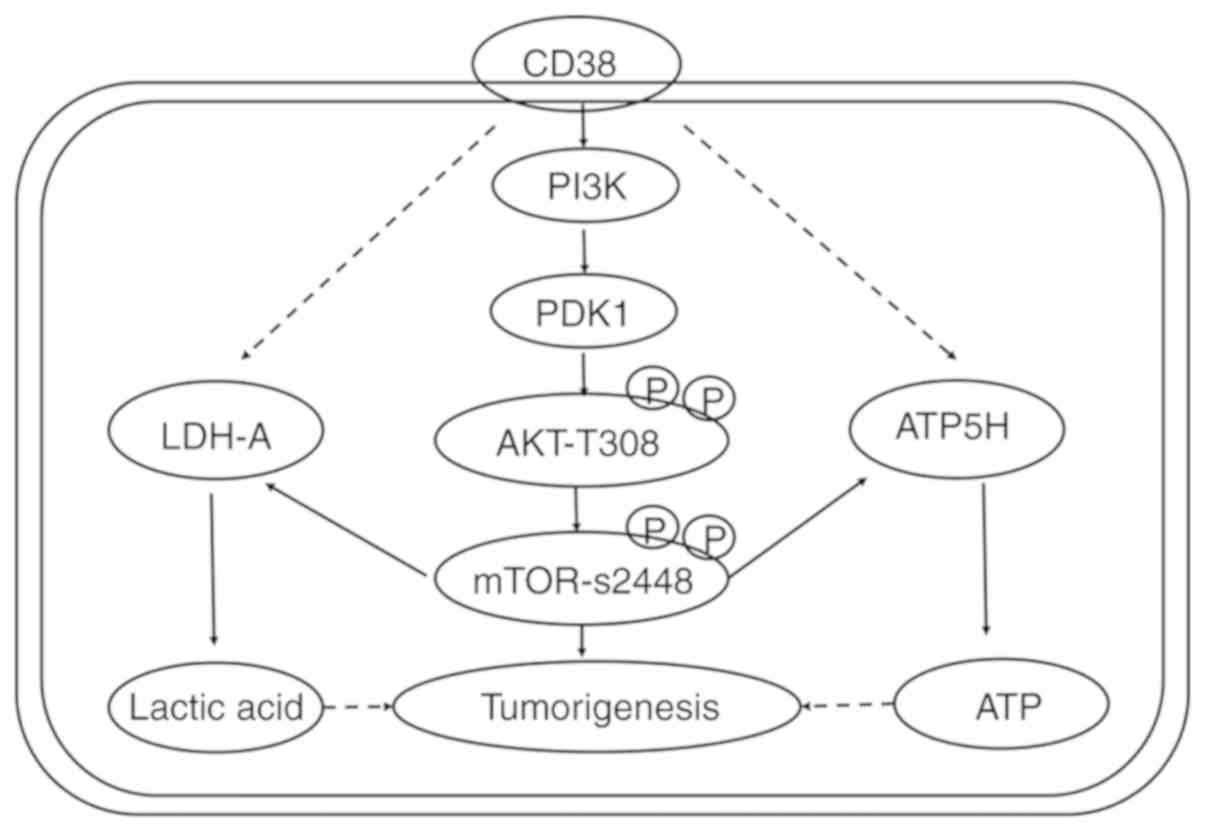
with rapamycin increased (P<0.05; Fig. 6). This indicates that the effects
of CD38 on the apoptosis of cervical cancer cells may occur via the
PI3K/AKT/mTOR signaling pathway (Fig.
7).
Discussion
Cellular biological processes are based on normally
regulated metabolism, while metabolism in tumor cells is
dysregulated, which leads to the abnormal survival and growth of
malignant cells (1,35). These changes provide sufficient
energy, macromolecular precursors and reducing equivalents to
support the rapid proliferation of tumor cells (1,2).
Cellular metabolism regulation is under precise control and the
main molecules and compounds involved in regulating metabolism
pathways, such as the tricarboxylic acid cycle, glycolysis,
oxidative phosphorylation and the pentose phosphate pathway, have
been discovered and have been subjected to intensive research
(36-38). However, the exact regulatory
mechanisms remain unclear.
The present study found that overexpression of CD38
was associated with changes in the levels of ATP5H-2, CYB5B, CYC1
and BRI3BP in cervical cancer cells, as well as changes in
metabolic pathways, such as 'oxidative phosphorylation', 'glycosyl
compound metabolic process' and 'ATP/ADP metabolic process'.
Glycolysis is more active in a variety of tumors, including diffuse
large B cell lymphoma (39,40),
uterine leiomyosarcoma (41) and
lung adenocarcinoma (42,43). Cancer cells often exhibit a high
rate of aerobic glycolysis, which promotes cancer growth and
progression by increasing glucose uptake, increasing lactic acid
production and supporting energy requirements (44). Knockdown of keratin 6B
significantly inhibits the expression of c-Myc, glucose uptake,
lactic acid production, ATP production, extracellular acidification
rate, and the protein levels of glucose transporter type 1 and
lactate dehydrogenase A. Furthermore, overexpression of c-Myc
reverses the decreased glycolysis and malignant phenotype in
keratin 6B-knockdown cells (34).
It has been proposed that oncogene expression is sufficient to
reprogram certain aspects of nutrient utilization, suggesting that
cell-autonomous metabolism is driven in part by oncogenes (20,45,46).
PI3K/AKT/mTOR activation is closely associated with
the occurrence, development and treatment of malignant tumors. PI3K
promotes AKT and mTOR phosphorylation to activate the PI3K/AKT/mTOR
signaling pathway (47). The
PI3K/AKT/mTOR signaling pathway can mediate the downregulation of
E-cadherin levels induced by insulin-like growth factor 1,
ultimately leading to the proliferation of ovarian cancer cells
(48). Mutations in the genes
encoding members of the PI3K/AKT/mTOR pathway are often found in
breast cancer (49). Mutations in
this pathway are frequently associated with cell transformation,
tumorigenesis, tumor progression and multidrug resistance (49).
The results of the present study demonstrated that
CD38 overexpression in CaSki cells upregulated the levels of key
molecules in the PI3K/AKT/mTOR signaling pathway, such as PI3K,
total AKT p-AKT and p-mTOR. CD38 overexpression also upregulated
p-TOR expression in HeLa cells. Treatment of cervical cancer cells
stably overexpressing CD38 with rapamycin results in downregulation
of p-mTOR, and the activity of the PI3K/AKT/mTOR signaling pathway
is inhibited accordingly (50).
Similarly, treatment with rapamycin resulted in significantly lower
levels of ATP and lactate cervical cancer cells compared with those
treated with DMSO. Clonogenic assays revealed that rapamycin could
reduce the proliferative phenotype of cervical cancer cells induced
by CD38 overexpression. Jian et al (47) reported that interleukin-17
activates PI3K/AKT/mTOR signaling pathway and regulates lung cancer
cell autophagy by downregulating the expression of Beclin 1 in lung
cancer cell lines. In endometrial cancer, the PI3K/AKT/mTOR
signaling pathway is often activated (51); however, the results of the clinical
trials of PI3K/AKT/mTOR inhibitors remain controversial (52-54).
New research on combination therapy using dual inhibitors,
multi-channel inhibitors or other targeted drugs may result in more
effective treatment (51). T cell
immunoglobulin and mucin domain containing 4 can activate
angiogenesis via the PI3K/AKT/mTOR signaling pathway, and then
recruit tumor-related macrophages, ultimately promoting the growth
of colorectal cancer (55).
Cellular secretion of epidermal growth factor (EGF) plays a role in
M2 polarization of macrophages in colon cancer. EGF can promote
macrophage polarization to M2 via the EGF receptor/PI3K/AKT/mTOR
pathway (56).
In summary, CD38 regulates glucose uptake, and
intracellular ATP and lactic acid levels in cervical cancer cells
by regulating the PI3K/AKT/mTOR signaling pathway. Ultimately, this
promotes the proliferation of cervical cancer cells. Rapamycin
could reverse the effect of CD38. However, to determine the exact
mechanism of CD38 in the regulation of cervical cancer cell
metabolism requires further experimentation.
Funding
This work was supported by the National Natural
Sciences Foundation of China (grant no. 81272975), the Science and
Technology Foundation Survey Project of Ministry of Science and
Technology of China (grant nos. 2018FY100900 and 2018FY10090004),
and the Fundamental Research Funds for the Central Universities of
Central South University (grant no. 2019zzts731).
Availability of data and materials
All data generated or analyzed during this study are
included in this published article.
Authors' contributions
SL, CY and XJ performed the experiments. LL, JH and
ZH analyzed the data. GL and YZ designed the study and wrote the
manuscript. All authors read and approved the final manuscript.
Ethics approval and consent to
participate
Not applicable.
Patient consent for publication
Not applicable.
Competing interests
The authors declare that they have no competing
interests.
Acknowledgments
Not applicable.
Abbreviations:
|
AKT
|
Akt serine/threonine kinase
|
|
mTOR
|
mammalian target of rapamycin
|
|
LDH-A
|
lactate dehydrogenase A
|
|
ATP5H
|
ATP synthase peripheral stalk subunit
D
|
|
KEGG
|
Kyoto Encyclopedia of Genes and
Genomes
|
|
PI3K
|
phosphatidylinositol-4,5-bisphosphate
3-kinase
|
References
|
1
|
DeBerardinis RJ, Lum JJ, Hatzivassiliou G
and Thompson CB: The biology of cancer: Metabolic reprogramming
fuels cell growth and proliferation. Cell Metabolism. 7:11–20.
2008. View Article : Google Scholar : PubMed/NCBI
|
|
2
|
Vander Heiden MG, Cantley LC and Thompson
CB: Understanding the Warburg effect: The metabolic requirements of
cell proliferation. Science. 324:1029–1033. 2009. View Article : Google Scholar : PubMed/NCBI
|
|
3
|
Warburg O: On the origin of cancer cells.
Science. 123:309–314. 1956. View Article : Google Scholar : PubMed/NCBI
|
|
4
|
Warburg O, Wind F and Negelein E: The
metabolism of tumors in the body. J Gen Physiol. 8:519–530. 1927.
View Article : Google Scholar : PubMed/NCBI
|
|
5
|
Lv L, Li D, Zhao D, Lin R, Chu Y, Zhang H,
Zha Z, Liu Y, Li Z, Xu Y, et al: Acetylation targets the M2 isoform
of pyruvate kinase for degradation through chaperone-mediated
autophagy and promotes tumor growth. Mol Cell. 42:719–730. 2011.
View Article : Google Scholar : PubMed/NCBI
|
|
6
|
Xu XD, Shao SX, Jiang HP, Cao YW, Wang YH,
Yang XC, Wang YL, Wang XS and Niu HT: Warburg effect or reverse
Warburg effect? A review of cancer metabolism. Oncol Res Treat.
38:117–122. 2015. View Article : Google Scholar : PubMed/NCBI
|
|
7
|
Liesa M and Shirihai OS: Mitochondrial
dynamics in the regulation of nutrient utilization and energy
expenditure. Cell Metab. 17:491–506. 2013. View Article : Google Scholar : PubMed/NCBI
|
|
8
|
Mitra K: Mitochondrial fission-fusion as
an emerging key regulator of cell proliferation and
differentiation. Bioessays. 35:955–964. 2013. View Article : Google Scholar : PubMed/NCBI
|
|
9
|
Youle RJ and Karbowski M: Mitochondrial
fission in apoptosis. Nat Rev Mol Cell Biol. 6:657–663. 2005.
View Article : Google Scholar : PubMed/NCBI
|
|
10
|
Luo S, Li Y, Ma R, Liu J, Xu P, Zhang H,
Tang K, Ma J, Liu N, Zhang Y, et al: Downregulation of PCK2
remodels tricar-boxylic acid cycle in tumor-repopulating cells of
melanoma. Oncogene. 36:3609–3617. 2017. View Article : Google Scholar : PubMed/NCBI
|
|
11
|
Kerins MJ, Vashisht AA, Liang BX,
Duckworth SJ, Praslicka BJ, Wohlschlegel JA and Ooi A: Fumarate
mediates a chronic prolif-erative signal in fumarate
Hydratase-inactivated cancer cells by increasing transcription and
translation of ferritin genes. Mol Cell Biol. 37:pii: e00079-e17.
2017, View Article : Google Scholar
|
|
12
|
Crunkhorn S: Breast cancer: Inhibiting
fatty acid oxidation blocks tumour growth. Nat Rev Drug Discov.
15:3102016.
|
|
13
|
Zhu L, Ploessl K, Zhou R, Mankoff D and
Kung HF: Metabolic imaging of glutamine in cancer. J Nucl Med.
58:533–537. 2017. View Article : Google Scholar : PubMed/NCBI
|
|
14
|
Csibi A, Fendt SM, Li C, Poulogiannis G,
Choo AY, Chapski DJ, Jeong SM, Dempsey JM, Parkhitko A, Morrison T,
et al: The mTORC1 pathway stimulates glutamine metabolism and cell
proliferation by repressing SIRT4. Cell. 153:840–854. 2013.
View Article : Google Scholar : PubMed/NCBI
|
|
15
|
Altman BJ, Stine ZE and Dang CV: From
Krebs to clinic: Glutamine metabolism to cancer therapy. Nat Rev
Cancer. 16:619–634. 2016. View Article : Google Scholar : PubMed/NCBI
|
|
16
|
Tedeschi PM, Bansal N, Kerrigan JE, Abali
EE, Scotto KW and Bertino JR: NAD+ kinase as a therapeutic target
in cancer. Clin Cancer Res. 22:5189–5195. 2016. View Article : Google Scholar : PubMed/NCBI
|
|
17
|
Jiang P, Du W, Wang X, Mancuso A, Gao X,
Wu M and Yang X: p53 regulates biosynthesis through direct
inactivation of glucose-6-phosphate dehydrogenase. Nat Cell Biol.
13:310–316. 2011. View
Article : Google Scholar : PubMed/NCBI
|
|
18
|
Dang CV: Rethinking the Warburg effect
with Myc micromanaging glutamine metabolism. Cancer Res.
70:859–862. 2010. View Article : Google Scholar : PubMed/NCBI
|
|
19
|
Wang JB, Erickson JW, Fuji R, Ramachandran
S, Gao P, Dinavahi R, Wilson KF, Ambrosio AL, Dias SM, Dang CV and
Cerione RA: Targeting mitochondrial glutaminase activity inhibits
oncogenic transformation. Cancer Cell. 18:207–219. 2010. View Article : Google Scholar : PubMed/NCBI
|
|
20
|
Gao P, Tchernyshyov I, Chang TC, Lee YS,
Kita K, Ochi T, Zeller KI, De Marzo AM, Van Eyk JE, Mendell JT and
Dang CV: c-Myc suppression of miR-23a/b enhances mitochondrial
glutaminase expression and glutamine metabolism. Nature.
458:762–765. 2009. View Article : Google Scholar : PubMed/NCBI
|
|
21
|
Poulain L, Sujobert P, Zylbersztejn F,
Barreau S, Stuani L, Lambert M, Palama TL, Chesnais V, Birsen R,
Vergez F, et al: High mTORC1 activity drives glycolysis addiction
and sensitivity to G6PD inhibition in acute myeloid leukemia cells.
Leukemia. 31:2326–2335. 2017. View Article : Google Scholar : PubMed/NCBI
|
|
22
|
Oronsky BT, Oronsky N, Fanger GR, Parker
CW, Caroen SZ, Lybeck M and Scicinski JJ: Follow the ATP: Tumor
energy production: A perspective. Anticancer Agents Med Chem.
14:1187–1198. 2014. View Article : Google Scholar : PubMed/NCBI
|
|
23
|
Rah SY and Kim UH: CD38-mediated
Ca2+ signaling contributes to glucagon-induced hepatic
gluconeogenesis. Sci Rep. 5:107412015. View Article : Google Scholar
|
|
24
|
Mehta K, Shahid U and Malavasi F: Human
CD38, a cell-surface protein with multiple functions. FASEB J.
10:1408–1417. 1996. View Article : Google Scholar : PubMed/NCBI
|
|
25
|
Malavasi F, Funaro A, Roggero S,
Horenstein A, Calosso L and Mehta K: Human CD38: A glycoprotein in
search of a function. Immunol Today. 15:95–97. 1994. View Article : Google Scholar : PubMed/NCBI
|
|
26
|
Chini EN: CD38 as a regulator of cellular
NAD: A novel potential pharmacological target for metabolic
conditions. Curr Pharm Des. 15:57–63. 2009. View Article : Google Scholar : PubMed/NCBI
|
|
27
|
Zocchi E, Daga A, Usai C, Franco L, Guida
L, Bruzzone S, Costa A, Marchetti C and De Flora A: Expression of
CD38 increases intracellular calcium concentration and reduces
doubling time in HeLa and 3T3 cells. J Biol Chem. 273:8017–8024.
1998. View Article : Google Scholar : PubMed/NCBI
|
|
28
|
Long AN, Owens K, Schlappal AE, Kristian
T, Fishman PS and Schuh RA: Effect of nicotinamide mononucleotide
on brain mitochondrial respiratory deficits in an Alzheimer's
disease‑relevant murine model. BMC Neurol. 15:192015. View Article : Google Scholar
|
|
29
|
Hayakawa K, Esposito E, Wang X, Terasaki
Y, Liu Y, Xing C, Ji X and Lo EH: Transfer of mitochondria from
astrocytes to neurons after stroke. Nature. 535:551–555. 2016.
View Article : Google Scholar : PubMed/NCBI
|
|
30
|
Liao S, Xiao S, Chen H, Zhang M, Chen Z,
Long Y, Gao L, Zhu G, He J, Peng S, et al: CD38 enhances the
proliferation and inhibits the apoptosis of cervical cancer cells
by affecting the mitochondria functions. Mol Carcinog.
56:2245–2257. 2017. View Article : Google Scholar : PubMed/NCBI
|
|
31
|
Liao S, Xiao S, Zhu G, Zheng D, He J, Pei
Z, Li G and Zhou Y: CD38 is highly expressed and affects the
PI3K/Akt signaling pathway in cervical cancer. Oncol Rep.
32:2703–2709. 2014. View Article : Google Scholar : PubMed/NCBI
|
|
32
|
Zhu GC, Gao L, He J, Long Y, Liao S, Wang
H, Li X, Yi W, Pei Z, Wu M, et al: CD90 is upregulated in gastric
cancer tissues and inhibits gastric cancer cell apoptosis by
modulating the expression level of SPARC protein. Oncol Rep.
34:2497–2506. 2015. View Article : Google Scholar : PubMed/NCBI
|
|
33
|
Li H, Li X, Ge X, Jia L, Zhang Z, Fang R,
Yang J, Liu J, Peng S, Zhou M, et al: MiR-34b-3 and miR-449a
inhibit malignant progression of nasopharyngeal carcinoma by
targeting lactate dehydrogenase A. Oncotarget. 7:54838–54851. 2016.
View Article : Google Scholar : PubMed/NCBI
|
|
34
|
Luo P, Zhang C, Liao F, Chen L, Liu Z,
Long L, Jiang Z, Wang Y, Wang Z, Liu Z, et al: Transcriptional
positive cofactor 4 promotes breast cancer proliferation and
metastasis through c-Myc mediated Warburg effect. Cell Commun
Signal. 17:362019. View Article : Google Scholar : PubMed/NCBI
|
|
35
|
Hensley CT, Faubert B, Yuan Q, Lev-Cohain
N, Jin E, Kim J, Jiang L, Ko B, Skelton R, Loudat L, et al:
Metabolic heterogeneity in human lung tumors. Cell. 164:681–694.
2016. View Article : Google Scholar : PubMed/NCBI
|
|
36
|
Kletzien RF, Harris PK and Foellmi LA:
Glucose-6-phosphate dehydrogenase: A 'housekeeping' enzyme subject
to tissue‑specific regulation by hormones, nutrients, and oxidant
stress. FASEB J. 8:174–181. 1994. View Article : Google Scholar : PubMed/NCBI
|
|
37
|
Stanton RC: Glucose-6-phosphate
dehydrogenase, NADPH, and cell survival. IUBMB Life. 64:362–369.
2012. View Article : Google Scholar : PubMed/NCBI
|
|
38
|
Wood T: Physiological functions of the
pentose phosphate pathway. Cell Biochem Funct. 4:241–247. 1986.
View Article : Google Scholar : PubMed/NCBI
|
|
39
|
Compagno M, Lim WK, Grunn A, Nandula SV,
Brahmachary M, Shen Q, Bertoni F, Ponzoni M, Scandurra M, Califano
A, et al: Mutations of multiple genes cause deregulation of
NF-kappaB in diffuse large B-cell lymphoma. Nature. 459:717–721.
2009. View Article : Google Scholar : PubMed/NCBI
|
|
40
|
Rosenwald A, Wright G, Chan WC, Connors
JM, Campo E, Fisher RI, Gascoyne RD, Muller-Hermelink HK, Smeland
EB, Giltnane JM, et al: The use of molecular profiling to predict
survival after chemotherapy for diffuse large-B-cell lymphoma. N
Engl J Med. 346:1937–1947. 2002. View Article : Google Scholar : PubMed/NCBI
|
|
41
|
Quade BJ, Wang TY, Sornberger K, Dal Cin
P, Mutter GL and Morton CC: Molecular pathogenesis of uterine
smooth muscle tumors from transcriptional profiling. Genes
Chromosomes Cancer. 40:97–108. 2004. View Article : Google Scholar : PubMed/NCBI
|
|
42
|
Stearman RS, Dwyer-Nield L, Zerbe L,
Blaine SA, Chan Z, Bunn PA Jr, Johnson GL, Hirsch FR, Merrick DT,
Franklin WA, et al: Analysis of orthologous gene expression between
human pulmonary adenocarcinoma and a carcinogen-induced murine
model. Am J Pathol. 167:1763–1775. 2005. View Article : Google Scholar : PubMed/NCBI
|
|
43
|
Su LJ, Chang CW, Wu YC, Chen KC, Lin CJ,
Liang SC, Lin CH, Whang-Peng J, Hsu SL, Chen CH and Huang CY:
Selection of DDX5 as a novel internal control for Q-RT-PCR from
micro-array data using a block bootstrap re-sampling scheme. BMC
Genomics. 8:1402007. View Article : Google Scholar
|
|
44
|
Gatenby RA and Gillies RJ: Why do cancers
have high aerobic glycolysis? Nat Rev Cancer. 4:891–899. 2004.
View Article : Google Scholar : PubMed/NCBI
|
|
45
|
Ji H, Ramsey MR, Hayes DN, Fan C, McNamara
K, Kozlowski P, Torrice C, Wu MC, Shimamura T, Perera SA, et al:
LKB1 modulates lung cancer differentiation and metastasis. Nature.
448:807–810. 2007. View Article : Google Scholar : PubMed/NCBI
|
|
46
|
Son J, Lyssiotis CA, Ying H, Wang X, Hua
S, Ligorio M, Perera RM, Ferrone CR, Mullarky E, Shyh-Chang N, et
al: Glutamine supports pancreatic cancer growth through a
KRAS-regulated metabolic pathway. Nature. 496:101–105. 2013.
View Article : Google Scholar : PubMed/NCBI
|
|
47
|
Jian M, Yunjia Z, Zhiying D, Yanduo J and
Guocheng J: Interleukin 7 receptor activates PI3K/Akt/mTOR
signaling pathway via downregulation of Beclin-1 in lung cancer.
Mol Carcinog. 58:358–365. 2019. View Article : Google Scholar
|
|
48
|
Lau MT and Leung PC: The PI3K/Akt/mTOR
signaling pathway mediates insulin-like growth factor 1-induced
E-cadherin down-regulation and cell proliferation in ovarian cancer
cells. Cancer Lett. 326:191–198. 2012. View Article : Google Scholar : PubMed/NCBI
|
|
49
|
Guerrero-Zotano A, Mayer IA and Arteaga
CL: PI3K/AKT/mTOR: Role in breast cancer progression, drug
resistance, and treatment. Cancer Metastasis Rev. 35:515–524. 2016.
View Article : Google Scholar : PubMed/NCBI
|
|
50
|
Takeuchi H, Kondo Y, Fujiwara K, Kanzawa
T, Aoki H, Mills GB and Kondo S: Synergistic augmentation of
rapamycin-induced autophagy in malignant glioma cells by
phosphatidylinositol 3-kinase/protein kinase B inhibitors. Cancer
Res. 65:3336–3346. 2005. View Article : Google Scholar : PubMed/NCBI
|
|
51
|
Barra F, Evangelisti G, Ferro Desideri L,
Di Domenico S, Ferraioli D, Vellone VG, De Cian F and Ferrero S:
Investigational PI3K/AKT/mTOR inhibitors in development for
endometrial cancer. Expert Opin Investig Drugs. 28:131–142. 2019.
View Article : Google Scholar
|
|
52
|
Fleming GF, Filiaci VL, Marzullo B, Zaino
RJ, Davidson SA, Pearl M, Makker V, Burke JJ II, Zweizig SL, Van Le
L, et al: Temsirolimus with or without megestrol acetate and
tamoxifen for endometrial cancer: A gynecologic oncology group
study. Gynecol Oncol. 132:585–592. 2014. View Article : Google Scholar : PubMed/NCBI
|
|
53
|
Colombo N, McMeekin S, Schwartz P, Kostka
J, Sessa C, Holloway PG, Braly P, Matei D and Einstein M: A phase
II trial of the mTOR inhibitor AP23573 as a single agent in
advanced endometrial cancer. J Clin Oncol. 25(18 Suppl): S55162007.
View Article : Google Scholar
|
|
54
|
Tsoref D, Welch S, Lau S, Biagi J, Tonkin
K, Martin LA, Ellard S, Ghatage P, Elit L, Mackay HJ, et al: Phase
II study of oral rida-forolimus in women with recurrent or
metastatic endometrial cancer. Gynecol Oncol. 135:184–189. 2014.
View Article : Google Scholar : PubMed/NCBI
|
|
55
|
Tan X, Zhang Z, Yao H and Shen L: Tim-4
promotes the growth of colorectal cancer by activating angiogenesis
and recruiting tumor-associated macrophages via the PI3K/AKT/mTOR
signaling pathway. Cancer Lett. 436:119–128. 2018. View Article : Google Scholar : PubMed/NCBI
|
|
56
|
Lian G, Chen S, Ouyang M, Li F, Chen L and
Yang J: Colon cancer cell secretes EGF to promote M2 polarization
of TAM through EGFR/PI3K/AKT/mTOR pathway. Technol Cancer Res
Treat. 18:15330338198490682019. View Article : Google Scholar : PubMed/NCBI
|