Introduction
Gastric cancer (GC) is a common malignant tumor of
the digestive system that originates in the gastric mucosal
epithelium. GC is a frequently diagnosed type of cancer and is an
important leading cause of cancer-related mortality according to
the cancer statistics of 2019 (1).
Currently, the majority of patients with early-stage GC have a
relatively long-term survival time after selecting surgery as a
principal treatment option (2-4). In
recent years, a program combining immunotherapy, molecular targeted
therapy and neoadjuvant chemoradiotherapy has been shown to be a
promising treatment method for GC (5-9).
However, the molecular mechanisms associated with the occurrence
and progression of GC remain unclear. Therefore, the exploration of
cancer-related genes and specific molecular targets for the
effective treatment of GC is imperative.
SAC3 domain containing 1 (SAC3D1) is a
protein-coding gene located on chromosome 11 and is widely found in
the cytoplasm, cytoskeleton, microtubule tissue center, centrosome
and spindle (10). SAC3D1 has been
reported to be abnormally expressed in multiple types of cancer and
may be associated with the occurrence or progression of numerous
types of cancer. A previous study reported that SAC3D1 may serve as
a prognostic biomarker in hepatocellular carcinoma by combining the
data of Gene Expression Omnibus (GEO), The Cancer Genome Atlas and
International Cancer Genome Consortium (11). The prognostic value of SAC3D1 has
also been demonstrated in colon cancer (12). You et al reported that
SAC3D1 was associated with SLC2A5-inhibited adjacent lung
adenocarcinoma cytoplasmic pro-B cell progression (13). However, the role and molecular
mechanisms of action of SAC3D1 in GC have not yet been reported.
According to a preliminary calculation with TCGA RNA-seq data,
SAC3D1 was found to be significantly abnormally expressed in GC.
Thus, it was speculated that SAC3D1 may play a pivotal clinical
role in GC.
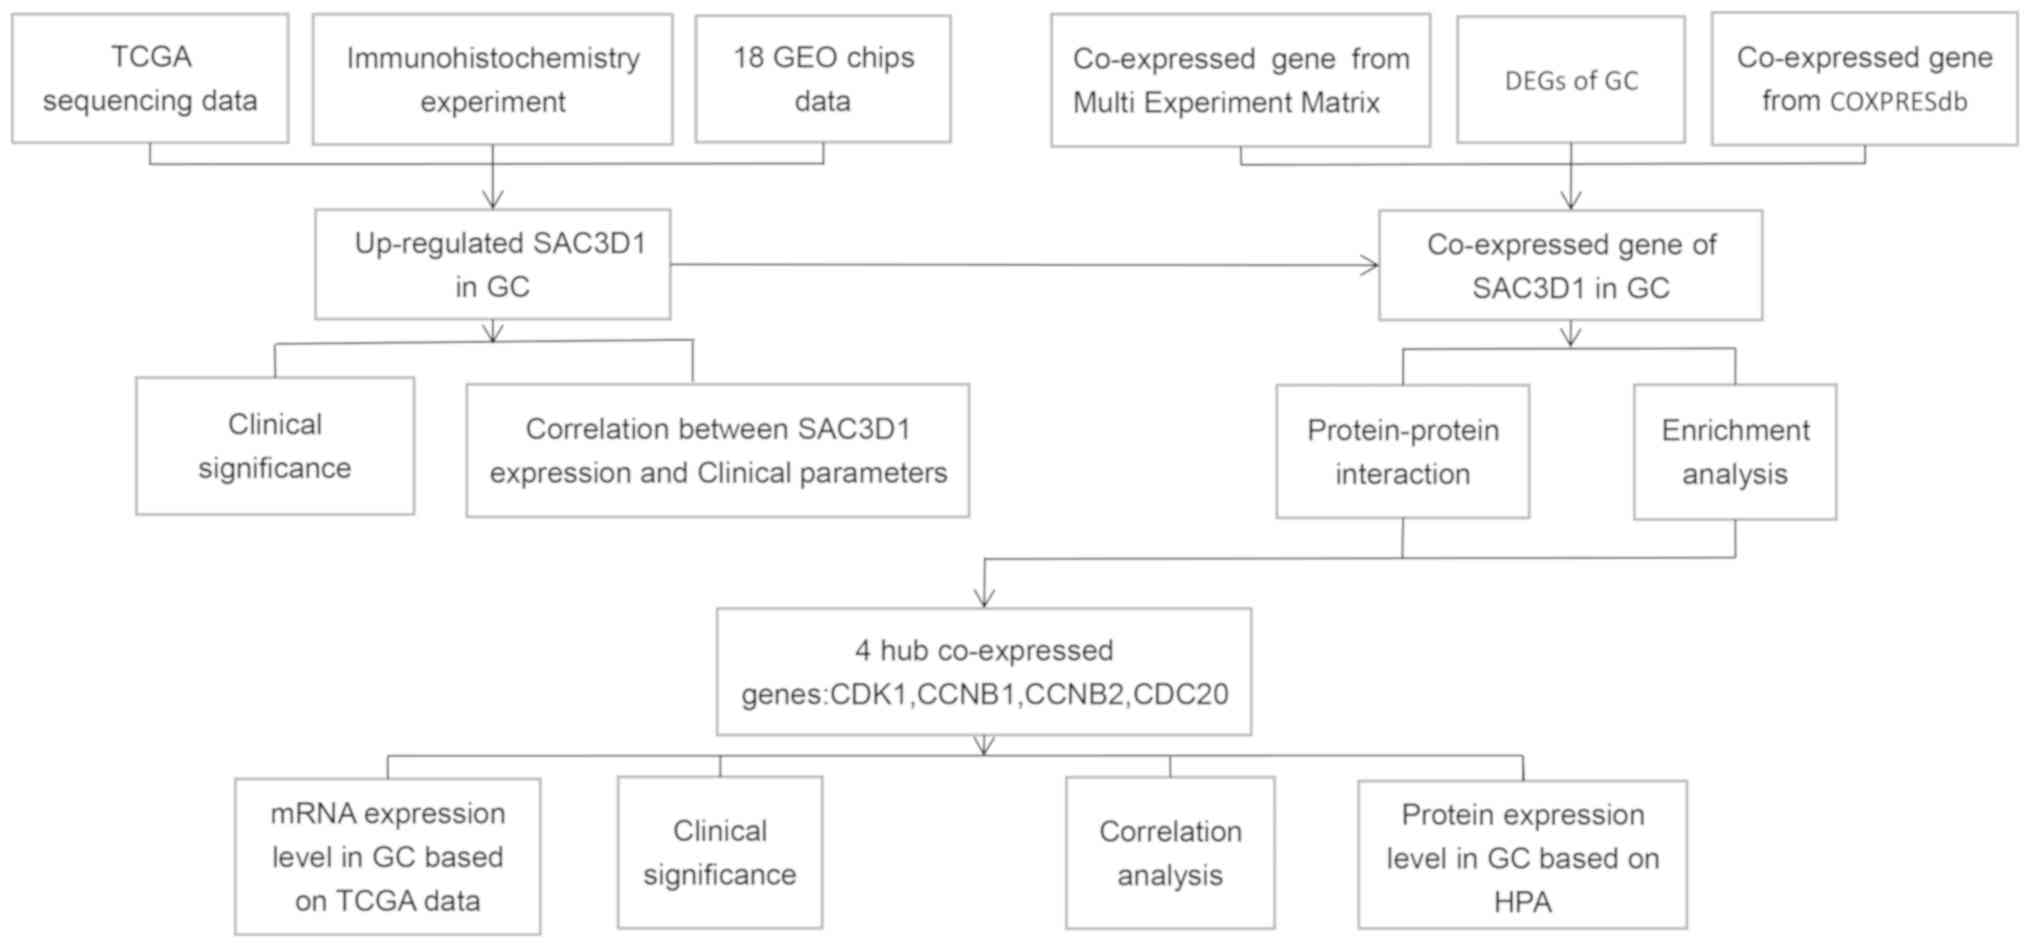
In the present study, GC microarray data and RNA-seq
data were integrated to assess the mRNA expression of SAC3D1 in GC,
and an in-house immunohistochemistry (IHC) was performed to further
validate the protein expression level of SAC3D1. The co-expressed
genes of SAC3D1 in GC were also collected and the possible molecule
molecular mechanisms of action of SAC3D1 were analyzed by
bioinformatics methods (Fig.
1).
Materials and methods
Data sources and processing
GC microarray and RNA-seq data were screened from
the Sequence Read Archive (SRA; https://www.ncbi.nlm.nih.gov/sra) (14), Gene Expression Omnibus (GEO;
http://www.ncbi.nlm.nih.gov/geo/)
(15), ArrayExpress(http://www.ebi.ac.uk/arrayexpress/) (16) and Oncomine (https://www.oncomine.org/resource/main.html)
(17) databases with the following
keywords: ('gastric' OR 'stomach' OR 'gastrointestinal') AND
('cancer' OR 'carcinoma' OR 'tumor' OR 'adenocarcinoma'). The
inclusion criteria were as follows: First, the experimental group
and the control group should be human GC samples and healthy
samples, respectively. Second, lymph node metastasis and distant
metastasis tissues were also included in the present study. Third,
the calculated mRNA expression data should be provided by all
included datasets. The information of included GC microarray and
RNA-seq data is presented in Table
I. Besides, microarray and RNA-seq data with prognostic data
were screened separately for prognostic-related analysis. The mRNA
expression matrix data of each dataset were downloaded, and the
mRNA expression data of SAC3D1 were extracted. The SAC3D1
expression data underwent a log2 transformation and were divided
into cancer groups and normal groups. The GC RNA seq data of the
TCGA database were downloaded from UCSC Xena (https://xena.ucsc.edu/), which included sequencing
data of 373 GC and 32 normal tissues. The data were processed as
microarray data. The GC-related clinical parameters, including sex,
grade, age, TNM stage and survival data, were also acquired from
UCSC Xena.
 | Table ISAC3D1 expression profile based on
immunohistochemistry data, GEO datasets and TCGA sequencing
data. |
Table I
SAC3D1 expression profile based on
immunohistochemistry data, GEO datasets and TCGA sequencing
data.
| Datasets | Country | Year | Platform | Patients
| Normal
| t-value | P-value |
|---|
| Number | Mean | SD | Number | Mean | SD |
|---|
| GSE103236 | Romania | 2017 | GPL4133 | 10 | 10.127 | 0.70021 | 9 | 9.3167 | 0.423 | -3.008 | 0.008 |
| GSE81948 | Italy | 2017 | GPL6244 | 15 | 7.5101 | 0.12937 | 5 | 7.5443 | 0.10822 | 0.53 | 0.603 |
| GSE54129 | China | 2017 | GPL570 | 111 | 6.9017 | 0.51905 | 21 | 6.9055 | 0.26462 | 0.05 | 0.96 |
| GSE26942 | USA | 2016 | GPL6947 | 205 | 8.9493 | 0.71607 | 12 | 9.0224 | 0.37734 | 0.61 | 0.551 |
| GSE84787 | China | 2016 | GPL17077 | 10 | 9.758 | 3.58558 | 10 | 9.7934 | 2.84105 | 0.024 | 0.981 |
| GSE64951 | USA | 2015 | GPL570 | 63 | 7.6095 | 1.74653 | 31 | 7.1908 | 2.02533 | -1.036 | 0.303 |
| GSE63089 | China | 2014 | GPL5175 | 45 | 7.1186 | 0.52955 | 45 | 7.0702 | 0.53337 | -0.432 | 0.667 |
| GSE56807 | China | 2014 | GPL5175 | 5 | 7.0561 | 0.24711 | 5 | 6.9774 | 0.32808 | -0.428 | 0.68 |
| GSE29272 | USA | 2013 | GPL96 | 134 | 7.0223 | 0.52461 | 134 | 6.3874 | 0.29172 | 12.244 | <0.001 |
| GSE38940 | Argentina | 2012 | GPL5936 | 34 | 0.0224 | 0.31734 | 31 | 0.0745 | 0.47533 | 0.515 | 0.609 |
| GSE33429 | China | 2012 | GPL5175,
GPL9128 | | | | | | | | |
| | | | 25 | 4.9522 | 0.14036 | 25 | 5.0153 | 0.11872 | 1.715 | 0.093 |
| GSE20143 | India | 2010 | GPL9365 | 5 | -1.0585 | 0.60379 | 2 | -0.8016 | 0.23093 | 0.559 | 0.601 |
| GSE13911 | Italy | 2008 | GPL80 | 38 | 9.3052 | 1.38313 | 31 | 7.1942 | 1.57059 | -5.857 | <0.001 |
| GSE2685 | Japan | 2005 | GPL571 | 22 | 7.0903 | 0.17473 | 8 | 7.0079 | 0.27967 | -0.968 | 0.341 |
| GSE109476 | China | 2018 | GPL24530 | 5 | 11.5194 | 0.3444 | 5 | 11.1203 | 0.52596 | -1.42 | 0.194 |
| GSE112369 | Japan | 2018 | GPL15207 | 37 | 9.0061 | 0.4449 | 25 | 8.6954 | 0.40925 | -2.784 | 0.007 |
| GSE26899 | USA | 2016 | GPL6947 | 96 | 9.4018 | 0.6073 | 12 | 9.0224 | 0.37734 | 3.0272 | 0.007 |
| GSE79973 | China | 2016 | GPL570 | 8 | 9.3585 | 0.3251 | 9 | 8.5798 | 0.60777 | 3.229 | 0.0056 |
| TCGA | - | - | - | 373 | 17.3966 | 0.78827 | 32 | 16.8133 | 0.34279 | -7.984 | <0.001 |
| IHC | - | - | - | 179 | 10.1899 | 1.93074 | 147 | 3.2381 | 2.77793 | 26.57 | <0.001 |
In-house IHC
The tissue array that included 179 cases of GC
tissues and 147 normal tissues was purchased from Pantomics, Inc.
and some clinical information for each sample, such as age, sex,
tumor pathological grade and clinical stage, were also provided. In
the IHC analysis, SAC3D1 was detected with anti-SAC3D1 antibody (at
a 1/500 dilution; cat. no. ab122809, Abcam's RabMAb technology).
The SAC3D1 expression intensity for each sample was evaluated based
on the score, and the score was generated from the product of the
proportion of stained cells among all cells (0, <5%; 1, 5-25%;
2, 25-50%; 3, 50-75%; 4, >75%) and the staining degree of the
positive cells (0, no staining; 1, light yellow or yellow; 2,
brown; 3, dark brown) (18).
Images were captured using an optical microscope (Motic China Group
Co., Ltd.). Moreover, to improve the accuracy of results, Image-Pro
Plus version 6.0 software (Media Cybernetics, Inc.) was also used
to evaluate the area and density of the dyed region and the
integrated optical density (IOD) value of the IHC section. The mean
densitometry of the digital image (magnification, ×400) was
regarded as representative SAC3D1 staining intensity (indicating
the relative SAC3D1 expression level). The IOD values of the tissue
areas from 179 cases of gastric cancer tissues and 147 normal
tissues randomly selected fields were calculated counted in a
blinded manner and subjected to statistical analysis.
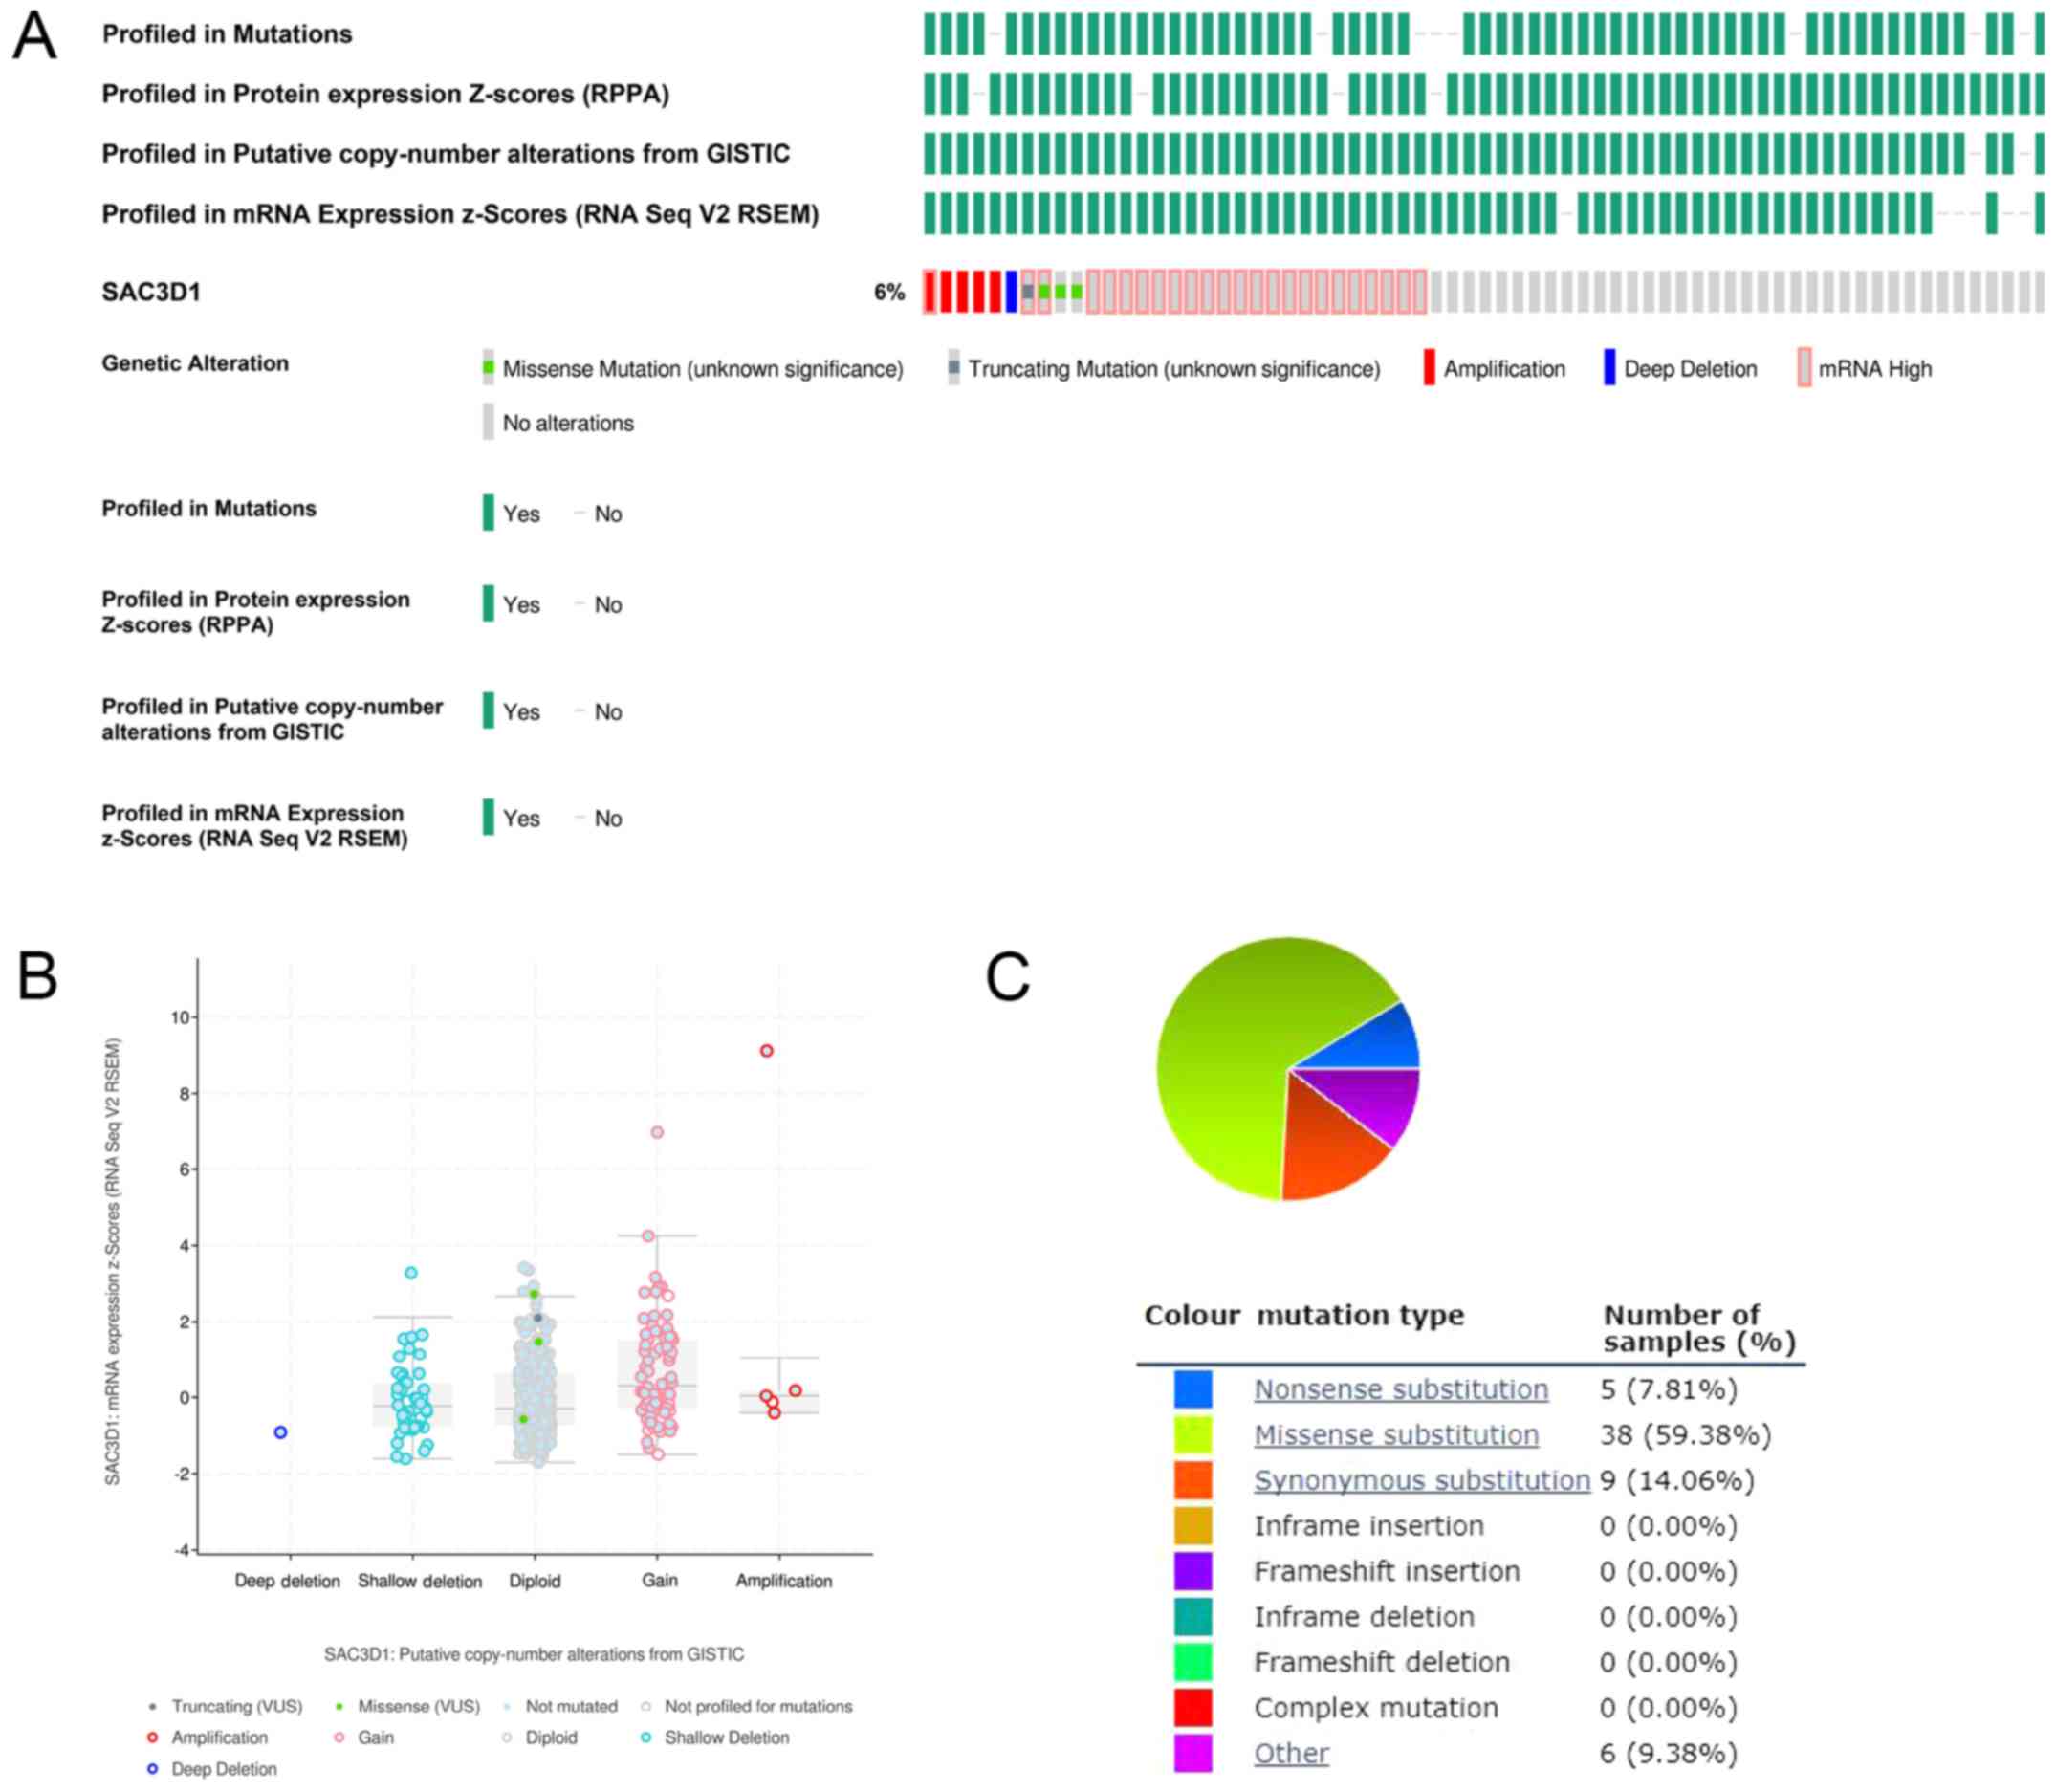
Mutations of the SAC3D1 in GC
Genetic alterations of SAC3D1 in GC were
investigated based on high throughput data in cBio-Portal for
Cancer Genomics (cBioportal) (http://cBioportal.org) and Catalogue Of Somatic
Mutations In Cancer (COSMIC) (https://cancer.sanger.ac.uk/cosmic), including
missense mutation, truncating mutation, deep deletion, and
amplification.
Acquisition of co-expressed genes of
SAC3D1 in GC
The co-expressed genes of SAC3D1 were obtained from
the Multi Experiment Matrix (https://biit.cs.ut.ee/mem/index.cgi) (19) and COXPRESdb (http://coxpresdb.jp) (20). In the Multi Experiment Matrix,
P<0.05 was regarded as statistically significant. In COXPRESdb,
2000 was set as the upper limit. In addition, GC-related
differentially expressed genes were calculated with the edgeR
package based on TCGA and GTEx data, and a log (fold change) equal
to 1 and P<0.05 was defined as including condition. The
overlapped genes of three parts were considered co-expressed genes
of SAC3D1 in GC.
Enrichment and protein-protein
interaction (PPI) analysis
The genes co-expressed with SAC3D1 were submitted to
DAVID (https://david.ncifcrf.gov/) (21) for an enrichment analysis, including
gene ontology (GO) analysis and Kyoto Encyclopedia of Genes and
Genomes (KEGG) pathway analysis. STRING (https://string-db.org/) (22) was utilized to construct a PPI
network, and based on the degree of nodes, hub co-expressed genes
of SAC3D1 were identified.
Validation of hub co-expressed genes
The expression of hub co-expressed genes was further
validated at the mRNA level based on the microarray and RNA-seq
data via a meta-analysis and the protein expression levels of hub
co-expressed genes were verified in Human Protein Atlas (HPA)
(https://www.proteinatlas.org/) (23). The sensitivity and specificity of
hub co-expressed genes on differentiating GC tissues and normal
tissues were also calculated. Besides, genetic alterations of the
hub co-expressed genes in GC were also investigated in cBioportal.
A prognosis related meta-analysis was also conducted to assess the
prognosis value of hub co-expressed gene, respectively. Moreover,
the expression relationship between SAC3D1 and hub co-expressed
genes was presented by correlation analysis.
Statistical analysis
Independent and paired sample t-tests were performed
in SPSS 19.0 to calculate and evaluate the expression level of
SAC3D1 in GC tissues and normal tissues based on the GC microarray
data, RNA seq data and IHC data. Stata 12.0 was used to perform a
continuous variable meta-analysis and calculate the value of SMD.
One-way analysis of variance was used in the present study to
compare the differences in the mean of three or more sets of data.
Bonferroni and Tamhane's T2 were used as post hoc tests for equal
variance assumed and equal variance not assumed, respectively. In
addition, the sensitivity and specificity of SAC3D1 on
differentiating GC tissues and normal tissues were evaluated by
drawing ROC curves in GraphPad Prism5 based on microarray data, RNA
seq data, and IHC data. Stata 12.0 was also used to integrate the
results of each ROC with a summary ROC. Finally, a Spearman's
correlation analysis was used to examine the relationship between
the expression of SAC3D1 and core co-expressed genes.
Results
Expression and clinical value of SAC3D1
in GC based on chips and RNA-seq data
First, a total of 18 eligible GEO chips and a
section of TCGA sequencing data were collected, including 1,241
gastric cancer samples and 452 normal samples, from which the
expression data of SAC3D1 was extracted. The expression of SAC3D1
in each chip or section of TCGA sequencing data was clarified
through independent or paired sample t-tests. For the GEO chips, 5
chips (GSE103236, GSE29272, GSE13911, GSE112369 and GSE26899)
exhibited a significantly upregulated trend of SAC3D1 in GC. For
the TCGA sequencing data, SAC3D1 was found to be upregulated in 373
gastric cancer tissues (17.3966±0.78827) compared to 32 normal
tissues (16.8133±0.34279, P<0.001) (Table I and Fig. 2). To further improve the accuracy
of the results, the results of t-tests based on 18 eligible GEO
chips and a section of TCGA sequencing data were integrated by a
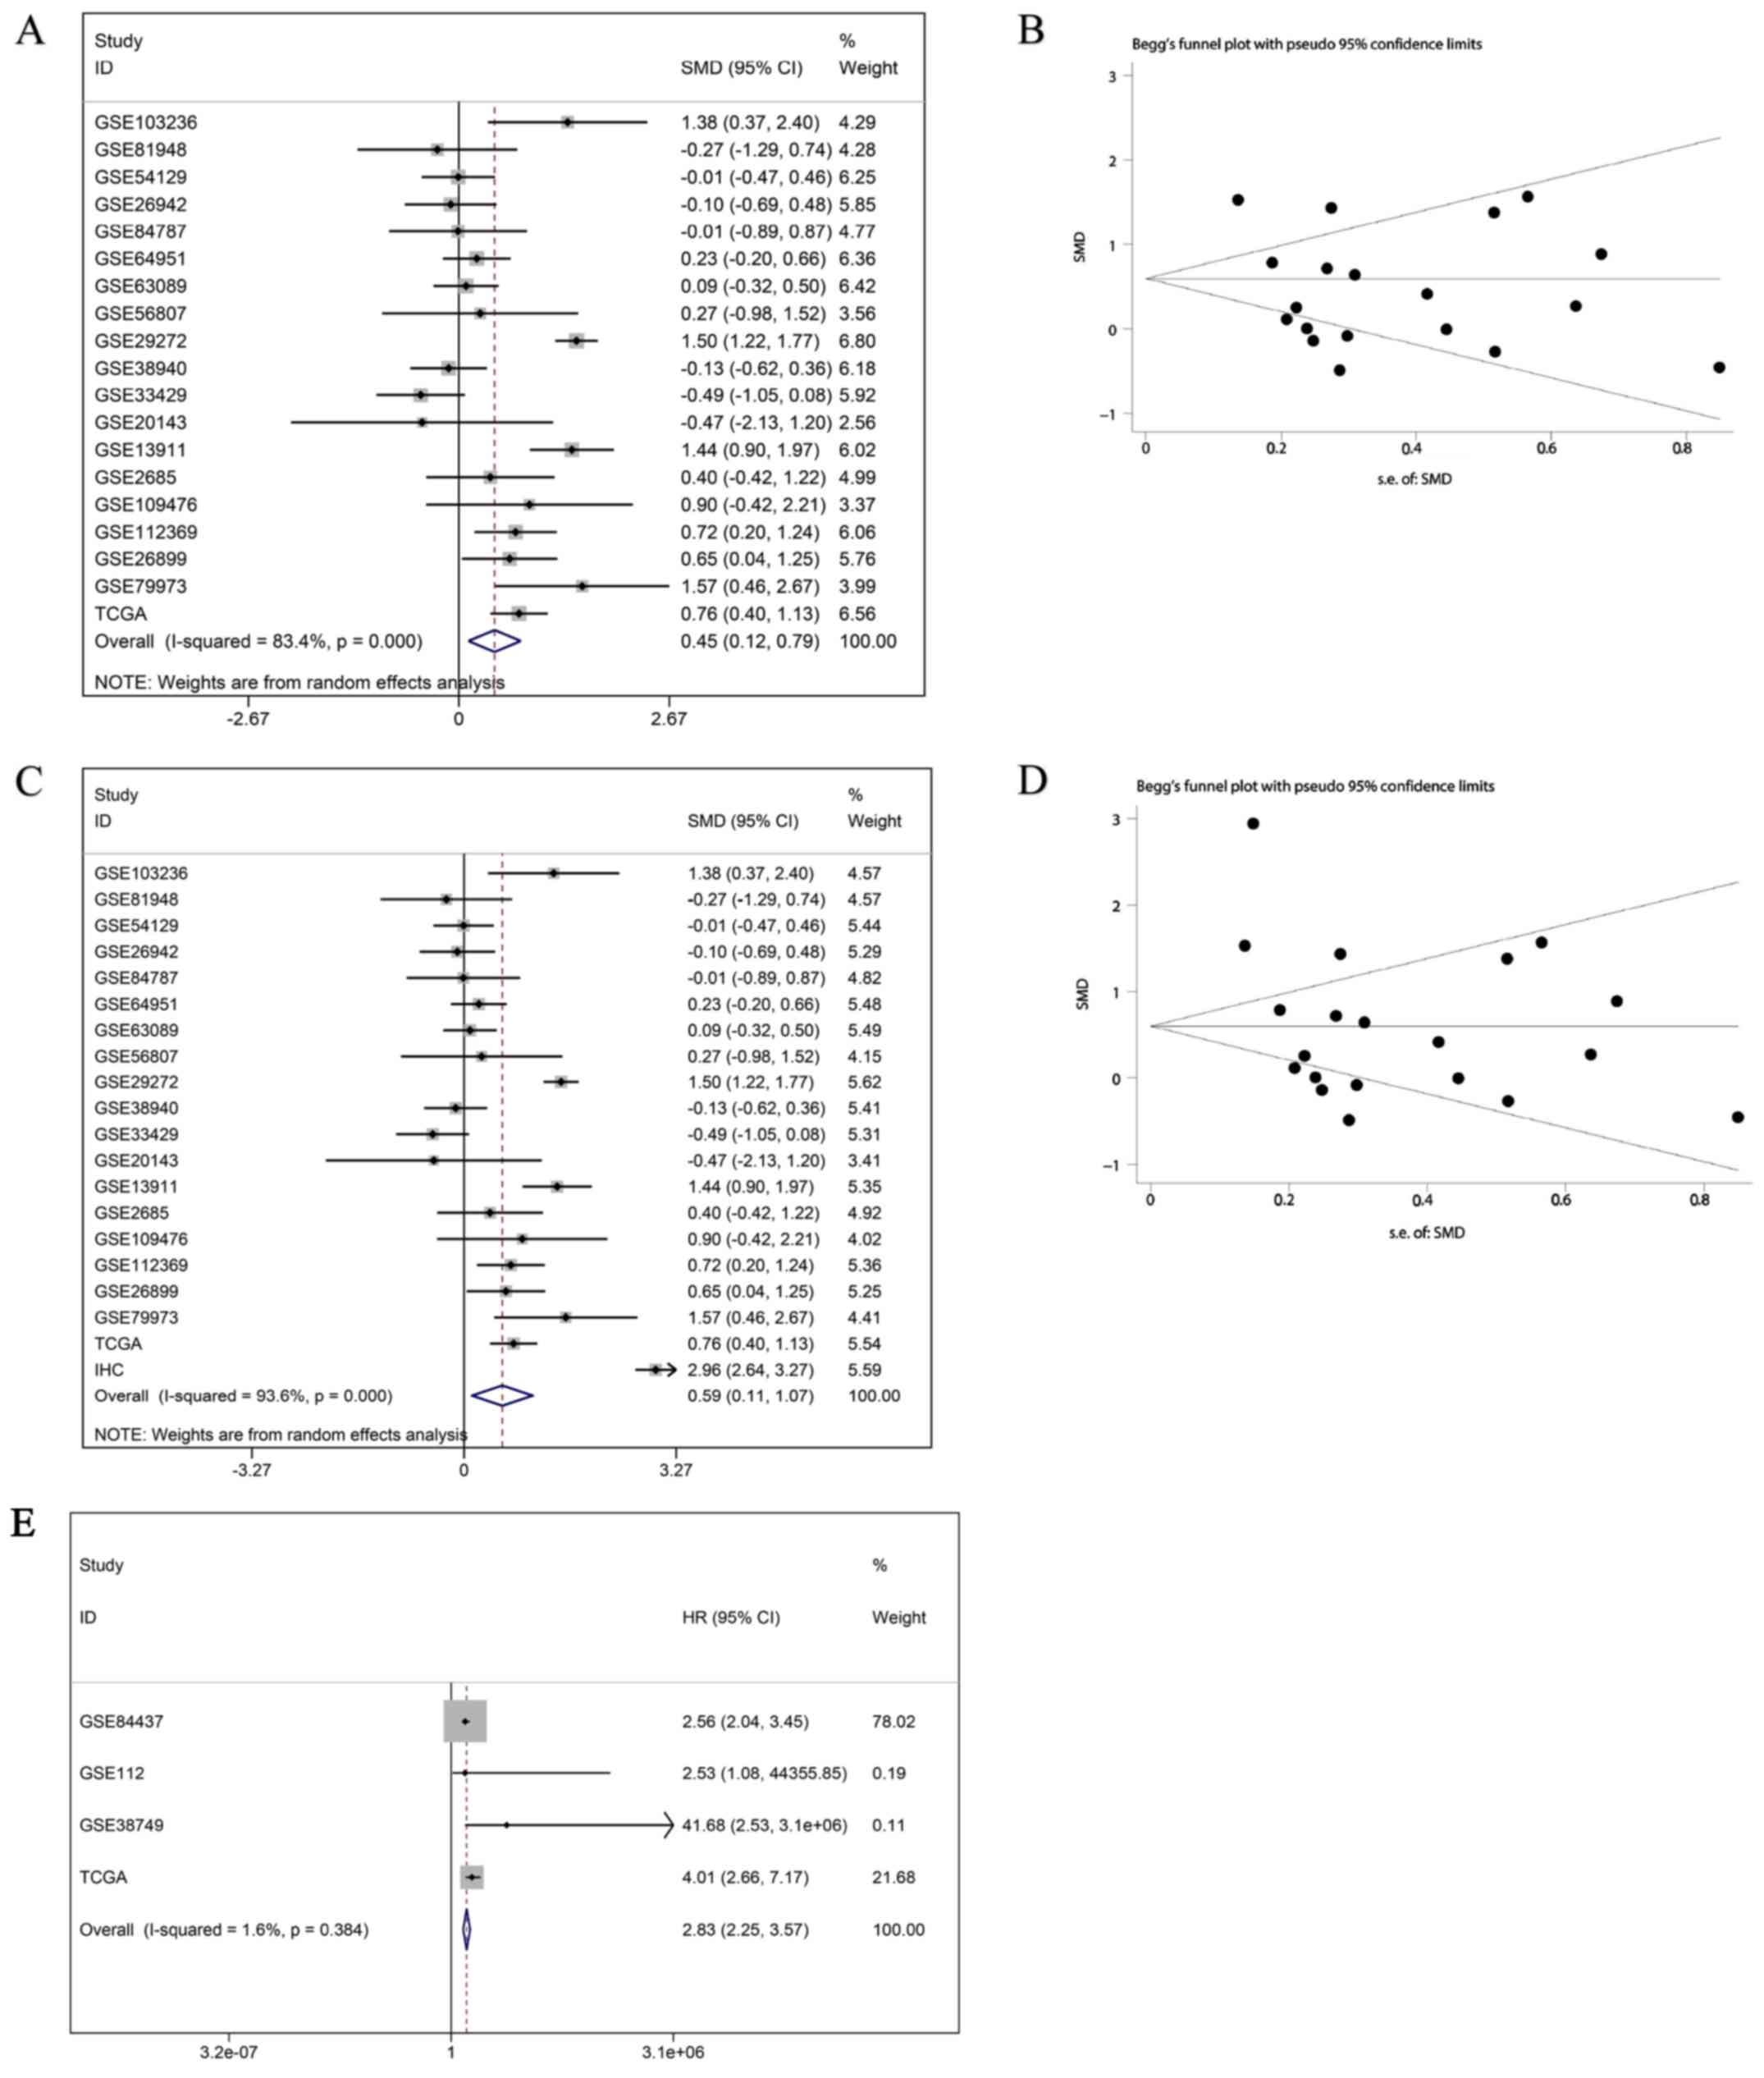
continuous variable meta-analysis. The results indicated that
SAC3D1 was clearly upregulated in GC tissues with the SMD of the
random effect model being 0.45 (0.12, 0.79), and the funnel plot
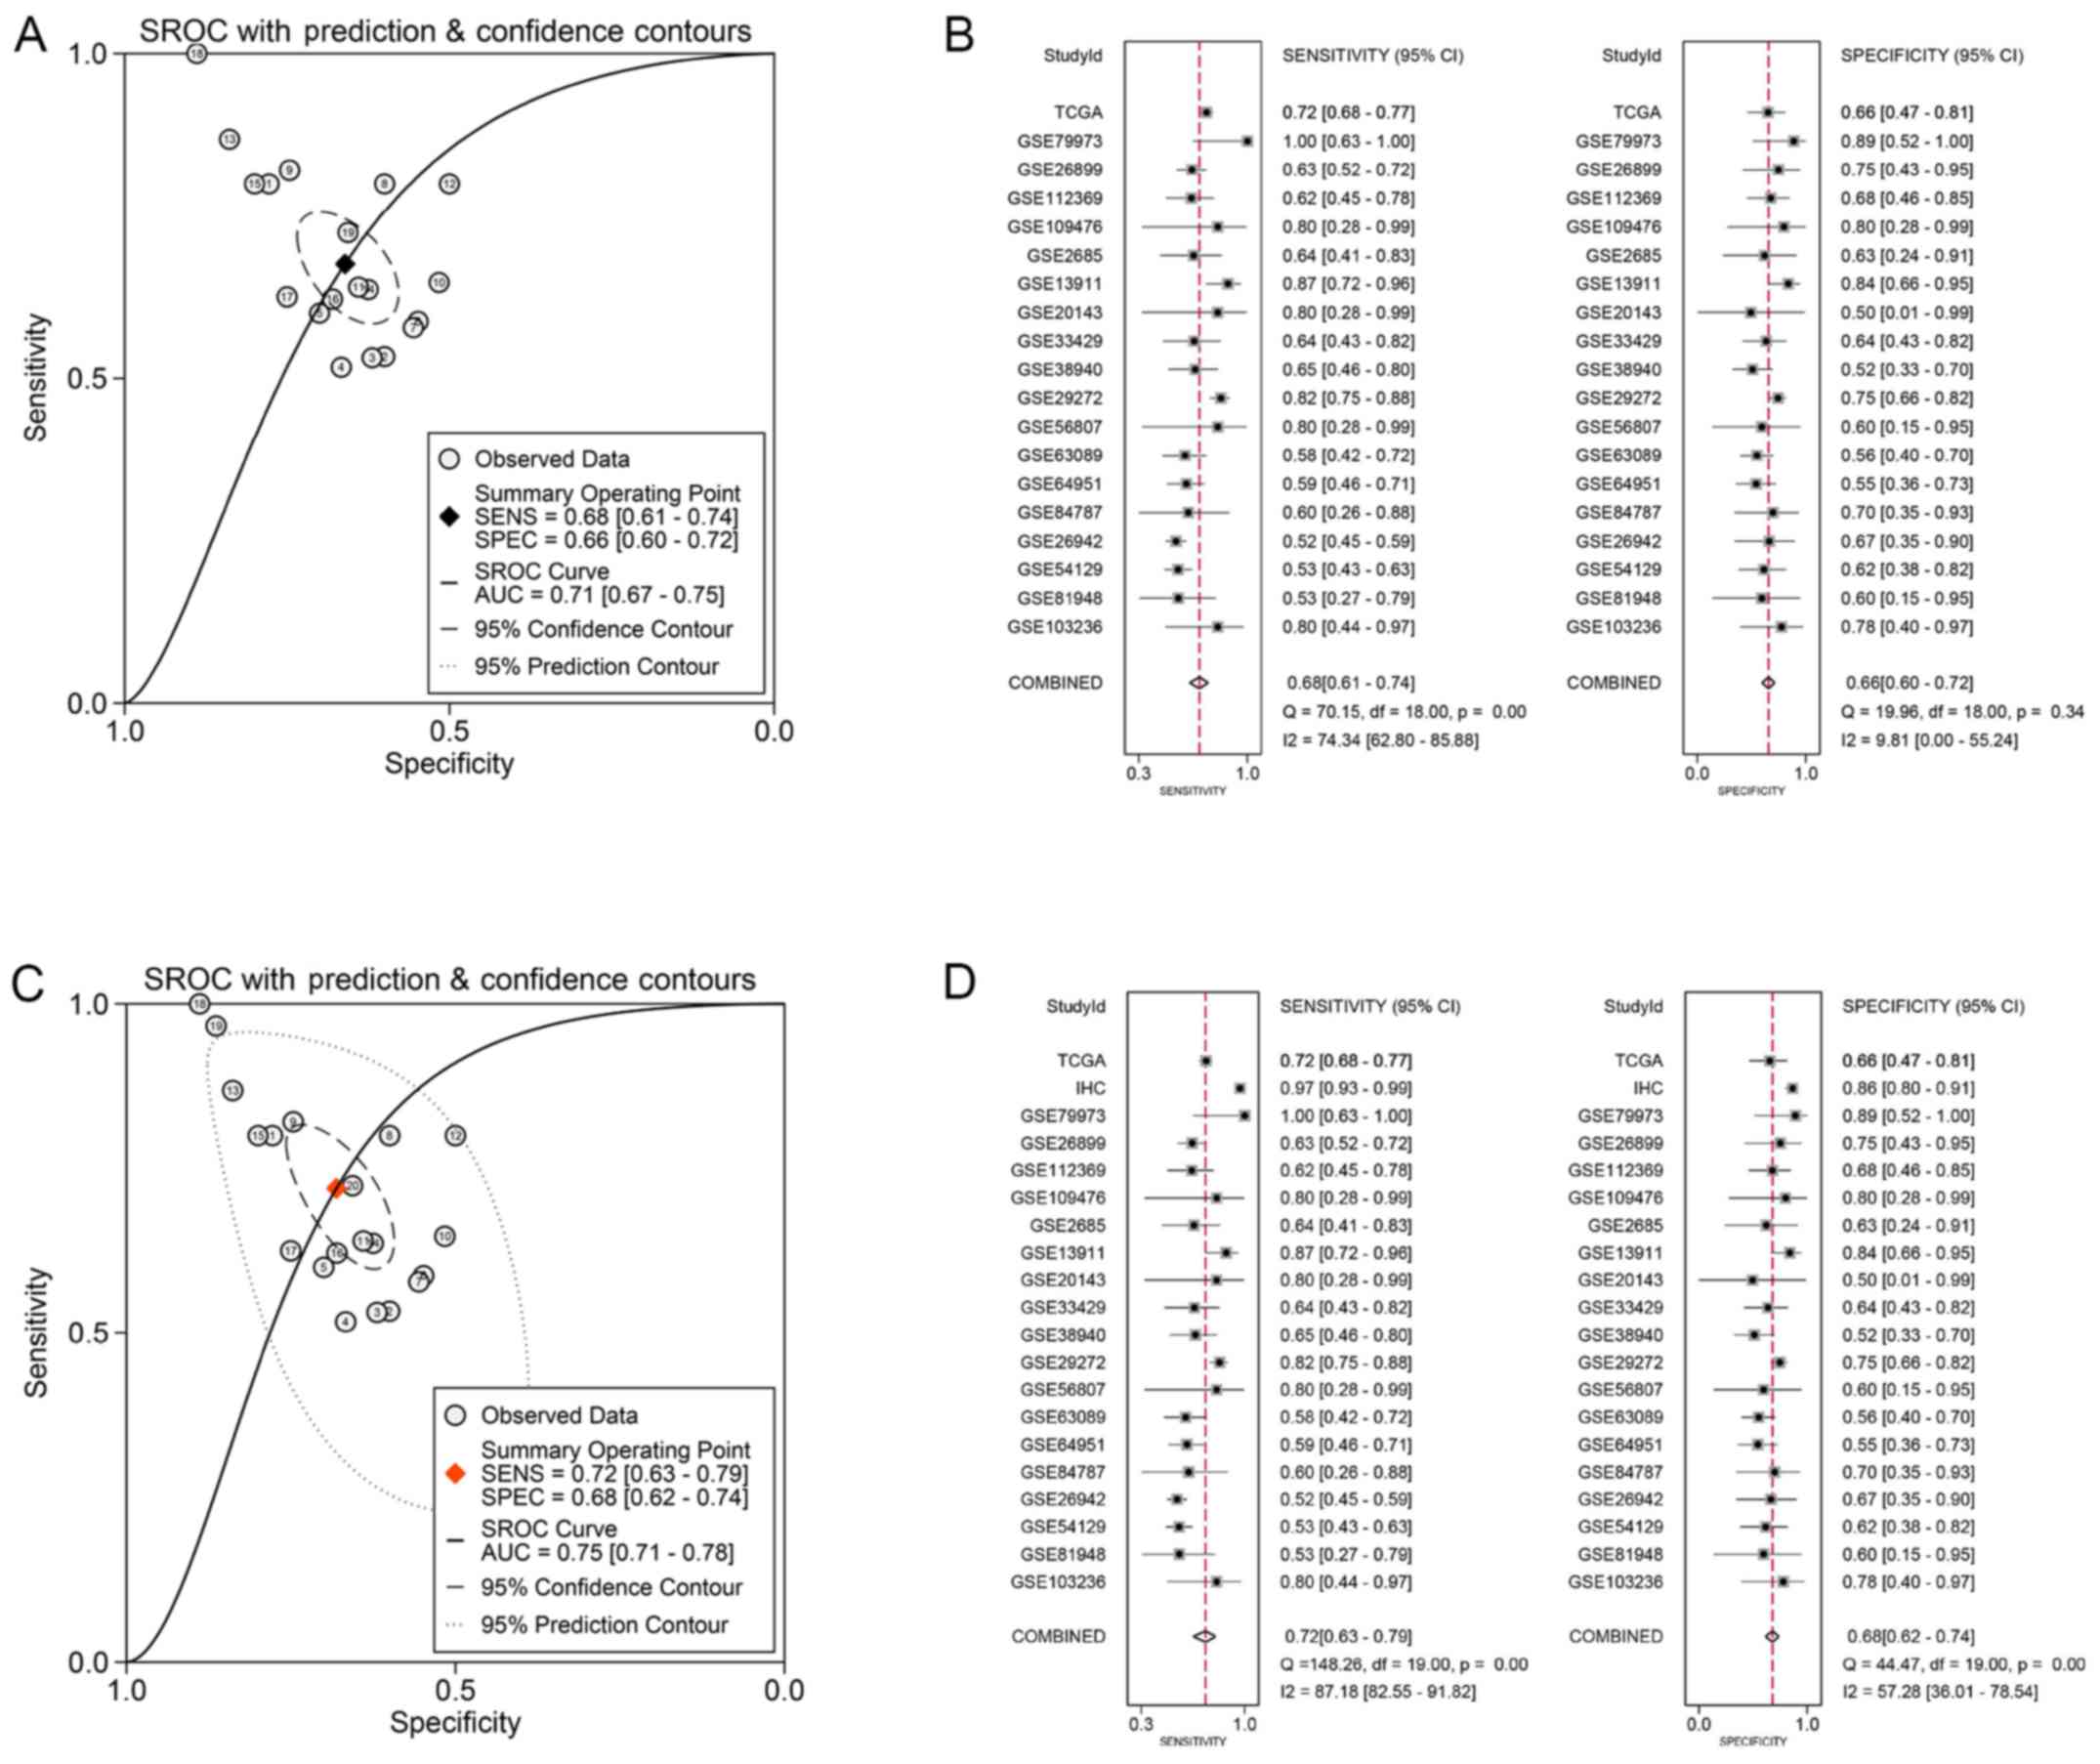
indicated that there was no publication bias (Fig. 3A and B). The ROC of all chips and
RNA-seq data was calculated (Table
II and Fig. 4), and the AUC of
sROC was 0.71 (0.67, 0.75), with pooled sensitivity and specificity
being 0.68 (0.61, 0.74) and 0.66 (0.60, 0.72) (Fig. 5A and B). The prognosis-related
meta-analysis indicated that the overexpression of SAC3D1 was
closely associated with the poor prognosis of patients with GC [HR,
2.83 (2.25, 3.57); P<0.001] (Fig.
3E).
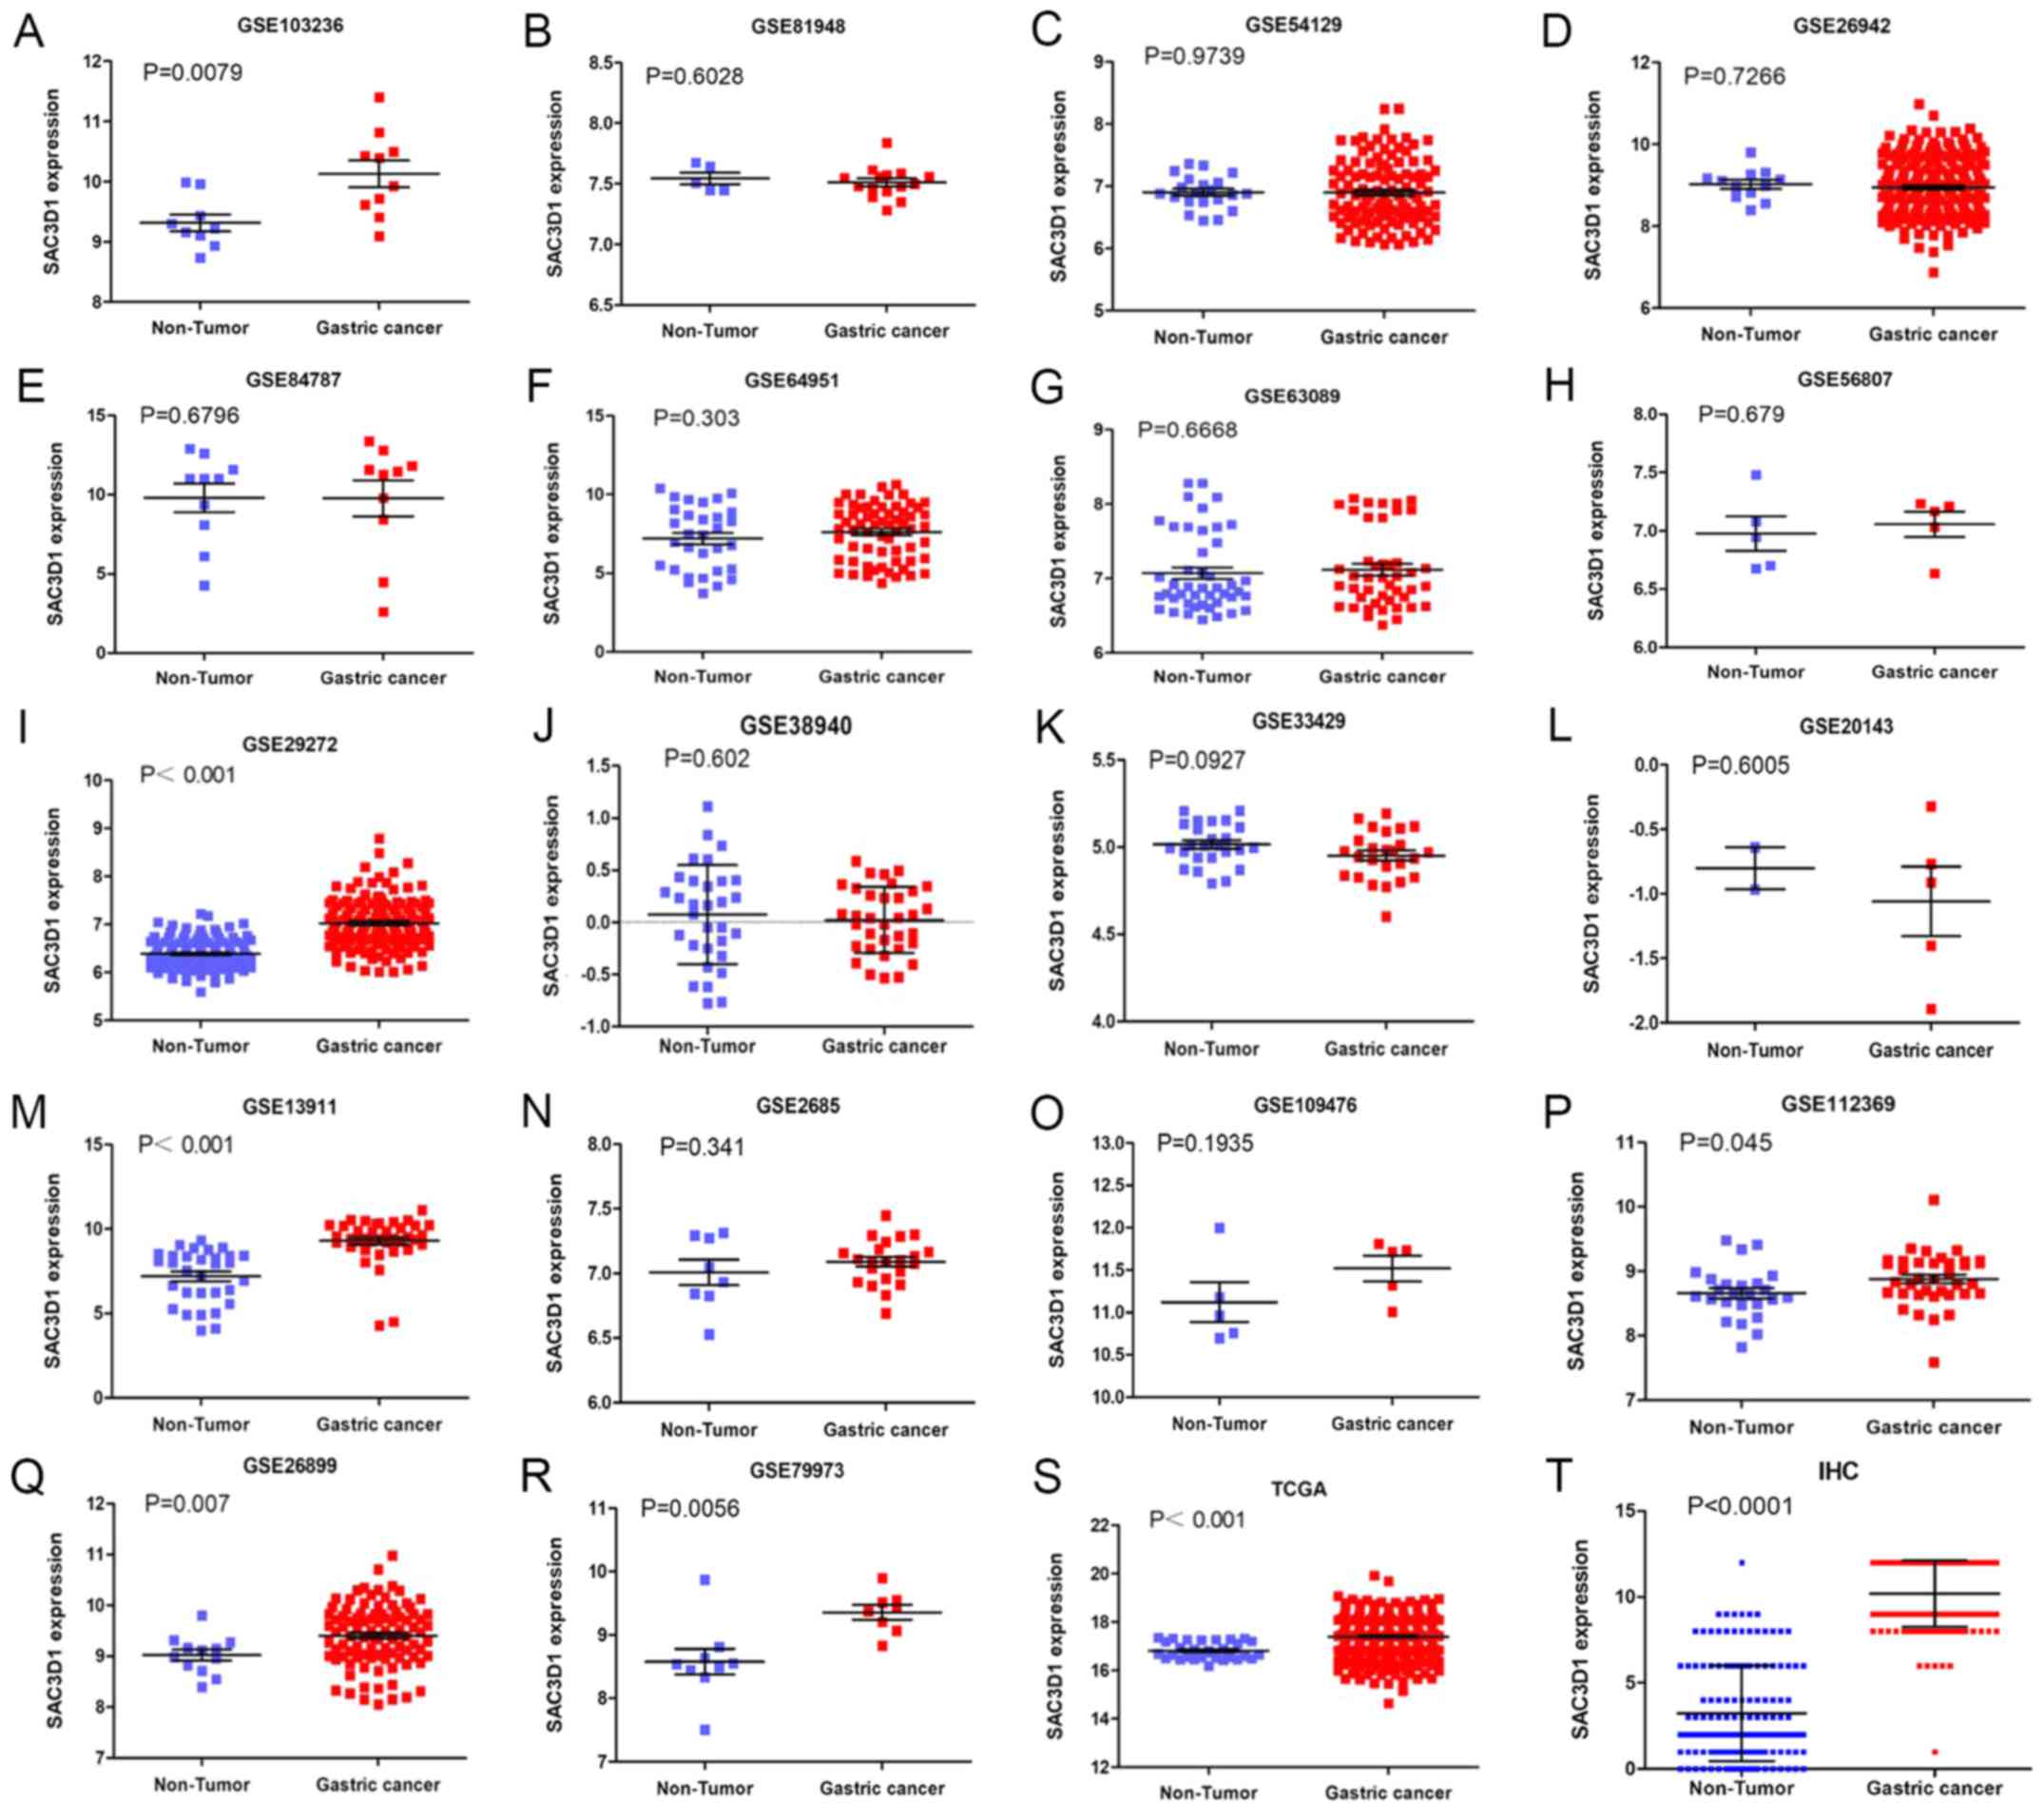 | Figure 2Scatterplots of SAC3D1 based on IHC
data, GEO datasets and TCGA sequencing data. (A) GSE103236, (B)
GSE81948, (C) GSE54129, (D) GSE26942, (E) GSE84787, (F) GSE64951,
(G) GSE63089, (H) GSE56807, (I) GSE29272, (J) GSE38940, (K)
GSE33429, (L) GSE20143, (M) GSE13911, (N) GSE2685, (O) GSE109476,
(P) GSE112369, (Q) GSE26899, (R) GSE79973, (S) TCGA, (T) IHC.
SAC3D1, SAC3 domain containing 1. |
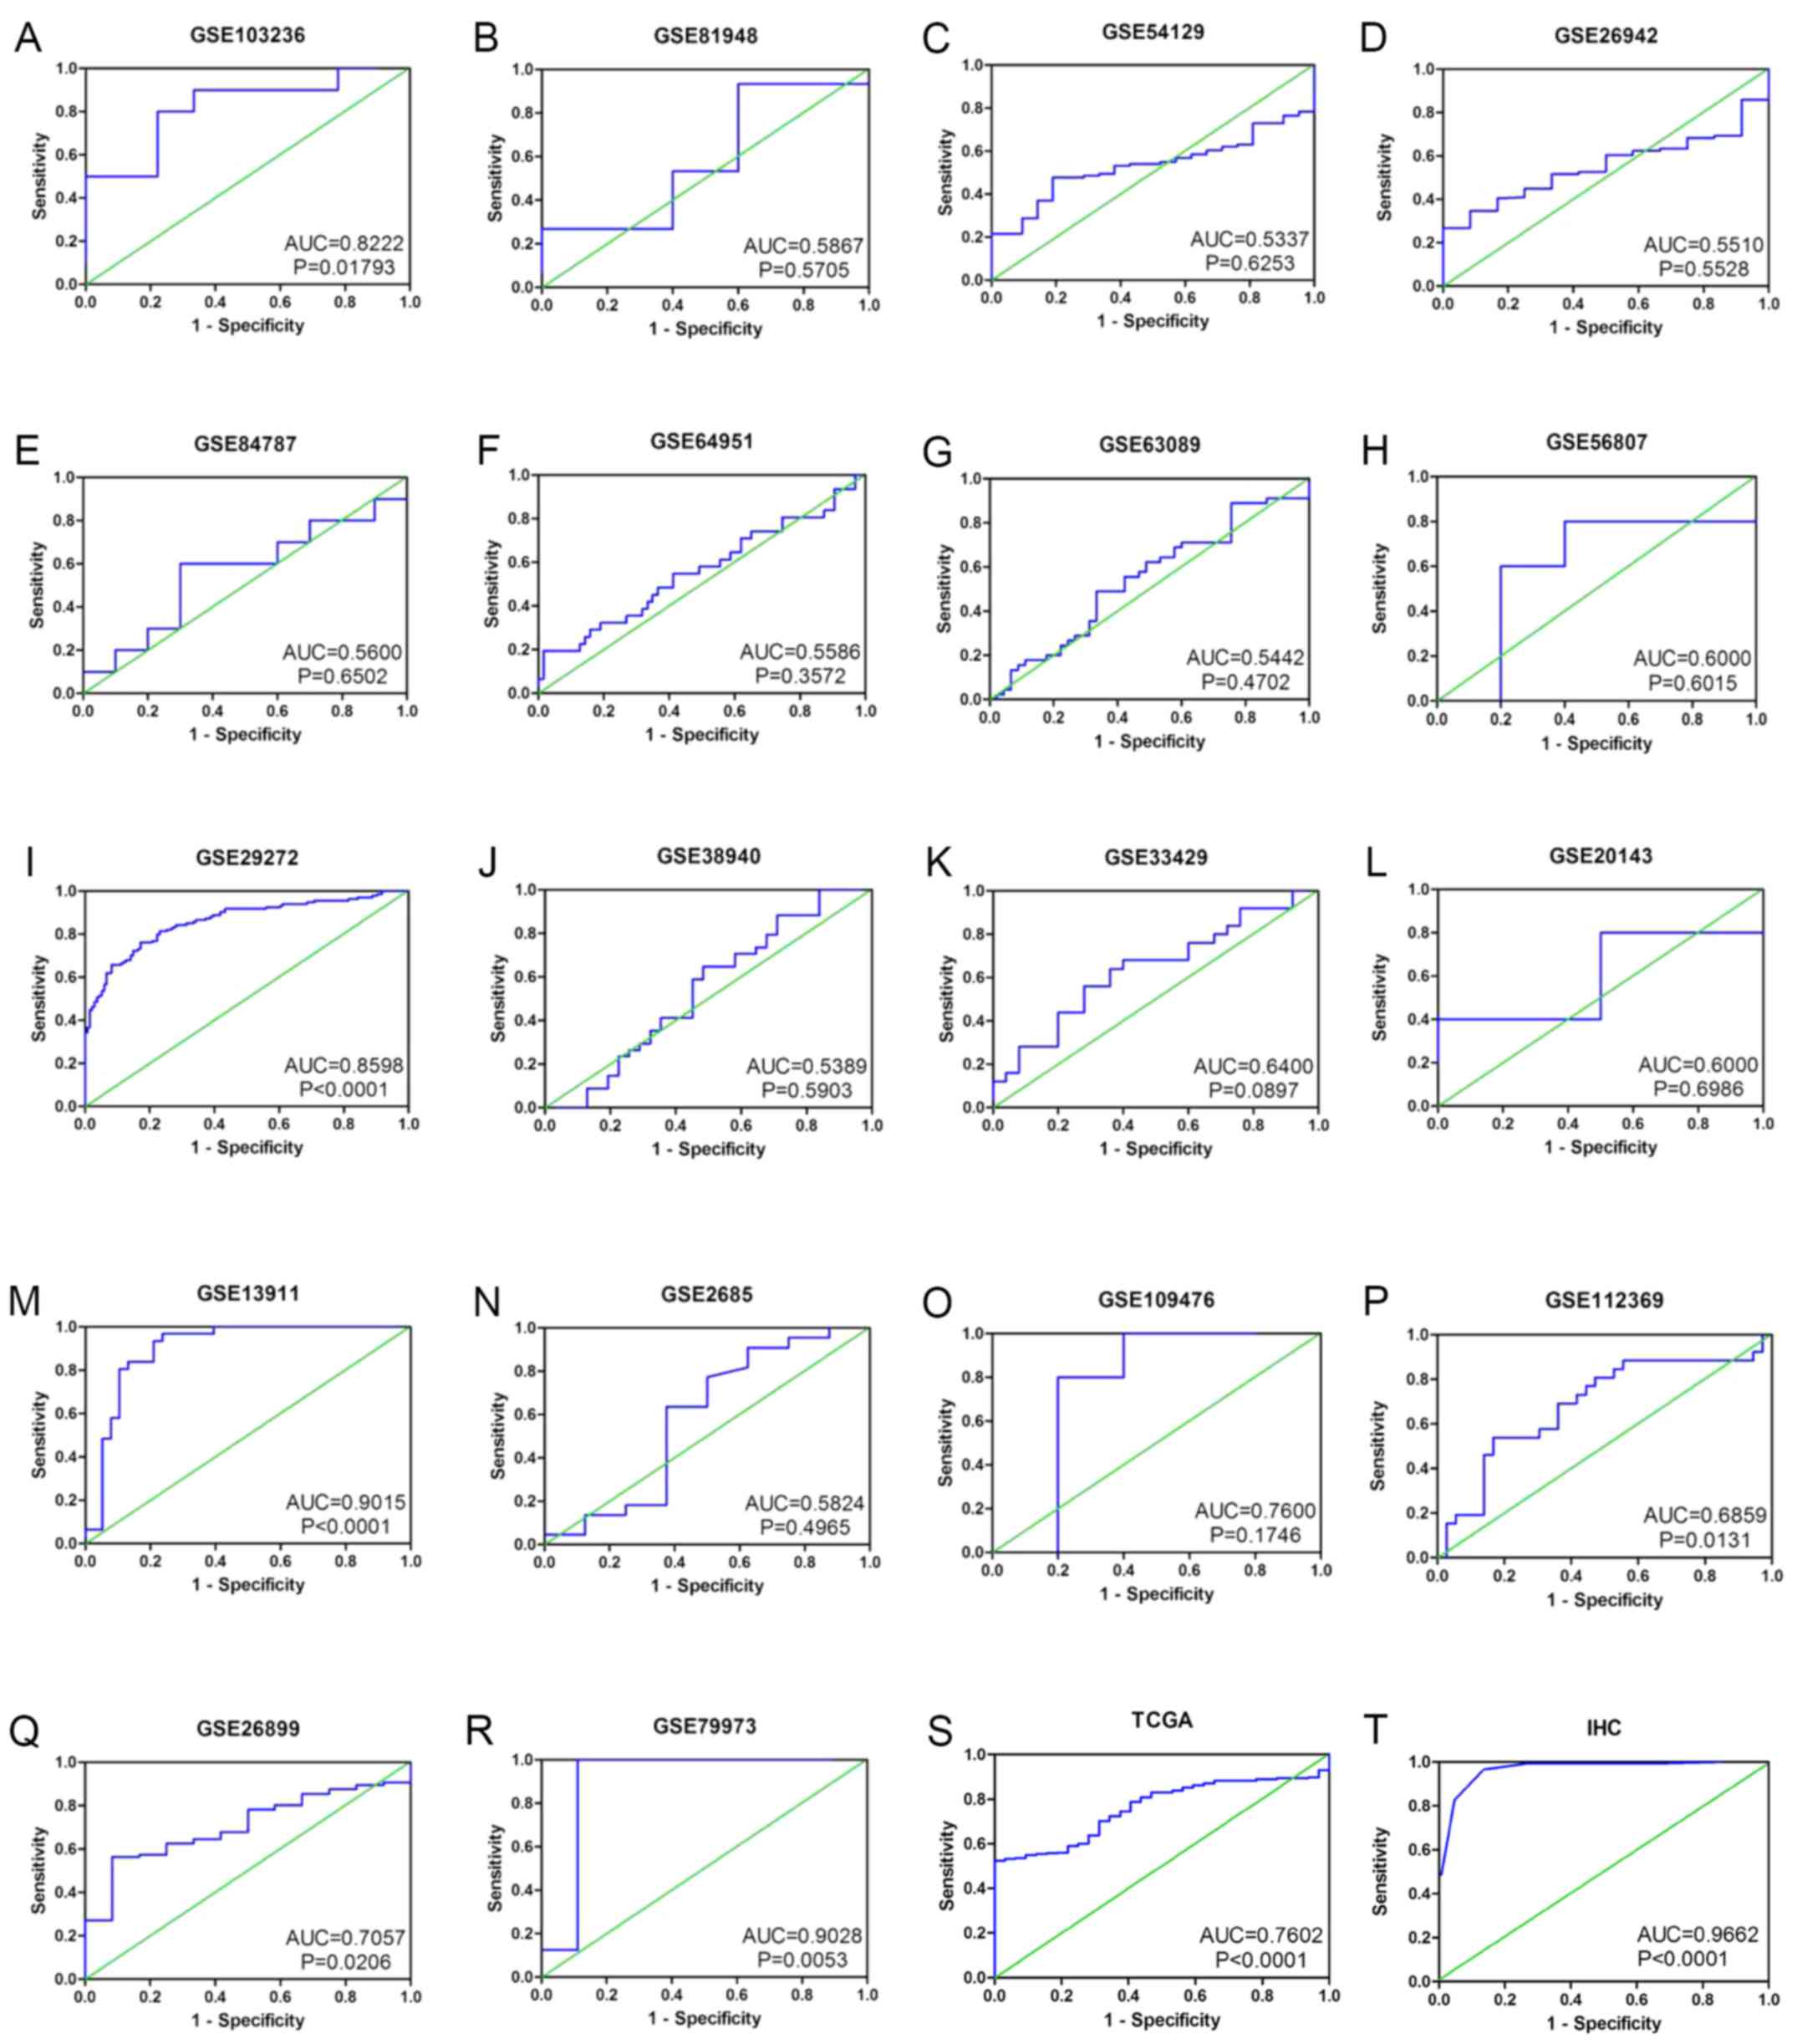 | Figure 4ROC curves of SAC3D1 based on GEO
datasets, TCGA RNA seq data, and IHC data. (A) GSE103236, (B)
GSE81948, (C) GSE54129, (D) GSE26942, (E) GSE84787, (F) GSE64951,
(G) GSE63089, (H) GSE56807, (I) GSE29272, (J) GSE38940, (K)
GSE33429, (L) GSE20143, (M) GSE13911, (N) GSE2685, (O) GSE109476,
(P) GSE112369, (Q) GSE26899, (R) GSE79973, (S) TCGA, (T) IHC.
SAC3D1, SAC3 domain containing 1. |
| Table IIPotential of SAC3D1 to serve as a
bio-marker on identifying gastric cancer tissues and normal
tissue. |
Table II
Potential of SAC3D1 to serve as a
bio-marker on identifying gastric cancer tissues and normal
tissue.
| Datasets | Sensitivity | Specificity | TP | FP | FN | TN |
|---|
| GSE103236 | 80.00% | 77.80% | 8 | 2 | 2 | 7 |
| GSE81948 | 53.33% | 60.00% | 8 | 2 | 7 | 3 |
| GSE54129 | 53.15% | 61.90% | 59 | 8 | 52 | 13 |
| GSE26942 | 51.71% | 66.67% | 106 | 4 | 99 | 8 |
| GSE84787 | 60.00% | 70.00% | 6 | 3 | 4 | 7 |
| GSE64951 | 58.73% | 54.84% | 37 | 14 | 26 | 17 |
| GSE63089 | 57.78% | 55.56% | 26 | 20 | 19 | 25 |
| GSE56807 | 80.00% | 60.00% | 4 | 2 | 1 | 3 |
| GSE29272 | 82.09% | 74.63% | 110 | 34 | 24 | 100 |
| GSE38940 | 64.71% | 51.61% | 22 | 15 | 12 | 16 |
| GSE33429 | 64.00% | 64.00% | 16 | 9 | 9 | 16 |
| GSE20143 | 80.00% | 50.00% | 4 | 1 | 1 | 1 |
| GSE13911 | 86.84% | 83.87% | 33 | 5 | 5 | 26 |
| GSE2685 | 63.64% | 62.50% | 14 | 3 | 8 | 5 |
| GSE109476 | 80.00% | 80.00% | 4 | 1 | 1 | 4 |
| GSE112369 | 62.16% | 68.00% | 23 | 8 | 14 | 17 |
| GSE26899 | 62.50% | 75.00% | 60 | 3 | 36 | 9 |
| GSE79973 | 100.00% | 88.89% | 8 | 1 | 0 | 8 |
| TCGA | 72.39% | 65.63% | 270 | 11 | 103 | 21 |
| IHC | 96.65% | 86.39% | 173 | 20 | 6 | 127 |
Expression and clinical value of SAC3D1
in GC based on chips, RNA seq data and IHC data
The protein expression of SAC3D1 was clearly high
expressed in 179 GC tissues compared with 147 paracancerous tissues
(Fig. 2T). The results of t-tests
based on IHC data, 18 eligible GEO chips and a section of TCGA
RNA-seq data were also merged by a meta-analysis. An upregulation
of SAC3D1 was finally determined with the SMD of the random effect
model being 0.59 (0.11, 1.07), and a corresponding funnel plot
indicated that there was no publication bias (Fig. 3C and D). After constructing the
sROC curve based on the IHC data, 18 eligible GEO chips and a
section of TCGA RNA-seq data, it was found that SAC3D1 has a
certain potential to be identified as a molecular indicator to
identify GC tissues and normal tissues, and the sensitivity and
specificity was 0.72 (0.63, 0.79) and 0.68 (0.62, 0.74),
respectively (Fig. 5C and D).
Moreover, it was found that the positive ratio of SAC3D1 staining
was comparable with the original methods using Image-Pro Plus
version 6.0 software (Fig. S1 and
Table SI).
Association of SAC3D1 expression with
clinical parameters
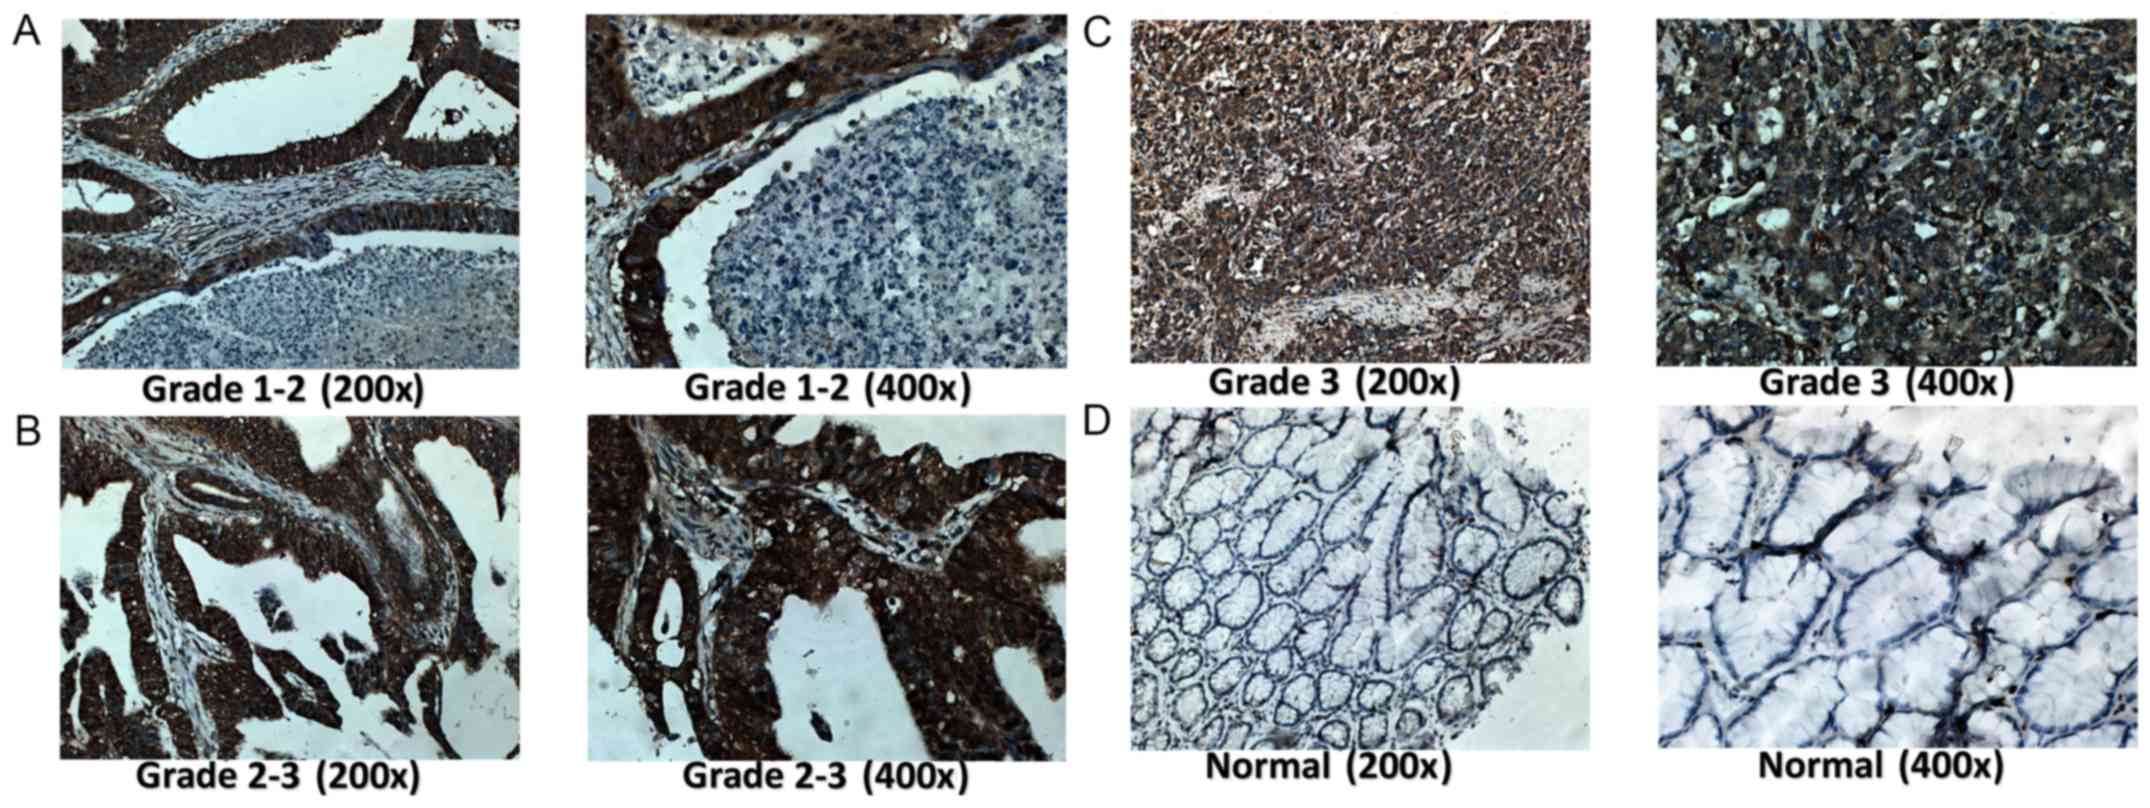
According to the IHC data, the upregulation of
SAC3D1 was statistically associated with the histological grade,
clinical stage, T stage and N stage of GC. In a more advanced stage
of the disease, or histological grade, the protein expression
intensity of SAC3D1 was stronger than that in low-stage or grade.
Thus, it was speculated that SAC3D1 may be involved in the
development and progression of GC (Fig. 6 and Table III). In addition, the association
between SAC3D1 and some clinical parameters was also calculated
using the TCGA data, and the results indicated that the expression
of SAC3D1 was associated with the N stage (Table IV, F=7.596, P<0.001).
| Table IIIAssociation between SAC3D1 expression
and some clinical pathological parameters based on
immunohistochemistry data. |
Table III
Association between SAC3D1 expression
and some clinical pathological parameters based on
immunohistochemistry data.
| Clinicopathological
parameters | Group | SAC3D1 expression
| t-value | P-value |
|---|
| Cases | Mean ± SD |
|---|
| Tissue | GC tissue | 179 |
10.1899±1.93074 | | |
| Normal tissue | 147 | 3.2381±2.77793 | 26.57 | P<0.001 |
| Age (years) | ≤50 | 46 |
10.3043±2.22979 | | |
| >50 | 128 |
10.1484±1.83616 | 0.466 | 0.642 |
| Sex | Male | 128 | 10.125±1.99606 | | |
| Female | 46 | 10.3696±1.7933 | 0.731 | 0.466 |
| T | T1-T2 | 54 | 9.1111±1.9683 | | |
| T3-T4 | 120 | 10.675±1.73041 | -5.029 | P<0.001 |
| N | N0 | 65 | 9.1692±1.98879 | | |
| N1 | 87 |
10.7356±1.69445 | | |
| N2 | 22 |
11.0455±1.43019 | 17.277 | P<0.001 |
| Stage | IA-IB | 38 | 8.7105±1.99875 | | |
| IIA-IIB | 117 |
10.5043±1.75491 | | |
| IIIA | 19 |
11.2105±1.35724 | 18.192 | P<0.001 |
| Histological
grade | I | 28 | 8.5714±2.1846 | | |
| II | 56 | 10.25±1.77098 | | |
| III | 63 |
10.8125±1.62202 | F=15.261 | P<0.001 |
| Table IVAssociation between SAC3D1 expression
and some clinical pathological parameters based on TCGA data. |
Table IV
Association between SAC3D1 expression
and some clinical pathological parameters based on TCGA data.
| Clinicopathological
parameters | SAC3D1 expression
| t-value | P-value |
|---|
| n | Mean ± SD |
|---|
| Tissue | | | | |
| Non-tumor | 32 |
16.8133±0.34279 | | |
| GC | 373 |
17.3966±0.78827 | -7.984 | <0.001 |
| Sex | | | | |
| Male | 258 | 17.3224±0.7312 | | |
| Female | 143 |
17.4426±0.82768 | 1.504 | 0.133 |
| Age (years) | | | | |
| <60 | 124 |
17.3489±0.74119 | | |
| ≥60 | 273 |
17.3752±0.78175 | -0.316 | 0.752 |
| Grade | | | | |
| G1 | 11 | 17.094±1.12374 | | |
| G2 | 147 | 17.3488±0.7554 | | |
| G3 | 235 |
17.3891±0.76078 | | |
| Gx | 8 |
17.3374±0.72202 | F=0.557 | 0.644 |
| TNM | | | | |
| T1-T1b | 25 |
17.2418±0.75401 | | |
| T2-T2b | 88 |
17.3177±0.85172 | | |
| T3 | 179 | 17.452±0.72991 | | |
| T4-T4b | 105 |
17.3393±0.71874 | F=1.117 | 0.342 |
| N0 | 121 |
17.4878±0.77501 | | |
| N1 | 104 |
17.3645±0.74107 | | |
| N2 | 85 | 17.361±0.63662 | | |
| N3-N3b | 74 |
17.3808±0.79604 | | |
| Nx | 16 |
16.3963±0.82501 | F=7.596 | <0.001 |
| M0 | 352 | 17.393±0.73777 | | |
| M1 | 27 |
17.1293±1.08533 | | |
| Mx | 22 | 17.2109±0.7571 | F=1.957 | 0.143 |
| I-IB | 59 | 17.397±0.84514 | | |
| Stage | | | | |
| II-IIB | 124 |
17.4667±0.69269 | | |
| III-IIIC | 156 |
17.4222±0.64408 | | |
| IV | 42 |
17.2256±0.98701 | F=1.142 | 0.332 |
Genetic alterations of the SAC3D1 in
GC
From the online analysis of cBioPortal and COSMIC,
it was found that SAC3D1 has a mutation in GC, although the genetic
alteration rate was relatively low. Therefore, it was hypothesized
that the role of highly expressed SAC3D1 in the development of GC
may not be mutated, amplification-mediated (Fig. 7).
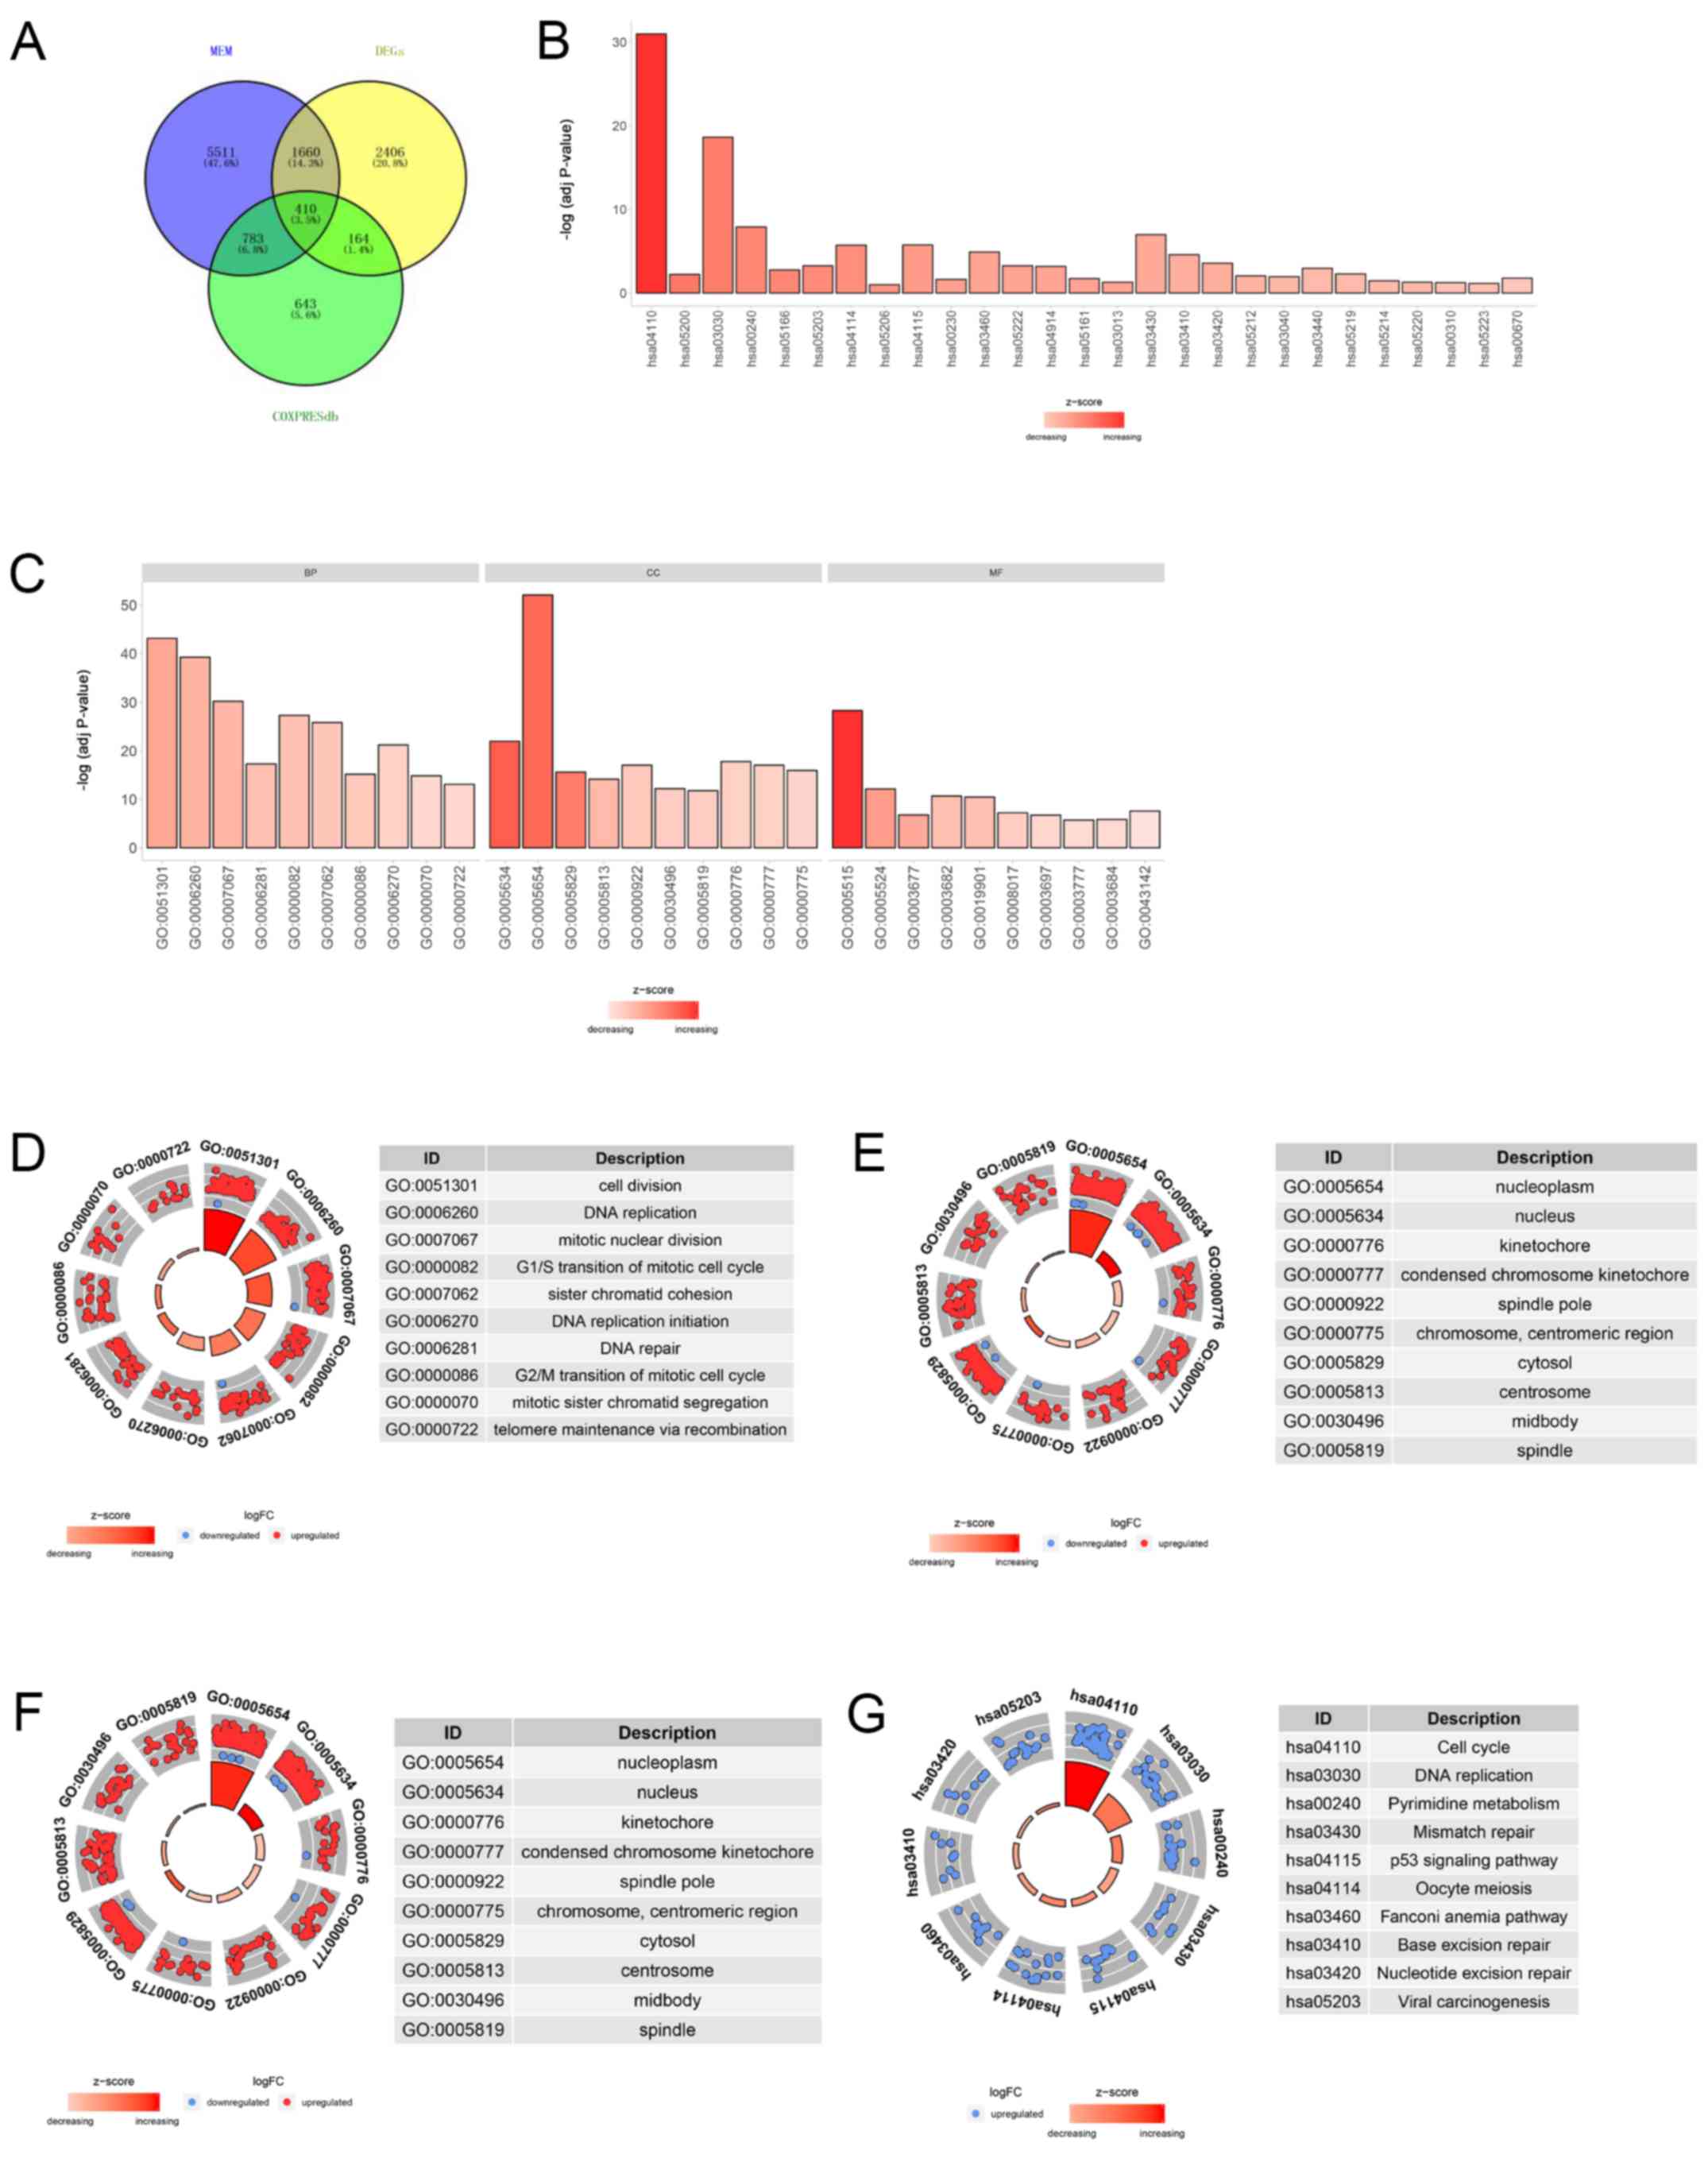
Enrichment and PPI analysis of
co-expressed gene of SAC3D1
A total of 8,364 and 2,000 co-expressed genes of
SAC3D1 were obtained in the Multi Experiment Matrix (https://biit.cs.ut.ee/mem/index.cgi) and
COXPRESdb, respectively. In addition, 4,640 GC-related
differentially expressed genes were acquired after TCGA and GTEx
data calculations. Finally, 410 overlapping genes of 3 parts were
considered co-expressed genes of SAC3D1 in GC (Fig. 8A). The GO-enriched analysis
indicated that SAC3D1 and co-expressed genes were mainly enriched
in mitotic sister chromatid segregation, nuclear chromosome and ATP
binding (Table V and Fig. 8C-F). In the KEGG pathway analysis,
the SAC3D1 and co-expressed genes were mainly enriched in DNA
replication and the cell cycle (Table
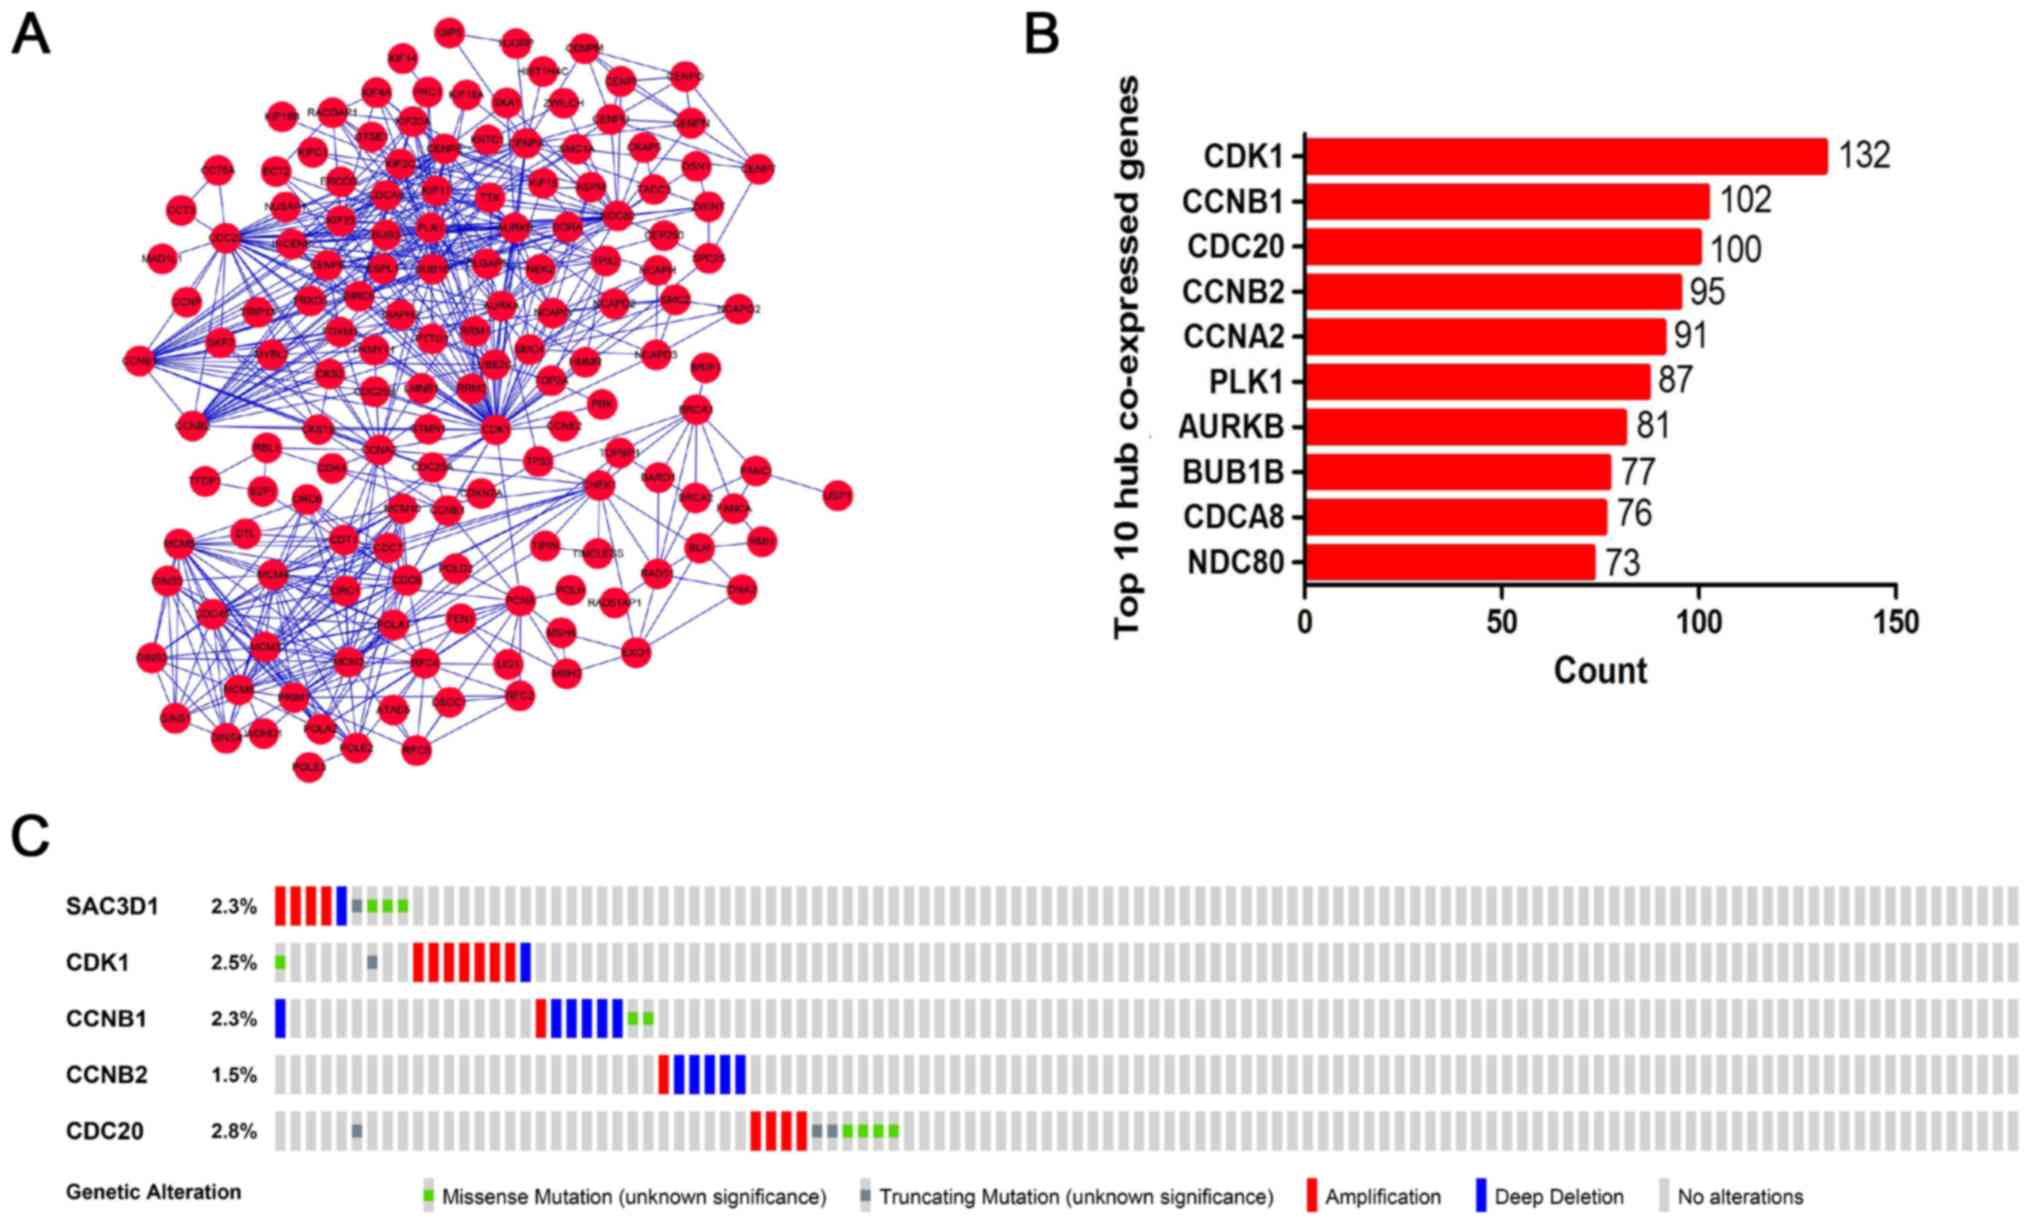
VI and Fig. 8B and G). The PPI
network indicated that CDK1, CCNB1, CCNB2 and CDC20 were the hub
co-expressed genes of SAC3D1 in GC (Fig. 9A and B).
| Table VThe top 10 GO items associated with
SAC3D1 and its co-expressed genes. |
Table V
The top 10 GO items associated with
SAC3D1 and its co-expressed genes.
| Category | ID | Term | Count | P-value |
|---|
| BP | GO:0051301 | Cell division | 69 | 6.42E-44 |
| BP | GO:0006260 | DNA
replication | 48 | 5.22E-40 |
| BP | GO:0007067 | Mitotic nuclear
division | 49 | 6.14E-31 |
| BP | GO:0000082 | G1/S transition of
mitotic cell cycle | 33 | 4.98E-28 |
| BP | GO:0007062 | Sister chromatid
cohesion | 32 | 1.46E-26 |
| BP | GO:0006270 | DNA replication
initiation | 19 | 6.20E-22 |
| BP | GO:0006281 | DNA repair | 35 | 5.10E-18 |
| BP | GO:0000086 | G2/M transition of
mitotic cell cycle | 26 | 6.69E-16 |
| BP | GO:0000070 | Mitotic sister
chromatid segregation | 14 | 1.42E-15 |
| BP | GO:0000722 | Telomere
maintenance via recombination | 14 | 8.38E-14 |
| CC | GO:0005654 | Nucleoplasm | 189 | 7.71E-53 |
| CC | GO:0005634 | Nucleus | 211 | 1.05E-22 |
| CC | GO:0000776 | Kinetochore | 23 | 1.67E-18 |
| CC | GO:0000777 | Condensed
chromosome kinetochore | 23 | 9.02E-18 |
| CC | GO:0000922 | Spindle pole | 25 | 9.22E-18 |
| CC | GO:0000775 | Chromosome,
centromeric region | 19 | 1.14E-16 |
| CC | GO:0005829 | Cytosol | 141 | 2.46E-16 |
| CC | GO:0005813 | Centrosome | 41 | 6.89E-15 |
| CC | GO:0030496 | Midbody | 22 | 6.37E-13 |
| CC | GO:0005819 | Spindle | 21 | 1.70E-12 |
| MF | GO:0005515 | Protein
binding | 305 | 5.16E-29 |
| MF | GO:0005524 | ATP binding | 80 | 7.62E-13 |
| MF | GO:0003682 | Chromatin
binding | 35 | 2.18E-11 |
| MF | GO:0019901 | Protein kinase
binding | 34 | 3.39E-11 |
| MF | GO:0043142 | Single-stranded
DNA-dependent | | |
| | ATPase
activity | 7 | 2.59E-08 |
| MF | GO:0008017 | Microtubule
binding | 21 | 6.22E-08 |
| MF | GO:0003677 | DNA binding | 72 | 1.66E-07 |
| MF | GO:0003697 | Single-stranded DNA
binding | 14 | 1.79E-07 |
| MF | GO:0003684 | Damaged DNA
binding | 11 | 1.44E-06 |
| MF | GO:0003777 | Microtubule motor
activity | 12 | 1.88E-06 |
| Table VIThe 10-most KEGG pathways associated
with SAC3D1 and its co-expressed genes. |
Table VI
The 10-most KEGG pathways associated
with SAC3D1 and its co-expressed genes.
| Category | ID | Term | P-value |
|---|
| KEGG | hsa04110 | Cell cycle | 1.05E-31 |
| KEGG | hsa03030 | DNA
replication | 2.24E-19 |
| KEGG | hsa00240 | Pyrimidine
metabolism | 1.25E-08 |
| KEGG | hsa03430 | Mismatch
repair | 1.01E-07 |
| KEGG | hsa04115 | p53 signaling
pathway | 1.78E-06 |
| KEGG | hsa04114 | Oocyte meiosis | 1.87E-06 |
| KEGG | hsa03460 | Fanconi anemia
pathway | 1.20E-05 |
| KEGG | hsa03410 | Base excision
repair | 2.55E-05 |
| KEGG | hsa03420 | Nucleotide excision
repair | 2.71E-04 |
| KEGG | hsa05203 | Viral
carcinogenesis | 5.13E-04 |
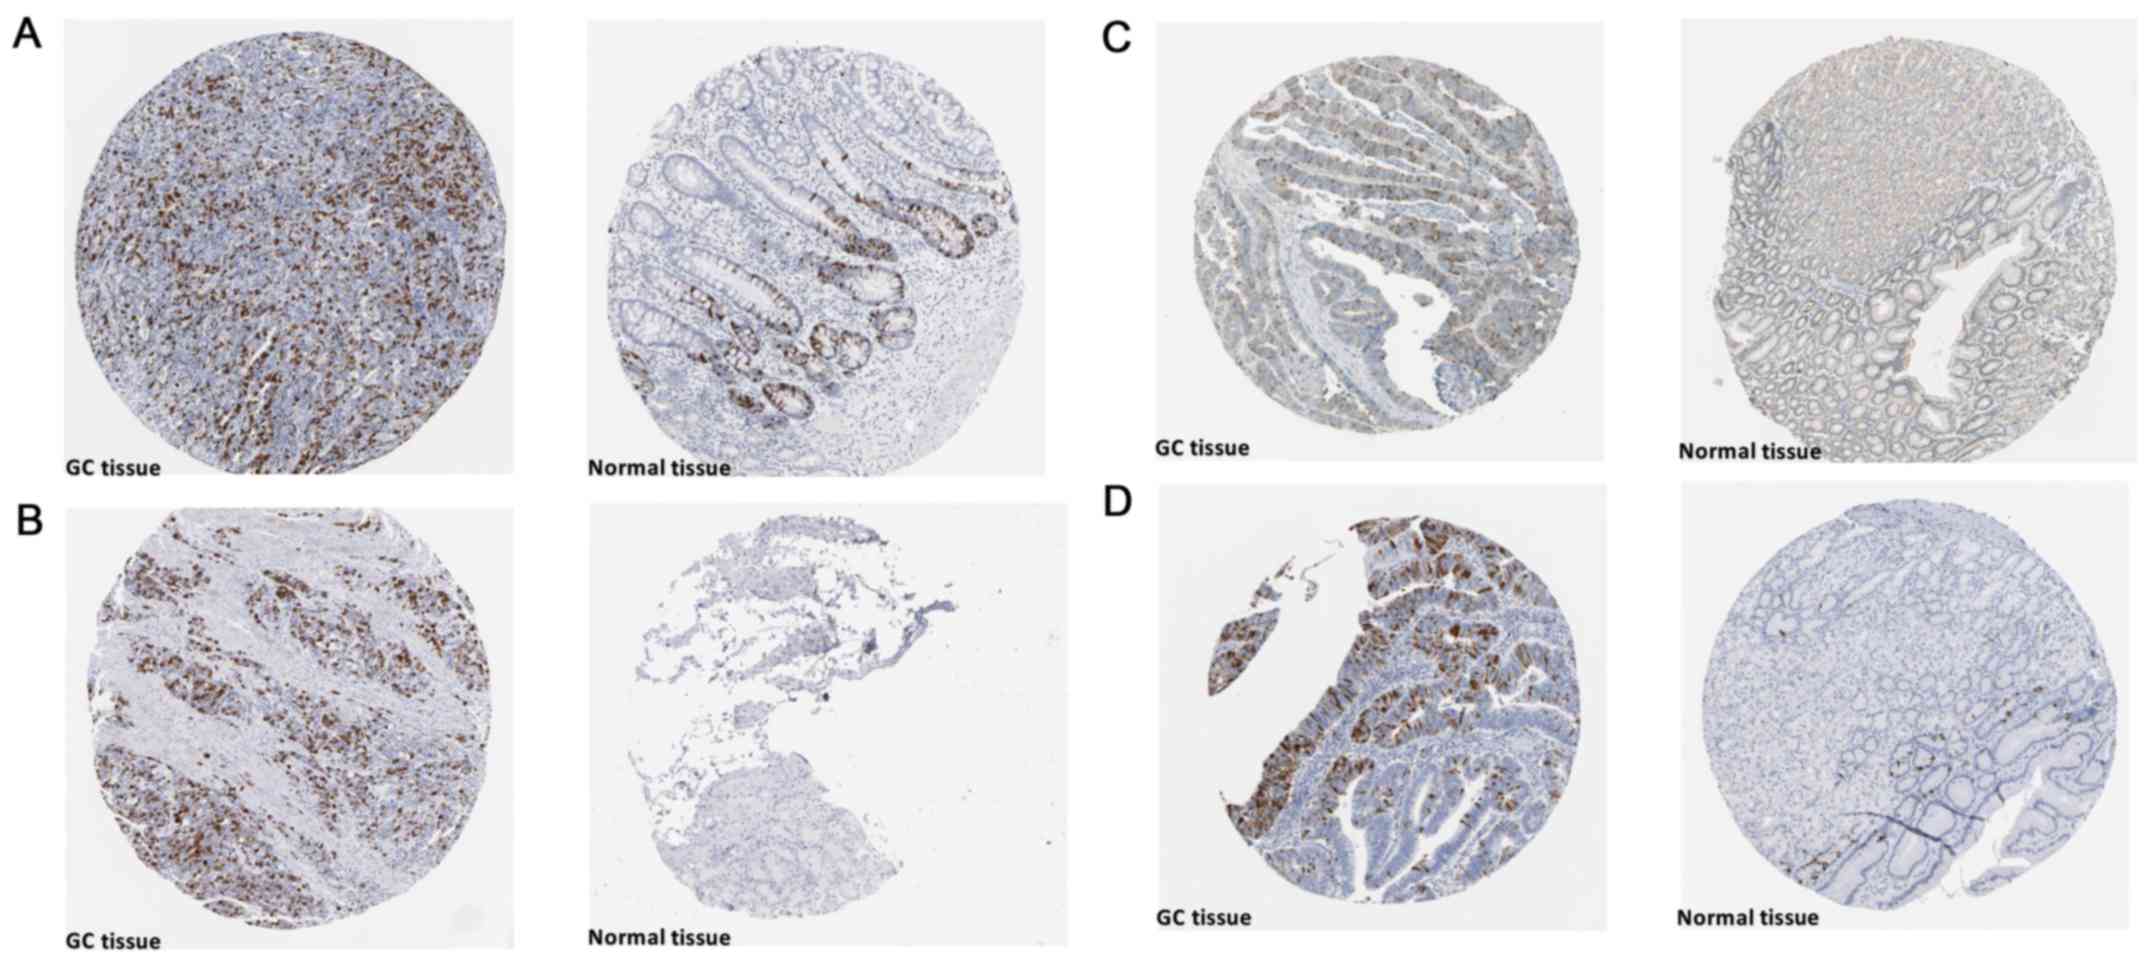
Validation of hub co-expressed genes
based on TCGA and HPA
Various types of mutations of the 4 hub co-expressed
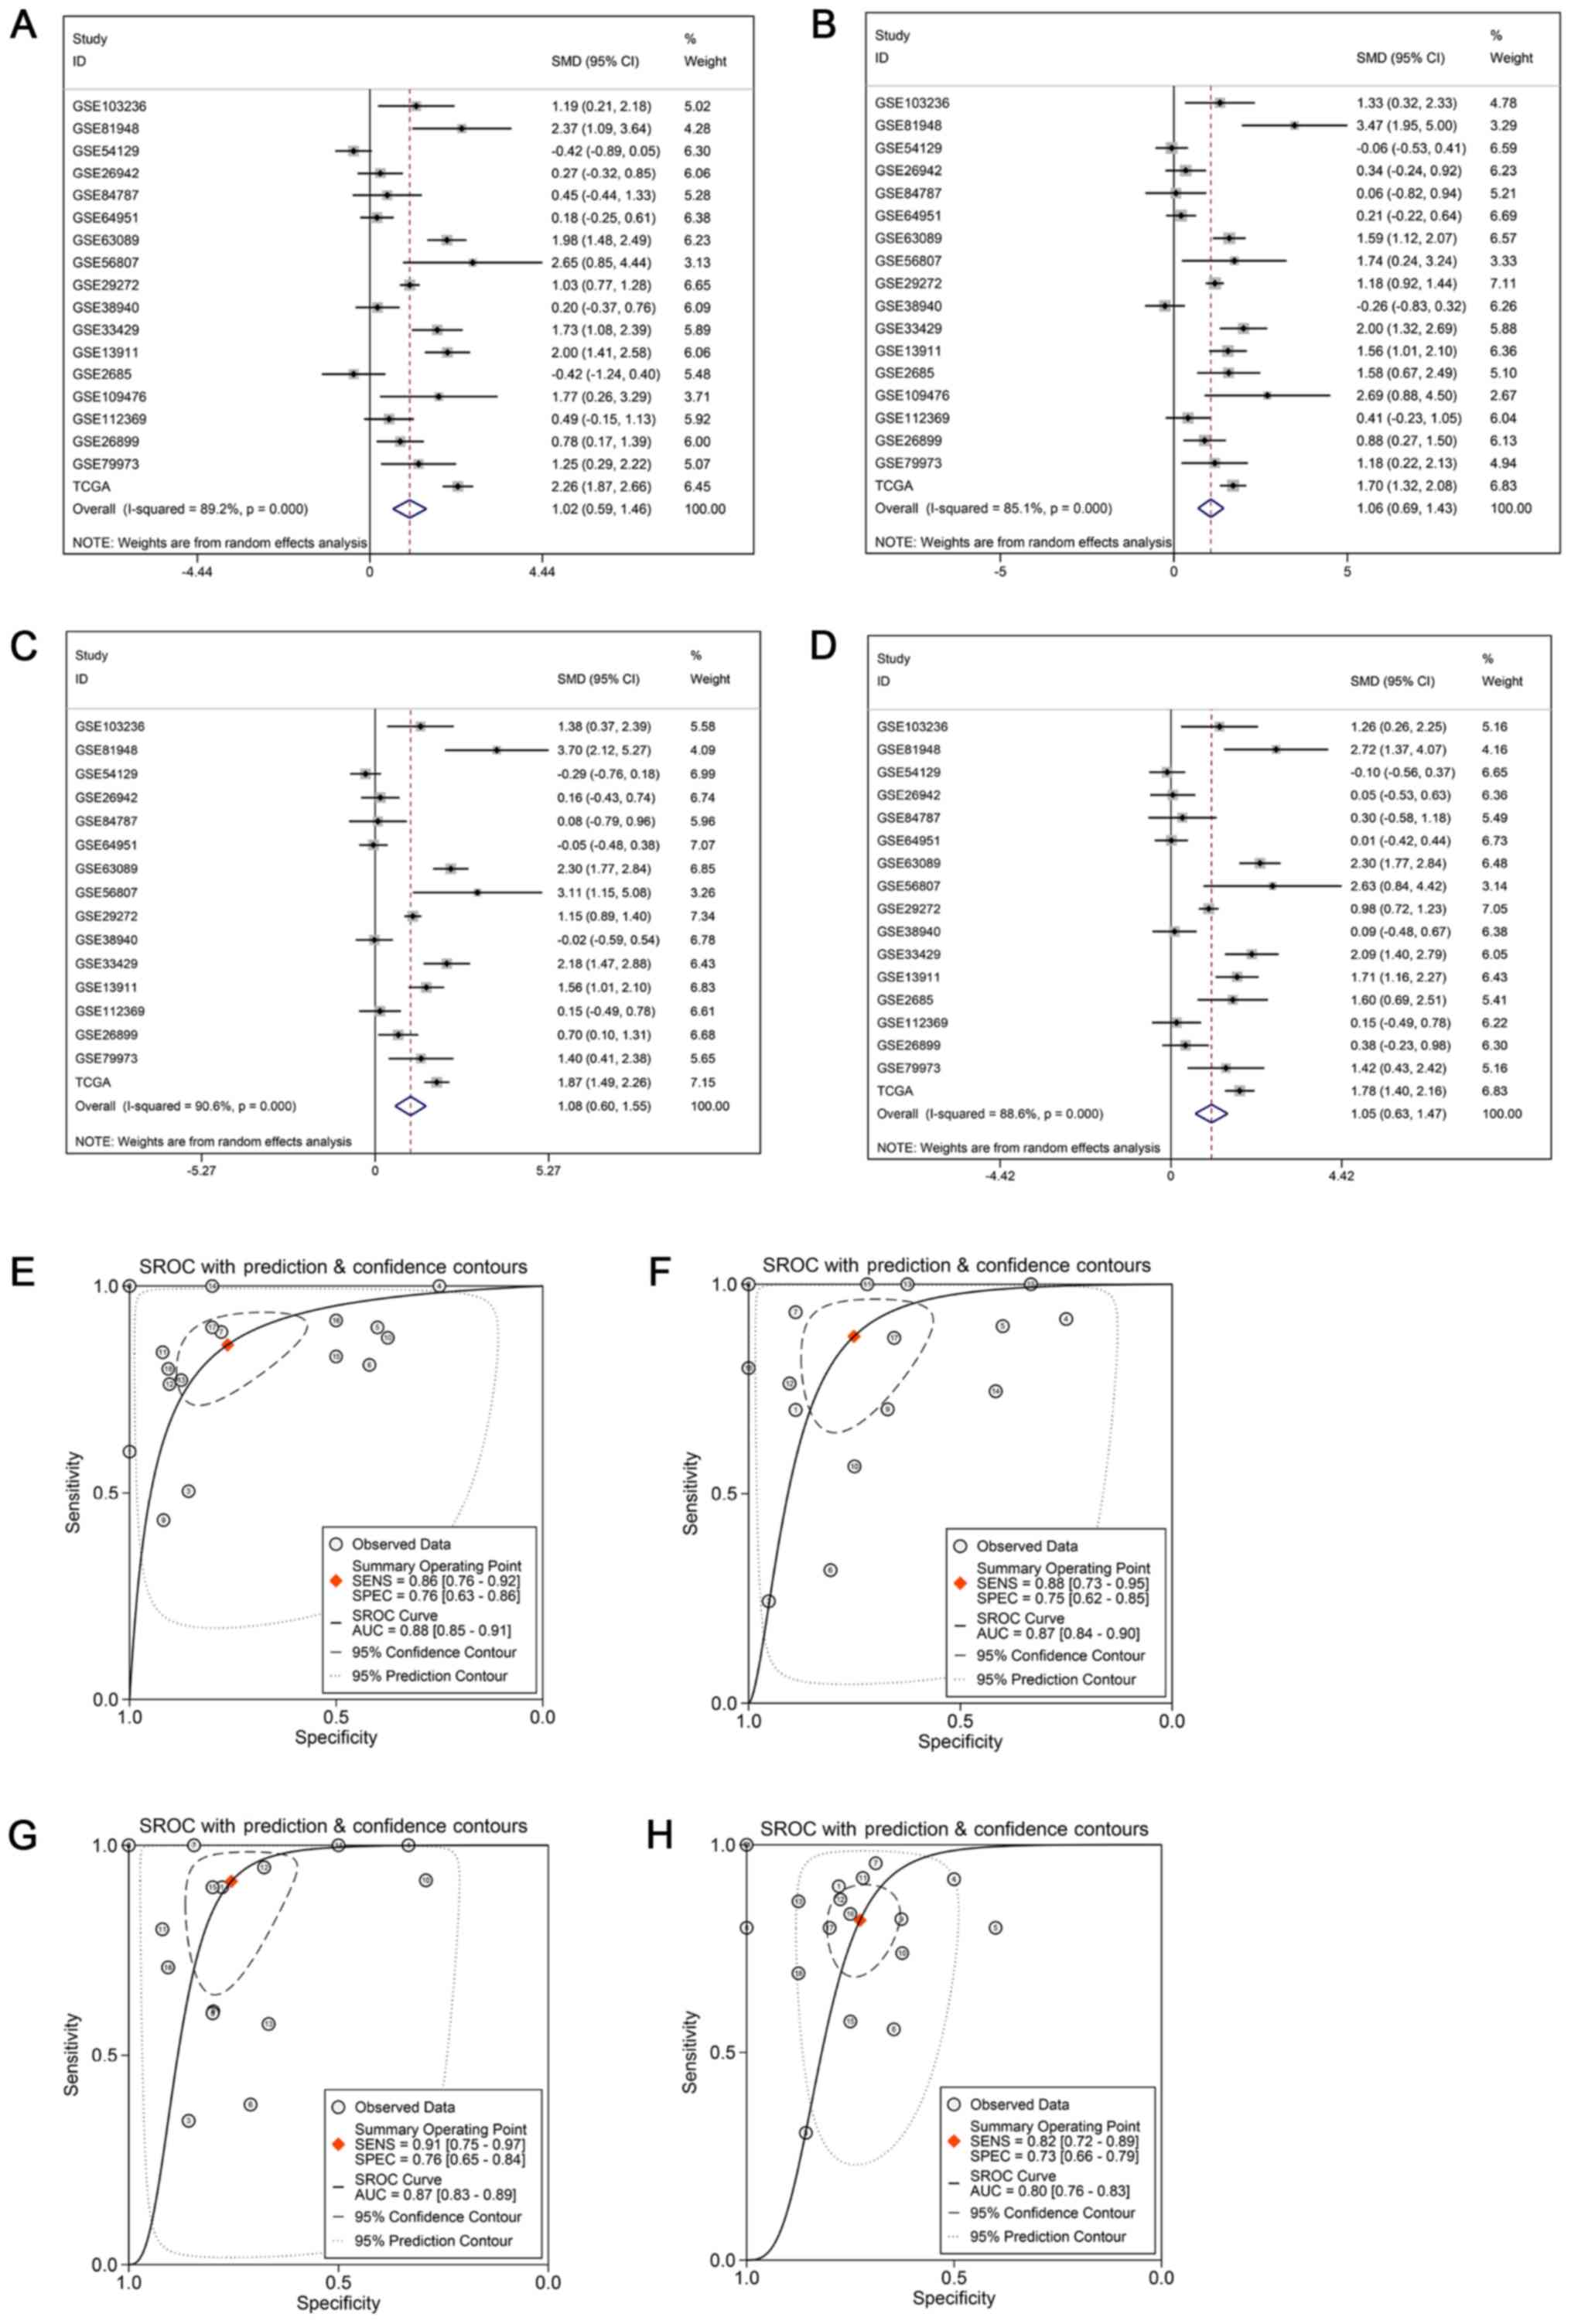
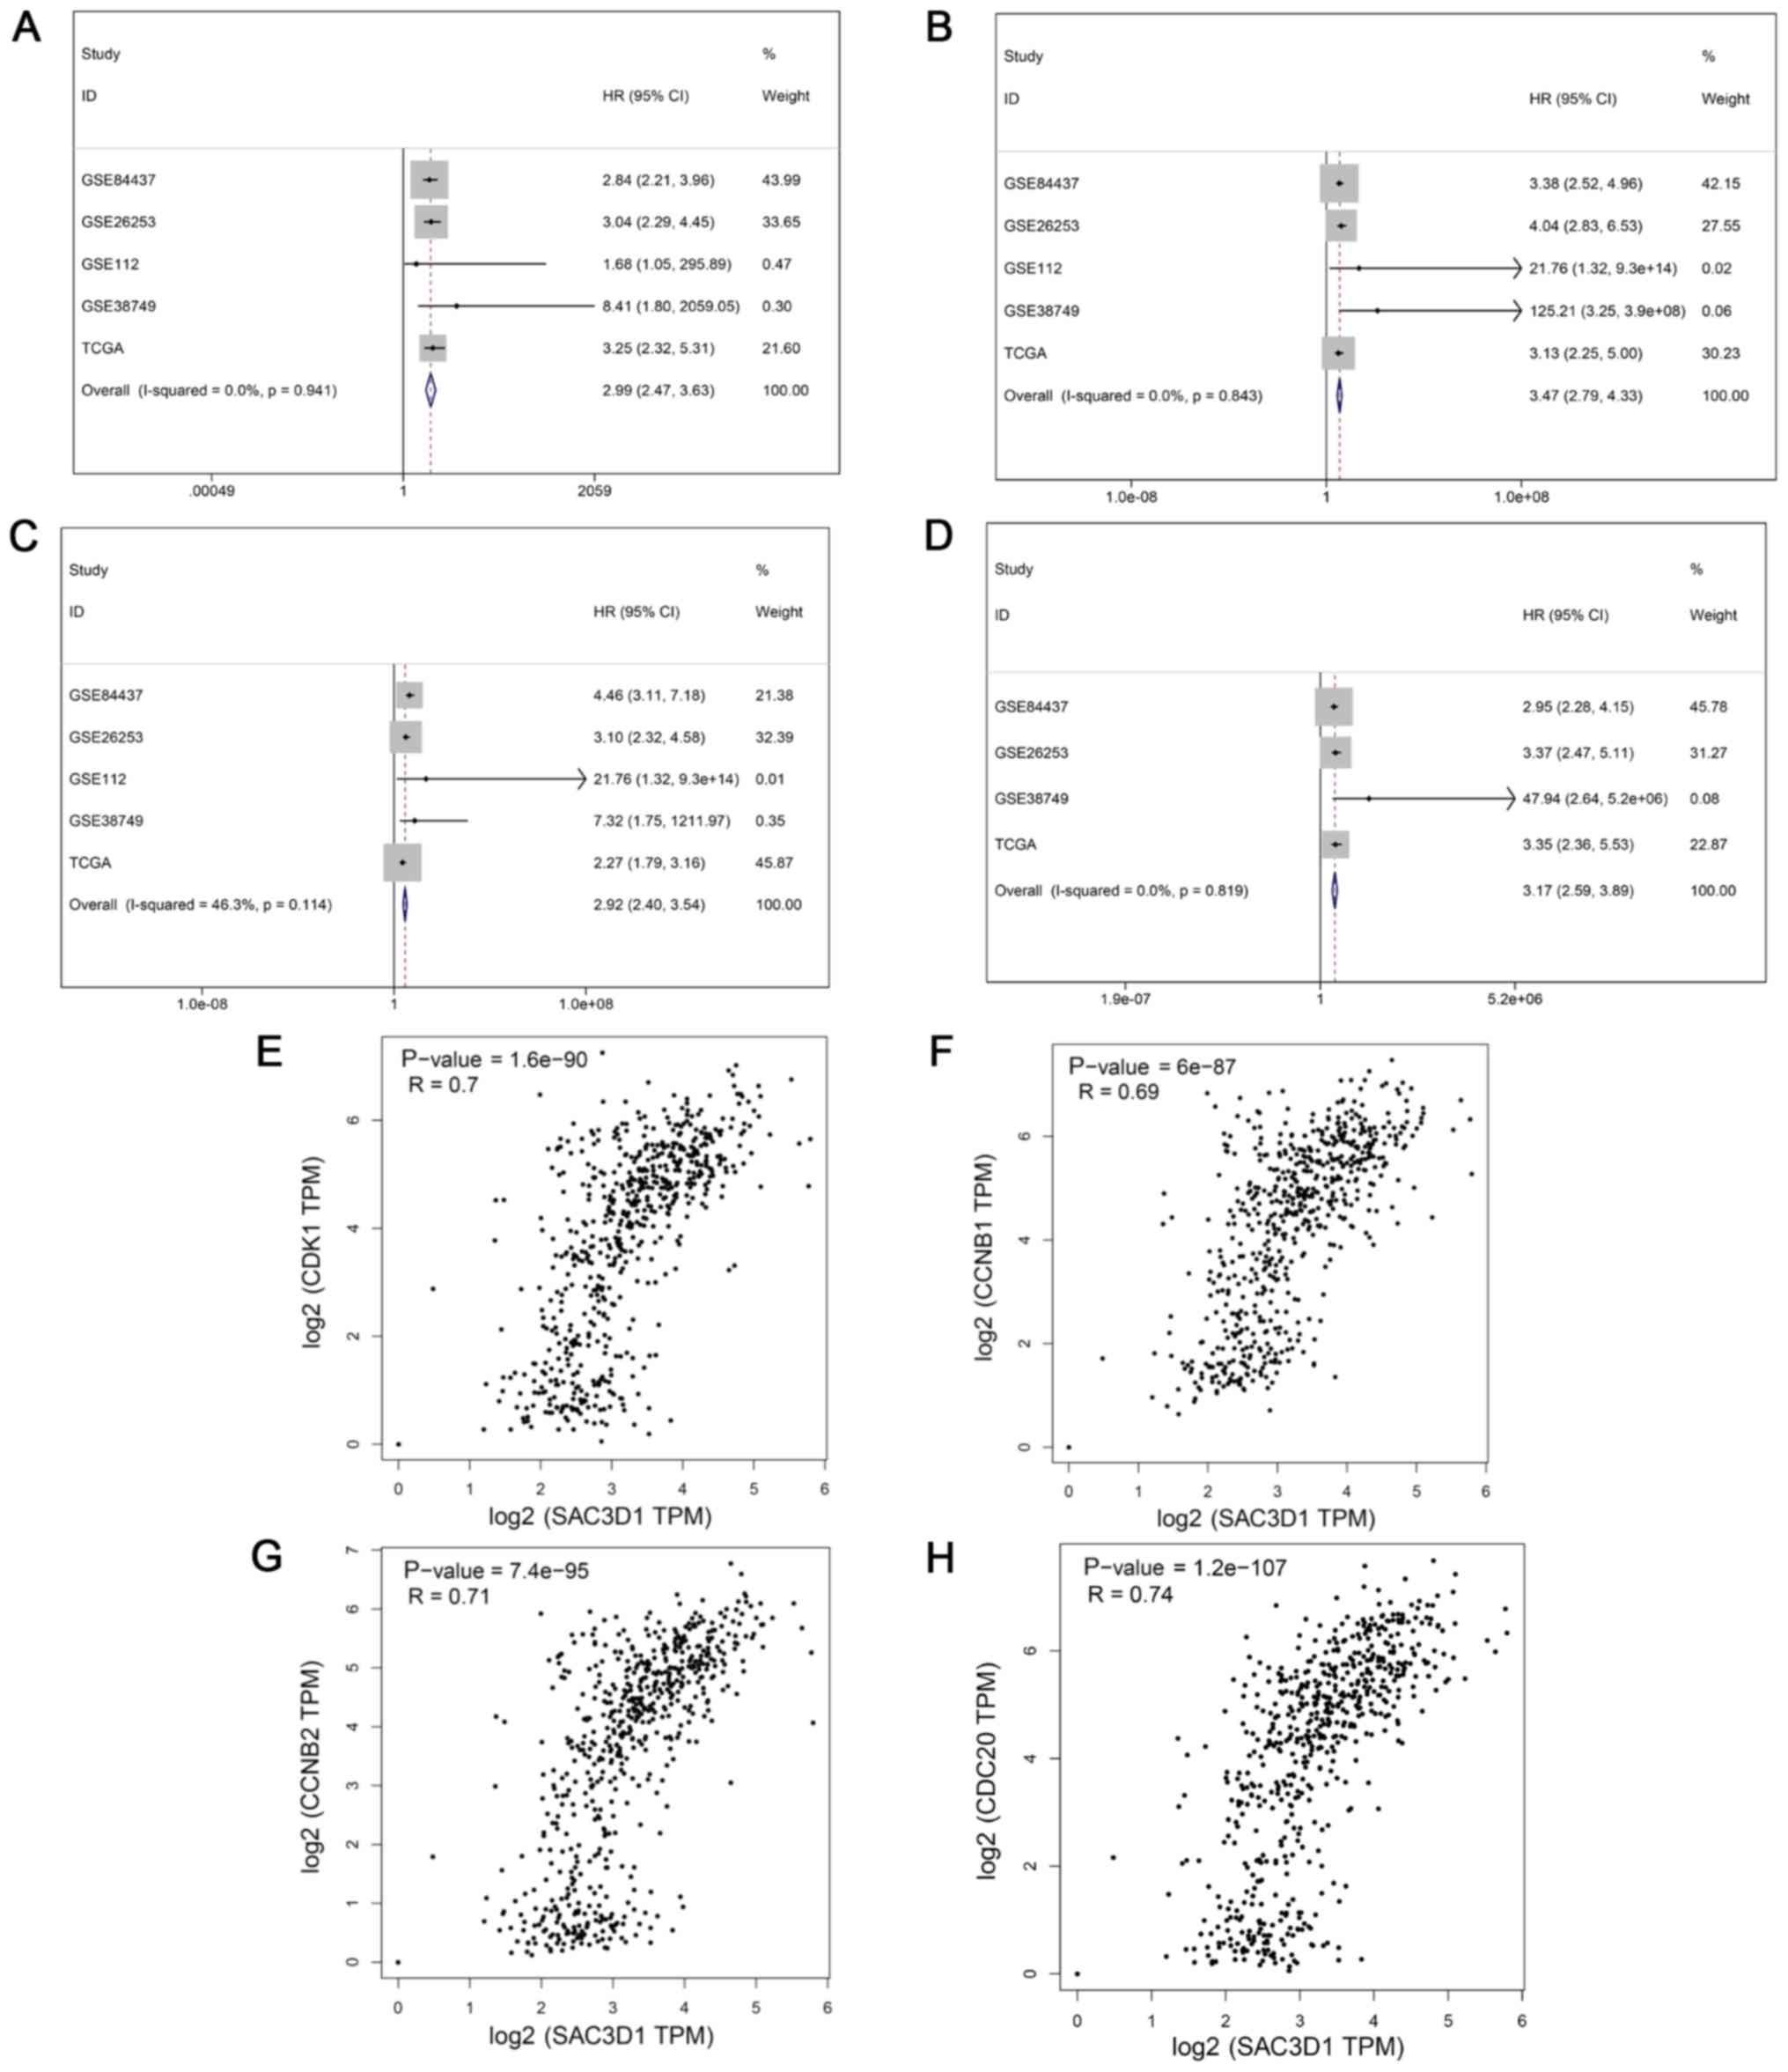
genes (CDK1, CCNB1, CCNB2 and CDC20) were observed in GC (Fig. 9C). CDK1, CCNB1, CCNB2 and CDC20
were evidently highly expressed in GC based on the microarray and
RNA-seq data mRNA expression data (Fig. 10A-D) and CDK1, CCNB1, CCNB2 and
CDC20 may also serve as biomarkers differentiating GC tissues and
normal tissues with a relative high sensitivity and specificity
(Fig. 10E-H). The high expression
trends of these 4 genes were also observed in protein expression
data based on the HPA database (Fig.
11). These genes were risk factors affecting the prognosis of
gastric cancer (Fig. 12A-D).
Moreover, Spearman's correlation analysis indicated that there were
significant positive correlations between SAC3D1 and these core
co-expressed genes (Fig.
12E-H).
Discussion
In the present study, the expression of SAC3D1 in GC
was determined by integrated and thoroughly re-processed 18 GEO
chips, TCGA RNA-seq data and IHC data, which included 1,420 GC
tissues and 599 normal tissues. Notably, both SAC3D1 mRNA and
protein levels were observed to be upregulated in GC tissues. The
overexpression SAC3D1 was associated with the histological grade,
clinical stage, T stage and N stage of GC, revealing that SAC3D1
may be involved in the development and progression of GC.
Enrichment analysis revealed that SAC3D1 and 4 other SAC3D1-related
genes (CDK1, CCNB1, CCNB2 and CDC20) are important for GC
development via the cell cycle pathway.
Numerous studies have reported the overexpression of
SAC3D1 in several types of cancer, including hepatocellular
carcinoma (11), colon cancer
(12) and lung adenocarcinoma
(13). Recent studies have
assessed the prognostic value of SAC3D1 using GEO, the Cancer
Genome Atlas and International Cancer Genome Consortium and
suggested that SAC3D1 may be a credible prognosis-related biomarker
for hepatocellular carcinoma (11). In colon cancer, the upregulation of
SAC3D1 was confirmed by a quantitative PCR (12). In lung adenocarcinoma, SAC3D1 may
be involved in the inhibition of cytoplasmic pro-B cell
developmental mechanisms in paracancerous tissue of lung
adenocarcinoma by low glucose transporter SLC2A5 (13). However, to the best of our
knowledge, no studies to date have clarified the expression of
SAC3D1 in GC, and the expression of SAC3D1 in other cancers was
only validated based on small sample sizes or a single method,
which may decrease the reliability of their conclusion.
Particularly, no research or clinical trials have specifically been
done attempting to reveal the molecular mechanisms of SAC3D1 in
cancers, including GC.
To explore the possible molecular mechanisms of
actoin of SAC3D1 in GC, an enrichment analysis was performed for
SAC3D1 and its co-expressed genes. The results indicated that
SAC3D1 and co-expressed genes were positively associated with the
cell cycle. Additionally, numerous studies have demonstrated that
the cell cycle pathway plays an important role in cancer cells. Cao
et al reported that the regulatory mechanism of BIRC5 and
co-expressed genes in lung carcinoma may be closely related to the
cell cycle (24). Liu et al
reported that upregulated differentially expressed genes
participated in regulating breast cancer cells by the cell cycle
pathway (25). Moreover, Qiu et
al revealed that the modules and central genes associated with
the development of breast cancer were significantly enriched in the
cell cycle pathway (26). Feng
et al investigated poor prognosis-related genes of ovarian
cancer by bioinformatics analysis and found that these genes were
mainly enriched in the cell cycle pathway (27). It has also been reported that the
cell cycle pathway is the key signaling pathway for 8 target
therapy of neuroblastomas (28).
Zhang et al reported that LncRNA CASC11 promoted the
proliferation, migration, and invasion of GC cells in vitro
via the cell cycle pathway (29).
A number of studies have documented that the cell cycle pathway may
play a role in the regulation of multiple types of cancer,
including GC and enrichment analysis revealed that SAC3D1 and its
co-expressed genes were involved in the cell cycle pathway. This
prompted the hypothesis that SAC3D1 may be related to the
occurrence and progression of GC. A total of 4 genes (CDK1, CCNB1,
CCNB2 and CDC20) were determined as the core co-expressed genes of
SAC3D1 in GC, and it was speculated that SAC3D1 may cooperate with
these genes to promote the progression of GC. Further in
vitro experimental analyses are still required to verify the
findings of the present study, such as SAC3D1 overexpression or
interference.
CDK1 is a cell cycle-related gene that can be
regulated by KIAA0101 and is involved in the occurrence and
development of GC (30). CDK1 can
also be regulated by LncRNA CASC11 and then participate in the
proliferation, migration, and invasion of GC cells (29). Guo et al demonstrated that
rhCNB may decrease the expression of cell cycle B1 and CDK1
proteins and participate in the mechanism of cell cycle arrest
(31). CCNB1 is a cell
cycle-related gene that can be regulated by ISL1 to promote the
proliferation and tumor growth of GC cells (32). CCNB1 can be used as a biomarker to
monitor prognosis and hormone therapy in ER breast cancer (33). It has also been reported that the
overexpression of CCNB1 induced by chk1 can promote the
proliferation and tumor growth of human colorectal cancer cells and
inhibit the induction of apoptosis in some colorectal cancer cells
(34). CCNB1 could also activate
FOXM1 and promote the proliferation of human hepatocel-lular
carcinoma cells (35). CCNB1 may
serve as a promising diagnostic tool for determining the high risk
of recurrence in patients with non-myenteric invasive bladder
cancer (36). CCNB2 is a cell
cycle-related gene that can be regulated by ISL1 to promote the
proliferation and tumor growth of GC cells (32). In addition, the overexpression of
CCNB2 protein is related to the clinical progress and poor
prognosis of non-small cell lung cancer, and over-expressed CCNB2
is a biomarker of poor prognosis in Chinese patients with non-small
cell lung cancer (37). The
increased expression of the cell cycle-related gene CCNB2 is
related to the advanced growth of prostate cancer cell subsets
(38). Kim et al reported
that the expression of CDC20 in early GC was significantly higher
than that in normal mucous membranes (39). The upregulation of CDC20 was
associated with invasive progress and poor prognosis in GC, and it
was identified as an independent marker for predicting clinical
outcomes in patients with GC (40). It has also been reported that CDC20
expression can be used as a biomarker for tumor prognosis or as a
therapeutic target for other human cancers (41). In addition, CDC20 can mediate
docetaxel resistance to castrated prostate cancer (42).
Microarray and RNA-seq data were combined to
evaluate the prognostic value of 4 hub co-expressed genes via a
prognostic-related meta-analysis. It was found that the
upregulation of these genes were closely related to the poor
prognosis of patients with GC. From online analysis, it was found
that the genetic alterations rate of SAC3D1 and its hub
co-expressed genes in GC was relatively low. Therefore, it
speculated that mutation and amplification may not be the main
reasons for SAC3D1 to promote the development of GC. Further
experimental analyses are warranted. In conclusion, the findings of
the present study demonstrate that SAC3D1 is highly expressed in GC
and may be associated with the progression of GC.
Supplementary Data
Funding
The present study was supported by the Guangxi
medical and Health Appropriate Technology Development And Promotion
Application Project (S201657), Guangxi Zhuang Autonomous Region
Health Committee Self-financed Scientific Research Project
(Z20190594), Guangxi Degree and Postgraduate Education Reform and
Development Research Projects, China (JGY2019050), Future Academic
Star of Guangxi Medical University (WLXSZX19077).
Availability of data and materials
The datasets generated and/or analyzed during the
current study are available in the TCGA (http://cancergenome.nih.gov/), the GEO (https://www.ncbi.nlm.nih.gov/geo/) and the SRA
(https://www.ncbi.nlm.nih.gov/sra/)
data portals. The in-house IHC data from the present study can be
acquired from the correspondence author on reasonable request.
Authors' contributions
AGL and JCZ collected data from public datasets and
analyzed the data and performed the statistical analysis. XGQ and
WJM performed in-house IHC experiments. GC, RQH and JJL
participated in the conception and design of the study and in
language modification. AGL, JCZ and YQH drafted the manuscript and
analyzed the GO and KEGG terms. JM, LHY, XJW and JTH conceived and
designed the study and assisted in the drafting of the manuscript.
All authors have read and approved the final manuscript.
Ethics approval and consent to
participate
This research program was approved by the Ethics
Committee of the First Affiliated Hospital of Guangxi Medical
University. All participants signed informed consent forms as
collected by Pantomics.
Patient consent for publication
Not applicable.
Competing interests
The authors declare that they have no competing
interests.
Acknowledgments
The authors would like to thank all members of the
Molecular Oncology Group of the First Affiliated Hospital of
Guangxi Medical University (Nanning, Guangxi Zhuang Autonomous
Region 530021, China) for their professional suggestions. At the
same time, the authors would like to thank GEO, ArrayExpress,
Oncomine, SRA, TCGA, Human Protein Atlas and other websites for
providing valuable data.
References
|
1
|
Siegel RL, Miller KD and Jemal A: Cancer
statistics, 2019. CA Cancer J Clin. 69:7–34. 2019. View Article : Google Scholar : PubMed/NCBI
|
|
2
|
Kim HH, Han SU, Kim MC, Kim W, Lee HJ, Ryu
SW, Cho GS, Kim CY, Yang HK, Park DJ, et al: Korean
Laparoendoscopic Gastrointestinal Surgery Study (KLASS) Group:
Effect of laparo-scopic distal gastrectomy vs. open distal
gastrectomy on long-term survival among patients with stage I
gastric cancer: The KLASS-01 Randomized Clinical Trial. JAMA Oncol.
5:506–513. 2019. View Article : Google Scholar : PubMed/NCBI
|
|
3
|
De Franco L, Marrelli D, Voglino C,
Vindigni C, Ferrara F, Di Mare G, Iudici L, Marini M and Roviello
F: Prognostic value of perineural invasion in resected gastric
cancer patients according to Lauren histotype. Pathol Oncol Res.
24:393–400. 2018. View Article : Google Scholar
|
|
4
|
Liu W, Quan H, Chen X, Ouyang Y and Xiao
H: Clinicopathological features and prognosis of young gastric
cancer patients following radical gastrectomy: A propensity score
matching analysis. Sci Rep. 9:59432019. View Article : Google Scholar : PubMed/NCBI
|
|
5
|
Huang T, Song C, Zheng L, Xia L, Li Y and
Zhou Y: The roles of extracellular vesicles in gastric cancer
development, micro-environment, anti-cancer drug resistance, and
therapy. Mol Cancer. 18:622019. View Article : Google Scholar
|
|
6
|
Ahn MJ, Lee K, Lee KH, Kim JW, Kim IY and
Bae WK: Combination of anti-PD-1 therapy and stereotactic
radiosurgery for a gastric cancer patient with brain metastasis. A
case report BMC Cancer. 18:1732018. View Article : Google Scholar
|
|
7
|
Zhao D, Zhang Y and Song L: MiR-16-1
targeted silences far upstream element binding protein 1 to advance
the chemosensitivity to adriamycin in gastric cancer. Pathol Oncol
Res. 24:483–488. 2018. View Article : Google Scholar
|
|
8
|
Xu J, Zhu J and Wei Q: Adjuvant
radiochemotherapy versus chemotherapy alone for gastric cancer:
Implications for target definition. J Cancer. 10:458–466. 2019.
View Article : Google Scholar : PubMed/NCBI
|
|
9
|
Charalampakis N, Economopoulou P,
Kotsantis I, Tolia M, Schizas D, Liakakos T, Elimova E, Ajani JA
and Psyrri A: Medical management of gastric cancer: A 2017 update.
Cancer Med. 7:123–133. 2018. View Article : Google Scholar :
|
|
10
|
Rappaport N, Fishilevich S, Nudel R, Twik
M, Belinky F, Plaschkes I, Stein TI, Cohen D, Oz-Levi D, Safran M,
et al: Rational confederation of genes and diseases: NGS
interpretation via GeneCards, MalaCards and VarElect. Biomed Eng
Online. 16(Suppl 1): 722017. View Article : Google Scholar : PubMed/NCBI
|
|
11
|
Han ME, Kim JY, Kim GH, Park SY, Kim YH
and Oh SO: SAC3D1: A novel prognostic marker in hepatocellular
carcinoma. Sci Rep. 8:156082018. View Article : Google Scholar : PubMed/NCBI
|
|
12
|
Fan J, Yan D, Teng M, Tang H, Zhou C, Wang
X, Li D, Qiu G and Peng Z: Digital transcript profile analysis with
aRNA-LongSAGE validates FERMT1 as a potential novel prognostic
marker for colon cancer. Clin Cancer Res. 17:2908–2918. 2011.
View Article : Google Scholar : PubMed/NCBI
|
|
13
|
You J, Wang L, Huang J, Jiang M, Chen Q,
Wang Y and Jiang Z: Low glucose transporter SLC2A5-inhibited human
normal adjacent lung adenocarcinoma cytoplasmic pro-B cell
development mechanism network. Mol Cell Biochem. 399:71–76. 2015.
View Article : Google Scholar
|
|
14
|
Tsui B, Dow M, Skola D and Carter H:
Extracting allelic read counts from 250,000 human sequencing runs
in sequence read archive. Pac Symp Biocomput. 24:196–207.
2019.PubMed/NCBI
|
|
15
|
Gao L, Zhang LJ, Li SH, Wei LL, Luo B, He
RQ and Xia S: Role of miR-452-5p in the tumorigenesis of prostate
cancer: A study based on the Cancer Genome Atl (TCGA), Gene
Expression Omnibus (GEO), and bioinformatics analysis. Pathol Res
Pract. 214:732–749. 2018. View Article : Google Scholar : PubMed/NCBI
|
|
16
|
Guo YN, Luo B, Chen WJ, Chen X, Peng ZG,
Wei KL and Chen G: Comprehensive clinical implications of homeobox
A10 in 3,199 cases of non-small cell lung cancer tissue samples
combining qRT-PCR, RNA sequencing and microarray data. Am J Transl
Res. 11:45–66. 2019.PubMed/NCBI
|
|
17
|
Li J, Su T, Yang L, Zhang C and He Y: High
expression of MRE11 correlates with poor prognosis in gastric
carcinoma. Diagn Pathol. 14:602019. View Article : Google Scholar : PubMed/NCBI
|
|
18
|
Lin P, Xiong DD, Dang YW, Yang H, He Y,
Wen DY, Qin XG and Chen G: The anticipating value of PLK1 for
diagnosis, progress and prognosis and its prospective mechanism in
gastric cancer: A comprehensive investigation based on
high-throughput data and immunohistochemical validation.
Oncotarget. 8:92497–92521. 2017. View Article : Google Scholar : PubMed/NCBI
|
|
19
|
Gan BL, He RQ, Zhang Y, Wei DM, Hu XH and
Chen G: Downregulation of HOXA3 in lung adenocarcinoma and its
relevant molecular mechanism analysed by RT-qPCR, TCGA and in
silico analysis. Int J Oncol. 53:1557–1579. 2018.PubMed/NCBI
|
|
20
|
Obayashi T, Kagaya Y, Aoki Y, Tadaka S and
Kinoshita K: COXPRESdb v7: A gene coexpression database for 11
animal species supported by 23 coexpression platforms for technical
evaluation and evolutionary inference. Nucleic Acids Res.
47:D55–D62. 2019. View Article : Google Scholar :
|
|
21
|
Zhong X, Huang G, Ma Q, Liao H, Liu C, Pu
W, Xu L, Cai Y and Guo X: Identification of crucial miRNAs and
genes in esophageal squamous cell carcinoma by miRNA-mRNA
integrated analysis. Medicine (Baltimore). 98:e162692019.
View Article : Google Scholar
|
|
22
|
Szklarczyk D, Gable AL, Lyon D, Junge A,
Wyder S, Huerta-Cepas J, Simonovic M, Doncheva NT, Morris JH, Bork
P, et al: STRING v11: Protein-protein association networks with
increased coverage, supporting functional discovery in genome-wide
experimental datasets. Nucleic Acids Res. 47:D607–D613. 2019.
View Article : Google Scholar
|
|
23
|
Colwill K, Gräslund S, Graslund S,
Renewable Protein Binder and Working Group: A roadmap to generate
renewable protein binders to the human proteome. Nat Methods.
8:551–558. 2011. View Article : Google Scholar : PubMed/NCBI
|
|
24
|
Cao Y, Zhu W, Chen W, Wu J, Hou G and Li
Y: Prognostic value of BIRC5 in lung adenocarcinoma lacking EGFR,
KRAS, and ALK mutations by integrated bioinformatics analysis. Dis
Markers. 2019:54512902019. View Article : Google Scholar : PubMed/NCBI
|
|
25
|
Liu F, Wu Y, Mi Y, Gu L, Sang M and Geng
C: Identification of core genes and potential molecular mechanisms
in breast cancer using bioinformatics analysis. Pathol Res Pract.
215:1524362019. View Article : Google Scholar : PubMed/NCBI
|
|
26
|
Qiu J, Du Z, Wang Y, Zhou Y, Zhang Y, Xie
Y and Lv Q: Weighted gene co-expression network analysis reveals
modules and hub genes associated with the development of breast
cancer. Medicine (Baltimore). 98:e143452019. View Article : Google Scholar
|
|
27
|
Feng H, Gu ZY, Li Q, Liu QH, Yang XY and
Zhang JJ: Identification of significant genes with poor prognosis
in ovarian cancer via bioinformatical analysis. J Ovarian Res.
12:352019. View Article : Google Scholar : PubMed/NCBI
|
|
28
|
Shaabanpour Aghamaleki F, Mollashahi B,
Aghamohammadi N, Rostami N, Mazloumi Z, Mirzaei H, Moradi A,
Sheikhpour M and Movafagh A: Bioinformatics analysis of key genes
and pathways for medulloblastoma as a therapeutic target. Asian Pac
J Cancer Prev. 20:221–227. 2019. View Article : Google Scholar : PubMed/NCBI
|
|
29
|
Zhang L, Kang W, Lu X, Ma S, Dong L and
Zou B: LncRNA CASC11 promoted gastric cancer cell proliferation,
migration and invasion in vitro by regulating cell cycle pathway.
Cell Cycle. 17:1886–1900. 2018. View Article : Google Scholar : PubMed/NCBI
|
|
30
|
Wang Z, Dang C, Yan R, Zhang H, Yuan D and
Li K: Screening of cell cycle-related genes regulated by KIAA0101
in gastric cancer. Nan Fang Yi Ke Da Xue Xue Bao. 38:1151–1158.
2018.In Chinese. PubMed/NCBI
|
|
31
|
Guo Y, Huang Y, Tian S, Xie X, Xing G and
Fu J: Genetically engineered drug rhCNB induces apoptosis and cell
cycle arrest in both gastric cancer cells and hepatoma cells. Drug
Des Devel Ther. 12:2567–2575. 2018. View Article : Google Scholar : PubMed/NCBI
|
|
32
|
Shi Q, Wang W, Jia Z, Chen P, Ma K and
Zhou C: ISL1, a novel regulator of CCNB1, CCNB2 and c-MYC genes,
promotes gastric cancer cell proliferation and tumor growth.
Oncotarget. 7:36489–36500. 2016. View Article : Google Scholar : PubMed/NCBI
|
|
33
|
Ding K, Li W, Zou Z, Zou X and Wang C:
CCNB1 is a prognostic biomarker for ER+ breast cancer.
Med Hypotheses. 83:359–364. 2014. View Article : Google Scholar : PubMed/NCBI
|
|
34
|
Fang Y, Yu H, Liang X, Xu J and Cai X:
Chk1-induced CCNB1 overexpression promotes cell proliferation and
tumor growth in human colorectal cancer. Cancer Biol Ther.
15:1268–1279. 2014. View Article : Google Scholar : PubMed/NCBI
|
|
35
|
Chai N, Xie HH, Yin JP, Sa KD, Guo Y, Wang
M, Liu J, Zhang XF, Zhang X, Yin H, et al: FOXM1 promotes
proliferation in human hepatocellular carcinoma cells by
transcriptional activation of CCNB1. Biochem Biophys Res Commun.
500:924–929. 2018. View Article : Google Scholar : PubMed/NCBI
|
|
36
|
Kim SK, Roh YG, Park K, Kang TH, Kim WJ,
Lee JS, Leem SH and Chu IS: Expression signature defined by
FOXM1-CCNB1 activation predicts disease recurrence in
non-muscle-invasive bladder cancer. Clin Cancer Res. 20:3233–3243.
2014. View Article : Google Scholar : PubMed/NCBI
|
|
37
|
Qian X, Song X, He Y, Yang Z, Sun T, Wang
J, Zhu G, Xing W and You C: CCNB2 overexpression is a poor
prognostic biomarker in Chinese NSCLC patients. Biomed
Pharmacother. 74:222–227. 2015. View Article : Google Scholar : PubMed/NCBI
|
|
38
|
Horning AM, Wang Y, Lin CK, Louie AD,
Jadhav RR, Hung CN, Wang CM, Lin CL, Kirma NB, Liss MA, et al:
Single-cell RNA-seq reveals a subpopulation of prostate cancer
cells with enhanced cell-cycle-related transcription and attenuated
androgen response. Cancer Res. 78:853–864. 2018. View Article : Google Scholar
|
|
39
|
Kim Y, Choi JW, Lee JH and Kim YS: Spindle
assembly checkpoint MAD2 and CDC20 overexpressions and cell-in-cell
formation in gastric cancer and its precursor lesions. Hum Pathol.
85:174–183. 2019. View Article : Google Scholar
|
|
40
|
Ding ZY, Wu HR, Zhang JM, Huang GR and Ji
DD: Expression characteristics of CDC20 in gastric cancer and its
correlation with poor prognosis. Int J Clin Exp Pathol. 7:722–727.
2014.PubMed/NCBI
|
|
41
|
Gayyed MF, El-Maqsoud NM, Tawfiek ER, El
Gelany SA and Rahman MF: A comprehensive analysis of CDC20
overexpression in common malignant tumors from multiple organs: Its
correlation with tumor grade and stage. Tumour Biol. 37:749–762.
2016. View Article : Google Scholar
|
|
42
|
Wu F, Lin Y, Cui P, Li H, Zhang L, Sun Z,
Huang S, Li S, Huang S, Zhao Q, et al: Cdc20/p55 mediates the
resistance to docetaxel in castration-resistant prostate cancer in
a Bim-dependent manner. Cancer Chemother Pharmacol. 81:999–1006.
2018. View Article : Google Scholar : PubMed/NCBI
|