Introduction
There were 12,000 cases of head and neck cancer
(HNC) in the UK in 2015 and its incidence is predicted to continue
to increase by 33% between 2014 and 2035 (1). The burden of disease is unequal
within the UK, with the highest incidence being in areas of social
deprivation (1,2). Early detection of HNC reduces
morbidity and mortality rates and decreases the economic burden
placed on the NHS (3). Management
is less invasive when the disease is treated at earlier stages and
results in improved quality of life for patients (4). Patient's displaying symptoms of oral
cancer, who are ultimately diagnosed with the disease, are known to
delay seeking healthcare advice for >1 month in the majority of
cases (56.7%), with 10% waiting over one year (5).
Risk prediction models offer an opportunity to
enhance patient care for HNC. The results from personalised risk
calculators could be used during patient consultations to
communicate levels of risk to individual patients and assist in
counselling on risk behaviours (prevention), whilst also providing
an opportunity to enhance patient awareness of the signs and
symptoms of disease (6), with the
aim of promoting early detection (7). There is also potential for a risk
calculator to be used in clinical trial design to enable
recruitment of sub-groups of patients with the highest risk of
disease. Risk models have been successfully developed and
implemented in this context in other cancer types, such as breast
(8), colorectal (9) and lung cancer (10). Use of risk prediction models to
select individuals at high-risk of lung cancer screening has been
recommended, as this improves cost-effectiveness and reduces the
risk of false-positive diagnoses (11,12).
Therefore, the construction of such risk prediction models for HNC
may be useful in the selection of high-risk individuals who would
benefit the most from screening (12).
The aim of the present study was to develop and
validate the first risk prediction model for HNC in the UK
population, to the best of our knowledge, to estimate absolute risk
of developing the condition.
Materials and methods
Transparent reporting of a multivariable prediction
model for individual prognosis or diagnosis (TRIPOD) guidelines for
development, validation and reporting have been followed (13).
Data source
The risk prediction model was developed using a
nested case-control study within the UK Biobank dataset (14). The UK Biobank recruited over
500,000 individuals aged 40-69 years between 2006 and 2010, in 35
assessment centres. Participants first completed the consent
process via a touch-screen electronic system, allowing for direct
data entry. A touch-screen questionnaire was used to collect the
majority of data. The individuals were asked questions concerning
the following categories: Sociodemographic factors; smoking and
alcohol consumption; sexual history, family history of major
diseases (including diabetes, some cancer types and cardiovascular
disease) and early life factors (for example, infant feeding and
maternal smoking); general health and disability; environmental
factors; dietary habits; physical activity and psychological and
cognitive state. A subsequent computer-assisted personal interview
was conducted by trained assessors based on 'screening' questions
asked as part of the touch-screen questionnaire. For example,
patients who indicated they had a particular medical condition
would be asked follow-up questions on this during the interview. In
addition, the individuals agreed to be followed up via online
questionnaires and via links to national data registries (15). Baseline physical measurements were
also recorded, including blood pressure, weight, height, waist and
hip circumference, bio-impedance (body-fat), hand-grip strength and
bone densitometry were measured.
Outcome
Cases were defined as patients with a diagnosis of
HNC, as defined by International Statistical Classification of
Diseases and Related Health Problems-10 codes C00-14 and C30-31
(16), and this was used as the
outcome measure. Laryngeal cancer was excluded when building this
model, as screening for oral cancers and laryngeal cancers requires
different expertise and laryngeal cancer would not be visible
during routine oral examination. Controls included all participants
of the UK Biobank study who did not have a diagnosis of HNC
recorded in the Cancer Registries data in September 2016 (15). The UK Biobank is linked to the
Cancer Registries and is updated to include newly diagnosed disease
after each study period. Some patients had a diagnosis of HNC prior
to recruitment to the UK Biobank study and others developed the
disease during or after the study period, and only incident cases
of HNC (individuals who developed HNC in the 7 years following
recruitment to the UK Biobank study) were included when developing
the present risk model.
Predictors
The UK Biobank dataset contains 7,800 separate data
entries (variables) for each individual. These were reduced to a
list of ~250 candidate predictors for consideration for the present
risk model, based on known clinical associations with HNC (17). Data regarding age, sex, smoking,
alcohol, diet and exercise, body mass index (BMI), medical history
and social demographics were selected for further analysis, based
on clinical relevance from literature review (18-20)
and feed-back from patients. Human papillomavirus (HPV) infection
is recognised as a risk factor for oropharyngeal cancers (21), but HPV status was not available in
the UK Biobank dataset. However, having ≥ six lifetime sexual
partners is known to be associated with an increased risk of
HPV-associated oropharyngeal cancer (22,23),
therefore this was considered for inclusion as a surrogate marker
of HPV infection for the present model.
Validation dataset
Validation of risk prediction models is of paramount
importance to determine their generalisability in different
populations. Models should be validated in external datasets to
confirm their generalisability and predictive accuracy, before they
are used in clinical practice (24-26).
The North West of England is known to have a higher incidence of
head and neck cancer compared with other parts of the UK (2,27).
For this reason, the cohort dataset was split geographically, into
development and validation sets, to test the model's performance in
a cohort known to have a higher risk of HNC compared with the
cohort used to develop the model (25,28).
All participants recruited at assessment centres in the North West
of England, including Manchester, Liverpool, Bury and Stockport,
were included in the validation dataset. The remaining participants
were retained in the model development dataset. The development
dataset contained 702 cases of head and neck cancer, of which 199
were incident cases and 423,050 controls. The validation dataset
contained 78,895 individuals with 157 cases of HNC, of which 54 are
incident cases.
Statistical analysis
Data handling
Statistical analysis was completed using Stata
version 13 statistical software (StataCorp LLC). Continuous
variables, such as age, were modelled as continuous to prevent
biological implausibility and inefficient use of data (29). However, to facilitate clinical
interpretation, the Townsend Deprivation Index (TDI) variable was
categorised into recognised quintiles 1-5 to allow for more
meaningful analysis and interpretation of results, with 1
representing least deprived (30).
Fruit and vegetable intake was combined and categorised into '<
five per day' and '≥ five per day', in line with current NHS
guidelines that everyone should eat at least five portions (400 g)
of fruit and vegetables every day (31). Exercise was also categorised into
'no exercise' or 'moderate exercise for at least 10 min, 1-4 days
per week' and 'moderate exercise on 5 or more days of the week', in
line with current NHS guidelines on exercise (32).
Missing data
A previous study has shown that irrespective of the
missing data mechanism, complete case analysis does not pose a
major threat to statistical power in datasets with small amounts of
missing data (33). In the present
study, missing data was minimal [<1% for all variables except
exercise (missing data=5.9%)], therefore, complete case analysis
was used. Total numbers for each variable are shown in Table I. The final model was developed
based on 232 incident cases of HNC and 396,947 controls (events per
variable=18).
 | Table IDifference between HNC cases and
controls in the model development and validation datasets. |
Table I
Difference between HNC cases and
controls in the model development and validation datasets.
| Variable | Development data
| Validation data
|
|---|
HNC cases
| Controls
| P-value
| HNC Cases
| Controls
| P-value
|
|---|
| Males | Females | Males | Females | Male | Females | Males | Females | Males | Females | Males | Females |
|---|
| Total number,
na | 440 (62.7) | 262 (37.3) | 191,897 (45.4) | 231,153 (54.6) | - | - | 94 (59.9) | 63 (40.1) | 36,747 (46.7) | 41,991 (53.3) | - | - |
| Total number of
incidence cases of HNC | 165 | 88 | - | - | | | 23 | 31 | - | - | | |
| Age at
recruitmentb | 58 (41-70) | 59 (40-70) | 56 (37-72) | 56 (39-71) | <0.001 | <0.001 | 59.4 (6.5) | 57.0 (7.0) | 56.7 (8.2) | 56.6 (8.0) | 0.003 | 0.697 |
| Smoking
Statusa | | | | | | | | | | | | |
| Never smoked | 143 (32.9) | 119 (45.9) | 93,885 (49.2) | 137,805 (60.0) | <0.001 | <0.001 | 33 (35.1) | 21 (33.3) | 17,435 (47.8) | 24,163 (57.8) | 0.012 | <0.001 |
| Ex-smoker | 201 (46.2) | 113 (43.6) | 73,365 (38.5) | 72,021 (31.3) | | | 50 (53.2) | 34 (54.0) | 14,012 (38.4) | 13,306 (31.8) | | |
| Current
smoker | 91 (20.9) | 27 (10.4) | 2,3449 (12.3) | 20,021 (8.71) | | | 11 (11.7) | 8 (12.7) | 5,066 (13.8) | 4,316 (10.4) | | |
| Missingc | 1 (0.6) | 1 (1.1) | 1,202 (0.6) | 1,308 (0.6) | | | 0 | 0 | 234 (0.6) | 206 (0.5) | | |
| Smoking
durationb,c | 32.8 (13.0) | 29.3 (12.3) | 26.5 (12.9) | 25.2 (12.7) | <0.001 | <0.001 | 30.4 (14.5) | 25.8 (13.2) | 27.4 (12.9) | 26.8 (12.7) | 0.105 | 0.675 |
| Missingc | 22 (13.3) | 14 (15.9) | 28,317 (14.7) | 33,220 (14.4) | | | 4 (12.9) | 2 (8.7) | 5,167 (14.0) | 5,696 (13.6) | | |
| Alcohol
statusa | | | | | | | | | | | | |
| Never | 9 (2.0) | 12 (4.6) | 5,421 (2.8) | 13,846 (6.0) | <0.001 | <0.001 | 2 (2.1) | 1 (1.6) | 1,037 (2.8) | 2,219 (5.3) | 0.035 | 0.274 |
| Previous | 46 (10.5) | 22 (8.4) | 6,765 (3.5) | 8,317 (3.6) | | | 8 (8.5) | 4 (6.4) | 1,309 (3.6) | 1,644 (3.9) | | |
| Current | 385 (87.5) | 228 (87.0) | 179,059 (93.3) | 208,335 (90.1) | | | 84 (89.4) | 58 (92.1) | 34,291 (93.3) | 38,042 (90.1) | | |
| Missingc | 0 | 0 | 652 (0.3) | 665 (0.3) | | | 0 | 0 | 110 (0.3) | 86 (0.2) | | |
| Current alcohol
frequencya,b | | | | | | | | | | | | |
| Daily or almost
daily | 136 (30.9) | 48 (18.3) | 49,388 (25.8) | 38,101 (16.5) | <0.001 | <0.001 | 27 (28.7) | 8 (12.7) | 8,363 (22.8) | 5,721 (13.7) | 0.126 | 0.943 |
| 3-4 times per
week | 92 (20.9) | 55 (21.0) | 49,714 (26.0) | 47,218 (20.5) | | | 17 (18.0) | 16 (25.4) | 9,729 (26.6) | 8,622 (20.6) | | |
| 1-2 times per
week | 94 (21.4) | 56 (21.4) | 48,936 (25.6) | 58,788 (25.5) | | | 29 (30.9) | 16 (25.4) | 10,075 (27.5) | 11,329 (27.0) | | |
| 1-3 times per
month | 28 (6.4) | 29 (11.1) | 17,033 (8.9) | 29,896 (13.0) | | | 5 (5.3) | 7 (11.1) | 3,293 (9.0) | 5,583 (13.3) | | |
| Special
occasions | 35 (8.0) | 40 (15.3) | 13,988 (7.3) | 34,332 (14.9) | | | 6 (6.4) | 11 (17.5) | 2,831 (7.7) | 6,787 (16.2) | | |
| Neverd | 55 (12.5) | 34 (13.0) | 12,186 (6.4) | 22,163 (9.6) | | | 10 (10.6) | 5 (7.9) | 2,346 (6.4) | 3,863 (9.2) | | |
| Missingc | 0 | 0 | 652 (0.3) | 655 (0.3) | | | 0 | 0 | 110 (0.3) | 86 (0.2) | | |
| Body Mass
Indexb | 26.4 (4.5) | 26.1 (5.0) | 27.8 (4.2) | 27.0 (5.2) | <0.001 | 0.004 | 26.7 (3.8) | 26.1 (5.6) | 28.1 (4.4) | 27.4 (5.2) | 0.003 | 0.04 |
| Missing | 1 (0.6) | 0 | 1,355 (0.7) | 1,196 (0.5) | | | 0 | 0 | 290 (0.8) | 263 (0.6) | | |
| Fruit and
vegetablesa, | 309 (70.2) | 212 (80.9) | 152,249 (79.3) | 200,310 (86.7) | <0.001 | 0.006 | 30 (31.9) | 12 (19.1) | 8,469 (23.0) | 6,649 (15.8) | 0.040 | 0.485 |
| ≥5 pieces/day | | | | | | | | | | | | |
| <5
pieces/day | 131 (29.8) | 50 (19.1) | 39,648 (20.7) | 30,843 (13.3) | | | 64 (68.1) | 51 (84.2) | (28,341)
(77.0) | 35,375 (84.2) | | |
| Missing | 0 | 0 | 275 | 168 | | | 0 | 0 | 0 | 0 | | |
| Townsend
Deprivation Indexa | | | | | | | | | | | | |
| 1 | 142 (32.3) | 90 (34.4) | 69,171 (36.1) | 82,830 (35.9)
<0.001 | 0.62 | 31 (33.0) | 23 (36.5) | 13,170 (35.8) | 15151 (36.1) | 0.525 | 0.432 | |
| 2 | 90 (20.4) | 60 (22.9) | 45,201 (23.6) | 55,750 (24.1) | | 17 (18.1) | 15 (23.8) | 8,523 (23.2) | 10147 (24.2) | | | |
| 3 | 69 (15.7) | 47 (17.9) | 33,687 (17.6) | 41,913 (18.2) | | 17 (18.1) | 15 (23.8) | 6,148 (16.7) | 7,244 (17.3) | | | |
| 4 | 77 (17.5) | 37 (14.1) | 26,406 (13.8) | 31,797 (13.8) | | 15 (16.0) | 4 (6.4) | 4,812 (13.1) | 5,538 (13.2) | | | |
| 5 | 62 (14.1) | 28 (10.7) | 17,166 (9.0) | 18,563 (8.0) | | 14 (14.9) | 6 (9.5) | 4,064 (11.1) | 3,880 (9.2) | | | |
| Missing | 0 | 0 | 266 (0.1) | 300 (0.1) | | 0 | 0 | 30 (0.1) | 31 (0.1) | | | |
| Household income, £
per yeara | | | | | | | | | | | | |
| ≤17,999 | 109 (28.4) | 75 (35.1) | 33,918 (19.8) | 45,880 (24.1)
<0.001 | <0.001 | 29 (40.3) | 11 (24.4) | 7,734 (25.3) | 9,470 (29.2) | 0.039 | 0.229 | |
| 18,000-30,999 | 100 (26.0) | 71 (33.2) | 41,177 (24.1) | 49,735 (26.1) | | 12 (16.7) | 19 (42.2) | 8,076 (26.4) | 9,011 (27.8) | | | |
| 31,000-51,999 | 94 (24.5) | 37 (17.3) | 46,075 (26.9) | 48,832 (25.6) | | 19 (26.4) | 7 (15.6) | 7,834 (25.6) | 7,895 (24.3) | | | |
|
52,000-100,000 | 64 (16.7) | 27 (12.6) | 38,807 (22.7) | 36,518 (19.2) | | 10 (13.9) | 6 (13.3) | 5,770 (18.9) | 5,090 (15.7) | | | |
| >100,000 | 17 (4.4) | 4 (1.9) | 11,034 (6.5) | 9,750 (5.1) | | 2 (2.8) | 2 (4.4) | 1,156 (3.8) | 969 (3.0) | | | |
| Missingc | 20 (12.1) | 14 (15.9) | 20,922 (10.9) | 40,472 (17.5) | | 7 (22.6) | 7 (30.4) | 6,192 (16.8) | 9,567 (22.8) | | | |
| Moderate exercise,
days per weeka | | | | | | | | | | | | |
| 0 | 80 (19.5) | 34 (13.6) | 23,823 (13.0) | 26,776 (12.4)
<0.001 | 0.512 | 20 (22.0) | 11 (18.6) | 4,990 (14.3) | 5,445 (13.9) | 0.111 | 0.185 | |
| 1-4 | 159 (38.8) | 128 (51.2) | 85,767 (46.7) | 106,225 (49.0) | | 38 (41.8) | 32 (54.2) | 15,747 (45.1) | 18,702 (47.8) | | | |
| ≥5 | 171 (41.7) | 88 (35.2) | 74,097 (40.3) | 83,824 (38.7) | | 33 (36.2) | 16 (27.1) | 14,179 (40.6) | 14,976 (38.3) | | | |
| Missing | 16 (9.7) | 3 (3.4) | 8,224 (4.3) | 14,337 (6.2) | | 1 (3.2) | 2 (8.7) | 1,833 (5.0) | 2,870 (6.8) | | | |
Model development
Two-tailed unpaired t-tests were used to describe
differences between male and female cases and controls for each
continuous, clinically relevant variable. χ2 tests were
used to test associations between categorical variables (Tables I and SI). P<0.05 was considered to indicate
a statistically significant difference.
Each variable of interest was then tested for an
(unadjusted) association with the outcome, diagnosis of head and
neck cancer, using univariate logistic regression analysis
(Table II). This step was
performed to detect associations, not to aid in variable selection
(34). Final predictors were
selected based on clinical significance with regards to published
literature, as aforementioned, and following discussion with a
local Patient and Public Involvement group (the Liverpool Oral
Medicine Patient Research Forum). The patient group were asked to
identify questions they would be willing to answer to inform
predictor choice, in the context of generating a risk estimate for
developing HNC. Smoking status was included as an indicator of
current or previous smoking experience. Alcohol status was also
used as a reflection of lifetime exposure to alcohol, rather than
current alcohol frequency, which does not consider previous intake
of alcohol. Type of alcohol was also explored but ultimately
excluded from the final model as this cannot be used as a measure
of lifetime exposure.
| Table IIUnivariate analysis of head and neck
cancer risk in the UK Biobank. |
Table II
Univariate analysis of head and neck
cancer risk in the UK Biobank.
| Variable | Odds ratio | 95% confidence
interval | P-value |
|---|
| Age, years | 1.04 | 1.02-1.05 | <0.001 |
| Sex | | | |
| Female | 1 | | |
| Male | 2.26 | 1.74-2.92 | <0.001 |
| Smoking status | | | |
| Never smoked | 1 | | |
| Ex-smoker | 1.95 | 1.46-2.60 | <0.001 |
| Current
Smoker | 4.06 | 2.93-5.61 | <0.001 |
| Alcohol Status | | | |
| Never drinker | 1 | | |
| Previous
drinker | 5.31 | 2.18-13.0 | <0.001 |
| Current
drinker | 1.84 | 0.82-4.13 | 0.141 |
| Alcohol
Frequency | | | |
| Daily | 1 | | |
| 3-4 times per
week | 0.73 | 0.51-1.04 | 0.081 |
| 1-2 times per
week | 0.82 | 0.59-1.15 | 0.267 |
| 1-3 times per
month | 0.42 | 0.24-0.74 | 0.003 |
| Special
occasions | 0.58 | 0.35-0.94 | 0.028 |
| Never | 1.19 | 0.78-1.83 | 0.411 |
| Body Mass
Index | 0.98 | 0.95-1.01 | 0.163 |
| Fruit and vegetable
intake, ≥5 pieces/day | 0.58 | 0.44-0.77 | <0.001 |
| Townsend
Deprivation Index | | | |
| 1 | 1 | | |
| 2 | 1.29 | 0.90-1.82 | 0.25 |
| 3 | 1.21 | 0.82-1.79 | 0.192 |
| 4 | 2.04 | 1.42-2.91 | <0.001 |
| 5 | 2.06 | 1.36-3.12 | 0.001 |
| Household Income, £
per year | | | |
| ≤17,999 | 1 | | |
| 18,000-30,999 | 0.95 | 0.67-1.35 | 0.78 |
| 31,000-51,999 | 0.66 | 0.45-0.97 | 0.032 |
|
52,000-100,000 | 0.65 | 0.43-0.99 | 0.042 |
| >100,000 | 0.64 | 0.33-1.25 | 0.192 |
| Moderate exercise,
number days/week | | | |
| 0 | 1 | | |
| 1-4 | 0.6 | 0.42-0.85 | 0.005 |
| ≥5 | 0.66 | 0.46-0.94 | 0.022 |
Household income was not included in the risk model
as it was not necessary to include two variables measuring
socio-economic deprivation and missing data were greater for
household income. Income only reflects one aspect of deprivation,
whereas the TDI takes into account income as well as car ownership,
education, employment and number of persons per household. TDI is
measured over previously-defined Output Areas, which contain ~125
households (30). Multivariate
logistic regression analysis was then used to develop the final
model (35) with model coefficient
and odds ratio (OR) presented, with 95% confidence intervals.
Model performance was assessed by external
validation using the North West Cohort from the UK Biobank,
according to discrimination and calibration. Discrimination refers
to the model's ability to separate those who develop the disease
from those who do not. This is assessed using the C-statistic/area
under the receiver operating curve (36). A value of 1 indicates perfect
discrimination. Calibration compares observed and expected risks
and was assessed using a calibration plot with points lying close
to the 45-degree line indicating good calibration (37). Bootstrapping was not completed as
the dataset is sufficiently large, with minimal risk of optimism in
predictions due to a good number of events per variable (26,38,39).
Results
Descriptive statistics
Characteristics of all cases and controls are shown
in Table I and differences are
summarised below. Males accounted for 62% of cases (n=165) compared
with 45.4% (n=191,897) of controls (P<0.001). Patients with HNC
were older at recruitment compared with controls [males 58 years
(range, 41-70 years) vs. 56 years (range, 37-72 years); females 59
years (range, 40-70 years) vs. 56 years (39-71 years); P<0.001
both sexes). Male cases were less likely to report 'never smoking'
compared with male controls [32.9% (n=143) of male cases were never
smokers vs. 49.2% (n=93,885) of male controls (P<0.001)].
Amongst females, 45.9% (n=119) of cases are never smokers vs. 60%
(n=137,805) of controls (P<0.001). More detailed measures of
smoking exposure were analysed; however, for smoking duration, the
amount of missing data was high (15.9%), therefore this was
excluded from the risk model.
Male and female cases were significantly more likely
to report daily consumption of alcohol compared with controls
[30.9% (n=136) of male cases vs. 25.8% (n=49,388) of male controls;
P<0.001; 18.3% (n=48) of female cases vs. 16.5% (n=38,101) of
female controls; P<0.001]. Further detail on consumption of
different types of alcohol can be found in Table SI. Significantly more male and
female cases reported drinking 'less alcohol now compared to 10
years previously' (P<0.017 and <0.001 for males) (data not
shown).
Male and female cases had significantly lower BMI
compared with controls [mean 26.4 vs. 27.8 for males (P<0.001);
26.1 vs. 27.0 for females (P=0.004), respectively]. Fruit and
vegetable consumption was lower amongst male and female cases
compared with controls; 29.8% (n=131) of male cases consumed <5
pieces of fruit and vegetables per day vs. 20.7% (n=39,648) of
controls; P<0.001. The figures for female cases are 19.1% (n=50)
vs. 13.3% n=30,843 in controls (P=0.006). In total, 31.6% (n=139)
of male cases were in most-socioeconomically deprived groups
(Townsend IV and V) vs. 22.8% of controls (n=43,572; P<0.001).
In addition, 19.5% of males (n=80) reported 0 days of exercise per
week vs. 13% of controls (n=28,823; P<0.001).
Univariate analysis
The results of the univariate (unadjusted) analysis
are shown in Table II. Increasing
age, male sex, current or previous smoking, current and previous
alcohol consumption and residence in an area of deprivation (TDI 4
or 5) were associated with increased risk of HNC. Eating greater ≥
five pieces of fruit and vegetables per day and partaking in
moderate exercise at least once per week was associated with a
protective effect against HNC. A household income of
£31,000-100,000 per annum (compared with <£18,000) was also
protective. Consuming alcohol only one to three times monthly or
only on special occasions was significantly protective against HNC,
when compared with daily drinking.
Data on number of sexual partners was missing in 21%
(n=64) of cases (data not shown) and there was no significant
difference in mean lifetime number of sexual partners on
univariable analysis (OR=1.00; 95% CI 0.99-1.00; P=0.656),
therefore this variable was excluded from the model.
Multivariate model
Table III shows
the ORs for predictors in the multivariate model. Older age and
male sex were significantly associated with increased risk of HNC,
with 4% increased risk with every increasing year of age (OR=1.04;
95% CI, 1.02-1.05). Males had nearly twice the risk of HNC compared
with females (OR=1.81; 95% CI, 1.38-2.38). Living in an area of
social deprivation (TDI group 4 or 5) was associated with an
increased risk of HNC (OR=1.81; 95% CI 1.25-2.63 for TDI group 4).
Eating at least five portions of fruit or vegetables per day
offered a significant protective effect against HNC (OR=0.71; 95%
CI, 0.53-0.97), as did partaking in moderate exercise at least once
per week (OR=0.68; 95% CI, 0.47-0.98) and five or more times per
week (OR=0.66; 95% CI, 0.46-0.96). Higher BMI also conferred a
protective effect (OR=0.96; 95% CI, 0.93-0.99).
| Table IIIMultivariable model for head and neck
cancer risk in the UK Biobank. |
Table III
Multivariable model for head and neck
cancer risk in the UK Biobank.
| Variable | Odds ratio | P-value | 95% confidence
interval |
|---|
| Age, years | 1.04 | <0.001 | 1.02 | 1.05 |
| Sex | | | | |
| Female | 1 | | | |
| Male | 1.81 | <0.001 | 1.38 | 2.38 |
| Smoking status | | | | |
| Never | 1 | | | |
| Previous | 1.59 | 0.003 | 1.17 | 2.15 |
| Current | 3.1 | <0.001 | 2.17 | 4.4 |
| Townsend
deprivation index | | | | |
| 1 | 1 | | | |
| 2 | 1.3 | 0.177 | 0.9 | 1.81 |
| 3 | 1.14 | 0.499 | 0.77 | 1.7 |
| 4 | 1.81 | 0.001 | 1.25 | 2.63 |
| 5 | 1.66 | 0.02 | 1.08 | 2.56 |
| Body Mass
Index | 0.96 | 0.011 | 0.93 | 0.99 |
| Alcohol
consumption | | | | |
| Never | 1 | | | |
| Previous | 3.26 | 0.01 | 1.32 | 8.04 |
| Current | 1.42 | 0.406 | 0.62 | 3.21 |
| Moderate Exercise,
number of days per week | | | | |
| 0 | 1 | | | |
| 1-4 | 0.68 | 0.04 | 0.47 | 0.98 |
| ≥5 | 0.66 | 0.03 | 0.46 | 0.95 |
| Fruit and vegetable
intake per day | | | | |
| <5 | 1 | | | |
| ≥5 | 0.71 | 0.031 | 0.53 | 0.97 |
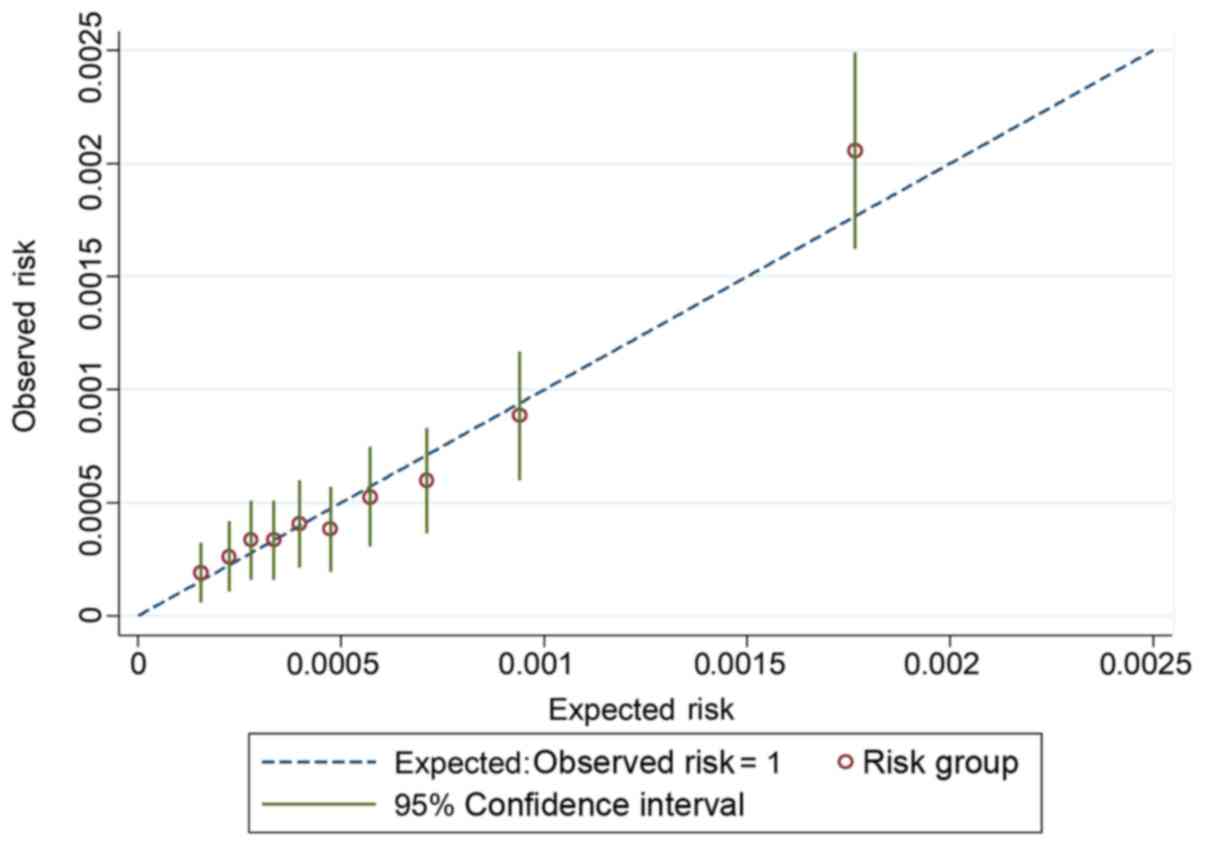
Model performance
Discrimination, as measured by the C-statistic, was
0.69 (95% CI, 0.66-0. 71), which demonstrated that the model was
better compared with chance at predicting a case of HNC. The
calibration plot is shown in Fig.
1. Expected and observed risk are plotted for ten risk groups,
and the model displays good calibration. The 45-degree line
indicates perfect calibration. CIs are narrow, due to the large
number of participants. Most of the deciles are clustered close to
the left side of the graph, indicating the very low risk of head
and neck cancer in the general population.
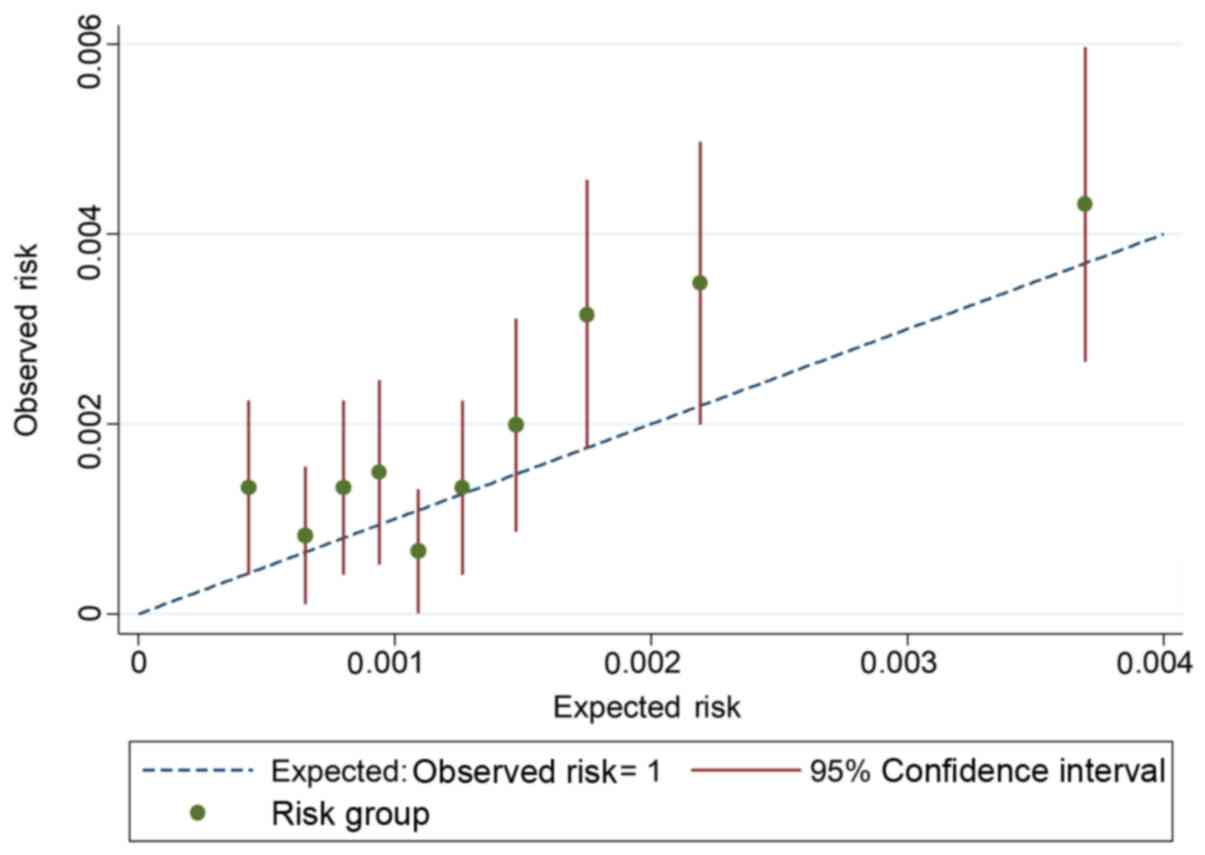
External validation in the North West
cohort
Characteristics of cases and controls within the
validation dataset are presented in Table I. The prevalence of HNC in this
population was 198 per 100,000 compared with 165 per 100,000 in the
development dataset, indicating the higher risk of disease in this
population. In total, 60,240 individuals (76.4%) were available for
complete case analysis (contained no missing data). The C-statistic
for the model in the validation data is 0.64 (95% CI, 0.60-0.68)
(Table III), which shows that
the model is better than chance at predicting the outcome. This
value was close to the C-statistic obtained from apparent
discrimination indicating the performance was similar in the
validation dataset. The risk of disease was very low and the
observed and expected probabilities are close to the reference
line, demonstrating reasonable calibration. The calibration slope
was 0.83 and the calibration plot (Fig. 2) showed several data points lying
above the reference line, which demonstrated that the model
slightly under-predicted risk of head and neck cancer.
Discussion
The present study developed and validated of a risk
prediction model for HNC using the UK Biobank dataset, with the aim
of highlighting the potential for the use of risk prediction models
within HNC. This risk model allows the calculation of an individual
risk score for development of HNC.
The model performance was good in terms of its
ability to discriminate between cases and controls
(C-statistic=0.69) and displayed good calibration. The model was
validated in a sub-group of individuals from the North West of
England, known to have a higher incidence of HNC (2). The performance of the model in this
external validation was reasonable, with a C-statistic of 0.64 and
a calibration slope of 0.67. Further validation should be performed
using a truly independent dataset, to confirm the transportability
of the present model to other populations. This C-statistic
indicates good discrimination of the model but there is potential
for improvement. For example, Lee et al reported area under
the curve values (compared with the C-statistic) of 0.701-0.798 for
a risk prediction models for oral and oropharyngeal cancer for men
and women in the US population (40). The better performance compared with
the present study may be attributed to the much larger sample size
in their cohort.
Risk prediction modelling has been identified as an
area of opportunity for early detection of cancer by the National
Cancer Institute (41). The power
of big data is increasingly recognised (42), and analysis of large population
databases allows predictions to be made regarding the development
of specific diseases in individuals, based on demographics and risk
behaviours (42). Risk models have
been shown to improve selection criteria for lung cancer screening
programmes (12), for example the
Liverpool Lung Project risk model (10) is currently used to guide
recruitment of individuals at a high-risk of lung cancer to the UK
Lung Cancer Screening trial (43).
This demonstrates that with proper development, validation and
implementation, risk models can be of benefit to both physicians
and patients for numerous diseases, including HNC.
Increasing age, male sex, smoking and alcohol
consumption are well established risk factors for HNC (20,44,45),
and these were confirmed by the present study. Previous alcohol
consumption was identified as a risk factor for HNC in the present
study. Alcohol is a recognised risk factor for HNC, particularly
when combined with either current or previous history of smoking
(18,19). The present study reveals previous
consumption of alcohol appears to be a greater risk factor for HNC
compared with current drinking. It is possible that those currently
not drinking have stopped consuming alcohol for health-related
reasons, for example alcoholic liver disease. The UK Biobank does
not contain data regarding lifetime alcohol consumption, therefore
this is a limitation of the present study. However, a significantly
greater number of male and female cases reported drinking 'less
alcohol now than 10 years previously' compared with controls (see
results), which suggested a pattern of previous higher alcohol
consumption amongst HNC cases.
Consuming at least five portions of fruit and
vegetables (combined) per day is protective against HNC. Chuang
et al have also published evidence of the protective effect
of fruit and vegetables on the risk of HNC (46). Their study used the international
INHANCE (International Head and Neck Cancer Epidemiology)
consortium of studies with 14,520 cases and 22,737 controls;
Consuming fruit 7 or more times per week offered a protective
effect of 48% [OR 0.52 (95% CI, 0.43-0.62)] and vegetables OR 0.66
(95% CI, 0.49-0.90). This may be due to the antioxidant effects of
fruits and vegetables as reactive oxygen species (ROS)-mediated
DNA-damage is known to be a significant factor in carcinogenesis
(47). Antioxidants are involved
in the prevention of cellular and tissue damage caused by ROS and
therefore have a well-established role in cancer prevention
(48).
BMI has been investigated in association with HNC
risk, with mixed results (49).
The present study reported that increasing BMI confers a protective
effect against HNC. A pooled analysis of 17 international studies
also appeared to show a protective effect of higher BMI against HNC
amongst smokers and consumers of alcohol (BMI >30; OR=0.38; 95%
CI, 0.30-0.49); however, this protective effect was not significant
for never smokers (OR=0.95; 95% CI, 0.47-1.91) (40). A similar tendency for leanness (BMI
<25) has been noted in other smoking-related malignancies, such
as lung and oesophageal cancer (50). The reason for this is unclear;
however, this could be explained by residual confounding by smoking
or another risk factor, reverse causation or a true effect. Smokers
with lower BMI have been found to have higher levels of
8-hydroxydeoxyguanosin, a marker of oxidative DNA damage (51), which is associated with increased
risk of various cancer types, including breast, lung, prostate and
bladder cancer (52).
Hashibe et al investigated risk factors for
HNC within prostate, lung, colorectal and ovarian cancer
(n=101,182) and demonstrated that physical activity for >3 h per
week offered a protective effect against HNC of ~40% (OR=0.58; 95%
CI, 0.35-0.96) (20). The present
study also reported that moderate exercise, for at least ten
minutes, at least once per week, offers a protective effect against
HNC. Current NHS guidelines recommend moderate exercise for 150 min
per week and strength exercises on ≥2 days per week. The guidance
suggests that one way to do the recommended 150 min of weekly
physical activity is to do 30 min on 5 days every week (32).
This study has confirmed a role for social
deprivation in HNC, with those living in deprived areas (TDI 4)
having an increased risk of developing HNC compared with those
people living in the most affluent areas (TDI 1). This supports a
previous study which demonstrates HNC is more common in lower
socio-economic groups and those with lower educational attainment
compared with those in higher socio-economic groups (OR=1.9; 95%
CI, 1.6-2.3) (53). This
highlights the issue of social inequality in HNC that has been
identified by the International Association for Cancer Research as
a research priority (54).
It was not possible to separate HNC cases associated
with HPV status, as this information is not captured by ICD-10
codes for head and neck cancer types. A future model for risk of
HPV-associated HNC should be considered, if a suitable dataset were
to become available. The present model is intended for use in
primary care and it is unlikely that a patient's HPV status would
be available for entry into a risk calculator, therefore HPV-status
would not be a helpful addition to the risk prediction model in
this context (40).
A limitation of the present study was that data
regarding family history of HNC was not available from the UK
Biobank, therefore this could not be considered as a potentially
relevant risk factor. In addition, the majority of participants
within the UK Biobank were born in the UK or Republic of Ireland
(93.3% of cases and 92.6% of controls), which may limit the
application of the present model outside to these populations. The
model could be externally validated in other populations to test
its transportability, if a suitable database were available.
General dental practitioners are required to screen
all patients for oral cancer (55). Using a personalised risk estimate
could identify high-risk patients and support discussions between
dental professionals and patients regarding risk behaviours, such
as smoking and alcohol consumption. This would also provide the
opportunity to discuss health promoting behaviours, such as eating
fresh fruit and vegetables and taking regular exercise. There is
evidence from a randomized controlled trial that use of a risk
score when providing smoking cessation advice results in longer
term success with smoking cessation (6).
In future, a web-based tool could be co-designed by
patients and clinicians to allow easy generation of the risk score.
Feasibility and clinical utility studies would be required to test
whether the present HNC risk model is well-received by clinicians
and patients. An impact study could then be completed to assess the
effect on smoking cessation rates and other risk behaviours.
To the best of our knowledge, the present study was
the first to develop and validate a risk model for head and neck
cancer in the UK population, using statistical methodology
developed according to TRIPOD guidelines (13). The model provides the opportunity
to calculate a risk score, which can be used to discuss
personalised risk of HNC with patients. This foundation could be
built upon by including salivary biomarkers (56,57)
such as loss of heterozygosity at 9p, 17p and 4q (58), in future iterations of the model.
Risk prediction modelling is currently under-utilised in HNC
research; there is great potential to build, validate and implement
risk calculators in several areas of HNC clinical practice. The
model developed should be further assessed for clinical utility
particularly for its suitability to screen individuals at high-risk
of HNC and recruit them to clinical trials, as well as to guide
dental practitioners when counselling patients on risk
behaviours.
Supplementary Data
Funding
Laura Bonnett was funded by a National Institute for
Health Research (NIHR) Post-Doctoral Fellowship (grant no.
PDF-2015-08-044) for this research project. Caroline McCarthy was
funded by a NIHR Academic Clinical Fellowship in Oral Medicine.
Availability of data and materials
The data that support the findings of this study are
available on application from the UK Biobank but restrictions apply
to the availability of these data, which were used under license
for the current study, and so are not publicly available.
Authors' contributions
JKF and MWM developed the concept for the head and
neck cancer risk prediction model. CEM undertook the preparation of
the UK Biobank dataset for the analysis, discussed risk parameters
with patients with head and neck cancer and those at risk,
completed the statistical analysis and drafted the manuscript. LJB
and MWM designed the methodology, supported the statistical
analysis and assisted with manuscript editing. JKF helped
critically revise the manuscript for important intellectual content
and super-vised the analysis. All authors read and approved the
final manuscript.
Ethics approval and consent to
participate
The Research Ethics Committee reference for UK
Biobank is 16/NW/0274.
Patient consent for publication
Not applicable.
Competing interests
The authors declare that they have no competing
interests.
Abbreviations:
|
HNC
|
head and neck cancer
|
|
BMI
|
body mass index
|
|
NHS
|
National Health Service
|
Acknowledgments
The authors would like to thank Professor Stephen
Duffy (Centre for Cancer Prevention, Queen Mary University of
London) for his invaluable advice regarding the methodology for
this study.
References
|
1
|
Smittenaar CR, Petersen KA, Stewart K and
Moitt N: Cancer incidence and mortality projections in the UK until
2035. Br J Cancer. 115:1147–1155. 2016. View Article : Google Scholar : PubMed/NCBI
|
|
2
|
Taib BG, Oakley J, Dailey Y, Hodge I,
Wright P, du Plessis R, Rylands J, Taylor-Robinson D, Povall S,
Schache A, et al: Socioeconomic deprivation and the burden of head
and neck cancer-regional variations of incidence and mortality in
mersey-side and cheshire, North West, England. Clin Otolaryngol.
43:846–853. 2018. View Article : Google Scholar : PubMed/NCBI
|
|
3
|
Brocklehurst P, Kujan O, O'Malley LA,
Ogden G, Shepherd S and Glenny AM: Screening programmes for the
early detection and prevention of oral cancer. Cochrane Database
Syst Rev. 19:CD0041502013.
|
|
4
|
van der Waal I: Are we able to reduce the
mortality and morbidity of oral cancer; some considerations. Med
Oral Patol Oral Cir Bucal. 18:e33–e37. 2013. View Article : Google Scholar :
|
|
5
|
Friedrich RE: Delay in diagnosis and
referral patterns of 646 patients with oral and maxillofacial
cancer: A report from a single institution in Hamburg, Germany.
Anticancer Res. 30:1833–1836. 2010.PubMed/NCBI
|
|
6
|
Sherratt FC, Marcus MW, Robinson J and
Field JK: Utilizing lung cancer risk prediction models to promote
smoking cessation: Two randomized controlled trials. Am J Health
Promot. 32:1196–1205. 2018. View Article : Google Scholar
|
|
7
|
World Health Organisation: Guide to cancer
early diagnosis. 2017
|
|
8
|
Pfeiffer RM, Park Y, Kreimer AR, Lacey JV
Jr, Pee D, Greenlee RT, Buys SS, Hollenbeck A, Rosner B, Gail MH
and Hartge P: Risk prediction for breast, endometrial, and ovarian
cancer in white women aged 50 year or older: Derivation and
validation from population-based cohort studies. PLoS Med.
10:e10014922013. View Article : Google Scholar
|
|
9
|
Tammemagi CM, Pinsky PF, Caporaso NE,
Kvale PA, Hocking WG, Church TR, Riley TL, Commins J, Oken MM, Berg
CD and Prorok PC: Lung cancer risk prediction: Prostate, lung,
colorectal and ovarian cancer screening trial models and
validation. J Natl Cancer Inst. 103:1058–1068. 2011. View Article : Google Scholar : PubMed/NCBI
|
|
10
|
Marcus MW, Chen Y, Raji OY, Duffy SW and
Field JK: LLPi: Liverpool lung project risk prediction model for
lung cancer incidence. Cancer Prev Res (Phila). 8:570–575. 2015.
View Article : Google Scholar
|
|
11
|
Ten Haaf K, Jeon J, Tammemägi MC, Han SS,
Kong CY, Plevritis SK, Feuer EJ, de Koning HJ, Steyerberg EW and
Meza R: Risk prediction models for selection of lung cancer
screening candidates: A retrospective validation study. PLoS Med.
14:e10022772017. View Article : Google Scholar : PubMed/NCBI
|
|
12
|
Tammemagi MC, Schmidt H, Martel S,
McWilliams A, Goffin JR, Johnston MR, Nicholas G, Tremblay A,
Bhatia R, Liu G, et al: Participant selection for lung cancer
screening by risk modelling [the Pan-Canadian Early Detection of
Lung Cancer (PanCan) study]: A single-arm, prospective study.
Lancet Oncol. 18:1523–1531. 2017. View Article : Google Scholar : PubMed/NCBI
|
|
13
|
Collins GS, Reitsma JB, Altman DG and
Moons KG: Transparent reporting of a multivariable prediction model
for individual prognosis or diagnosis (TRIPOD): The TRIPOD
statement. Br J Cancer. 112:251–259. 2015. View Article : Google Scholar : PubMed/NCBI
|
|
14
|
UK Biobank: Protocol for a large-scale
prospective epidemiological resource. 2007.
|
|
15
|
Public Health England (PHE): National
Cancer Registration and Analysis Service. https://www.gov.uk/guidance/national-cancer-regis-tration-and-analysis-service-ncrasuri.
Accessed November 3, 2016.
|
|
16
|
World Health Organisation (WHO):
International statistical classification of diseases and related
health problems, 10th revision (ICD-10). 2. 5th edition. WHO;
Geneva: 2016
|
|
17
|
Hashim D, Genden E, Posner M, Hashibe M
and Boffetta P: Head and neck cancer prevention: From primary
prevention to impact of clinicians on reducing burden. Ann Oncol.
30:744–756. 2019. View Article : Google Scholar : PubMed/NCBI
|
|
18
|
Hashibe M, Brennan P, Benhamou S,
Castellsague X, Chen C, Curado MP, Dal Maso L, Daudt AW, Fabianova
E, Fernandez L, et al: Alcohol drinking in never users of tobacco,
cigarette smoking in never drinkers, and the risk of head and neck
cancer: Pooled analysis in the international head and neck cancer
epidemiology consortium. J Natl Cancer Inst. 99:777–789. 2007.
View Article : Google Scholar : PubMed/NCBI
|
|
19
|
Hashibe M, Brennan P, Chuang SC, Boccia S,
Castellsague X, Chen C, Curado MP, Dal Maso L, Daudt AW, Fabianova
E, et al: Interaction between tobacco and alcohol use and the risk
of head and neck cancer: Pooled analysis in the international head
and neck cancer epidemiology consortium. Cancer Epidemiol
Biomarkers Prev. 18:541–550. 2009. View Article : Google Scholar : PubMed/NCBI
|
|
20
|
Hashibe M, Hunt J, Wei M, Buys S, Gren L
and Lee YC: Tobacco, alcohol, body mass index, physical activity,
and the risk of head and neck cancer in the prostate, lung,
colorectal, and ovarian (PLCO) cohort. Head Neck. 35:914–922. 2013.
View Article : Google Scholar
|
|
21
|
Shaw R and Beasley N: Aetiology and risk
factors for head and neck cancer: United Kingdom national
multidisciplinary guide-lines. J Laryngol Otol. 130(Suppl 2):
S9–S12. 2016. View Article : Google Scholar :
|
|
22
|
D'Souza G, McNeel TS and Fakhry C:
Understanding personal risk of oropharyngeal cancer: Risk-groups
for oncogenic oral HPV infection and oropharyngeal cancer. Ann
Oncol. 28:3065–3069. 2017. View Article : Google Scholar : PubMed/NCBI
|
|
23
|
Heck JE, Berthiller J, Vaccarella S, Winn
DM, Smith EM, Shan'gina O, Schwartz SM, Purdue MP, Pilarska A,
Eluf-Neto J, et al: Sexual behaviours and the risk of head and neck
cancers: A pooled analysis in the international head and neck
cancer epidemiology (INHANCE) consortium. Int J Epidemiol.
39:166–181. 2010. View Article : Google Scholar :
|
|
24
|
Heus P, Damen JAAG, Pajouheshnia R,
Scholten RJPM, Reitsma JB, Collins GS, Altman DG, Moons KGM and
Hooft L: Poor reporting of multivariable prediction model studies:
Towards a targeted implementation strategy of the TRIPOD statement.
BMC Med. 16:1202018. View Article : Google Scholar : PubMed/NCBI
|
|
25
|
Moons KG, Kengne AP, Grobbee DE, Royston
P, Vergouwe Y, Altman DG and Woodward M: Risk prediction models:
II. External validation, model updating, and impact assessment.
Heart. 98:691–698. 2012. View Article : Google Scholar : PubMed/NCBI
|
|
26
|
Riley RD, Ensor J, Snell KI, Debray TP,
Altman DG, Moons KG and Collins GS: External validation of clinical
prediction models using big datasets from e-health records or IPD
meta-analysis: Opportunities and challenges. BMJ. 353:i31402016.
View Article : Google Scholar : PubMed/NCBI
|
|
27
|
McCarthy CE, Field JK, Rajlawat BP, Field
AE and Marcus MW: Trends and regional variation in the incidence of
head and neck cancers in England: 2002 to 2011. Int J Oncol.
47:204–210. 2015. View Article : Google Scholar : PubMed/NCBI
|
|
28
|
Steyerberg EW, Vickers AJ, Cook NR, Gerds
T, Gonen M, Obuchowski N, Pencina MJ and Kattan MW: Assessing the
performance of prediction models: A framework for traditional and
novel measures. Epidemiology. 21:128–138. 2010. View Article : Google Scholar
|
|
29
|
Collins GS, Ogundimu EO, Cook JA, Manach
YL and Altman DG: Quantifying the impact of different approaches
for handling continuous predictors on the performance of a
prog-nostic model. Stat Med. 35:4124–4135. 2016. View Article : Google Scholar : PubMed/NCBI
|
|
30
|
Townsend P: Deprivation. J Soc Policy.
16:125–146. 1987. View Article : Google Scholar
|
|
31
|
NHS: Why 5 a day? 2018, https://www.nhs.uk/live-well/eat-well/why-5-a-day/uri.
Accessed October 8, 2018.
|
|
32
|
NHS: Physical activity guidelines for
older adults. 2018, https://www.nhs.uk/live-well/exercise/physical-activity-guidelines-older-adults/uri.
Accessed October 8, 2019.
|
|
33
|
Little RJB and Rubin DB: Statistical
analysis with missing data. 2nd edition. John Wiley & Sons,
Inc; Hoboken: 2014
|
|
34
|
Heinze G, Wallisch C and Dunkler D:
Variable selection-A review and recommendations for the practicing
statistician. Biom J. 60:431–449. 2018. View Article : Google Scholar : PubMed/NCBI
|
|
35
|
Hosmer DW and Lemeshow S: Applied logistic
regression. John Wiley & Sons, Inc; New York, NY: 1989
|
|
36
|
Steyerberg EW, Harrell FE Jr, Borsboom GJ,
Eijkemans MJ, Vergouwe Y and Habbema JD: Internal validation of
predictive models: Efficiency of some procedures for logistic
regression analysis. J Clin Epidemiol. 54:774–781. 2001. View Article : Google Scholar : PubMed/NCBI
|
|
37
|
Van Calster B, Nieboer D, Vergouwe Y, De
Cock B, Pencina MJ and Steyerberg EW: A calibration hierarchy for
risk models was defined: From utopia to empirical data. J Clin
Epidemiol. 74:167–176. 2016. View Article : Google Scholar : PubMed/NCBI
|
|
38
|
Smith GC, Seaman SR, Wood AM, Royston P
and White IR: Correcting for optimistic prediction in small data
sets. Am J Epidemiol. 180:318–324. 2014. View Article : Google Scholar : PubMed/NCBI
|
|
39
|
van der Ploeg T, Austin PC and Steyerberg
EW: Modern model-ling techniques are data hungry: A simulation
study for predicting dichotomous endpoints. BMC Med Res Methodol.
14:1372014. View Article : Google Scholar
|
|
40
|
Lee YA, Al-Temimi M, Ying J, Muscat J,
Olshan AF, Zevallos JP, Winn DM, Li G, Sturgis EM, Morgenstern H,
et al: Head and neck cancer risk prediction models for the US
population from the INHANCE consortium. Am J Epidemiol.
189:3302020. View Article : Google Scholar
|
|
41
|
Gail MH, Brinton LA, Byar DP, Corle DK,
Green SB, Schairer C and Mulvihill JJ: Projecting individualized
probabilities of developing breast cancer for white females who are
being examined annually. J Natl Cancer Inst. 81:1879–1886. 1989.
View Article : Google Scholar : PubMed/NCBI
|
|
42
|
Chawla NV and Davis DA: Bringing big data
to personalized healthcare: A patient-centered framework. J Gen
Intern Med. 28(Suppl 3): S660–S665. 2013. View Article : Google Scholar : PubMed/NCBI
|
|
43
|
Field JK, Duffy SW, Baldwin DR, Brain KE,
Devaraj A, Eisen T, Green BA, Holemans JA, Kavanagh T, Kerr KM, et
al: The UK lung cancer screening trial: A pilot randomised
controlled trial of low-dose computed tomography screening for the
early detection of lung cancer. Health Technol Assess. 20:1–146.
2016. View Article : Google Scholar : PubMed/NCBI
|
|
44
|
Winn DM, Lee YC, Hashibe M and Boffetta P;
INHANCE consortium: The INHANCE consortium: Toward a better
under-standing of the causes and mechanisms of head and neck
cancer. Oral Dis. 21:685–693. 2015. View Article : Google Scholar : PubMed/NCBI
|
|
45
|
Beynon RA, Lang S, Schimansky S, Penfold
CM, Waylen A, Thomas SJ, Pawlita M, Waterboer T, Martin RM, May M
and Ness AR: Tobacco smoking and alcohol drinking at diagnosis of
head and neck cancer and all-cause mortality: Results from head and
neck 5000, a prospective observational cohort of people with head
and neck cancer. Int J Cancer. 143:1114–1127. 2018. View Article : Google Scholar : PubMed/NCBI
|
|
46
|
Chuang SC, Jenab M, Heck JE, Bosetti C,
Talamini R, Matsuo K, Castellsague X, Franceschi S, Herrero R, Winn
DM, et al: Diet and the risk of head and neck cancer: A pooled
analysis in the INHANCE consortium. Cancer Causes Control.
23:69–88. 2012. View Article : Google Scholar
|
|
47
|
Ziech D, Franco R, Pappa A and
Panayiotidis MI: Reactive oxygen species (ROS)-induced genetic and
epigenetic alterations in human carcinogenesis. Mutat Res.
711:167–173. 2011. View Article : Google Scholar : PubMed/NCBI
|
|
48
|
Choudhari SK, Chaudhary M, Gadbail AR,
Sharma A and Tekade S: Oxidative and antioxidative mechanisms in
oral cancer and precancer: A review. Oral Oncol. 50:10–18. 2014.
View Article : Google Scholar
|
|
49
|
Gaudet MM, Olshan AF, Chuang SC,
Berthiller J, Zhang ZF, Lissowska J, Zaridze D, Winn DM, Wei Q,
Talamini R, et al: Body mass index and risk of head and neck cancer
in a pooled analysis of case-control studies in the international
head and neck cancer epidemiology (INHANCE) consortium. Int J
Epidemiol. 39:1091–1102. 2010. View Article : Google Scholar : PubMed/NCBI
|
|
50
|
Bhaskaran K, Douglas I, Forbes H,
dos-Santos-Silva I, Leon DA and Smeeth L: Body-mass index and risk
of 22 specific cancers: A population-based cohort study of 5.24
million UK adults. Lancet. 384:755–765. 2014. View Article : Google Scholar : PubMed/NCBI
|
|
51
|
Mizoue T, Kasai H, Kubo T and Tokunaga S:
Leanness, smoking, and enhanced oxidative DNA damage. Cancer
Epidemiol Biomarkers Prev. 15:582–585. 2006. View Article : Google Scholar : PubMed/NCBI
|
|
52
|
Wu LL, Chiou CC, Chang PY and Wu JT:
Urinary 8-OHdG: A marker of oxidative stress to DNA and a risk
factor for cancer, atherosclerosis and diabetics. Clin Chim Acta.
339:1–9. 2004. View Article : Google Scholar
|
|
53
|
Radoi L and Luce D: A review of risk
factors for oral cavity cancer: The importance of a standardized
case definition. Community Dent Oral Epidemiol. 41:97–109. e78–e91.
2013. View Article : Google Scholar
|
|
54
|
International Agency for Research on
Cancer (IARC): Reducing social inequalities in cancer: Evidence and
priorities for research. (IARC Scientific Publication No. 168).
Vaccarella S, Lortet-Tieulent J, Saracci R, Conway DI, Straif K and
Wild CP: IARC; Lyon, France: 2019
|
|
55
|
Faculty of general dental practice (UK):
Standards in Dentistry. 2018.
|
|
56
|
Achalli S, Madi M, Babu SG, Shetty SR,
Kumari S and Bhat S: Sialic acid as a biomarker of oral potentially
malignant disorders and oral cancer. Indian J Dent Res. 28:395–399.
2017. View Article : Google Scholar : PubMed/NCBI
|
|
57
|
Kallalli BN, Rawson K, Muzammil, Singh A,
Awati MA and Shivhare P: Lactate dehydrogenase as a biomarker in
oral cancer and oral submucous fibrosis. J Oral Pathol Med.
45:687–690. 2016. View Article : Google Scholar : PubMed/NCBI
|
|
58
|
Rock LD, Rosin MP, Zhang L, Chan B,
Shariati B and Laronde DM: Characterization of epithelial oral
dysplasia in non-smokers: First steps towards precision medicine.
Oral Oncol. 78:119–125. 2018. View Article : Google Scholar : PubMed/NCBI
|