Introduction
Renal cell carcinoma (RCC) is one of the most common
malignant tumors of the urinary system, accounting for 2-3% of
adult malignancies (1). The
incidence of RC is increasing each year (2). The early diagnosis of RCC is
challenging; 20-30% of patients with RCC are diagnosed with
metastases at the time of initial diagnosis (3-5).
Surgical resection remains the most effective treatment for
early-stage RCC, while immunotherapy and radiotherapy are commonly
used for advanced-stage carcinoma. However, these treatment methods
are associated with severe side-effects (6,7).
Recently, targeted therapy has become increasingly popular for
treating patients with RCC.
The receptor tyrosine kinase inhibitors (TKIs)
represented by sunitinib are the first-line treatment approach for
advanced-stage RCC (4). Sunitinib
is known to exhibit antitumor and anti-angiogenic activities. It
blocks vascular endothelial growth factor receptor (VEGFR),
platelet-derived growth factor receptor (PDGFR), KIT and other
important molecules affecting cell growth and survival (8-11).
Although targeted drugs have greatly improved the therapeutic
prospects of advanced-stage RCC, drug resistance has gradually
reduced the clinical effects of targeted drugs. Approximately 20%
of patients with RCC prescribed with sunitinib have been reported
to develop innate resistance, while the majority of patients
develop secondary resistance after 6-11 months (12,13). The molecular and biological
mechanisms involved in sunitinib resistance remain unclear, and
there are no effective biomarkers for predicting resistance, at
least to the best of our knowledge.
In a previous study, the authors screened out the
protein glutaminyl-peptide cyclotransferase (QPCT), which is
closely related to sunitinib resistance in RCC, using
high-throughput sequencing data and subsequent validation
experiments (14). The QPCT gene
encodes glutamyl peptidyltransferase, which modifies the protein by
transforming N-terminal glutamic acid into pyroglutamine. This
renders proteins more resistant to protease degradation, becoming
more hydrophobic and neurotoxic, and thus easier to aggregate
(15). In the present study, in
order to further elucidate the molecular mechanisms responsible for
sunitinib resistance in RCC, sunitinib-non-responsive and
-responsive RCC tissue and plasma samples were collected, and
additional experiments were performed to elucidate the molecular
mechanisms responsible for sunitinib resistance in RCC.
Materials and methods
Patients with RCC and clinical
samples
Patients with RCC who underwent surgical resection
prior to receiving adjuvant therapy at Jinling Hospital (Nanjing,
China) from 2010 to 2018 were enrolled in the present study. All
patients signed informed consent forms before participating in the
study, and the study was approved by the Ethics Committee of
Jinling Hospital. The accession number for this approval was
2020DZGZRZX-008. The expression of QPCT was detected in 20 pairs of
sunitinib-resistant and -sensitive RCC tissues. The details of the
patients are presented in Table
SI.
To investigate the association between QPCT
expression and sunitinib responsivity, tissue samples were
collected from 128 patients (including the 20 pairs of
sunitinib-resistant and -sensitive RCC tissues mentioned in
Table SI) with advanced clear
cell RCC (ccRCC) who received no other treatment between July, 2010
and February, 2018. The sunitinib group (n=72) received at least
two cycles of targeted therapy, while the control group (n=56)
received no treatment. These ccRCC tissues were constructed into a
tissue microarray, and the expression of QPCT was detected by
immunohistochemistry. The details of the patients are presented in
Table SII.
To investigate the association between the QPCT
content in peripheral blood of patients with RCC and sunitinib
reactivity, plasma samples from patients (including the 20 pairs of
patient plasma samples mentioned in Table SI) with sunitinib resistance and
sensitivity were collected at Jinling Hospital from 2010 to 2018.
The details of the patients are presented in Table SIII.
Cell lines and reagents
Human RCC cell lines, including OS-RC-2 (cat. no.
TCHu40), A498 (cat. no. HTB-44), 786-O (cat. no. TCHu186), ACHN
(cat. no. TCHu199), KETR-3 (cat. no. CRL-1161) and human umbilical
vein endothelial cells (HUVECs, cat. no. CRL-1730) were obtained
from the Chinese Academy of Sciences (Shanghai, China) or the
American Type Culture Collection (ATCC). The A498 and ACHN cells
were cultured in MEM (10-010-CV, Corning, Inc.) supplemented with
10% fetal bovine serum (FBS, 16000044, Gibco; Thermo Fisher
Scientific, Inc.), and the other RCC cells were cultured in
RPMI-1640 (10-040-CV, Corning, Inc.) supplemented with 10% FBS.
HUVECs were cultured in DMEM (Corning, Inc.) containing 10% FBS.
The cells were grown in a single layer on a plastic cell culture
dish in humidified air containing 5% CO2 at 37°C.
Sunitinib was purchased from Shanghai Selleck Chemicals Co., Ltd.
MG132 and cycloheximide (CHX) were obtained from Apexbio
Technology, LLC. Recombinant human glutamine peptide loop
transferase/QPCT (6368-Zn) was obtained from R&D Systems.
Matrigel matrix basement membrane matrix (354234, BD Biosciences)
was purchased from Corning, Inc.
Animal experiments
A total of 16 BALB/c male nude mice, 4 weeks old,
weighing ~20 g, were obtained from the Shanghai Institute of
Material Medical (Chinese Academy of Science, Shanghai, China). The
mice were maintained under pathogen-free conditions in accordance
with relevant guidelines and regulations for the care and use of
laboratory animals, with the approval of the Institutional Animal
Care and Use Committee at Jinling Hospital and the accession number
for this approval was 2020JLHGKJDWLS-47.
A total of 7×10⁶ lv-PIK3CA and lv-NC
786-O cells (obtained via transfection as described below) were
subcutaneously inoculated into the left and right side of male
athymic BALB/c nude mice (4 weeks old). All the mice were housed in
an environment with a temperature of 22±1°C, a relative humidity of
50±1% and a light/dark cycle of 12/12 h. The mice had free access
to food and water. At one week after the injection of tumor cells,
the animals were randomly assigned to the control or experimental
groups (n=4 mice/group). When the xenografts reached 100
mm3, sunitinib (40 mg/kg/day) or saline (control) was
used for intragastric administration. Tumor size was monitored at
five-day intervals. Xenograft tumor volumes were measured using a
vernier caliper and individually calculated using the following
formula: Volume=axb2/2 ('a' represents length and 'b'
represents width). Xenograft tumor samples were collected for
histological evaluation (paraffin-embedded sections) or were
snap-frozen in liquid nitrogen. A total of 16 mice participated in
the experiment and no mice died during the experiment. The animal
experiment lasted for eight weeks and the mice were sacrificed
eight weeks following inoculation. The mice were anesthetized by an
inhalation of isoflurane. Isoflurane was added into the evaporator
of an anesthesia machine and the percentage of isoflurane was
adjusted in the mixed gas (the concentration of isoflurane was 5%).
After ~1 min, the mice were placed in the induction box. The
induction box was then closed and the mice were fully anesthetized,
which took ~2 min. The induction box was gently shaken to determine
whether the mice were completely anesthetized. If the bodies of
mice turned over to the side position and the mice did not try to
resume the prone position, this indicated that the mice were
completely anesthetized. The mice were then sacrificed by cervical
dislocation under anesthesia to reduce their pain. All animal
experiments (including the mouse euthanasia procedure) were
conducted according to the AAALAC and the IACUC guidelines.
RNA extraction, cDNA preparation and
reverse transcription-quantitative polymerase chain reaction
(RT-qPCR)
Total RNA was extracted from cells and tissues using
TRIzol reagent (Takara Bio, Inc.), according to the manufacturer's
instructions. Total RNA quality was assessed using a Nanodrop 2000
and agarose gel electrophoresis. First-strand cDNA was generated
from 2 µg of total RNA using M-MLV reverse transcriptase
(Invitrogen; Thermo Fisher Scientific, Inc.) with random primers.
Quantitative PCR (qPCR) was performed on triplicate samples in a
reaction mix of SYBR-Green (Takara Bio, Inc.) using the ABI 7900HT
Fast Real-Time PCR System (Applied Biosystems; Thermo Fisher
Scientific, Inc.). The conditions of PCR denaturation, annealing
and extension were respectively 94°C 60 sec, 37°C 60 sec, and 72°C
120 sec. The expression of indicated genes was normalized to the
endogenous reference control, β-actin, using the 2−ΔΔCq
method (16). The primers were
synthesized by Sangon Biotech (Shanghai) Co., Ltd. Each qRT-PCR
reaction was performed in triplicate. The primer sequences were as
follows: QPCT forward, 5′-AAA TTG CAG AAG GCA CCA GT-3′ and
reverse, 5′-CTG AAT TCG CTG CAT GAT GT-3′; CCCTC-binding factor
(CTCF) forward, 5′-CTG CTG TGG ACG ATA CCC-3′ and reverse, 5′-GCA
AGG CCC TCT TTA GAC-3′; phosphatidylinositol-4,5-bisphosphate
3-kinase catalytic subunit alpha (PIK3CA) forward, 5′-CAT GCA TTG
TTT TGC ACC CC-3′ and reverse, 5′-ATG GAA GAC GGG AGA TTC ACA T-3′
and β-actin forward, 5′-CTG GTG CCT GGG GCG-3′ and reverse, 5′-AGC
CTC GCC TTT GCC GA-3′.
Western blot analysis
Briefly, RCC cells or tissues were lysed to obtain
proteins using RIPA buffer (EMD Millipore). The BCA method was used
to determine the protein concentration, Total RCC cell and RCC
tissue lysates were prepared in 1X sodium dodecyl sulphate (SDS)
buffer. Identical quantities of protein (20 µl) were
separated by 10% SDS gel electrophoresis and transferred onto
nitrocellulose filter membranes. The membranes were blocked with 5%
non-fat milk for 2 h at room temperature and incubated with
specific antibodies overnight at 4°C. Following incubation with
antibodies specific for QPCT (ab201172, Abcam; 1:1,000), PIK3CA
(ab40776, Abcam; 1:1,000), ubiquitin (3936, Cell Signaling
Technology, Inc.; 1:1,000), AKT (4691, Cell Signaling Technology,
Inc.; 1:1,000), p-AKT (4060, Cell Signaling Technology, Inc.;
1:1,000) and GAPDH (sc-25778; Santa Cruz Biotechnology, Inc.;
1:2,000), the blots were incubated with IRDye 800-conjugated goat
anti-rabbit IgG (2095, Li-Cor Biosciences Inc.; 1:1,000) for 1 h in
the dark at room temperature, and bands were detected using an
Odyssey infrared scanner (Li-Cor). Odyssey software (V1.01, Li-Cor
Biosciences Inc.) was used for densitometry. GAPDH was used as the
loading control. Each western blot analysis experiment was repeated
three times.
ELISA
A 25 ng/well of capture antibody goat-anti QPCT
(PA5-112679, ThermoFisher) was coated over night at 4°C. The wells
were blocked for 2 h by the addition of 200 µl blocking
buffer [protein free (TBS) blocking buffer (37570, Thermo Fisher
Scientific, Inc.)] and then washed three times using 300 µl
of wash buffer [protein free T20 (TBS) blocking buffer (37571,
Thermo Fisher Scientific, Inc.)]. Standard peptides (PeproTech,
Inc.) and samples (human plasma) were diluted using dilution buffer
[protein-free T20 (TBS) blocking buffer)] and 100 µl were
applied onto the test plate. The incubation of test samples and
standard peptides was performed for 2 h at room temperature and the
plate was then washed three times using wash buffer. Thereafter,
wells were washed three times with 300 µl of wash buffer and
the chromogen SureBlue (KPL, Inc.) was applied in a volume of 100
µl to each well and incubated in the dark. After 30 min, the
reaction was abrogated using 50 µl Stop Solution (1.2 N
H2SO4) and absorption was determined at 450 nm. The absorbance was
recorded at 450 nm using a microplate reader (Varioskan Flash;
Thermo Fisher Scientific, Inc.). The reference wavelength of 550 nm
was subtracted from sample absorption at 450 nm.
Cell transfection and lentivirus
infection
Transfections were performed using a Lipofectamine
RNAiMAX Transfection Reagent kit (Invitrogen; Thermo Fisher
Scientific, Inc.) according to the manufacturer's instructions.
Small interfering RNAs and negative control RNAs were introduced
into ACHN and OS-RC-2 cells at 75 pmol per well in six-well plates
and the cells were grown in humidified air containing 5%
CO2 at 37°C. The cells were harvested at 48 h following
transfection. CTCF siRNA was synthesized by GenePharma, Inc., with
a sequence of si-CTCT1, 5′-GUG GUA CCA UGA AGA UGC ATT-3′ (forward)
and 5′-UGC AUC UUC AUG GUA CCA CTT-3′ (reverse); si-CTCT2, 5′-GGC
AAG ACA UGC UGA UAA UTT-3′ (forward) and 5′-AUU AUC AGC AUG UCU UGC
CTT-3′ (reverse). A non-silencing siRNA oligonucleotide that does
not recognize any known mammalian gene homolog (GenePharma,
Shanghai, China) was used as a negative control.
QPCT-overexpressing, PIK3CA-overexpressing and
control lentiviruses were produced by Obio Technology (Shanghai)
Corp., Ltd. The CDS sequence containing QPCT or PIK3CA was
amplified by PCR and cloned into the lentiviral vectors,
pLVX-CMV-QPCT-3FLAG-PGK-Puro or pLVX-CMV-PIK3CA-3FLAG-PGK-Puro, to
construct the QPCT-overexpressing or PIK3CA-overexpressing
lentiviruses. The concentration and purification of lentivirus wase
divided into primary purification and ultracentrifugation. The
concentrations of QPCT-overexpressing lentiviruses and
PIK3CA-overexpressing lentiviruses were 7.17×10⁸ and
5.26×10⁸, respectively. The QPCT or PIK3CA knockdown
lentiviruses and control lentiviruses were constructed for a siRNA.
The lentiviral vector used was LKD001 pLKD-CMV-Puro-U6-shRNA. The
concentration of QPCT knockdown lentiviruses and PIK3CA knockdown
lentiviruses were 1.39×10⁹ and 2.28×10⁹,
respectively. CTCF-overexpressing and control lentiviruses were
produced by Hanbio Biotechnology Co., Ltd. The CDS sequence
containing CTCF was amplified by PCR and cloned into the lentiviral
vector pHBLV-CMV-MCS-3flag-EF1-puro to construct the
CTCF-overexpressing lentiviruses. The concentration of
CTCF-overexpressing lentiviruses was 3.15×10⁸. The
appropriate amount of lentiviruses (1:1,000) was transfected into
RCC cells. The cells were grown in humidified air containing 5%
CO2 at 37°C and the medium was changed after 48 h. After
the cells were infected with lentiviruses for 72 h, 1.5
µg/ml puromycin was selected for stable transformation
screens. RT-qPCR was used to verify the transfection efficiency of
the lentiviruses.
Immunohistochemistry
The sections were heated at 70°C for 1 h, dewaxed in
xylene, and dehydrated through a gradient concentration of alcohol.
After retrieving and blocking endogenous peroxidase and
non-specific staining with 3% H2O2 and normal
bovine serum, the sections were incubated with primary antibody
overnight at 4°C. The slides were then incubated with horseradish
peroxidase (HRP)-conjugated secondary antibody (HS101-01, TransGen
Biotech, 1:500) for 10 min at 37°C. Finally, the sections were
visualized by diaminobenzidine (DAB) solution for 15 min at 37°C
and then counterstained with hematoxylin. Two pathologists blinded
to the patient outcomes independently scored the staining
intensities and percentages of positive tumor cells. The results of
immunohistochemistry were observed using an optical microscope
(ZTX-3S-C2, AS ONE Corporation). Specimens were stained with
antibodies to QPCT (ab201172, Abcam, 1:100), PIK3CA (ab135384,
Abcam, 1:100), CD31 (ab28364, Abcam, 1:50) and CD34 (ab110643,
Abcam, 1:100).
Chromatin immunoprecipitation
Chromatin immunoprecipitation was performed using
the EZ ChIP Chromatin Immunoprecipitation kit for cell line samples
(EMD Millipore) according to the manufacturer's instructions. 786-O
and KETR-3 cells (1×10⁷ cells) were cross-linked with 1%
formaldehyde and incubated for 10 min at 37°C. ChIP assay was
performed according to the manufacturer's protocol using monoclonal
Anti-CTCF antibody (ab128873, Abcam; 1:100) or normal rabbit IgG as
a negative control (ab172730, Abcam, 1:100). An aliquot of lysates
(20 µl) was used as an input control. DNA enrichment was
determined by quantitative PCR (qPCR), and was normalized to the
input using the ABI 7900HT Fast Real-Time PCR System (Applied
Biosystems; Thermo Fisher Scientific, Inc.). The sequence for
Primer1 (containing the CTCF binding QPCT site) was as follows:
Forward, 5′-GTG TAT TTC CAG GCA AGC CC-3′ and reverse, 5′-CCA CCC
ACT CAC TCT GTC TTC-3′.
Human proteome microarray assay
The HuProt microarray assay (17,18) and data analysis were performed by
Wayen Biotechnologies (Shanghai), Inc., according to the following
procedure. The HuProt microarray (CDI Laboratories, Inc.) comprises
20,240 human full-length proteins with N-terminal glutathione
S-transferase (GST) tags. Human proteome microarrays (HuProtTM 20
K) were blocked with blocking buffer (1% BSA and 0.1% Tween-20 in
TBST) for 1 h at room temperature with gentle agitation. The QPCT
protein was labelled with biotin with an Antibody Array assay kit
(Full Moon BioSystems, Inc.) and was then diluted to 0.01 mg/ml in
blocking buffer and incubated on the blocked proteome microarray at
room temperature for 1 h. The microarrays were washed three times
for 5 min each with TBST, incubated with streptavidin-Cy5 at a
dilution of 1:1,000 (Thermo Fisher Scientific, Inc.) for 1 h at
room temperature and subjected to three more 5-min washes. The
microarrays were spun dry at 1,500 rpm for 3 min and subjected to
scanning with a GenePix 4000B (Axon Instruments, Inc.) to visualize
and record the results. GenePix Pro 6.0 was used for data analysis.
GO (Biological Process, Molecular Function, Cellular Component) and
KEGG_Pathway analysis were conducted for the proteins that bound to
QPCT.
Co-immunoprecipitation
Co-immunoprecipitation (co-IP) was performed
according to the manufacturer's instructions (Pierce
Co-Immunoprecipitation kit, Thermo Fisher Scientific, Inc.). RCC
cells with indicated treatment were used for one
immunoprecipitation reaction. Briefly, cells were lysed in a series
of buffers and centrifugation steps to obtain lysate supernatant.
Indicated antibodies were covalently coupled onto an amine-reactive
resin and used to bait the corresponding proteins. Antibodies
against QPCT (sc-517122, Santa Cruz Biotechnology, Inc., 1:50) and
PIK3CA (4255, Cell Signaling Technology, Inc.; 1:50) were incubated
for 12 h at 4°C and then incubated with IRDye 800-conjugated goat
anti-rabbit IgG (2095, Li-Cor Biosciences Inc.; 1:1,000) for 1 h in
the dark at room temperature, and bands were detected using an
Odyssey infrared scanner (Li-Cor).
In vitro Matrigel tube formation
assay
HUVECs (5×10⁵ cells per well) were seeded
onto Matrigel plates (containing 200 µl Matrigel) and
cultured for 12 h at 37°C in 5% CO2. Capillary-like
structures were evident and counted using a phase-contrast
microscope (Shanghai Optical Instrument Factory), and the networks
formed by HUVECs were quantified using ImageJ software V1.8.0.112
(National Institutes of Health). The group incubated with exogenous
VEGF (RP-87723, Gibco; Thermo Fisher Scientific, Inc.; 10
µM) was used as the positive control group and the purified
QPCT cytokines (rhQPCT, 6368-ZN-010, R&D Systems, Inc.; 10
µM) was used.
Statistical analysis
SPSS 22.0 software (SPSS, Inc.) was used for all
statistical analyses in the present study. Data are expressed as
the mean ± standard deviation (SD). Depending on the type of data,
the appropriate statistical methods were used. A two-tailed t-test
or non-parametric Mann-Whitney U test was used for comparisons
between two groups. Analysis of variance or Kruskal-Wallis was used
for comparisons among multiple groups. Dunnett's test was used for
post hoc evaluation analysis. Pearson Chi-squared test was applied
to analyze clinical variables. Kaplan-Meier survival analysis was
used to compare the effects of QPCT dichotomous expression on the
survival rate of patients with RCC using the log-rank test or Renyi
test if the hazard rates crossed. A P-value <0.05 was considered
to indicate a statistically significant difference.
Results
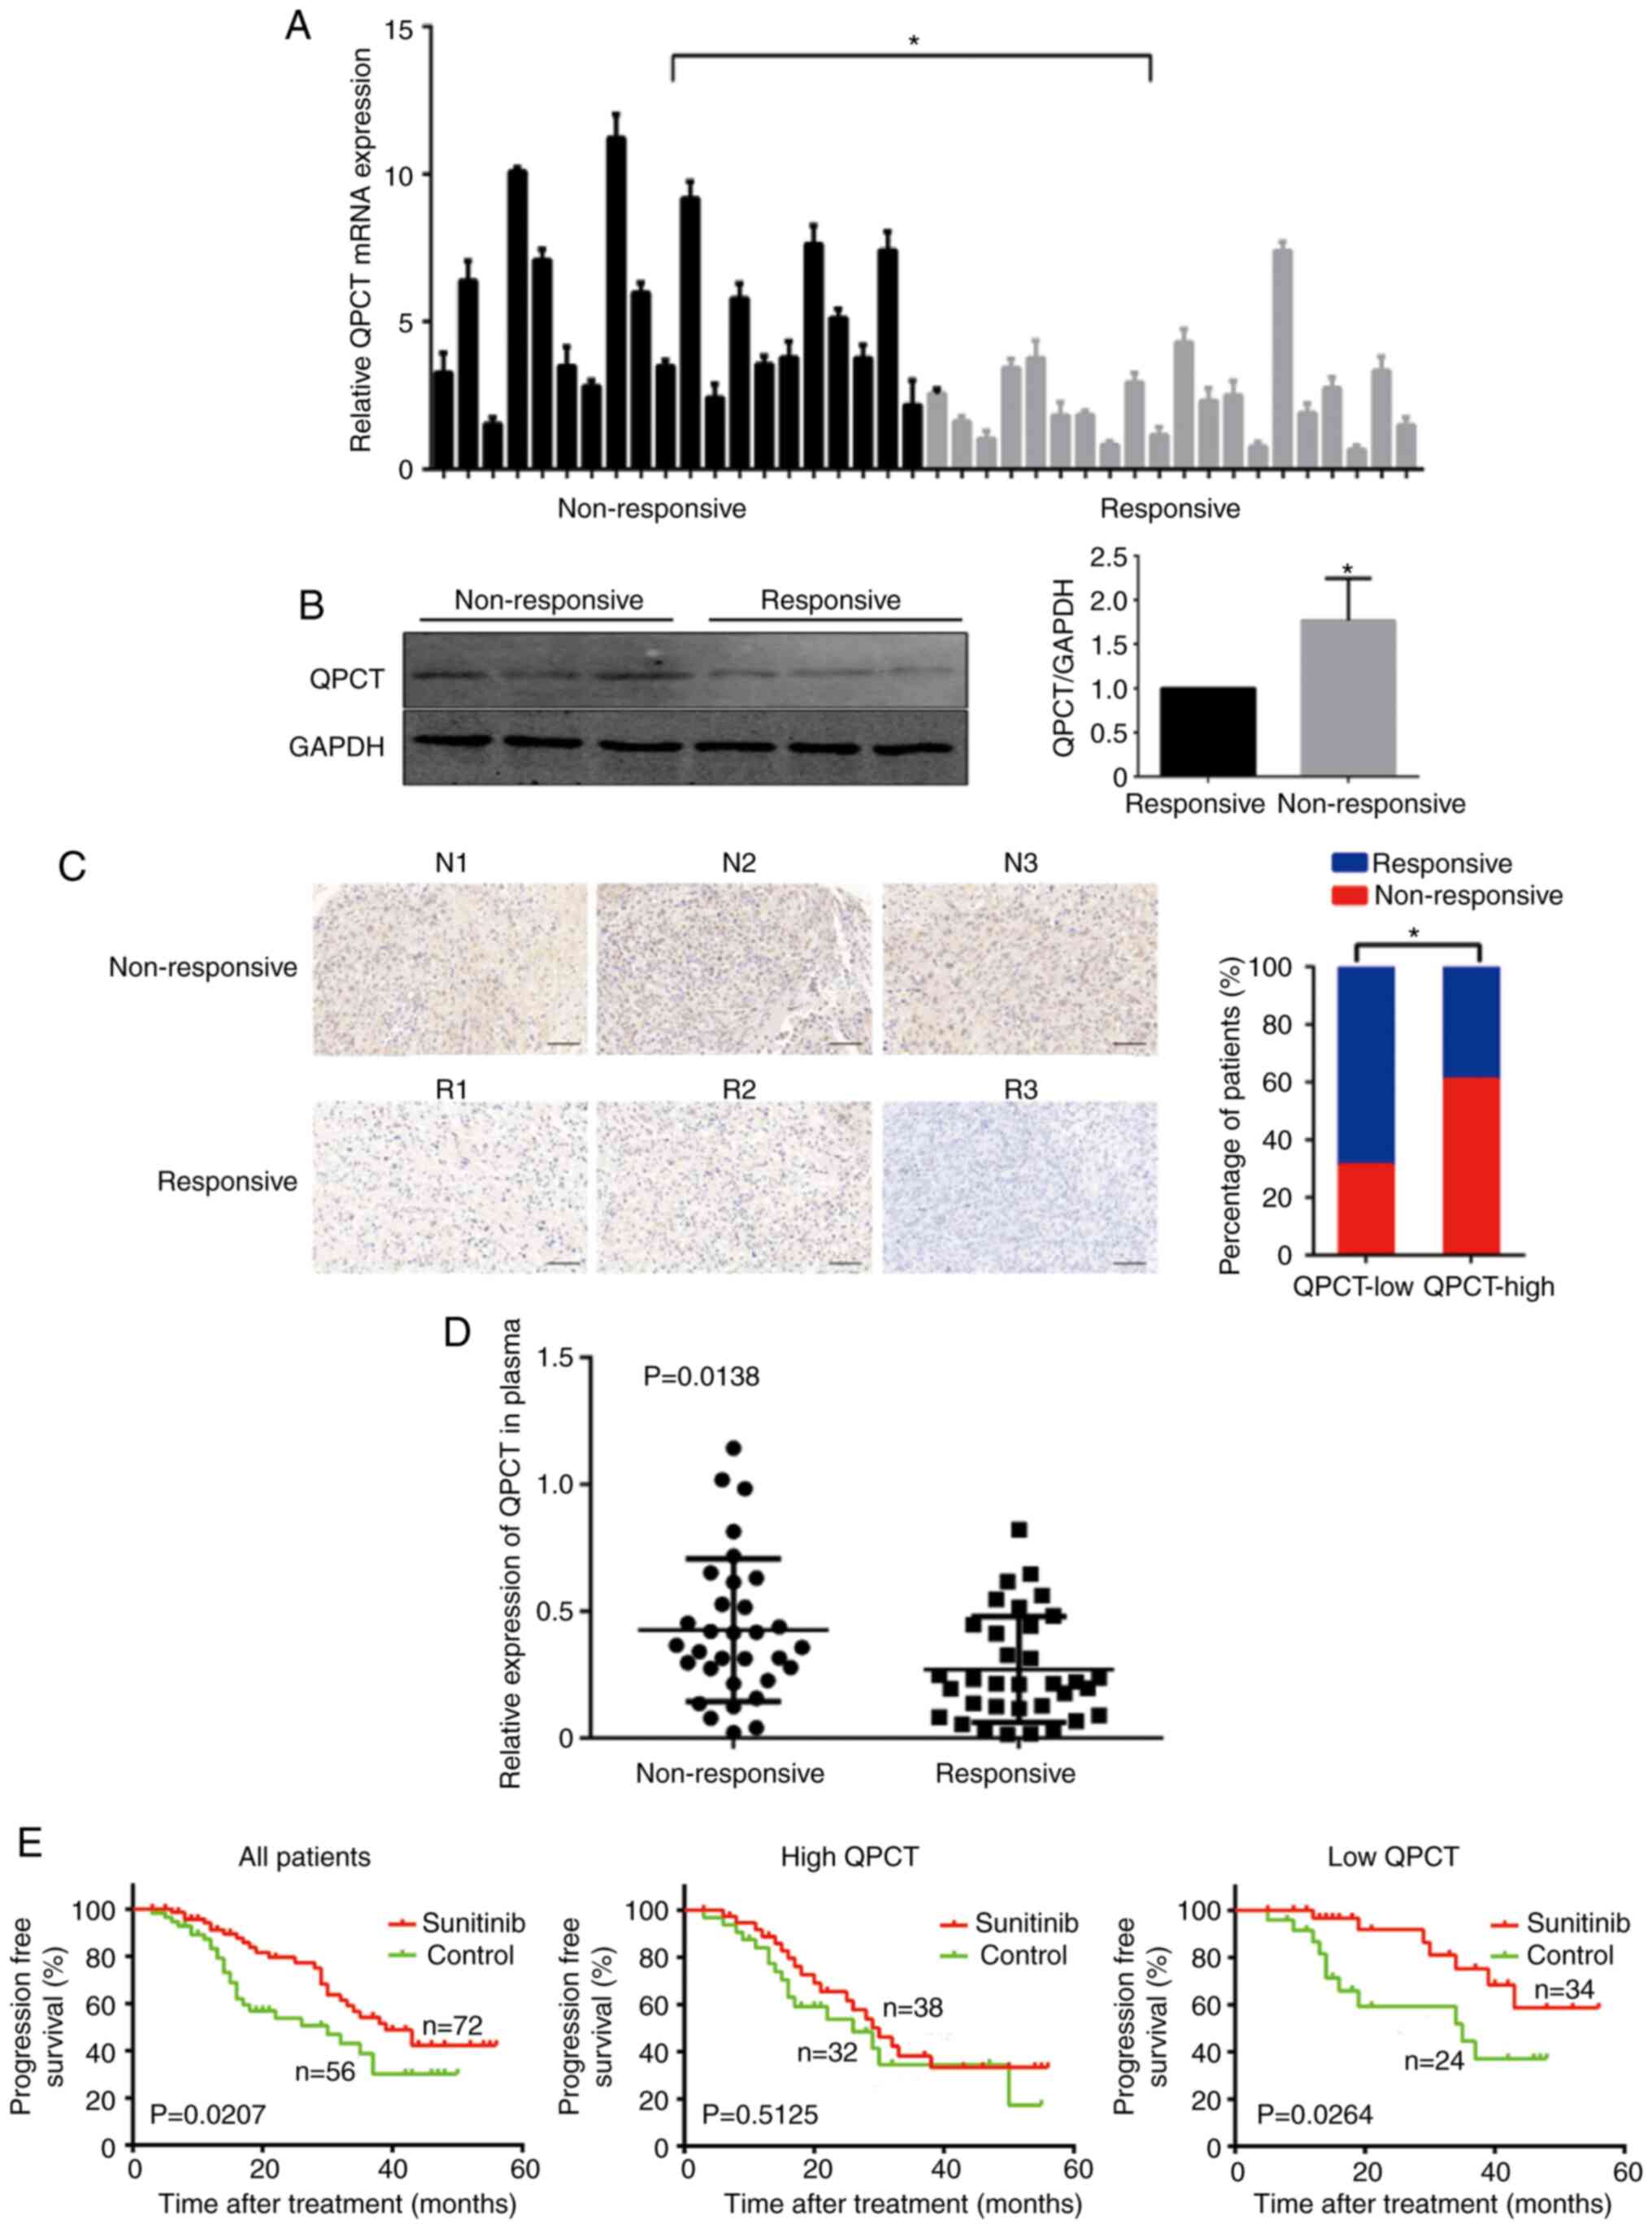
QPCT expression is increased in the
sunitinib-non-responsive RCC tissues and plasma, and patients with
RCC with a high QPCT expression have a poor response to
sunitinib
The present study first selected 20 pairs of
sunitinib-non-responsive and -responsive RCC tissue samples to
detect QPCT expression at the mRNA and protein level. It was found
that QPCT expression was upregulated in the
sunitinib-non-responsive RCC tissues (Fig. 1A and B). Immunohistochemistry was
then performed to detect QPCT expression in a tissue microarray,
including 128 RCC tissue samples. Once again, QPCT expression was
upregulated in the sunitinib-nonresponsive RCC tissues (Fig. 1C).
QPCT can be secreted by tumor cells (14,15). ELISA of patients with RCC who had
a favorable or adverse response to sunitinib therapy revealed
elevated plasma QPCT levels in patients who did not respond to
sunitinib (Fig. 1D). Since QPCT
was functionally involved in the sunitinib reaction of RCC cells,
the expression of QPCT in the tissue microarray including 128 RCC
samples was detected by immunohistochemistry, and the association
between the QPCT content and RCC response to sunitinib treatment
was analyzed by combining the prognostic information of the
patients. It was found that sunitinib treatment extended the
progression-free survival (PFS) of patients with RCC (Fig. 1E, left panel), while patients with
a low QPCT expression in tumor tissue had a more significant
improvement in PFS after receiving sunitinib compared to the
control group (Fig. 1E, right
panel). However, patients with a high QPCT expression did not
respond well to sunitinib treatment (Fig. 1E, middle panel). Therefore, QPCT
expression was suggested as an independent predictor of the
sunitinib response in patients with RCC.
In a previous study, the authors found that the
downregulation of QPCT expression enhanced the sensitivity if RCC
to sunitinib, while its overexpression promoted RCC resistance to
sunitinib in vitro and in vivo (14). However, the mechanisms through
which QPCT induces sunitinib resistance in RCC remain unclear.
Thus, the present study aimed to elucidate these mechanisms.
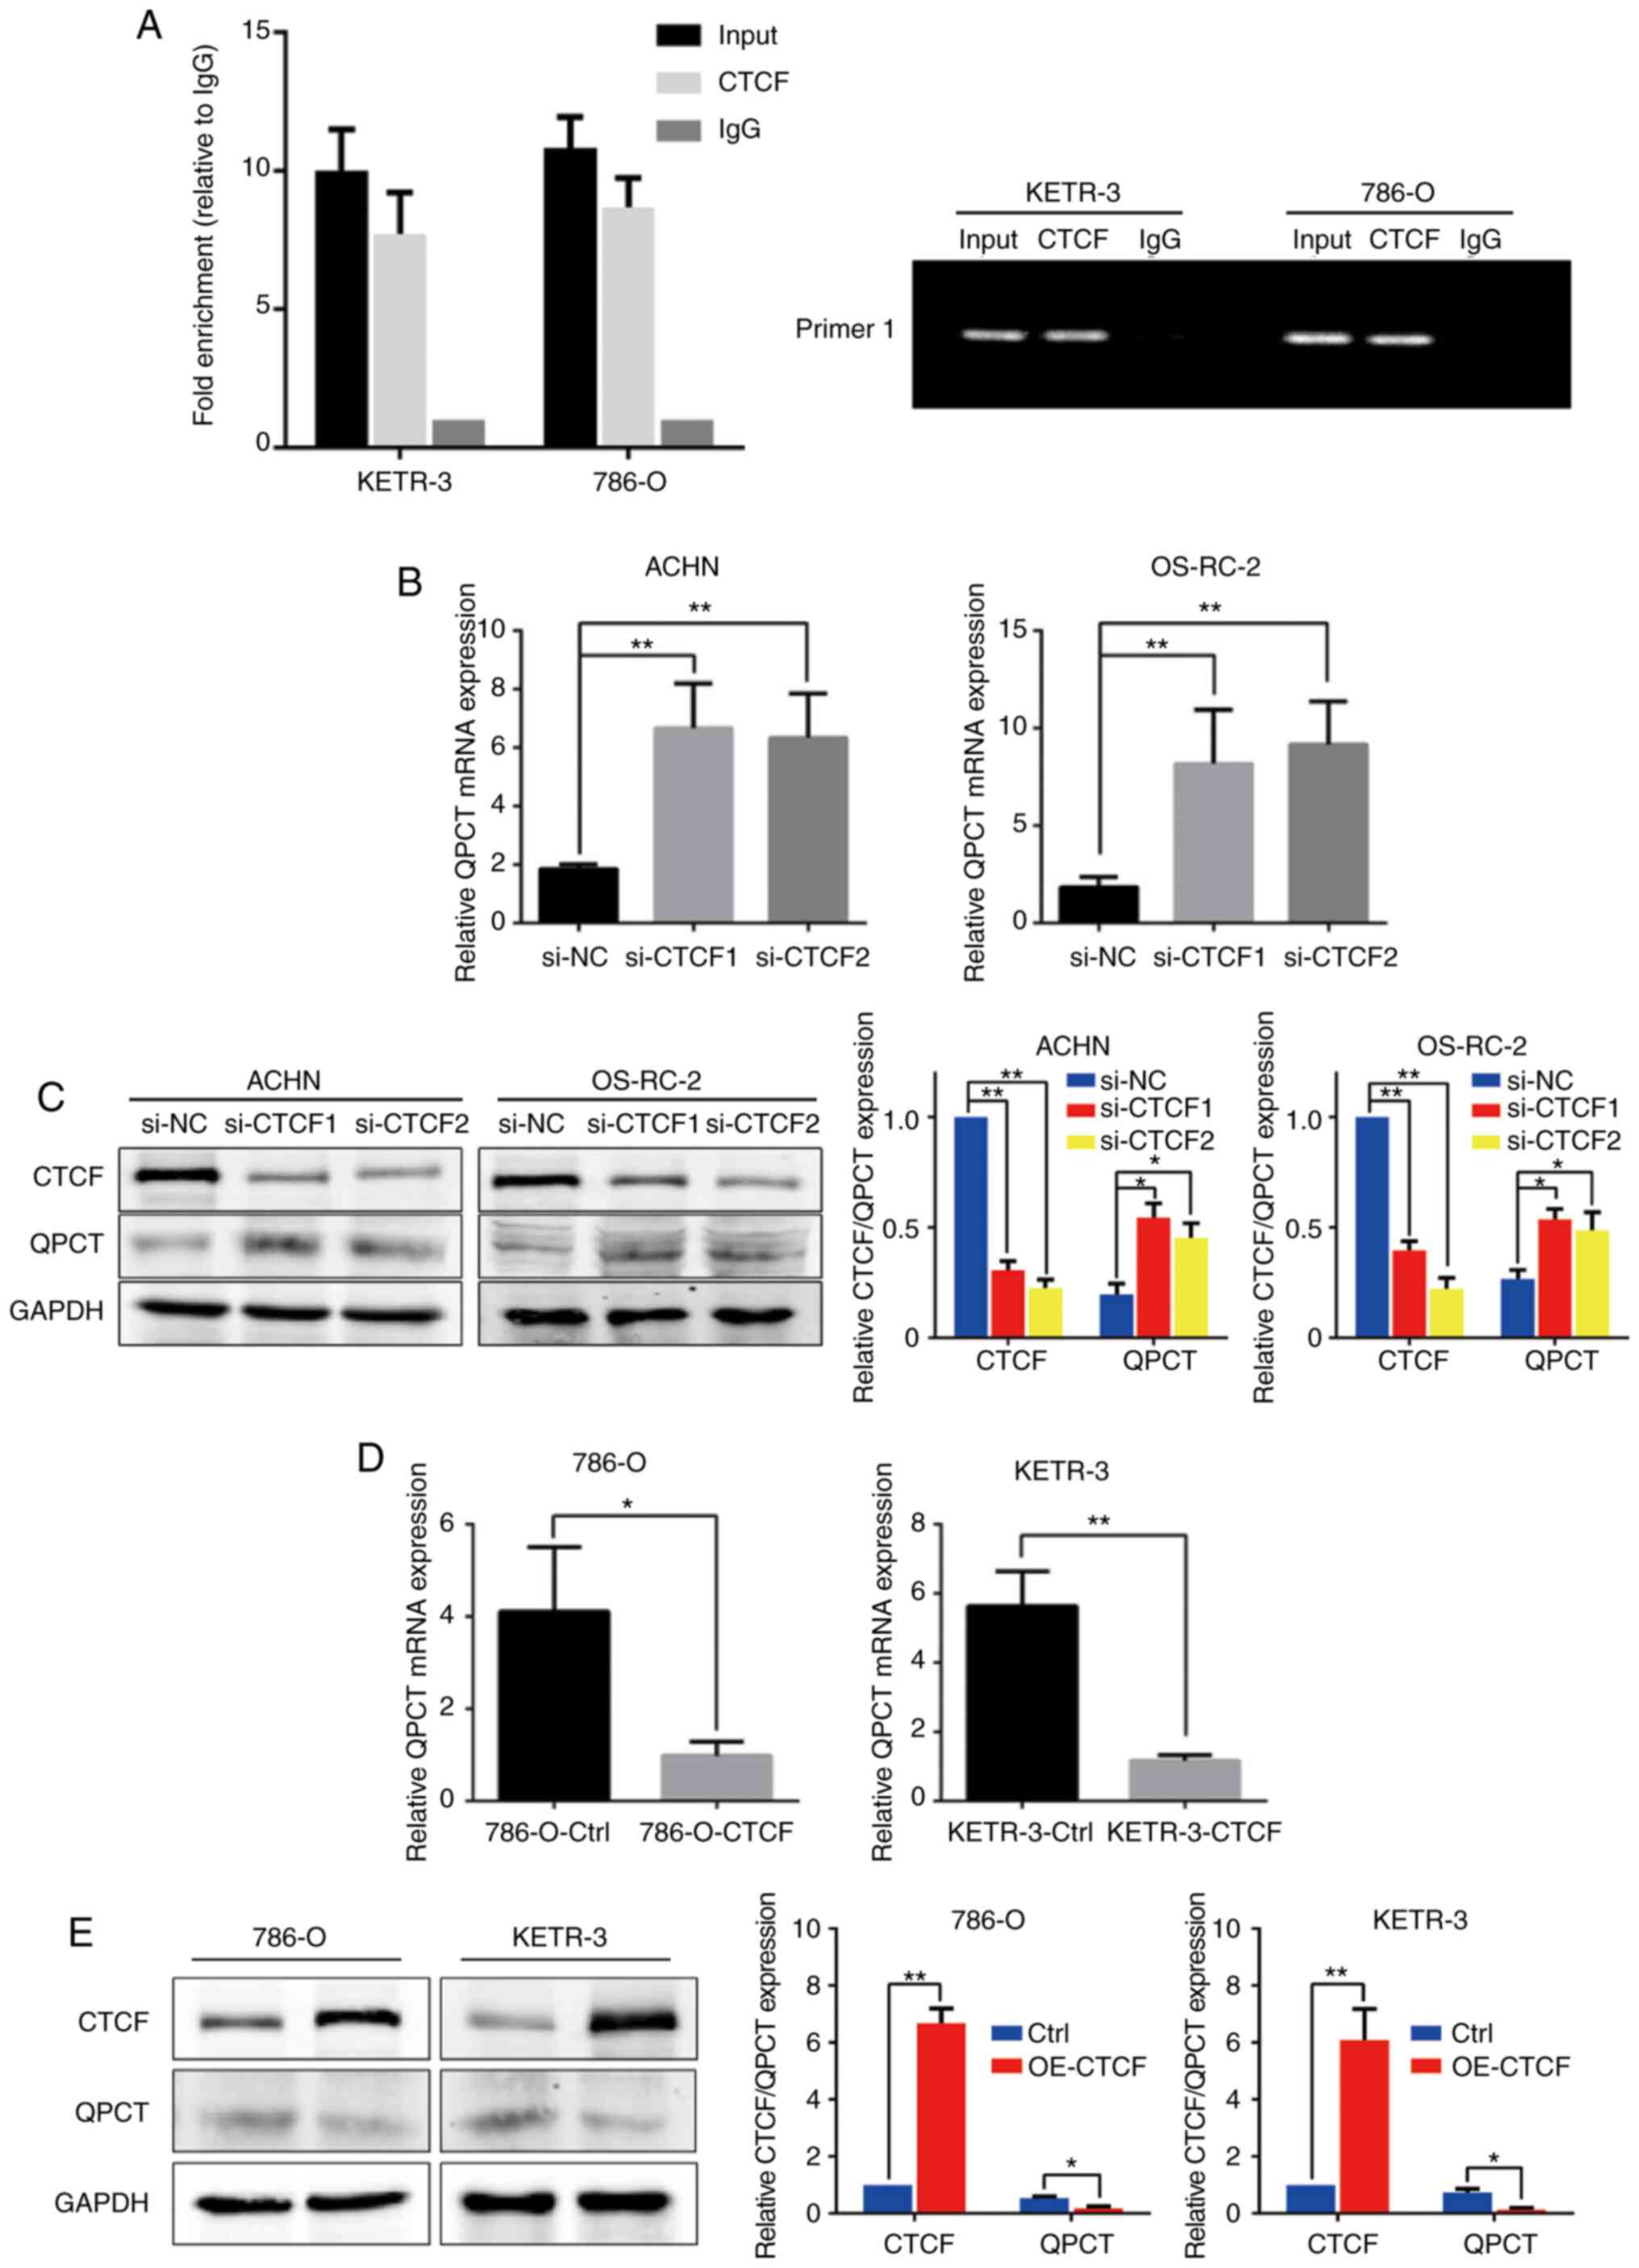
CTCF binds to the QPCT promoter region,
negatively regulating its expression
Through transcription factor prediction, it was
found that CTCF may be one of the transcription factors regulating
QPCT expression. Through ChIP assay, it was confirmed that CTCF
could bind to the QPCT promoter region; the possible binding site
was -1,050 bp of the ATG transcription start codon (Fig. 2A). To thoroughly explore the
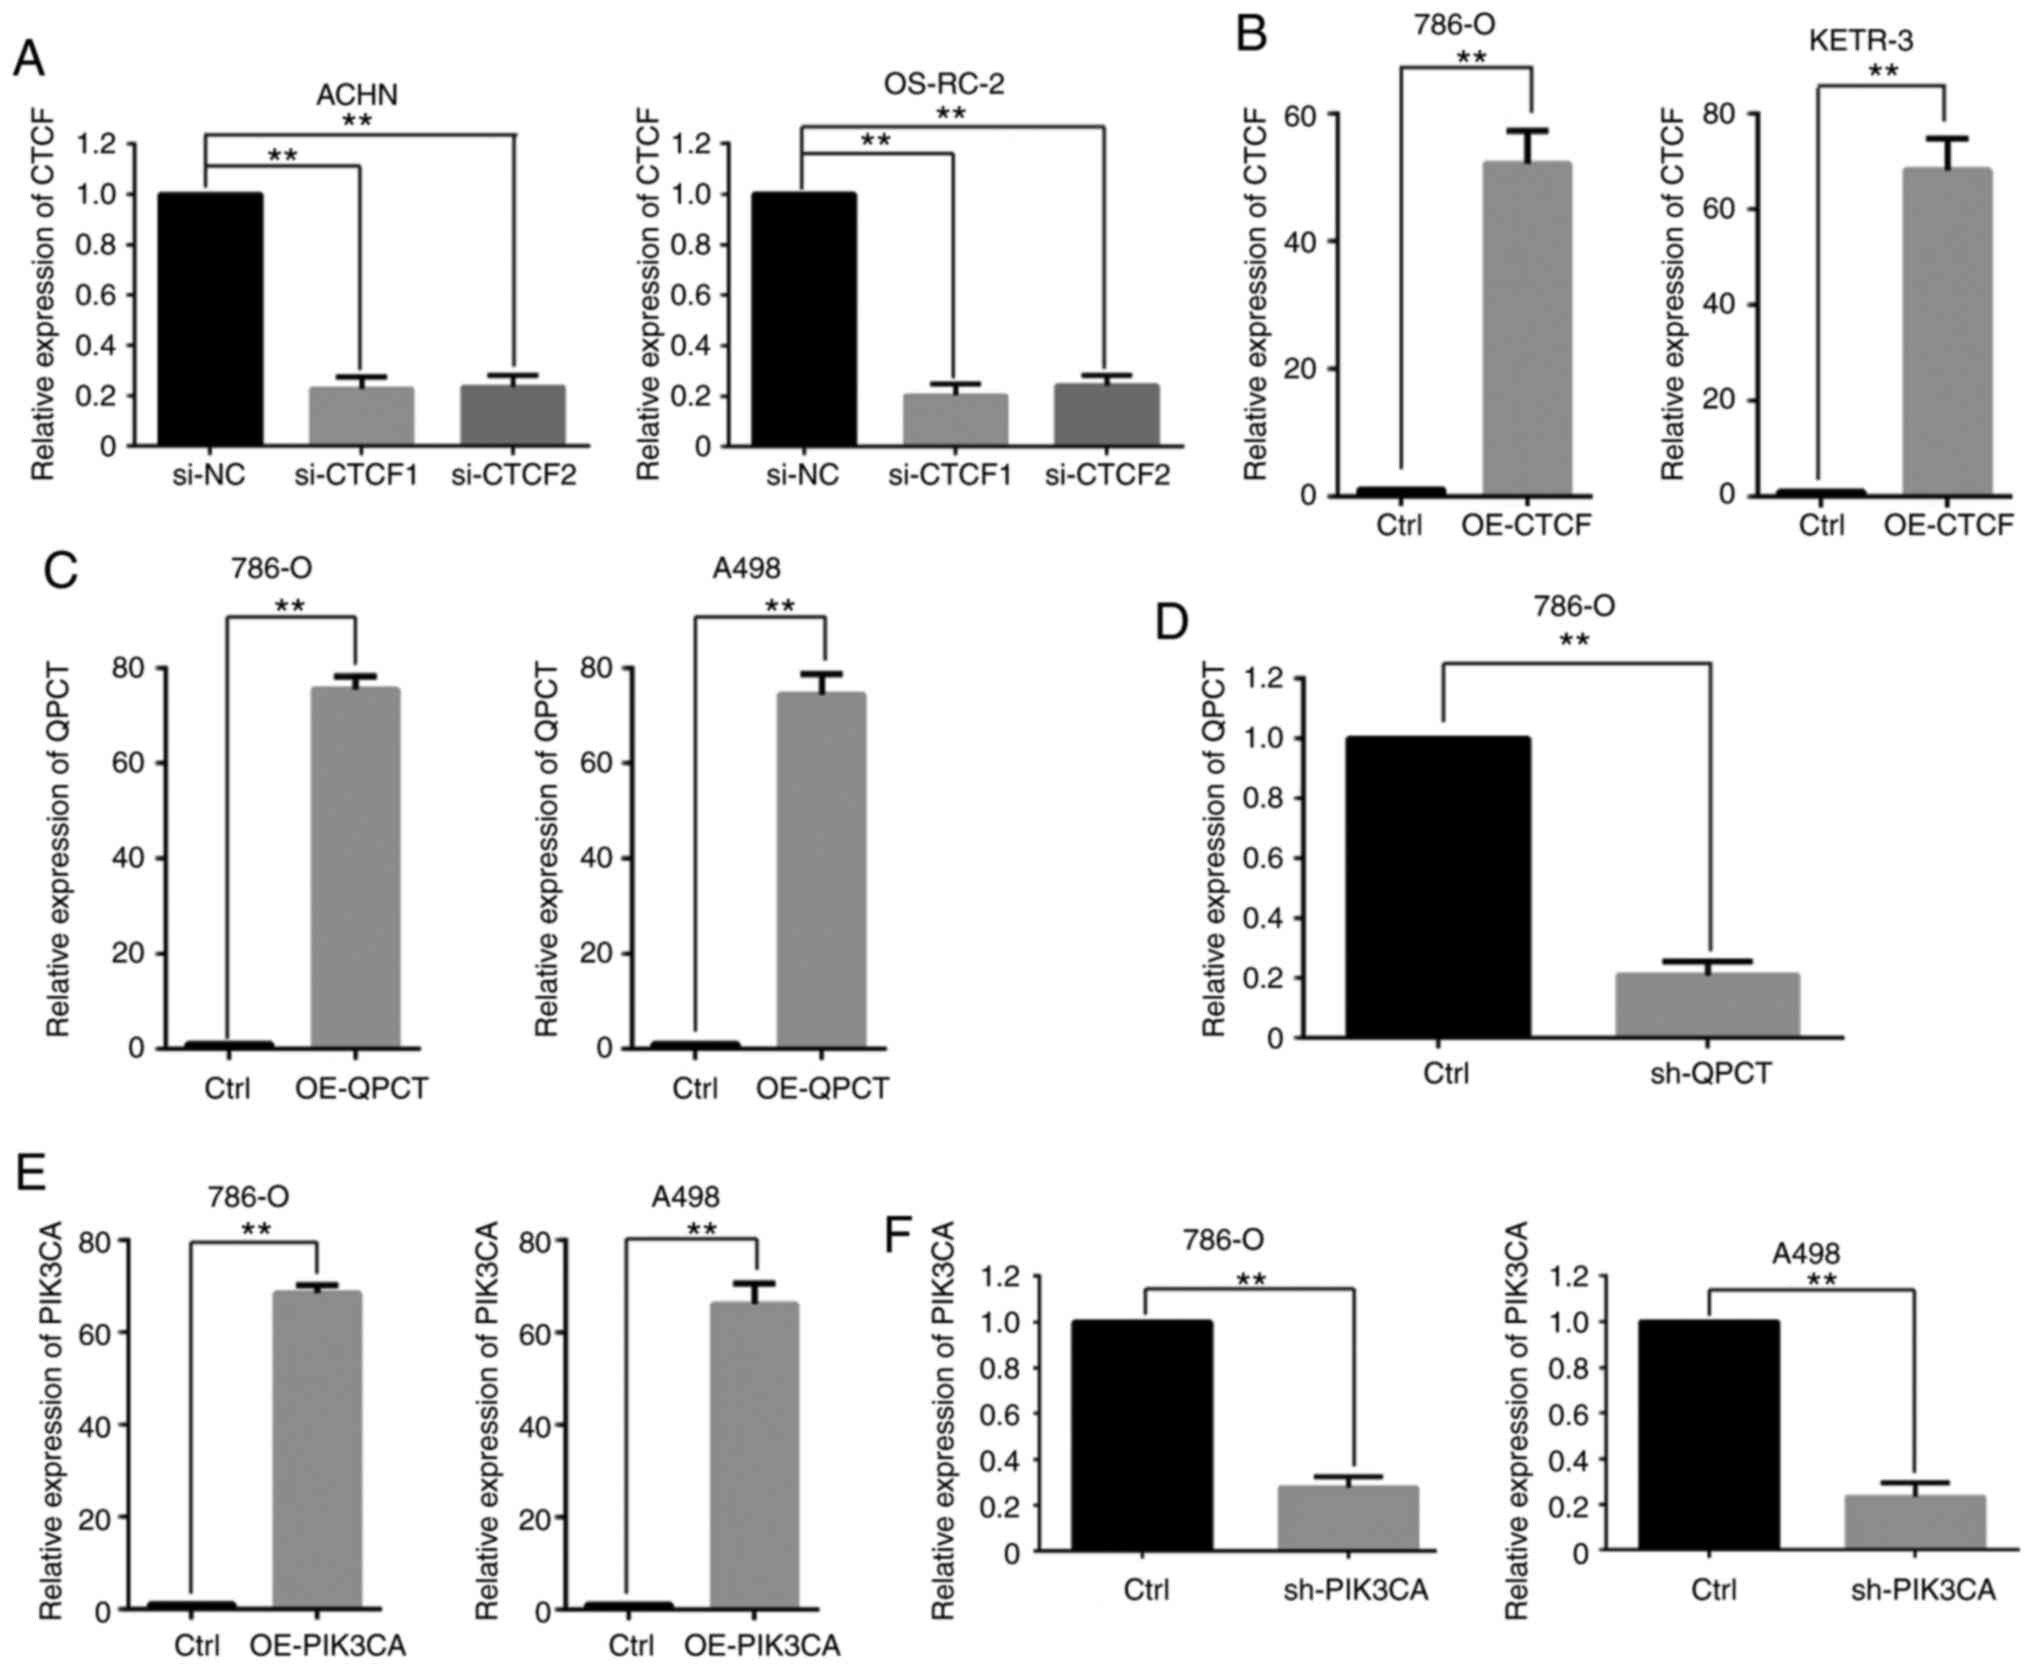
function of CTCF, the expression of CTCF was examined in RCC cell
lines by RT-qPCR (Fig. SIA) and
CTCF expression was then suppressed utilizing two siRNAs against
CTCF in the ACHN and OS-RC-2 cell lines (Fig. 3A). QPCT expression was upregulated
following interference with CTCF (Fig. 2B and C). Subsequently, CTCF was
overexpressed in the 786-O and KETR-3 cell lines (Fig. 3B). QPCT expression was
downregulated when CTCF was overexpressed (Fig. 2D and E). This indicated that CTCF
negatively regulated the expression of QPCT.
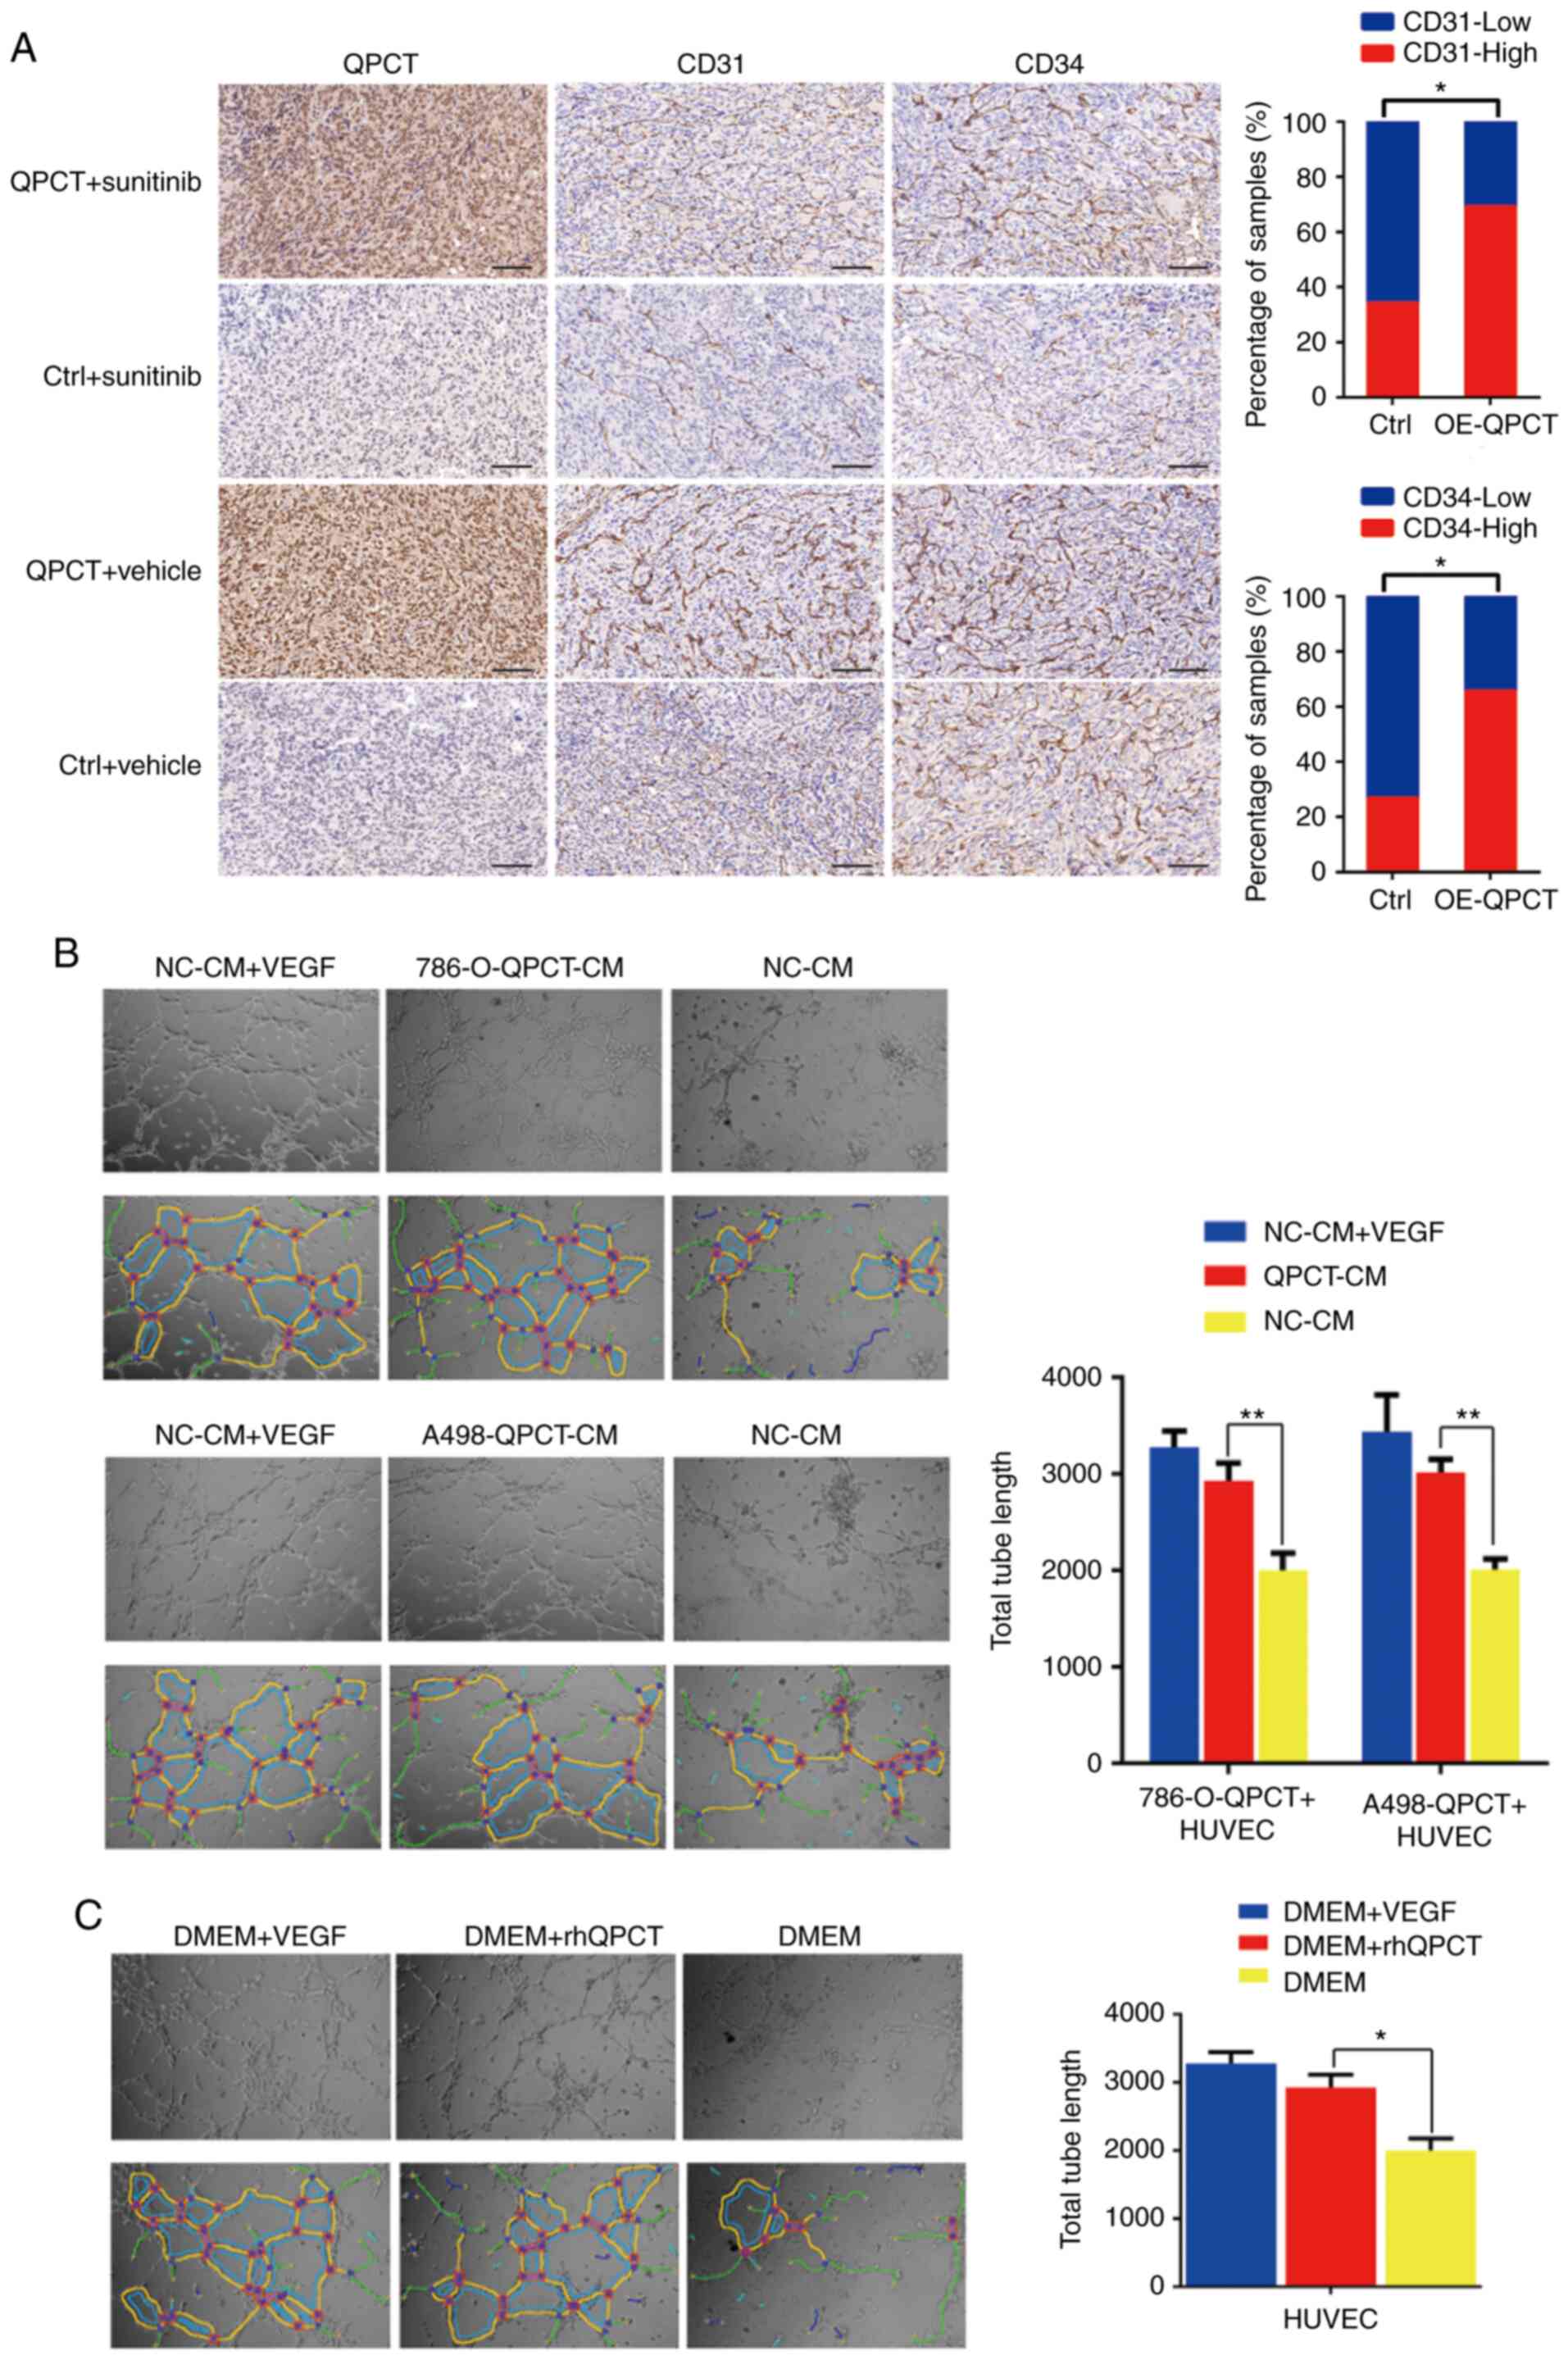
Overexpression of QPCT promotes tumor
angiogenesis
In the xenograft tumors formed from
QPCT-overexpressing and control 786-O cells (14), it was found that the expression of
CD31 and CD34 significantly increased when QPCT was overexpressed
(Fig. 4A). Therefore, it was
suggested that QPCT can promote angiogenesis in RCC. Moreover, one
of the sunitinib targets in the treatment of RCC is the inhibition
of tumor angiogenesis. Hence, it was hypothesized that when QPCT
was overexpressed, the ability of sunitinib to inhibit angiogenesis
would be suppressed. In order to verify this hypothesis, tube
formation assays were carried out using HUVECs (the total tube
length was calculated using ImageJ software). Knowing that QPCT can
be secreted extracellularly by RCC cells (14,15), HUVECs were incubated with culture
supernatant from RCC cells stably overexpressing QPCT (Fig. 3C). The results revealed that the
HUVECs formed more tubes compared with the negative control group,
while there was no significant difference between the experimental
group and the positive control group (cell cultured with VEGF added
to the culture medium) (Fig.
4B).
As RCC cells can secrete a variety of factors
extracellularly (11,13,14), the present study chose to add the
purified QPCT cytokines (rhQPCT) into the HUVEC culture medium.
Similarly, it was found that HUVECs cultured with rhQPCT formed
more tubes compared with the negative control group (Fig. 4C).
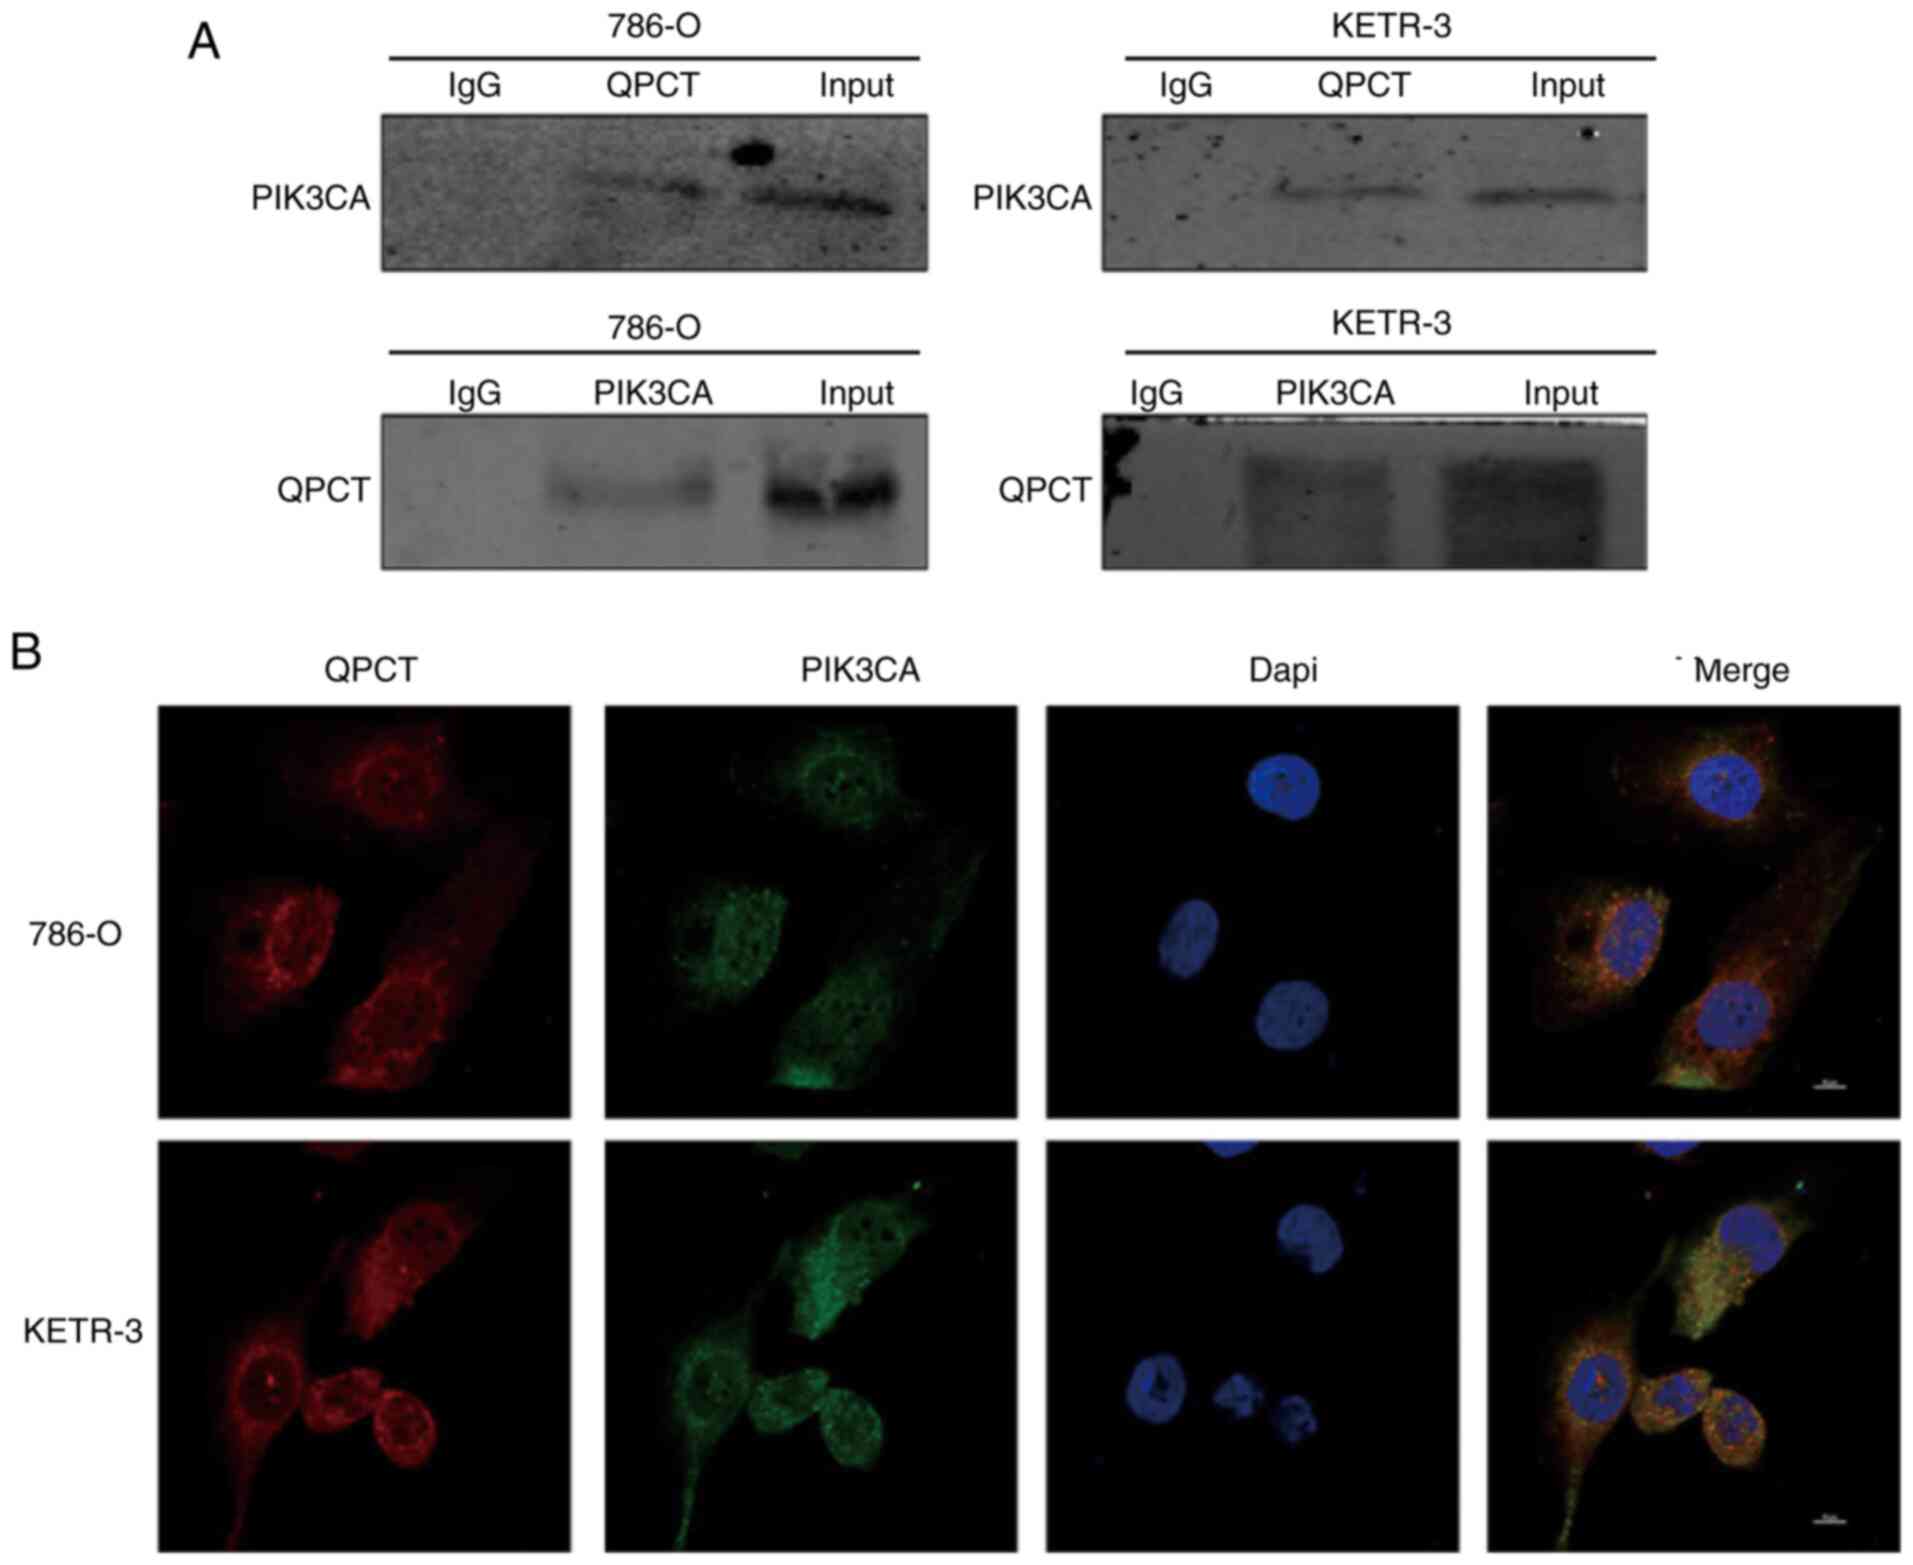
QPCT can bind with PIK3CA
To clarify the mechanisms underlying the role of
QPCT in sunitinib resistance in RCC, a human proteome microarray
consisting of 20,240 full-length human proteins and N-terminal
glutathione S-transferase (GST) tags was used to search for
proteins that interact with QPCT. A total of 366 proteins were
detected (14). Information on
proteins that may bind to QPCT is presented in Table SIV. In the Kyoto Encyclopedia of
Genes and Genomes/Genome Ontology (KEGG/GO) database, it was found
that QPCT bound to PIK3CA, a key proto-oncogene in the PI3K/AKT
signaling pathway. The protein encoded by PIK3CA was a subunit of
the PI3K enzyme. PIK3CA was involved in the PI3K/AKT pathway, which
plays a crucial biological role in cell growth, proliferation,
apoptosis, angiogenesis, autophagy and other cell processes. The
disruption of this pathway leads to a range of diseases, including
cancer (19-21). The present study verified the
results of ChIP with co-IP, and PIK3CA was proven capable of
combining with QPCT (Fig. 5A).
QPCT co-localized with PIK3CA in the cytoplasm, as shown by
immunofluorescence staining and laser confocal microscopy, thus
further confirming the binding of QPCT with PIK3CA (Fig. 5B).
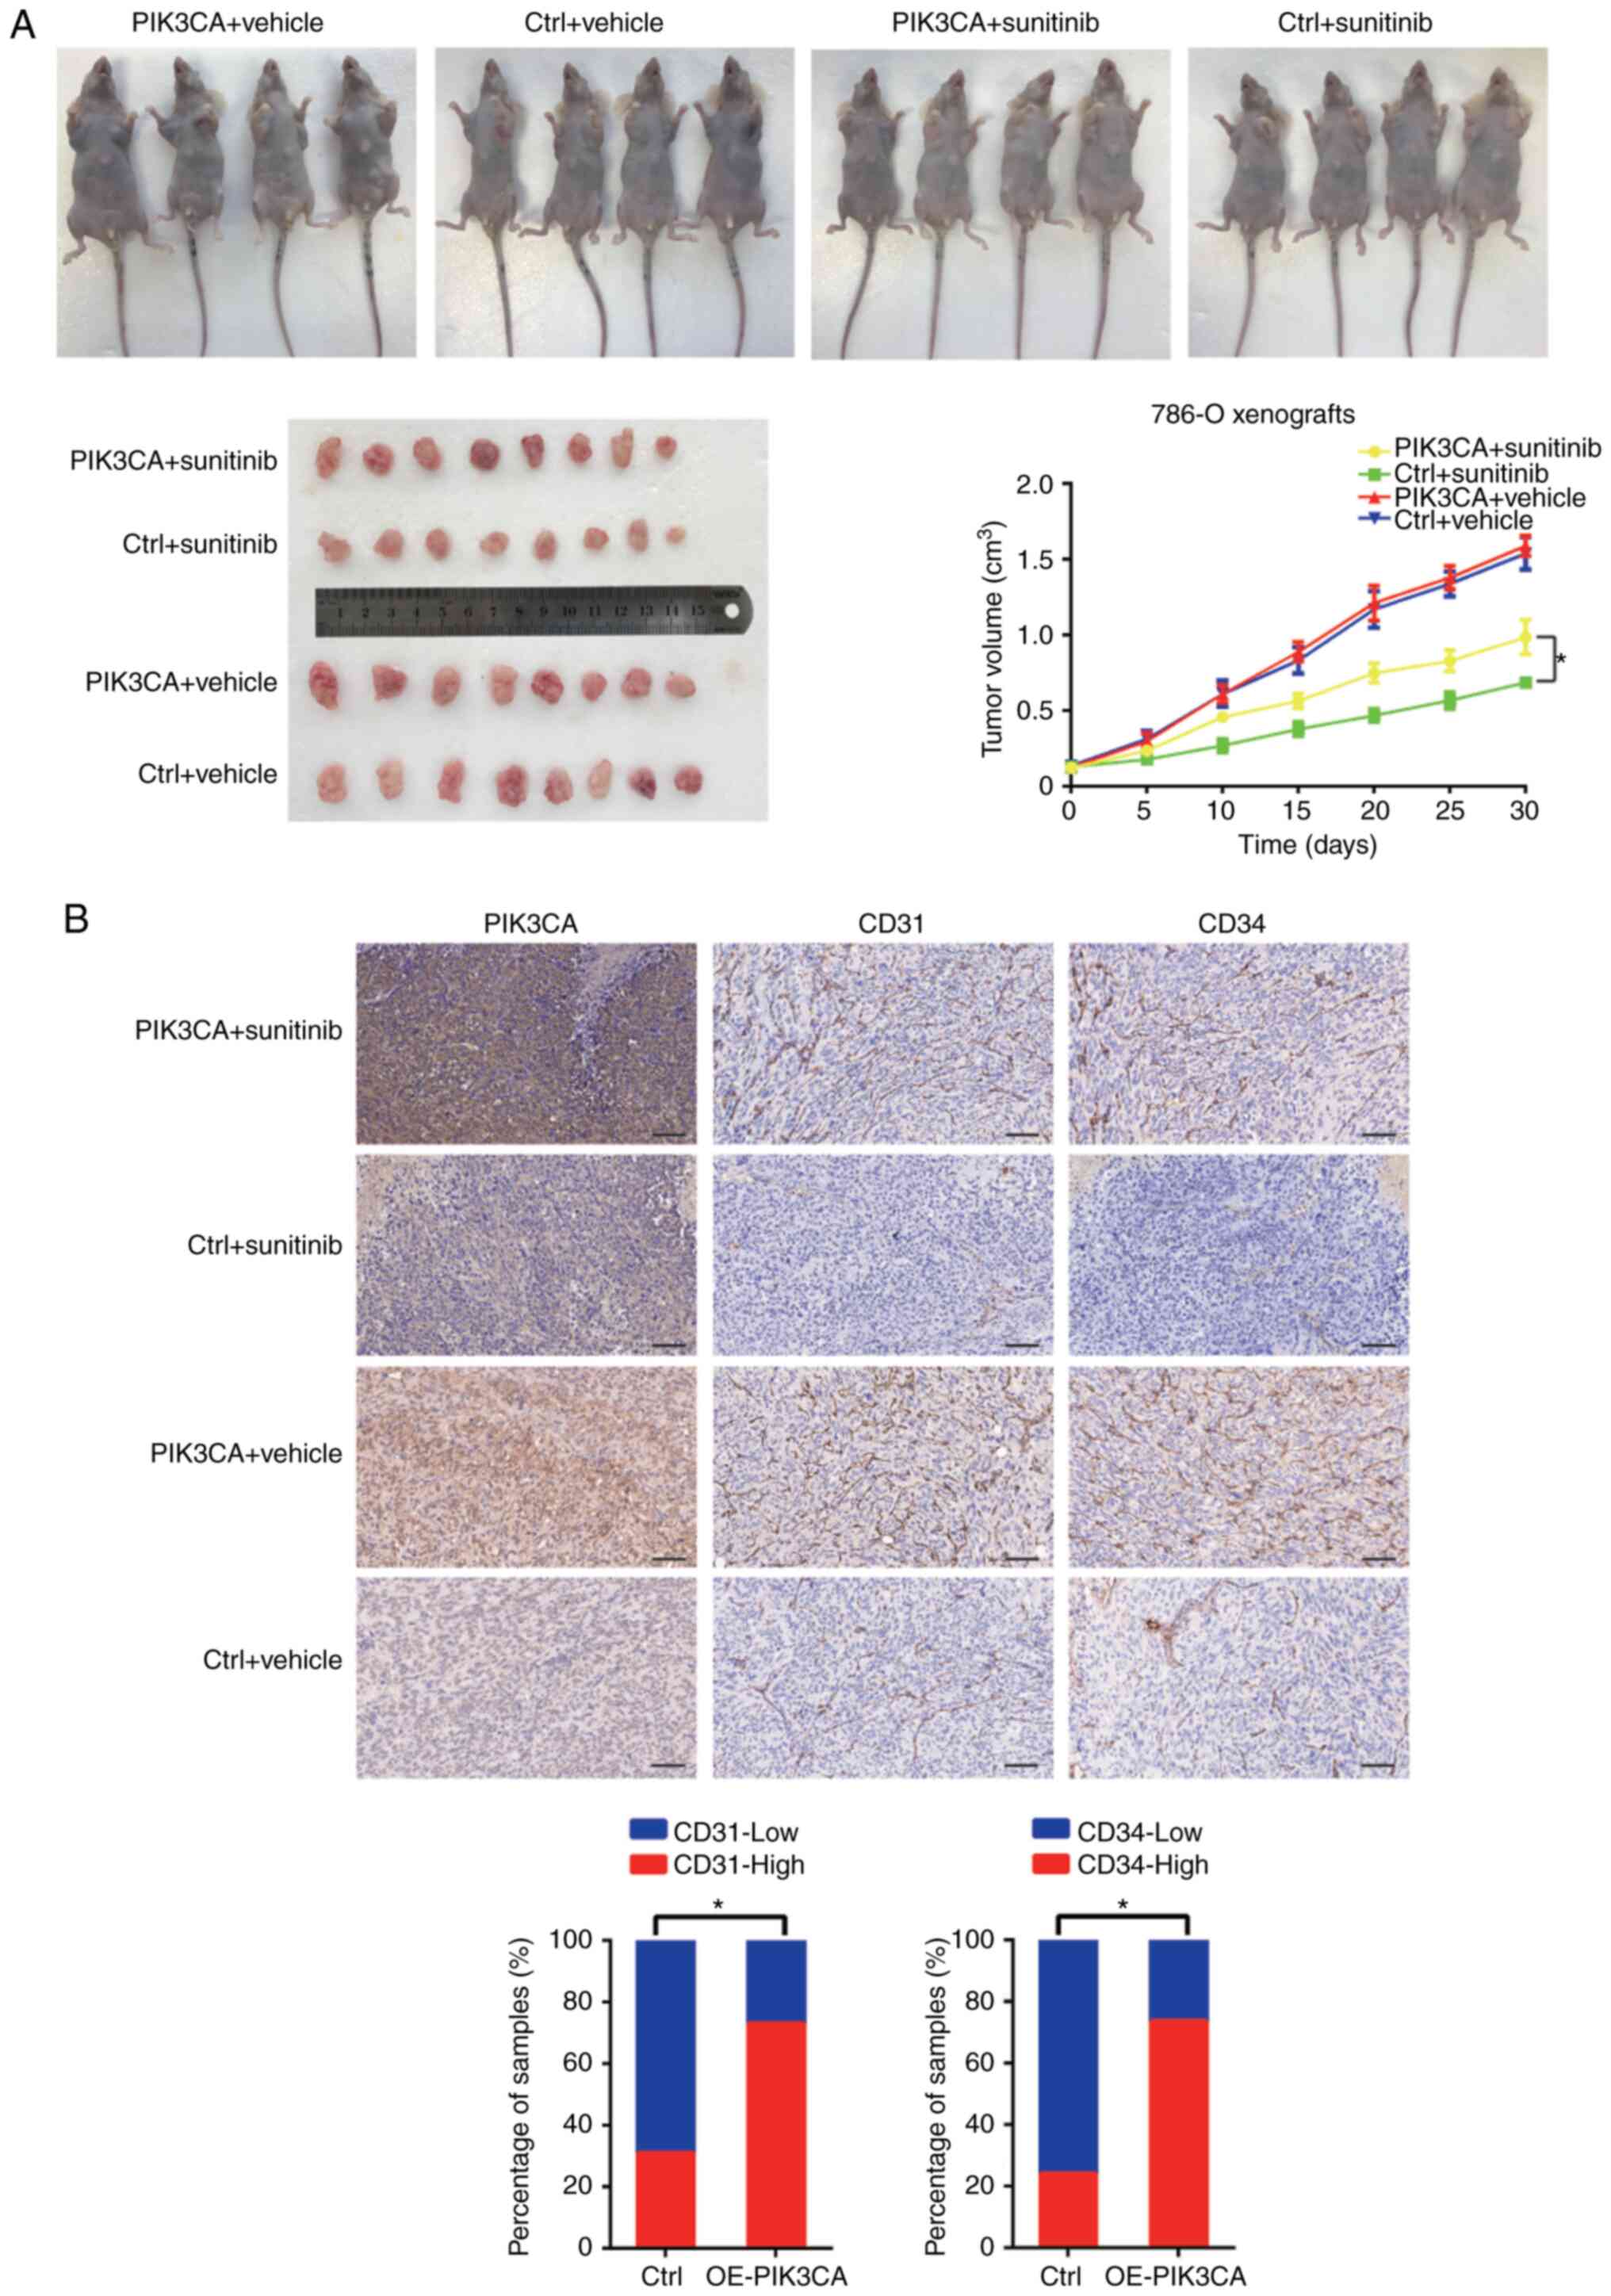
Overexpression of PIK3CA promotes
sunitinib resistance in RCC
To verify the role of PIK3CA in resistance to
sunitinib in RCC, the expression of PIK3CA was examined in RCC cell
lines by RT-qPCR (Fig. SIB) and
PIK3CA was then overexpressed in the 786-O and A498 cell lines
(Fig. 3E). Subsequently,
7×10⁶ lv-PIK3CA and lv-NC 786-O cells were inoculated
subcutaneously into the left and right side of male athymic BALB/c
nude mice. When the xenografts grew to 100 mm3,
sunitinib (40 mg/kg/day) or saline (control) were used for
intragastric administration in the mice. The results revealed that
the tumor xenografts formed from RCC cells overexpressing PIK3CA
exhibited worse responses to sunitinib (Fig. 6A). It was also found that the
expression levels of CD31 and CD34 were upregulated in the tumor
tissue overexpressing PIK3CA (Fig.
6B).
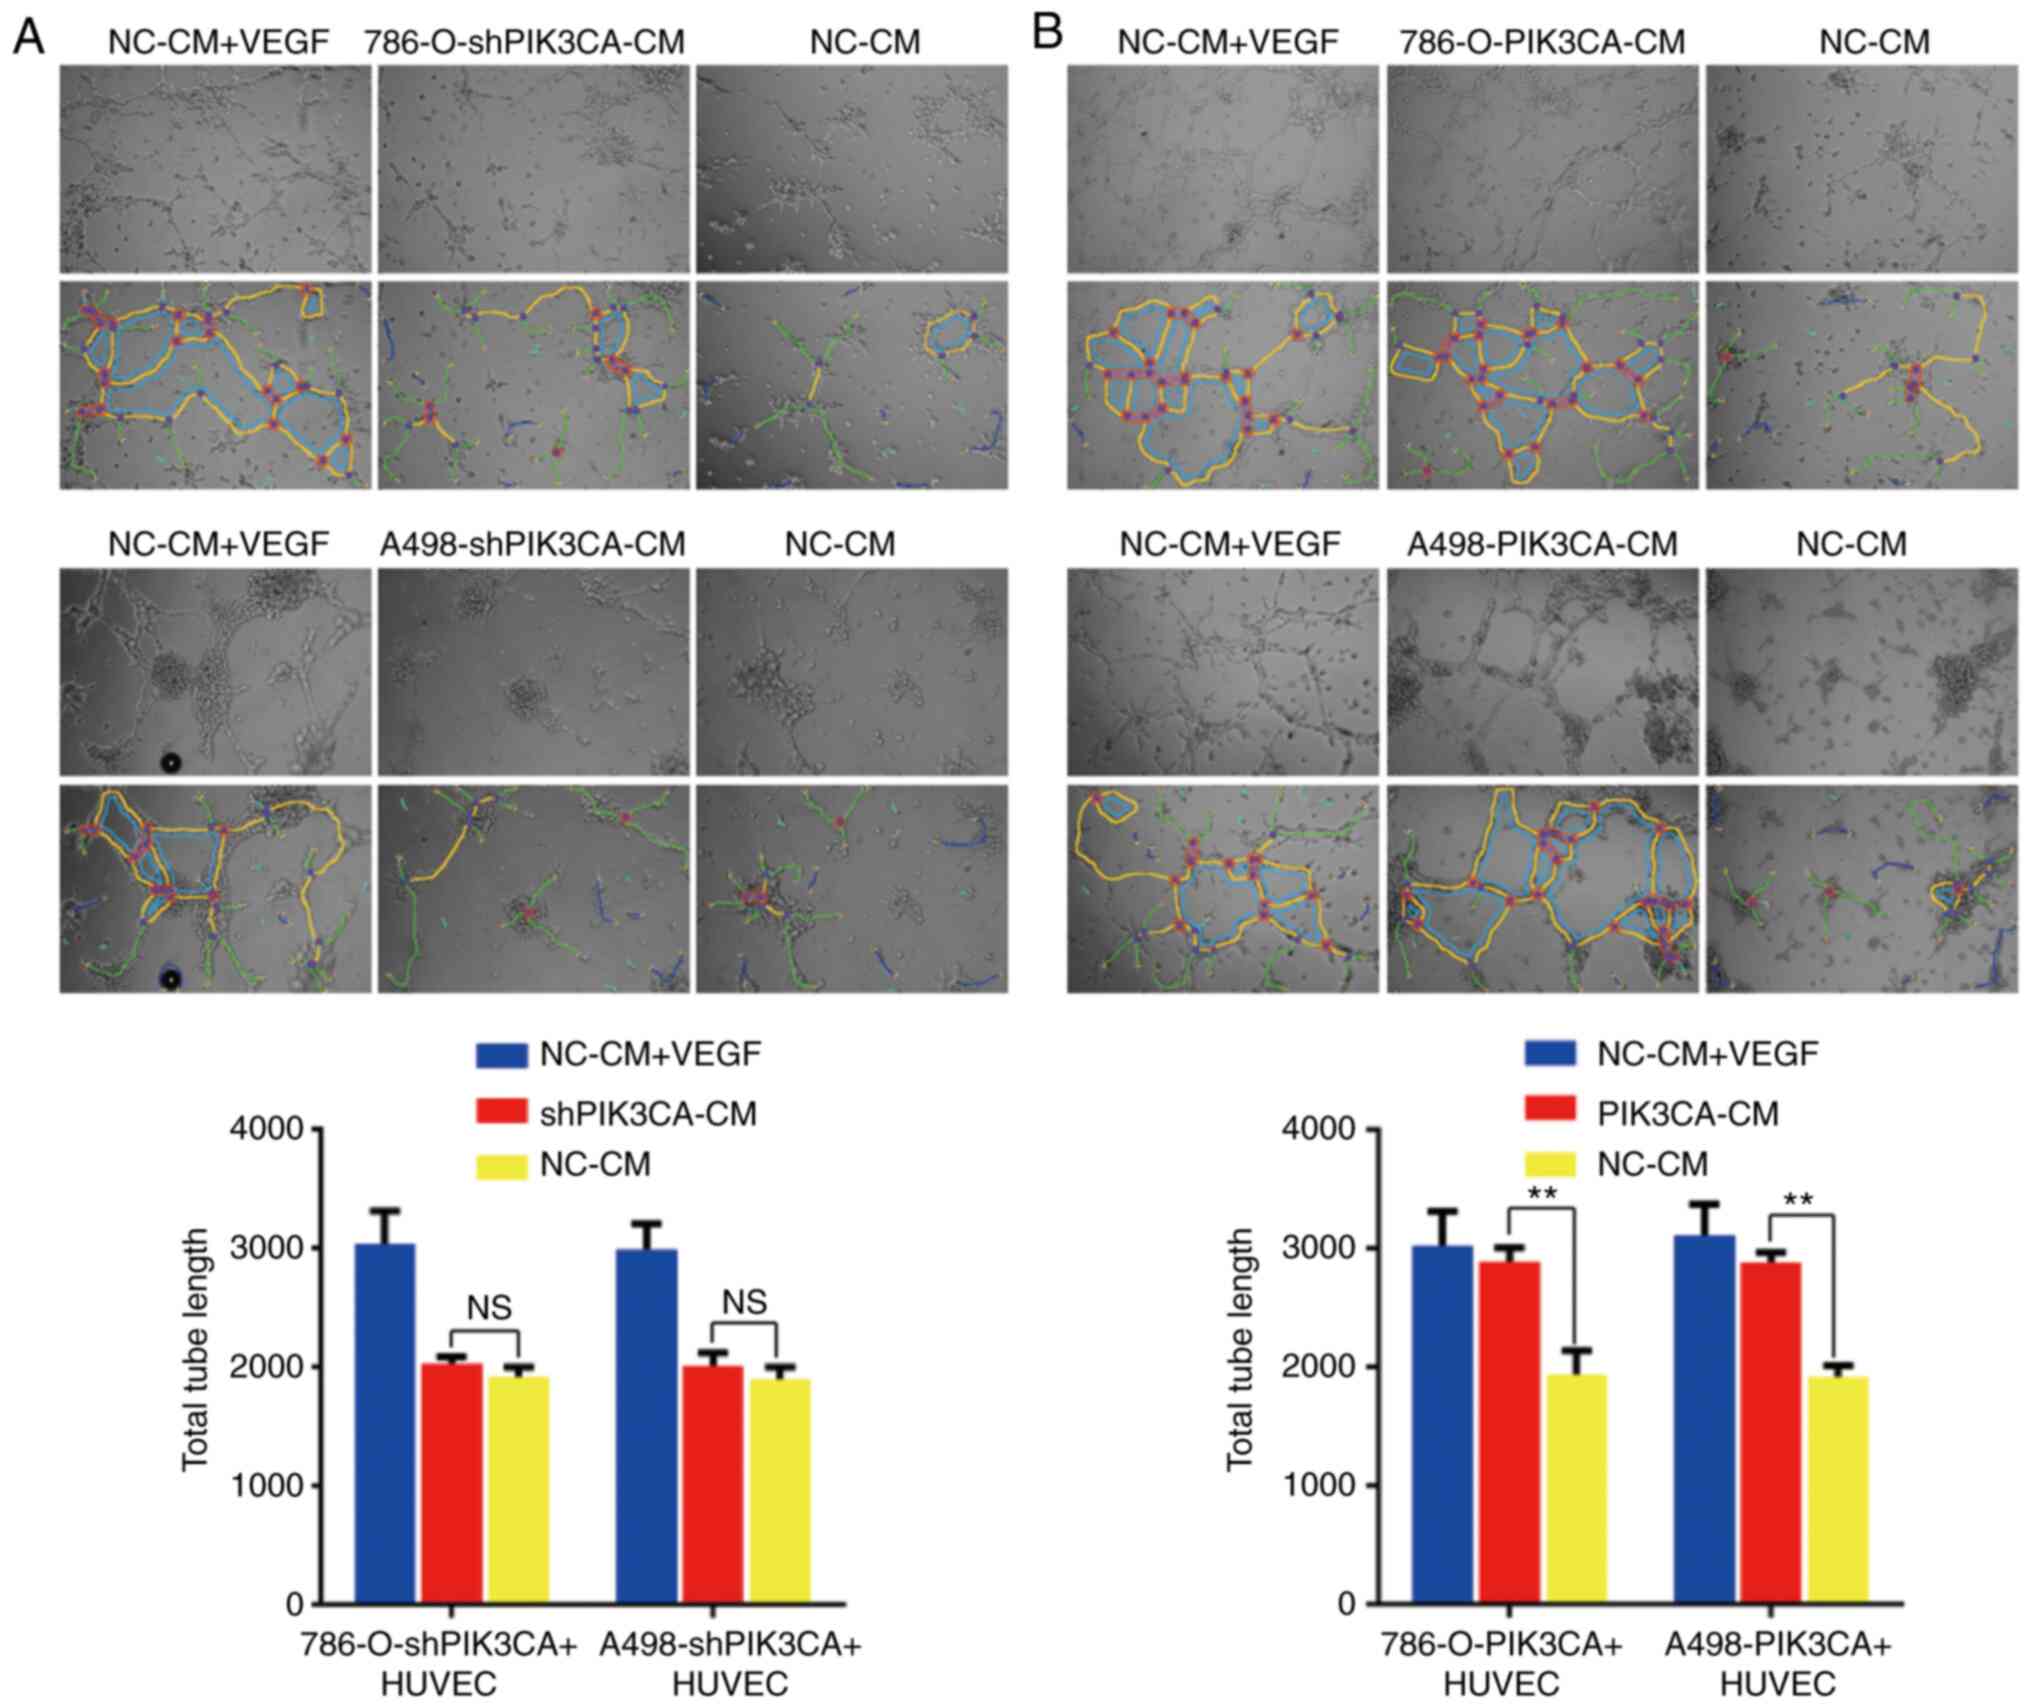
PIK3CA plays a role in angiogenesis in
RCC
Similarly, data were obtained in vitro.
PIK3CA expression was suppressed utilizing a shRNA against PIK3CA
in the 786-O and A498 cell lines (Fig. 3F). Significantly lower tube
formation was found when the HUVECs were incubated with the culture
supernatant of RCC cells in which PIK3CA was knocked down compared
with the positive group (Fig.
7A). By contrast, tube formation increased when the HUVECs were
incubated with the culture supernatant of RCC cells overexpressing
PIK3CA compared with the negative control group (Fig. 7B). These results were consistent
with those of certain previous studies suggesting that PIK3CA
overexpression promotes angiogenesis (19-22).
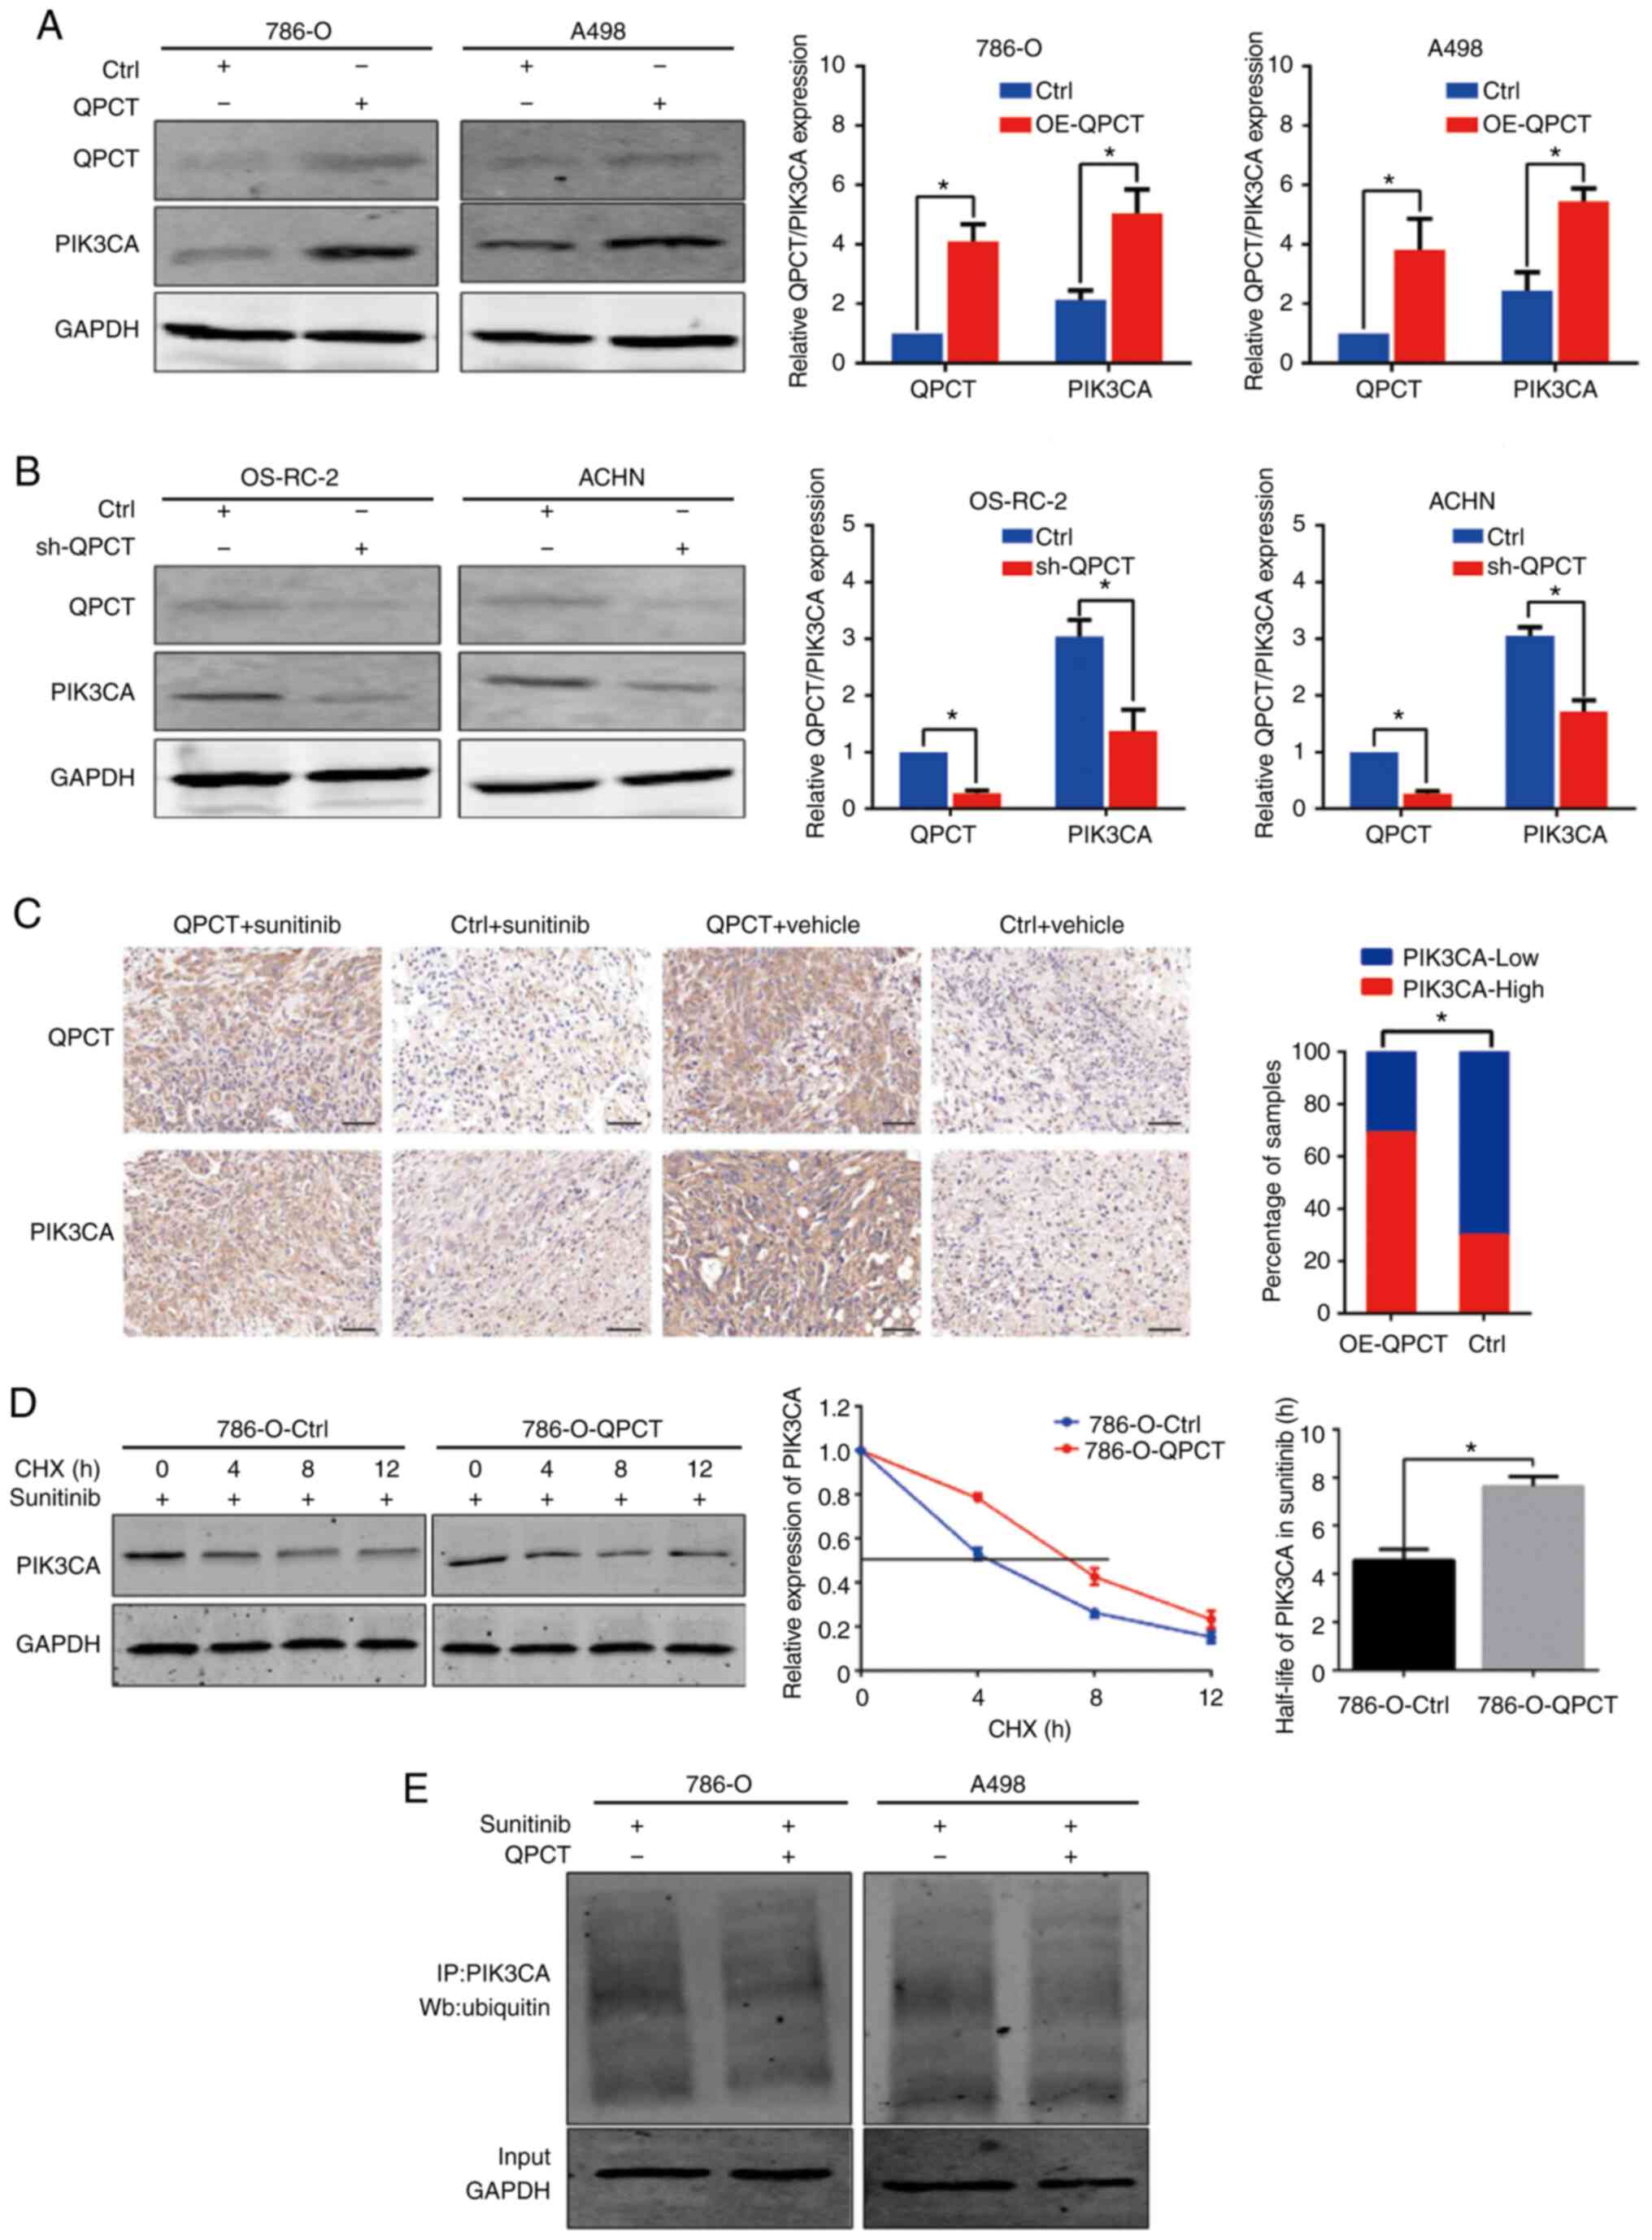
QPCT enhances the stability of PIK3CA by
reducing the degradation of PIK3CA ubiquitination
As QPCT mediates the post-translational modification
of proteins by converting N-terminal glutamate to pyroglutamate, it
renders proteins more resistant to protease degradation. The
present study found that PIK3CA expression was upregulated in RCC
cells that stably overexpressed QPCT (Fig. 8A), while PIK3CA expression was
downregulated when QPCT was knocked down (Fig. 8B). In addition,
immunohistochemistry of xenograft tumors derived from
QPCT-overexpressing and control 786-O cells also indicated that
PIK3CA expression was upregulated in response to QPCT
overexpression (Fig. 8C). Through
the chase experiment with CHX, it was found that QPCT inhibited the
degradation of PIK3CA, and when QPCT was overexpressed, the
half-life of PIK3CA was significantly prolonged, indicating that
the overexpression of QPCT enhanced the stability of PIK3CA
(Fig. 8D). In addition, ubiquitin
analysis revealed that the overexpression of QPCT attenuated PIK3CA
ubiquitin in the sunitinib-treated RCC cells (Fig. 8E).
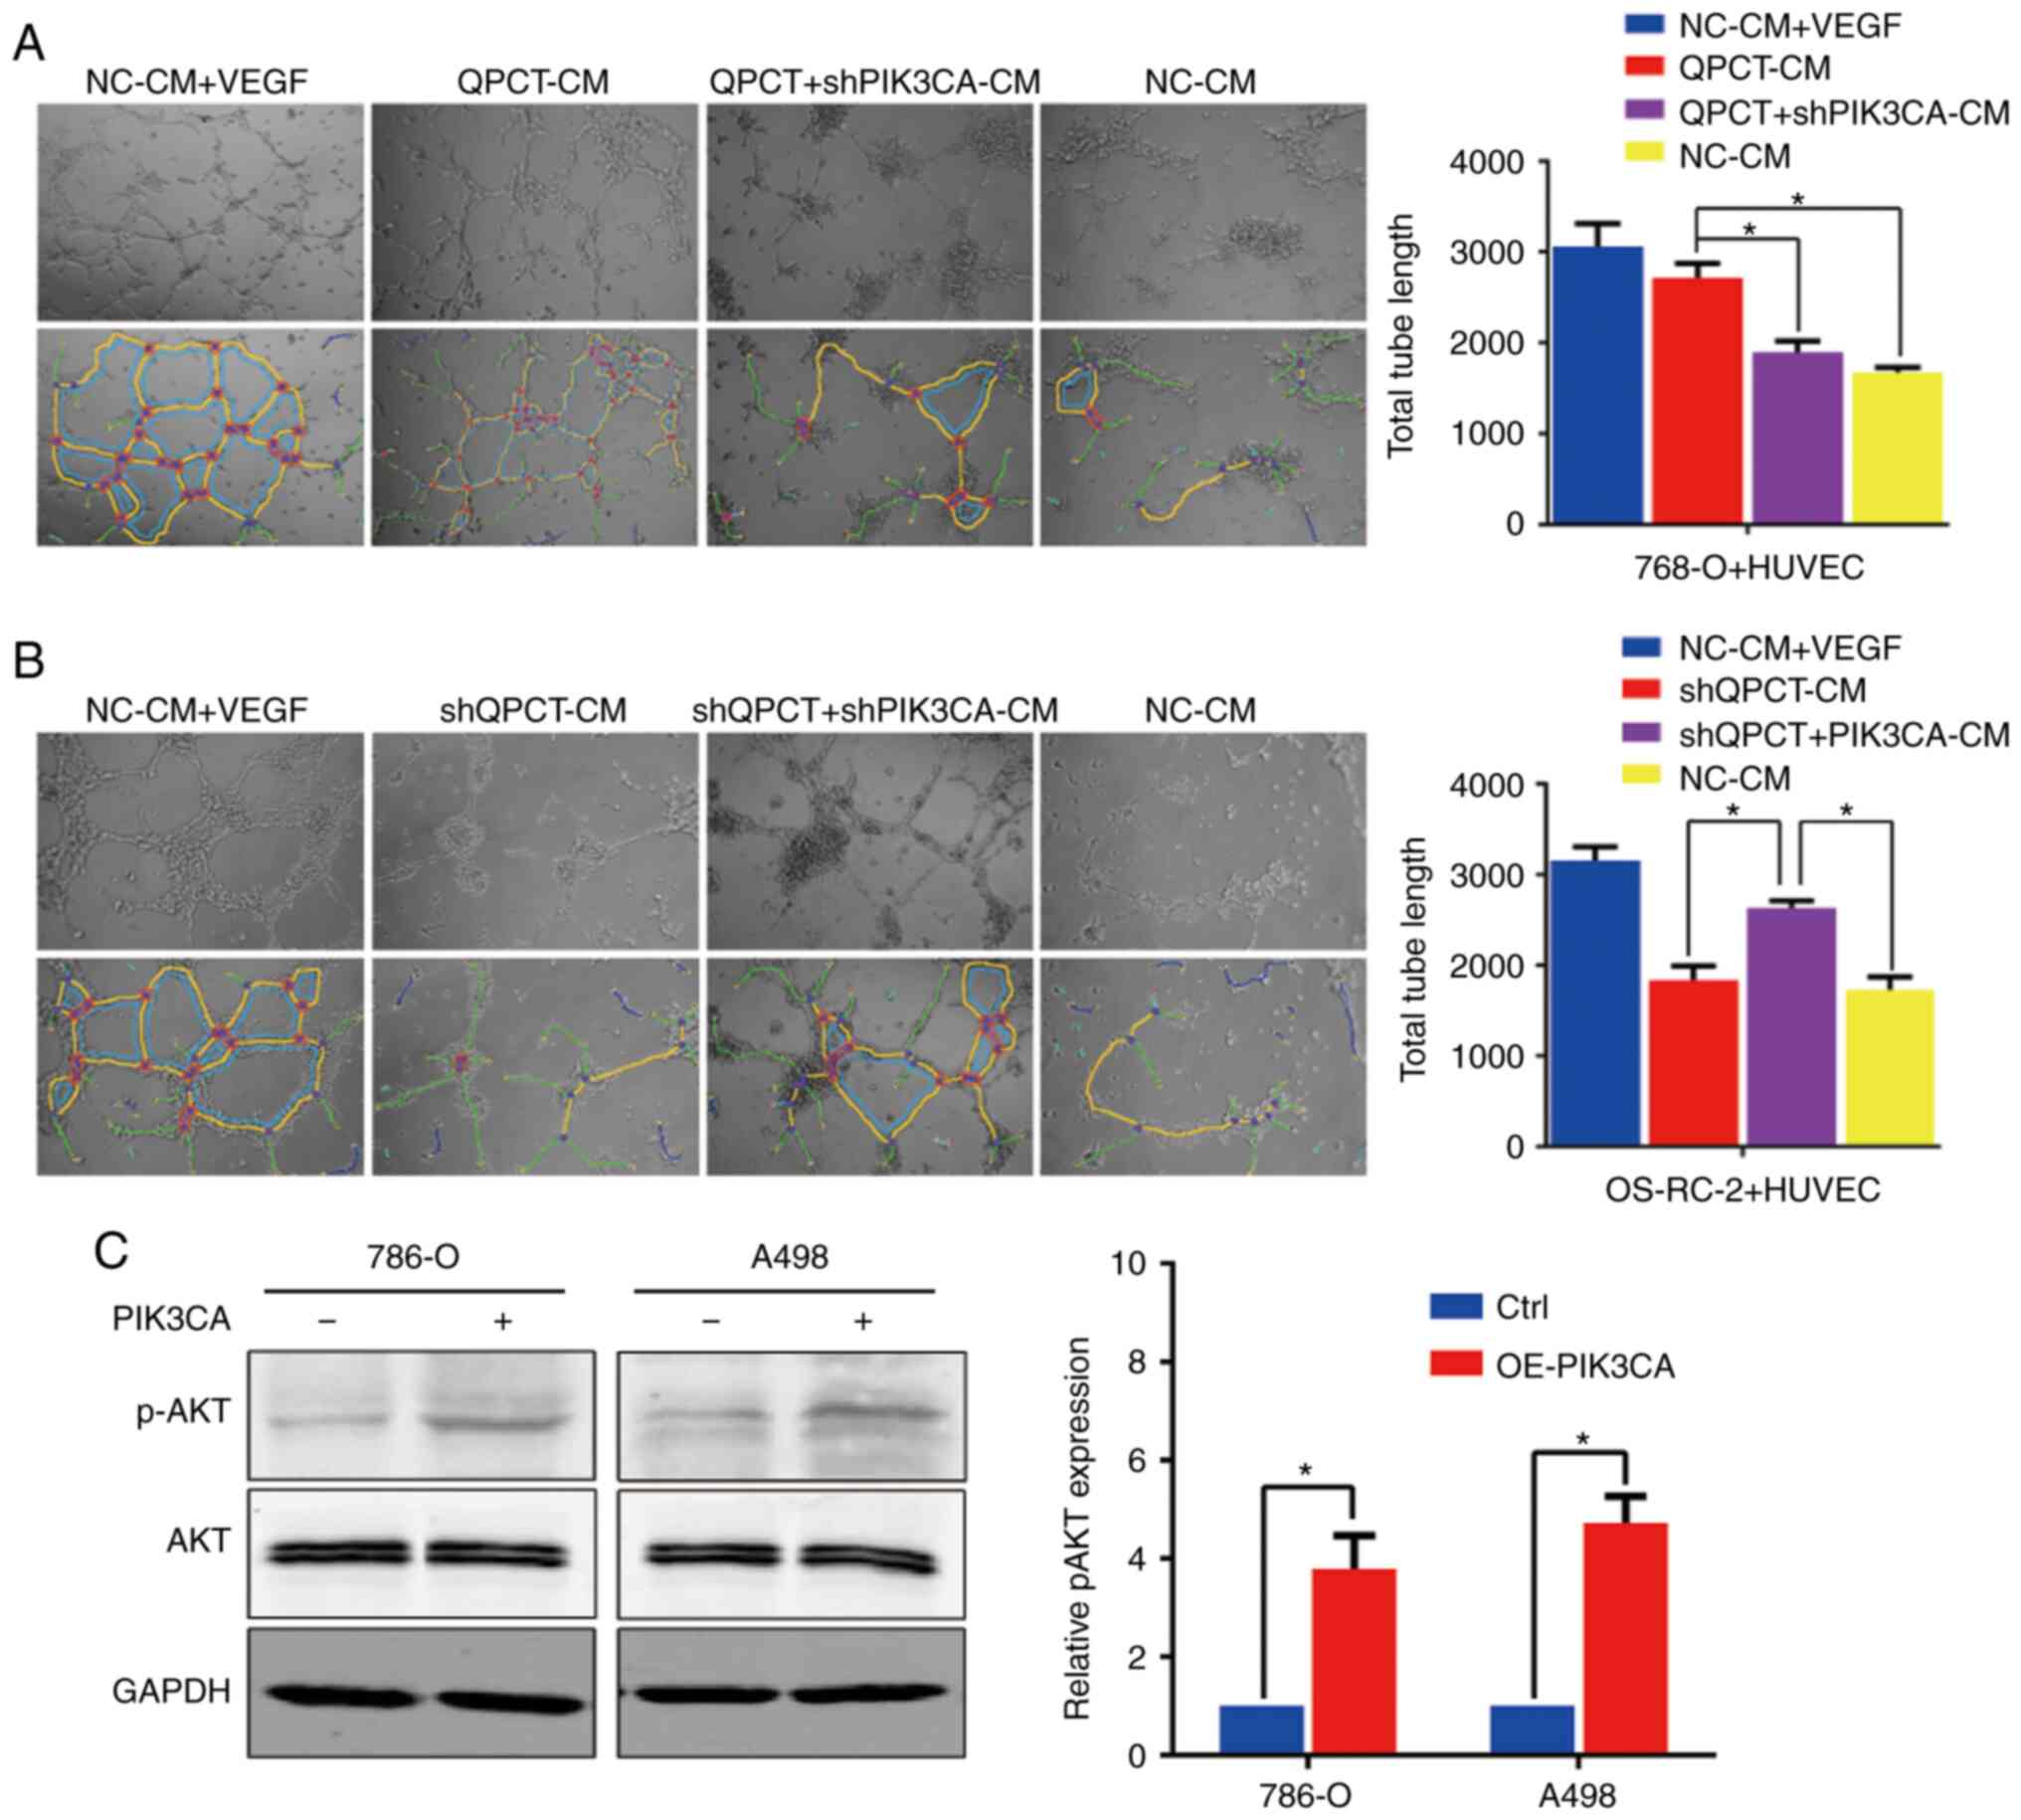
QPCT regulates angiogenesis through
PIK3CA, and p-AKT levels are upregulated when PIK3CA is
overexpressed
By the 'rescue method', it was found that the
knockdown of PIK3CA in QPCT-overexpressing cells weakened the tube
formation ability of HUVECs (Fig.
9A). Furthermore, the overexpression of PIK3CA in cells in
which QPCT was knocked down promoted tube formation of HUVECs
(Fig. 9B). Therefore, it was
suggested that QPCT promotes angiogenesis through PIK3CA. In the
PIK3CA-overexpressing RCC cells, although the total AKT expression
remained unaltered, p-AKT levels were upregulated, representing the
activation of the PI3K/AKT signaling pathway (Fig. 9C). On the whole, it was confirmed
that QPCT enhanced the stability of PIK3CA by reducing its
ubiquitination, thus promoting angiogenesis and resulting in
sunitinib resistance in RCC.
Discussion
The mechanisms of drug resistance can be divided
into the following: The activation of angiogenic signaling
pathways, the change in the tumor microenvironment, the enhancement
of tumor invasion and metastasis, the role of microRNAs and the
activation of other signaling pathways (23). Previous research has demonstrated
that angiogenic factors are upregulated in patients resistant to
sunitinib (24). In fact,
anti-angiogenesis-induced hypoxia activates the mTOR signaling
pathway, promotes HIF production and activates the transcription of
HRE-containing genes, including VEGF, PDGF, transforming growth
factor (TGF)-α, erythropoietin (EPO), matrix metalloproteinase
(MMP)-1, epidermal growth factor receptor (EGFR), hepatocyte growth
factor receptor (HGFR)/cMET, cyclin D1, stromal cell-derived factor
(SDF)1 and CXCR4. In addition, the key role of the changes in the
tumor microenvironment in sunitinib-resistance RCC has also been
confirmed (25). Some researchers
have highlighted the role of pericytes in sunitinib resistance in
RCC. Pericytes grow and cover endothelial cells after inhibiting
VEGF (26).
The QPCT gene encodes glutamylpeptidyl transferase,
which modifies proteins by converting N-terminal glutamate to
pyroglutamine. This renders the protein more resistant to protease
degradation, making it hydrophobic, neurotoxic, and easier to
aggregate (15). At present,
there are limited studies available on QPCT in tumors. Few have
reported the role of QPCT in thyroid cancer (27-29) and melanoma (30). In the present study, it was found
that QPCT was strongly associated with sunitinib resistance in RCC.
QPCT expression was increased in sunitinib-resistant RCC tissues
and plasma, and high QPCT levels predicted a poor response to
sunitinib in patients with RCC. It was further confirmed that the
downregulation of QPCT enhanced the sensitivity of RCC cells to
sunitinib, while its overexpression promoted resistance in
vitro and in vivo (14). Through transcription factor
prediction and ChIP assay verification, it was found that the
transcription factor CTCF binds to the QPCT promoter region and
negatively regulated its expression. CTCF, Zinc-finger protein, is
a multifunctional transcription factor widely expressed in
eukaryotes (31). CTCF is a
nuclear protein, which is widely spread across cell types. CTCF is
a multifunctional transcription factor that regulates gene
expression through various mechanisms, including the recruitment of
other coactivators and binding to target gene promoter regions.
Genetic alterations in CTCF have been found in a number of types of
cancer, such as liver cancer, lung cancer, stomach cancer and
breast cancer (32-34). The elimination of CTCF confirms
the multifunctional state of the protein, which is an important
factor in transcriptional regulation, unique ring formation, and
maintenance of chromatin structure, and is involved in protein
complexes, such as adhesion proteins in interchromatin and
chromatin inner rings (32-35). Abnormal CTCF expression has been
found to induce a number of diseases or disorders, including
various types of cancer (31,36). In particular, the downregulation
of CTCF is positively associated with the dysregulation of CpG
methylation patterns around genes known to be involved in
tumorigenesis such as tumor protein P53 (TRp53), DNA
methyltransferase 1a (DNMT4a), Runt-related transcription factor 1
(RUNX1) and CTCF] (37). DNA
methylation in CpG regions near CTCF regulatory genes (including
oncogenes) leads to unusable CTCF binding (31). This is consistent with our
previous research results (14).
It was found that in sunitinib-resistant RCC tissues, the
methylation level of the QPCT promoter region was significantly
changed (14), which may affect
the binding of CTCF with the QPCT promoter region, thus affecting
the expression of QPCT. Cancer genome sequencing revealed multiple
acquired mutations in CTCF, which turned out to be a tumor
suppressor gene. Thus, tumor growth is enhanced in the absence of
CTCF regulation of the relevant genes. The dysfunction of CTCF can
alter many cancer-related genes epigenetically (31,38).
Through human proteome microarray, co-IP,
immunofluorescence staining and confocal laser microscopy
observation, the present study found that QPCT bound to PIK3CA, and
PI3K/Akt/mTOR was one of the main intracellular signaling pathways.
PI3K signals regulate various cellular functions, including
translational regulation of cell proliferation, survival, protein
synthesis, glucose metabolism, cell migration and angiogenesis
(39-43). The disruption of this pathway
leads to a range of diseases, including cancer (44). PI3K/Akt/mTOR pathway plays an
important role in the regulation of angiogenesis in normal and
cancerous tissues (19-22,39). PI3K proteins are a family of lipid
kinases that are activated in growth factor receptor tyrosine
kinases (RTKs) and G-protein coupled receptor signaling. PIK3CA is
the most commonly associated gene in huma cancers that has been
shown to contain oncogenic mutations or amplifications (45).
In conclusion, the data of the present study
suggested that QPCT, which was negatively regulated by CTCF, could
enhance the stability of PIK3CA by reducing its ubiquitination,
thus promoting angiogenesis and leading to sunitinib resistance in
RCC. Therefore, QPCT and PIK3CA may prove to be novel targets for
the treatment or reversal of sunitinib resistance in RCC.
Supplementary Data
Availability of data and materials
The datasets used and/or analyzed during the current
study are available from the corresponding author on reasonable
request.
Authors' contributions
TZ and YZ conducted all experiments and analyzed the
data. XY, HH and QW provided support with the experimental
techniques. TZ, QW, SG, HH, SX, BD, JD and JG collected the
clinical data. TZ, HH and SX wrote the manuscript. TZ, YZ and HH
confirmed the authenticity of all the raw data. WZ, LW and LQ
provided the clinical samples, contributed to manuscript revision,
conceived the study and supervised all the experiments. All authors
have read approved the final manuscript.
Ethics approval and consent to
participate
All patients signed the informed consent before
participating in the study, and the plan was approved by the Ethics
Committee of Jinling Hospital. The accession number for this
approval was 2020DZGZRZX-008. The animal experiments were performed
in accordance with relevant guidelines and regulations for the care
and use of laboratory animals, with the approval of the
Institutional Animal Care and Use Committee at Jinling Hospital.
The accession number for this approval was 2020JLHGKJDWLS-47.
Patient consent for publication
Not applicable.
Competing interests
The authors declare that they have no competing
interests.
Acknowledgments
Not applicable.
Funding
The present study was supported by the National Natural Science
Foundation of China (grant nos. 82002700 and 82072836),
Postdoctoral Science Foundation of China (grant nos. 2020M673678),
and Postdoctoral Science Foundation of Jiangsu Province (grant no.
2020Z363).
Abbreviations:
|
RCC
|
renal cell carcinoma
|
|
QPCT
|
glutaminyl peptide
cyclotransferase
|
|
PIK3CA
|
phosphatidylinositol-4,5-bisphosphate
3-kinase catalytic subunit alpha
|
|
HUVECs
|
human umbilical vein endothelial
cells
|
|
VEGF
|
vascular endothelial growth factor
|
|
PFS
|
progression-free survival
|
|
PCR
|
polymerase chain reaction
|
|
IHC
|
immunohistochemistry
|
|
ChIP
|
chromatin immunoprecipitation
|
|
Co-IP
|
co-immunoprecipitation
|
References
|
1
|
Capitanio U and Montorsi F: Renal cancer.
Lancet. 387:894–906. 2016. View Article : Google Scholar
|
|
2
|
Siegel RL, Miller KD and Jemal A: Cancer
statistics, 2010. CA Cancer J Clin. 60:277–300. 2010. View Article : Google Scholar : PubMed/NCBI
|
|
3
|
Ljungberg B, Campbell SC, Choi HY, Jacqmin
D, Lee JE, Weikert S and Kiemeney LA: The epidemiology of renal
cell carcinoma. Eur Urol. 60:615–621. 2011. View Article : Google Scholar : PubMed/NCBI
|
|
4
|
Ljungberg B, Bensalah K, Canfield S,
Dabestani S, Hofmann F, Hora M, Kuczyk MA, Lam T, Marconi L,
Merseburger AS, et al: EAU guidelines on renal cell carcinoma: 2014
update. Eur Urol. 67:913–924. 2015. View Article : Google Scholar : PubMed/NCBI
|
|
5
|
Gupta K, Miller JD, Li JZ, Russell MW and
Charbonneau C: Epidemiologic and socioeconomic burden of metastatic
renal cell carcinoma (mRCC): A literature review. Cancer Treat Rev.
34:193–205. 2008. View Article : Google Scholar : PubMed/NCBI
|
|
6
|
Motzer RJ, Bacik J, Murphy BA, Russo P and
Mazumdar M: Interferon-alfa as a comparative treatment for clinical
trials of new therapies against advanced renal cell carcinoma. J
Clin Oncol. 20:289–296. 2002. View Article : Google Scholar : PubMed/NCBI
|
|
7
|
Motzer RJ, Hutson TE, Tomczak P,
Michaelson MD, Bukowski RM, Rixe O, Oudard S, Negrier S, Szczylik
C, Kim ST, et al: Sunitinib versus interferon alfa in metastatic
renal-cell carcinoma. N Engl J Med. 356:115–124. 2007. View Article : Google Scholar : PubMed/NCBI
|
|
8
|
National Comprehensive Cancer Network
(NCCN): NCCN Clinical Practice Guidelines in Oncology: Kidney
Cancer. Version 1.2017. www.nccn.org. Accessed February 6,
2017.
|
|
9
|
Escudier B, Porta C, Schmidinger M,
Rioux-Leclercq N, Bex A, Khoo V, Gruenvald V and Horwich A; ESMO
Guidelines Committee: Renal cell carcinoma: ESMO clinical practice
guidelines for diagnosis, treatment and follow-up. Ann Oncol.
27(Suppl 5): v58–v68. 2016. View Article : Google Scholar : PubMed/NCBI
|
|
10
|
Christensen JG: A preclinical review of
sunitinib, a multitargeted receptor tyrosine kinase inhibitor with
anti-angiogenic and anti-tumour activities. Ann Oncol. 18(Suppl
10): x3–10. 2007. View Article : Google Scholar
|
|
11
|
Faivre S, Demetri G, Sargent W and Raymond
E: Molecular basis for sunitinib efficacy and future clinical
development. Nat Rev Durg Discov. 6:734–745. 2007. View Article : Google Scholar
|
|
12
|
Oudard S and Elaidi RT: Sequential therapy
with targeted agents in patients with advanced renal cell
carcinoma: Optimizing patient benefit. Cancer Treat Rev.
38:981–987. 2012. View Article : Google Scholar : PubMed/NCBI
|
|
13
|
Molina AM, Lin X, Korytowsky B, Matczak E,
Lechuga MJ, Wiltshire R and Motzer RJ: Sunitinib objective response
in metastatic renal cell carcinoma: Analysis of 1059 patients
treated on clinical trials. Eur J Cancer. 50:351–358. 2014.
View Article : Google Scholar
|
|
14
|
Zhao T, Bao Y, Gan X, Wang J, Chen Q, Dai
Z, Liu B, Wang A, Sun S, Yang F and Wang L: DNA
methylation-regulated QPCT promotes sunitinib resistance by
increasing HRAS stability in renal cell carcinoma. Theranostics.
9:6175–6190. 2019. View Article : Google Scholar : PubMed/NCBI
|
|
15
|
Kehlen A, Haegele M, Menge K, Gans K,
Immel UD, Hoang-Vu C, Klonisch T and Demuth HU: Role of glutaminyl
cyclases in thyroid carcinomas. Endocr Relat Cancer. 20:79–90.
2013. View Article : Google Scholar
|
|
16
|
Livak KJ and Schmittgen TD: Analysis of
relative gene expression data using real-time quantitative PCR and
the 2(-Delta Delta C(T)) method. Methods. 25:402–408. 2001.
View Article : Google Scholar
|
|
17
|
Yu X, Petritis B and LaBaer J: Advancing
translational research with next-generation protein microarrays.
Proteomics. 16:1238–1250. 2016. View Article : Google Scholar : PubMed/NCBI
|
|
18
|
Shen SM, Ji Y, Zhang C, Dong SS, Yang S,
Xiong Z, Ge MK, Yu Y, Xia L, Guo M, et al: Nuclear PTEN safeguards
pre-mRNA splicing to link Golgi apparatus for its tumor suppressive
role. Nat Commun. 9:23922018. View Article : Google Scholar : PubMed/NCBI
|
|
19
|
Wu Z, Ai X, Hu H, Wang S, Wang Y, Kang F,
Ouyang C and Zhu J: Hematopoietic-substrate-1 associated protein
X-1 (HAX-1) regulates liver cancer cells growth, metastasis, and
angiogenesis through Akt. Cancer Biol Ther. 20:1223–1233. 2019.
View Article : Google Scholar : PubMed/NCBI
|
|
20
|
Zhang T, Yao Y, Wang J, Li Y, He P,
Pasupuleti V, Hu Z, Jia X, Song Q, Tian XL, et al:
Haploinsufficiency of Klippel-Trenaunay syndrome gene Aggf1
inhibits developmental and pathological angiogenesis by
inactivating PI3K and AKT and disrupts vascular integrity by
activating VE-cadherin. Hum Mol Genet. 25:5094–5110.
2016.PubMed/NCBI
|
|
21
|
Zhang L, Yang N, Katsaros D, Huang W, Park
JW, Fracchioli S, Vezzani C, Rigault de la Longrais IA, Yao W,
Rubin SC and Coukos G: The oncogene phosphatidylinositol 3′-kinase
catalytic subunit alpha promotes angiogenesis via vascular
endothelial growth factor in ovarian carcinoma. Cancer Res.
63:4225–4231. 2003.PubMed/NCBI
|
|
22
|
Murillo MM, Zelenay S, Nye E, Castellano
E, Lassailly F, Stamp G and Downward J: RAS interaction with PI3K
p110α is required for tumor-induced angiogenesis. J Clin Invest.
124:3601–3611. 2014. View Article : Google Scholar : PubMed/NCBI
|
|
23
|
Joosten SC, Hamming L, Soetekouw PM, Aarts
MJ, Veeck J, van Engeland M and Tjan-Heijnen VC: Resistance to
sunitinib in renal cell carcinoma: From molecular mechanisms to
predictive markers and future perspectives. Biochim Biophys Acta.
1855:1–16. 2015.
|
|
24
|
Fernando NT, Koch M, Rothrock C, Gollogly
LK, D'Amore PA, Ryeom S and Yoon SS: Tumor Escape from endogenous,
extracellular matrix-associated angiogenesis inhibitors by
up-regulation of multiple proangiogenic factors. Clin Cancer Res.
14:1529–1539. 2008. View Article : Google Scholar : PubMed/NCBI
|
|
25
|
Oudard S, Geoffrois L, Guillot A, Chevreau
C, Deville JL, Falkowski S, Boyle H, Baciuchka M, Gimel P, Laguerre
B, et al: Clinical activity of sunitinib rechallenge in metastatic
renal cell carcinoma-Results of the REchallenge with SUnitinib in
MEtastatic RCC (RESUME) Study. Eur J Cancer. 62:28–35. 2016.
View Article : Google Scholar : PubMed/NCBI
|
|
26
|
Bergers G and Hanahan D: Modes of
resistance to anti-angiogenic therapy. Nat Rev Cancer. 8:592–603.
2008. View Article : Google Scholar : PubMed/NCBI
|
|
27
|
Jarzab B, Wiench M, Fujarewicz K, Simek K,
Jarzab M, Oczko-Wojciechowska M, Wloch J, Czarniecka A, Chmielik E,
Lange D, et al: Gene expression profile of papillary thyroid
cancer: Sources of variability and diagnostic implications. Cancer
Res. 65:1587–1597. 2005. View Article : Google Scholar : PubMed/NCBI
|
|
28
|
Fluge Ø, Bruland O, Akslen LA, Lillehaug
JR and Varhaug JE: Gene expression in poorly differentiated
papillary thyroid carcinomas. Thyroid. 16:161–175. 2006. View Article : Google Scholar : PubMed/NCBI
|
|
29
|
Griffith OL, Melck A, Jones SJ and Wiseman
SM: Meta-analysis and meta-review of thyroid cancer gene expression
profiling studies identifies important diagnostic biomarkers. J
Clin Oncol. 24:5043–5051. 2006. View Article : Google Scholar : PubMed/NCBI
|
|
30
|
Gillis JS: Microarray evidence of
glutaminyl cyclase gene expression in melanoma: Implications for
tumor antigen specific immunotherapy. J Transl Med. 4:272006.
View Article : Google Scholar : PubMed/NCBI
|
|
31
|
Oh S, Oh C and Yoo KH: Functional roles of
CTCF in breast cancer. BMB Rep. 50:445–453. 2017. View Article : Google Scholar : PubMed/NCBI
|
|
32
|
Aitken SJ, Ibarra-Soria X, Kentepozidou E,
Flicek P, Feig C, Marioni JC and Odom DT: CTCF maintains regulatory
homeostasis of cancer pathways. Genome Biol. 19:1062018. View Article : Google Scholar : PubMed/NCBI
|
|
33
|
Bailey CG, Metierre C, Feng Y, Baidya K,
Filippova GN, Loukinov DI, Lobanenkov VV, Semaan C and Rasko JE:
CTCF expression is essential for somatic cell viability and
protection against cancer. Int J Mol Sci. 19:38322018. View Article : Google Scholar
|
|
34
|
Lee JY, Mustafa M, Kim CY and Kim MH:
Depletion of CTCF in breast cancer cells selectively induces cancer
cell death via p53. J Cancer. 8:2124–2131. 2017. View Article : Google Scholar : PubMed/NCBI
|
|
35
|
Ren G, Jin W, Cui K, Rodrigez J, Hu G,
Zhang Z, Larson DR and Zhao K: CTCF-mediated enhancer-promoter
interaction is a critical regulator of cell-to-cell variation of
gene expression. Mol Cell. 67:1049–1058.e6. 2017. View Article : Google Scholar : PubMed/NCBI
|
|
36
|
Höflmayer D, Steinhoff A, Hube-Magg C,
Kluth M, Simon R, Burandt E, Tsourlakis MC, Minner S, Sauter G,
Büscheck F, et al: Expression of CCCTC-binding factor (CTCF) is
linked to poor prognosis in prostate cancer. Mol Oncol. 14:129–138.
2020. View Article : Google Scholar
|
|
37
|
Kemp CJ, Moore JM, Moser R, Bernard B,
Teater M, Smith LE, Rabaia NA, Gurley KE, Guinney J, Busch SE, et
al: CTCF haploinsufficiency destabilizes DNA methylation and
predisposes to cancer. Cell Rep. 7:1020–1029. 2014. View Article : Google Scholar : PubMed/NCBI
|
|
38
|
Chan CS and Song JS: CCCTC-binding factor
confines the distal action of estrogen receptor. Cancer Res.
68:9041–9049. 2008. View Article : Google Scholar : PubMed/NCBI
|
|
39
|
Hosseini S, Behjati F, Rahimi M, Taheri N,
Khoram Khorshid H, Aghakhani Moghaddam F, Ghasemi S, Karimlou M,
Sirati F and Keyhani E: Relationship between PIK3CA amplification
and P110α and CD34 tissue expression as angiogenesis markers in
Iranian women with sporadic breast cancer. Iran J Pathol.
13:447–453. 2018.
|
|
40
|
Chou WC, Lin PH, Yeh YC, Shyr YM, Fang WL,
Wang SE, Liu CY, Chang PM, Chen MH, Hung YP, et al: Genes involved
in angiogenesis and mTOR pathways are frequently mutated in Asian
patients with pancreatic neuroendocrine tumors. Int J Biol Sci.
12:1523–1532. 2016. View Article : Google Scholar : PubMed/NCBI
|
|
41
|
Riquelme I, Tapia O, Espinoza JA, Leal P,
Buchegger K, Sandoval A, Bizama C, Araya JC, Peek RM and Roa JC:
The Gene Expression status of the PI3K/AKT/mTOR pathway in gastric
cancer tissues and cell lines. Pathol Oncol Res. 22:797–805. 2016.
View Article : Google Scholar : PubMed/NCBI
|
|
42
|
du Rusquec P, Blonz C, Frenel JS and
Campone M: Targeting the PI3K/Akt/mTOR pathway in estrogen-receptor
positive HER2 negative advanced breast cancer. Ther Adv Med Oncol.
12:1758835920940932020. View Article : Google Scholar
|
|
43
|
Sasore T and Kennedy B: Deciphering
combinations of PI3K/AKT/mTOR pathway drugs augmenting
Anti-angiogenic efficacy in vivo. PLoS One. 9:e1052802013.
View Article : Google Scholar
|
|
44
|
Bader AG, Kang S and Vogt PK:
Cancer-specific mutations in PIK3CA are oncogenic in vivo. Proc
Natl Acad Sci USA. 103:1475–1479. 2006. View Article : Google Scholar : PubMed/NCBI
|
|
45
|
De Santis MC, Gulluni F, Campa CC, Martini
M and Hirsch E: Targeting PI3K signaling in cancer: Challenges and
advances. Biochim Biophys Acta Rev Cancer. 1871:361–366. 2019.
View Article : Google Scholar : PubMed/NCBI
|