Introduction
Leukemia is a fatal malignancy of hematopoietic stem
cells and immature progenitors, presenting with increased
leucocytes in the blood and bone marrow (1,2).
Acute myeloid leukemia (AML), the most frequently diagnosed
leukemia in adults (3), includes
a group of malignant clonal disorders in the myeloid system with
significant functional somatic cell mutation and chromosome
translocation (4). Immature AML
cells generally accumulate rapidly in the blood and sometimes
metastasize to lymph nodes, spleen, liver and the central nervous
system (5). Genetic diseases,
ionizing radiation, cigarette smoking, benzene exposure,
chemotherapy, viruses and a high gestational age at birth are
positively associated with the occurrence of AML (6,7).
It is known that >50% of patients with AML are >65 years of
age and almost 30% are >75 years of age. Older-aged patients
with AML generally have poor outcomes due to age-related factors,
unfavorable cytogenetics, relapse following complete remission and
drug resistance (8). Ample
research has been performed with an aim to improve the prognosis of
patients with AML; however, the standard treatment for most newly
diagnosed AML subtypes has not changed over the past 40 years
(9). Thus, there remains an
urgent and clear need for the identification of novel AML
biomarkers and therapies, as well as personalized treatment methods
for patients with AML.
MicroRNAs (miRNAs or miRs), a class of small
non-coding RNAs, which serve as critical post-transcriptional
mediators of genes implicated in multiple fundamental processes,
such as differentiation, proliferation, apoptosis and cancer drug
resistance (10). miRNAs
participate in hematopoietic cell differentiation, and an aberrant
miRNA expression contributes to tumor progression, including
leukemia (11). miR-93 belongs to
the miR-106b-25 cluster, a subgroup of the miR-17-92 cluster
(12). miR-93 expression has been
demonstrated to be upregulated in patients with adult-T cell
leukemia (13). The dysregulated
expression of miR-93 has been shown to enhance the growth of
leukemia stem cells, prevent differentiation and reduce apoptosis,
thereby facilitating the progression of leukemia (14). A previous study reported the
elevated expression of miR-93 in the serum of patients with AML
(15). The detection of clinical
samples from patients with AML has revealed that miR-93 expression
positively correlates with vascular endothelial growth factor
(VEGF) expression, while VEGF promotes AML progression (16). Moreover, accumulating studies have
unveiled the promoting effects of miR-63 on tumor progression
(15,17-19). miR-93 has been reported to
function as an effective inhibitor of disabled 2 (DAB2) in lung
cancer (20). DAB2 is a
multifunctional scaffold protein that participates in cell growth,
differentiation, homeostasis, cell-cell interaction, and platelet
aggregation (21). DAB2 is a
binding protein that regulates adhesion and mitogen-activated
protein kinase activity in human chronic myeloid leukemia cells
(22). A recent study revealed
that the overexpression of DAB2 interactive protein inhibited the
activation of the phosphatidylinositol 3-kinase (PI3K)/protein
kinase B (AKT) pathway (23).
Martelli et al noted that targeting the PI3K/AKT/mTOR
pathway with small molecule inhibitors may lead to decreased
toxicity and improved the therapeutic effects in patients with AML
(24). In addition, miR-93 has
been shown to play a vital role in glioma progression via the
PI3K/AKT pathway (25).
In view of the above-mentioned information, it was
thus hypothesized speculated that miR-93, DAB2 and the PI3K/AKT
pathway are involved in the biological process of AML progression.
Therefore, the aim of the present study was to determine the roles
of miR-93, DAB2 and the PI3K/AKT pathway in AML and their
involvement in the progression of this disease.
Materials and methods
Ethics statement
The present study was approved and supervised by the
Ethics Committee of the Third Affiliated Hospital of Sun Yat Sen
University. All subjects signed an informed consent form. All
animal experiments involving nude mice were approved by the
Laboratory Animal Ethics Committee of the Third Affiliated Hospital
of Sun Yat Sen University. Significant efforts were made to
minimize both the number of animals and their suffering.
Study subjects
From October, 2016 to October, 2018, 28 patients
with AML (16 males and 12 females, aged 19-71 years, with a median
age of 46.2 years) diagnosed and treated at the Hematology
Department of Third Affiliated Hospital of Sun Yat Sen University
were enrolled in the present study. A total of 30 patients without
malignant hematological diseases excluded by bone marrow
examination during the same time period were included as the
control group. All patients with AML were diagnosed according to
the examinations of Morphology, Immunology, Cytogenetics and
Molecular Biology (MICM), and were in accordance with the Criteria
for Diagnosis and Therapeutic Effect of Hematological Diseases (3rd
edition) (26). Mononuclear cells
from the bone marrow of enrolled subjects were isolated and frozen
in liquid nitrogen for future use. Mononuclear cells were isolated
from the bone marrow using the hydroxyethyl starch precipitation
method. Briefly, the bone marrow fluid was centrifuged at 450 × g
for 10 min at room temperature to remove plasma and supplemented
with the same volume of normal saline with plasma and mixed well.
The mixture was then mixed with 6% hydroxyethyl starch (BA740193,
Precedex; Hospira; Pfizer, Inc.) in a ratio of 1:4 and kept at room
temperature for 40 min. The supernatant was centrifuged at 450 × g
for 5 min at room temperature to obtain the cell precipitate,
washed normal saline twice, and prepared into a cell
suspension.
Cells and cell culture
AML cell lines (Kasumi-1, THP-1, and HL60, cat. nos.
3142C0001000000322, 3111C0001CCC 000057 and 3111C0001CCC000037
respectively) purchased from the Cell Bank of Experimental Medical
Center of China Union Medical University (Beijing, China) and the
normal bone marrow cell line (HS-5, cat. no. CRL-11882) purchased
from the American Type Culture Collection (ATCC) were cultured in
Roswell Park Memorial Institute (RPMI)-1640 medium containing 10%
inactivated fetal bovine serum (FBS) in an incubator (37°C, 5%
CO2). After cultured in a conventional manner, the cells
in the exponential growth phase were obtained for use in subsequent
experiments. 293T cells (ATCC, cat. no. CRL-1573) were cultured in
Dulbecco's modified Eagle's medium (DMEM) under the same
conditions.
Transfection and grouping
The sequences of the recombinant overexpression
vector pZsGreen1-miR-93 (oe-miR-93), interference vector
pLL3.7-anti-miR-93, and their negative control (NC) were designed
by Shanghai GenePharma Co., Ltd. and synthesized by Invitrogen;
Thermo Fisher Scientific, Inc. Following enzyme digestion, the
vectors were sequenced by Shanghai Genechem Co., Ltd. Following
amplification and extraction, the recombinant plasmid
pZsGreen1-miR-93 was digested with restriction enzymes Kpn
and BamHI overnight. Following amplification and extraction,
the recombinant plasmid pLL3.7-anti-miR-93 was digested with
restriction enzymes XbaI and NotI overnight. The
digested products were electrophoresed respectively. The results of
electrophoresis following digestion were all recombinant vectors as
the digested sites of recombinant plasmids no longer existed. The
results of DNA sequencing confirmed that the target sequence was
inserted into the skeleton plasmid correctly, and the sequence was
identical with the expected sequence.
One day prior to lentivirus infection, the THP-1,
HL60 and HS-5 cells of the 3rd passage were seeded into 6-well
plates at 3×10⁵ cells/well. When the cell confluence
reached 70%, the cells were transfected with 2.5 μg
corresponding lentivirus vectors using Lipofectamine®
3000 reagent (Thermo Fisher Scientific, Inc.). The cells were
randomly assigned to the control group (cells were cultured
routinely), oe-miR-93 or oe-NC group (THP-1 cells of the 3rd
passage were cultured with the overexpression vector,
pZsGreen1-miR-93 or its NC), and anti-miR-93 or anti-NC group (HL60
cells of the 3rd passage were cultured with interference vector
pLL3.7-anti-miR-93 or its NC). The medium was refreshed at 24 h
following transfection. Cell fluorescence was observed under a
fluorescence microscope (FSX100, Olympus Corporation) after 72
h.
3-(4,5-Dimethylthiazol-2-yl)-2,5-diphenyltetrazolium bromide (MTT)
assay
Cells were seeded in 96-well plates at a density of
5,000 cells/well in an incubator (37°C, 5% CO2).
Following culture for 0, 24, 48 and 72 h, 20 μl of 5 mg/ml
MTT solution (Sigma-Aldrich; Merck KGaA) were added to each well
with subsequent incubation at 37°C for 4 h. Subsequently, 200
μl of dimethyl sulfoxide were added and the cells were
placed in a vibrating apparatus for 10 min. The absorbance at 490
nm was measured using a microplate reader (Bio-Rad 680, Bio-Rad
Laboratories, Inc.).
Ethynyl-2′-deoxyuridine (EdU) assay
A Cell-Light EdU fluorescence detection kit
(Guangzhou RiboBio Co., Ltd.) was used to detect EdU-positive cells
according to the manufacturer's instructions. The cells were seeded
into 96-well plates (5,000 cells/well), added with 100 μl
medium containing 50 μmol/l EdU, and cultured at 37°C with
5% CO2 for 2 h. The cells were then washed with PBS 3
times and each well was supplemented with 100 μl PBS
solution containing 4% paraformaldehyde to fix the cells at room
temperature for 30 min. Following PBS washing, each well was
supplemented with 100 μl PBS solution containing 0.5%
TritonX-100 to increase membrane permeability. Following PBS
washing again, each well was added with 100 μl
Apollo® staining reaction solution (provided with the
kit) and cultured at room temperature in the dark for 30 min. The
staining reaction solution was discarded and each well was
supplemented with 100 μl DAPI (C1002, Beyotime Institute of
Biotechnology, Inc.) at room temperature in the dark for 30 min.
Following PBS washing, the staining effect was observed under
fluorescence microscope (FSX100, Olympus Corporation) and images
were collected. The images were analyzed using Olympus stream
system. The total number of nuclei (blue) and proliferating cells
(red) were counted respectively. EdU-positive cell
rate=proliferating cells/total cells ×100%. The experiment was
repeated three times.
Flow cytometry
Cells were centrifuged at room temperature and 1,000
× g for 1 min and collected following trypsin detachment, and 2
μl of 1 mg/ml RNase A (prepared by deionized water) were
added at 37°C for 40 min to remove the RNA. Cells were treated with
propidium iodide (PI) staining solution and incubated at room
temperature without exposure to light for 20 min. Finally, the cell
cycle distribution was detected using a flow cytometer
(MoFloAstrios EQ, Beckman Coulter, Inc.).
The cells were centrifuged and collected following
trypsin detachment. To each tube, 100 μl 1X Annexin binding
buffer was added to resuspend the cell precipitates. Alexa Fluor
488 Annexin V-fluorescein isothiocyanate (FITC) and 1 μl of
100 mg/ml PI staining solution were mixed and added to the cells,
followed by incubation at room temperature for 15 min without light
exposure. Apoptotic cells were measured with a flow cytometer
(MoFloAstrios EQ, Beckman Coulter, Inc.).
Hoechst 33258 staining
THP-1 and HL60 cells in exponential phase were
seeded at 1×10⁵ cells/ml into 6-well plates on a
coverslip. Following culture at 37°C with 5% CO2 for 24
h, the cells were fixed for 10 min, and stained with Hoechst 33258
dye (Shanghai, Beyotime Biotechnology Co., Ltd.) for 5 min in the
dark. The cells were then placed on a slide covered in an
anti-fluorescence quenching agent (E675011-0005, BBI Life Sciences
Corporation). The slides were observed and photographed using a
fluorescence microscope (FSX100, Olympus Corporation).
Reverse transcription-quantitative
polymerase chain reaction (RT-qPCR)
TRIzol (Invitrogen; Thermo Fisher Scientific, Inc.)
was used to extract total RNA from bone marrow monocytes, leukemic
cell lines and normal bone marrow cells, and the extracted
high-quality RNA was examined using ultraviolet analysis and
formaldehyde denaturation electrophoresis. A total of 1 μg
RNA was reverse transcribed into cDNA using avian myeloblastosis
virus reverse transcriptase (M5101, Promega, Corporation). qPCR was
conducted using the SYBR-Green system (Beijing Labest Biotechnology
Co., Ltd.) with U6 as an internal reference gene for miR-93 and
β-actin as an internal reference gene for DAB2 and other genes. PCR
primers were designed and synthesized by Shanghai Sangon
Biotechnology Co., Ltd. and are presented in Table I. The PCR system included 1.0
μl cDNA, 10 μl 2X SYBR-Green mix, 0.5 μl of
forward primer (10 μM), 0.5 μl reverse primer (10
μM), and was supplemented into 20 μl with RNase-free
water. The PCR conditions were as follows: Pre-denaturation at 94°C
for 5 min, 40 cycles of denaturing at 94°C for 40 sec, annealing at
60°C for 40 sec, and extension at 72°C for 60 sec, and a final
extension at 72°C for 10 min. The products were verified by agarose
gel electrophoresis. The data were analyzed using the
2−ΔΔCq method (27),
indicating multiple associations between the experimental group and
the control group. ΔΔCt=[Ct (target gene)-Ct (internal reference
gene)] experimental group-[Ct (target gene)-Ct (internal reference
gene)] control group.
 | Table IPrimer sequences used for
RT-qPCR. |
Table I
Primer sequences used for
RT-qPCR.
| Genes | Sequences |
|---|
| miR-93 | F:
5′-GAAGATCTACCTTCACTGAGAGGGTGGT-3′ |
| R:
5′-CGGAATTCACCAGACCCTTTTGAACGCC-3′ |
| U6 | F:
5′-CTCGCTTCGGCAGCACA-3′ |
| R:
5′-AACGCTTCACGAATTTGCGT-3′ |
| DAB2 | F:
5′-TGGACGATGTGCTCTATGCC-3′ |
| R:
5′-GGATGGTGATGGTTTGGTAG-3′ |
| TGFBR2 | F: 5′-CCTGAGAGGAGAT
GAAGTAG-3′ |
| R:
5′-CTTAAAGTATAAGAGCCTGCA-3′ |
| ITGB8 | F:
5′-CGTGACTTTCGTCTTGGATTTGG-3′ |
| R:
5′-TCCTTTCGGGGTGGATGCTAA-3′ |
| CDKN1A | F:
5′-CGATGGAACTTCGACTTTGTCA-3′ |
| R:
5′-GCACAAGGGTACAAGACAGTG-3′ |
| BTG3 | F:
5-ATGAAGAATGAAATTGCTGCCGTTG-3′ |
| R:
5′-GTGAGGTGCTAACATGTGAGGATT-3′ |
| β-actin | F:
5-TGAGCGCGGCTACAGCTT-3′ |
| R:
5′-TCCTTAATGTCACGCACGATTT-3′ |
Western blot analysis
Protein was extracted from the cells and the
concentration was determined using a bicinchoninic acid kit (Boster
Biological Technology Co., Ltd.), following the manufacturer's
instructions. The extracted proteins were mixed with loading
buffer, boiled at 95°C for 10 min, loaded (each for 30 μg)
and separated via 10% polyacrylamide gel electrophoresis (Boster
Biological Technology Co., Ltd.). Subsequently, the proteins were
transferred onto polyvinylidene fluoride membranes and the
membranes were incubated in 5% bovine serum albumin (BSA) at room
temperature for 1 h. Membranes were incubated with the following
primary antibodies at 4°C overnight: p21 (1:500, ab218311), cyclin
D1 (1/200, ab16663), caspase3 (1:500, ab13847), Bax (1:1,000,
ab32503), Bcl-2 (1:500, ab185002), DAB2 (2 μg/ml, ab33441),
transforming growth factor beta receptor II (TGFBR2, 1:2,000,
ab186838), integrin beta8 (ITGB8, 1 μg/ml, ab80673),
cyclin-dependent kinase (CDK) inhibitor p21 (CDKN1A, 1:500,
ab102013), B-cell translocation gene 3 (BTG3, 1:1,000, ab197399),
AKT (1:10,000, ab179463), p-AKT (1:500, ab38449), PI3K (1:1,000,
ab32089) and p-PI3K (1:500, ab182651) (all from Abcam). The
membranes were rinsed using Tris-buffered saline containing 0.05%
Tween-20 (TBST) and then incubated for 1 h with the secondary
antibody (1:5,000, ZB-2301, ZSGB-Bio Co., Ltd.) at room
temperature. The membranes were then washed with TBST and developed
using a chemiluminescence reagent. Protein bands were visualized
using the Gel Doc EZ imager (Bio-Rad Laboratories, Inc.). The
target band was examined using ImageJ software (National Institutes
of Health) for gray value analysis.
Bioinformatics analysis
The target genes of miR-93 were predicted through
TargetScan (http://www.targetscan.org/vert_71/) (28), miRBase (http://www.mirbase.org/) (29), MicroRNA.org
(http://www.microrna.org) (30), and PicTar (https://pictar.mdc-berlin.de/) (31).
Dual-luciferase reporter gene assay
The DAB2 3′-untranslated region (3′UTR) sequence
containing the binding site of miR-93 was synthesized and a DAB2
3′UTR wild-type plasmid (DAB2-WT) was constructed. Based on
DAB2-WT, the DAB2 3′UTR mutant-type (MUT) plasmid (DAB2-MUT) was
constructed. The plasmids were purchased from Promega Corporation.
DAB2-WT and DAB2-MUT plasmids were mixed with NC and miR-93 mimics
(GenePharma Co., Ltd.) respectively, and then transfected into 293T
cells using Lipofectamine® 3000. Each group was
co-transfected with 800 ng recombinant plasmid, and the final
concentration of mimics was 20 nmol/l. The cells were collected and
lysed following transfection for 48 h. Luciferase activity was
measured using a luciferase detection kit (BioVision, Inc.) using a
Glomax 20/20 luminometer (Promega Corporation). With Renilla
luciferase as the internal reference, the relative light unit (RLU)
measured by Firefly luciferase was divided by the RLU measured by
Renilla luciferase to normalize the data of each group.
Xenograft tumors in nude mice
BALB/c male nude mice (aged, 4-6 weeks; weighing,
16-18 g; Beijing Vital River Laboratory Animal Technology Co.,
Ltd.) were raised in a specific pathogen-free animal center. A
volume of 1×10⁷ THP-1 cells/100 μl was
subcutaneously injected into the armpit of the right forelimb of
each nude mouse. Tumor volume was measured every 7 days according
to the following formula: V=L × W2 × 0.5, where L
represents the long diameter of the tumor and W represents the
short diameter. Tumor growth curves were drawn. Mice were
euthanized by cervical dislocation 35 days later and tumors were
peeled off along the subcutaneous side and weighed for
immunohistochemistry.
Immunostaining
For immunofluorescence, the cells were fixed with 4%
paraformaldehyde solution and treated with Triton X-100 (Guangzhou
Eskin Biotechnology Co., Ltd.). The cells were then incubated with
p-AKT (1:100, ab38513, Abcam) antibody at 4°C overnight followed by
incubation with FITC-labeled goat anti-rabbit immunoglobulin G
(IgG, 1:200, ab150077, Abcam). The cells were then stained with
4′,6-diamidino-2-phenylindole (DAPI). Briefly, the slide was added
with DAPI (1 μg/ml, Beyotime Institute of Biotechnology),
incubated at room temperature in the dark, and washed with PBS. The
cell fluorescence and localization were observed under an inverted
fluorescence microscope (FSX100, Olympus Corporation). The
fluorescence intensity of p-AKT was quantified using the Olympus
Stream system.
For immunohistochemistry, after weighing, the tumors
were fixed in 4% paraformaldehyde for 24 h, dehydrated in an
alcohol gradient, embedded in paraffin, sectioned at 4 μm,
dewaxed with xylene and ethanol, and placed in 0.01 mol/l citric
acid buffer. Subsequently, the sections were incubated with 3%
H2O2 for 15 min at 37°C, rinsed with
distilled water for 5 min, immersed in PBS for 5 min, and incubated
with primary antibodies (Ki67: 1:500, ab92742, Abcam; survivin:
1:1,000, ab76424, Abcam; p53: 1:100, ab32389, Abcam) at 4°C
overnight. The following day, the sections were incubated with the
corresponding secondary antibodies (goat anti-rabbit IgG H&L
(HRP): 1:1,000, ab6721, Abcam) and placed in a constant temperature
box at 37°C for 40 min. The sections were developed with
2,4-diaminobutyric acid, counterstained with hematoxylin at room
temperature for 1 min, differentiated, washed with cold water,
dehydrated and sealed. Positively stained sections were observed
and photographed under an optical microscope (Olympus
Corporation).
Statistical analysis
SPSS 21.0 (IBM Corp.) was used for data analysis.
The Kolmogorov-Smirnov test revealed that the data were normally
distributed. The data are presented as the means ± standard
deviation, or count and percentage (categorical variables). The
diagnostic efficacy of miR-93 in patients with AML was analyzed
using the receiver operating characteristic (ROC) curve.
Correlation analysis was performed using the Pearson's correlation
coefficient. Comparisons between 2 groups were performed using the
Student's t-test or Chi-squared test, and comparisons among
multiple groups were performed using one-way analysis of variance
(ANOVA), followed by Tukey's multiple comparisons test. P-values
were obtained using a two-tailed test, and P<0.05 was considered
to indicate a statistically significant difference.
Results
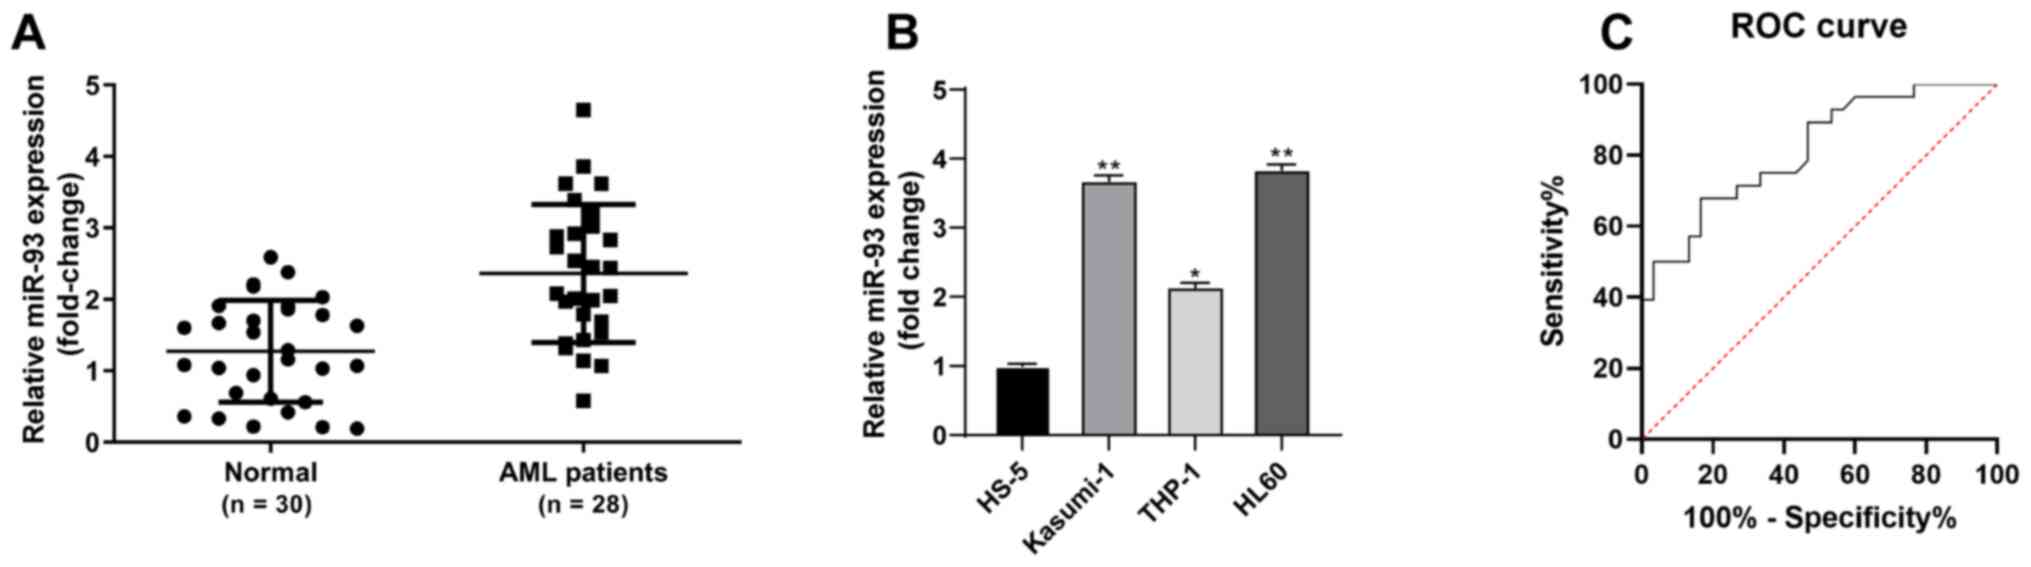
High miR-93 expression in patients with
AML and AML cells
The present study sought to investigate the
association between miR-93 expression and AML. The results of
RT-qPCR revealed that miR-93 expression was notably higher in bone
marrow-derived monocytes from patients with AML than in
non-malignant hematological patients (P<0.05, Fig. 1A). miR-93 expression was also
upregulated in AML cells (Kasumi-1, THP-1 and HL-60) compared to
normal bone marrow cells (HS-5) (all P<0.05). miR-93 exhibited
the highest expression in HL60 cells and the lowest in the THP-1
cells (Fig. 1B). Of the patients
with AML, 14 were allocated to the low expression group and 14 to
the high expression group, with a median value of miR-93 expression
as the critical threshold, as previously described (32). The distribution of sex, age
French-American-British (FAB) classification and white blood cells
(WBC) were analyzed. The WBC levels of patients with a high miR-93
expression were significantly higher than those with a low miR-93
expression (P<0.05); however, there were no significant
differences in sex, age and FAB classification between the 2 groups
(P>0.05; Table II). The
diagnostic efficacy of miR-93 in patients with AML was analyzed
using the ROC curve, and the area under the curve was 0.8143
(sensitivity, 0.6786; specificity, 0.8333), indicating that miR-93
expression was clinically significant for the diagnosis of AML
(Fig. 1C).
| Table IIAssociation between miR-93 expression
and the clinical characteristics of patients with AML. |
Table II
Association between miR-93 expression
and the clinical characteristics of patients with AML.
| Clinical data | miR-93 expression
in AML tissues
|
χ2/F-value | P-value |
|---|
| Low expression
(n=14) | High expression
(n=14) |
|---|
| Sex | | | | |
| Male | 9 (64.29%) | 7 (50.00%) | 0.583 | 0.445 |
| Female | 5 (35.71%) | 7 (50.00%) | | |
| Age, years; median
(range) | 45.5 (19-63) | 45.0 (34-71) | 1.341 | 0.897 |
| FAB
classification | | | | |
| M0 | 1 (7.14%) | 2 (14.29%) | 5.082 | 0.406 |
| M1 | 8 (57.14%) | 3 (21.43%) | | |
| M2 | 3 (21.43%) | 4 (28.57%) | | |
| M3 | 0 (0.00%) | 2 (14.29%) | | |
| M4 | 1 (7.14%) | 2 (14.29%) | | |
| M5 | 1 (7.14%) | 1 (7.14%) | | |
| M6 | 0 (0.00%) | 0 (0.00%) | - | - |
| WBC
(×109/l); median (range) | 48.13
(30.98-122.85) | 85.69
(21.59-166.16) | 1.272 | <0.001 |
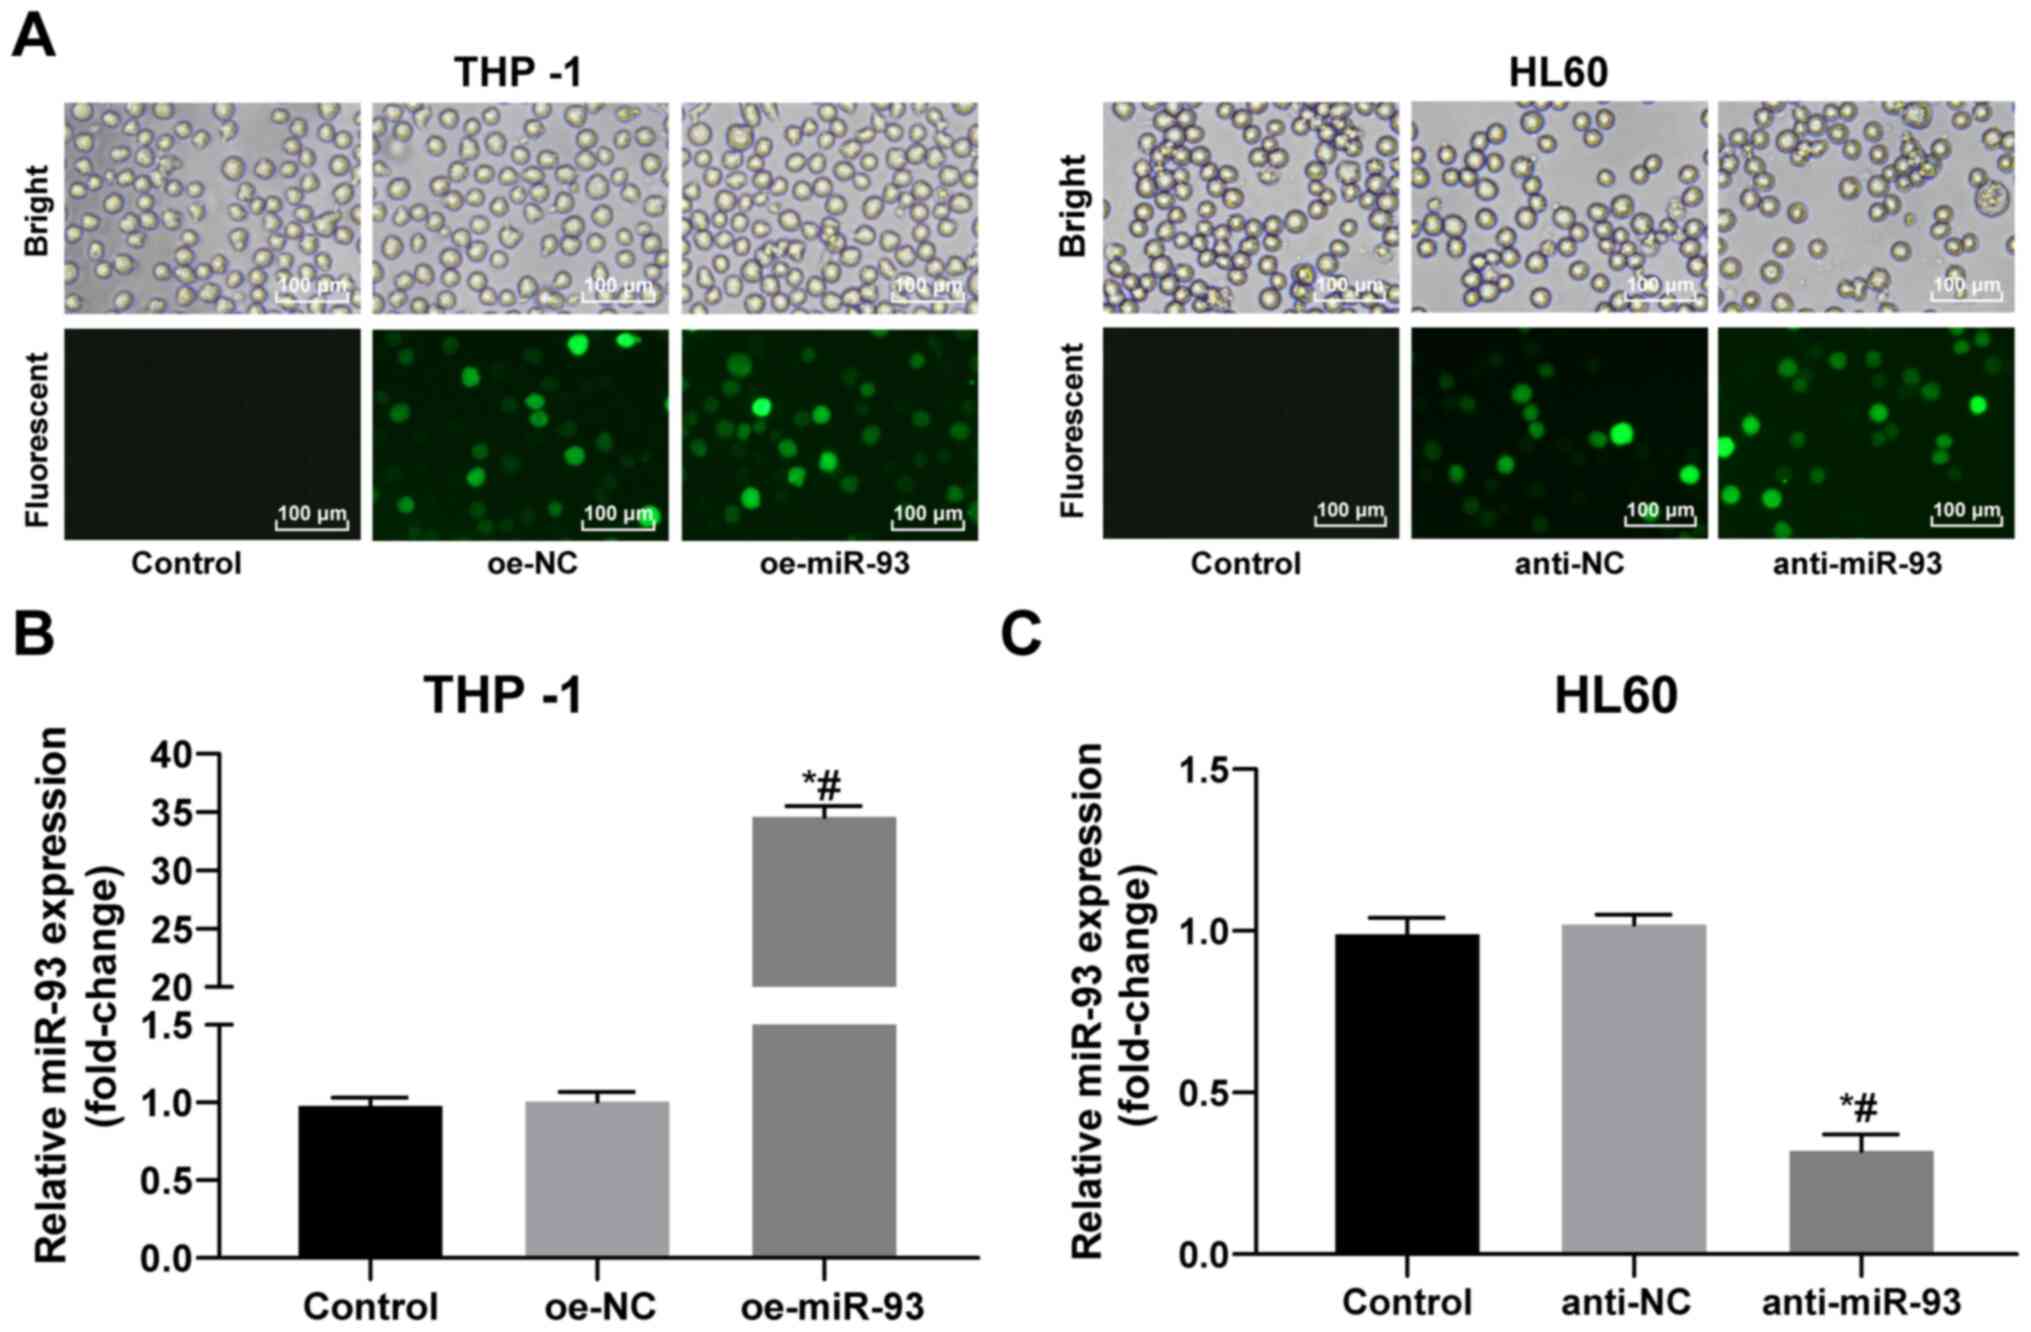
Construction of miR-93 lentiviral
expression vector and lentiviral interference vector
Following 72 h of transfection with a recombinant
lentivirus, the THP-1 and HL60 cells grew well. Compared with the
control group, the transfected cells exhibited extensive green
fluorescence (Fig. 2A). miR-93
expression in the THP-1 and HL60 cells following transfection was
detected by RT-qPCR. miR-93 expression was increased in the THP-1
cells and decreased in the HL60 cells, indicating successful
transfection (all P<0.05; Fig. 2B
and C).
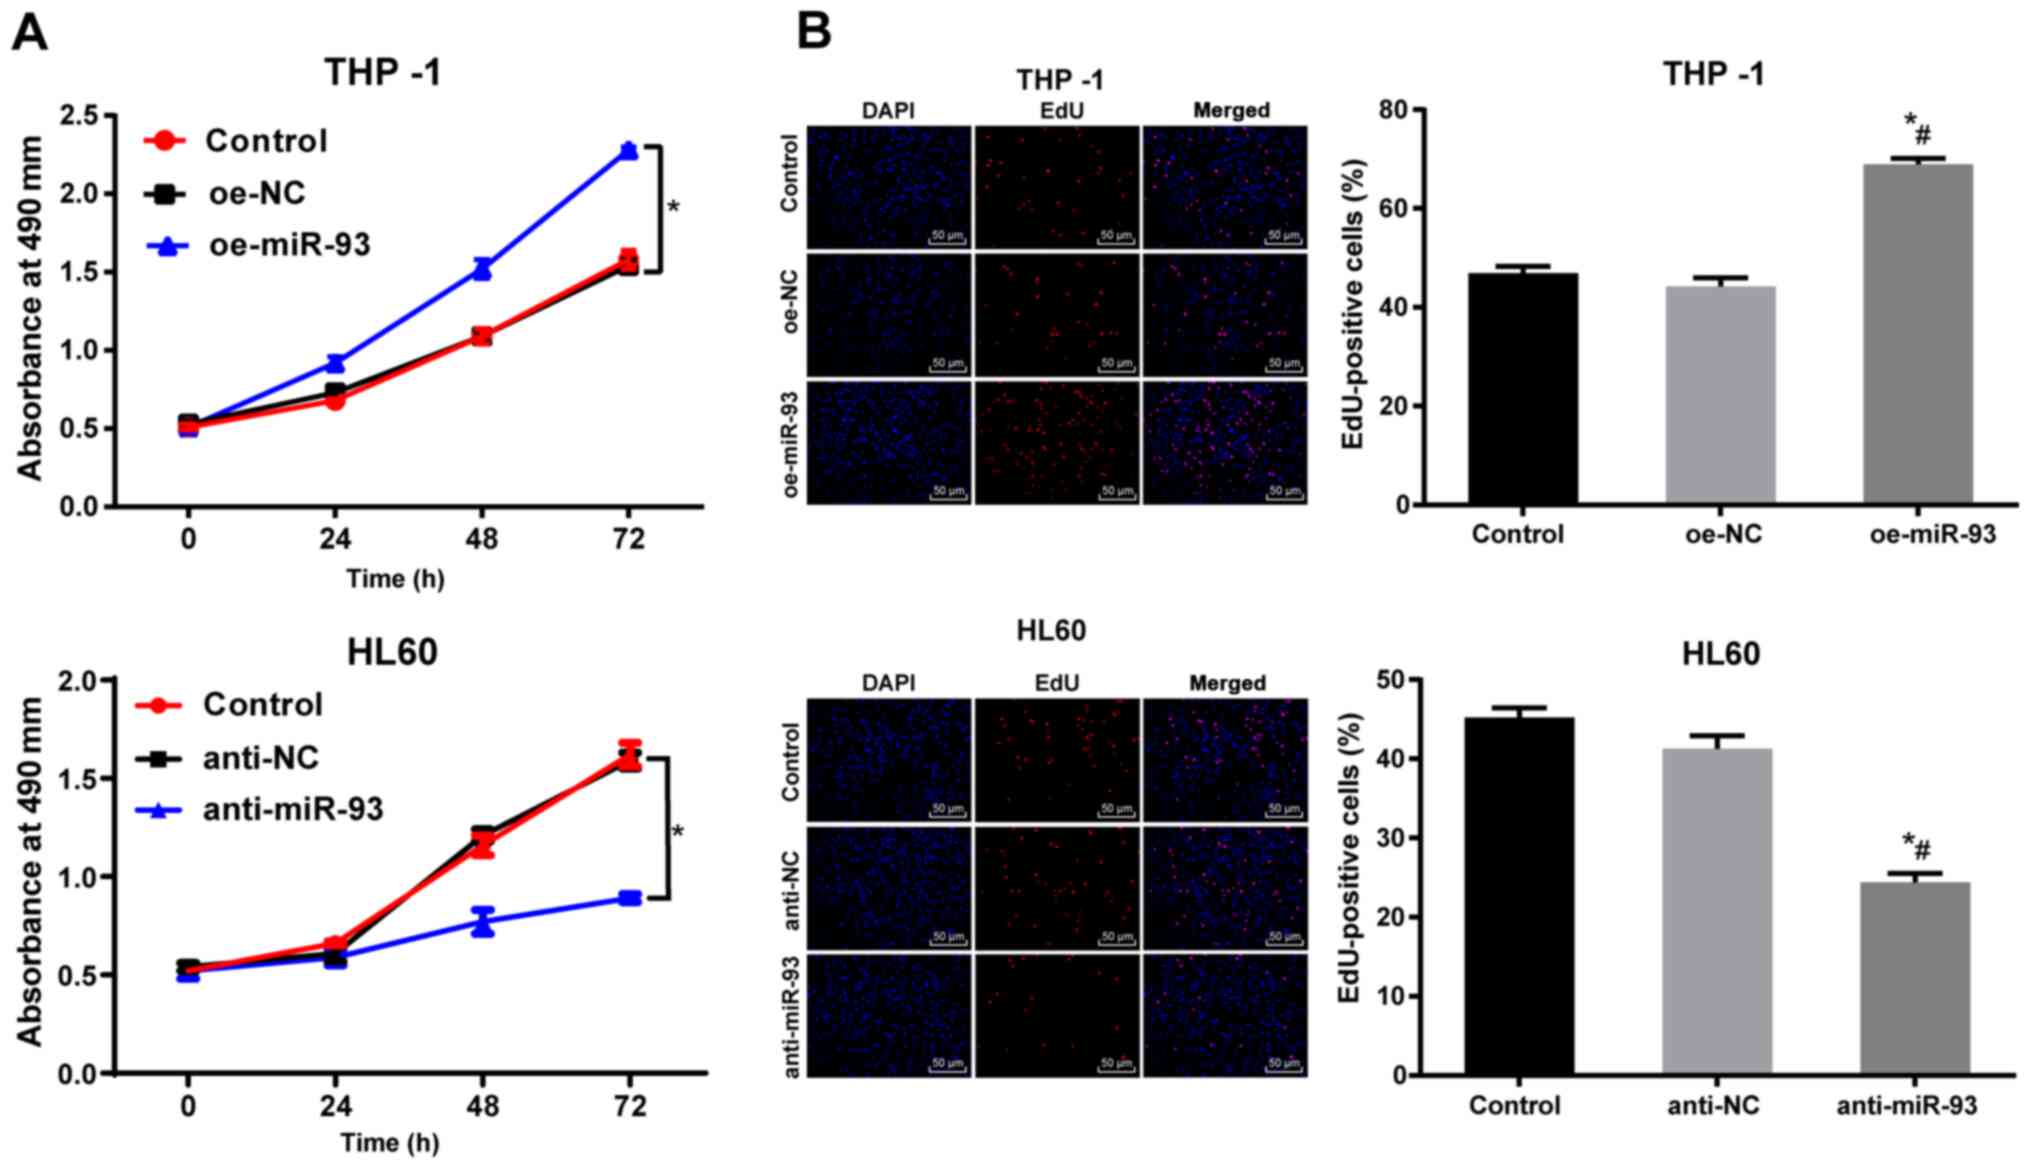
Anti-miR-93 vector inhibits AML cell
proliferation in vitro
The proliferation of the THP-1 and HL60 cells
following transfection was measured by MTT assay. There was no
marked difference in THP-1 and HL60 cell proliferation between the
NC and control groups (P>0.05). Compared with the NC cells, the
proliferation of the THP-1 cells transfected with oe-miR-93 was
markedly increased, while the proliferation of the HL60 cells
transfected with anti-miR-93 was notably decreased (P<0.05,
Fig. 3A). The DNA replication
activity of the AML cells was measured using an EdU assay. There
were no significant differences in DNA replication activity or in
the percentage of EdU-positive cells between the NC and control
groups (P>0.05). Compared with the NC group, DNA replication and
the percentage of EdU-positive THP-1 cells transfected with
oe-miR-93 were markedly increased (P<0.05). However, DNA
replication and the percentage of EdU-positive HL60 cells
transfected with anti-miR-93 was significantly decreased
(P<0.05, Fig. 3B). These
results suggest that the overexpression of miR-93 promotes AML cell
proliferation in vitro.
Anti-miR-93 promotes AML cell cycle
arrest and apoptosis
Cell cycle distribution and apoptosis were measured
by flow cytometry. No significant differences were found in cell
cycle distribution and apoptosis between the control and NC groups
(P>0.05). Compared with the NC cells, the proportion of THP-1
cells transfected with oe-miR-93 in the G0/G1 phase was decreased
and the proportion in the S phase were increased. The proportion of
HL60 cells transfected with anti-miR-93 in the G0/G1 phase were
increased and those in the S phase were decreased (all P<0.05;
Fig. 4A). Relative to that in the
NC cells, the apoptotic rate of the THP-1 cells transfected with
oe-miR-93 was markedly decreased, while the apoptotic rate of the
HL60 cells transfected with anti-miR-93 was markedly increased
(both P<0.05; Fig. 4B). In
addition, the levels of the cycle-related proteins, p21 and cyclin
D1, and the apoptosis-related proteins, caspase3, Bax and Bcl-2,
were detected by western blot analysis. miR-93 overexpression
promoted cell cycle progression and inhibited apoptosis, while
miR-93 inhibition exerted the opposite effect (Fig. 4C).
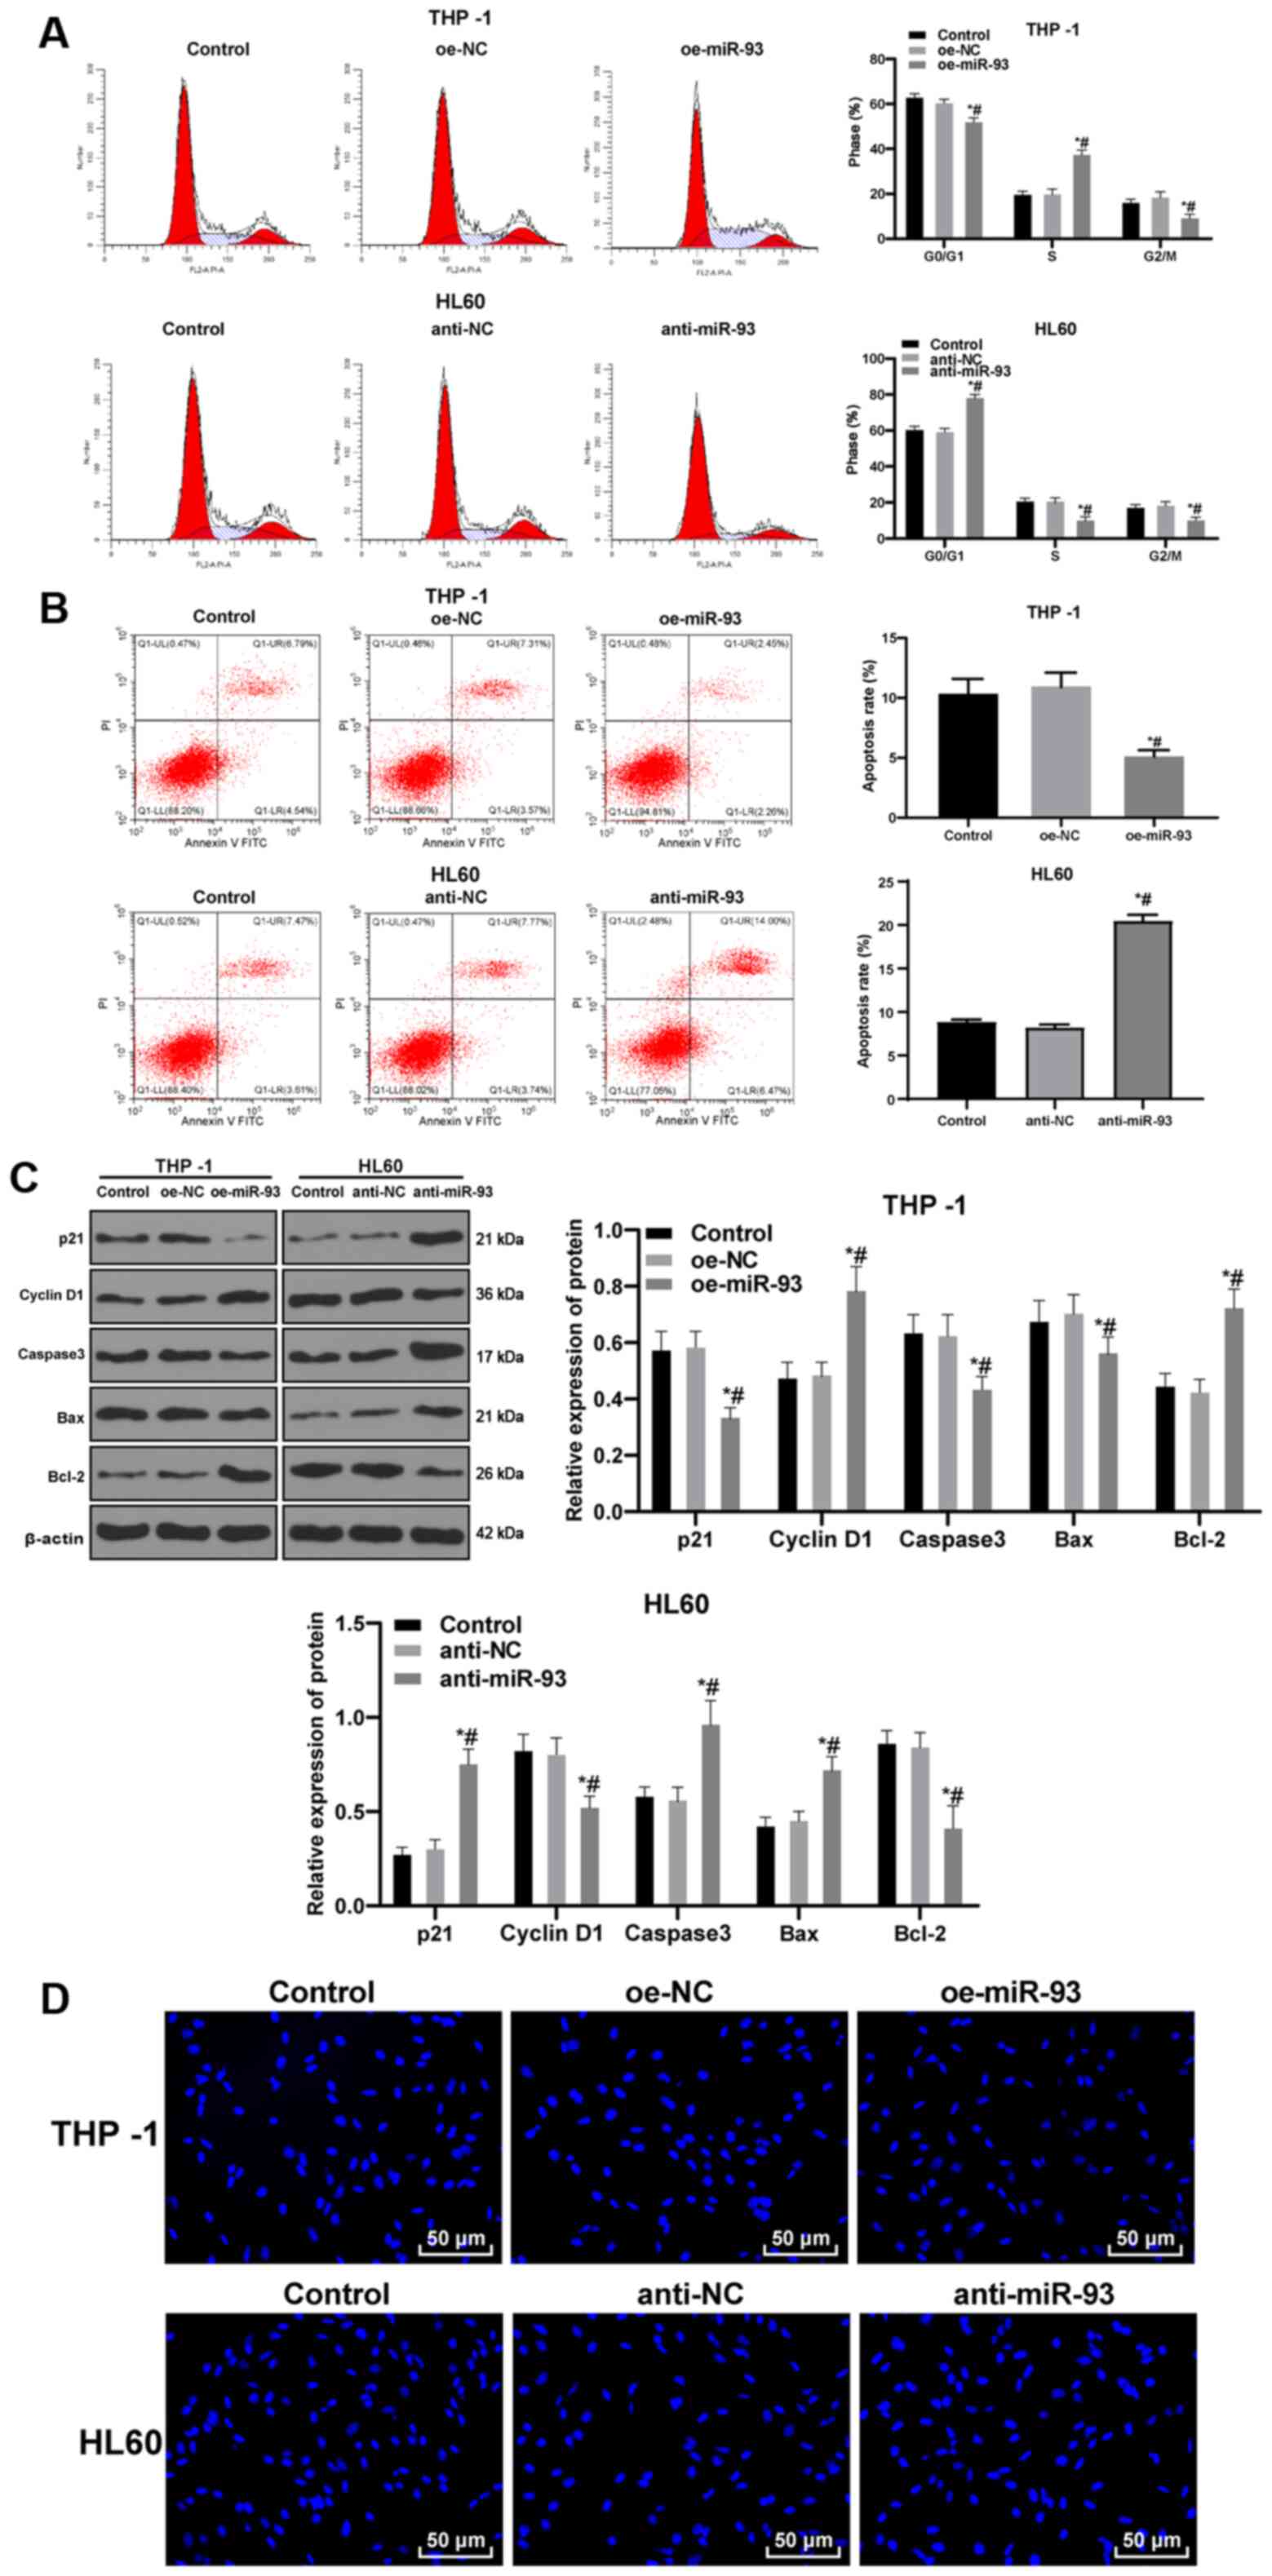 | Figure 4Anti-miR-93 promotes cell cycle
arrest and the apoptosis of AML cells. The expression of miR-93 was
upregulated in THP-1 cells and downregulated in HL60 cells. (A)
Cell cycle distribution was measured by flow cytometry. (B)
Relative cell apoptosis was detected by flow cytometry. (C) Levels
of the cycle-related proteins, p21 and cyclin D1, and the
apoptosis-related proteins, caspase3, Bax and Bcl-2, were detected
by western blot analysis. (D) Representative images of Hoechst
33258 staining. Each experiment was performed 3 times,
independently. Data are presented as the means ± standard
deviation. Data in (A-C) were analyzed by one-way ANOVA, followed
by Tukey's multiple comparisons test. *P<0.05,
compared with the control group; #P<0.05, compared
with the oe-NC or anti-NC group. miR-93, microRNA-93; NC, negative
control; AML, acute myeloid leukemia. |
Following Hoechst 33258 staining, cells in the
control and NC groups exhibited normal, full and clear nuclei,
presenting a round or oval shape. Compared with the NC cells, the
THP-1 cells transfected with oe-miR-93 exhibited slightly deformed
nuclei. However, the HL60 cells transfected with anti-miR-93
exhibited evidently deformed nuclei, unclear nucleus margins,
nucleus shrinkage or fragmentation, chromatin concentration and
aggregation, and marginalization. Under the inverted fluorescence
microscope, the nuclei exhibited bright blue spots, or were
enveloped by the nucleus membrane as apoptotic bodies, showing
typical morphological changes of apoptosis (Fig. 4D).
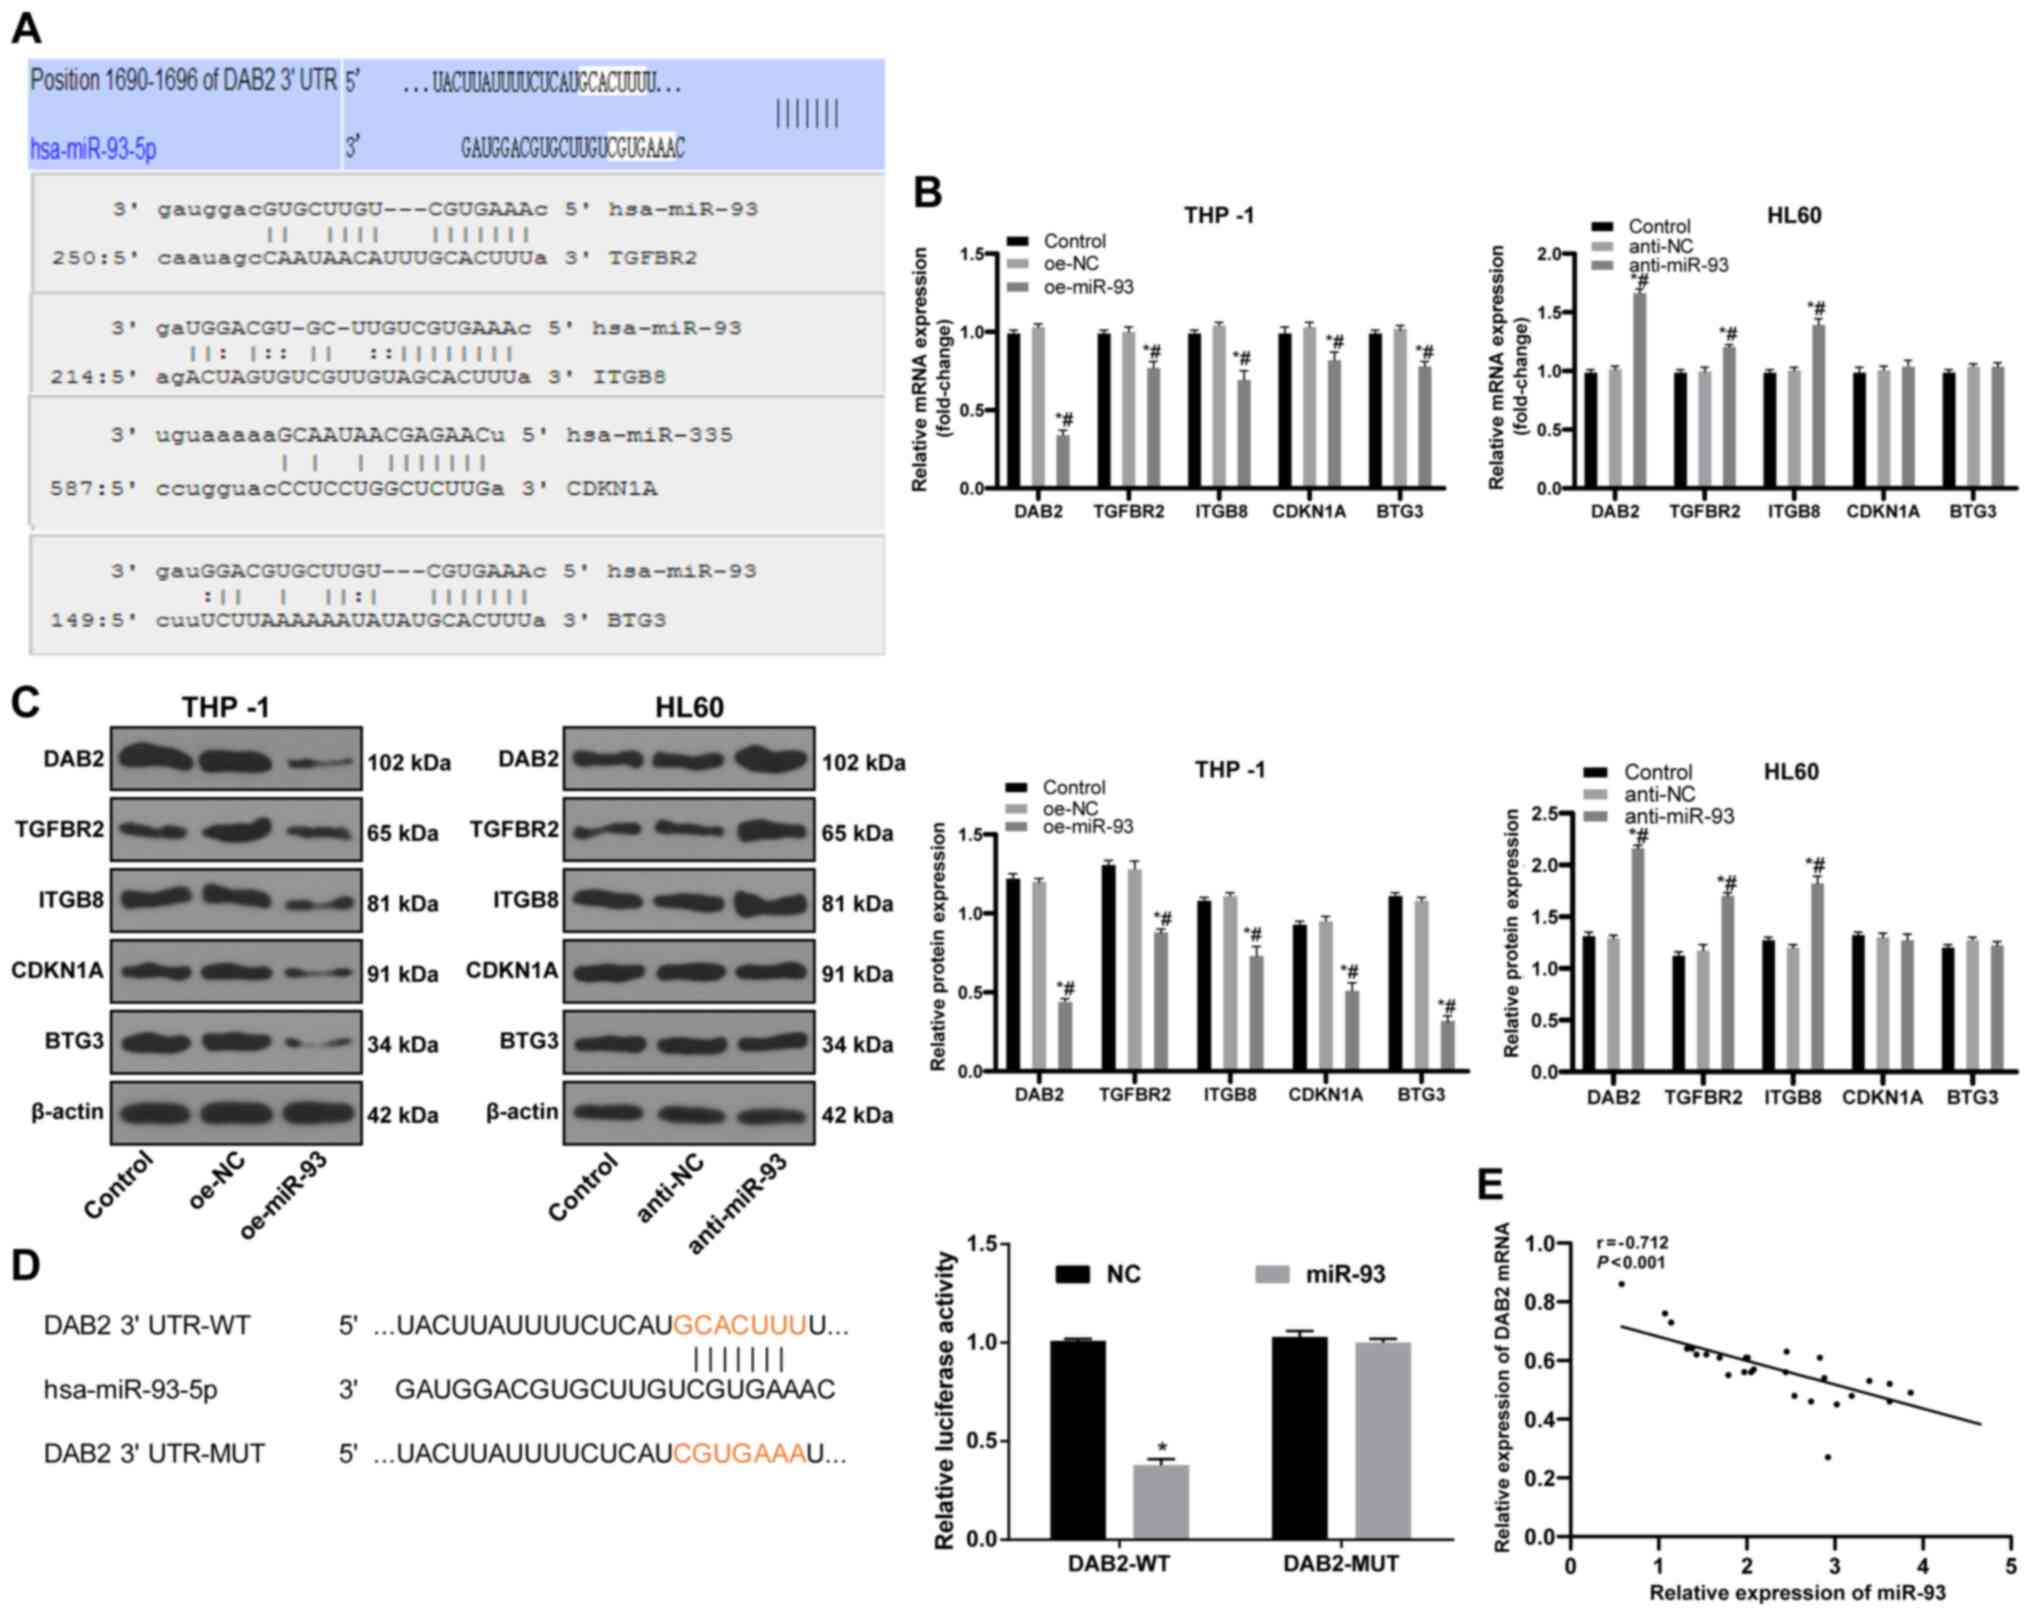
miR-93 targets DAB2
To elucidate the downstream mechanisms of miR-93 in
AML, data from the bioinformatics databases, miRBase, microRNA.org, PicTar and TargetScan, were used to
predict the target genes of miR-93. Targets related to tumor growth
were DAB2, TGFBR2, ITGB8, CDKN1A and BTG3 (Fig. 5A); of these targets, DAB2 can
affect the proliferation of leukemia cells (33). The results of RT-qPCR and western
blot analysis were employed to measure the levels of target genes.
DAB2 expression in the THP-1 cells overexpressing miR-93 was
decreased, while DAB2 expression in the HL60 cells in which miR-93
was knocked down was significantly increased (both P<0.05;
Fig. 5B and C). A dual-luciferase
reporter gene assay further indicated that DAB2 was a target gene
of miR-93 (P<0.05; Fig. 5D).
DAB2 mRNA expression and miR-93 expression in the bone marrow
mononuclear cells of 28 patients with AML were detected by RT-qPCR.
Pearson's correlation analysis revealed a negative correlation
between DAB2 mRNA and miR-93 expression (r=−0.712, P<0.01;
Fig. 5E).
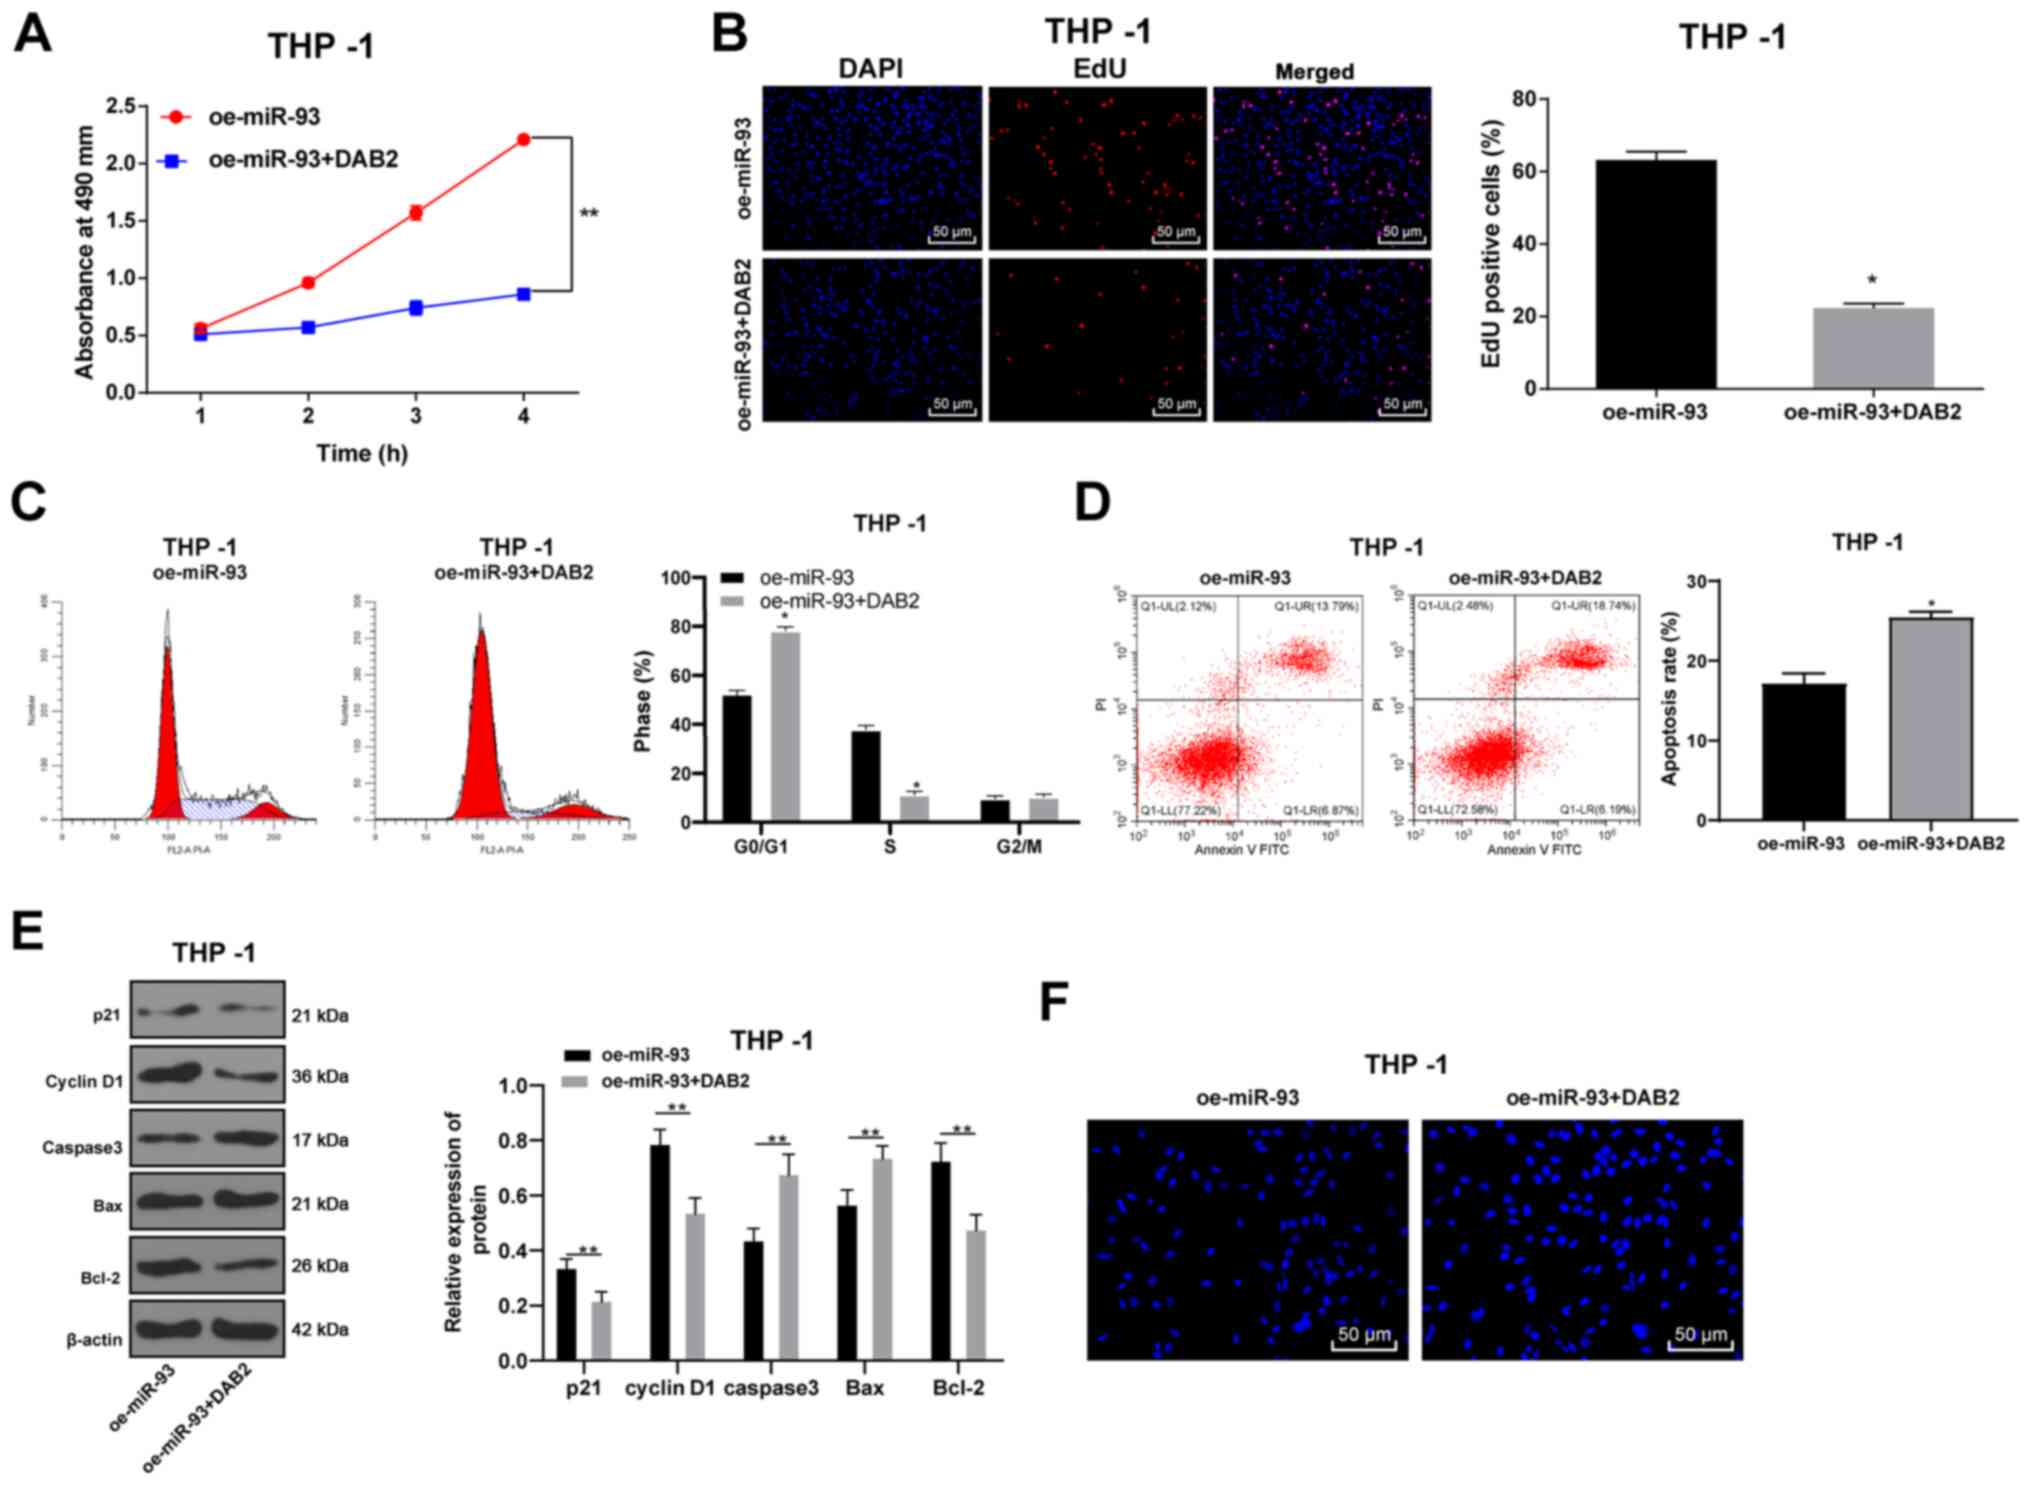
DAB2 reverses the promoting effects of
miR-93 overexpression on AML cell growth
To confirm that miR-93 regulates the growth of AML
cells by targeting DAB2, the DAB2 overexpression plasmid was
transfected into THP-1 cells overexpressing miR-93. The THP-1 cells
were transfected with DAB2, and the proliferation of the THP-1
cells was detected by MTT, EdU and colony formation assays.
Compared with the oe-miR-93 group, the proliferative ability of the
THP-1 cells in the oe-miR-93 + DAB2 group was decreased (all
P<0.05), indicating that the overexpression of DAB2 inhibited
AML cell proliferation in vitro (Fig. 6A and B).
Flow cytometry was used to assess cell cycle
distribution and the apoptotic rate. The proportion of cells in the
G0/G1 phase markedly increased in the oe-miR-93 + DAB2 group, while
the proportion of cells in the S phase substantially decreased as
compared with those in the oe-miR-93 group (P<0.05; Fig. 6C). The apoptotic rate in the
oe-miR-93 + DAB2 group was significantly higher than that in the
oe-miR-93 group (Fig. 6D). In
addition, the levels of the cycle-related proteins, p21 and cyclin
D1, and the apoptosis-related proteins, caspase3, Bax, and Bcl-2,
were detected by western blot analysis. It was found that oe-miR-93
+ DAB2 treatment promoted cell cycle progression and inhibited
apoptosis, whereas oe-miR-93 treatment alone had the opposite
effect (all P<0.05; Fig.
6E).
Hoechst 33258 staining revealed that compared with
the oe-miR-93 group, the oe-miR-93 + DAB2 group exhibited obvious
deformed nuclei, nuclear nucleus margin, nucleus shrinkage or
fragmentation, chromatin concentration and aggregation and
marginalization. Under the inverted fluorescence microscope, the
nuclei exhibited bright blue spots, or were wrapped by the nucleus
membrane into apoptotic bodies, showing typical morphological
changes of apoptosis (P<0.05; Fig.
6F).
miR-93 promotes the activation of the
PI3K/AKT pathway by upregulating DAB2
The overexpression of the DAB2 interactive protein
inhibits the activation of the PI3K/AKT pathway (23). Targeting the PI3K/AKT/mTOR pathway
with small molecule inhibitors may lead to decreased toxicity and
therapeutic effects in AML patients (24). Thus, it was hypothesized that
miR-93/DAB2 regulates the PI3K/AKT pathway to manipulate AML cell
growth. Western blot analysis was performed to determine protein
levels and phosphorylation of AKT and PI3K in each group. The
levels of p-AKT and p-PI3K were elevated in the THP-1 cells
overexpressing miR-93, but were downregulated following DAB2
overexpression. There were no notable differences in the protein
levels of AKT and PI3K in the HL60 cells transfected with
anti-miR-93, but the levels of p-AKT and p-PI3K were notably
decreased (all P<0.05; Fig.
7A).
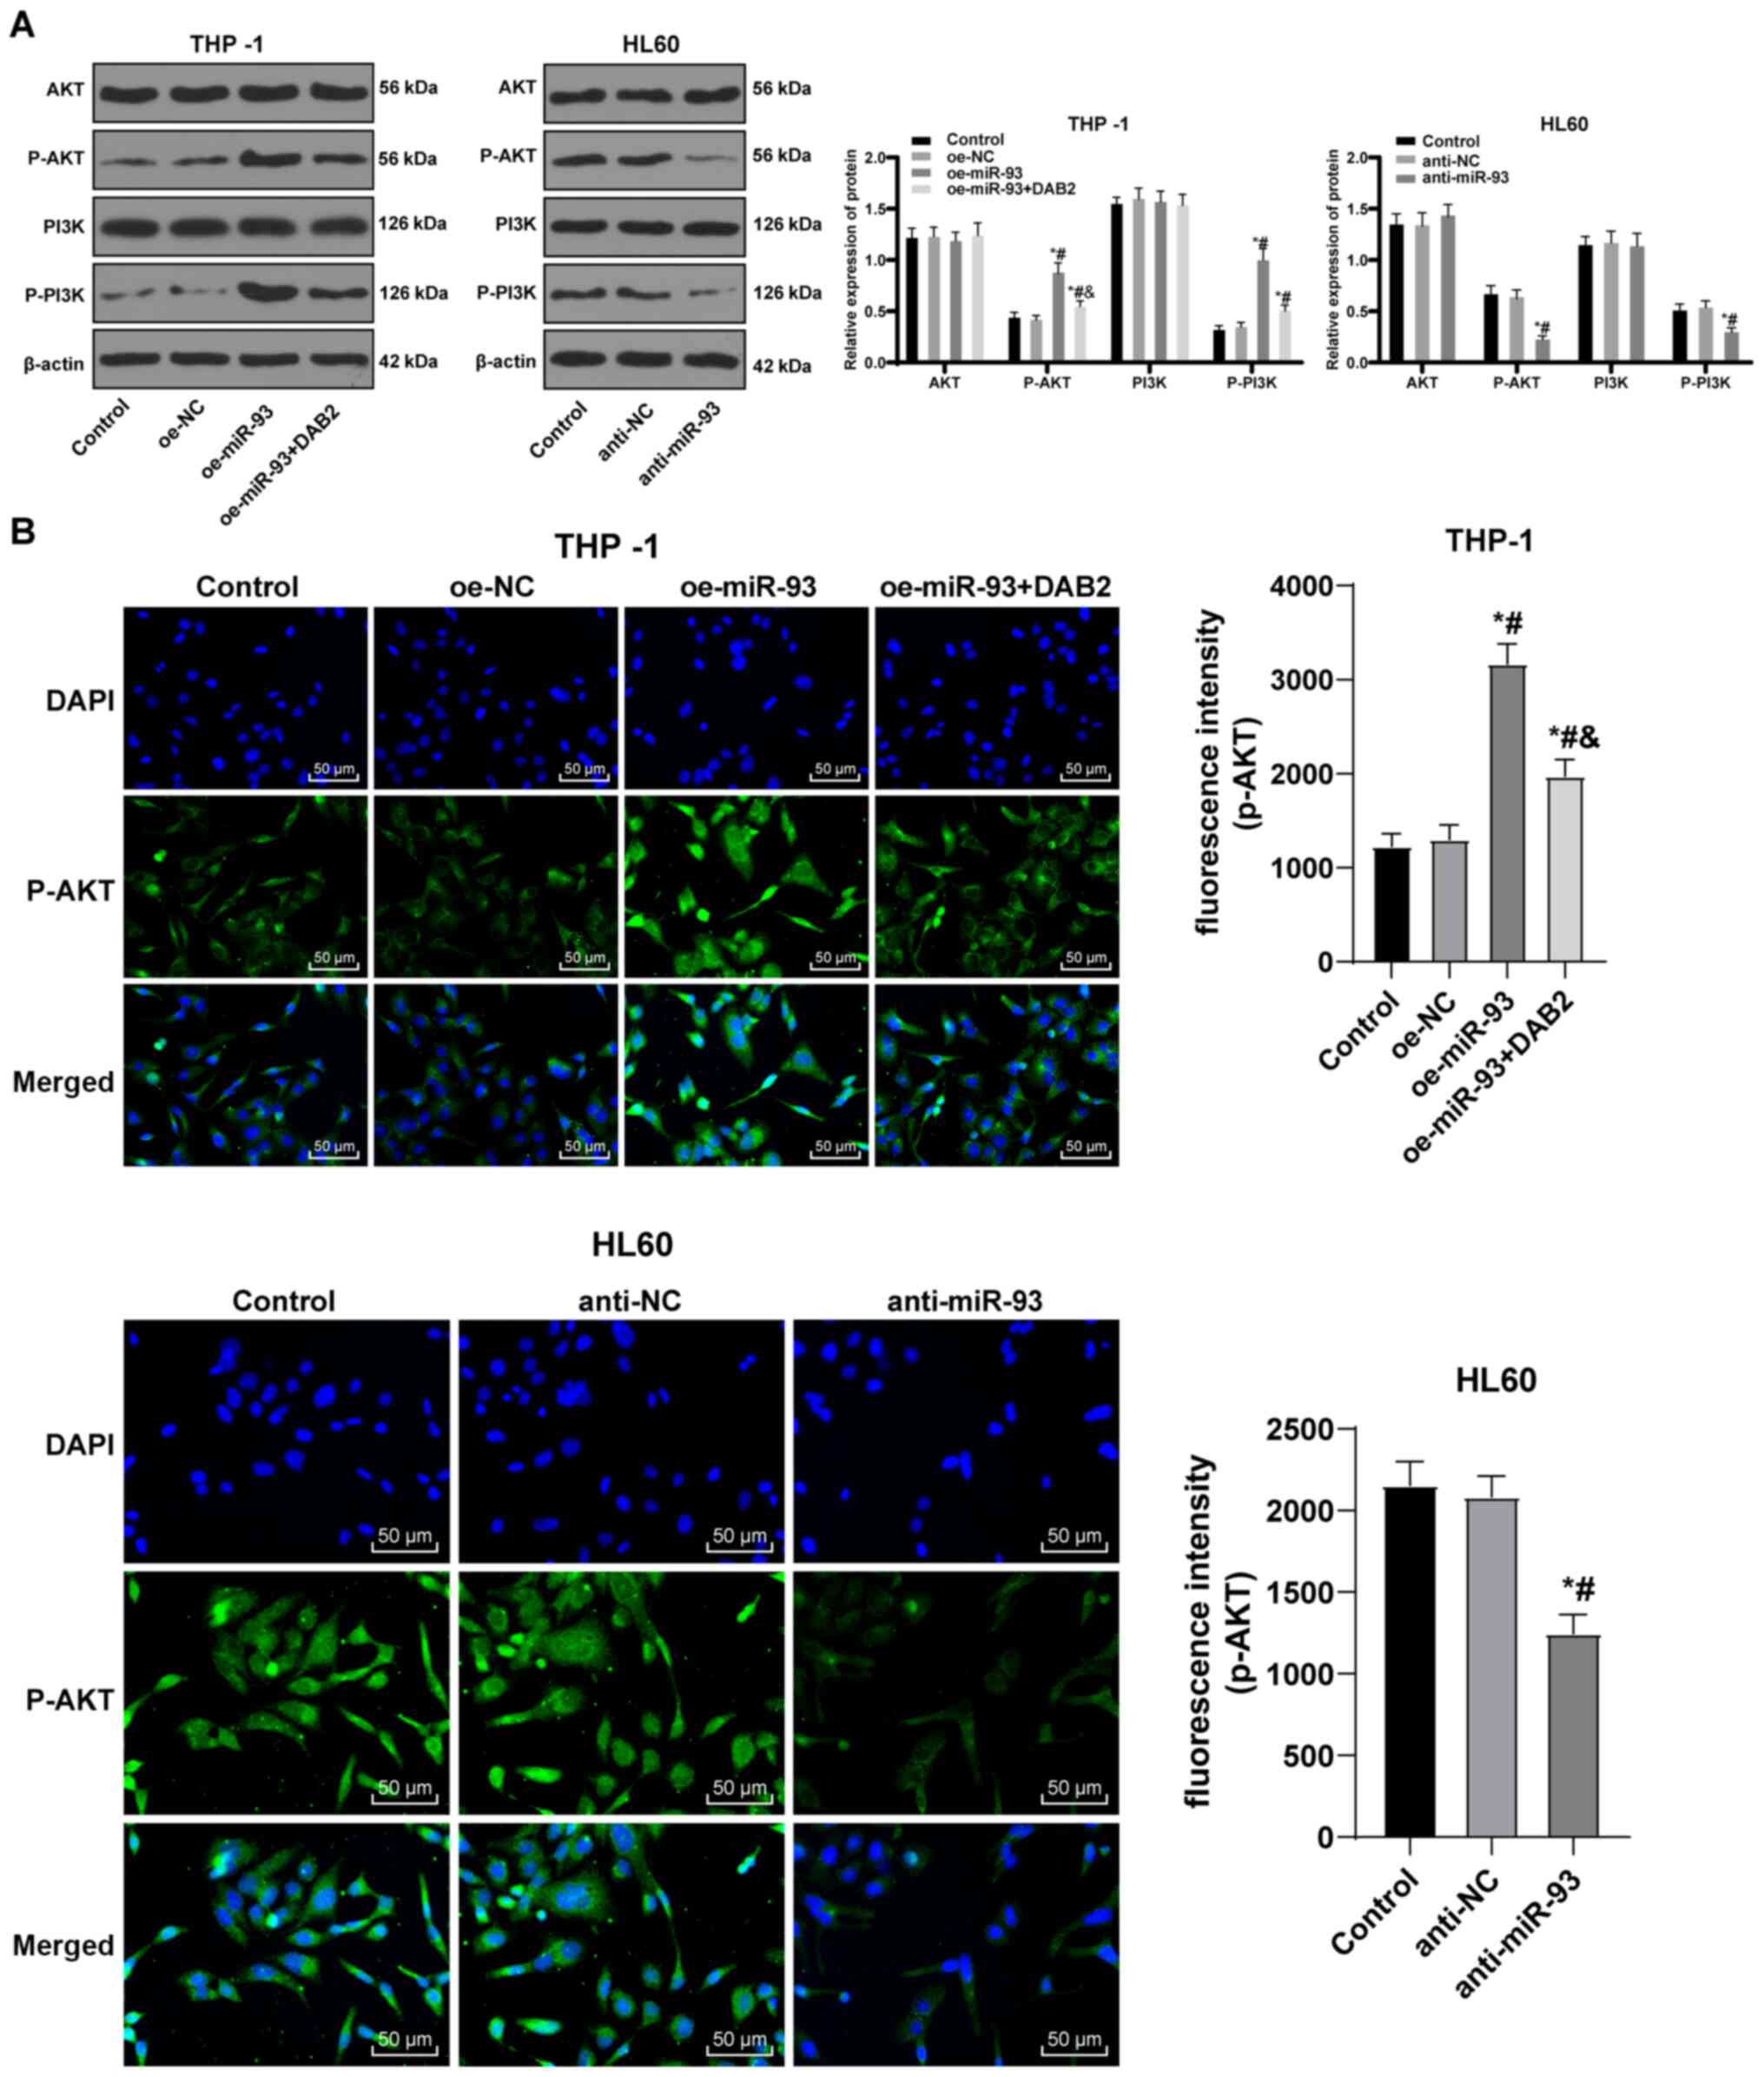 | Figure 7miR-93 promotes the activation of
PI3K/AKT pathway via downregulating DAB2. (A) Protein bands and
relative protein levels of AKT, p-AKT, PI3K and p-PI3K were
measured by western blot analysis. (B) Representative images of
fluorescence expression of p-AKT by immunofluorescence assay.
FITC-labeled goat anti-rabbit IgG (H + L) exhibited a green
emission light (i.e., expression and localization of p-Akt protein
immunofluorescence), and DAPI-stained cells exhibited a blue
emission light (i.e., nuclear staining). Each experiment was
performed 3 times, independently. The data are presented as the
means ± standard deviation. Data in (A) were analyzed by one-way
ANOVA, followed by Tukey's multiple comparisons test.
*P<0.05, compared with the control group;
#P<0.05, compared with the oe-NC or anti-NC group;
&P<0.05, compared with the oe-miR-93 group.
miR-93, microRNA-93; NC, negative control; DAB2, disabled 2; AKT,
protein kinase B; PI3K, phosphatidylinositol-3 kinase. |
The fluorescence expression of p-AKT was visualized
using an immunofluorescence assay. In contrast to the control and
NC groups, the fluorescence expression of p-AKT in the THP-1 cells
was notably increased in the oe-miR-93 group (P<0.05). Compared
with the oe-miR-93 group, the fluorescence expression of p-AKT in
the oe-miR-93 + DAB2 group decreased, while the expression of p-AKT
in HL60 cells transfected with anti-miR-93 was greatly decreased
(all P<0.05; Fig. 7B). The
results revealed that miR-93 promoted the activation of the
PI3K/AKT pathway by targeting DAB2 to participate in the growth of
AML cells.
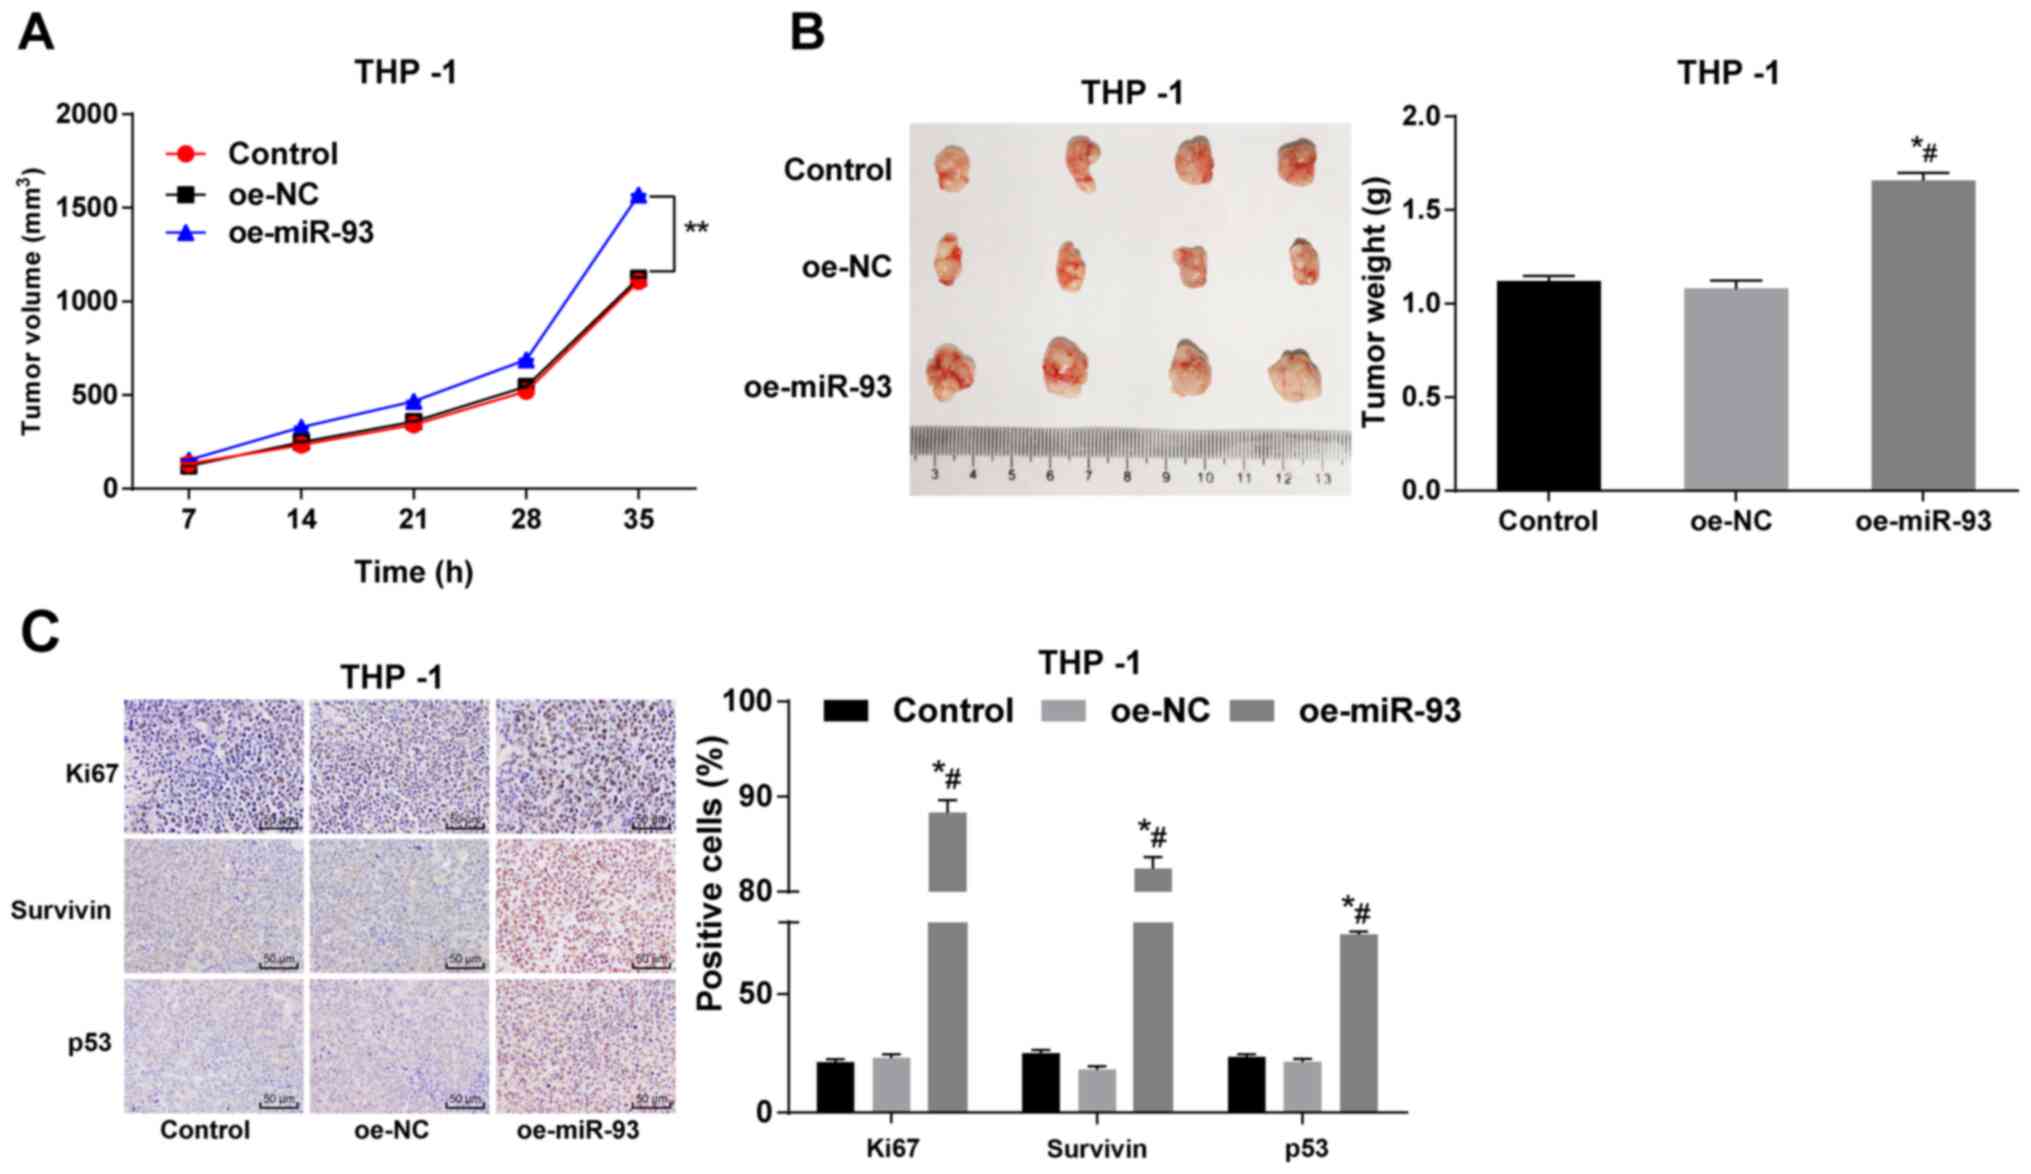
Anti-miR-93 inhibits xenograft tumors in
vivo
THP-1 cells overexpressing miR-93 were
subcutaneously injected into nude mice, and the tumor volume and
weight were measured. No significant differences were observed in
tumor volume and weight between the control and NC groups
(P>0.05). Compared with the control and NC groups, the injection
of THP-1 cells overexpressing miR-93 significantly increased tumor
volume and weight (P<0.05; Fig. 8A
and B). Immunohistochemistry was also employed to measure the
expression of Ki67, survivin and p53. Compared with the control and
NC groups, the numbers of Ki67-, surviving- and p53-positive THP-1
cells transfected with oe-miR-93 were notably increased (all
P<0.05; Fig. 8C). Taken
together, these findings demonstrate that miR-93 overexpression
promotes tumor growth in nude mice.
Discussion
Currently, one feasible treatment option exists for
patients with recurrent or refractory leukemia, namely allogeneic
hematopoietic stem cell transplant, with cure rates of only ~10%
using standard chemotherapy (34). With a deeper understanding of the
pathogenesis of AML, new drugs for various operational targets can
be developed (35). miRs are
involved in normal hematopoiesis, suggesting that the dysregulation
of miRs can contribute to leukemogenesis (36). The present study assessed the
mechanisms of miR-93 and DAB2 in the biological processes of AML
with the involvement of the PI3K/AKT pathway. Consequently, it was
found that the silencing miR-93 suppressed AML cell growth by
negatively regulating DAB2 and inactivating the PI3K/AKT
pathway.
The first major result was that miR-93 expression
was upregulated in patients with AML and in AML cells. The
unfavorable role of miR-93 has been identified in other diseases.
For instance, miR-93 has been shown to be markedly upregulated in
nasopharyngeal carcinoma and breast cancer (37,38). A previous study demonstrated that
miR-93 upregulation was positively associated with
clinicopathologic grades, but negatively with overall survival time
in patients with gliomas (25).
Meenhuis et al confirmed that miR-93 was abundantly
expressed in human and mouse hematopoietic progenitor cells, and
that its expression significantly decreased during bone marrow
differentiation (39).
Convincingly, Verboon et al stated that the miR-106b-25
cluster, to which miR-93 belongs, was upregulated in relapsed mixed
lineage leukemia-rearranged pediatric AML (40). In the present study, the area
under the curve was 0.8143 (sensitivity, 0.6786; specificity,
0.8333), indicating that miR-93 expression had certain clinical
significance for the diagnosis of AML. Thus, the present study
investigated miR-93 expression in the patients with AML and the
authors aim to perform further studies in the future on this matter
as well.
Transfection with anti-miR-93 vectors inhibited AML
cell proliferation, resistance to apoptosis and tumor growth. In
line with the results of the present study, the downregulation of
miR-93 has been shown to effectively attenuate the proliferation,
migration and metastasis of A549, H1975 and H1299 cells (41). Another study revealed that the
inhibition of miR-93 suppressed hepatocellular carcinoma cell
proliferation and migratory ability (42). In addition, the knockdown of
miR-93 has been shown to suppress gastric tumor growth in
vivo (43). Cancer-derived
miR-93 knockout inhibits leukemia development by reducing the
number of stem cells, inhibiting cell proliferation, and promoting
cell differentiation and apoptosis (14), which is consistent with the
present findings. Moreover, a previous study demonstrated that
AML-derived mesenchymal stem cells exhibited a low miR-93
expression, which could promote the production of antioxidant
metabolites to protect cells from oxidative stress injury in the
leukemia microenvironment (44).
Furthermore, the data of the present study support
the hypothesis that miR-93 targets DAB2 and that the overexpression
of DAB2 inhibits AML cell proliferation and facilitates apoptosis.
miR-93 has previously been reported as an effective inhibitor of
DAB2 expression, and the overexpression of miR-93 is associated
with the lower expression of DAB2 in lung cancer (20). The tumor suppressor gene, DAB2,
exerts potent inhibitory functions in the growth of solid tumor
cells and regulates the AKT pathway (45). Dynamic DAB2 expression in vascular
and microglial progenitor cells strongly indicates that DAB2 is
implicated in the development of bone marrow cells (46). The decreased expression of DAB2 in
patients with leukemia is related to the aggravation of the disease
(33). As previously described,
the restoration of DAB2 interactive proteins prevents the
proliferation, colony-forming ability, migration, subcutaneous
tumor growth and pulmonary metastasis of nasopharyngeal carcinoma
cells by inactivating the PI3K/AKT pathway (23). Additionally, the present study
verified that anti-miR-93 inactivated the PI3K/AKT pathway by
targeting DAB2. A previous study revealed that PI3K activity
regulates the proliferation and apoptosis of erythroid progenitor
cells, and that the PI3K/AKT pathway is activated in 50% of AML
cases (47). The downregulation
of miR-93 reduces the levels of p-PI3K and p-AKT, thus inactivating
the PI3K/AKT pathway in nasopharyngeal carcinoma (38). Similarly, miR-22 overexpression
promotes chronic lymphocytic leukemia progression by activating the
PI3K/AKT pathway (48).
In conclusion, the present study demonstrates that
the inhibition of miR-93 suppresses AML cell growth by negatively
regulating DAB2 and inactivating the PI3K/AKT pathway. These
results are promising in the prospect of promoting future
individualized treatments for patients with AML. Although the
current findings provide therapeutic implications for the treatment
of AML, the experimental results and their translation into the
effective application in clinical practice warrant further in-depth
investigations. The authors aim to focus on the effects and
mechanism of AML cell differentiation in future research and to
improve the experimental design to explore the mechanisms of
oe-miR-93 and anti-miR-93 in experimental cell lines. The authors
also aim to further investigate the effects of miR-93 expression on
the prognosis of patients with AML in future experiments, as well
as to use core blood cells for experiments, analyze mature myeloid
markers, and conduct animal experiments in an intravenous manner.
However, it is hoped that the findings of the present study may aid
future research on AML.
Availability of data and materials
The data that support the findings of this study are
available from the corresponding author upon reasonable
request.
Authors' contributions
All authors are the guarantors of the integrity of
the entire study. JH, RX, XW and ZF contributed to the study
concept, study design and definition of intellectual content. XW,
ZF, JH, RX, ZF and BK contributed to the manuscript preparation,
editing and reviewing. JL and BK contributed to the clinical
experiments. MY and LZ contributed to the experiments and data
acquisition. JW contributed to data analysis and statistical
analysis. JH and RX confirm the authenticity of all the raw data.
All authors read and approved the final manuscript.
Ethics approval and consent to
participate
The present study was approved and supervised by the
Ethics Committee of the Third Affiliated Hospital of Sun Yat Sen
University. All subjects signed an informed consent form. All
animal experiments involving nude mice were approved by the
Laboratory Animal Ethics Committee of the Third Affiliated Hospital
of Sun Yat Sen University. Significant efforts were made to
minimize both the number of animals and their suffering.
Patient consent for publication
Not applicable.
Competing interests
The authors declare that they have no competing
interests.
Acknowledgements
Not applicable.
References
|
1
|
Juliusson G and Hough R: Leukemia. Prog
Tumor Res. 43:87–100. 2016. View Article : Google Scholar
|
|
2
|
Yamashita Y, Yuan J, Suetake I, Suzuki H,
Ishikawa Y, Choi YL, Ueno T, Soda M, Hamada T, Haruta H, et al:
Array-based genomic resequencing of human leukemia. Oncogene.
29:3723–3731. 2010. View Article : Google Scholar
|
|
3
|
Cammarata G, Augugliaro L, Salemi D,
Agueli C, La Rosa M, Dagnino L, Civiletto G, Messana F, Marfia A,
Bica MG, et al: Differential expression of specific microRNA and
their targets in acute myeloid leukemia. Am J Hematol. 85:331–339.
2010.
|
|
4
|
Akalin A, Garrett-Bakelman FE, Kormaksson
M, Busuttil J, Zhang L, Khrebtukova I, Milne TA, Huang Y, Biswas D,
Hess JL, et al: Base-pair resolution DNA methylation sequencing
reveals profoundly divergent epigenetic landscapes in acute myeloid
leukemia. PLoS Genet. 8:e10027812012. View Article : Google Scholar
|
|
5
|
Prada-Arismendy J, Arroyave JC and
Rothlisberger S: Molecular biomarkers in acute myeloid leukemia.
Blood Rev. 31:63–76. 2017. View Article : Google Scholar
|
|
6
|
Crump C, Sundquist J, Sieh W, Winkleby MA
and Sundquist K: Perinatal risk factors for acute myeloid leukemia.
Eur J Epidemiol. 30:1277–1285. 2015. View Article : Google Scholar
|
|
7
|
Fircanis S, Merriam P, Khan N and Castillo
JJ: The relation between cigarette smoking and risk of acute
myeloid leukemia: An updated meta-analysis of epidemiological
studies. Am J Hematol. 89:E125–E132. 2014. View Article : Google Scholar
|
|
8
|
Ferrara F and Schiffer CA: Acute myeloid
leukaemia in adults. Lancet. 381:484–495. 2013. View Article : Google Scholar
|
|
9
|
Kadia TM, Ravandi F, Cortes J and
Kantarjian H: New drugs in acute myeloid leukemia. Ann Oncol.
27:770–778. 2016. View Article : Google Scholar
|
|
10
|
Gomes BC, Rueff J and Rodrigues AS:
MicroRNAs and cancer drug resistance. Methods Mol Biol.
1395:137–162. 2016. View Article : Google Scholar
|
|
11
|
Bousquet M, Harris MH, Zhou B and Lodish
HF: MicroRNA miR-125b causes leukemia. Proc Natl Acad Sci USA.
107:21558–21563. 2010. View Article : Google Scholar
|
|
12
|
Fang L, Du WW, Yang W, Rutnam ZJ, Peng C,
Li H, O'Malley YQ, Askeland RW, Sugg S, Liu M, et al: miR-93
enhances angiogenesis and metastasis by targeting LATS2. Cell
Cycle. 11:4352–4365. 2012. View
Article : Google Scholar
|
|
13
|
Yeung ML, Yasunaga J, Bennasser Y, Dusetti
N, Harris D, Ahmad N, Matsuoka M and Jeang KT: Roles for microRNAs,
miR-93 and miR-130b, and tumor protein 53-induced nuclear protein 1
tumor suppressor in cell growth dysregulation by human T-cell
lymphotrophic virus 1. Cancer Res. 68:8976–8985. 2008. View Article : Google Scholar
|
|
14
|
Pan Y, Meng M, Zhang G, Han H and Zhou Q:
Oncogenic microRNAs in the genesis of leukemia and lymphoma. Curr
Pharm Des. 20:5260–5267. 2014. View Article : Google Scholar
|
|
15
|
Zhi F, Cao X, Xie X, Wang B, Dong W, Gu W,
Ling Y, Wang R, Yang Y and Liu Y: Identification of circulating
microRNAs as potential biomarkers for detecting acute myeloid
leukemia. PLoS One. 8:e567182013. View Article : Google Scholar
|
|
16
|
Li L, Zhu L, Wang Y, Zhou D, Zhu J, Xie W
and Ye X: Profiling of microRNAs in AML cells following
overexpression or silencing of the VEGF gene. Oncol Lett.
13:105–110. 2017. View Article : Google Scholar
|
|
17
|
Chen L, Jiang M, Yuan W and Tang H:
Prognostic value of miR-93 overexpression in resectable gastric
adenocarcinomas. Acta Gastroenterol Belg. 75:22–27. 2012.
|
|
18
|
Fang L, Deng Z, Shatseva T, Yang J, Peng
C, Du WW, Yee AJ, Ang LC, He C, Shan SW and Yang BB: MicroRNA
miR-93 promotes tumor growth and angiogenesis by targeting
integrin-β8. Oncogene. 30:806–821. 2011. View Article : Google Scholar
|
|
19
|
Hu J, Xu J, Wu Y, Chen Q, Zheng W, Lu X,
Zhou C and Jiao D: Identification of microRNA-93 as a functional
dysregulated miRNA in triple-negative breast cancer. Tumour Biol.
36:251–258. 2015. View Article : Google Scholar
|
|
20
|
Du L, Zhao Z, Ma X, Hsiao TH, Chen Y,
Young E, Suraokar M, Wistuba I, Minna JD and Pertsemlidis A:
miR-93-directed downregulation of DAB2 defines a novel oncogenic
pathway in lung cancer. Oncogene. 33:4307–4315. 2014. View Article : Google Scholar
|
|
21
|
Finkielstein CV and Capelluto DG:
Disabled-2: A modular scaffold protein with multifaceted functions
in signaling. Bioessays. 38(Suppl 1): S45–S55. 2016. View Article : Google Scholar
|
|
22
|
Tseng CP, Huang CL and Cheng JC: Serine 24
phosphorylation of Disabled-2 negatively regulates K562 cell
adhesion to fibrinogen. In: Proceedings of the The 95th Annual
Meeting of American Association for Cancer Research (AACR); AACR,
Orlando, FL. 2004
|
|
23
|
Wang B, Gu Q and Li J: DOC-2/DAB2
interactive protein regulates proliferation and mobility of
nasopharyngeal carcinoma cells by targeting PI3K/Akt pathway. Oncol
Rep. 38:317–324. 2017. View Article : Google Scholar
|
|
24
|
Martelli AM, Evangelisti C, Chiarini F,
Grimaldi C, Manzoli L and McCubrey JA: Targeting the PI3K/AKT/mTOR
signaling network in acute myelogenous leukemia. Expert Opin
Investig Drugs. 18:1333–1349. 2009. View Article : Google Scholar
|
|
25
|
Jiang L, Wang C, Lei F, Zhang L, Zhang X,
Liu A, Wu G, Zhu J and Song L: miR-93 promotes cell proliferation
in gliomas through activation of PI3K/Akt signaling pathway.
Oncotarget. 6:8286–8299. 2015. View Article : Google Scholar
|
|
26
|
Zhang Z and Shen T: Blood disease
diagnosis and efficacy standards. 3rd edition. Science Press;
Beijing: 2007
|
|
27
|
Livak KJ and Schmittgen TD: Analysis of
relative gene expression data using real-time quantitative PCR and
the 2(−Delta Delta C(T)) method. Methods. 25:402–408. 2001.
View Article : Google Scholar
|
|
28
|
Agarwal V, Bell GW, Nam JW and Bartel DP:
Predicting effective microRNA target sites in mammalian mRNAs.
Elife. 4:e050052015. View Article : Google Scholar
|
|
29
|
Kozomara A, Birgaoanu M and
Griffiths-Jones S: MiRBase: From microRNA sequences to function.
Nucleic Acids Res. 47(D1): D155–D162. 2019. View Article : Google Scholar
|
|
30
|
Betel D, Wilson M, Gabow A, Marks DS and
Sander C: The http://microRNA.orgurisimplemicroRNA.org resource:
Targets and expression. Nucleic Acids Res. 36(Database Issue):
D149–D153. 2008. View Article : Google Scholar
|
|
31
|
Krek A, Grun D, Poy MN, Wolf R, Rosenberg
L, Epstein EJ, MacMenamin P, da Piedade I, Gunsalus KC, Stoffel M
and Rajewsky N: Combinatorial microRNA target predictions. Nat
Genet. 37:495–500. 2005. View
Article : Google Scholar
|
|
32
|
Zhao J, Lu Q, Zhu J, Fu J and Chen YX:
Prognostic value of miR-96 in patients with acute myeloid leukemia.
Diagn Pathol. 9:762014. View Article : Google Scholar
|
|
33
|
Bernardoni R, Giordani G, Signorino E,
Monticelli S, Messa F, Pradotto M, Rosso V, Bracco E, Giangrande A,
Perini G, et al: A new BCR-ABL1 Drosophila model as a powerful tool
to elucidate the pathogenesis and progression of chronic myeloid
leukemia. Haematologica. 104:717–728. 2019. View Article : Google Scholar
|
|
34
|
Bose P, Vachhani P and Cortes JE:
Treatment of relapsed/refractory acute myeloid leukemia. Curr Treat
Options Oncol. 18:172017. View Article : Google Scholar
|
|
35
|
Saygin C and Carraway HE: Emerging
therapies for acute myeloid leukemia. J Hematol Oncol. 10:932017.
View Article : Google Scholar
|
|
36
|
Lv M, Zhang X, Jia H, Li D, Zhang B, Zhang
H, Hong M, Jiang T, Jiang Q, Lu J, et al: An oncogenic role of
miR-142-3p in human T-cell acute lymphoblastic leukemia (T-ALL) by
targeting glucocorticoid receptor-α and cAMP/PKA pathways.
Leukemia. 26:769–777. 2012. View Article : Google Scholar
|
|
37
|
Deng ZQ, Qian J, Liu FQ, Lin J, Shao R,
Yin JY, Tang Q, Zhang M and He L: Expression level of miR-93 in
formalin-fixed paraffin-embedded tissues of breast cancer patients.
Genet Test Mol Biomarkers. 18:366–370. 2014. View Article : Google Scholar
|
|
38
|
Lyu X, Fang W, Cai L, Zheng H, Ye Y, Zhang
L, Li J, Peng H, Cho WC, Wang E, et al: TGFβR2 is a major target of
miR-93 in nasopharyngeal carcinoma aggressiveness. Mol Cancer.
13:512014. View Article : Google Scholar
|
|
39
|
Meenhuis A, van Veelen PA, de Looper H,
van Boxtel N, van den Berge IJ, Sun SM, Taskesen E, Stern P, de Ru
AH, van Adrichem AJ, et al: miR-17/20/93/106 promote hematopoietic
cell expansion by targeting sequestosome 1-regulated pathways in
mice. Blood. 118:916–925. 2011. View Article : Google Scholar
|
|
40
|
Verboon LJ, Obulkasim A, de Rooij JD,
Katsman-Kuipers JE, Sonneveld E, Baruchel A, Trka J, Reinhardt D,
Pieters R, Cloos J, et al: MicroRNA-106b~25 cluster is upregulated
in relapsed MLL-rearranged pediatric acute myeloid leukemia.
Oncotarget. 7:48412–48422. 2016. View Article : Google Scholar
|
|
41
|
Pignataro D, Francia S, Zanetta F, Brenna
G, Brandini S, Olivieri A, Torroni A, Biamonti G and Montecucco A:
A missense MT-ND5 mutation in differentiated Parkinson Disease
cytoplasmic hybrid induces ROS-dependent DNA damage response
amplified by DROSHA. Sci Rep. 7:95282017. View Article : Google Scholar
|
|
42
|
Xu D, He XX, Chang Y, Sun SZ, Xu CR and
Lin JS: Downregulation of miR-93 expression reduces cell
proliferation and clonogenicity of HepG2 cells.
Hepatogastroenterology. 59:2367–2373. 2012.
|
|
43
|
Liang H, Wang F, Chu D, Zhang W, Liao Z,
Fu Z, Yan X, Zhu H, Guo W, Zhang Y, et al: miR-93 functions as an
oncomiR for the downregulation of PDCD4 in gastric carcinoma. Sci
Rep. 6:237722016. View Article : Google Scholar
|
|
44
|
Ruvolo PP, Jacamo R, McQueen T, Pan R,
Samudio I, Konopleva M, Kornblau SM, Garzon R, Croce CM and
Andreeff M: Suppression of Mir-93 may regulate anti-oxidant
metabolism in mesenchymal stromal cells derived from acute myeloid
leukemia patients. Blood. 120:23542012. View Article : Google Scholar
|
|
45
|
Yan ZX, Wu LL, Xue K, Zhang QL, Guo Y,
Romero M, Leboeuf C, Janin A, Chen SJ, Wang L and Zhao WL:
MicroRNA187 overexpression is related to tumor progression and
determines sensitivity to bortezomib in peripheral T-cell lymphoma.
Leukemia. 28:880–887. 2014. View Article : Google Scholar
|
|
46
|
Cheung KK, Mok SC, Rezaie P and Chan WY:
Dynamic expression of Dab2 in the mouse embryonic central nervous
system. BMC Dev Biol. 8:762008. View Article : Google Scholar
|
|
47
|
Park S, Chapuis N, Tamburini J, Bardet V,
Cornillet-Lefebvre P, Willems L, Green A, Mayeux P, Lacombe C and
Bouscary D: Role of the PI3K/AKT and mTOR signaling pathways in
acute myeloid leukemia. Haematologica. 95:819–828. 2010. View Article : Google Scholar
|
|
48
|
Palacios F, Abreu C, Prieto D, Morande P,
Ruiz S, Fernandez-Calero T, Naya H, Libisch G, Robello C, Landoni
AI, et al: Activation of the PI3K/AKT pathway by microRNA-22
results in CLL B-cell proliferation. Leukemia. 29:115–125. 2015.
View Article : Google Scholar
|