Introduction
The proteasome, also known as a core particle (CP)
or 20S proteasome, is a large, major intracellular, multi-catalytic
protease in eukaryotic cells (1).
The proteasome is responsible for the degradation of most cellular
proteins via non-lysosomal proteolytic pathways (2-4).
There are four different proteasome regulatory complexes (PA700,
PA28, PA28γ and PA200), which affect proteasomal activity (5). PA700, also termed the regulatory
complex or 19S, couples with the 20S proteasome to form the 26S
proteasome (5). The 26S
proteasome is responsible for breaking down ubiquitinated protein
substrates in an ATP-dependent manner (6). PA28, an 11S protein regulator of the
20S proteasome, comprises of two distinct but homologous
polypeptides, termed PA28α and PA28β. PA28α and PA28β are encoded
by small diverse genes, proteasome activator complex subunit
(PSME)1 and PSME2, respectively (7-9).
PA28αβ activates the proteasome by binding to the cylinder end of
the 20S proteinase and opening the catalytic center (10-12). PA28γ, encoded by PSME3,
forms a homoheptamer and binds to the α-ring of the CP (13). PA200 is encoded by PSME4
and, similarly to PA28, binds to the end of the 20S CP (5,14,15).
PA28αβ is expressed primarily in the cytoplasm,
whereas PA28γ and PA200 are highly abundant within the nucleus
(16,17). PA28α and β subunits are highly
inducible by IFN-γ, and are abundant in the liver, lung and spleen,
but has limited expression in the brain. By contrast, PA28γ is not
induced by IFN-γ, and is abundant in the brain and has moderate
expression in other organs, such as the spleen (5,18).
PA200 exists in all mammalian tissues, and is expressed abundantly
in the testis and sperm (19).
PA28 modulates the proteasome-catalyzed products of the major
histocompatibility class I antigenic peptides to present to
cytotoxic T lymphocytes, inferring its association with the immune
response (20-22). Previous studies have found that
PA28 could activate the hydrolysis of small non-ubiquitinated
peptides and has protective functions against oxidative stress
(23-25). A previous study demonstrated that
PA28 was associated with colon cancer, while other studies reported
that PA28β plays a role in some cancers (26,27). For example, using two-dimensional
polyacrylamide gel electrophoresis-based proteomics, Ebert et
al (28) showed that human
PA28β protein expression was increased in gastric cancer. Perroud
et al (29) also
discovered that the protein expression levels of PA28β was
upregulated in clear cell renal cell carcinoma (ccRCC) compared
with that in normal kidney tissue, as determined using proteomics.
The mRNA expression levels of PA28β were markedly elevated in
cutaneous skin melanoma and Burkitt lymphoma (14,20). Higher protein expression levels of
PA28β were detected in primary breast tumors compared with that in
lymph node metastasis (30).
However, Huang et al (31,32) and Zheng et al (33) showed that the protein expression
level of PA28β was decreased in gastric adenocarcinoma (GA) and
this decreased expression was associated with poorer GA
differentiation. Kim et al (34) confirmed that PA28β expression was
decreased in lung cancer. In human esophageal squamous cell
carcinoma, PA28β expression was significantly lower (35). In conclusion, PA28β expression is
differently associated with several types of cancer.
The present study aimed to investigate PSME2, as a
biomarker for ccRCC using the protein expression patterns of kidney
renal clear cell carcinoma (KIRC) tissues and matched adjacent
normal tissue. In addition, the association between PSME2
expression level and BCL2 interacting protein (BNIP) 3-mediated
autophagy in ccRCC was also analyzed. The findings suggest that
PSME2 may be a candidate target for kidney cancer therapy.
Materials and methods
Samples and data processing
The mRNA expression data of tumor and normal
adjacent tissue from patients with KIRC were downloaded from two
platforms, including KIRC cohort from TCGA (https://www.cancer.gov/about-nci/organization/ccg/research/structural-genomics/tcga).
TCGA database comprises of a large number of gene expression data
and is a useful resource for understanding the molecular basis of
cancer. In the present study, a dataset containing 533 tumor
samples and 72 paired normal samples was downloaded. A paired
t-test was used to compare the expression level of four PSME genes
between the tumor tissues and adjacent normal tissues. The Oncomine
database, which is a publicly accessible online cancer microarray
database (https://www.oncomine.org/resource/login.html)
(36), was used to analyze the
mRNA expression level of PSME2 in tumor (n=486) and normal (n=338)
tissues from different types of cancer. During the analysis, the
numbers in the boxes indicate the number of GEO datasets containing
differential expressed PSME2; the red color indicates the
expression of PSME2 ranked in top 10% of all genes and blue color
indicates PSME2 ranked in bottom 10% of all genes. Various
threshold parameters were set as follows: P<0.01; fold change
>2; gene ranking, all and data type, mRNA. The RNA Sequencing
dataset, from the two datasets were expressed as fragments per
kilobase per million mapped reads and were log2
transformed after the addition of one [log2(x + 1)]
prior to analysis.
Survival analysis
Kaplan-Meier plotter was used to calculate the
survival time in patients with KIRC in each dataset. The survival
probability, including overall survival (OS), disease-specific
survival (DSS), and progression-free survival (PFS) times, were
evaluated for patients with high or low mRNA expression levels of
PSME2, based on the best group separation. The log-rank test was
used and P<0.05 was considered to indicate a statistically
significant difference. Survival analyses were performed using R
software v3.6.3 (https://www.r-project.org/).
Bioinformatics analysis
The top 25% of genes with the largest variance were
used to perform a weighted gene co-expression network analysis
(WGCNA) with the 'WGCNA' package in R software (37). The correlation coefficient and
P-value of the module characteristic genes with tumor and normal
tissues were calculated using Pearson correlation coefficient (PCC)
algorithm. The absolute value of the correlation coefficient was
≥0.5, and P<0.05 was used to screen the modules associated with
each trait. Gene dendrogram construction and module identification
was performed with the dynamic sheer method (38). Further study of the brown module
with the tumor tissue, which was significantly associated with
PSME2 expression level, was performed for functional enrichment
analyses.
Gene Ontology (GO) and Kyoto Encyclopedia of Genes
and Genomes (KEGG) analyses were used to identify the biological
functions in the co-expression module. The Database for Annotation,
Visualization and Integrated Discovery (DAVID; version 6.8)
(39,40) database is a comprehensive set of
functional annotation tools for high-throughput gene function
enrichment analysis. The biological processes and enriched pathways
of the proteins encoded by the candidate genes were analyzed using
DAVID. P<0.05 was set as the cut-off criterion.
Gene Set Enrichment Analysis (GSEA; https://www.gsea-msigdb.org/gsea/index.jsp) was
performed to screen the GO terms and KEGG pathways that may be
associated with PSME2 based on the 6,290 curated gene datasets in
the database. In this analysis, all of the ccRCC and normal samples
were analyzed and a total of 1,097 kidney cancer samples were
divided into two groups based on the expression level of PSME2; low
expression level was defined as log2(TPM+1) <6.2,
while high expression level was defined as log2(TPM+1)
>6.2). The cut-off values for GSEA were false discovery rate
(FDR) <0.25 and P<0.05.
Bioinformatics analyses were performed using the R
programming language (https://www.r-project.org). Cox proportional hazard
regression analysis was used to evaluate the association between
the risk score and OS, DSS and PFS times. Receiver operating
characteristic (ROC) analysis was used to determine the specificity
and sensitivity of PSME mRNA expression level in the KIRC tissues.
The area under the curve (AUC) was used as an indicator of
reliability.
Tissue microarray (TMA) and IHC
The human ccRCC TMA (cat. no. HKidE150CS01) was
purchased from Shanghai Xinchao Biological Technology Co., Ltd. The
TMA contained 150 tumors and matched adjacent normal kidney tissues
(0.5-2.0 cm) (41) from 75
patients, including clear cell carcinoma, chromophobe cell
carcinoma, papillary carcinoma and urothelial carcinoma. The
clinical variables, including year of diagnosis, age at diagnosis,
survival status and sex were collected, in an unbiased manner.
These tissues were taken during renal cell carcinoma surgical
resection between July 2006 and February 2007, and the last
follow-up day was in August 2015. Kidney function and tumor stages
were assessed according to the 2010 International Union Against
Cancer Tumor-Node-Metastasis (TNM) classification system (42), and curative resection was defined
as previously described (43).
The following inclusion criteria were used: Only one tumor lesion,
absence of any metastasis and aged 18-70 years. The following
exclusion criteria were used: Liver or kidney function insufficient
[includes one of the following: Alanine aminotransferase (ALT)
<7.0 or >40.0 U/l; aspartate aminotransferase (AST) <13.0
or >35.0 U/l; AST/ALT >1; alkaline phosphatase (ALP) <40.0
or >110.0 U/l; serum creatinine >133 µmol/l; urine pH
<5.0 or >8.0; urine protein >1.5 g/24 h; or positive urine
occult blood test), receiving chemotherapy/radiotherapy or
difficult to follow up. Clinicopathological data of the patients
with RCC were collected from medical records at The West China
Hospital (Sichuan, China). Survival information was obtained from
the Social Security Death Index, telephone interviews and medical
records, and all pathological data were originally assessed by two
pathologists. The present study was performed in accordance with
medical ethics and was approved by the West China Hospital of
Sichuan University Biomedical Research Ethics Committee (Sichuan,
China). Written informed consent was obtained from all participants
before collection of the specimens. The IHC staining was performed
according to the manufacturer's protocol using the primary antibody
against PSME2 (cat. no. ab183727; 1:150 dilution; Abcam), as
previously described (44). The
omission of primary antibodies was used as the negative control,
and a brown color was considered as positive staining.
Cell culture and transfection
The HK-2 cell line was purchased from the China
Center for Type Culture Collection from Wuhan University (Hubei,
China) and was cultured in DMEM/F12 supplemented with 10% FBS (both
from Gibco; Thermo Fisher Scientific, Inc.). The 786-O, CAKI-1,
ACHN and A498 cell lines were purchased from the State Key
Laboratory of Biotherapy of Sichuan University (Sichuan, China).
The 786-O cell line was cultured with RPMI-1640 medium, containing
10% FBS, while the CAKI-1 cell line was cultured in McCoy's 5a
(Modified) medium supplemented with 10% FBS and the ACHN and A498
cell lines were cultured in EMEM, containing 10% FBS (all from
Gibco; Thermo Fisher Scientific, Inc.). All medium contained 1%
penicillin/streptomycin solution (Hyclone; Cytiva). All the cell
lines were maintained at 37°C in a humidified incubator with 5%
CO2.
The small interfering (si)RNA negative control
(scrambled NC) (sense, 5′-UUCUCCGAACGUGUCACGUTT-3′ and anti-sense,
5′-ACGUGACACGUUCGGAGAATT-3′), siPSME2#1 (sense,
5′-CAAGGAUGAUGAGAUGGAAAC-3′ and anti-sense,
5′-UUCCAUCUCAUCAUCCUUGGG-3′), siPSME2#2 (sense,
5′-CAGAGAUCUAGCGACUGAAGC-3′ and antisense
5′-UUCAGUCGCUAGAUCUCUGGU-3′), siPSME2#3 (sense,
5′-CCAAGAUUGAAGAUGGAAAUG-3′ and antisense,
5′-UUUCCAUCUUCAAUCUUGGGG-3′) and siBNIP3 (sense,
5′-UACUGCUGGACGCACAGCAdTdT-3′ and antisense,
5′-UGCAGUGCGUCCAGCAGUAdTdT-3′) were purchased from Shanghai
GenePharma Co., Ltd. For RNA interference, the CAKI-1 and 786-O
cell lines were transfected with siNC or siPSME2 and/or siBNIP3 (50
nM) using Lipofectamine® 3000 (Invitrogen; Thermo Fisher
Scientific, Inc.) according to manufacturer's recommendations.
After transfection for 24 and 48 h, the cells were used for
subsequent experimentation.
To overexpress BNIP3 in the CAKI-1 cell lines, both
cell lines were transfected with expressing vector or the empty
control vector pLKO.1-puro (50 nM; Sigma-Aldrich; Merck KGaA) using
Lipofectamine® 3000 (Invitrogen; Thermo Fisher
Scientific, Inc.). After transfection at 37°C in 5% a humidified
incubator with CO2 for 12, 24 and 48 h, the cells were
selected with 5 µg/ml puromycin (Sigma-Aldrich; Merck KGaA)
after 3-5 days. Puromycin-resistant clones were tested for their
ability to overexpress BNIP3 and used for subsequent
experimentation.
Transwell invasion assay
The cell invasion assays were performed using a
Transwell chamber (24-well; 8 µm pore size; Corning, Inc.).
Matrigel matrix on ice (Corning, Inc.) was diluted 1:8 with
pre-cooled medium and coated on the upper chamber surface of the
Transwell membrane for 0.5-1 h at room temperature. The CAKI-1 and
786-O cell lines stably transfected with siPSME2 and/or siBNIP3
were trypsinized, centrifuged at 300 × g for 5 min at room
temperature, and resuspended with serum-free McCoy's 5a (Modified)
medium and RPMI-1640, respectively. The CAKI-1 and 786-O cells
transfected with siPSME2 were then treated with bafilomycin A1
(Baf-A1; 1 µmol/l; Selleckchem) for 24 h. The CAKI-1 cell
line was transfected with both siPSME2 + siBNIP3 for 48 h. A total
of 1×10⁵ cells (200 µl) were added to the upper
chamber and 600 µl same medium with 10% FBS, was placed in
the lower chamber in each well of a 24-well plate. After incubation
at 37°C for 48 h, the Transwell membrane was removed and a wet
cotton swab was used to clear the cells from the upper chamber.
Then, the cells that had migrated through the membrane were washed
with 0.01 M PBS and fixed with 4% paraformaldehyde at room
temperature for 20 min. Next, the cells were stained with 0.1%
crystal violet (Beyotime Institute of Biotechnology) at room
temperature for 10 min and images were captured using a phase
contrast microscope (Nikon Corporation).
Cell proliferation assay
The CAKI-1 and 786-O cell lines transfected with
siPSME2#1/siPSME2#2 or siNC, were seeded onto a 96-well plate, at a
density of 3-5 ×10³ cells/ml. The cell number was
measured every 24 h using a CCK-8 assay (MedChemExpress). Following
incubation for 1.5 h at 37°C in a humidified incubator with 5%
CO2, the absorbance was measured at 450 nm using an
automatic microplate spectrophotometer (Thermo Fisher Scientific,
Inc.). The experiments were repeated at least three times.
Immunofluorescence (IF) assays
In total, ~1×10⁵ CAKI-1 and 786-O cell
lines transfected with siPSME2#2 or siNC were plated on coverslips,
cultured overnight at 37°C, then transfected with green fluorescent
protein-microtubule-associated protein light chain3 plasmid
(pGFP-LC3; Invitrogen; Thermo Fisher Scientific, Inc.) at a
concentration of 1,000 virus particles/cell using
Lipofectamine® 3000 (Invitrogen; Thermo Fisher
Scientific, Inc.) at room temperature. After transfection for 24 h,
the coverslips were fixed with 4% pro-cooled paraformaldehyde for
20 min at room temperature, then briefly incubated with DAPI
(Invitrogen; Thermo Fisher Scientific, Inc.) at room temperature
for 5 min in the dark. Finally, the slides were sealed with neutral
balsam and viewed using a confocal fluorescence microscope
(Axiovert 200 M; Zeiss GmbH). DAPI was used to label nuclei (blue),
and autophagosomes were defined as GFP-LC3 puncta. The fluorescent
puncta were analyzed using ImageJ v1.47 software (https://imagej.net).
Transmission electron microscope
(TEM)
Following transfection with BNIP3 overexpression
plasmid, the CAKI-1 and 786-O cell lines were fixed with 2.5%
paraformaldehyde in 100 mM sodium phosphate buffer (pH 7.4) at room
temperature for 1 h. Then, the cells were washed with PBS and fixed
with 0.25% neutral glutaraldehyde overnight at 4°C for TEM
sectioning. Subsequently, the sections were analyzed using a TEM
(JEOL, Ltd.).
Western blot analysis
The cells, transfected with PSME2 siRNAs and BNIP3
overexpression plasmid, were harvested and lysed with RIPA
(Beyotime Institute of Biotechnology). The protein concentration of
each sample was measured using a Pierce™ Rapid Gold BCA Protein
Assay kit (Thermo Fisher Scientific, Inc.) based on the
manufacturer's guidelines. Total protein (40 µg) was
separated using 12.5% SDS-PAGE, transferred to PVDF membranes
(MilliporeSigma), blocked with 5% skimmed milk at room temperature
for 2 h, then incubated with the following primary antibodies:
BNIP3 (cat. no. ab109362; 1:1,000 dilution; Abcam), PSME2 (cat. no.
ab183727; 1:1,000 dilution; Abcam), LC3-I/II (cat. no. ABC929;
1:500 dilution; Sigma-Aldrich; Merck KgaA) sequestersome 1 (SQSTM1;
cat. no. 18420-1-AP; 1:1,000 dilution; ProteinTech Group, Inc.) and
GAPDH (cat. no. 60004-1-Ig; 1:10,000 dilution; ProteinTech Group,
Inc.) on a shaker overnight at 4°C. Following which, the membranes
were washed with TBS containing 0.1% Tween-20 three times and
incubated with HRP-conjugated secondary antibodies (1:10,000
dilution; ProteinTech Group, Inc.) for 1 h at room temperature. The
blotted proteins were observed using Immobilon ECL Ultra Western
HRP Substrate (Merck KGaA), scanned with a Chemi-Doc System
(Bio-Rad Laboratories, Inc.) and analyzed using ImageJ software
(https://imagej.net).
RT-qPCR and gene expression analysis
Following transfection with siPSME2 or BNIP3
overexpressing plasmid for 48 h in the 786-O and CAKI-1 cell lines,
total RNA was extracted from the cells using TRIzol®
(Invitrogen; Thermo Fisher Scientific, Inc.). Then, total RNA (1
µg) was reverse transcribed at 37°C for 15 min, then at 85°C
for 5 sec using a PrimeScript™ RT reagent kit, with gDNA Eraser
(cat no. RR047A; Takara Bio Inc.). qPCR was performed using TB
Green® Premix Ex Taq™ II (cat. no. RR820A; Takara Bio
Inc.) according to the manufacturer's instructions on a
LightCycler96 thermo cycler (Bio-Rad Laboratories, Inc.). The
primer sequences were designed by TsingKe Biological Technology and
the sequences are as follows: PSME2 forward,
5′-CTTTTCCAGGAGGCTGAGGAAT-3′ and reverse,
5′-AGGGAAGTCAAGTCAGCCAC-3′; GAPDH forward,
5′-GGTGGTCTCCTCTGACTTCAACAG-3′ and reverse,
5′-GTTGTTGTAGCCAAATTCGTTGT-3′; IL6 forward,
5′-TCCCCCTAGTTGTGTCTTGC-3′ and reverse, 5′-GAAAAAGGCGGCTAGGTGTC-3′;
TNF forward, 5′-CATCCAACCTTCCCAAACGC-3′ and reverse,
5′-CGAAGTGGTGGTCTTGTTGC-3′; CXCL9 forward,
5′-ATTGGAGTGCAAGGAACCCC-3′ and reverse, 5′-TAGTCCCTTGGTTGGTGCTG-3′;
CXCL10 forward, 5′-TCCTGCAAGCCAATTTTGTCC-3′ and reverse,
5′-TGTGGTCCATCCTTGGAAGC-3′; TNFSF13B (BLys) forward,
5′-GCAGACAGTGAAACACCAAC-3′ and reverse, 5′-GATGTCCCATGGCGTAGGTC-3′.
The following thermocycling conditions were used: Initial
denaturation at 95°C for 30 sec followed by 35 cycles at 95°C for 5
sec and 60°C for 30 sec. Relative mRNA expression levels were
calculated using the 2−ΔΔCq method (45).
Statistical analysis
Statistical analysis was performed using GraphPad
Prism (GraphPad Software, Inc.) or R v3.6.3 package (https://www.r-project.org/). The Mann-Whitney U test
(Wilcoxon rank sum test) was used to compare two groups which did
not meet normal distribution, including Figs. 1B and C, 2B, 4B
and 5F. The Kruskal-Wallis test
and a Dwass-Steel-Critchlow-Fligner post hoc test was used to
compare multiple groups, which did not meet normal distribution,
including Figs. 5A and D,
6A and B, 7A and F and S1. Fisher's exact test was used to
analyze the clinicopathological parameters of patients, including
TNM stages. The Pearson's χ2 test was used to analyze
differential PSME2 expression associated with the sex of the
patients.
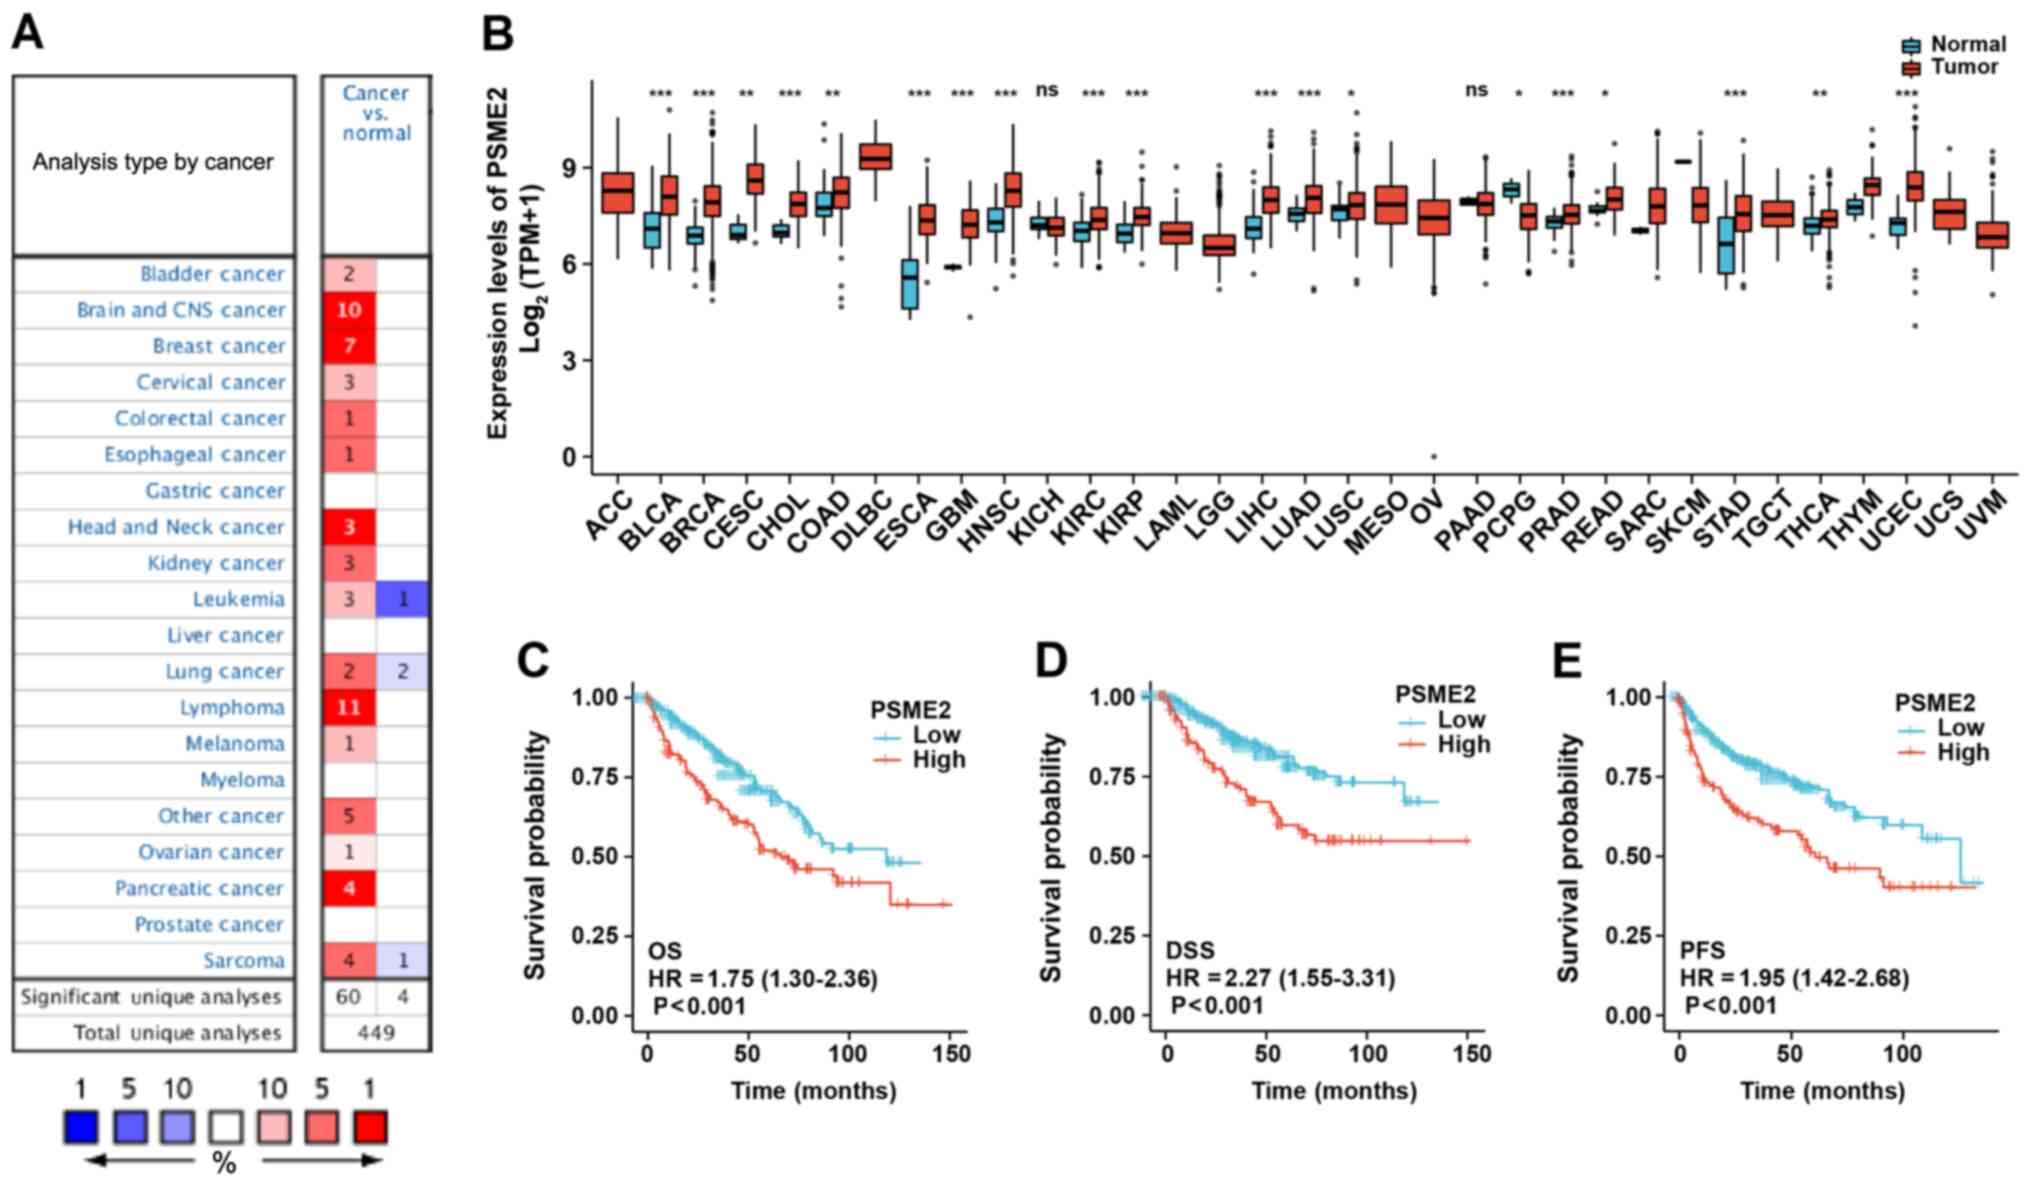 | Figure 2Expression profiling of PSME2 in
diverse types of cancer and association of PSME2 expression with
prognosis. (A) The PSME2 gene expression level in different types
of cancer and normal tissues using the Oncomine database. The graph
represents the datasets with statistically significant (P<0.01)
overexpression (red) or lower expression (blue) in PSME2. (B) PSME2
differential expression level in 33 types of cancer (n=486) and
normal (n=338) tissues from The Cancer Genome Atlas database.
*P<0.05, **P<0.01,
***P<0.001. PSME2 gene expression was associated with
(C) OS, (D) DSS and (E) PFS time Kaplan-Meier survival analysis.
HR, hazard ratio; OS, overall survival; DSS, disease-free survival;
PFS, progression-free survival; ACC, adrenocortical carcinoma;
BLCA, bladder urothelial carcinoma; BRCA, breast invasive
carcinoma; CESC, cervical squamous cell carcinoma and endocervical
adenocarcinoma; CHOL, cholangiocarcinoma; COAD, colon
adenocarcinoma; DLBC, lymphoid neoplasm diffuse large B-cell
lymphoma; ESCA, esophageal carcinoma; GBM, glioblastoma multiforme;
HNSC, head and neck squamous cell carcinoma; KICH, kidney
chromophobe; KIRC, kidney renal clear cell carcinoma; KIRP, kidney
renal papillary cell carcinoma; LAML, acute myeloid leukemia; LGG,
brain lower grade glioma; LIHC, liver hepatocellular carcinoma;
LUAD, lung adenocarcinoma; LUSC, lung squamous cell carcinoma;
MESO, mesothelioma; OV, ovarian serous cystadenocarcinoma; PAAD,
pancreatic adenocarcinoma; PCPG, pheochromocytoma and
paraganglioma; PRAD, prostate adenocarcinoma; READ, rectum
adenocarcinoma; SARC, sarcoma; SKCM, skin cutaneous melanoma; STAD,
stomach adenocarcinoma; TGCT, testicular germ cell tumors; THCA,
thyroid carcinoma; THYM, thymoma; UCEC, uterine corpus endometrial
carcinoma; UCS, uterine carcinosarcoma; UVM, uveal melanoma; PSME2,
proteasome activator complex subunit 2. |
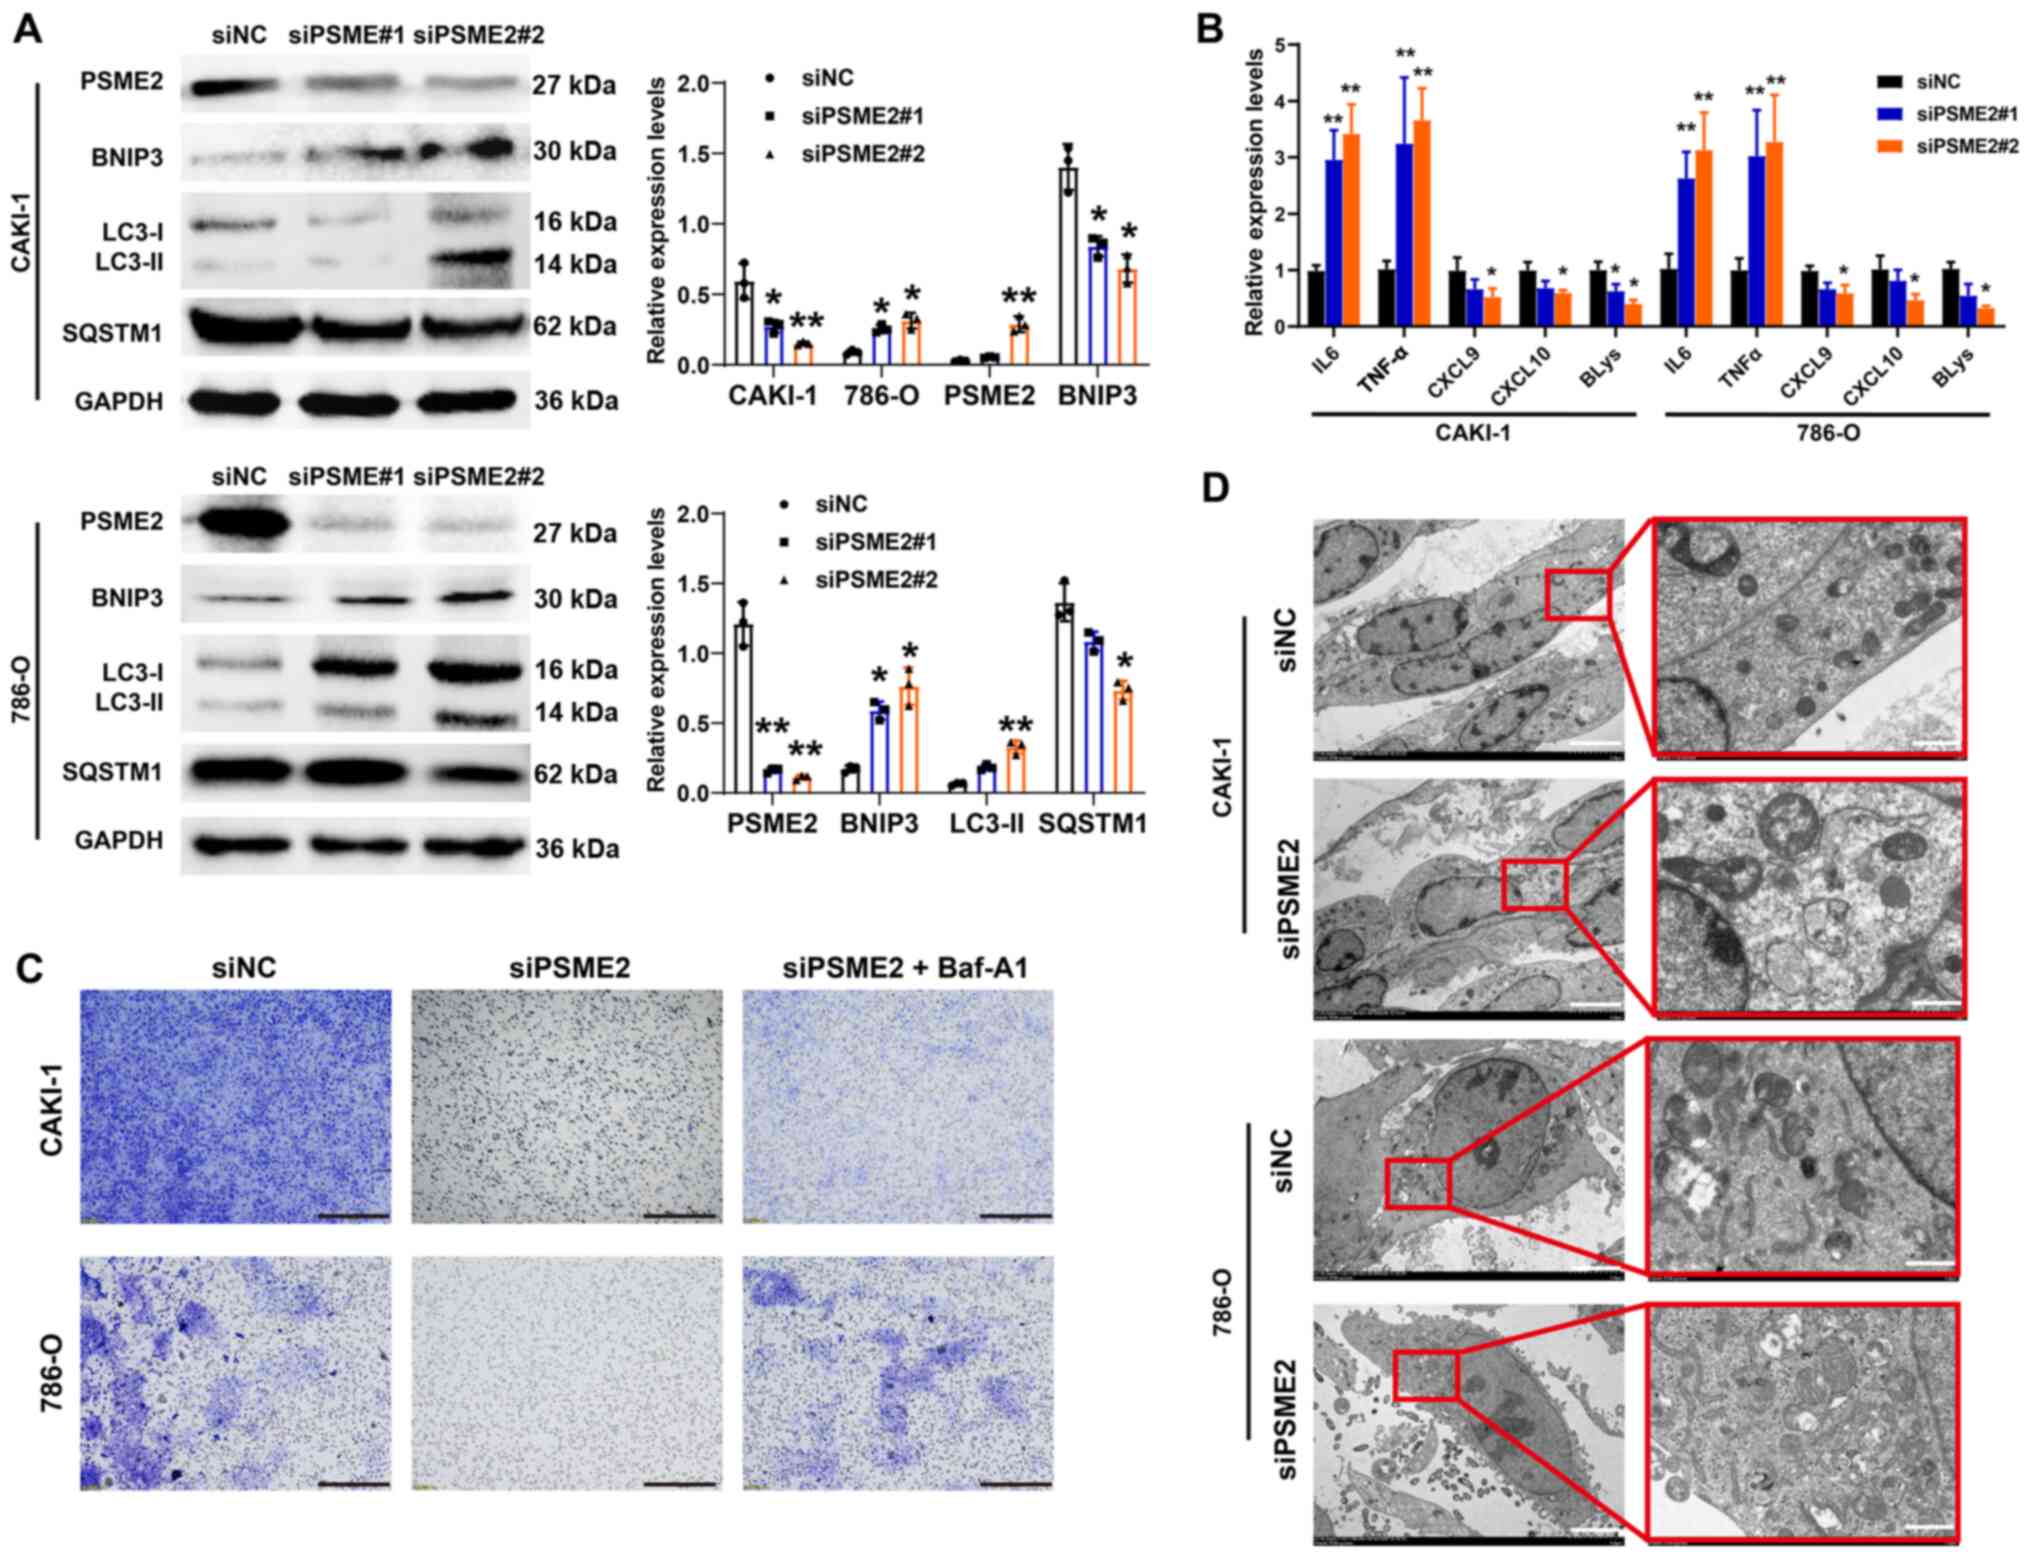 | Figure 6Effects of PSME2-knockdown on
autophagy and tumor cytokine expression in the CAKI-1 and 786-O
cell lines. (A) Autophagy-associated proteins were detected using
western blot analysis and the results were quantified using
densitometry. The data are presented as the mean ± SD from three
independent experiments. *P<0.05,
**P<0.01. (B) The mRNA expression level of IL-6,
TNF-α, CXCL9, CXCL10 and BLys were determined in the CAKI-1 and
786-O cell lines using reverse transcription-quantitative PCR.
*P<0.05, **P<0.01, compared to siNC
control. (C) Cell invasion of CAKI-1 and 786-O cell lines
transfected with siPSME2 or siNC were analyzed following treatment
with Baf-A1. Scale bar, 200 µm. (D) Transmission electron
microscopy of autophagosomes in renal carcinoma cells transfected
with siRNAs. Left scale bar, 5 µm; right scale bar, 1
µm. PSME2, proteasome activator complex subunit 2; si, small
inhibiting; NC, negative control; Baf-A1, bafilomycin A1; SQSTM1,
sequestersome 1; BNIP3, BCL2 interacting protein; CXCL, C-X-C motif
chemokine ligand; BLys, B lymphocyte stimulator. |
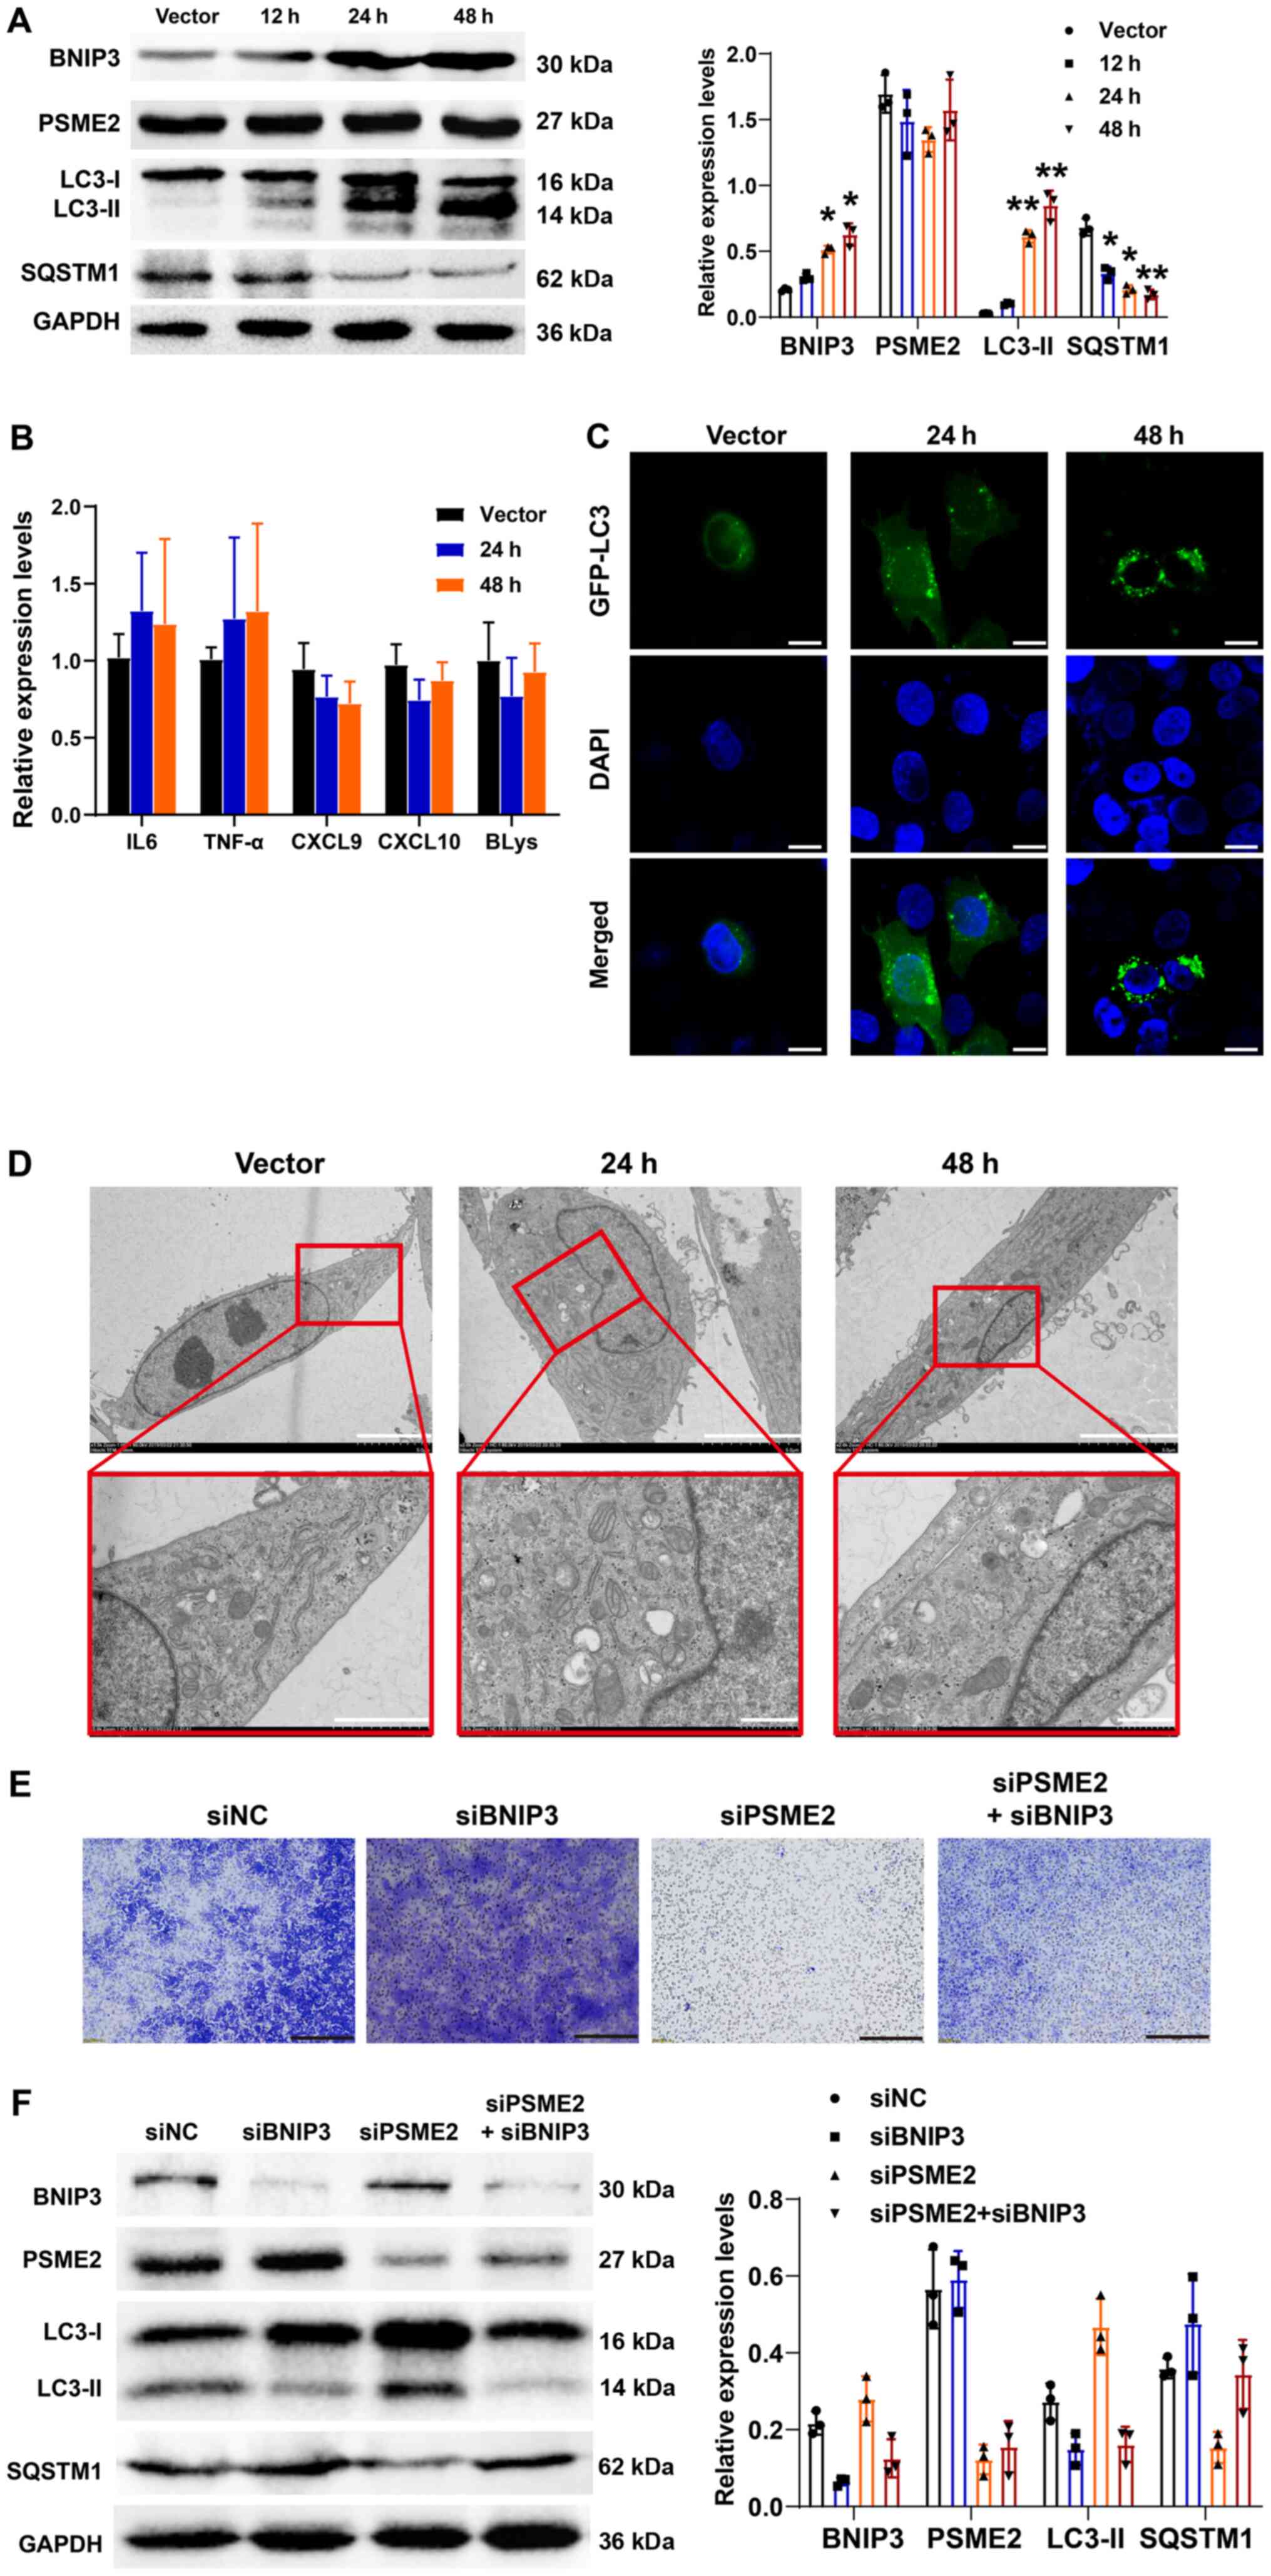 | Figure 7Effects of BNIP3 overexpression on
autophagy and tumor cytokine expression level with or without
siPSME2 in the CAKI-1 cell line. (A) Western blot analysis of
autophagy-related proteins and PSME2 in empty vector and
BNIP3-overexpressing cells at 12, 24 and 48 h following
transfection, and the results were quantified using densitometry.
*P<0.05, **P<0.01, compared to vector.
(B) IL-6, TNF-α, CXCL9, CXCL10 and BLys mRNA expression levels were
measured using reverse transcription-quantitative PCR. The cells
were transfected with either empty plasmid or BNIP-3 overexpression
vector for 24 and 48 h. (C) Subcellular localizations of LC3 were
determined using confocal microscopy. Scale bar, 10 µm. (D)
Transmission electron microscope of the CAKI-1 cell line
transfected with empty plasmid or BNIP-3 overexpression vector for
24 and 48 h. Top scale bar, 5 µm; bottom scale bar, 1
µm. (E) Invasion of the CAKI-1 cell line simultaneously
transfected with siBNIP3 and siPSME2 using a Transwell invasion
assay. Scale bar, 200 µm. (F) A total of five protein
biomarkers were found to be differentially expressed in BNIP3
or/and PSME2 knockout cells and the results were quantified using
densitometry. PSME2, proteasome activator complex subunit 2; si,
small inhibiting; NC, negative control; SQSTM1, sequestersome 1;
BNIP3, BCL2 interacting protein; CXCL, C-X-C motif chemokine
ligand; BLys, B lymphocyte stimulator. |
Results
PSME2 expression is upregulated in the
KIRC dataset from TCGA
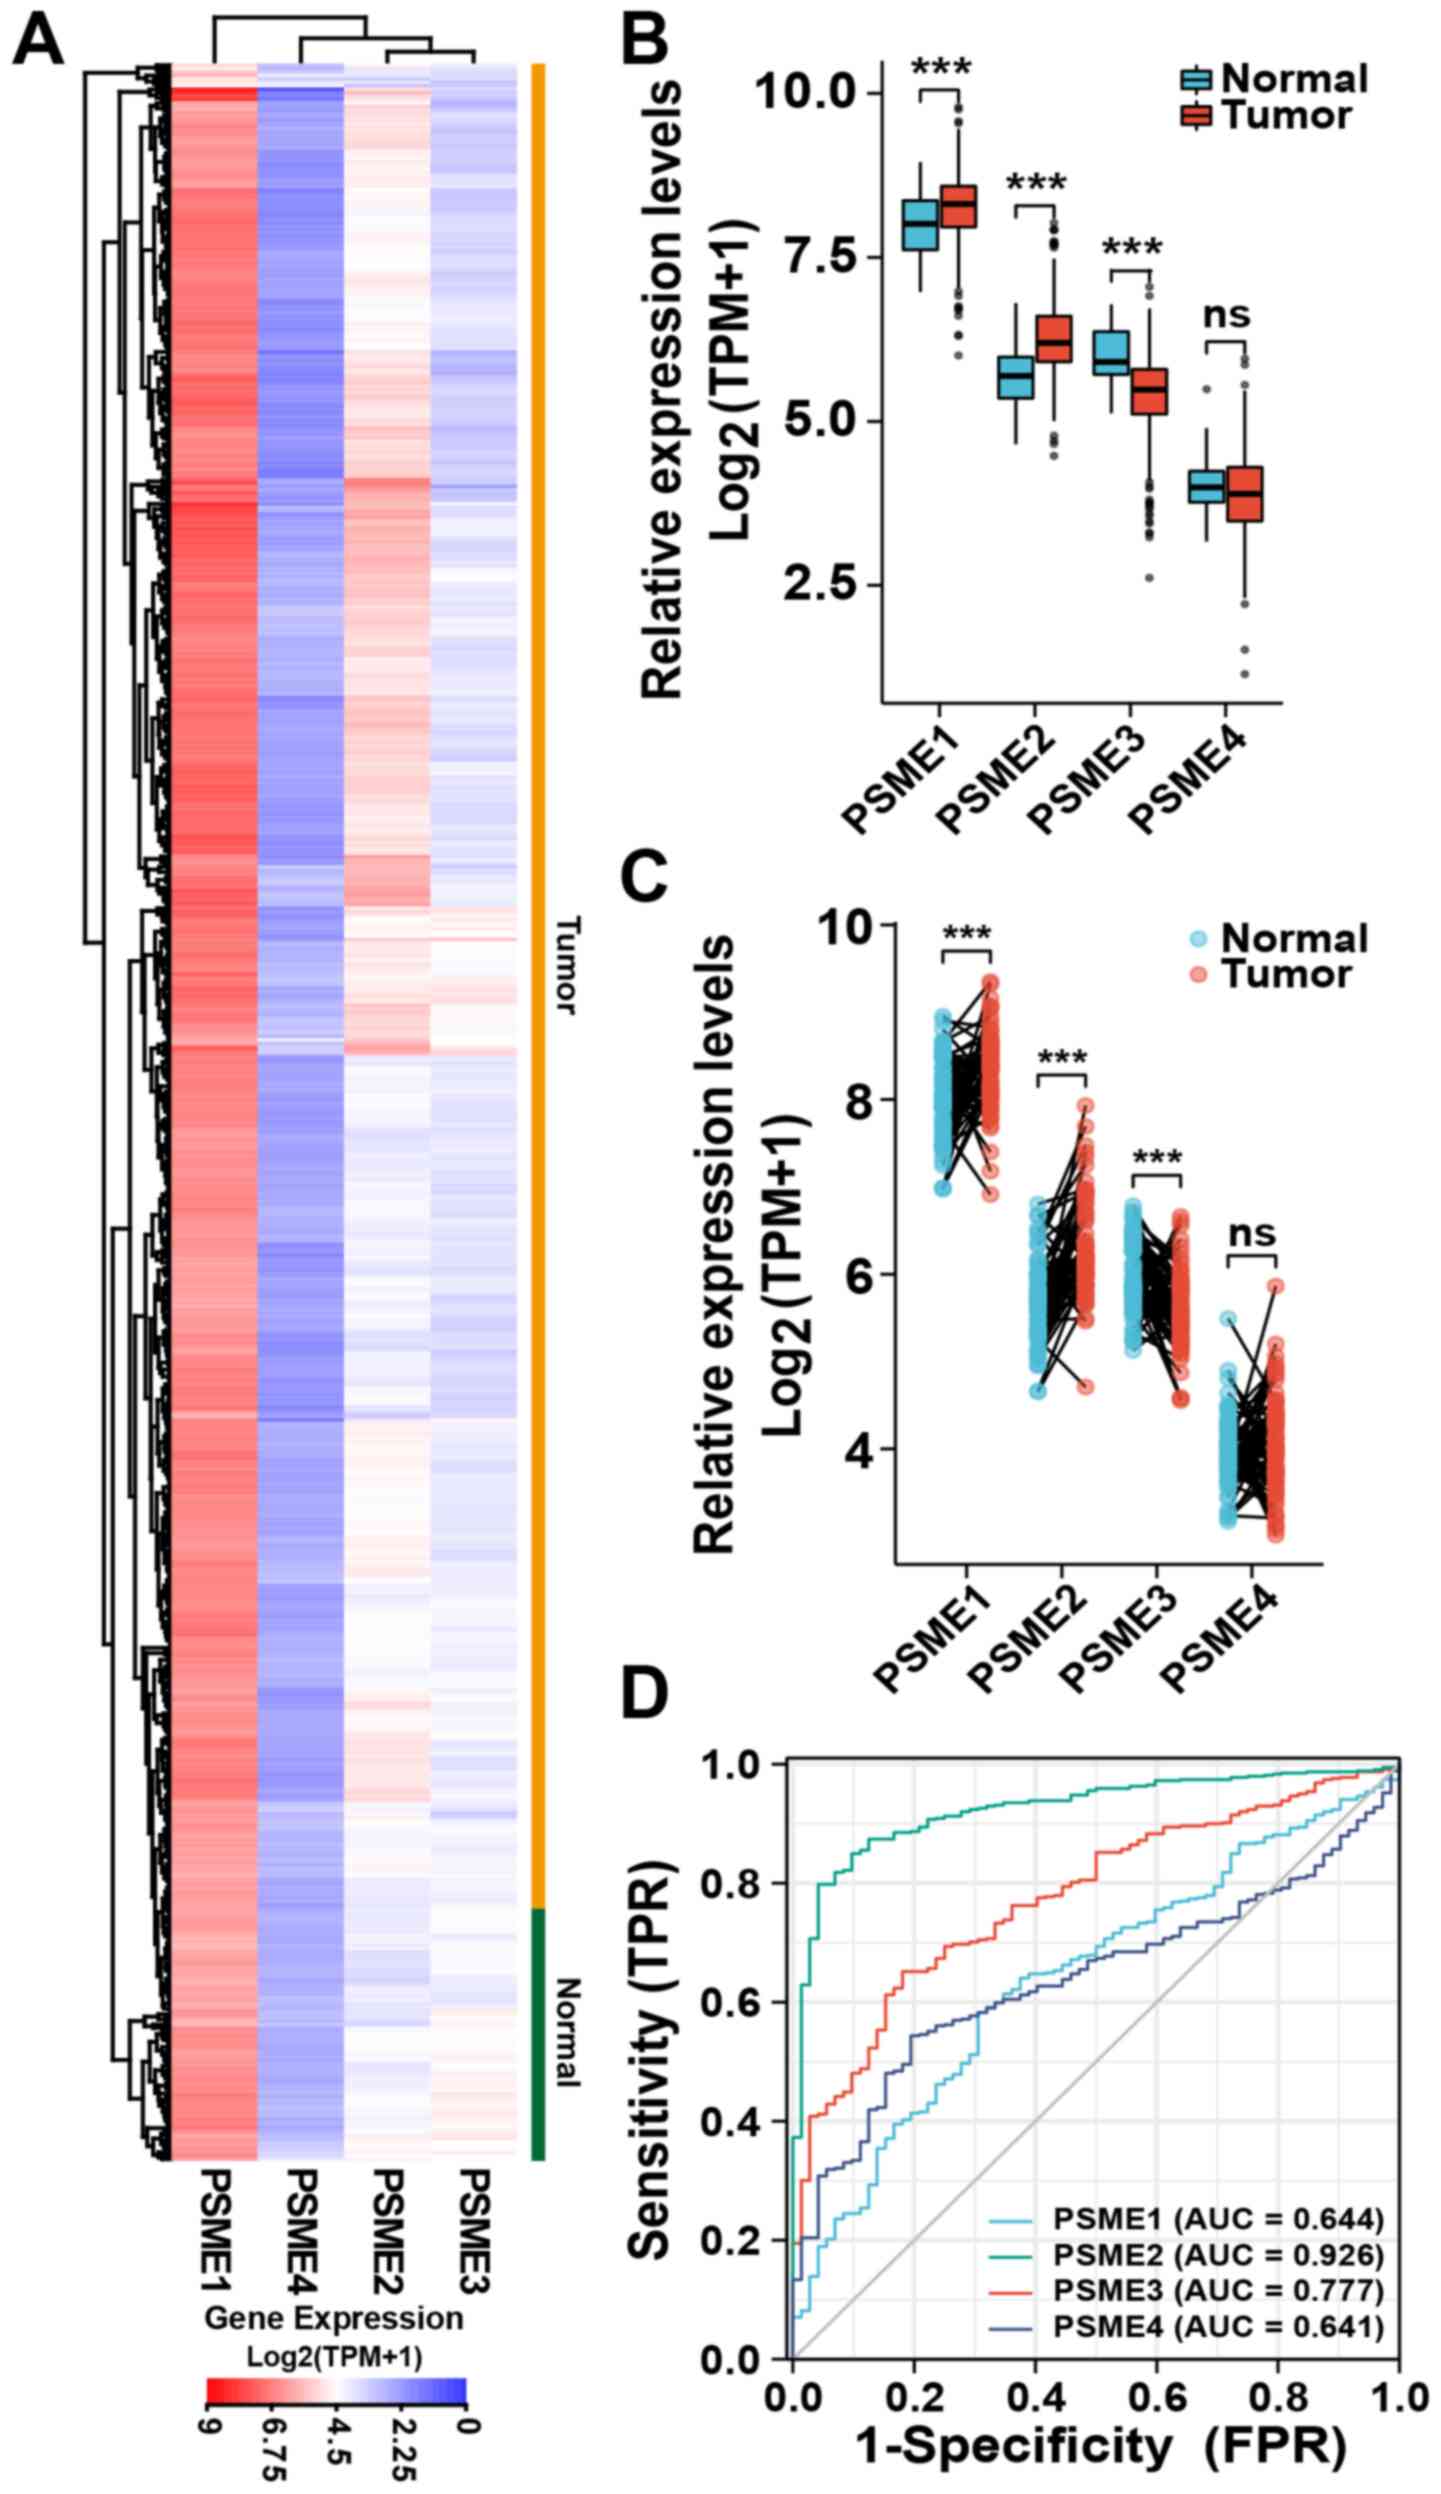
To determine the association between PSME2 mRNA
expression and KIRC tissues, a transcriptional profile of PSME2,
and other PSME genes, was analyzed using TCGA database. The data
showed that, compared with that in normal tissues, PSME2 mRNA
expression was upregulated in most tumor samples. Furthermore,
among the PSME subtypes, PSME1 had a high level of expression. By
contrast, the mRNA expression level of PSME4 was low and there was
no difference in the expression level of PSME3 between the tumor
and normal tissues (Fig. 1A). As
shown in Fig. 1B, the median mRNA
expression levels of all the subtypes of PSME4 were significantly
different between the tumor and normal tissues samples, except for
PSME4. PSME1 and PSME2 were upregulated in the tumor tissues,
whereas PSME3 was significantly downregulated. Paired tissue
analysis also revealed that the expression levels of PSME2 were
significantly upregulated (P<0.001) in the tumor samples
compared with that in the adjacent normal samples (Fig. 1C). ROC curve analysis was used to
investigate the validity of the mRNA expression level in the four
PSME genes in KIRC and normal tissues. As shown in Fig. 1D, the AUCs of the four genes were
all >60%. The gene with the highest AUC was PSME2 (92.6%).
Therefore, the mRNA expression level of PSME2 showed the best
specificity and sensitivity to correctly distinguish tumor and
adjacent normal kidney samples. Thus, PSME2 may play a critical
role in kidney carcinoma.
Upregulated expression of PSME2 in cancer
and the prognostic value of PSME2 in patients with ccRCC
To identify the function of PSME2 in different types
of tumor, the expression levels between tumor and normal tissues
were compared using the visualization tools in the Oncomine
database. As illustrated in Fig.
2A, the Oncomine database contained 449 unique analyses for
PSME2. It was found that PSME2 was upregulated in several types of
cancers, including the brain and central nervous system cancer,
breast cancer, lymphoma, and pancreatic cancer. A total of three
studies revealed a significant increase in mRNA expression levels
of PSME2 in kidney cancer samples compared with that in normal
samples (46-48). Accessing TCGA dataset, the PSME2
mRNA expression levels in various types of tumor tissues and
adjacent normal tissues were compared (Fig. 2B). It was found that PSME2 was
significantly upregulated in bladder urothelial carcinoma, breast
invasive carcinoma, cholangiocarcinoma, cervical squamous cell
carcinoma and endocervical adenocarcinoma, colon adenocarcinoma,
esophageal carcinoma, glioblastoma multiforme, head and neck
squamous cell carcinoma, KIRC, lung adenocarcinoma, liver
hepatocellular carcinoma, lung squamous cell carcinoma, prostate
adenocarcinoma, rectum adenocarcinoma, stomach adenocarcinoma,
thyroid carcinoma and uterine corpus endometrial carcinoma, while
it had lower expression levels in pheochromocytoma and
paraganglioma compared with that in adjacent normal tissues. In
addition, Kaplan-Meier plotter analysis for OS (Fig. 2C), DSS (Fig. 2D) and PFS (Fig. 2E) time revealed an association
with PSME2 mRNA expression; therefore, PSME2 was significantly
associated with patient prognosis. It was found that patients who
had high mRNA expression level of PSME2, had a low survival rate.
These findings indicated that PSME2 could be a tumor and
prognosis-related marker.
Functional enrichment analysis of PSME2
mRNA expression level in ccRCC
To investigate the molecular mechanisms involved in
ccRCC, WGCNA was performed and 194 differentially expressed probes
among 12 tumor samples were divided into five-module colors of the
top 25% genes ranked using cluster dendrogram trees, including the
colors brown, blue, turquoise, yellow, and grey. The grey module
was specified as the gene set that could not be assigned to any
module and had no reference meaning (Fig. 3A). The association between module
eigengenes and clinicopathological status (normal and tumor) of
ccRCC is shown in Fig. 3B. In
Fig. 3B, the values of PCC ranged
from -1 to 1 depending on the strength of the association. A
positive value indicates the probe sets in a specific co-expression
module increase as the variable increases, while a negative value
indicates a specific co-expression module decreases as the variable
decreases. Compared with that in the other modules, the genes in
the turquoise module displayed the highest association with normal
tissues. By contrast, the brown module showed the highest
association with the tumor. Based on this method, the brown module,
with the tumor, was identified as the clinically crucial module and
was chosen for further investigation. Subsequently, the genes in
the brown module in the tumor group were used for KEGG and GO
enrichment analysis with DAVID. As depicted in Fig. 3C, in the brown module, most mRNAs
were enriched in 'anion transmembrane transporter activity',
'extracellular matrix structural constituent', 'apical part of
cell', 'collagen-containing extracellular matrix', 'response to
nutrient levels', 'extracellular structure organization' and
'macroautophagy'. KEGG enrichment analysis demonstrated that genes
were mainly enriched in 'autophagy-animal', 'complement and
coagulation cascades', 'rheumatoid arthritis', 'protein digestion
and viral protein interaction', 'Staphylococcus aureus
infection', 'cytokine and cytokine receptor', 'IL-17 signaling
pathway', and 'pertussis' (Fig.
3D). It was found that almost all the enriched functional terms
and pathways were associated with the autophagy and cytokines.
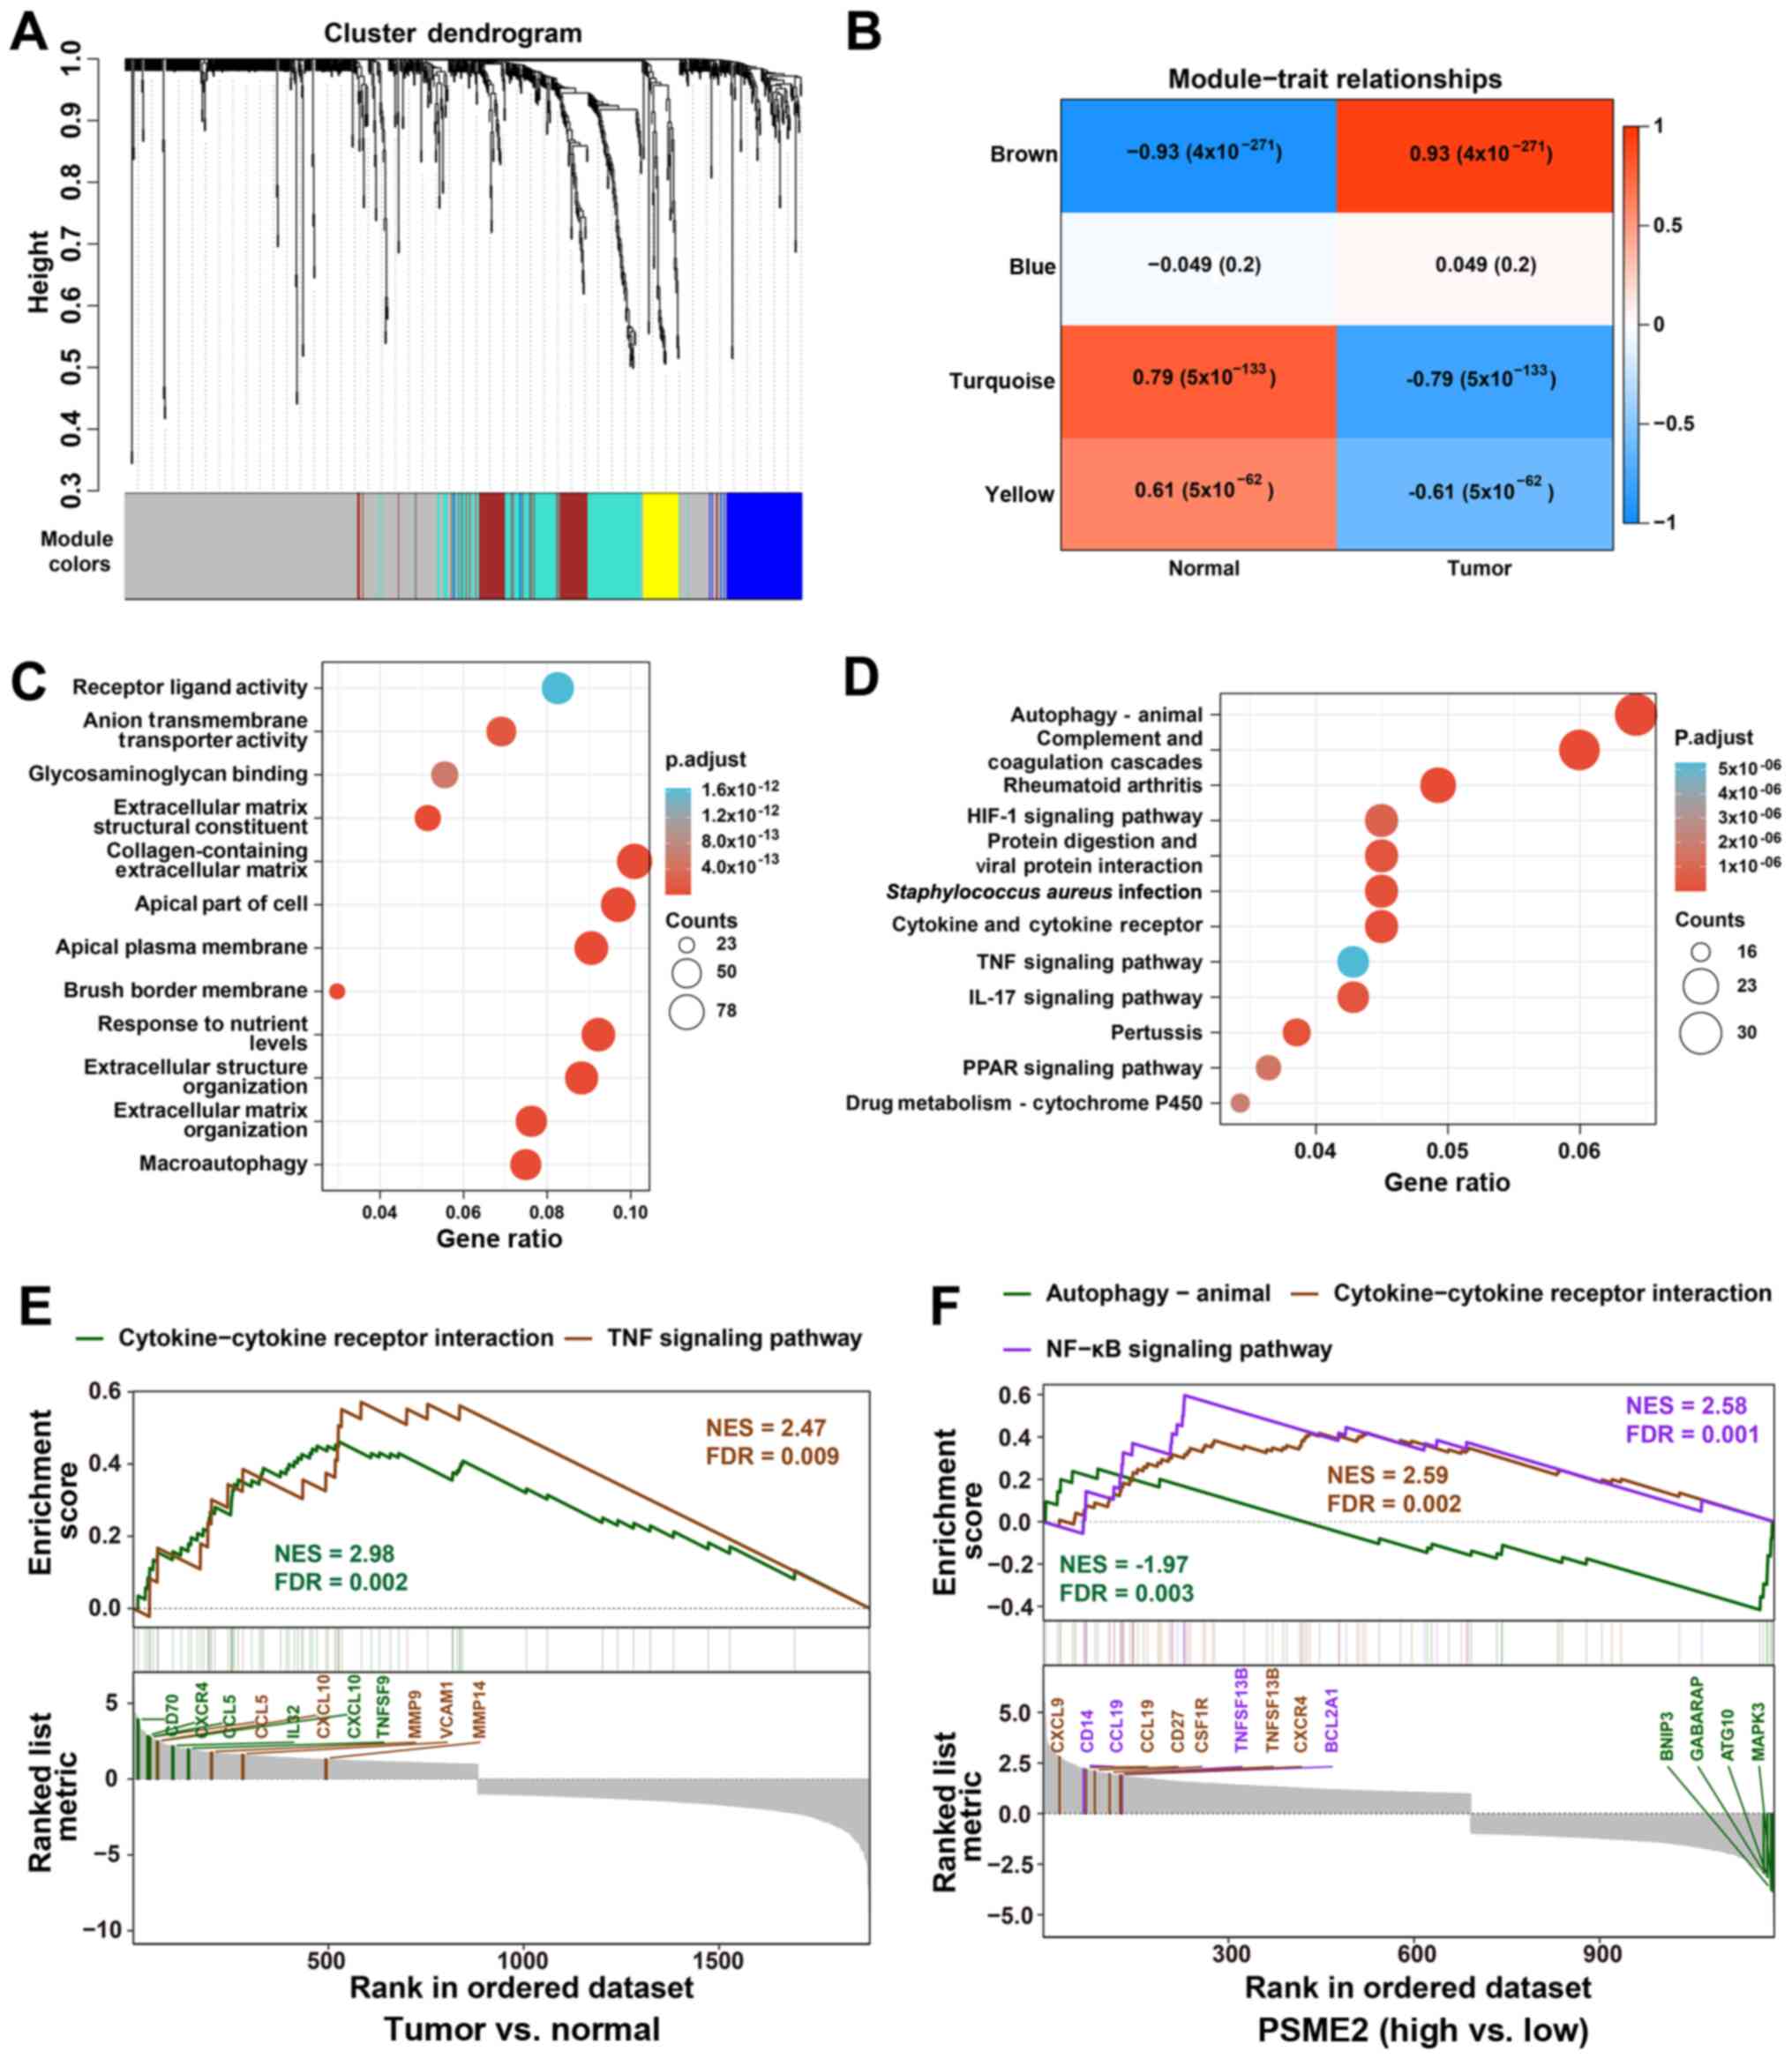 | Figure 3Functional characterization of PSME2
in ccRCC using WGCNA and GSEA. (A) WGCNA hierarchical cluster
dendrogram of the top 25% genes ranked by SD from large to small
ccRCC. Each branch in the tree represents one gene. Each color
represents one co-expression module. (B) PCC matrix of the
correlation between MEs and clinicopathological status (normal and
tumor) of ccRCC. Each row corresponds to a colored ME detected
using WGCNA, and each column corresponds to a trait. The values of
PCC ranged from -1 to 1 depending on the strength of the
relationship. A positive value means that the probe sets in a
specific co-expression module increase as the variable increases,
while a negative value indicates a specific co-expression module
decreases as the variable decreases. Each PCC value has the
corresponding P-value in brackets. (C) GO enrichment analysis using
The Database for Annotation, Visualization and Integrated
Discovery. The horizontal axis represents the proportion of PSME2
enriched in each GO term. The vertical axis represents the
annotation terms. The size of the bubble represents the number of
genes in each GO term; depth of each circle color represents
P-value. (D) KEGG enrichment for the differentially expressed genes
in Fig. 3B. (E) GSEA revealing
cytokine-cytokine receptor interaction and TNF signaling pathway
associations between tumor and normal samples from TCGA. (F) GSEA
revealing autophagy-animal, cytokine-cytokine receptor interaction
and NF-κB signaling pathway associated with PSME2 expression levels
from TCGA database. ME, module eigengenes; GO, Gene Ontology; KEGG,
Kyoto Encyclopedia of Genes and Genomes; WGCNA, weighted gene
co-expression network analysis; GSEA, Gene Set Enrichment Analysis;
TCGA, The Cancer Genome Atlas; PSME2, proteasome activator complex
subunit 2; ccRCC, clear cell renal cell carcinoma; NES, normalized
enrichment score; FDR, false discovery rate; PCC, Pearson's
correlation coefficient. |
To understand the pathways involved in PSME2 and
ccRCC, GSEA analysis was conducted using the GSE dataset. The two
most functional gene sets were enriched in the TNF signaling
pathway, and cytokine and cytokine receptor interaction between the
tumor and normal samples (Fig.
3E). Functional analysis of the PSME2 gene showed that several
genes associated with numerous critical aspects of cancer were
changed. The hub genes in cytokine and cytokine receptor
interaction were CD70, CXCR4, CCL5, IL32, CXCL10, and TNFSF9. In
addition, the core regulators in the TNF signaling pathway included
the CCL5, CXCL10, MMP9, VCAM1 and MMP14 genes. For patients with
ccRCC and high expression levels of PSME2, the NF-κB signaling
pathway and cytokine-cytokine receptor interaction were enriched in
the two gene sets. CXCL9, CCL19, CD27, CSF1R, TNFSF13B and CXCR4,
and CD14, CCL19, TNFSF13B and BCL2A1 were core regulators in the
NF-κB signaling pathway and cytokine-cytokine receptor interaction,
respectively. Whereas genes in the PSME2 low expression group were
enriched in autophagy-animal. BNIP3, GABARAP, ATG10 and MAPK3 genes
were found to be hub regulators (Fig.
3F).
Expression level of PSME2 in clinical
samples and tumor cells
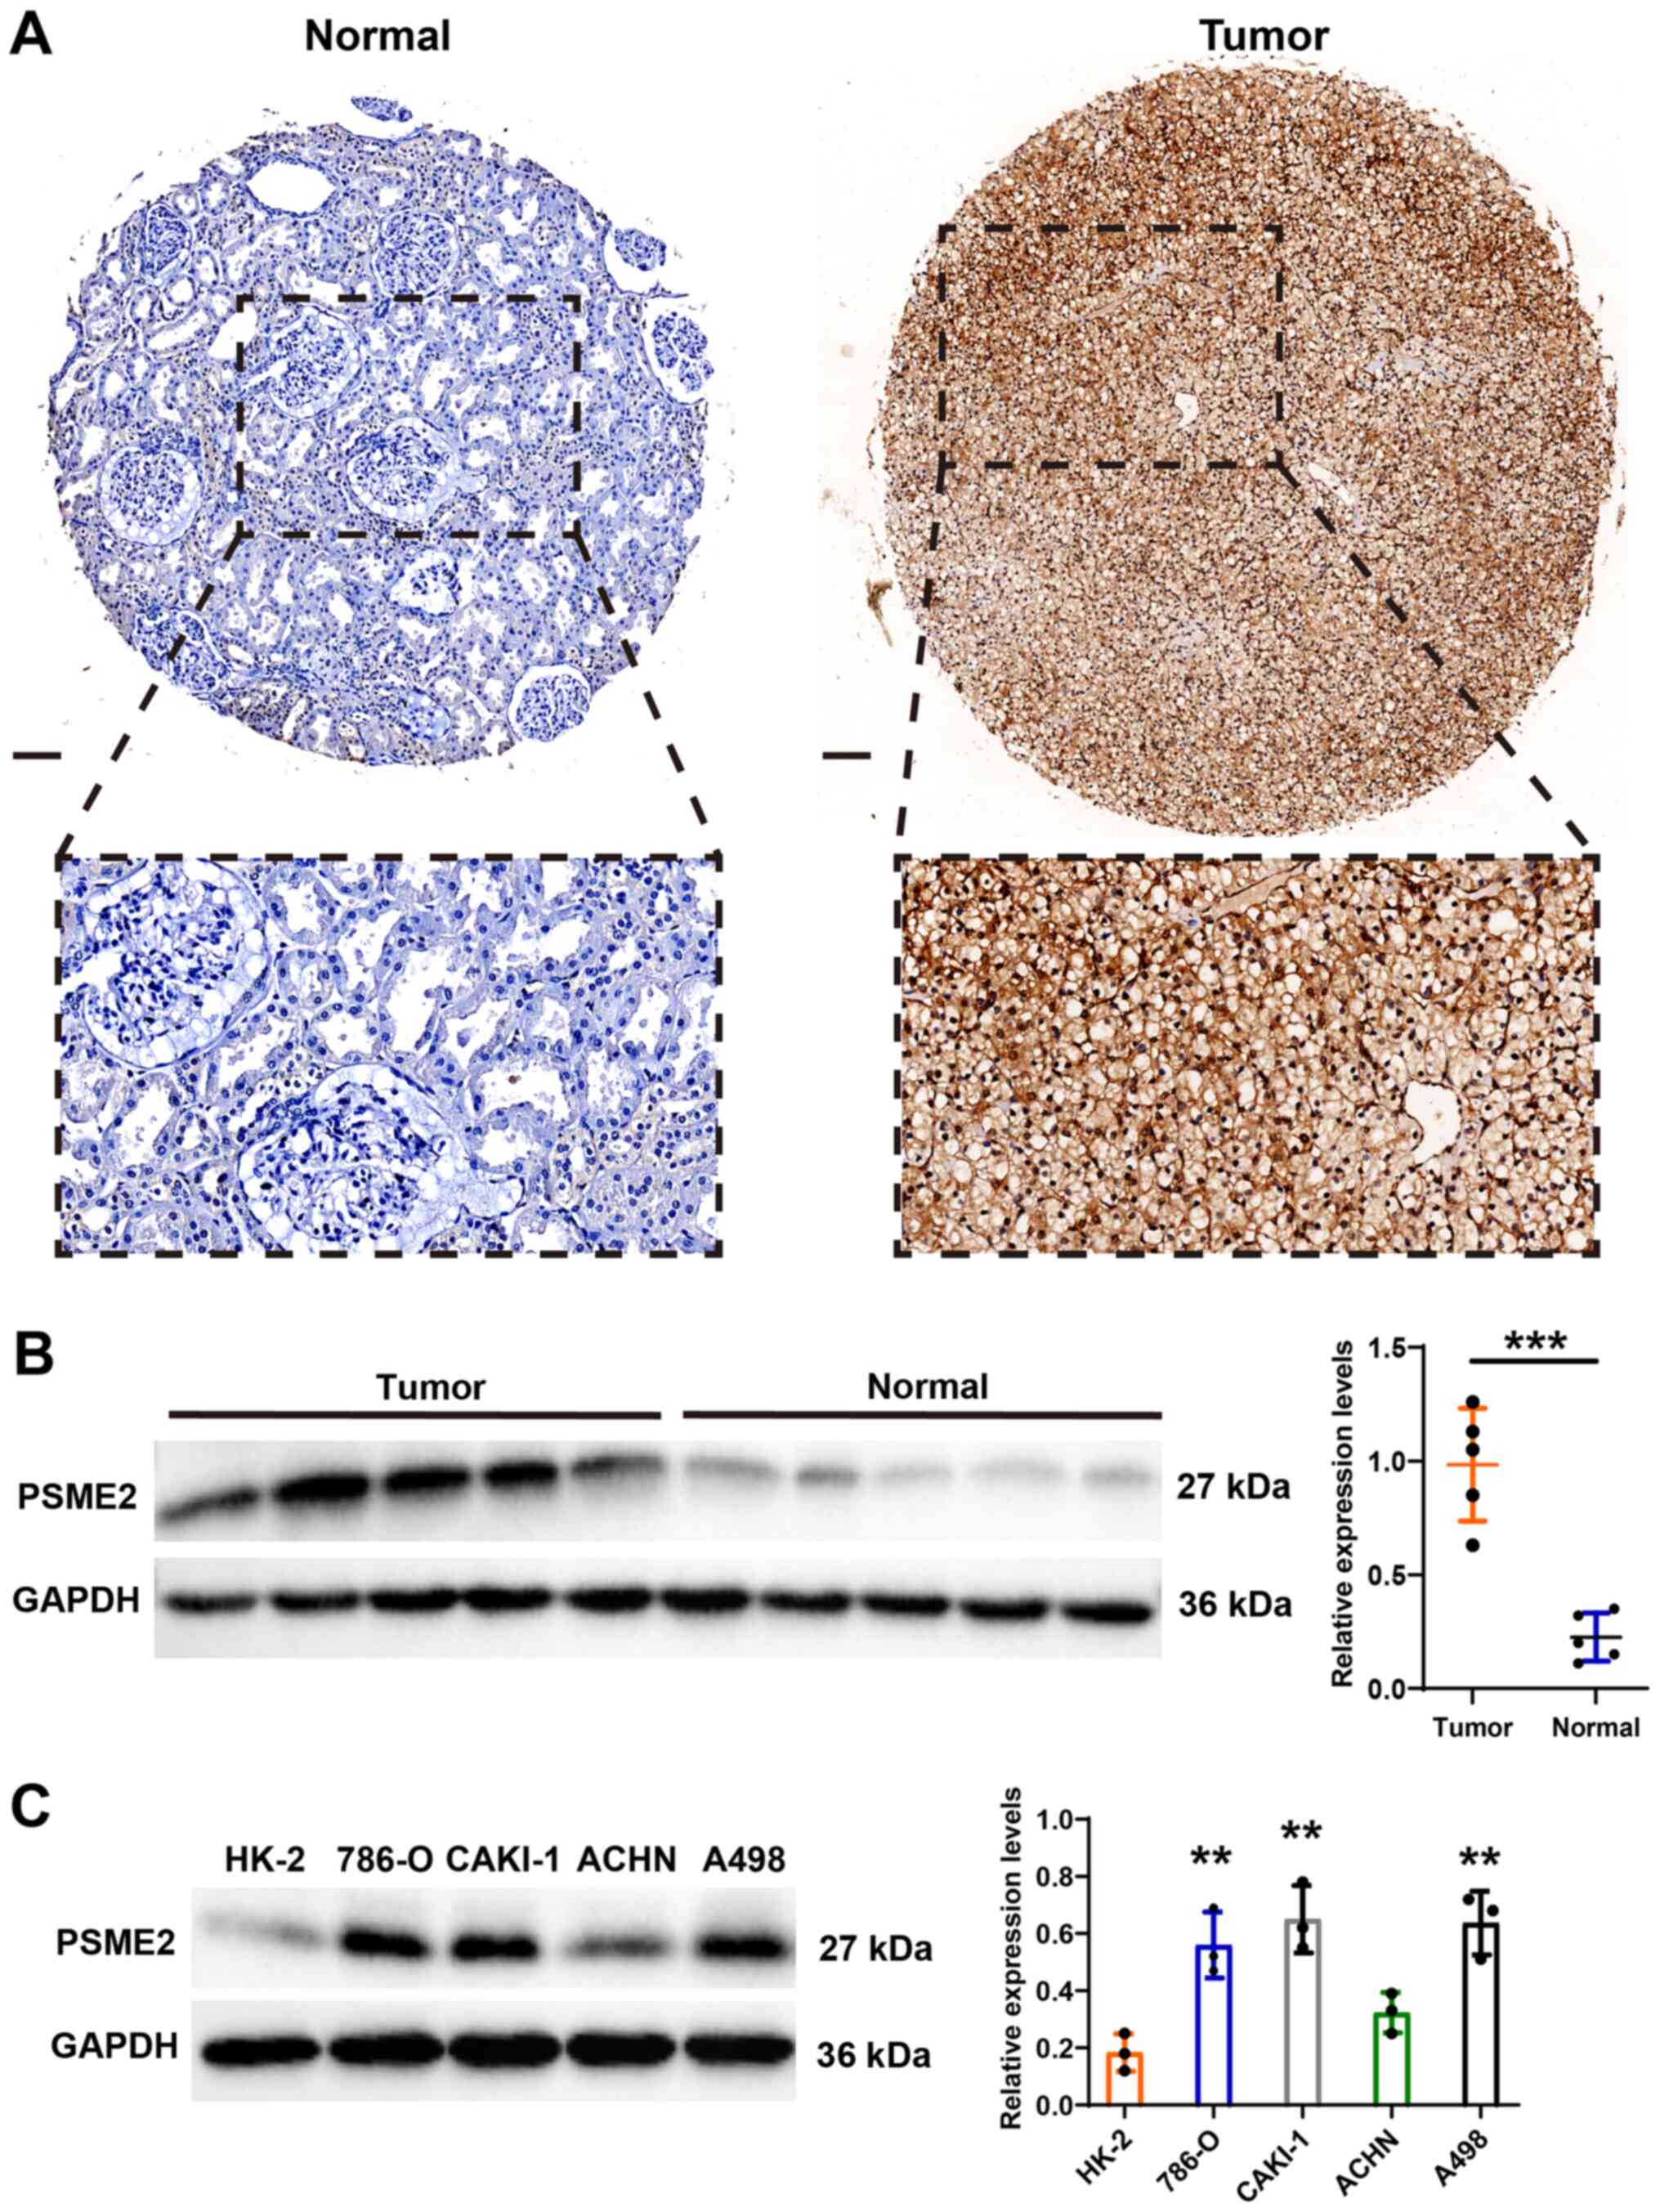
The bioinformatics results showed that PSME2
expression level was frequently upregulated in KIRC. To verify the
results from bioinformatics analysis, the expression patterns of
PSME2 were analyzed using IHC and its association with
clinicopathological features in patients with kidney cancer was
also investigated. Fig. 4A shows
representative PSME2 staining images from the TMA. There was strong
expression of PSME2 in the cytoplasm of the renal tumor tissues,
but a weak expression level in adjacent normal tissues from
patients with ccRCC. In addition, univariate analysis showed that T
stage (P<0.001) and M stages (P<0.001) were significantly
associated with PSME2 expression in the samples from patients with
ccRCC. The details of the patient characteristics are listed in
Table I. Western blot analysis
also revealed that PSME2 protein expression level was more notable
in tumor tissues compared with that in matched normal tissues
(Fig. 4B). Then, the normal human
kidney cell line (HK-2) and the renal carcinoma cell lines (786-O,
CAKI-1, ACHN and A498) were used to determine the expression levels
of PSME2. As shown in Fig. 4C,
PSME2 was increased in the renal tumor cell lines, which was
consistent with bioinformatics and IHC results.
 | Table IUnivariate Cox regression analysis
between low (n=37) and high (n=38) PSME2 expression groups and
clinicopathological features in patients with clear cell renal cell
carcinoma. |
Table I
Univariate Cox regression analysis
between low (n=37) and high (n=38) PSME2 expression groups and
clinicopathological features in patients with clear cell renal cell
carcinoma.
| Characteristic | PSME2 expression
| PSME2 expression
| P-value |
|---|
| Low | High |
|---|
| T stage, n (%) | | | <0.001 |
| T1 | 22 (29.3) | 17 (22.7) | |
| T2 | 5 (6.7) | 5 (6.7) | |
| T3 | 10 (13.3) | 15 (20.0) | |
| T4 | 0 (0.0) | 1 (1.3) | |
| N stage, n (%) | | | 0.149 |
| N0 | 33 (44.0) | 36 (48.0) | |
| N1 | 4 (5.3) | 2 (2.7) | |
| M stage, n (%) | | | <0.001 |
| M0 | 34 (45.3) | 29 (38.7) | |
| M1 | 3 (4.0) | 9 (12.03) | |
| Sex, n (%) | | | 0.192 |
| Male | 23 (30.6) | 26 (34.6) | |
| Female | 14 (18.7) | 12 (16.0) | |
| Median age (IQR),
years | 55 (43-60) | 63 (54-67) | 0.354 |
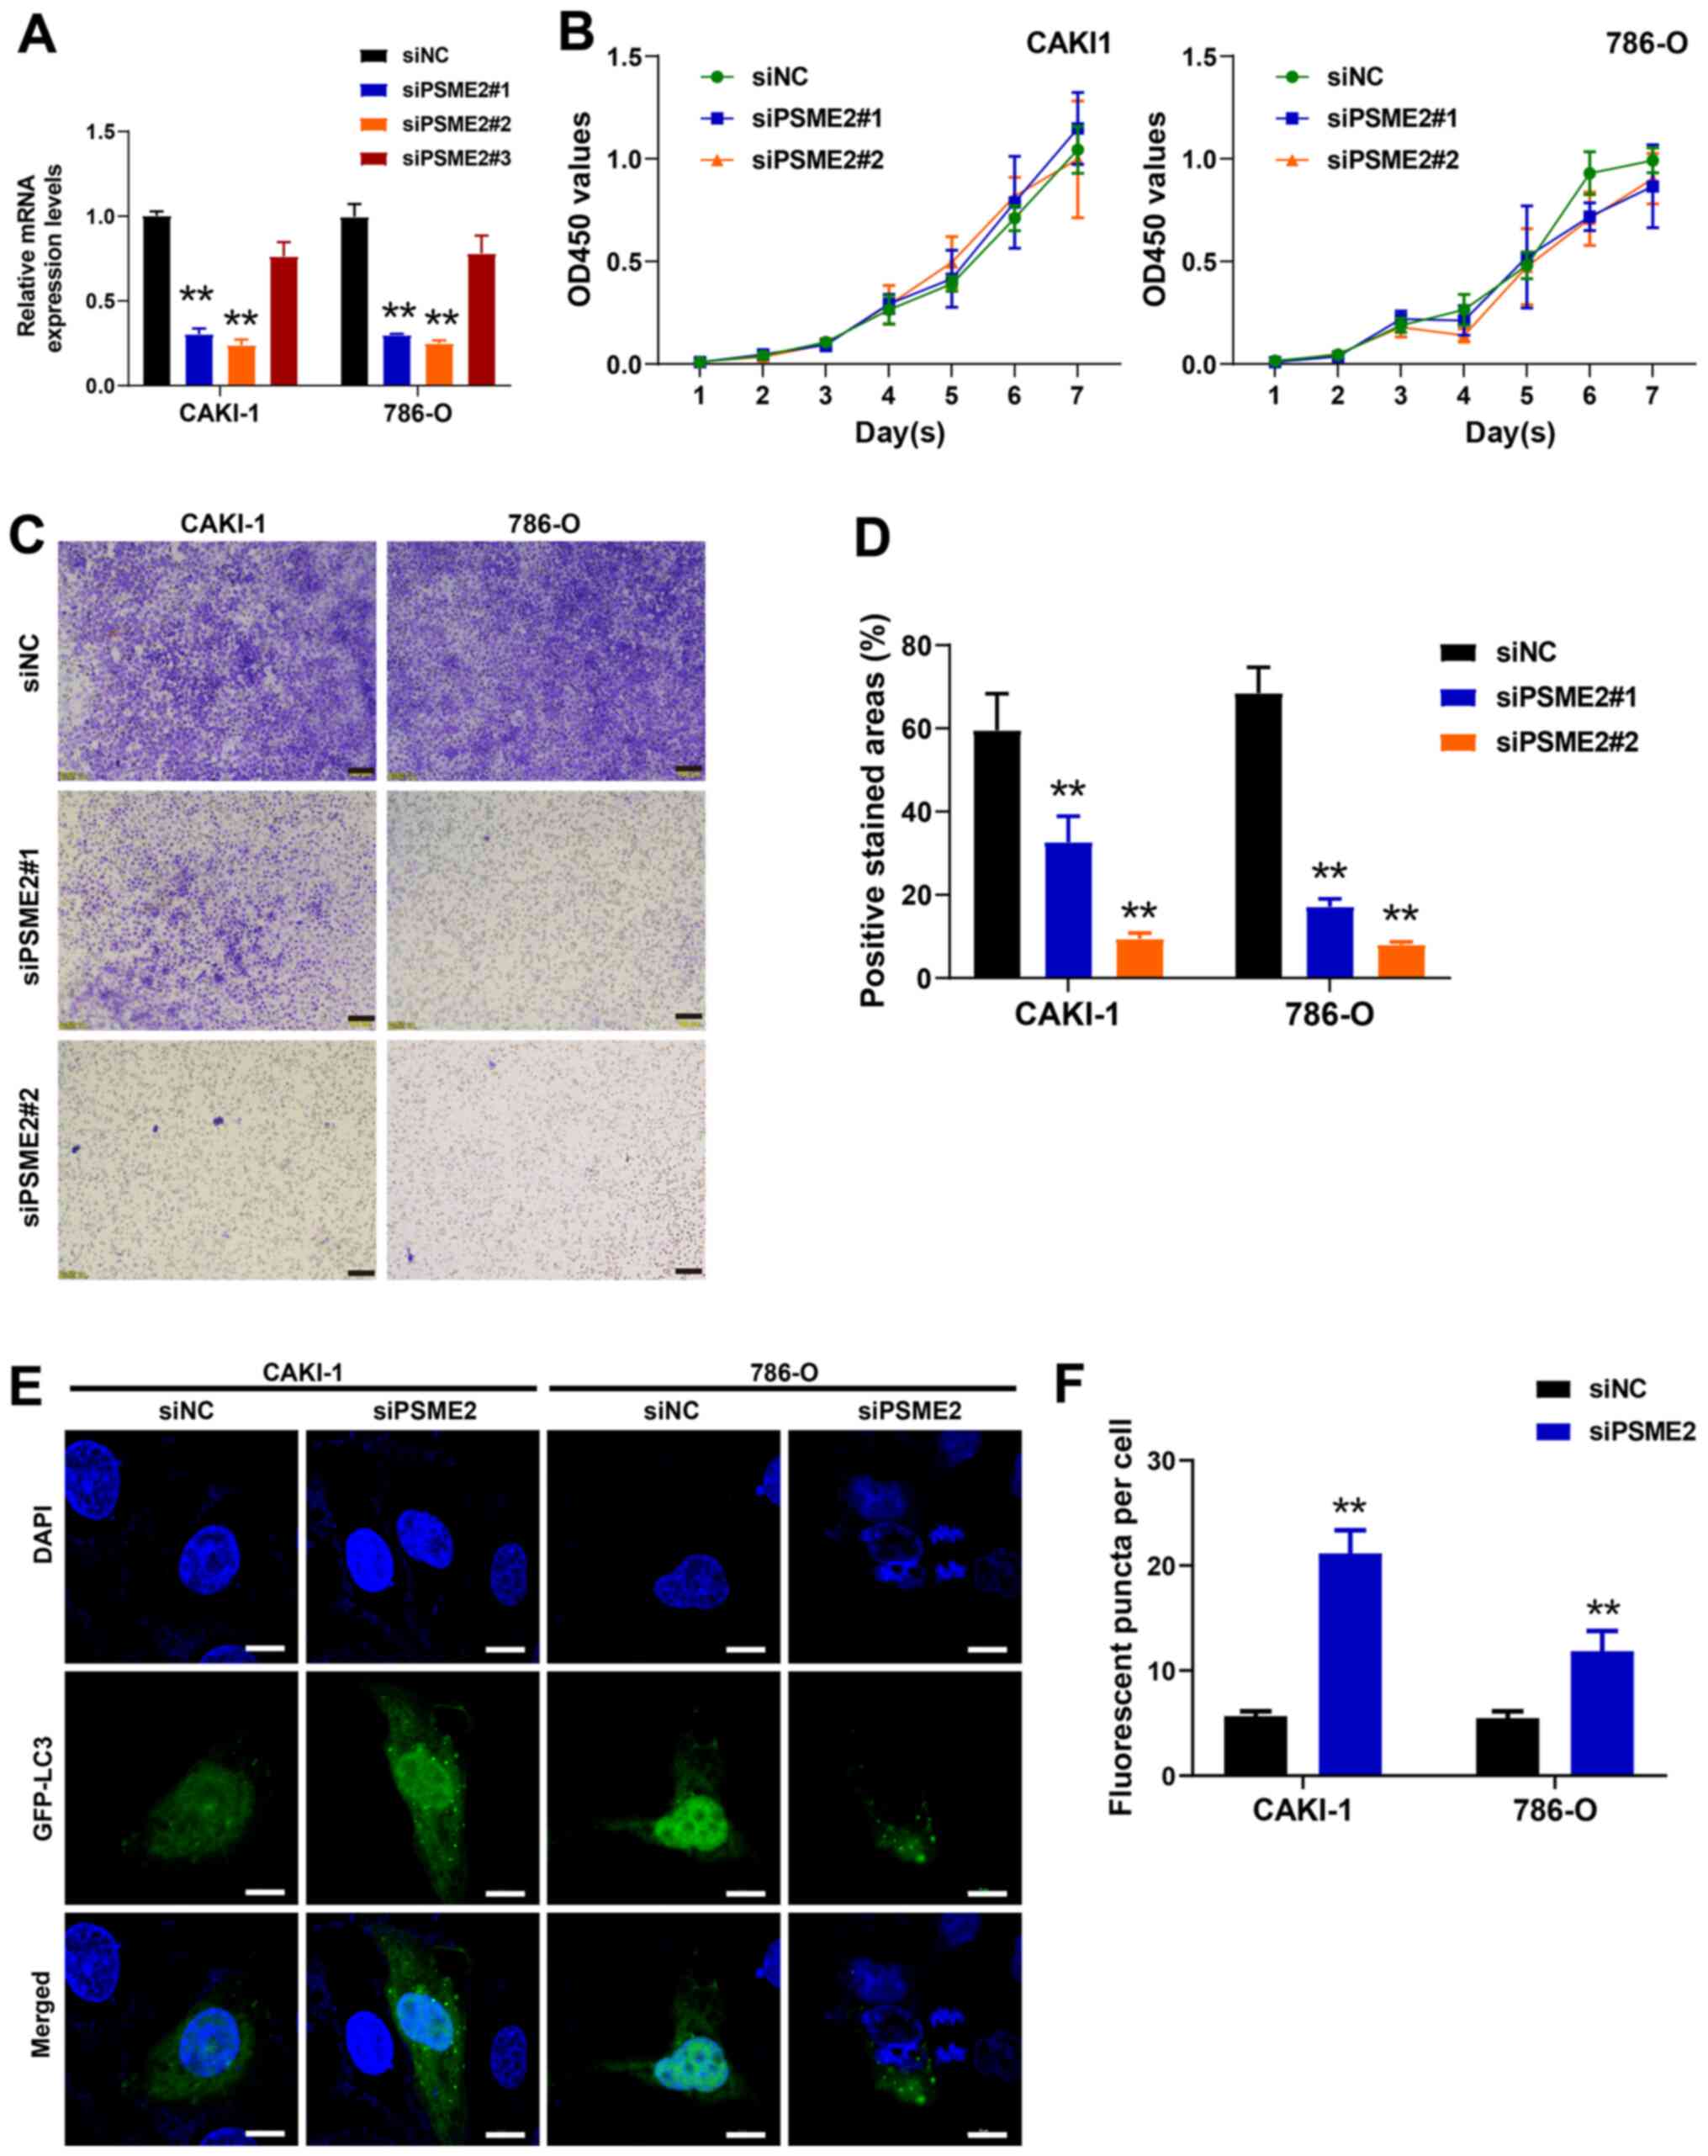
Knockdown of PSME2 inhibits the invasive
ability of the CAKI-1 and 786-O cell lines
To investigate the effect of PSME2 on cell
proliferation and invasion, the 786-O and CAKI-1 cell lines were
transfected with siPSME2 and siNC. After transfection for 48 h, the
cells were collected and the mRNA expression level of PSME2 was
detected using RT-qPCR. As presented in Fig. 5A, after transfection with the 3
siRNAs targeting PSME2, the expression levels of the PSME2 gene in
the cells transfected with siPSME2#1 and siPSME2#2 notably
decreased compared with that in the control siRNA group
(P<0.01). This confirmed that the siPSME2#1 and siPSME2#2 siRNAs
were effective. Therefore, siPSME2#1 and siPSME2#2 were selected
for further experimentation. The viability of the 786-O and CAKI-1
cell lines, detected using a CCK-8 assay, was not significantly
different between the siPSME2#1 and siPSME2#2, and siNC groups
(Fig. 5B). These data indicated
that decreasing the expression level of PSME2 could not inhibit
cell proliferation. The role of PSME2 in tumor cell invasion was
detected using a Transwell invasion assay. Knockdown of PSME2 in
the CAKI-1 and 786-O cell lines reduced invasion compared with that
in the cells transfected with siNC (Fig. 5C). Quantitative analysis of the
positive stained areas in the Transwell membrane showed that ~35
and 20% of the siPSME2#1-transfected cells were invasive compared
with those in the siNC-transfected CAKI-1 and 786-O cells,
respectively. Furthermore, 10 and 8% of the cells in the siPSME2#2
group were invasive in the CAKI-1 and 786-O cell lines (P<0.01;
Fig. 5D), which suggested that
interference of PSME2 reduced the invasive abilities of the cancer
cell lines.
Inhibition of PSME2 promotes autophagy
and affects the expression level of tumor cytokines in the CAKI-1
and 786-O cell lines
To gain insight into the role of PSME2 in autophagy,
PSME2 expression was knocked down using siRNAs, then
autophagosomes, which were stained with a specific GFP-LC3 in the
786-O and CAKI-1 cell lines, were analyzed (Fig. 5E and F). The number of
autophagosomes per cell was increased following siPSME2#2
transfection, suggesting that knockdown of PSME2 induced autophagy
in the CAKI-1 and 786-O cell lines. To determine the status of
autophagy in the CAKI-1 and 786-O cell lines following knockdown of
PSME2, the protein expression level of the autophagy markers,
microtubule-associated protein 1 light chain 3 (LC3), which exists
in two forms and transforms from the free form of LC3-I (18 kDa),
to the smaller (16 kDa) proteolytic form, LC3-II during autophagy,
BNIP3, and SQSTM1 was determined. From western blot analysis
(Fig. 6A), LC3-I to LC3-II
conversion was elevated and BNIP3 protein expression level was
markedly increased in the CAKI-1 cell line. However, SQSTM1 was
markedly decreased when the CAKI-1 cell line was transfected with
siPSME2#1 or siPSME2#2. Similar results were found in the 786-O
cell line. Subsequently, the mRNA expression level of tumor factors
associated with immune cells was analyzed using RT-qPCR. IL-6 and
TNF-α mRNA expression levels were notably higher in the 786-O and
CAKI-1 cell lines transfected siPSME2 compared with that in the
siNC groups. On the contrary, CXCL9, CXCL10 and BLys mRNA
expression levels were markedly decreased following transfection
with siPSME2 (Fig. 6B). The cells
transfected with siPSME2 were then treated with bafilomycin A1
(Baf-A1; an inhibitor of the autophagy) to inhibit autophagy
activation. The results of the Transwell assay revealed that
invasiveness was increased (Fig.
6C). TEM was used to analyze the autophagosomes, to visualize
the effect of siPSME2 on autophagy in the cancer cells.
Autophagosomes were characterized by the vacuole-like structure of
the bilayer-containing organelles in the cytoplasm. As shown in
Fig. 6D, there were a few
autophagosomes found in the control cells; however, they were
abundant within the cytoplasm of the PSME2-knockout cells. These
results indicated that PSME2 induced autophagy.
Effect of overexpression or knockdown of
BNIP3 on autophagy and the expression level of tumor cytokines
To investigate the role of BNIP3 in the CAKI-1 cell
line and the regulation of autophagy and tumor cytokines, a plasmid
vector that overexpressed BNIP3 was constructed and its
transfection efficiency was analyzed (Fig. S1). The protein expression levels
of BNIP3, PSME2, LC3-I/II and SQSTM1, at 12, 24 and 48 h after
transfection and the mRNA expression levels of IL-6, TNF-α, CXCL9,
CXCL10 and BLys were determined using western blot analysis and
RT-qPCR, respectively. As shown in Fig. 7A, overexpression of BNIP3 caused
LC3-I to LC3-II conversion and a decrease in SQSTM1 protein
expression levels in a time-dependent manner. However, there was no
significant difference in the protein expression level of PSME2.
There were no noticeable changes in the mRNA expression levels for
all the tumor cytokines following the overexpression of BNIP3
(Fig. 7B). To visualize
autophagy, LC3 was detected following transfection with GFP-tagged
proteins. Overexpression of BNIP3 induced a marked increase in the
number of structures labeled by the autophagy marker, as shown in
Fig. 7C. Similarly,
overexpression of BNIP3 led to an increase in the number of
autophagosomes in a time-dependent manner (Fig. 7D). Taken together, the data
suggested that BNIP3 affected autophagy, but had no effect on the
mRNA expression level of the tumor cytokines. The Transwell
invasion experiments confirmed that knocking down BNIP3 promoted
cell invasion, while low PSME2 expression inhibited cell invasion.
With inhibition of these two proteins simultaneously, cell invasion
was lower compared with that in the control group (Fig. 7E). Western blot analysis confirmed
that BNIP3 knockdown suppressed autophagy-related protein
expression level and inhibition of PSME2 expression promoted the
expression of autophagy-related proteins. Nevertheless, suppressing
both proteins, the autophagy inhibited by BNIP3 was restored, as
shown in Fig. 7F.
Discussion
Renal cancer is one of the ten most challenging
cancer types to diagnose and treat (49). Nearly 90% of kidney tumors are RCC
and 80% of cases are ccRCC, making it the most dominant
pathological subtype of RCC (50,51). Surgery is still the most effective
treatment for local ccRCC; however, 30-35% of patients undergoing
surgery will exhibit distant metastasis (50). The prognosis of ccRCC remains
unsatisfactory, with a 5-year survival rate of 23% for advanced
ccRCC, particularly for locally advanced and metastatic ccRCC
(52). Therefore, it is important
to investigate a biomarker, which is effective for the treatment
and prognosis of ccRCC.
In previous studies, it was found that the role of
PSME in tumors has been poorly reported, particularly in ccRCC. The
present study described the discovery of aberrant PSME2 mRNA
expression in human ccRCC tissues. PSME2 was upregulated in KIRC
tissues using TCGA and Oncomine databases, suggesting that
overexpression of PSME2 may promote ccRCC. Analysis of DSS, OS and
PFS times demonstrated that high PSME2 expression level was
predictive of poor perceived prognosis in patients with ccRCC.
WGCNA was also used to determine co-expression networks of groups
of genes from large expression data and four distinct co-expression
modules were identified. The brown module was positively associated
with the tumor tissue among the four modules. Furthermore, signal
enrichment analysis of the differential genes in the brown module
was used to identify GO terms and KEGG and pathways. The GO
analysis results revealed the differentially expressed genes were
enriched with 'anion transmembrane transporter activity',
'extracellular matrix structural constituent', 'apical part of the
cell', 'collagen containing extracellular matrix', 'response to
nutrient levels', 'extracellular structure organization', and
'macroautophagy'. These pathways were associated with tumorigenesis
and development. The KEGG pathway analysis showed that these
differential genes were associated with 'autophagy', 'complement
and coagulation cascades', 'rheumatoid arthritis', 'protein
digestion', 'viral protein interaction', 'Staphylococcus
aureus infection', 'cytokine and cytokine receptor', 'IL-17
signaling pathway', and 'pertussis'. GSEA showed that PSME2 was
associated with the TNF signaling pathway, cytokine-cytokine
receptor interaction, autophagy-animal and the NF-κB signaling
pathway in ccRCC. Using a comprehensive analysis of the association
between WGCNA and GSEA, the findings indicated that the expression
levels of the PSME2 in ccRCC may be involved in cytokine and
cytokine receptor interaction and autophagy in the tumor
tissue.
Next, the results from bioinformatics analysis were
verified. The PSME2 protein expression level was highly expressed
in ccRCC tissue, as confirmed using IHC staining and western blot
analysis. A previous study reported that PSME2 was a biomarker of
tumor invasion and metastasis (30). The cellular experiments then
demonstrated that knockdown of PSME2 reduced the invasion of the
ccRCC cell lines, but had no effect on cell proliferation.
Subsequently, the molecular mechanisms associated with
PSME2-induced invasiveness and metastasis of ccRCC were
investigated, combined with bioinformatics analysis. Autophagy and
tumor cytokine expression levels were investigated in the renal
cancer cell lines transfected with or without PSME2-specific siRNA.
LC3 is vital for the dynamic process of autophagosome formation.
The characteristic signature of autophagic membranes is the
conversion of LC3-I into LC3-II (53,54). In addition, detecting LC3 using
immunofluorescence has become a widely accepted method for
identifying autophagy (55).
Knockdown of PSME2 resulted in LC3-I conversion to LC3-II, which is
located on pre-autophagosomes and autophagosomes, making it an
autophagy marker (56).
Inhibiting PSME2 can promote the formation of autophagosomes.
Similarly, more autophagosomes, with GFP-LC3 fluorescence, were
found in the siPSME2 group compared with that in the control
group.
BNIP3 is a transmembrane protein, primarily located
in the outer membrane of mitochondria. It competes with beclin-1 to
bind to BCL2, releasing beclin-1 and inducing autophagy (57,58). It was found that the knockdown of
PSME2 increased BNIP3 protein expression levels in the 786-O and
CAKI-1 cell lines. This indicated that inhibiting PSME2 promoted
autophagy. SQSTM1 is a scaffold protein in autophagosomes (59) and a stress-inducible protein
(60), with multiple domains that
mediate its communications with different binding molecules,
including a TNF-associated receptor-6 binding domain (61), a Phox1 and Bem1p domain (62), a ZZ-type zinc finger domain, a
Keap1-interacting domain, an LC3-interacting domain, and an
ubiquitin-associated domain (60,63,64). SQSTM1 is a principle selective
autophagy receptor and an important protein in the autophagic
clearance of polyubiquitinated proteins (65,66). SQSTM1 binds to the ubiquitinated
protein in the autophagosome and fuses with the lysosome to form
the autophagosome to be cleared. Likewise, decreased expression of
SQSTM1 indicated inhibition of PSME2-induced autophagy. Taken
together, we hypothesized that renal cancer cells enhance invasion
and inhibit autophagy by overexpressing PSME2.
IL-6 is a tumor cytokine associated with mortality.
High mRNA expression levels of IL-6 were associated with decreased
survival time in patients with ccRCC (67,68). TNF-α is a core adjustor of a
complex cytokine network, which not only mediates the
pro-inflammatory response, but also regulates the interaction
between cells, cell differentiation and cell death (69). A high amount of evidence has
indicated that TNF-α has tumor promoting activity (70-73). CXCL9 and CXCL10 are IFN-inducible
CXCR3 ligands, and key regulators in recruiting T cells to the
tumor microenvironment. It has been reported that patients with
ccRCC and a high expression level of CXCL9 and CXCL10 have poor
survival times, and are more likely to have early recurrence
(74,75).
BLys is a member of the TNF superfamily of ligands
and is constitutively expressed on the cell membrane of
macrophages, monocytes, activated T cells, dendritic cells,
neutrophils, and antigen-presenting cells (76). High BLys protein expression in
malignant tumors, including B-cell non-multiple myeloma, Hodgkin's
lymphoma, Hodgkin's lymphoma and chronic lympho-cytic leukemia, has
been reported (77,78). It is note-worthy that IL6 and
TNF-α expression levels were increased, but CXCL9/10 and BLys were
significantly decreased in ccRCC cell lines transfected with PSME2
siRNA compared with that in the NC siRNA group. However, when BNIP3
was overexpressed, the mRNA expression levels of the five cytokines
did not change. It was found that reduced PSME2 expression augments
the mRNA expression level of inflammatory factors (IL-6 and TNF-α)
and attenuates CXCL9/10 and BLys associated with the tumor
microenvironment.
In summary, the findings from the present study
demonstrated that PSME2 was upregulated in ccRCC tissues compared
with that in normal tissues. This overexpression was not associated
with cell proliferation, while it may be associated with cell
invasion, autophagy and the tumor microenvironment. The expression
of BNIP3 was found via the use of siPSME2 and the effect of
BNIP3overexpression on PSME2 was also found. In addition, the
preliminary function of PSME2 in ccRCC was identified using rescue
and knockdown experiments. To the best of our knowledge, the
present study is the first report the potential significance and
function of PSME2 in ccRCC. Future investigations into the
molecular mechanism of ccRCC should concentrate on PSME2 and the
tumor microenvironment of ccRCC. A limitation to the current study
was that only an association between PSME2 and ccRCC was found,
additional experiments are required to validate the results. The
results provide further information on the effect of PSME2 and the
aggressiveness of tumor cells via cytokine and immune cells in
ccRCC. In addition, PSME2 could be considered as a biomarker and
therapeutic target for ccRCC.
Supplementary Data
Availability of data and materials
The datasets used and/or analyzed in the current
study are available from the corresponding author upon reasonable
request.
Authors' contributions
XW, FW, GH, XL designed the research and wrote the
manuscript. XW, YD, JC, YZ preformed the bioinformatics analysis
and cell experiments. XW and GH analyzed the data and confirmed the
authenticity of all the raw data generated during the study. XW,
FW, GH and XL contributed to the critical reading and correction of
the manuscript. All authors have read and approved the final
manuscript.
Ethics approval and consent to
participate
Ethics committee approval was obtained from the
Institutional Ethics Committee of West China Hospital of Sichuan
University (approval no. 2021211A) to the commencement of the study
laid down in the 1964 Declaration of Helsinki. Written informed
consent was provided by all the participants.
Patient consent for publication
Not applicable.
Competing interests
The authors declare that they have no competing
interests.
Acknowledgments
Not applicable.
Funding
This study was supported by grants from the National Natural
Science Foundation of China (grant no. 21772131) and the
Fundamental Research Funds for the Science and Technology
Department of Sichuan Province (grant nos. 2019YFSY0004 and
2019YFS0298).
References
|
1
|
Ahn K, Erlander M, Leturcq D, Peterson PA,
Früh K and Yang Y: In vivo characterization of the proteasome
regulator PA28. J Biol Chem. 271:18237–18242. 1996. View Article : Google Scholar : PubMed/NCBI
|
|
2
|
Coux O, Tanaka K and Goldberg AL:
Structure and functions of the 20S and 26S proteasomes. Annu Rev
Biochem. 65:801–847. 1996. View Article : Google Scholar
|
|
3
|
Ma CP, Willy PJ, Slaughter CA and
DeMartino GN: PA28, an activator of the 20 S proteasome, is
inactivated by proteolytic modification at its carboxyl terminus. J
Biol Chem. 268:22514–22519. 1993. View Article : Google Scholar
|
|
4
|
Kuroda K and Liu H: The proteasome
inhibitor, bortezomib, induces prostate cancer cell death by
suppressing the expression of prostate-specific membrane antigen,
as well as androgen receptor. Int J Oncol. 54:1357–1366.
2019.PubMed/NCBI
|
|
5
|
Rechsteiner M and Hill CP: Mobilizing the
proteolytic machine: Cell biological roles of proteasome activators
and inhibitors. Trends Cell Biol. 15:27–33. 2005. View Article : Google Scholar : PubMed/NCBI
|
|
6
|
Song X, von Kampen J, Slaughter CA and
DeMartino GN: Relative functions of the alpha and beta subunits of
the proteasome activator, PA28. J Biol Chem. 272:27994–28000. 1997.
View Article : Google Scholar : PubMed/NCBI
|
|
7
|
Wang YF, Yu M, te Pas MFW, Yerle M, Liu B,
Fan B, Xiong TA and Li K: Sequence characterization, polymorphism
and chromosomal localizations of the porcine PSME1 and PSME2 genes.
Anim Genet. 35:361–366. 2004. View Article : Google Scholar : PubMed/NCBI
|
|
8
|
McCusker D, Wilson M and Trowsdale J:
Organization of the genes encoding the human proteasome activators
PA28alpha and beta. Immunogenetics. 49:438–445. 1999. View Article : Google Scholar : PubMed/NCBI
|
|
9
|
Zaiss DMW and Kloetzel PM: A second gene
encoding the mouse proteasome activator PA28beta subunit is part of
a LINE1 element and is driven by a LINE1 promoter. J Mol Biol.
287:829–835. 1999. View Article : Google Scholar : PubMed/NCBI
|
|
10
|
Kuehn L and Dahlmann B: Structural and
functional properties of proteasome activator PA28. Mol Biol Rep.
24:89–93. 1997. View Article : Google Scholar : PubMed/NCBI
|
|
11
|
Demartino GN and Gillette TG: Proteasomes:
Machines for all reasons. Cell. 129:659–662. 2007. View Article : Google Scholar : PubMed/NCBI
|
|
12
|
Lee J, An S, Jung JH, Kim K, Kim JY, An IS
and Bae S: MUL1 E3 ligase regulates the antitumor effects of
metformin in chemoresistant ovarian cancer cells via AKT
degradation. Int J Oncol. 54:1833–1842. 2019.PubMed/NCBI
|
|
13
|
Kandil E, Kohda K, Ishibashi T, Tanaka K
and Kasahara M: PA28 subunits of the mouse proteasome: Primary
structures and chromosomal localization of the genes.
Immunogenetics. 46:337–344. 1997. View Article : Google Scholar : PubMed/NCBI
|
|
14
|
Wang Q, Pan F, Li S, Huang R, Wang X, Wang
S, Liao X, Li D and Zhang L: The prognostic value of the proteasome
activator subunit gene family in skin cutaneous melanoma. J Cancer.
10:2205–2219. 2019. View Article : Google Scholar : PubMed/NCBI
|
|
15
|
Feng J, Xiao T, Lu SS, Hung XP, Yi H, He
QY, Huang W, Tang YY and Xiao ZQ: ANXA1 derived peptides suppress
gastric and colon cancer cell growth by targeting EphA2
degradation. Int J Oncol. 57:1203–1213. 2020.PubMed/NCBI
|
|
16
|
Wójcik C, Tanaka K, Paweletz N, Naab U and
Wilk S: Proteasome activator (PA28) subunits, alpha, beta and gamma
(Ki antigen) in NT2 neuronal precursor cells and HeLa S3 cells. Eur
J Cell Biol. 77:151–160. 1998. View Article : Google Scholar : PubMed/NCBI
|
|
17
|
Khor B, Bredemeyer AL, Huang CY, Turnbull
IR, Evans R, Maggi LB Jr, White JM, Walker LM, Carnes K, Hess RA,
et al: Proteasome activator PA200 is required for normal
spermatogenesis. Mol Cell Biol. 26:2999–3007. 2006. View Article : Google Scholar : PubMed/NCBI
|
|
18
|
Noda C, Tanahashi N, Shimbara N, Hendil KB
and Tanaka K: Tissue distribution of constitutive proteasomes,
immunoproteasomes, and PA28 in rats. Biochem Biophys Res Commun.
277:348–354. 2000. View Article : Google Scholar : PubMed/NCBI
|
|
19
|
Huang L, Haratake K, Miyahara H and Chiba
T: Proteasome activators, PA28 gamma and PA200, play indispensable
roles in male fertility. Sci Rep. 6:92016.
|
|
20
|
Kaymaz Y, Oduor CI, Yu H, Otieno JA,
Ong'echa JM, Moormann AM and Bailey JA: Comprehensive Transcriptome
and Mutational Profiling of Endemic Burkitt Lymphoma Reveals EBV
Type-Specific Differences. Mol Cancer Res. 15:563–576. 2017.
View Article : Google Scholar :
|
|
21
|
Tanahashi N, Yokota K, Ahn JY, Chung CH,
Fujiwara T, Takahashi E, DeMartino GN, Slaughter CA, Toyonaga T,
Yamamura K, et al: Molecular properties of the proteasome activator
PA28 family proteins and gamma-interferon regulation. Genes Cells.
2:195–211. 1997. View Article : Google Scholar : PubMed/NCBI
|
|
22
|
Minor MM, Hollinger FB, McNees AL, Jung
SY, Jain A, Hyser JM, Bissig KD and Slagle BL: Hepatitis B Virus
HBx Protein Mediates the Degradation of Host Restriction Factors
through the Cullin 4 DDB1 E3 Ubiquitin Ligase Complex. Cells.
9:92020. View Article : Google Scholar
|
|
23
|
Li J, Powell SR and Wang X: Enhancement of
proteasome function by PA28α overexpression protects against
oxidative stress. FASEB J. 25:883–893. 2011. View Article : Google Scholar :
|
|
24
|
Grune T, Catalgol B, Licht A, Ermak G,
Pickering AM, Ngo JK and Davies KJ: HSP70 mediates dissociation and
reassociation of the 26S proteasome during adaptation to oxidative
stress. Free Radic Biol Med. 51:1355–1364. 2011. View Article : Google Scholar : PubMed/NCBI
|
|
25
|
Adelöf J, Andersson M, Porritt M, Petersen
A, Zetterberg M, Wiseman J and Hernebring M: PA28αβ overexpression
enhances learning and memory of female mice without inducing 20S
proteasome activity. BMC Neurosci. 19:702018. View Article : Google Scholar
|
|
26
|
Miyagi T, Tatsumi T, Takehara T, Kanto T,
Kuzushita N, Sugimoto Y, Jinushi M, Kasahara A, Sasaki Y, Hori M,
et al: Impaired expression of proteasome subunits and human
leukocyte antigens class I in human colon cancer cells. J
Gastroenterol Hepatol. 18:32–40. 2003. View Article : Google Scholar
|
|
27
|
Cerruti F, Martano M, Petterino C, Bollo
E, Morello E, Bruno R, Buracco P and Cascio P: Enhanced expression
of interferon-gamma-induced antigen-processing machinery components
in a spontaneously occurring cancer. Neoplasia. 9:960–969. 2007.
View Article : Google Scholar : PubMed/NCBI
|
|
28
|
Ebert MPA, Krüger S, Fogeron ML, Lamer S,
Chen J, Pross M, Schulz HU, Lage H, Heim S, Roessner A, et al:
Overexpression of cathepsin B in gastric cancer identified by
proteome analysis. Proteomics. 5:1693–1704. 2005. View Article : Google Scholar
|
|
29
|
Perroud B, Lee J, Valkova N, Dhirapong A,
Lin PY, Fiehn O, Kültz D and Weiss RH: Pathway analysis of kidney
cancer using proteomics and metabolic profiling. Mol Cancer.
5:642006. View Article : Google Scholar : PubMed/NCBI
|
|
30
|
Milioli HH, Santos Sousa K, Kaviski R, Dos
Santos Oliveira NC, De Andrade Urban C, De Lima RS, Cavalli IJ and
De Souza Fonseca Ribeiro EM: Comparative proteomics of primary
breast carcinomas and lymph node metastases outlining markers of
tumor invasion. Cancer Genomics Proteomics. 12:89–101. 2015.
|
|
31
|
Huang Q, Huang Q, Chen W, Wang L, Lin W,
Lin J and Lin X: Identification of transgelin as a potential novel
biomarker for gastric adenocarcinoma based on proteomics
technology. J Cancer Res Clin Oncol. 134:1219–1227. 2008.
View Article : Google Scholar : PubMed/NCBI
|
|
32
|
Huang Q, Huang Q, Lin W, Lin J and Lin X:
Potential roles for PA28beta in gastric adenocarcinoma development
and diagnosis. J Cancer Res Clin Oncol. 136:1275–1282. 2010.
View Article : Google Scholar : PubMed/NCBI
|
|
33
|
Zheng D-L, Huang Q-L, Zhou F, Huang Q-J,
Lin J-Y and Lin X: PA28β regulates cell invasion of gastric cancer
via modulating the expression of chloride intracellular channel 1.
J Cell Biochem. 113:1537–1546. 2012.
|
|
34
|
Kim JE, Koo KH, Kim YH, Sohn J and Park
YG: Identification of potential lung cancer biomarkers using an in
vitro carcinogenesis model. Exp Mol Med. 40:709–720. 2008.
View Article : Google Scholar
|
|
35
|
Chen JY, Xu L, Fang WM, Han JY, Wang K and
Zhu KS: Identification of PA28β as a potential novel biomarker in
human esophageal squamous cell carcinoma. Tumour Biol.
39:10104283177197802017.
|
|
36
|
Rhodes DR, Yu J, Shanker K, Deshpande N,
Varambally R, Ghosh D, Barrette T, Pandey A and Chinnaiyan AM:
ONCOMINE: A cancer microarray database and integrated data-mining
platform. Neoplasia. 6:1–6. 2004. View Article : Google Scholar : PubMed/NCBI
|
|
37
|
Langfelder P and Horvath S: WGCNA: An R
package for weighted correlation network analysis. BMC
Bioinformatics. 9:5592008. View Article : Google Scholar : PubMed/NCBI
|
|
38
|
Langfelder P and Horvath S: Eigengene
networks for studying the relationships between co-expression
modules. BMC Syst Biol. 1:542007. View Article : Google Scholar : PubMed/NCBI
|
|
39
|
Huang W, Sherman BT and Lempicki RA:
Systematic and integrative analysis of large gene lists using DAVID
bioinformatics resources. Nat Protoc. 4:44–57. 2009. View Article : Google Scholar
|
|
40
|
Huang W, Sherman BT and Lempicki RA:
Bioinformatics enrichment tools: Paths toward the comprehensive
functional analysis of large gene lists. Nucleic Acids Res.
37:1–13. 2009. View Article : Google Scholar :
|
|
41
|
Azhar RA, de Castro Abreu AL, Broxham E,
Sherrod A, Ma Y, Cai J, Gill TS, Desai M and Gill IS: Histological
analysis of the kidney tumor-parenchyma interface. J Urol.
193:415–422. 2015. View Article : Google Scholar
|
|
42
|
Moch H, Artibani W, Delahunt B, Ficarra V,
Knuechel R, Montorsi F, Patard JJ, Stief CG, Sulser T and Wild PJ:
Reassessing the current UICC/AJCC TNM staging for renal cell
carcinoma. Eur Urol. 56:636–643. 2009. View Article : Google Scholar : PubMed/NCBI
|
|
43
|
Margulis V, McDonald M, Tamboli P, Swanson
DA and Wood CG: Predictors of oncological outcome after resection
of locally recurrent renal cell carcinoma. J Urol. 181:2044–2051.
2009. View Article : Google Scholar : PubMed/NCBI
|
|
44
|
Kuang P, Deng H, Liu H, Cui H, Fang J, Zuo
Z, Deng J, Li Y, Wang X and Zhao L: Sodium fluoride induces
splenocyte autophagy via the mammalian targets of rapamycin (mTOR)
signaling pathway in growing mice. Aging (Albany NY). 10:1649–1665.
2018. View Article : Google Scholar
|
|
45
|
Livak KJ and Schmittgen TD: Analysis of
relative gene expression data using real-time quantitative PCR and
the 2(-Delta Delta C(T)) Method. Methods. 25:402–408. 2001.
View Article : Google Scholar
|
|
46
|
Jones J, Otu H, Spentzos D, Kolia S, Inan
M, Beecken WD, Fellbaum C, Gu X, Joseph M, Pantuck AJ, et al: Gene
signatures of progression and metastasis in renal cell cancer. Clin
Cancer Res. 11:5730–5739. 2005. View Article : Google Scholar : PubMed/NCBI
|
|
47
|
Yusenko MV, Kuiper RP, Boethe T, Ljungberg
B, van Kessel AG and Kovacs G: High-resolution DNA copy number and
gene expression analyses distinguish chromophobe renal cell
carcinomas and renal oncocytomas. BMC Cancer. 9:1522009. View Article : Google Scholar : PubMed/NCBI
|
|
48
|
Yusenko MV, Zubakov D and Kovacs G: Gene
expression profiling of chromophobe renal cell carcinomas and renal
oncocytomas by Affymetrix GeneChip using pooled and individual
tumours. Int J Biol Sci. 5:517–527. 2009. View Article : Google Scholar : PubMed/NCBI
|
|
49
|
Zhu WK, Xu WH, Wang J, Huang YQ,
Abudurexiti M, Qu YY, Zhu YP, Zhang HL and Ye DW: Decreased SPTLC1
expression predicts worse outcomes in ccRCC patients. J Cell
Biochem. 121:1552–1562. 2020. View Article : Google Scholar
|
|
50
|
Hu J, Chen Z, Bao L, Zhou L, Hou Y, Liu L,
Xiong M, Zhang Y, Wang B, Tao Z, et al: Single-Cell Transcriptome
Analysis Reveals Intratumoral Heterogeneity in ccRCC, which Results
in Different Clinical Outcomes. Mol Ther. 28:1658–1672. 2020.
View Article : Google Scholar : PubMed/NCBI
|
|
51
|
Reustle A, Di Marco M, Meyerhoff C, Nelde
A, Walz JS, Winter S, Kandabarau S, Büttner F, Haag M, Backert L,
et al: Integrative -omics and HLA-ligandomics analysis to identify
novel drug targets for ccRCC immunotherapy. Genome Med. 12:322020.
View Article : Google Scholar :
|
|
52
|
Wan B, Liu B, Huang Y and Lv C:
Identification of genes of prognostic value in the ccRCC
microenvironment from TCGA database. Mol Genet Genomic Med.
8:e11592020. View Article : Google Scholar :
|
|
53
|
Dikic I and Elazar Z: Mechanism and
medical implications of mammalian autophagy. Nat Rev Mol Cell Biol.
19:349–364. 2018. View Article : Google Scholar
|
|
54
|
Tanida I, Ueno T and Kominami E: LC3
conjugation system in mammalian autophagy. Int J Biochem Cell Biol.
36:2503–2518. 2004. View Article : Google Scholar : PubMed/NCBI
|
|
55
|
Tanida I, Ueno T and Kominami E: LC3 and
Autophagy. Methods Mol Biol. 445:77–88. 2008. View Article : Google Scholar
|
|
56
|
Kabeya Y, Mizushima N, Ueno T, Yamamoto A,
Kirisako T, Noda T, Kominami E, Ohsumi Y and Yoshimori T: LC3, a
mammalian homologue of yeast Apg8p, is localized in autophagosome
membranes after processing. EMBO J. 19:5720–5728. 2000. View Article : Google Scholar : PubMed/NCBI
|
|
57
|
Li L, Tan J, Miao Y, Lei P and Zhang Q:
ROS and Autophagy: Interactions and Molecular Regulatory
Mechanisms. Cell Mol Neurobiol. 35:615–621. 2015. View Article : Google Scholar
|
|
58
|
Zhang J, Zhang C, Jiang X, Li L, Zhang D,
Tang D, Yan T, Zhang Q, Yuan H, Jia J, et al: Involvement of
autophagy in hypoxia-BNIP3 signaling to promote epidermal
keratinocyte migration. Cell Death Dis. 10:2342019. View Article : Google Scholar : PubMed/NCBI
|
|
59
|
Christian F, Krause E, Houslay MD and
Baillie GS: PKA phosphorylation of p62/SQSTM1 regulates PB1 domain
interaction partner binding. Biochim Biophys Acta. 1843:2765–2774.
2014. View Article : Google Scholar
|
|
60
|
Katsuragi Y, Ichimura Y and Komatsu M:
p62/SQSTM1 functions as a signaling hub and an autophagy adaptor.
FEBS J. 282:4672–4678. 2015. View Article : Google Scholar : PubMed/NCBI
|
|
61
|
Wooten MW, Geetha T, Seibenhener ML, Babu
JR, Diaz-Meco MT and Moscat J: The p62 scaffold regulates nerve
growth factor-induced NF-kappaB activation by influencing TRAF6
polyubiquitination. J Biol Chem. 280:35625–35629. 2005. View Article : Google Scholar : PubMed/NCBI
|
|
62
|
Lamark T, Perander M, Outzen H,
Kristiansen K, Øvervatn A, Michaelsen E, Bjørkøy G and Johansen T:
Interaction codes within the family of mammalian Phox and Bem1p
domain-containing proteins. J Biol Chem. 278:34568–34581. 2003.
View Article : Google Scholar : PubMed/NCBI
|
|
63
|
Lin X, Li S, Zhao Y, Ma X, Zhang K, He X
and Wang Z: Interaction domains of p62: A bridge between p62 and
selective autophagy. DNA Cell Biol. 32:220–227. 2013. View Article : Google Scholar
|
|
64
|
Islam MA, Sooro MA and Zhang P: Autophagic
Regulation of p62 is Critical for Cancer Therapy. Int J Mol Sci.
19:152018. View Article : Google Scholar
|
|
65
|
Johansen T and Lamark T: Selective
autophagy mediated by autophagic adapter proteins. Autophagy.
7:279–296. 2011. View Article : Google Scholar
|
|
66
|
Zhang Y, Mun SR, Linares JF, Towers CG,
Thorburn A, Diaz-Meco MT, Kwon YT and Kutateladze TG: Mechanistic
insight into the regulation of SQSTM1/p62. Autophagy. 15:735–737.
2019. View Article : Google Scholar : PubMed/NCBI
|
|
67
|
Kays JK, Koniaris LG, Cooper CA, Pili R,
Jiang G, Liu Y and Zimmers TA: The Combination of Low Skeletal
Muscle Mass and High Tumor Interleukin-6 Associates with Decreased
Survival in Clear Cell Renal Cell Carcinoma. Cancers (Basel).
12:122020. View Article : Google Scholar
|
|
68
|
Liu T, Xia Q, Zhang H, Wang Z, Yang W, Gu
X, Hou T, Chen Y, Pei X, Zhu G, et al: CCL5-dependent mast cell
infiltration into the tumor microenvironment in clear cell renal
cell carcinoma patients. Aging (Albany NY). 12:21809–21836. 2020.
View Article : Google Scholar
|
|
69
|
Xu WH, Shi SN, Xu Y, Wang J, Wang HK, Cao
DL, Shi GH, Qu YY, Zhang HL and Ye DW: Prognostic implications of
Aquaporin 9 expression in clear cell renal cell carcinoma. J Transl
Med. 17:3632019. View Article : Google Scholar : PubMed/NCBI
|
|
70
|
Mikami S, Mizuno R, Kosaka T, Saya H, Oya
M and Okada Y: Expression of TNF-α and CD44 is implicated in poor
prognosis, cancer cell invasion, metastasis and resistance to the
sunitinib treatment in clear cell renal cell carcinomas. Int J
Cancer. 136:1504–1514. 2015. View Article : Google Scholar
|
|
71
|
Leibovich SJ, Polverini PJ, Shepard HM,
Wiseman DM, Shively V and Nuseir N: Macrophage-induced angiogenesis
is mediated by tumour necrosis factor-alpha. Nature. 329:630–632.
1987. View Article : Google Scholar : PubMed/NCBI
|
|
72
|
Michalaki V, Syrigos K, Charles P and
Waxman J: Serum levels of IL-6 and TNF-alpha correlate with
clinicopathological features and patient survival in patients with
prostate cancer. Br J Cancer. 90:2312–2316. 2004. View Article : Google Scholar
|
|
73
|
Balkwill F: Tumour necrosis factor and
cancer. Nat Rev Cancer. 9:361–371. 2009. View Article : Google Scholar
|
|
74
|
Liu W, Liu Y, Fu Q, Zhou L, Chang Y, Xu L,
Zhang W and Xu J: Elevated expression of IFN-inducible CXCR3
ligands predicts poor prognosis in patients with non-metastatic
clear-cell renal cell carcinoma. Oncotarget. 7:13976–13983. 2016.
View Article : Google Scholar
|
|
75
|
Choueiri TK, Atkins MB, Rose TL, Alter RS,
Ju Y, Niland K, Wang Y, Arbeit R, Parasuraman S, Gan L, et al: A
phase 1b trial of the CXCR4 inhibitor mavorixafor and nivolumab in
advanced renal cell carcinoma patients with no prior response to
nivolumab monotherapy. Invest New Drugs. 39:1019–1027. 2021.
View Article : Google Scholar : PubMed/NCBI
|
|
76
|
Jiang P, Yueguo W, Huiming H, Hongxiang Y,
Mei W and Ju S: B-Lymphocyte stimulator: A new biomarker for
multiple myeloma. Eur J Haematol. 82:267–276. 2009. View Article : Google Scholar : PubMed/NCBI
|
|
77
|
Nardelli B, Moore PA, Li Y and Hilbert DM:
B lymphocyte stimulator (BLyS): A therapeutic trichotomy for the
treatment of B lymphocyte diseases. Leuk Lymphoma. 43:1367–1373.
2002. View Article : Google Scholar : PubMed/NCBI
|
|
78
|
Shivakumar L and Ansell S: Targeting
B-lymphocyte stimulator/B-cell activating factor and a
proliferation-inducing ligand in hematologic malignancies. Clin
Lymphoma Myeloma. 7:106–108. 2006. View Article : Google Scholar : PubMed/NCBI
|