Introduction
Prostate cancer (PCa) is one of the most prevalent
urological malignancies, with the second-highest rate of
cancer-associated mortality among the male population in Western
countries (1). Over the past
decade, with the rapid growth of an aging population in China, the
incidence, morbidity pattern and mortality rates of PCa have all
been increasing on an annual basis. Notably, the majority of
patients with PCa develop incurable disease due to advanced
regional disease and/or distant metastasis (2).
Cancer cells exhibit the ability to survive and
proliferate even under unfavourable conditions, such as
nutrient-poor environments (3).
Previous reports have demonstrated that energy metabolism
reprogramming, which potentiates cell proliferation by adjusting
energy metabolism, is an emerging hallmark of cancer (4,5).
In particular, metabolic reprogramming towards glutamine (Gln) and
cell-dependent Gln metabolic activity have both been found to be
increased in a variety of cancers and this is a common metabolic
alteration in cancers, where the importance of Gln as a nutrient is
considered second only to glucose (5). Gln is one of the most abundant free
amino acids and can regulate ATP production, macromolecular
synthesis and signal transmission in cancer cells by donating its
nitrogen and carbon atoms (6). In
general, Gln is imported into the cell through specific
transporters, such as solute carrier family 1 member 5 (SLC1A5;
also known as ASCT2). Gln metabolism begins with its conversion to
glutamate (Glu), in a process catalysed by glutaminase (GLS), with
type I glutaminase (GLS1) as the dominant isoform expressed in
humans (7,8). Additional studies have revealed a
close relationship between Gln metabolism and PCa, such that Gln
has been proposed to be a potential marker for the diagnosis or
treatment of PCa (9-12).
Hepatocellular cell adhesion molecule (HepaCAM) is a
novel type of immunoglobulin (Ig) cell adhesion molecule that has
shown tumour suppressor-like characteristics and was first isolated
from the human liver (13). Under
physiological conditions, HepaCAM is expressed at high levels in
normal tissues and cells (14).
However, the expression of HepaCAM was previously found to be
downregulated or even lost in several tumour tissues and cells,
including PCa (13-15). In addition, HepaCAM expression has
been negatively associated with the proliferation, invasion and the
Warburg effect in malignancies of the urinary system, including
bladder cancer and renal cell carcinoma (16-19). Overexpression of HepaCAM has also
been found to inhibit the proliferation and invasion of PCa cells
(20), However, the possible
regulatory mechanism of HepaCAM in regards to Gln metabolism in PCa
remains poorly understood.
Previous reports have found the PI3K signalling
pathway to be one of the most frequently dysregulated pathways in
cancer (21-24).
Phosphatidylinositol-4,5-bisphosphate 3-kinase catalytic subunit α
(PIK3CA) is one of the most common oncogenes which encodes the
p110α catalytic subunit of PI3K (25). PIK3CA can be constitutively
activated by two main different mechanisms, namely activating
mutation and amplification (26).
Accumulating evidence has revealed that PIK3CA is associated with
Gln metabolism reprogramming in numerous types of cancers (27-30). Consequently, PIK3CA may also be a
key regulatory target for reprogramming Gln metabolism in PCa.
The present study explored the possible role of
HepaCAM in Gln metabolism in PCa, in addition to attempting the
identification of the potential relationship between HepaCAM and
PIK3CA expression. It was hypothesized that the overexpression of
HepaCAM can inhibit Gln metabolism reprogramming and PCa cell
proliferation by regulating PIK3CA.
Materials and methods
Bioinformatics analysis
A total of 19 PCa datasets (source link: https://www.cbioportal.org/study/summary?id=prad_mich%2Cprad_su2c_2019%2Cprad_su2c_2015%2Cprad_mcspc_mskcc_2020%2Cprad_broad_2013%2Cprad_broad%2Cprad_cpcg_2017%2Cprad_cdk12_mskcc_2020%2Cprad_mskcc%2Cprad_p1000%2Cprad_eururol_2017%2Cprad_tcga_pan_can_atlas_2018%2Cprad_mskcc_cheny1_organoids_2014%2Cprad_mskcc_2017%2Cprad_msk_2019%2Cprad_tcga_pub%2Cprad_tcga%2Cprostate_dkfz_2018%2Cmpcproject_broad_2021),
including T he Cancer Genome At la s, T CGA (https://www.cancer.gov/about-nci/organization/ccg/research/structural-genomics/tcga)
were downloaded from the cBioPortal (https://www.cbioportal.org). In total, 7 datasets had
HepaCAM structural variation, mutation or copy number variation
(CNA) data, with 2,093 cases (94.19%) belonging to PCa. In
addition, 19 datasets had PIK3CA structural variation, mutation or
CNA data, including 6,671 (95.5%) cases of PCa (including
castration-resistant PCa and prostate neuroendocrine carcinoma) and
324 cases (4.5%) of a normal group (N). The present study was
conducted in accordanc with the Declaration of Helsinki (as revised
in 2013).
Blood and tissue samples
Between 2016 and 2018, tissue specimens were
collected from 17 patients (age range, 53-86 years; mean age, 70)
with benign prostatic hyperplasia (BPH) and 44 patients (age range,
55-91 years; mean age, 71) with PCa. In addition, blood specimens
were collected from 43 individuals containing normal samples and 66
patients with PCa from 2018 to 2019. All patients were recruited
from the Department of Urology, The First Affiliated Hospital of
Chongqing Medical University (Chongqing China). All samples were
verified by a pathologist, who histologically diagnosed the samples
as either BPH or PCa. The present study was approved by the Ethics
Committee of Chongqing University. All patients provided written
informed consent prior to specimen acquisition.
Immunohistochemistry
All samples involved in the experiment, including
human PCa and BPH specimens, were cut into paraffin sections.
Detection of HepaCAM and PIK3CA expression in PCa and BPH tissue
samples was performed using the IHC staining procedure as described
previously (31). The primary
antibodies used were as follows: anti-HepaCAM (cat. no. MAB4108;
1:150; ProteinTech Group, Inc.) and anti-PIK3CA (cat. no. 4249T;
1:200; Cell Signaling Technology, Inc.). Tissues underwent fixation
with 4% paraformaldehyde, were embedded in paraffin and then
subjected to standard dewaxing and rehydration. The sections were
incubated in citric acid buffer (pH 6.0) for 15 min for antigen
retrieval, followed by incubation for 10 min with 3%
H2O2 solution to inactivate endogenous
enzymatic activity. The sections were then incubated with
anti-HepaCAM antibody and anti-PIK3CA antibody for 1 h at 25°C
followed by Elivision Plus Polyer HRP (mouse/rabbit)
immunohistochemistry kit (cat. no. KIT-9903; 1:1,000; Maxim
Biotech, Inc.) for 30 min at 20°C. The results of HepaCAM and
PIK3CA expression in PCa and BPH tissue samples was analysed
according to a previously described procedure (31).
Cell culture and treatment
Prostate cell lines PC3 (cat. no. ZQ0041), LNCaP
(cat. no. ZQ0039) and RWPE-1 (cat. no. ZQ0351) were obtained from
Shanghai ZhongQiao XinZhou Biotechnology Co., Ltd. RWPE-1 cells
were cultured with Keratinocyte-SFM medium (cat. no. 10744-019;
Gibco; Thermo Fisher Scientific, Inc.), whereas cancer cell lines
PC3 and LNCaP cells were cultured with RPMI-1640 media (Gibco;
Thermo Fisher Scientific, Inc.) supplemented with 10% FBS (Gibco;
Thermo Fisher Scientific, Inc.) and 100 U/ml
penicillin/streptomycin (Beyotime Institute of Biotechnology). All
cells were cultured in a 37°C incubator containing 5%
CO2 and 1% O2 with 45-65% humidity.
Adenoviruses encoding HepaCAM (Ad-HepaCAM) were stored at -80°C and
amplified in 293A cells. The viral fluid was obtained after the
repeated freezing and thawing of the 293A cells. The prostate
cancer cells were transfected with either Ad-HepaCAM or Ad-GFP,
respectively. Cells (1×10⁵/well) were seeded into 6-well
plates and incubated with 2 ml complete medium for 12 h, before
being transfected with adenoviruses and/or alpelisib (8 µM,
24 h; MedChemExpress, USA). After 24 or 72 h of incubation,
subsequent experiments were performed.
Gln deprivation experiments
After the cells had completely attached to the
culture dish, the RPMI-1640 medium was removed and PC3 and LNCaP
cells were washed once with PBS. Gln-free medium was prepared using
RPMI-1640 devoid of Gln (cat. no. A14431; Thermo Fisher Scientific,
Inc.) but other nutrients were retained at the same concentrations
as those in the standard complete RPMI-1640 media. Complete
RPMI-1640 medium was prepared by supplementing with 2 mM L-Gln
(Beijing Solarbio Science & Technology Co., Ltd.). All media
were supplemented with 10% dialyzed FBS (Gemini Bio Products) and
100 U/ml penicillin/streptomycin. All cells were cultured in a 37°C
incubator containing 5% CO2 and 1% O2 with
45-65% humidity. The incubation time depended on the experimental
requirements (24-72 h).
Reverse transcription-quantitative
polymerase chain reaction (RT-qPCR)
RNA was extracted from RWPE-1, PC3 and LNCaP cells
using TRIzol (Thermo Fisher Scientific, Inc.), and PrimeScript RT
reagent kits (Takara Bio, Inc.) were used to reverse transcribe the
RNA. Real-time PCR was performed with the SYBR Premix Ex Taq™ II
kit (cat. no. RR820A; TaKaRa, Inc.). Notably, β-actin was used as
the standard reference. The thermocycling conditions for qPCR were
as follows: initial denaturation at 95°C for 3 min; followed by 40
cycles of 95°C for 10 sec, 60°C for 20 sec and 72°C for 20 sec; and
final extension at 72°C for 5 min. The comparative
2−ΔΔCq method was used to calculate the relative
expression level of mRNA (32).
Each experiment was repeated ≥3 times. The primer sequences (5′-3′)
used were as follows: HepaCAM forward, TGT ACA GCT GCA TGG
TGG AGA and reverse, TCT GGT TTC AGG CGG TCA TCA; PIK3CA
forward, CCAC GAC CAT CAT CAG GTG AA and reverse, CCT CAC GGA GGC
ATT CTA AAG T; GLS forward, TAC TGA GCC CTG AAG C and
reverse, TCC AGA GGA GGA GAC C; SLC1A5 forward, GAG CTG CTT
ATC CGC TTC TTC and reverse, GGG GCG TAC CAC ATG ATC C; Cyclin
D1 forward, GCT GGA GCC CGT GAA AAA GA and reverse, CTC CGC CTC
TGG CAT TTT G; proliferating cell nuclear antigen (PCNA)
forward, TCA AGA AGG TGT TGG AGG CA and reverse, CAG CGG TAG GTG
TCG AAG C and β-actin forward, TGA CGT GGA CAT CCG CAA AG
and reverse, CTG GAAG GTG GAC AGC GAG G.
Western blotting
Total proteins were extracted by RIPA buffer (cat.
no. 9806; Cell Signaling Technology, Inc.) containing the protease
inhibitor phenyl methane sulfonyl fluoride and phosphatase
inhibitors (33,34). Nuclear and plasma proteins were
extracted using the nuclear and cytoplasmic protein extraction
reagent (Beyotime Institute of Biotechnology). The BCA kit
(Beyotime Institute of Biotechnology) was used to measure protein
concentration. SDS-PAGE (10% gel) was used for protein separation
(50 µg). The following antibodies were used: anti-HepaCAM
(cat. no. 18177-1-AP; 1:1,000; ProteinTech Group, Inc.),
anti-PIK3CA (cat. no. 4249T; 1:1,000; Cell Signaling Technology,
Inc.), anti-AKT1 (cat. no. abs131788; 1:1,000; Absin Bioscience,
Inc.), anti-phosphorylated (p-)AKT1 (Ser473; cat. no. abs130002;
1:1,000; Absin Bioscience, Inc.), anti-p-AKT1 (Thr308; cat. no.
abs130889; 1:1,000; Absin Bioscience, Inc.), anti-GLS1 (cat. no.
56750; 1:1,000, Cell Signaling Technology, Inc.), anti-SLC1A5 (cat.
no. 20350-1-AP; 1:3,000; ProteinTech Group, Inc.), anti-cyclin D1
(cat. no. 55506; 1:500, Cell Signaling Technology, Inc.), anti-PCNA
(cat. no. 13110; 1:500; Cell Signaling Technology, Inc.),
anti-β-actin (cat. no. 20536-1-AP, 1:5,000; ProteinTech Group,
Inc.), and HRP-conjugated anti-rabbit-IgGκ binding protein
secondary antibody (cat. no. ab205718; 1:5,000; Abcam). Enhanced
Chemiluminescence Detection Kit was utilized for the visualization
of protein bands (Suzhou New Saimei Biotechnology Co., Ltd.).
Cell Counting Kit-8 (CCK-8) assay
PC3 and LNCaP cells (3×10³/well) were
first cultured in 96-well plates overnight before being
transfected/treated with Ad-HepaCAM/-Gln/alpelisib or control.
After 0, 24, 48 or 72 h, 10 µl CCK-8 reagent (cat. no.
354550 Shanghai Univ Biotechnology Co., Ltd.) was added and
incubated for 1-4 h at 37°C. Finally, absorbance in each well was
measured at 450 nm. A total of four wells were used for each
treatment group per experiment.
Colony formation assay
PC3 and LNCaP cells (500/well) following blank
treatment and administration of Ad-GFP or Ad-HepaCAM were added
into 6-well plates and cultured in a 37°C incubator containing 5%
CO2 and 1% O2 with 45-65% humidity. for 7-14
days. The cells were then fixed with methanol for 2 min and stained
with 0.5% crystal violet for 10 min at room temperature and
photographed for cell counting. The images of each well were
scanned using an Epson scanner GT-X970 (Seiko Epson Corp.), and the
colonies were counted using ImageJ 1.52v software (National
Institutes of Health). Each treatment group used three wells per
experiment and each experiment was repeated three times
independently.
Flow cytometry
PC3 and LNCaP cells were transferred into 6-well
plates overnight and transfected/treated with Ad-HepaCAM or
alpelisib. After 72 h, the cells were washed two to three times
with PBS, before being digested using 0.25% trypsin, washed twice
again with PBS and transferred into Eppendorf tubes. The cells were
counted and 1×10⁶ cells were resuspended with 100
µl PBS before 500 µl cooled 75% ethanol was added
after centrifugation. Cell cycle distribution was detected using
the CytoFLEX Flow Cytometer (Beckman Coulter, Inc.) and the results
were analysed using ModFitLT 5 software (Verity Software House,
Inc.).
Immunofluorescence
PC3 and LNCaP cells (3×10⁴) were cultured
on coverslips in 24-well plates following administration of
Ad-HepaCAM or/and alpelisib, and then the cells were incubated for
72 h. The cells were then fixed with 4% paraformaldehyde, 0.1-1%
Triton X-100 and 5% goat blocking serum in sequence as previously
described (35). Primary
anti-bodies against anti-Ki67 (cat. no. ab197234; 1:100, Abcam),
secondary antibodies and 4,6-diamidino-2-pheny-lindole (Zhongshan
Golden Bridge Biotechnology, Ltd.; OriGene Technologies, Inc.) were
used for incubation with the cells. Fluorescence images were
captured using a confocal laser scanning microscope (Nikon Corp.)
at ×400 magnification. The Ki-67-positive index was analysed by
Image J (v4.6.2, National Institutes of Health).
Liquid chromatography-tandem mass
spectrometry (LC-MS/MS) and gas chromatography-mass spectrometry
(GC-MS) assay
The trypsin-digested PC3 and LNCaP cells
(>1×10⁷) from the different treatment groups were
collected, before the supernatant was discarded after
centrifugation. Cells were washed three times with PBS before being
fully disrupted using a sonicator (16,000 × g). Finally, pre-cooled
methanol was added for fixation. After fixation, the lysed cells
were suspended on a dried blood spot (DBS) to be sufficiently
saturated. Fresh blood samples from different patients were
collected, prepared in a DBS format on a filter paper and stored at
4°C. MS/MS analysis was achieved using a QTRAP triple quadrupole
mass spectrometer (AB SCIEX 3200; AB SCIEX, USA) coupled to a LC
system (Shimadziu 20ADXR; Shimadziu).
Approximately 20 µl of working solution was
directly injected for analysis without prior chromatographic
separation. A mixed liquor (acetonitrile:H2O=1:1)
containing 0.05% FA was used as the mobile phase. The mass
spectrometer was equipped with an electrospray ionization (ESI) and
operated in the positive ion mode to monitor the m/z transitions
for all peptides and IS. For each peptide, two multiple reaction
monitorings (MRMs) were simultaneously monitored. A scheduled MRM
acquisition method was constructed using manually optimized
declustering potentials (DP), collision energies (CE), collision
cell entrance (CEP) and exit potentials (CXP). All chromatograms
were analysed with Analyst 1.5 software (AB SCIEX, USA) using
internal standards, and the peak-area ratios were applied for
further calculations (36).
Xenograft model in vivo
A total of 10 male nude mice (4 weeks of age; body
weight, 10-15 g) were purchased from the Shanghai SLAC Laboratory
Animal Co., Ltd. All rats were housed at 23-25°C with 50-60%
humidity, 12-h light/dark cycle and food and water ad
libitum. The present study was performed in accordance with the
Animal Research Advisory Committee (ARAC) Guidelines (https://oacu.oir.nih.gov/animal-research-advisory-committee-guidelines)
and was approved by the Ethics Committee of Chongqing Medical
University (Chongqing, China). A prostate cancer xenograft model
was established by the subcutaneous injection of LNCaP cells into
the right flank of 10 mice (5×10⁶ cell per mouse). These
nude mice were then randomly divided into a dosing group and
control group. Alpelisib was dissolved in 0.5% sodium carboxyl
methyl cellulose (CMC-NA). Alpelisib (12.5 mg/kg) was administered
daily through an oral gavage for 5 consecutive days, and then 1 day
off and the above process was repeated once. The same amount of
0.5% CMC-NA was given by intragastric administration to the control
group. Tumour size was assessed every day. After 4 weeks, the 10
mice were sacrificed by CO2 euthanasia. The criteria for
determining the end point of this animal experiment were as
follows: i) the animal was dying or unable to move, or had no
response after giving gentle stimulation; ii) difficulty breathing,
with typical symptoms being salivation and/or cyanosis in the mouth
and nose; iii) diarrhea or urinary incontinence; iv) the body
weight was reduced by 20% of the body weight during the experiment;
v) inability to eat or drink; vi) the animal was showing clear
signs of anxiety, irritability; vii) the weight of the tumour
reached >10% of the animal's own body weight; viii) animal skin
damage area accounted for >30% of the whole body; and ix) or
infection and suppuration occurred. CO2 euthanasia was
performed using a CO2 delivery system according to the
ARAC guide (https://oir.nih.gov/sourcebook/committees-advisory-ddir/animal-research-advisory-committee-arac)
for the experimental procedure. The mouse was first placed in the
box full of air before the box was filled with a volume of 2 liters
CO2 to a volume of 10 liters at a constant rate (the
volume displacement rate of CO2 was 60% vol/min). Each
mouse was checked for the lack of breathing and constriction of
pupil size. After the breathing halted, the CO2 flow was
maintained for 1 min and the mouse was removed from the euthanasia
box. Death was verified by the cessation of heartbeat and
breathing, in addition to the reflexes disappearing. Tumour tissues
were then isolated for comparing the size and weight before IHC
experiments were performed. Tumour volume was calculated using the
formula V=π/6 × L × W, where V was the volume and L was the length
and W was the width. The maximum volume and the maximum diameter of
a single tumour presented in the present study were 764.5
mm3 and 12.1 mm, respectively.
Statistical analysis
SPSS (version 24.0; IBM Corp.) and GraphPad Prism
(version 5; GraphPad Software, Inc.) were used for statistical
analysis. Data are presented as the mean ± SD. All experiments were
repeated at least three times. Comparisons between two groups,
other than comparisons between tumour and adjacent non-tumour
samples, were analysed using the unpaired Student's t-test. A
paired Student's t-test was used to compare HepaCAM and PIK3CA
expression levels between tumour and adjacent non-tumour samples.
Survival curves were assessed using log-rank tests. Comparisons
among multiple groups were analysed using one-way ANOVA followed by
Tukey's post hoc test. The χ2 test was used to analyse
the relationship between HepaCAM and PIK3CA expression or the
concentration of Gln/Glu and each of the clinical parameters. The
correlation between HepaCAM and PIK3CA expression in the tissue
samples was evaluated using Spearman's rank correlation
coefficient. P<0.05 was considered to indicate a statistically
significant difference.
Results
Bioinformatics prediction of the
correlation among HepaCAM, PIK3CA and Gln metabolism in clinical
and genomic datasets
In a preliminary experiment, a correlation between
the expression of HepaCAM and GLS was found in PCa cells, but the
possibility of direct action was ruled out. The selection of PIK3CA
for the present study was based on preliminary bioinformatics
analysis, where protein interaction analysis in the STRING protein
database found a possibility of protein interaction between HepaCAM
and PIK3CA. In addition, previous studies have found that the
overexpression of HepaCAM was able to inhibit the expression of
c-Myc (37,38), which is an important regulatory
target of SLC1A5 (39). Under
these premises, the correlation among these components
aforementioned was assessed through bioinformatics analysis.
Comparative analysis of the different datasets in the cBioportal
database revealed little to no HepaCAM expression in the majority
of cancer types tested (Fig. 1A).
Furthermore, the main alteration in PIK3CA expression in PCa was
found to be amplification (Fig.
1B), while mutation was the major form of alteration in other
solid tumours (40,41). Additionally, the co-expression
analysis of genes in the databases found that the mRNA expression
levels of HepaCAM exhibited a negative correlation with
those of PIK3CA and components associated with Gln
metabolism, GLS and SLC1A5 (P<0.05; Fig. 1C-E). Survival analyses of the
datasets found that the patients whose samples possessed lower
expression levels of HepaCAM displayed poorer overall survival
(P<0.01; Fig. 1F), whereas the
survival trend for PIK3CA expression was opposite (P<0.05;
Fig. 1G).
Abnormal levels of Gln in blood samples
and PCa cell lines
Blood samples were collected from 66 patients with
PCa and 43 normal individuals for the detection of amino acid
concentrations by LC-MS/MS and GC-MS testing. Among the 15 common
amino acids detected, only the levels of Gln and arginine (Arg) in
the blood samples of patients with PCa were significantly lower
compared with those in the samples from the normal individuals
(P<0.05; Fig. 2A; Table I). In addition, the concentration
of Gln exhibited the most striking difference among all other amino
acids tested, where the main metabolic flow was towards the
synthesis of glutamic acid (P<0.001; Fig. 2A and B; Table I).
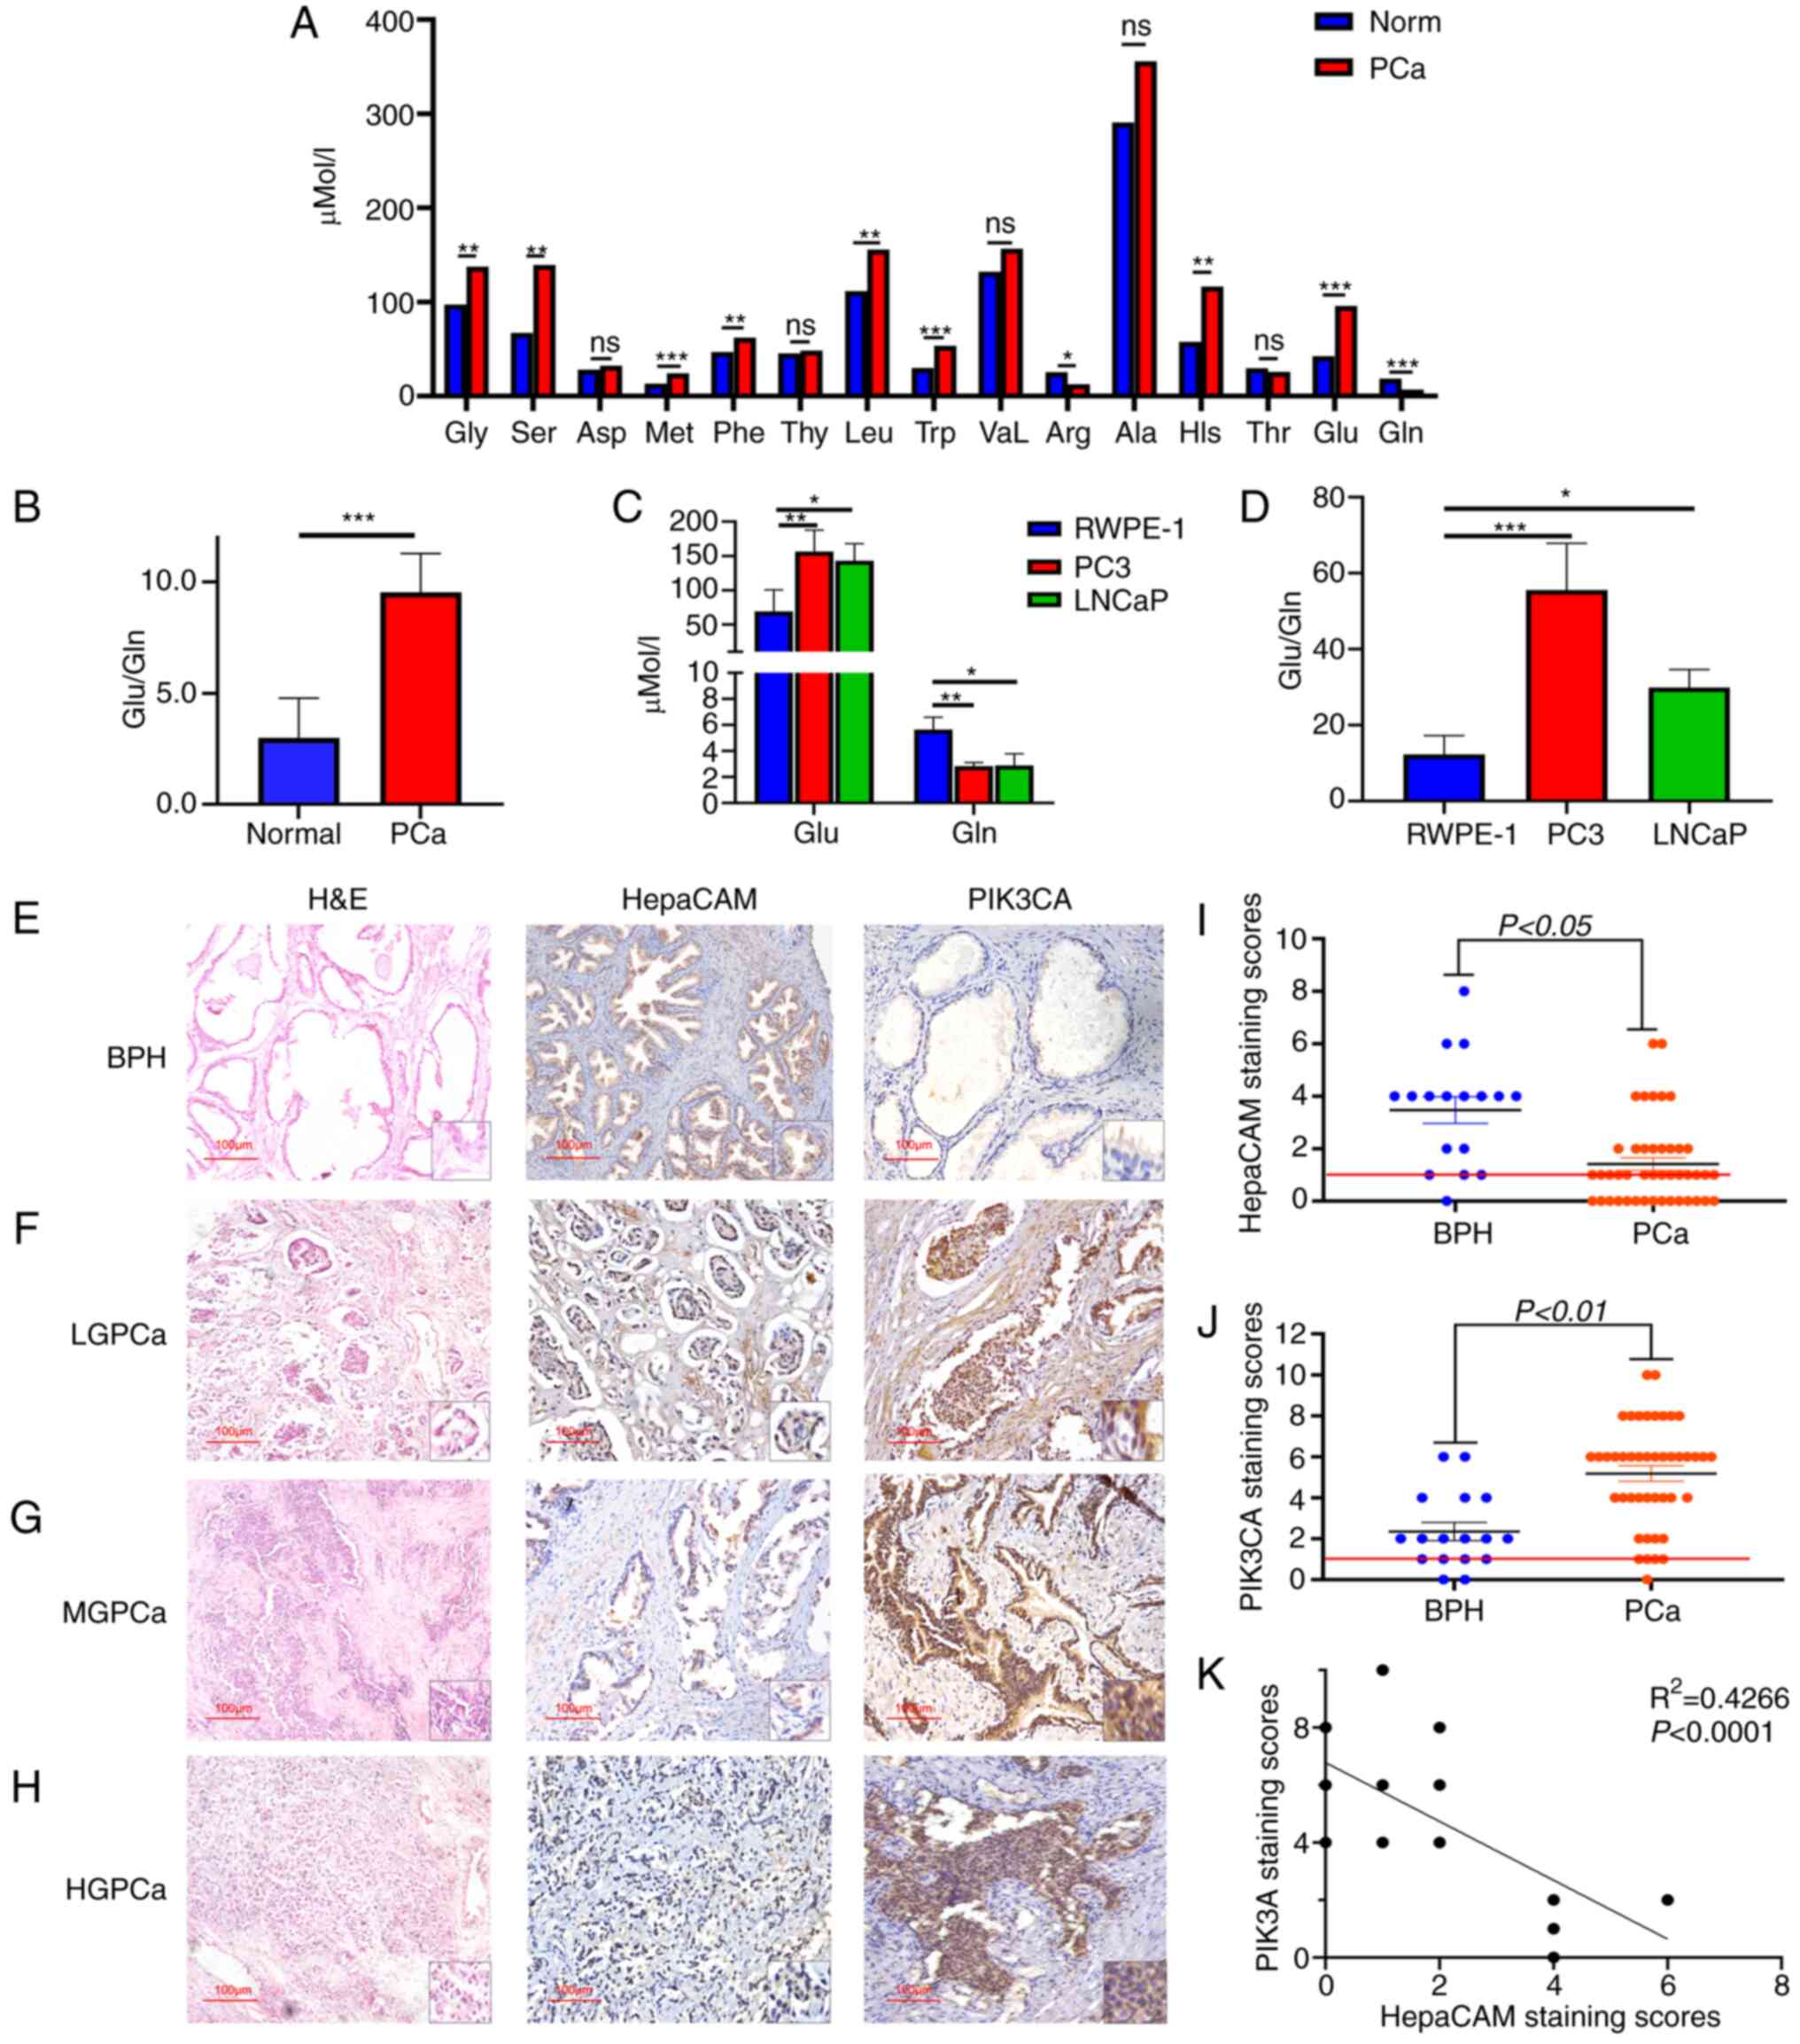 | Figure 2The significant difference in
glutamine (Gln)/glutamate (Glu) levels in blood specimens or cells
and HepaCAM and PIK3CA expression in tissues specimen. (A) Multiple
common amino acid concentrations in different blood samples tested
by mass spectrometry and analysed by Mann-Whitney test.
*P<0.05, **P<0.01,
***P<0.001; ns, not significant comparing PCa vs.
normal (Norm) specimens. (B) Comparison of the ratio of Glu to Gln
between PCa and normal samples. ***P<0.001 vs. normal
specimens. (C and D) Difference in the concentration of Glu and Gln
between prostate cancer cell lines PC3 and LNCaP and normal
epithelial RWPE-1 cells. *P<0.05,
**P<0.01, ***P<0.001. (E-H)
Representative hematoxylin and eosin (H&E) staining and IHC
staining for HepaCAM and PIK3CA in PCa and BPH samples,
Magnification, ×200. (I and J) Staining scores of HepaCAM and
PIK3CA expression in BPH and PCa tissues. (K) Correlation analysis
between HepaCAM and PIK3CA in tissues as analysed by Spearman's
correlation analysis. Glu, glutamate; Gln, glutamine; LGPCa,
low-grade PCa; MGPCa, middle-grade PCa; HGPCa, high-grade PCa; BPH,
benign prostatic hyperplasia; PCa, prostate cancer; HepaCAM,
hepatocellular cell adhesion molecule; PIK3CA,
phosphatidylinositol-4,5-bisphosphate 3-kinase catalytic subunit
α. |
 | Table IGlutamine/glutamate concentrations
and clinicopathological parameters of the PCa patients. |
Table I
Glutamine/glutamate concentrations
and clinicopathological parameters of the PCa patients.
|
Characteristics | No. of specimens
(%) | Glutamine (Gln)
(µmol/l)
| Glutamate (Glu)
(µmol/l)
|
|---|
| Median=9.766 | Median=66.613 |
|---|
|
|---|
| <9.766 | ≥9.766 | P-value | <66.613 | ≥66.613 | P-value |
|---|
| Histology | | | | | | | |
| Normal | 43 | 0 | 43 | 0.001 | 41 | 2 | 0.001 |
| PCa | 66 | 47 (71) | 19 (29) | | 13 (20) | 53 (80) | |
| Age (years) | | | | | | | |
| <60 | 9 (14) | 4 (6) | 5 (8) | 0.056 | 1 (2) | 8 (12) | 0.486 |
| ≥60 | 57 (86) | 43 (65) | 14 (21) | | 12 (18) | 45 (68) | |
| PSA
(µg/l) | | | | | | | |
| Median=20.67 | | | | | | | |
| <20.67 | 31 (47) | 25 (38) | 6 (9) | 0.233 | 4 (6) | 27 (41) | 0.192 |
| ≥20.67 | 35 (53) | 22 (33) | 13 (20) | | 9 (14) | 26 (39) | |
| Gleason score of
PCa | | | | | | | |
| ≤6 | 19 (29) | 10 (15) | 9 (14) | | 5 (8) | 14 (21) | |
| 7 | 23 (35) | 15 (23) | 8 (12) | 0.014 | 4 (6) | 19 (29) | 0.690 |
| ≥8 | 24 (36) | 22 (33) | 2 (3) | | 4 (6) | 20 (30) | |
On a cellular level, the Gln levels in RWPE-1 cells
was significantly higher compared with that in LNCaP and PC3 cells
(P<0.01; Fig. 2C), where the
metabolic flux was also biased towards synthesizing Glu
(P<0.001; Fig. 2D).
Additionally, high levels of Gln in PCa were found to be
significantly associated with the Gleason score (Table I). These results suggest that
metabolic changes in Gln occurred in patients with PCa, which
indicated the potential clinical significance of using Gln as a
marker for clinical PCa screening.
High negative correlation between HepaCAM
and PIK3CA expression in clinical PCa samples
The expression levels of HepaCAM and PIK3CA in 17
BPH and 44 PCa tissue samples were measured using IHC staining. The
results showed that the positive expression rate of HepaCAM reached
34.09% (15/44) among the PCa samples, compared with 76.47% (13/17)
in the BPH samples (Fig. 2I). In
addition, the positive expression rate of PIK3CA was 86.36% (38/44)
in PCa compared with 64.71% (11/17) in the BPH samples (Fig. 2J). Subsequently, HepaCAM and
PIK3CA expression were found to be significantly correlated with
the Gleason grade (Fig. 2E-H;
Table II). Semi-quantitative
staining scores revealed significantly decreased HepaCAM expression
(P<0.05; Fig. 2I) and
significantly increased PIK3CA expression (P<0.01; Fig. 2J) in the PCa tissues compared with
those in the BPH tissues. Spearman's correlation analysis
calculated that the expression of HepaCAM was negatively correlated
with that of PIK3CA (P<0.0001; Fig. 2K).
| Table IIHepaCAM and PIK3CA in PCa tissues and
clinicopathological parameters. |
Table II
HepaCAM and PIK3CA in PCa tissues and
clinicopathological parameters.
|
Characteristics | No. of specimens
(%) | HepaCAM staining
| PIK3CA staining
|
|---|
| Positive | Negative | P-value | Positive | Negative | P-value |
|---|
| Total | 44 (100) | 15 (34) | 29 (66) | | 38 (86) | 6 (14) | |
| Age (year) | | | | | | | |
| <60 | 16 (36) | 7 (16) | 4 (20) | 0.307 | 13 (29) | 3 (7) | 0.052 |
| ≥60 | 28 (64) | 8 (18) | 20 (46) | | 25 (57) | 3 (7) | |
| Histological
stage | | | | | | | |
| Ta-T2 | 29 (66) | 10 (23) | 19 (43) | 0.939 | 27 (61) | 2 (5) | 0.07 |
| T3-T4 | 15 (34) | 5 (11) | 10 (23) | | 11 (25) | 4 (9) | |
| Gleason score | | | | | | | |
| <6 | 10 (23) | 8 (18) | 2 (5) | | 6 (14) | 4 (9) | |
| 7 | 16 (36) | 7 (16) | 9 (20) | 0.001 | 15 (34) | 1 (2) | 0.022 |
| ≥8 | 18 (41) | 0 (0) | 18 (41) | | 17 (38) | 1 (3) | |
Overexpression of HepaCAM inhibits the
expression of PIK3CA in PCa cells
The expression of HepaCAM and PIK3CA in normal
prostate epithelial cells (RWPE-1) compared with PCa cell lines PC3
and LNCaP were next compared in vitro. As shown in Fig. 3A and B, both mRNA and protein
expression levels of HepaCAM in the cancer cell lines were
significantly lower compared with those in the RWPE-1 cells, while
the expression levels of PIK3CA were significantly higher in the
cancer cell lines (P<0.05). To ultimately establish the role of
HepaCAM in Gln metabolism and proliferation in the PCa cells,
Ad-HepaCAM was first transfected into the PC3 and LNCaP cells. The
results revealed significantly increased expression levels of
HepaCAM in the PC3 and LNCaP cells in the Ad-HepaCAM group compared
with those in the Ad-GFP group at both the mRNA and protein levels
(P<0.001; Fig. 3C-E). In
addition, the expression of PIK3CA in both PC3 and LNCaP cells was
significantly downregulated by the overexpression of HepaCAM
(P<0.01; Fig. 3C-E).
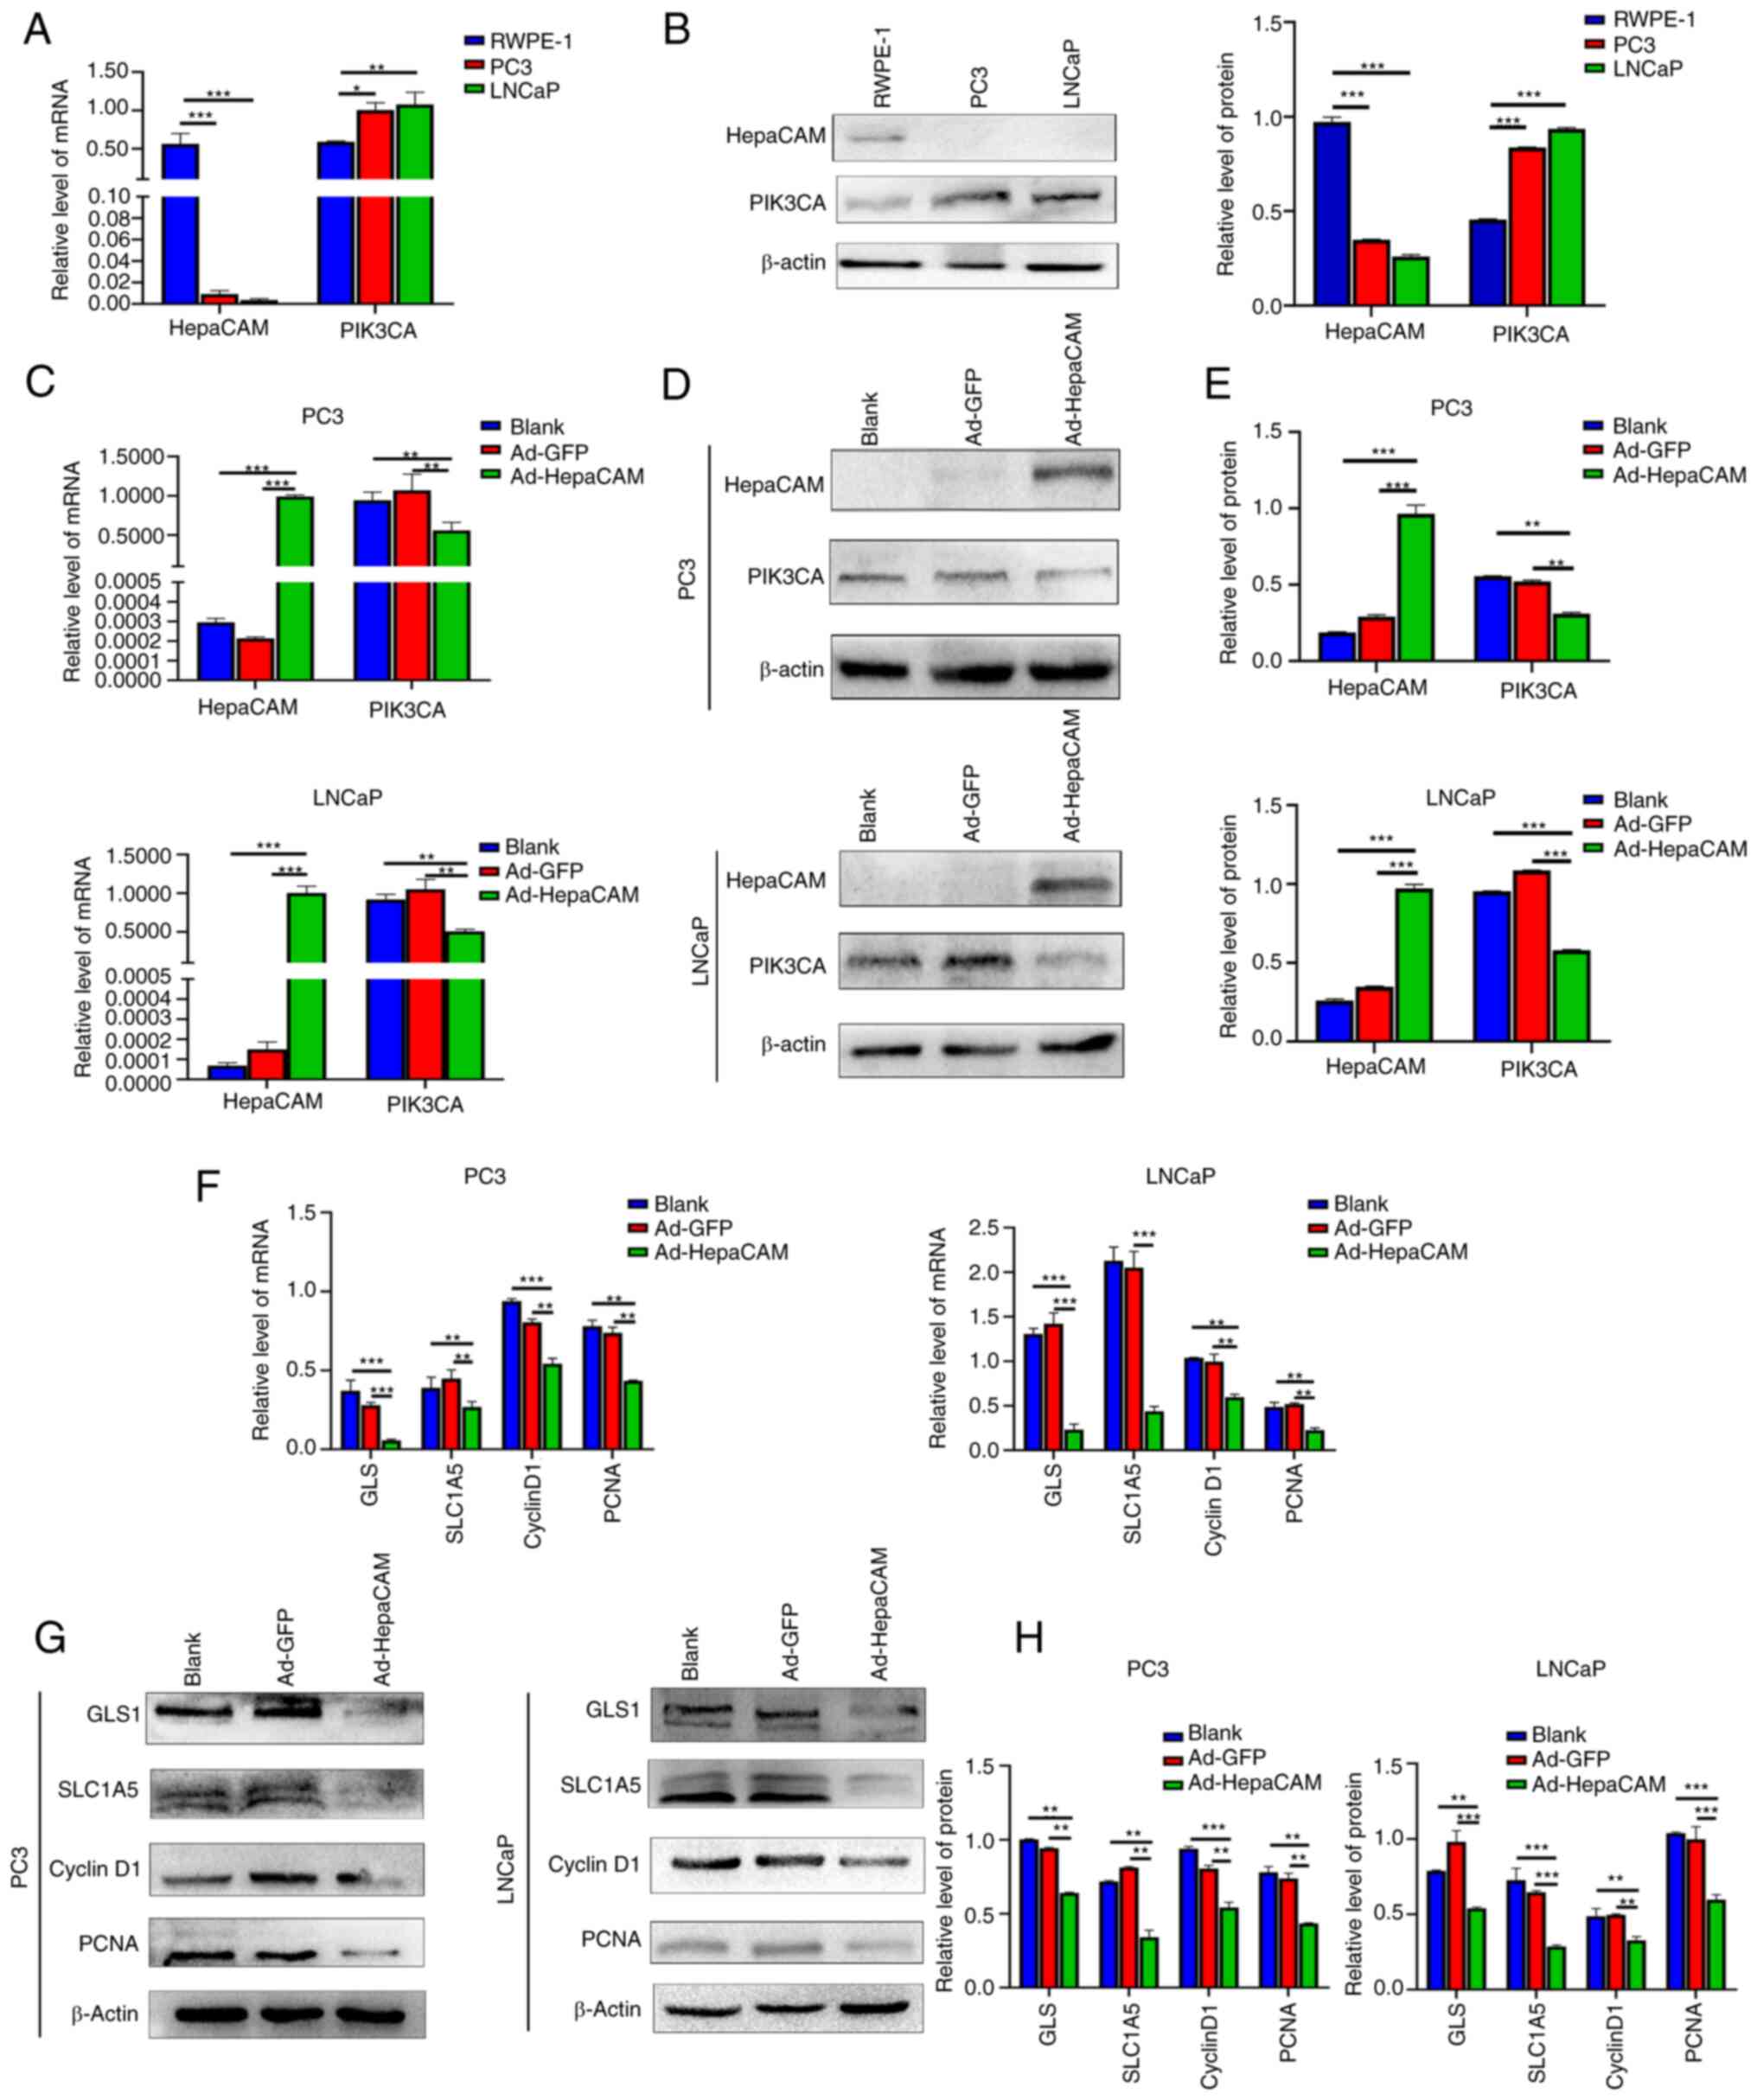 | Figure 3Overexpression of HepaCAM inhibits
the expression of PIK3CA and glutamine metabolism or proliferation
related molecules in PCa. (A and B) Expression of HepaCAM and
PIK3CA in RWPE-1, PC3 and LNCaP cells was detected by (A) RT-qPCR
and (B) western blot analysis. *P<0.05,
**P<0.01, and ***P<0.001 compared with
the RWPE-1 cells. (C-E) Overexpression of HepaCAM adenovirus and
corresponding changes in PIK3CA at the (C) mRNA and (D and E)
protein levels was verified in PC3 and LNCaP cells. (F-H) mRNA and
protein levels of GLS, SLC1A5, cyclin D1 and PCNA in cells were
detected by qPCR and western blot analysis after infection with
adenoviral Ad-HepaCAM. β-actin was used as internal controls. Data
are represented as mean ± SD of 3 individual experiments.
**P<0.01 and ***P<0.001 vs. blank
control. HepaCAM, hepatocellular cell adhesion molecule; PIK3CA,
phosphatidylinositol-4,5-bisphosphate 3-kinase catalytic subunit α;
GLS, glutaminase; SLC1A5, solute carrier family 1 member 5; PCNA,
proliferating cell nuclear antigen. |
Overexpression of HepaCAM inhibits Gln
metabolism reprogramming and proliferation in PCa cells
Subsequently, the present study next investigated
whether overexpression of HepaCAM can mediate an impact on Gln
metabolism reprogramming and PCa cell proliferation. The results
revealed that compared with that in the blank and Ad-GFP groups,
the expression in PC3 and LNCaP cells of Gln metabolism components
GLS and SLC1A5 in addition to cyclin D1 and PCNA, proteins
associated with proliferation, were significantly reduced in the
Ad-HepaCAM group at the mRNA and protein levels (P<0.05;
Fig. 3F-H). Consistently, the
results showed that the overexpression of HepaCAM also
significantly inhibited the proliferation of PCa cells according to
colony formation and CCK-8 assays compared with those in the Ad-GFP
group (P<0.05; Fig. 4A-C). MS
analysis in PCa cells revealed that Gln (Fig. 4D) levels in the Ad-HepaCAM group
were higher compared with those in the Ad-GFP group, while the
levels of Glu were lower (Fig.
4E), rendering the ratio of Glu/Gln to be lower as a result of
the overexpression of HepaCAM (Fig.
4F). This suggest that Gln metabolism reprogramming was
inhibited. These results suggest that HepaCAM overexpression can
inhibit Gln metabolism reprogramming and proliferation in PCa
cells.
Stress resistance by Gln metabolism can
be reversed by HepaCAM overexpression
Despite the clear inhibitory effects on cell
proliferation incurred by limited Gln levels, cancer cells have the
capacity to adapt to the conditions to promote survival and sustain
proliferative functions (42).
Measuring the expression of enzymes associated with metabolism
revealed that the expression of PIK3CA, GLS and SLC1A5 were
significantly upregulated immediately after Gln deprivation for 24
h (P<0.05; Fig. 5A). Next, to
explore the effects of HepaCAM on this positive response to
nutrient starvation in PCa cells, particularly to Gln depletion,
Ad-HepaCAM transfection was combined with Gln deprivation for 24 h
alongside the corresponding control groups. RT-qPCR and western
blotting analyses found that the overexpression of HepaCAM could
reverse the upregulation of PIK3CA, GLS and SLC1A5 expression after
Gln deprivation. Simultaneously, HepaCAM overexpression was found
to significantly reduce the expression of proliferation-associated
proteins cyclin D1 and PCNA (P<0.05; Fig. 5B-D). These results suggest that
the overexpression of HepaCAM can reverse the metabolic stress
resistance of PCa cells after Gln deprivation.
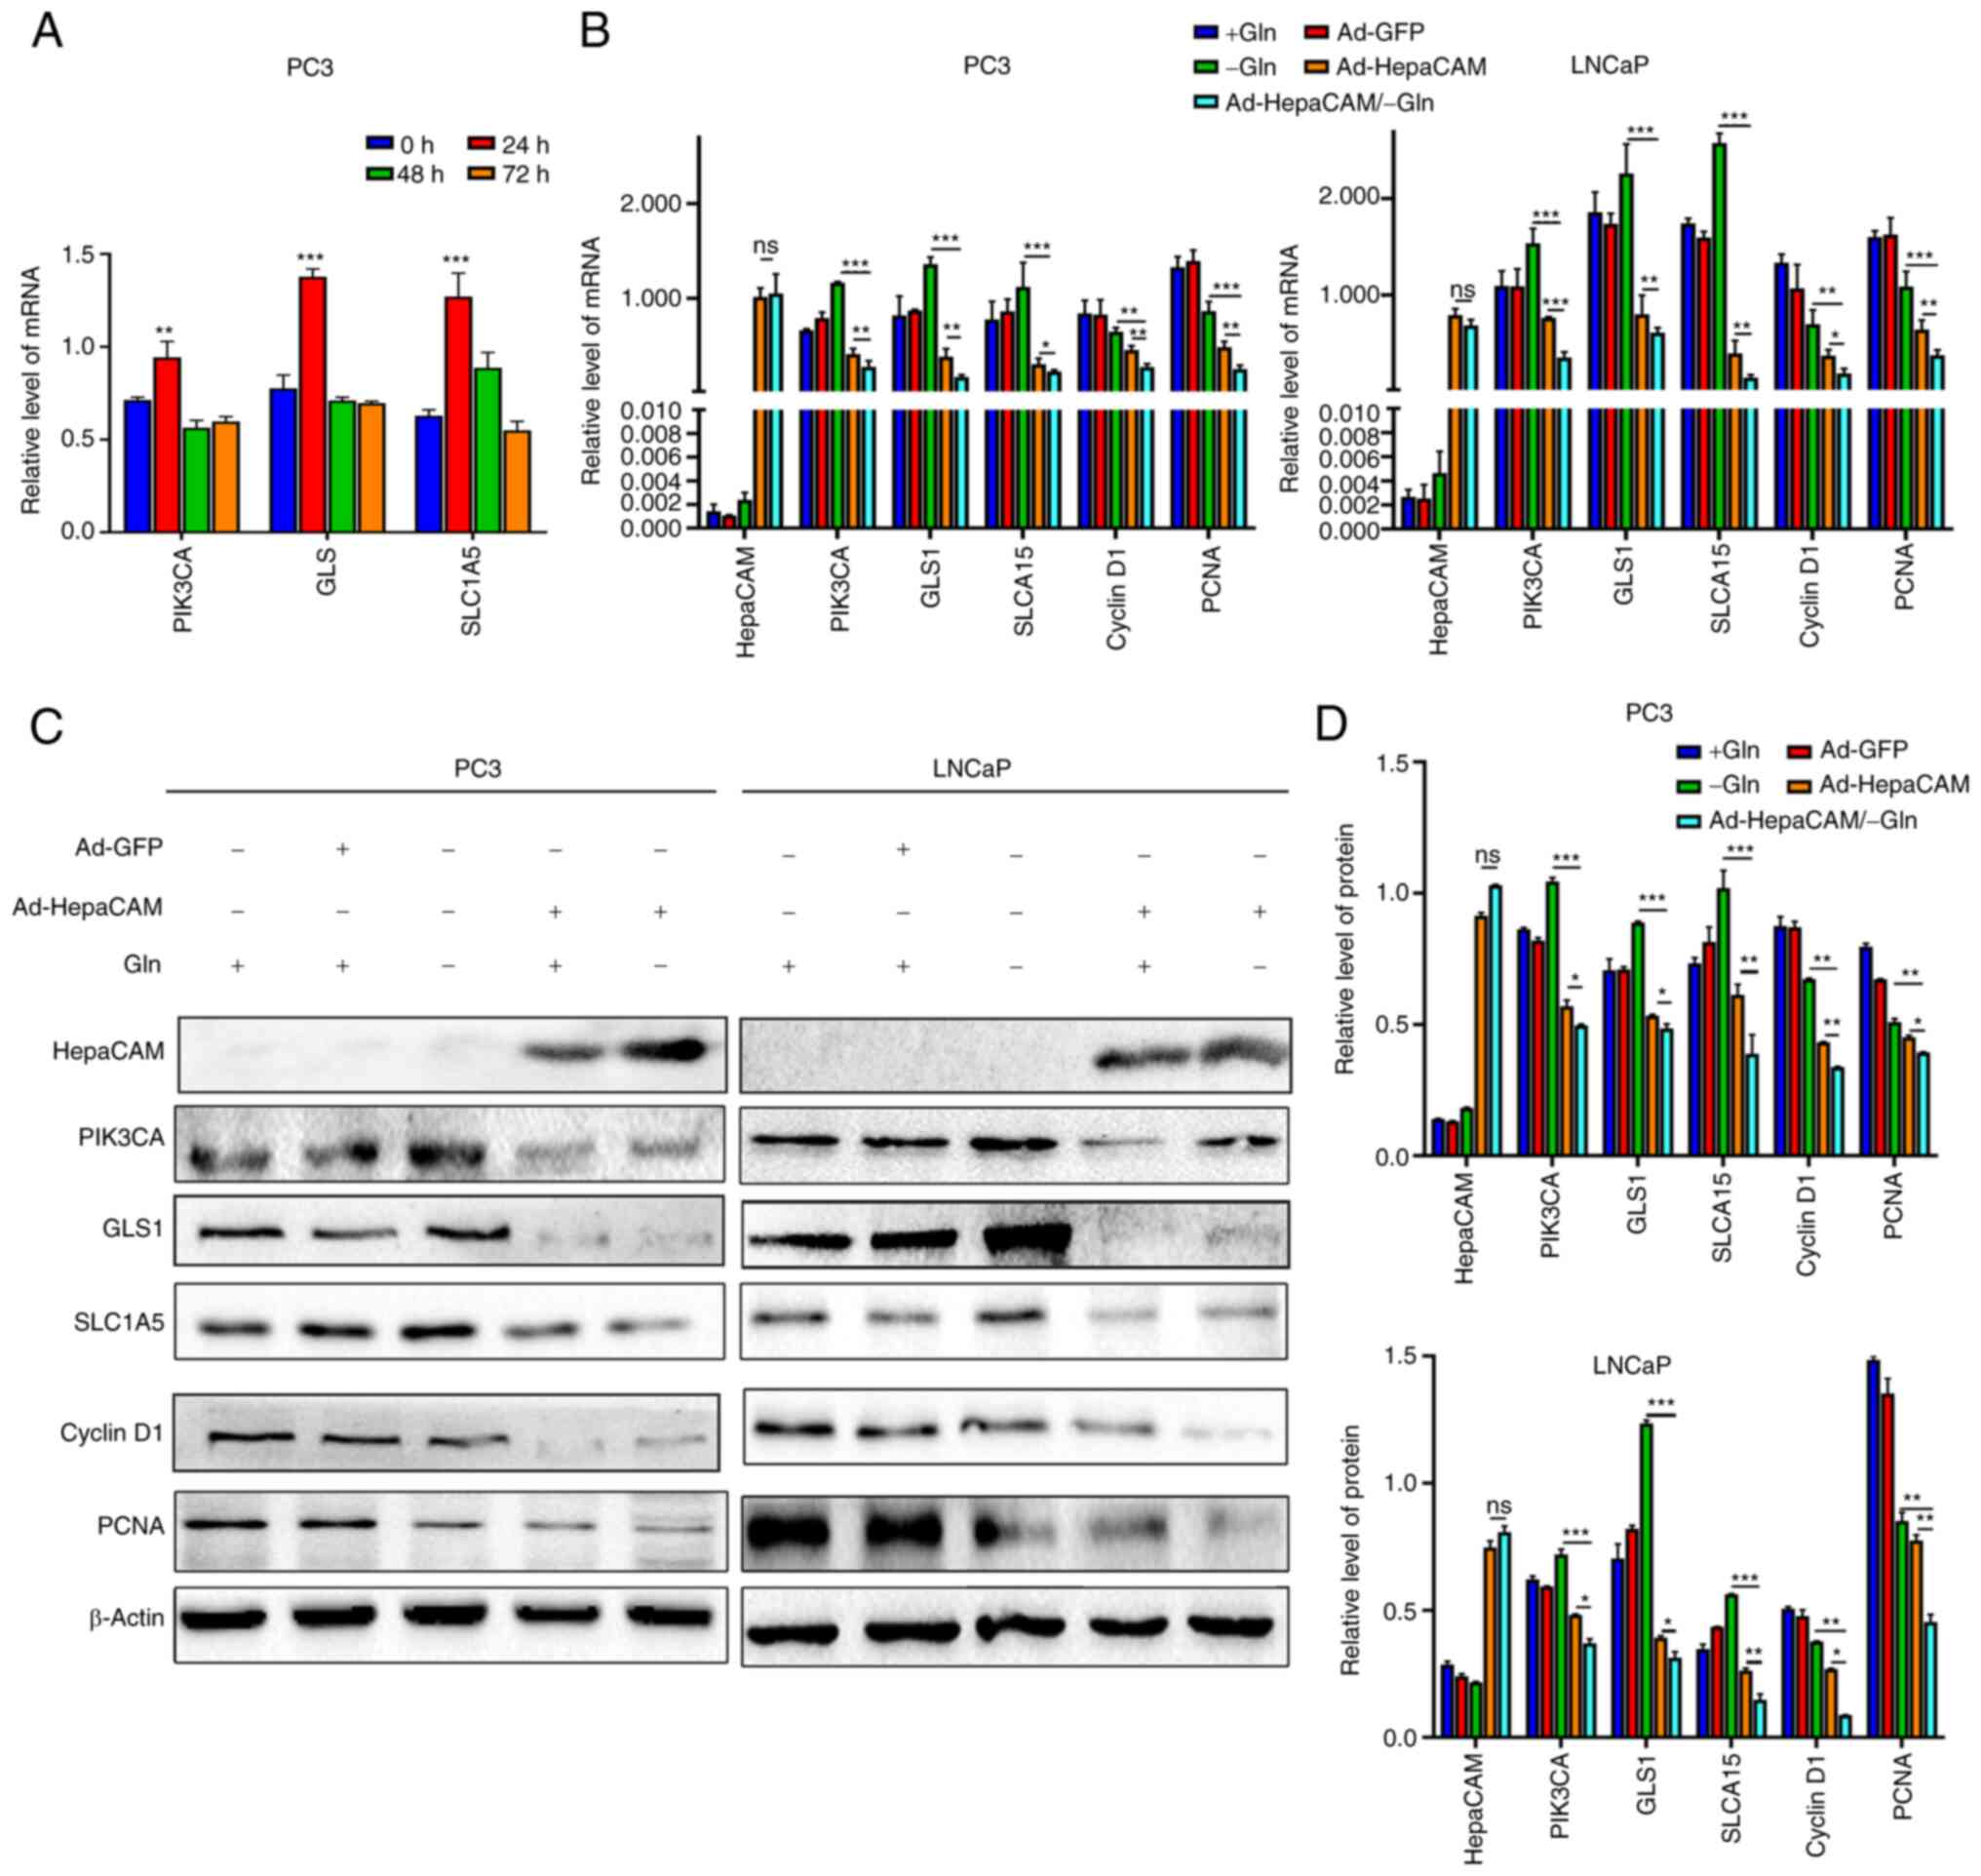 | Figure 5Overexpression of HepaCAM reverses
stress resistance to reprogramming of glutamine metabolism in PCa
cells. (A) mRNA expression levels of PIK3CA, GLS and SLC1A5 were
measured at different time points after Gln deprivation by RT-qPCR.
**P<0.01, and ***P<0.001 vs. 0 h. (B)
RT-qPCR detection of mRNA levels of HepaCAM, PIK3CA, GLS, SLC1A5,
Cyclin D1, and PCNA in PC3 and LNCaP cells after Ad-HepaCAM or Gln
deprivation (24 h). (C and D) Western blot analysis and
quantification of the protein expression of the molecules mentioned
in (B). β-actin were used as internal controls. Data are
represented as mean ± SD of three individual experiments.
*P<0.05, **P<0.01, and
***P<0.001; ns, not significant. HepaCAM,
hepatocellular cell adhesion molecule; PIK3CA,
phosphatidylinositol-4,5-bisphosphate 3-kinase catalytic subunit α;
GLS, glutaminase; SLC1A5, solute carrier family 1 member 5; PCNA,
proliferating cell nuclear antigen. |
Stress resistance of Gln metabolism is
mediated by PIK3CA
To ascertain whether the stress resistance
demonstrated by Gln metabolism in PCa cells in response to a poor
nutritional environment is associated with PIK3CA, alpelisib was
used to suppress and inhibit PIK3CA expression. The minimum
inhibitory concentration of cell viability exerted by alpelisib (8
µM) was first determined using CCK-8 assay (P<0.05;
Fig. 6A), while the trend of
dose-independent inhibition was demonstrated according to western
blotting results (P<0.05; Fig.
6B). It was subsequently discovered that the stress resistance
of Gln metabolism in PCa cells was reversed after PIK3CA expression
was inhibited by alpelisib under Gln deprivation (P<0.05;
Fig. 6C and D). To verify the
direct potentiating effects of PIK3CA on maintaining the stress
resistance of Gln metabolism in vivo, LNCaP cells were
subcutaneous injected into nude mice. In total, five mice were
subcutaneously injected with alpelisib before the extent of tumour
growth was measured over time. Alpelisib in the dosing group was
found to significantly inhibit the growth and reduce the weight of
xenograft tumours compared with those in the control group
(P<0.001; Fig. 7A-C). In
addition, the expression levels of PIK3CA and Ki-67 in the tumour
tissues of mice were suppressed by alpelisib (Fig. 7D). In conclusion, these results
suggest that PIK3CA can mediate the stress resistance of Gln
metabolism in PCa cells.
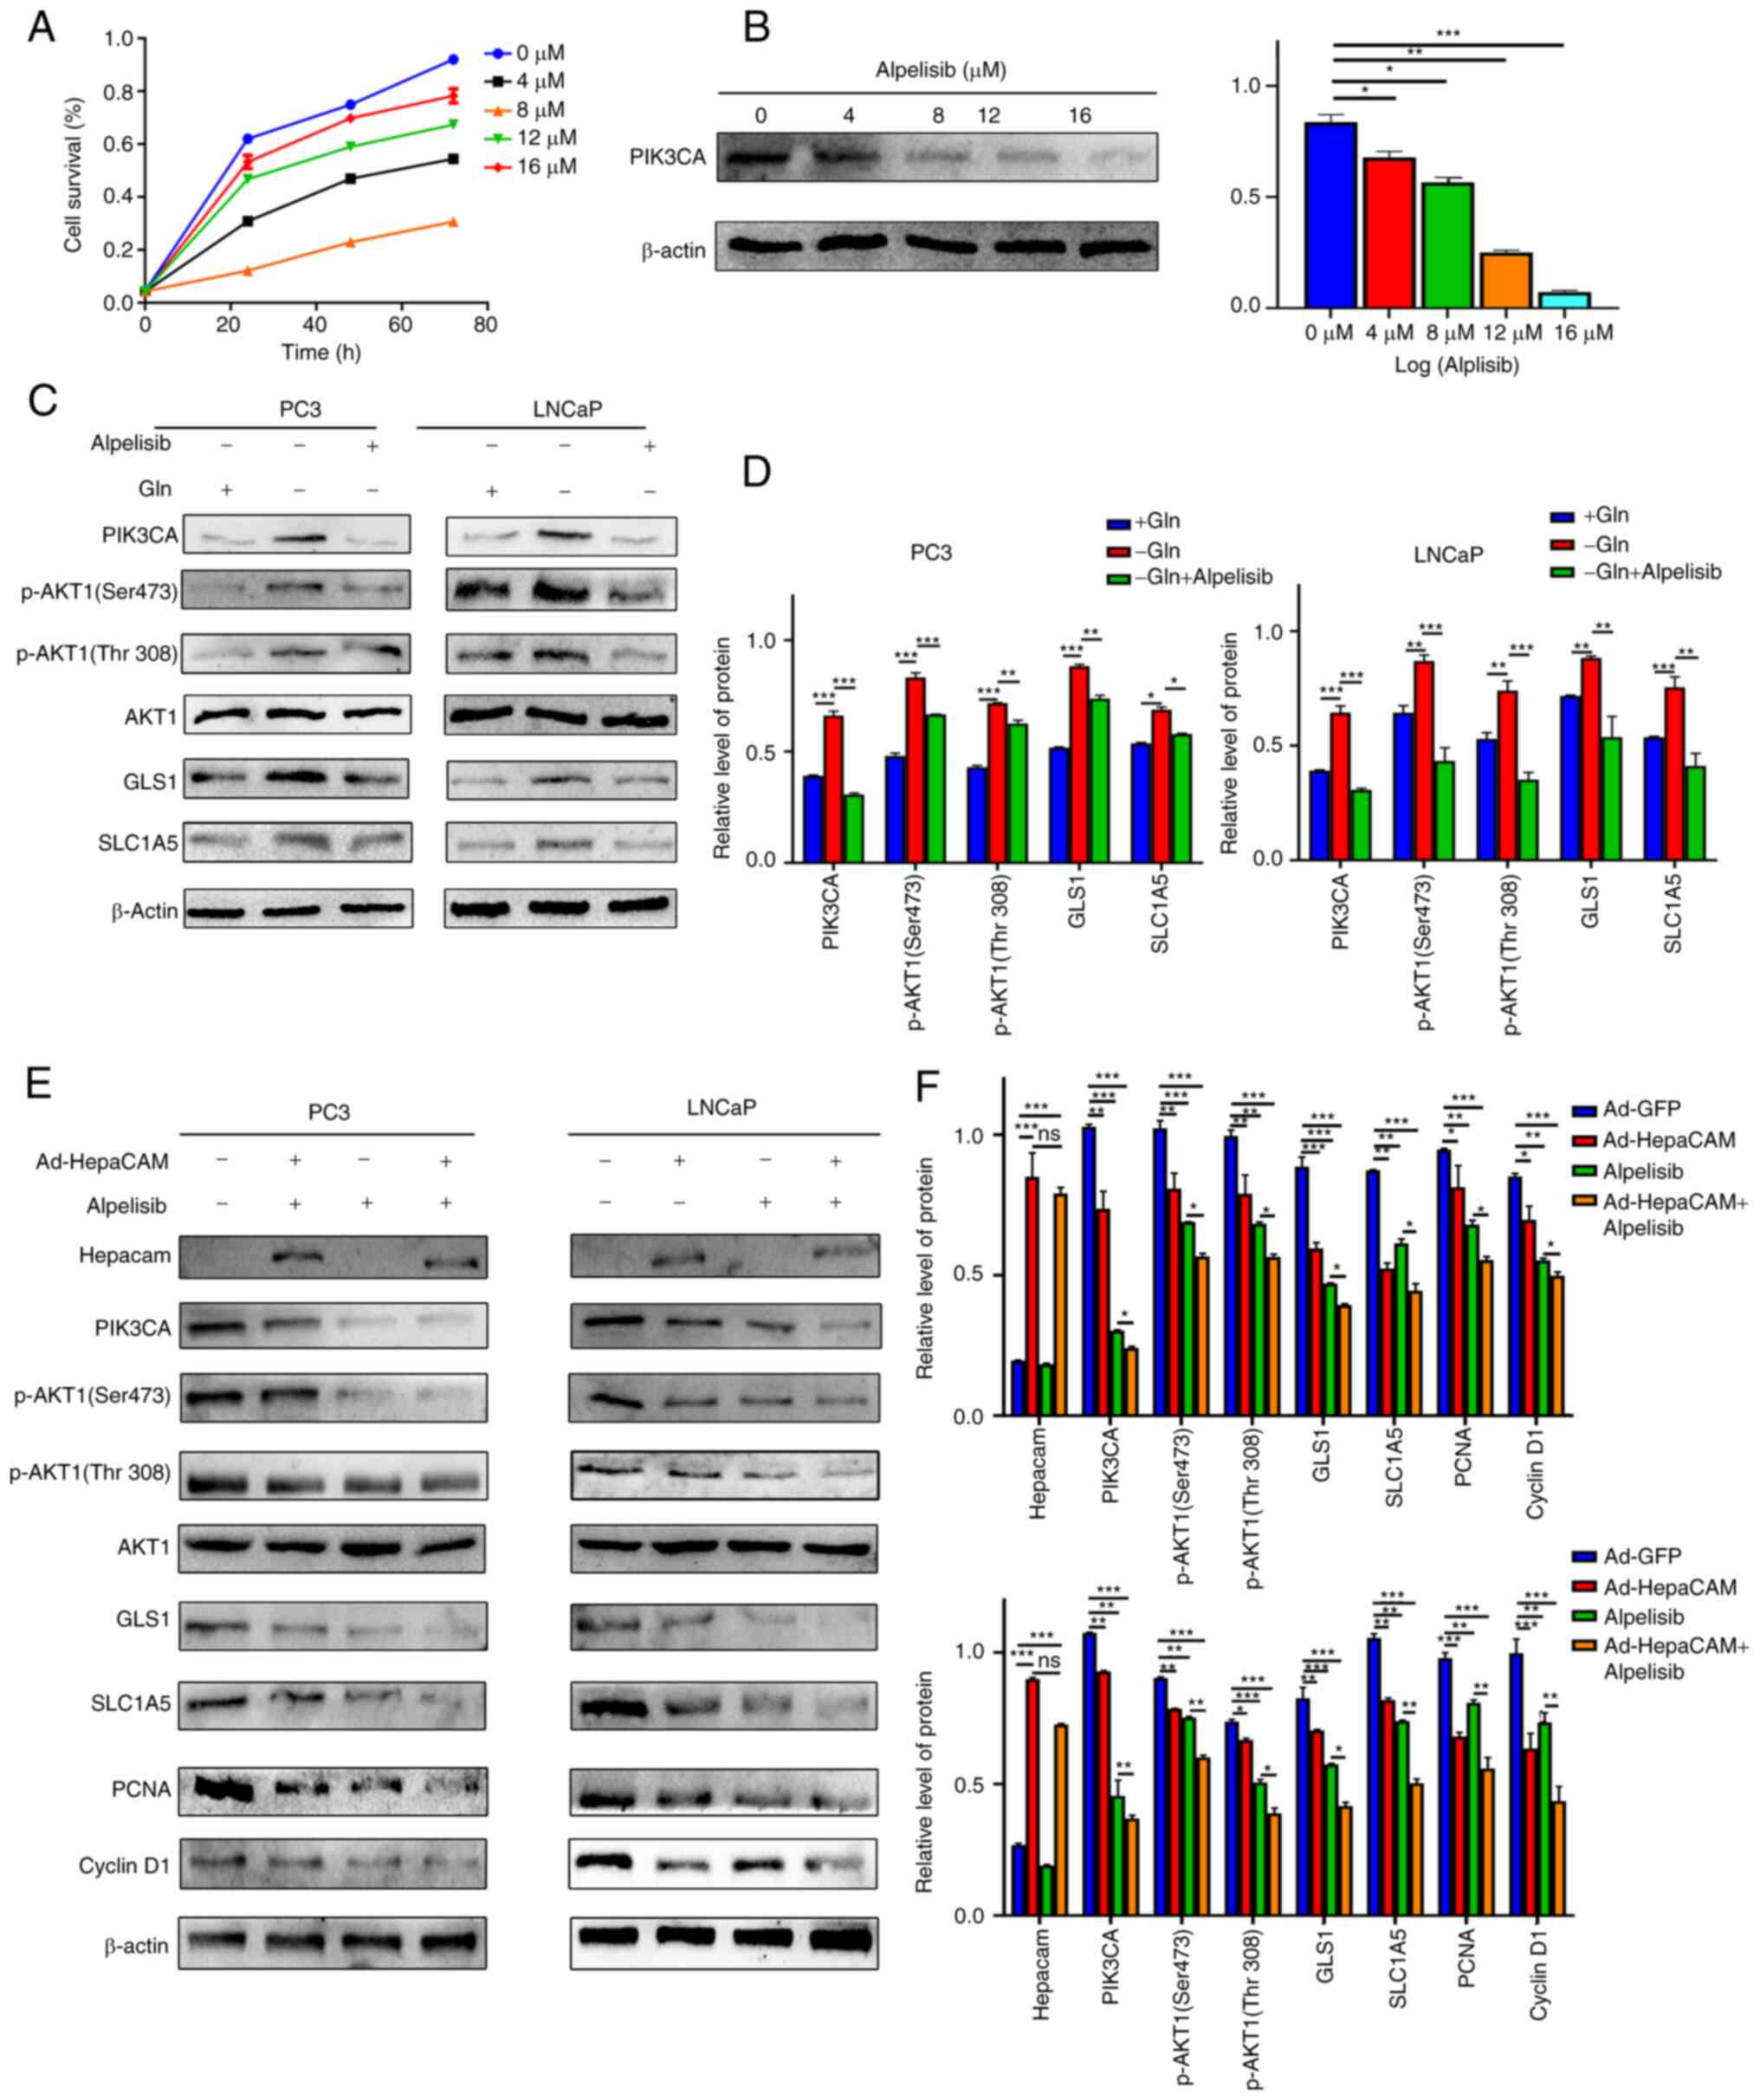 | Figure 6HepaCAM suppresses expression of
glutamine metabolism-related and proliferation-related molecules by
modulating PIK3CA. (A) CCK-8 assay was used to detect the toxicity
of different concentrations of alpelisib (0, 4, 8, 12 and 16
µM) on PC3 cells. (B) Western blot analysis was used to
assess the inhibitory effect on PIK3CA expression with the
concentrations of alpelisib used in A. (C and D) Western blot
analysis was used to detect and analyse the protein expression of
PIK3CA, p-AKT1(Ser473/Thr308), AKT1, GLS1, SLC1A5 after Gln
deprivation or/and alpelisib treatment in PC3 and LNCaP cells (8
µM, 24 h). (E and F) Western blot analysis was used to
detect and analyse the protein expression of HepaCAM, cyclin D1,
PCNA and the molecules mentioned in C after Gln deprivation for 24,
then treatment with Ad-HepaCAM or/and alpelisib for 72 h. β-actin
was used as internal controls. Data are represented as mean ± SD of
three individual experiments. *P<0.05,
**P<0.01, and ***P<0.001 vs. controls.
HepaCAM, hepatocellular cell adhesion molecule; PIK3CA,
phosphatidylinositol-4,5-bisphosphate 3-kinase catalytic subunit α;
GLS, glutaminase; SLC1A5, solute carrier family 1 member 5; PCNA,
proliferating cell nuclear antigen; Gln, glutamine. |
HepaCAM can suppress Gln metabolism
reprogramming and cell proliferation of PCa by inhibiting PIK3CA
expression
The present study next examined whether HepaCAM can
regulate Gln metabolism reprogramming in PCa by regulating PIK3CA
expression. To evaluate this hypothesis, Gln-deprived cells were
treated with alpelisib and/or transfected with Ad-HepaCAM. The
results demonstrated that the levels of PIK3CA protein expression
and its downstream effector p-AKT1 (Ser473/Thr308), Gln metabolism
components GLS1 and SLC1A5, proliferation-associated molecules
cyclin D1 and PCNA were all significantly lower in the Ad-HepaCAM
or alpelisib groups compared with those in their corresponding
control groups. In particular, the inhibitory effects mediated by
HepaCAM overexpression combined with alpelisib treatment were the
most potent (P<0.05; Fig. 6E and
F). In addition, suppression of PIK3CA expression did not exert
any significant effects on HepaCAM expression (Fig. 6E and F).
Next, CCK-8 assays were performed to detect the
sensitivity of PC3 and LNCaP cells to alpelisib after Ad-HepaCAM
transfection. The data revealed that alpelisib sensitivity was
significantly increased in both cell lines after the overexpression
of HepaCAM compared with that in the Ad-GFP group (P<0.05,
Fig. 8A). Furthermore, the
results showed that the positive expression index of Ki-67, a
marker of cancer cell proliferation activity, was significantly
lower compared with that in the Ad-GFP group following Ad-HepaCAM
transfection and/or alpelisib, where the effects exerted by the
combination of both treatments were also satisfactory (P<0.05;
Fig. 8B and C). Flow cytometry
assay revealed that the proportion of cells in the S phase was
increased after transfection with Ad-HepaCAM and alpelisib
(Fig. 8D and E). By contrast, MS
results revealed that the combination of alpelisib and HepaCAM
overexpression increased the concentration of Gln further in the
PCa cells while suppressing its conversion to Glu (P<0.05;
Fig. 4D-F). These results suggest
that HepaCAM overexpression can inhibit Gln metabolic reprogramming
in PCa cells through PIK3CA to reverse their stress resistance,
which in turn inhibits cell proliferation and tumour growth.
Discussion
In addition to essential sugars and fatty acids,
glutamine (Gln) is another important source of nutrients that can
accelerate the mitochondrial Kreb's cycle, in a process known as
glutaminolysis, which involves the catabolism of Gln into glutamate
(Glu), which is then metabolized into α-ketoglutarate to support
ATP production by feeding into the Kreb's cycle (5). In certain cases, cancer cells can
reprogram themselves to become dependent on certain metabolic
pathways, activities or processes, such that the cell adopts a type
of oncogenic addiction, in a phenomenon known as 'metabolic
reprogramming' (6). Importantly,
this type of metabolic reprogramming can be tissue-specific, and in
context, downstream of both genetic and environmental factors, such
that it can present vulnerabilities that can be therapeutically
exploited (43,44). Therefore, the present study
compared the levels of various amino acids in the blood samples of
normal individuals and patients with prostate cancer (PCa). Gln
levels exhibited one of the most sensitive and significant
differences, which was in turn correlated with the Gleason score
based on the clinical parameters of the patients. In addition,
through the detection and analysis of the levels of Gln and
metabolic flux in the blood samples and PCa cells, it was found
that Gln metabolism reprogramming was also common among patients
with PCa. Therefore, it was hypothesized that Gln levels have
potential as a type of auxiliary diagnostic marker for PCa in a
clinical setting.
Previous studies reported that hepatocellular cell
adhesion molecule (HepaCAM) can serve a significant role in tumour
cell proliferation, apoptosis, migration and invasion, since its
expression is typically absent in cancer tissues (19,45). In addition, previous reports have
found that mutation in phosphatidylinositol-4,5-bisphosphate
3-kinase catalytic subunit α (PIK3CA) can activate PI3K/AKT
signalling downstream to induce alterations in Gln metabolism in
tumour cells (29). In the
present study, bioinformatics analyses of various databases were
performed to predict the correlation in the expression levels
between HepaCAM and PIK3CA. These data revealed that PIK3CA and
that of glutaminase (GLS) and as solute carrier family 1 member 5
(SLC1A5), components of Gln metabolism, are expressed at high
levels in PCa tissues, all of which in turn correspond to poorer
prognoses. In addition, a negative correlation was found between
HepaCAM and PIK3CA expression in PCa tissues as determined by IHC.
Subsequently, HepaCAM and PIK3CA expression were found to be
significantly correlated with the Gleason grade, which implies the
different prognoses associated with their expression levels in PCa
tissues. Therefore, these findings suggest that HepaCAM can
regulate Gln metabolic reprogramming in PCa by regulating PIK3CA
expression.
At present, the most extensively studied metabolic
alteration in cancer cells is their high reliance on glycolysis
even under sufficient oxygen supply to sustain oxidative
phosphorylation in the mitochondria, in a process known as the
Warburg effect (19). The rapid
ATP production as a result of this glycolytic upregulation is
considered to potentiate the proliferation of cancer cells
(46). However, it has been
previously reported that the catabolic and anabolic roles of both
glucose and Gln can cooperate in promoting tumour growth (47). A previous study found that HepaCAM
can inhibit the Warburg effect in renal cell carcinoma cells
(19). Therefore, it could be
hypothesized that HepaCAM can inhibit Gln metabolism reprogramming
in PCa. In the present study, the mRNA and protein expression
levels of HepaCAM and PIK3CA in normal prostate epithelial cells
RWPE-1 and prostate cancer cell lines PC3 and LNCaP were next
assessed. After the induced overexpression of HepaCAM in the cells
lines, the expression of PIK3CA and Gln metabolism components GLS
and SLC1A5, in addition to tumour proliferation-associated
molecules PCNA and cyclin D1, were all reduced. These results
suggest that the loss of HepaCAM expression in tumours may promote
dysfunctions in Gln metabolism, promote cell proliferation and
tumour development.
Subsequently, the results from the present study
revealed stress resistance or a compensatory effect in Gln
metabolism in PCa cells following Gln starvation. GLS and SLC1A5
expression were temporarily increased in the short-term after Gln
deprivation in cell culture conditions, which may be a potential
cause of the ineffectiveness of Gln starvation in PCa. On this
basis, HepaCAM was overexpressed, which eliminated this stress
compensation effect. In addition, the inhibitory effects of HepaCAM
combined with Gln deprivation on tumour proliferation were
significantly more potent compared with those mediated by either
treatment alone. Although this compensatory response has been
previously reported in cervical cancer tissues, a previous study
found this effect after treatment with inhibitors of GLS1 (48). In addition, another previous study
discovered that arginine can participate in the mediation of this
type of compensation (49). Since
abnormal arginine levels were also found in the blood samples of
patients with PCa in the present study, the possibility of other
signalling pathways mediating this type of stress compensation
apart from HepaCAM cannot be ruled out.
The present study then explored the effects of
HepaCAM on Gln metabolism reprogramming of PCa. As one of the
catalytic subunits of classical PI3K, PIK3CA serves a key role in
activating the PI3K/AKT signalling pathway (25). A number of studies have previously
found that PIK3CA has a high frequency of mutations in tumours
(40,41,50). Through bioinformatics analysis, it
was found that PIK3CA primarily serves a facilitating role in PCa
pathophysiology, where it was frequently found to be activated by
amplification. This suggests that this form of PIK3CA activation is
tissue-specific. Subsequently, higher PIK3CA expression levels were
also found in PCa tissues compared with those in the adjacent
normal tissues, where they in turn were correlated inversely and
significantly with those of HepaCAM. Alpelisib is a specific
inhibitor of PIK3CA (51). The
present study found that inhibition of PIK3CA expression by
alpelisib significantly reversed the stress resistance of PCa cells
to Gln deprivation, supporting the possible effects of PIK3CA in
this phenomenon. After the PCa cells deprived of Gln for 24 h were
treated with alpelisib and transfected with Ad-HepaCAM at the same
time, the phosphorylation of AKT, the expression of Gln
metabolism-associated and proliferation-associated proteins were
all reduced. In addition, the suppression of PIK3CA exerted no
significant impact on HepaCAM expression. These observations
suggest that HepaCAM can strengthen the inhibition of Gln metabolic
reprogramming and proliferation in PCa by reversing stress
resistance through inhibiting PIK3CA expression. However, the
present study did not assess the possibility of a direct
interaction between HepaCAM and PIK3CA at the protein level.
Instead, the protein structure database STRING was used to predict
protein interaction, showing that HepaCAM may bind to PIK3CA
directly. However, this requires further experimental
verification.
Alpelisib is a PIK3CA inhibitor that has
demonstrated antitumor activity in several types of cancer,
including breast cancer (52) and
epithelial ovarian cancer (53).
In addition, it has been previously applied in clinical trials for
the treatment of multiple tumours. Results from the present study
suggest that it exerts significant inhibitory effects on PIK3CA in
PCa cells in a dose-dependent manner. Although HepaCAM was shown to
inhibit Gln metabolism reprogramming and proliferation in PCa, the
addition of alpelisib was able to significantly potentiate the
inhibition caused by HepaCAM overexpression. Although a specific
agonist of HepaCAM has not yet been successfully developed, the use
of PIK3CA inhibitors to block tumour growth and cell proliferation
appear to more likely result in greater clinical significance,
which provides a valuable reference for the clinical treatment of
PCa.
The present study has a number of limitations.
Although the mRNA expression data of HepaCAM in the bioinformatics
analysis is the relative expression value obtained after
standardization according to the FPKM algorithm, the abundance
value of HepaCAM expression in the TCGA PCa datasets were
relatively low, which could have caused a certain degree of
interference in the follow-up IHC experimental conclusions.
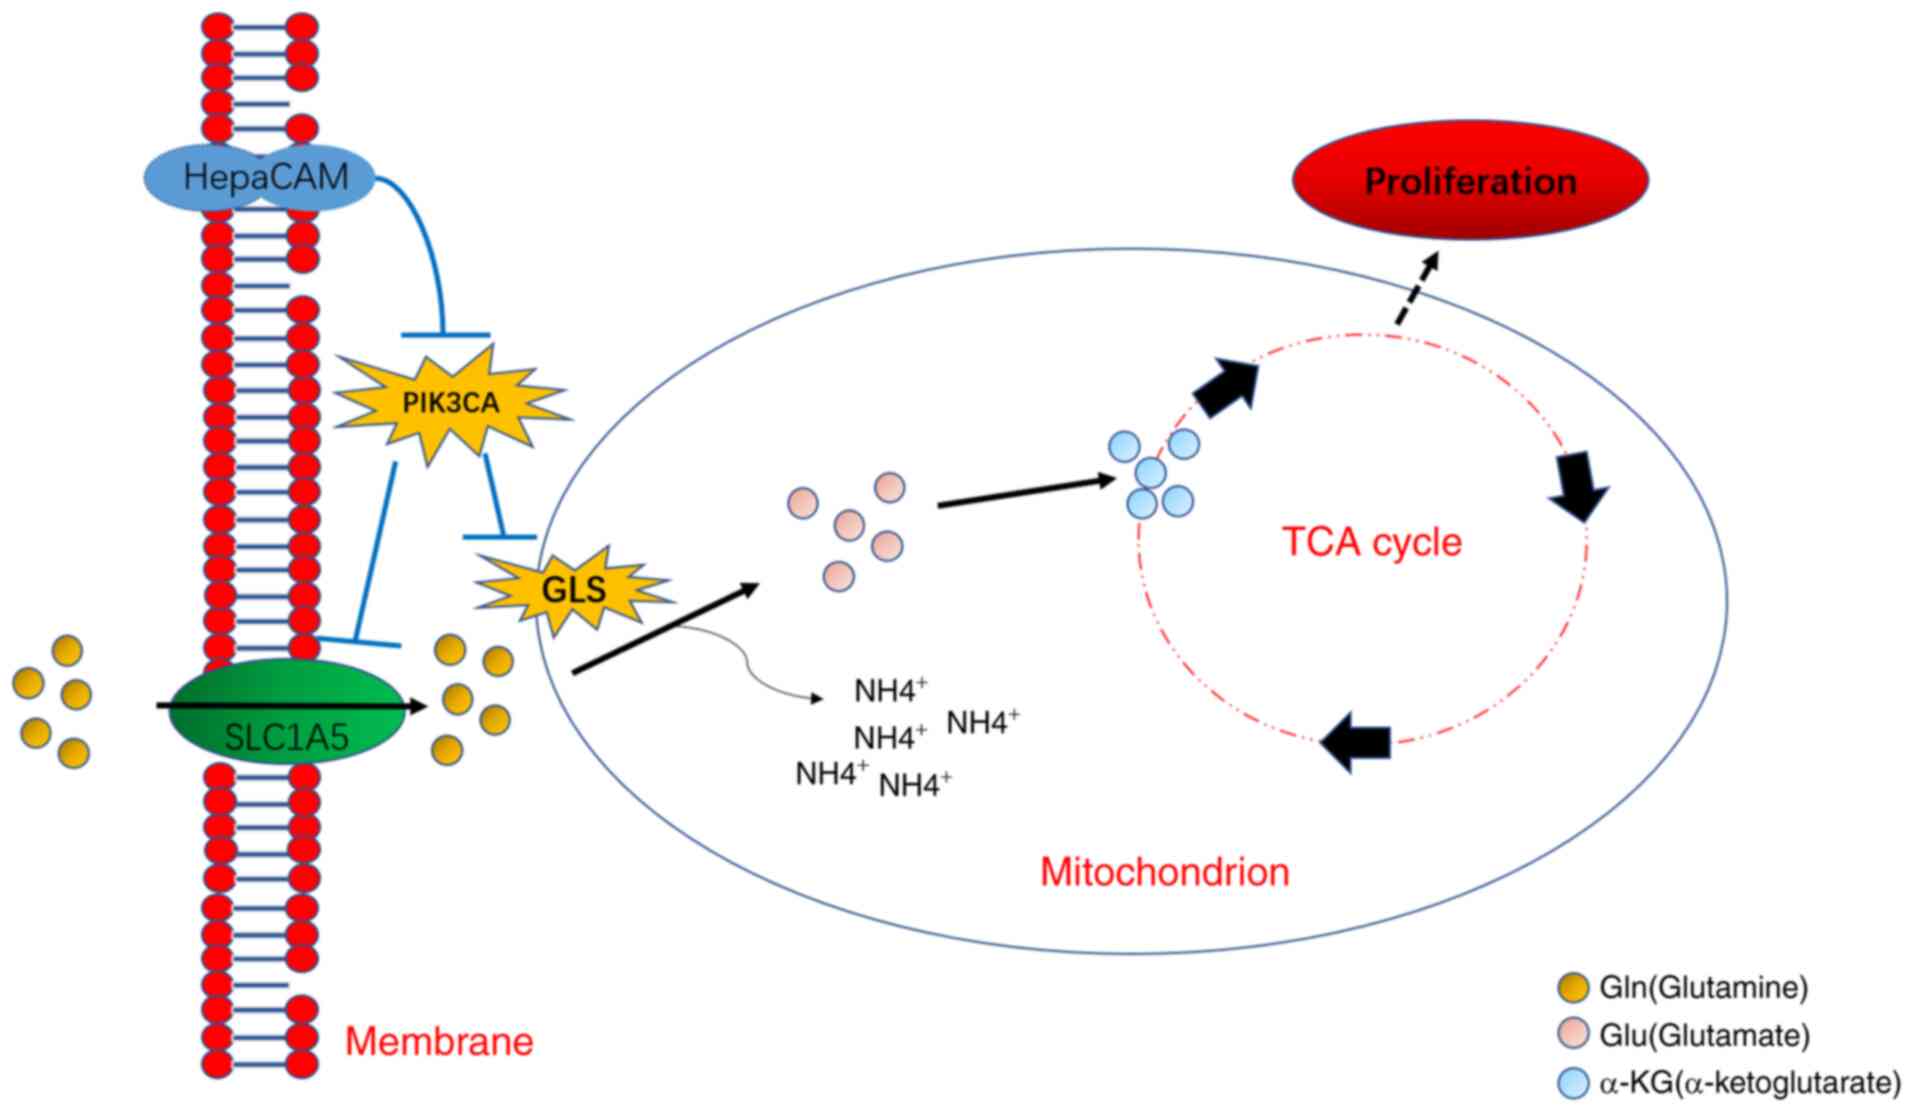
In summary, the present study uncovered abnormal Gln
concentrations, which may be exploited as a potential indicator for
the diagnosis of PCa. In addition, to the best of our knowledge,
the present study was the first to discover that the HepaCAM/PIK3CA
axis may be implicated in Gln metabolism reprogramming and PCa
proliferation (Fig. 9).
Mechanistically, HepaCAM overexpression reversed the stress
resistance shown by Gln metabolism by downregulating PIK3CA
expression. Importantly, the combination of PIK3CA inhibitor and
overexpression of HepaCAM was able to effectively inhibit Gln
metabolism reprogramming and PCa proliferation, thereby providing a
certain clinical value for the treatment of PCa.
Availability of data and materials
The datasets used and/or analysed during the current
study are available from the corresponding author on reasonable
request.
Authors' contributions
ZH, CL and YG designed the experiments. ZH, YG, TL
and CY collected the specimens and analysed the clinical data. ZH,
YG, TL and CY performed the experiments. CL and LO provided
technical support in this research project and supervised the
progress of the experiments. ZH and YG analysed the statistical
data. ZH, LO and TL assembled and installed the figures. ZH, YG and
TL confirm the authenticity of all the raw data. All authors have
read and approved the final manuscript for publication.
Ethics approval and consent to
participate
The present study was approved by the Ethics
Committee of Chongqing Medical University (2016.12.16 Chongqing,
China). Informed consent was obtained from the patients or their
family members who agreed to the use of their samples in this
study. The animal study was performed in accordance with the Animal
Research Advisory Committee (ARAC) Guidelines and was approved by
the Ethics Committee of Chongqing Medical University (Chongqing,
China).
Patient consent for publication
Not applicable.
Competing interests
The authors declare that they have no competing
interests.
Acknowledgments
The authors would like to thank Dr Chaowen Yu,
Center for Clinical Molecular Medicine, Children's Hospital of
Chongqing Medical University. Chongqing, China, for providing the
technical assistance with the liquid chromatography-tandem mass
spectrometry and gas chromatography-mass spectrometry assays.
Funding
The present study was supported by grants from the National
Natural Science Foundation of China (grant no. 81272572).
References
|
1
|
Bray F, Ferlay J, Soerjomataram I, Siegel
RL, Torre LA and Jemal A: Global cancer statistics 2018: GLOBOCAN
estimates of incidence and mortality worldwide for 36 cancers in
185 countries. CA Cancer J Clin. 68:394–424. 2018. View Article : Google Scholar : PubMed/NCBI
|
|
2
|
Fu ZT, Guo XL, Zhang SW, Zheng RS, Zeng
HM, Chen R, Wang SM, Sun KX, Wei WW and He J: Statistical analysis
of incidence and mortality of prostate cancer in China, 2015.
Zhonghua Zhong Liu Za Zhi. 42:718–722. 2020.In Chinese. PubMed/NCBI
|
|
3
|
Li Z and Zhang H: Reprogramming of
glucose, fatty acid and amino acid metabolism for cancer
progression. Cell Mol Life Sci. 73:377–392. 2016. View Article : Google Scholar
|
|
4
|
Hanahan D and Weinberg RA: Hallmarks of
cancer: The next generation. Cell. 144:646–674. 2011. View Article : Google Scholar : PubMed/NCBI
|
|
5
|
Altman B, Stine Z and Dang C: From Krebs
to clinic: Glutamine metabolism to cancer therapy. Nat Rev Cancer.
16:619–634. 2016. View Article : Google Scholar : PubMed/NCBI
|
|
6
|
Zhang J, Pavlova NN and Thompson CB:
Cancer cell metabolism: The essential role of the nonessential
amino acid, glutamine. EMBO J. 36:1302–1315. 2017. View Article : Google Scholar : PubMed/NCBI
|
|
7
|
Mates JM, Segura JA, Martin-Rufian M,
Campos-Sandoval JA, Alonso FJ and Marquez J: Glutaminase isoenzymes
as key regulators in metabolic and oxidative stress against cancer.
Curr Mol Med. 13:514–534. 2013. View Article : Google Scholar
|
|
8
|
Hassanein M, Hoeksema MD, Shiota M, Qian
J, Harris BK, Chen H, Clark JE, Alborn WE, Eisenberg R and Massion
PP: SLC1A5 mediates glutamine transport required for lung cancer
cell growth and survival. Clin Cancer Res. 19:560–570. 2013.
View Article : Google Scholar :
|
|
9
|
Strmiska V, Michalek P, Eckschlager T,
Stiborova M, Adam V, Krizkova S and Heger Z: Prostate
cancer-specific hallmarks of amino acids metabolism: Towards a
paradigm of precision medicine. Biochim Biophys Acta Rev Cancer.
1871:248–258. 2019. View Article : Google Scholar : PubMed/NCBI
|
|
10
|
Martinez-Outschoorn U, Lisanti M and
Sotgia F: Catabolic cancer-associated fibroblasts transfer energy
and biomass to anabolic cancer cells, fueling tumor growth. Semin
Cancer Biol. 25:47–60. 2014. View Article : Google Scholar : PubMed/NCBI
|
|
11
|
Huang C and McConathy J: Radiolabeled
amino acids for oncologic imaging. J Nucl Med. 54:1007–1010. 2013.
View Article : Google Scholar : PubMed/NCBI
|
|
12
|
Twum-Ampofo J, Fu D, Passaniti A, Hussain
A and Siddiqui M: Metabolic targets for potential prostate cancer
therapeutics. Curr Opin Oncol. 28:241–247. 2016. View Article : Google Scholar : PubMed/NCBI
|
|
13
|
Chung Moh M, Hoon Lee L and Shen S:
Cloning and characterization of hepaCAM, a novel Ig-like cell
adhesion molecule suppressed in human hepatocellular carcinoma. J
Hepatol. 42:833–841. 2005. View Article : Google Scholar : PubMed/NCBI
|
|
14
|
Moh MC, Zhang C, Luo C, Lee LH and Shen S:
Structural and functional analyses of a novel ig-like cell adhesion
molecule, hepaCAM, in the human breast carcinoma MCF7 cells. J Biol
Chem. 280:27366–27374. 2005. View Article : Google Scholar : PubMed/NCBI
|
|
15
|
Song X, Wang Y, Du H, Fan Y, Yang X, Wang
X, Wu X and Luo C: Overexpression of HepaCAM inhibits cell
viability and motility through suppressing nucleus translocation of
androgen receptor and ERK signaling in prostate cancer. Prostate.
74:1023–1033. 2014. View Article : Google Scholar : PubMed/NCBI
|
|
16
|
Tang M, Zhao Y, Liu N, Chen E, Quan Z, Wu
X and Luo C: Overexpression of HepaCAM inhibits bladder cancer cell
proliferation and viability through the AKT/FoxO pathway. J Cancer
Res Clin Oncol. 143:793–805. 2017. View Article : Google Scholar : PubMed/NCBI
|
|
17
|
Wang X, Chen E, Yang X, Wang Y, Quan Z, Wu
X and Luo C: 5-azacytidine inhibits the proliferation of bladder
cancer cells via reversal of the aberrant hypermethylation of the
hepaCAM gene. Oncol Rep. 35:1375–1384. 2016. View Article : Google Scholar
|
|
18
|
Quan Z, He Y, Luo C, Xia Y, Zhao Y, Liu N
and Wu X: Interleukin 6 induces cell proliferation of clear cell
renal cell carcinoma by suppressing hepaCAM via the STAT3-dependent
up-regulation of DNMT1 or DNMT3b. Cell Signal. 32:48–58. 2017.
View Article : Google Scholar : PubMed/NCBI
|
|
19
|
Fan Y, Ou L, Fan J, Li L, Wu X, Luo C, Gao
Y and Niu L: HepaCAM regulates warburg effect of renal cell
carcinoma via HIF-1α/NF-κB signaling pathway. Urology. 127:61–67.
2019. View Article : Google Scholar
|
|
20
|
Deng Q, Luo L, Quan Z, Liu N, Du Z, Sun W,
Luo C and Wu X: HepaCAM inhibits cell proliferation and invasion in
prostate cancer by suppressing nuclear translocation of the
androgen receptor via its cytoplasmic domain. Mol Med Rep.
19:2115–2124. 2019.PubMed/NCBI
|
|
21
|
Yuan TL and Cantley LC: PI3K pathway
alterations in cancer: Variations on a theme. Oncogene.
27:5497–5510. 2008. View Article : Google Scholar : PubMed/NCBI
|
|
22
|
Liu W, Yuan Y, Sun C, Balasubramanian B,
Zhao Z and An L: Effects of dietary betaine on growth performance,
digestive function, carcass traits, and meat quality in indigenous
yellow-feathered broilers under long-term heat stress. Animals
(Basel). 9:5062019. View Article : Google Scholar
|
|
23
|
Liu WC, Guo Y, Zhao ZH, Jha R and
Balasubramanian B: Algae-derived polysaccharides promote growth
performance by improving antioxidant capacity and intestinal
barrier function in broiler chickens. Front Vet Sci. 7:6013362020.
View Article : Google Scholar : PubMed/NCBI
|
|
24
|
Guo Y, Zhao ZH, Pan ZY, An LL,
Balasubramanian B and Liu WC: New insights into the role of dietary
marine-derived polysaccharides on productive performance, egg
quality, antioxidant capacity, and jejunal morphology in late-phase
laying hens. Poult Sci. 99:2100–2107. 2020. View Article : Google Scholar : PubMed/NCBI
|
|
25
|
Hiles ID, Otsu M, Volinia S, Fry MJ, Gout
I, Dhand R, Panayotou G, Ruiz-Larrea F, Thompson A, Totty NF, et
al: Phosphatidylinositol 3-kinase: Structure and expression of the
110 kd catalytic subunit. Cell. 70:419–429. 1992. View Article : Google Scholar : PubMed/NCBI
|
|
26
|
Holst F, Werner HM, Mjøs S, Hoivik EA,
Kusonmano K, Wik E, Berg A, Birkeland E, Gibson WJ, Halle MK, et
al: PIK3CA amplification associates with aggressive phenotype but
not markers of AKT-MTOR signaling in endometrial carcinoma. Clin
Cancer Res. 25:334–345. 2019. View Article : Google Scholar :
|
|
27
|
Han C, Yang L, Choi HH, Baddour J, Achreja
A, Liu Y, Li Y, Li J, Wan G, Huang C, et al: Amplification of USP13
drives ovarian cancer metabolism. Nat Commun. 7:135252016.
View Article : Google Scholar : PubMed/NCBI
|
|
28
|
Hao Y, Samuels Y, Li Q, Krokowski D, Guan
BJ, Wang C, Jin Z, Dong B, Cao B, Feng X, et al: Oncogenic PIK3CA
mutations reprogram glutamine metabolism in colorectal cancer. Nat
Commun. 7:119712016. View Article : Google Scholar : PubMed/NCBI
|
|
29
|
Boku S, Watanabe M, Sukeno M, Yaoi T,
Hirota K, Iizuka-Ohashi M, Itoh K and Sakai T: Deactivation of
glutaminolysis sensitizes PIK3CA-mutated colorectal cancer cells to
aspirin-induced growth inhibition. Cancers (Basel). 12:10972020.
View Article : Google Scholar
|
|
30
|
Lau CE, Tredwell GD, Ellis JK, Lam EW and
Keun H: Metabolomic characterisation of the effects of oncogenic
PIK3CA transformation in a breast epithelial cell line. Sci Rep.
7:460792017. View Article : Google Scholar : PubMed/NCBI
|
|
31
|
Du Z, Li L, Sun W, Wang X, Zhang Y, Chen
Z, Yuan M, Quan Z, Liu N, Hao Y, et al: HepaCAM inhibits the
malignant behavior of castration-resistant prostate cancer cells by
downregulating Notch signaling and PF-3084014 (a γ-secretase
inhibitor) partly reverses the resistance of refractory prostate
cancer to docetaxel and enzalutamide in vitro. Int J Oncol.
53:99–112. 2018.PubMed/NCBI
|
|
32
|
Zhao Y, Balasubramanian B, Guo Y, Qiu SJ,
Jha R and Liu WC: Dietary enteromorpha polysaccharides
supplementation improves breast muscle yield and is associated with
modification of mrna transcriptome in broiler chickens. Front Vet
Sci. 8:6639882021. View Article : Google Scholar :
|
|
33
|
Guo Y, Balasubramanian B, Zhao ZH and Liu
WC: Marine algal polysaccharides alleviate aflatoxin B1-induced
bursa of Fabricius injury by regulating redox and apoptotic
signaling pathway in broilers. Poult Sci. 100:844–857. 2021.
View Article : Google Scholar : PubMed/NCBI
|
|
34
|
Liu WC, Ou BH, Liang ZL, Zhang R and Zhao
ZH: Algae-derived polysaccharides supplementation ameliorates heat
stress-induced impairment of bursa of Fabricius via modulating
NF-κB signaling pathway in broilers. Poult Sci. 100:1011392021.
View Article : Google Scholar
|
|
35
|
Liu WC, Zhu YR, Zhao ZH, Jiang P and Yin
FQ: Effects of dietary supplementation of algae-derived
polysaccharides on morphology, tight junctions, antioxidant
capacity and immune response of duodenum in broilers under heat
stress. Animals (Basel). 11:22792021. View Article : Google Scholar
|
|
36
|
Yu C, Huang S, Wang M, Zhang J, Liu H,
Yuan Z, Wang X, He X, Wang J and Zou L: A novel tandem mass
spectrometry method for first-line screening of mainly
beta-thalassemia from dried blood spots. J Proteomics. 154:78–84.
2017. View Article : Google Scholar
|
|
37
|
Geng HT, Cao RJ, Cheng L and Liu CY:
Overexpression of hepatocyte cell adhesion molecule (hepaCAM)
inhibits the proliferation, migration, and invasion in colorectal
cancer cells. Oncol Res. 25:1039–1046. 2017. View Article : Google Scholar : PubMed/NCBI
|
|
38
|
Zhang QL, Luo CL, Wu XH, Wang CY, Xu X,
Zhang YY, Liu Q and Shen SL: HepaCAM induces G1 phase arrest and
promotes c-Myc degradation in human renal cell carcinoma. J Cell
Biochem. 112:2910–2919. 2011. View Article : Google Scholar : PubMed/NCBI
|
|
39
|
Wise DR, DeBerardinis RJ, Mancuso A, Sayed
N, Zhang XY, Pfeiffer HK, Nissim I, Daikhin E, Yudkoff M, McMahon
SB and Thompson CB: Myc regulates a transcriptional program that
stimulates mitochondrial glutaminolysis and leads to glutamine
addiction. Proc Natl Acad Sci USA. 105:18782–18787. 2008.
View Article : Google Scholar : PubMed/NCBI
|
|
40
|
Kandoth C, McLellan MD, Vandin F, Ye K,
Niu B, Lu C, Xie M, Zhang Q, McMichael JF, Wyczalkowski MA, et al:
Mutational landscape and significance across 12 major cancer types.
Nature. 502:333–339. 2013. View Article : Google Scholar
|
|
41
|
Lawrence MS, Stojanov P, Mermel CH,
Robinson JT, Garraway LA, Golub TR, Meyerson M, Gabriel SB, Lander
ES and Getz G: Discovery and saturation analysis of cancer genes
across 21 tumour types. Nature. 505:495–501. 2014. View Article : Google Scholar
|
|
42
|
Torre LA, Sauer AM, Chen MS Jr,
Kagawa-Singer M, Jemal A and Siegel R: Cancer statistics for Asian
Americans, Native Hawaiians, and Pacific Islanders, 2016:
Converging incidence in males and females. CA Cancer J Clin.
66:182–202. 2016. View Article : Google Scholar : PubMed/NCBI
|
|
43
|
Mayers JR, Torrence ME, Danai LV,
Papagiannakopoulos T, Davidson SM, Bauer MR, Lau AN, Ji BW, Dixit
PD and Hosios AM: Tissue of origin dictates branched-chain amino
acid metabolism in mutant Kras-driven cancers. Science.
353:1161–1165. 2016. View Article : Google Scholar : PubMed/NCBI
|
|
44
|
Yuneva MO, Fan TW, Allen TD, Higashi RM,
Ferraris DV, Tsukamoto T, Matés JM, Alonso FJ, Wang C, Seo Y, et
al: The metabolic profile of tumors depends on both the responsible
genetic lesion and tissue type. 15:157–170. 2012.PubMed/NCBI
|
|
45
|
Li T, Liu N, Gao Y, Quan Z, Hao Y, Yu C,
Li L, Yuan M, Niu L, Luo C and Wu X: Long noncoding RNA HOTAIR
regulates the invasion and metastasis of prostate cancer by
targeting hepaCAM. Br J Cancer. 124:247–258. 2020. View Article : Google Scholar
|
|
46
|
McGuirk S, Gravel S, Deblois G, Papadopoli
DJ, Faubert B, Wegner A, Hiller K, Avizonis D, Akavia UD, Jones RG,
et al: PGC-1α supports glutamine metabolism in breast cancer.
Cancer Metab. 1:222013. View Article : Google Scholar
|
|
47
|
DeBerardinis RJ and Cheng T: Q's next: The
diverse functions of glutamine in metabolism, cell biology and
cancer. Oncogene. 29:313–324. 2010. View Article : Google Scholar :
|
|
48
|
Biancur DE, Paulo JA, Małachowska B,
Quiles Del Rey M, Sousa CM, Wang X, Sohn AS, Chu GC, Gygi SP,
Harper JW, et al: Compensatory metabolic networks in pancreatic
cancers upon perturbation of glutamine metabolism. Nat Commun.
8:159652017. View Article : Google Scholar : PubMed/NCBI
|
|
49
|
Lowman XH, Hanse EA, Yang Y, Ishak Gabra
MB, Tran TQ, Li H and Kong M: p53 promotes cancer cell adaptation
to glutamine deprivation by upregulating Slc7a3 to increase
arginine uptake. Cell Rep. 26:3051–3060.e3054. 2019. View Article : Google Scholar :
|
|
50
|
Jiang W, He T, Liu S, Zheng Y, Xiang L,
Pei X, Wang Z and Yang H: The PIK3CA E542K and E545K mutations
promote glycolysis and proliferation via induction of the
β-catenin/SIRT3 signaling pathway in cervical cancer. J Hematol
Oncol. 11:1392018. View Article : Google Scholar
|
|
51
|
André F, Ciruelos E, Rubovszky G, Campone
M, Loibl S, Rugo HS, Iwata H, Conte P, Mayer IA, Kaufman B, et al:
Alpelisib for PIK3CA-mutated, hormone receptor-positive advanced
breast cancer. N Engl J Med. 380:1929–1940. 2019. View Article : Google Scholar
|
|
52
|
Juric D, Janku F, Rodón J, Burris HA,
Mayer IA, Schuler M, Seggewiss-Bernhardt R, Gil-Martin M, Middleton
MR, Baselga J, et al: Alpelisib plus fulvestrant in PIK3CA-altered
and PIK3CA-wild-type estrogen receptor-positive advanced breast
cancer: A phase 1b clinical trial. JAMA Oncol. 5:e1844752019.
View Article : Google Scholar
|
|
53
|
Konstantinopoulos PA, Barry WT, Birrer M,
Westin SN, Cadoo KA, Shapiro GI, Mayer EL, O'Cearbhaill RE, Coleman
RL, Kochupurakkal B, et al: Olaparib and α-specific PI3K inhibitor
alpelisib for patients with epithelial ovarian cancer: A
dose-escalation and dose-expansion phase 1b trial. Lancet Oncol.
20:570–580. 2019. View Article : Google Scholar : PubMed/NCBI
|