Introduction
Pancreatic cancer is highly lethal with a poor
prognosis, and no established sensitive markers for recurrence and
survival. The overall 5-year survival rate is only 10% and
increases to only 20% even after curative surgery; therefore,
pancreatic cancer is considered one of the most fatal diseases
(1-3). Large-scale genome analyses using
next-generation sequencing (NGS) have been performed for pancreatic
cancer (4) and subsequent
transcriptome analyses have classified several RNA signatures
(5,6).
Although recent technological developments have
reduced the cost of gene research examination, such as gene
sequencing, the economic costs and the time required for evaluation
of the genetic information of each patient remain topics of debate.
The field of radiogenomics has developed to evaluate genomic
mutations and gene expression changes based on inexpensive and
non-invasive general image data (radiomics); this field is
currently attracting attention (7,8).
Images, such as those obtained by computed
tomography (CT) and magnetic resonance imaging (MRI), are composed
of quantitative digital data that are originally a collection of
numerical values. The digital information obtained by such images
can be quantified using mathematical methods by considering an
image as a matrix of numbers. These quantitative values are called
image features (IFs), and the field of study that deals with
various IFs is called radiomics (9). Radiogenomics is expected to further
facilitate the construction of models for predicting tumor
molecular profiles by combining genomics techniques with
radiomics-based analysis of image phenotypes, thereby allowing
non-invasive, easy and inexpensive predictions.
The present study aimed to conduct a comprehensive
search for molecules showing prognostic value for pancreatic cancer
from the transcriptome, and to create a simple, inexpensive and
non-invasive predictive model using these molecules and diagnostic
imaging procedures commonly used for cancer treatment via
radiogenomics analysis. In pancreatic cancer, numerous studies have
comprehensively searched for factors associated with prognosis and
recurrence using NGS and immunostaining (4-6).
However, there are few reports that investigate the causal
relationship between the results of gene expression determined by
NGS and immunostaining; furthermore, there are few reports that
have constructed predictive models from clinical images, such as CT
images, in cases of pancreatic cancer (10). To the best of our knowledge, there
is no report of such a causal relationship with regard to integrin
αV (ITGAV); therefore, this was the subject of the present study.
To the best of our knowledge, no previous studies on various types
of cancer have predicted the expression of ITGAV from CT images
using radiogenomics analysis.
Materials and methods
Study population criteria
A total of 143 patients were pathologically
diagnosed with pancreatic cancer between January 2013 and March
2018 at Chiba Cancer Center following surgery. The average age of
these patients was 68.7 years (46-87 years), 85 were men and 58
were women. Of these, patients who received preoperative
chemotherapy, preoperative radiotherapy or preoperative
chemoradiotherapy, or those that exhibited metastases to other
organs were excluded. in addition, patients with cancer in other
organs were excluded. Of the 143 patients, 107 satisfied the
aforementioned conditions. Samples were retrospectively collected,
and -fixed paraffin-embedded (FFPE) specimens were used in
immunostaining, and frozen samples were used in RNA-seq in the
present study. Of these cases, total RNA was extracted from a total
of 15 cases, including six specimens that were collected
intraoperatively and promptly frozen and nine frozen specimens
stored in the biobank of Chiba Cancer Center, and comprehensively
analyzed by NGS. The present study was approved by the Chiba Cancer
Center Review Board (approval no. H29-006) and all patients
provided written informed consent.
RNA-sequencing (RNA-seq)
Total RNA was isolated from frozen tissue blocks
containing 50-100 mg pancreatic ductal adenocarcinoma (PDAC)
tissues or adjacent normal tissue. RNA was extracted using the
miRNeasy Mini kit (cat. no. 217004; Qiagen, Inc.). The
concentration of RNA was quantified using a NanoDrop system
(NanoDrop; Thermo Fisher Scientific, Inc.). The quality of
sufficiently concentrated samples was verified using the Agilent
RNA 6000 Nano Kit (cat. no. 5067-1511; Agilent Technologies, Inc.).
Samples with an RNA integrity number (RIN) value of ≥7.0 were used
for RNA-seq. The loading concentration of the final library was
measured using the Agilent High Sensitivity DNA kit (cat. no.
5067-4626; Agilent Technologies, Inc.) and Agilent 2100 Bioanalyzer
(Agilent Technologies, Inc.), and was 6 pM for RNA-seq. The library
was built for NGS using Ion Total RNA-Seq kit v2 (cat. no. 4475936;
Thermo Fisher Scientific, Inc.) and Ion Xpress™ RNA-Seq Barcode,
cat. no. 4475485; Thermo Fisher Scientific. Inc.). RNA-seq was
performed with an Ion Proton ™ instrument (Thermo Fisher
Scientific, Inc.). Sequencing data were mapped by Subread
(http://subread.sourceforge.net/) to the
hg19 reference genome. Differential expression levels were
estimated by linear modeling based on LIMMA, a method of generating
linear models for microarray data (11). Genes with a P-value of
≤1.0×10⁻⁴ were defined as differentially expressed genes
(DEGs). Upon initial DEG analysis, the relative expression
clustering profile patterns were assessed, and two pairs were
excluded from further analysis based on the close proximity in
expression patterns for the normal/tumor tissue pair with
multidimensional scaling. After excluding 2 pairs, subsequent gene
set enrichment analysis Gene Set Enrichment Analysis (GSEA;
https://www.gsea-msigdb.org/gsea/index.jsp) and
pathway analysis were performed using the Kyoto Encyclopedia of
Genes and Genomes (KEGG; https://www.genome.jp/kegg/kegg_ja.html). In addition,
protein-protein interactions for the DEGs were analyzed and
visualized using Cytoscape (ver. 3.8.1; https://cytoscape.org/) to identify the hub genes. The
R2: Genomics Analysis and Visualization Platform (https://hgserver1.amc.nl/cgi-bin/r2/main.cgi) with
expression and prognostic data (ID: PAAD; number of samples: 178)
from The Cancer Genome Atlas Program was used to pre-verify whether
these hub genes were associated with prognosis. Hub genes that
exhibited a significant association with worsening prognosis in R2
underwent immunostaining.
Immunohistochemical analysis
The protein expression levels of ITGAV were measured
by immunohistochemistry (IHC) using mouse monoclonal anti-human
ITGAV protein antibody (P2W7; cat. no. sc-9969; 1:100; Santa Cruz
Biotechnology, Inc.). Freshly removed pancreatic tissue samples
were immediately fixed in 10% formalin for at least 24 h at 24°C
and embedded in paraffin. Briefly, 5-µm sections were
obtained from FFPE tissues and underwent ITGAV staining with an
OptiView DAB IHC Detection Kit (cat. no. 760-700; Roche
Diagnostics) and a VENTANA BenchMark ULTRA automated slide stainer
(Roche Diagnostics). A 3% hydrogen peroxide solution was used as
the blocking reagent, and the sample was treated for 4 min at 36°C.
Enzyme-induced antigen activation was performed using ISH Protease
1 (cat. no. 760-2018; Roche Diagnostics) for 32 min at 36°C, and
the ITGAV primary antibody was applied to the sample for 120 min at
36°C to reduce non-specific reactions and background staining.
According to the steps of the OptiView IHC Detection Kit,
hydroxyquinoxaline was applied for 8 min at 36°C and then
peroxidase-labeled anti-hydroxyquinoxylin mouse monoclonal antibody
was applied as a secondary antibody for 8 min at 36°C. Finally,
images were captured under a light microscope.
IHC results were scored based on the percentage
positivity of staining. Two pathologists evaluated ITGAV protein
expression as the percentage of the stained tumor cells and the
stained area in the tumor interstitium. The staining intensity in
the tumor cells and interstitium was also evaluated. The expression
status of these proteins (low or high) was determined by the
percentage of tumor cells with any membrane staining, the staining
area of interstitium and the staining intensity.
IHC scoring of ITGAV and the related
definitions
Staining was usually observed in peripheral nerve
cells in pancreatic tissue, and the staining levels in these areas
were considered as controls. The percentage of tumor cells stained
was scored as follows: 0, 0%; 1, 0-≤20%; 2, >20-≤40%; 3,
>40-≤60%; 4, >60-≤80%; 5, >80%. The staining intensity of
tumor cells was also scored (0-3) as follows: 0, none; 1, intensity
lower than the control; 2, the same level as the control; 3,
intensity higher than the control. The two scores, the percentage
of stained tumor cells and the staining intensity of tumor cells,
were multiplied and ITGAV expression in tumor cells was scored.
Similarly, for tumor interstitial tissue, the proportion of
staining in the interstitial area was calculated as follows: 0, 0%;
1, 0-≤20%; 2, >20-≤40%; 3, >40-≤60%; 4, >60-≤80%; 5,
>80%. Staining intensity for the interstitial area was scored in
the same manner as that for tumor cells. The two scores were then
multiplied and to provide a score for ITGAV expression in the tumor
interstitial tissue.
Finally, the IHC expression score of ITGAV in tumor
tissues was calculated by adding the score in tumor cells to the
score in tumor interstitial tissue. A regression line was created
from this score using the least-squares method and RNA-seq
expression, and a value higher than the IHC expression score, which
corresponded to the median RNA expression, was regarded as high
expression. Spearman's correlation coefficient analysis was used to
examine the correlation between IHC expression scores and RNA-seq
expression.
Statistical analysis
Continuous variables such as age were divided into
two groups by median. The significant difference between ITGAV
expression, and clinical and pathological variables was assessed
using the χ2 test, Fisher's exact test or Mann-Whitney U
test. Overall survival (OS) was defined as the period between
surgery and final observation (in days). Disease-free survival
(DFS) was defined as the period between surgery and recurrence. A
survival curve was prepared using the Kaplan-Meier method and the
log-rank test was used to assess significant differences.
Multivariate analysis was performed using the Cox regression model
to determine significant factors in the log-rank test. P<0.05
was considered to indicate a statistically significant difference.
These statistical analyses were conducted using JMP version 15.2.1
(SAS Institute, Inc.)
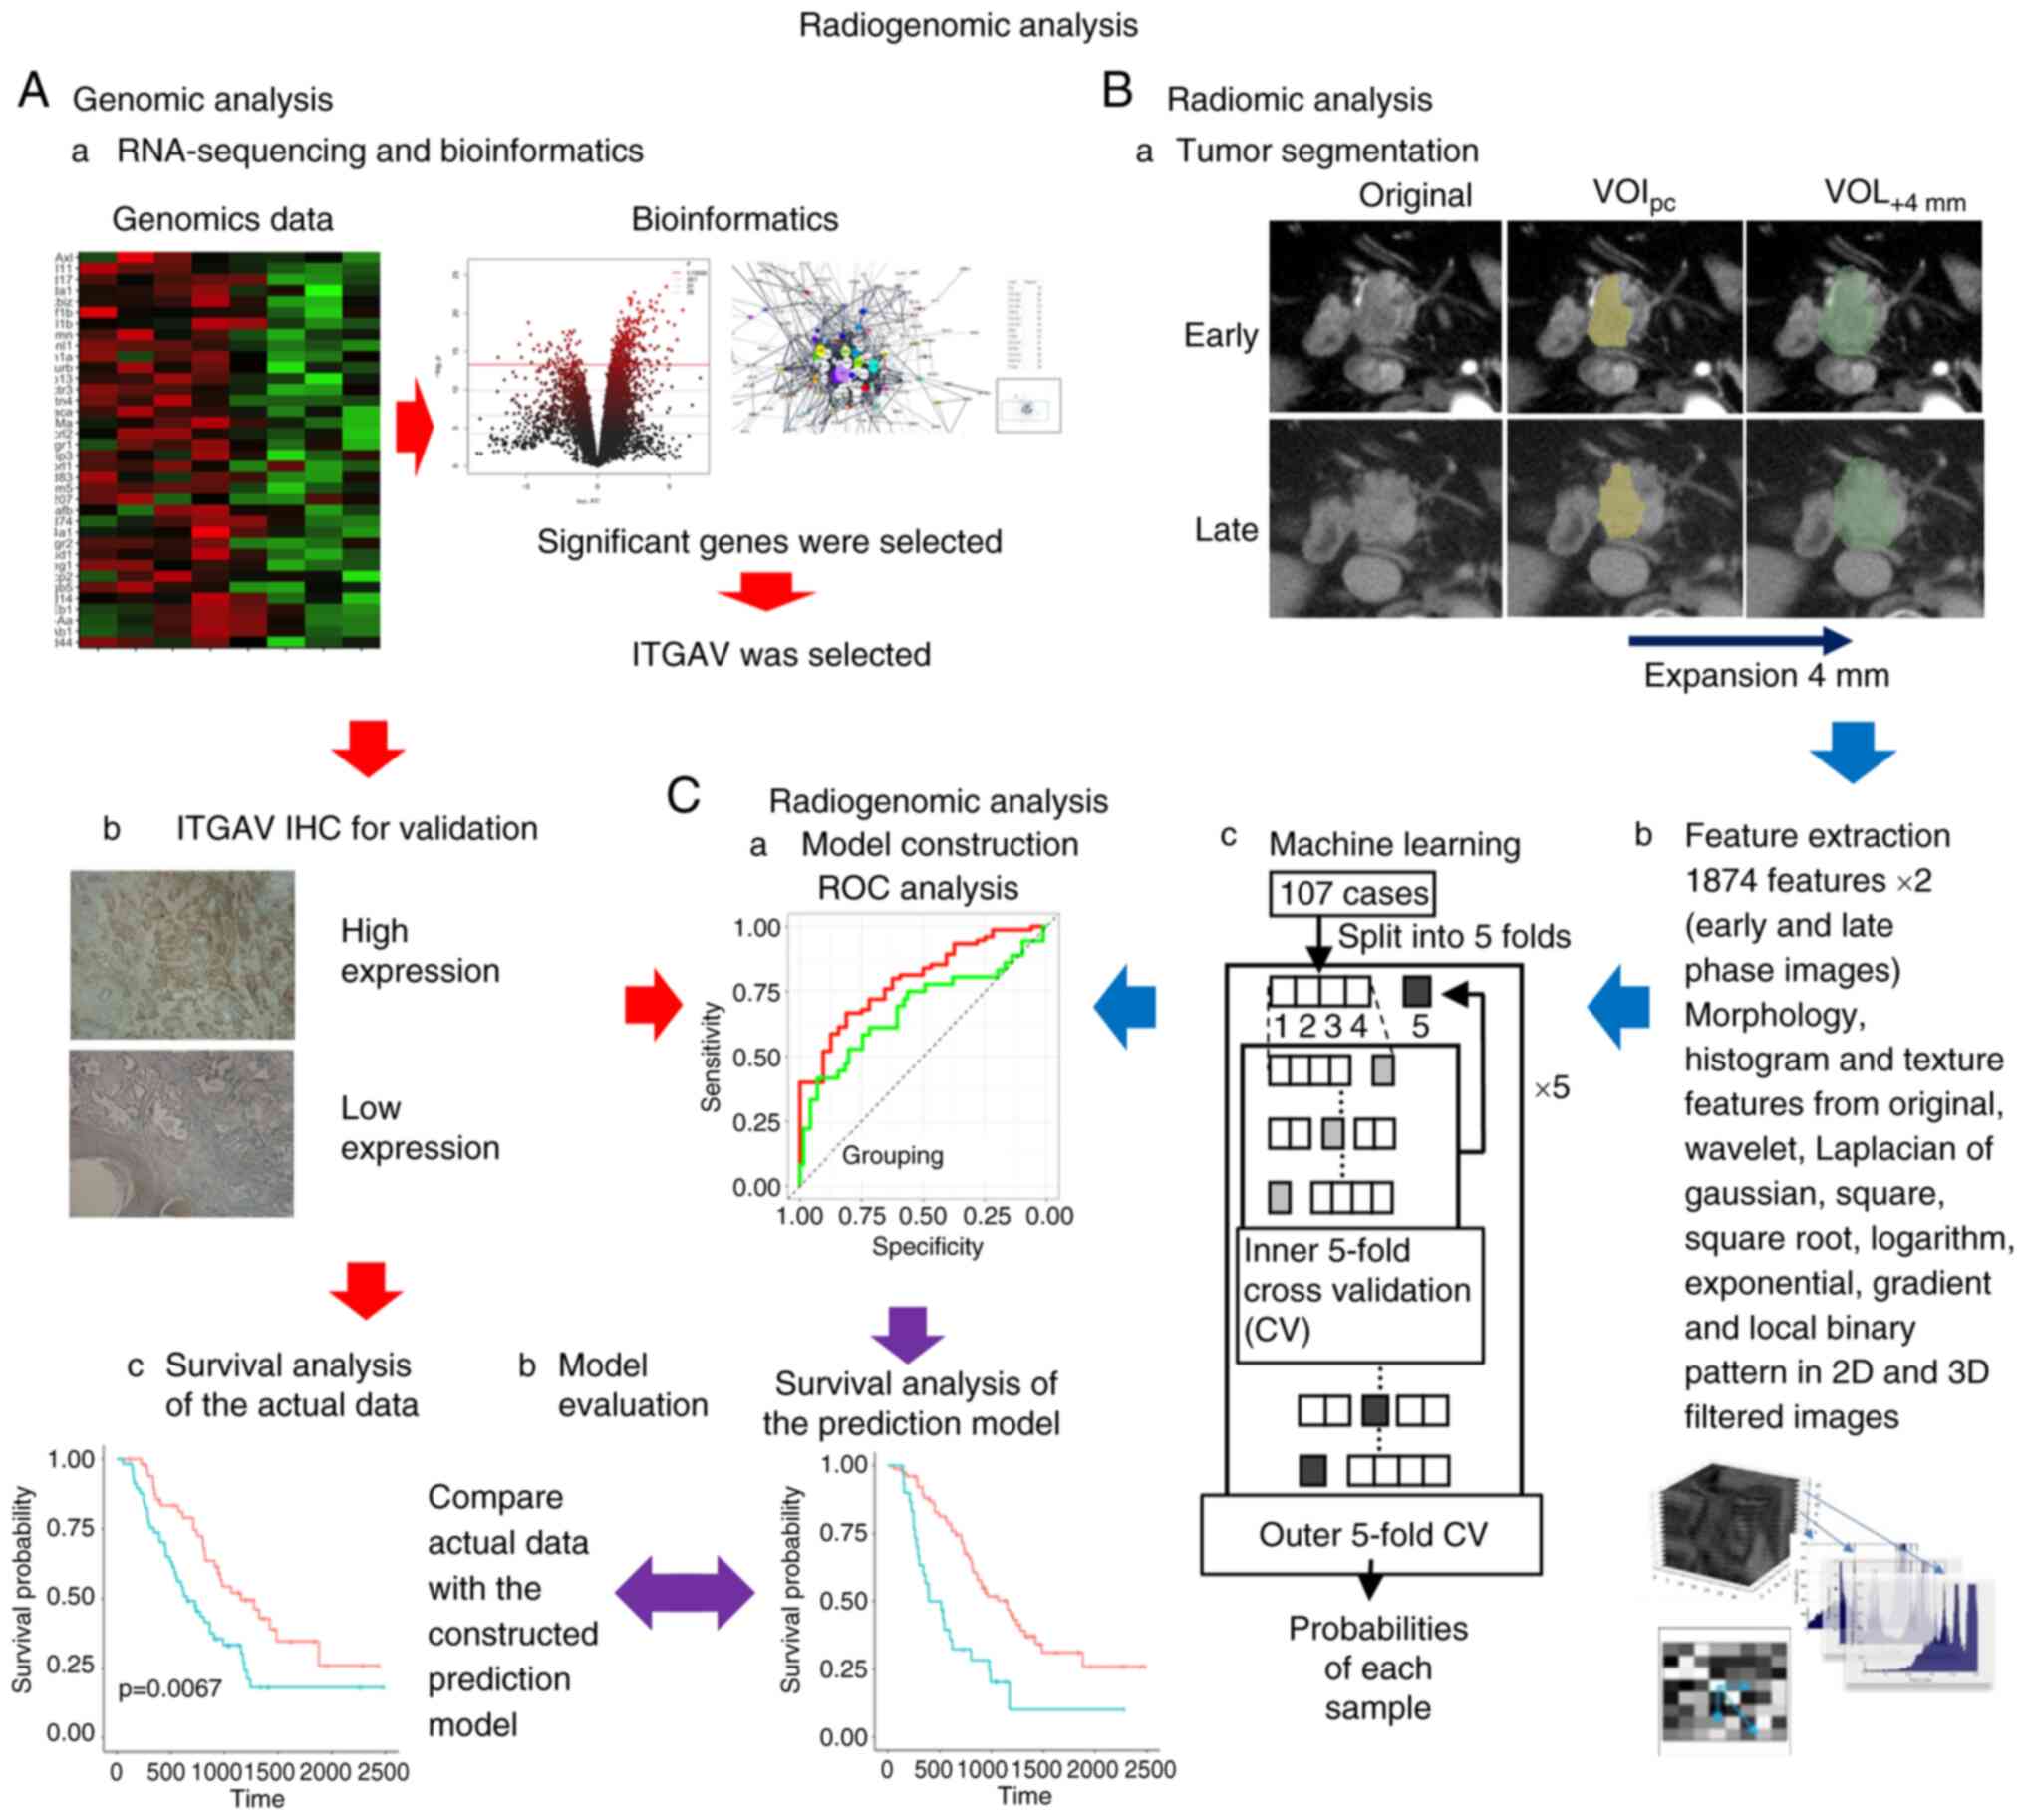
CT acquisition and tumor
segmentation
CT scans were performed under the same conditions as
our previous study, and a radiologist and a surgeon delineated the
volume of interest-pancreatic cancer (VOIpc) (12). Subsequently, VOI+4 mm
was created by mechanically expanding the axial plane by 4 mm
around each VOIpc.
IF extraction and machine learning
IFs were extracted using the same protocol as that
described in our previous study; the morphology, histogram and
texture features were calculated from the original images (12). In addition, the same types of
features were extracted from the original wavelet, Laplacian of
Gaussian, square, square root, logarithm, exponential, gradient,
and local binary patterns in 2D- and 3D-filtered images. Finally,
3,748 (1,874×2) features were extracted from each VOI for early-
and late-phase images. Feature selection consisted of two steps to
stabilize the predictive power of the model. Firstly, Student's
t-tests were performed on each IF, and only features with
significant differences were retained, and another feature
selection with recursive feature elimination was performed using a
random forest function. Secondly, these IFs were input into extreme
gradient boosting (XGBoost) to construct the predictive model for
ITGAV. The feature selection and model construction steps were
performed using nested cross-validation. Inner cross-validation for
feature selection and outer cross-validation for model construction
were five-fold. The probability of each sample was used for
receiver operating characteristic (ROC) analysis. A ROC plot was
created and the area under the curve (AUC) was calculated to
evaluate the survival prediction of the machine learning models.
The predicted status of ITGAV (high/low) was calculated using the
predictive model and quantified in the range 0 to 1. These were
arranged in descending order, divided into two groups near the
actual ITGAV positive rate, the log-rank test was performed and
several P-values were calculated; of these, the lowest P-value that
would contribute most to survival and recurrence was adopted. All
statistical analyses and machine learning were conducted using R
version 3.5.1 (R Foundation for Statistical Computing) (Fig. 1).
Results
Patient background
Between January 2013 and March 2018, a total of 143
patients were pathologically diagnosed with PDAC following surgery.
Among of them, 119 patients underwent surgery without preoperative
chemotherapy or radiation therapy, and were diagnosed with
pancreatic cancer by postoperative pathological diagnosis. A total
of 12 patients presented with cancer in other organs or with
metastasis to other organs and were therefore excluded. As a
result, a total of 107 cases were included in the present
retrospective study. Specimens were available for a total of 15
patients. The Biobank provided frozen specimens for nine patients:
Five cancer tissue specimens, and four matched cancer and normal
tissue specimens. In addition, specimens for six other cases were
obtained during the operation. The present study attempted to
extract RNA from 10 pairs of cancerous and normal tissues, and five
cancer tissues alone. Of the remaining 10 pairs, seven pairs passed
the quality check with a RIN value of ≥7.0, whereas two pairs
showed RIN values of ≥7.0 for the cancer tissue only. All five
cases in which only cancer tissues were collected exhibited RIN
values of ≥7.0. These cases underwent sequencing by NGS.
Furthermore, the pairs of cancerous and normal tissues were
evaluated on a multidimensional scale to assess whether they were
valid. It was detected that one pair was likely to have been
extracted only from cancerous tissue and another pair was likely to
have been extracted only from normal tissue; therefore, two pairs
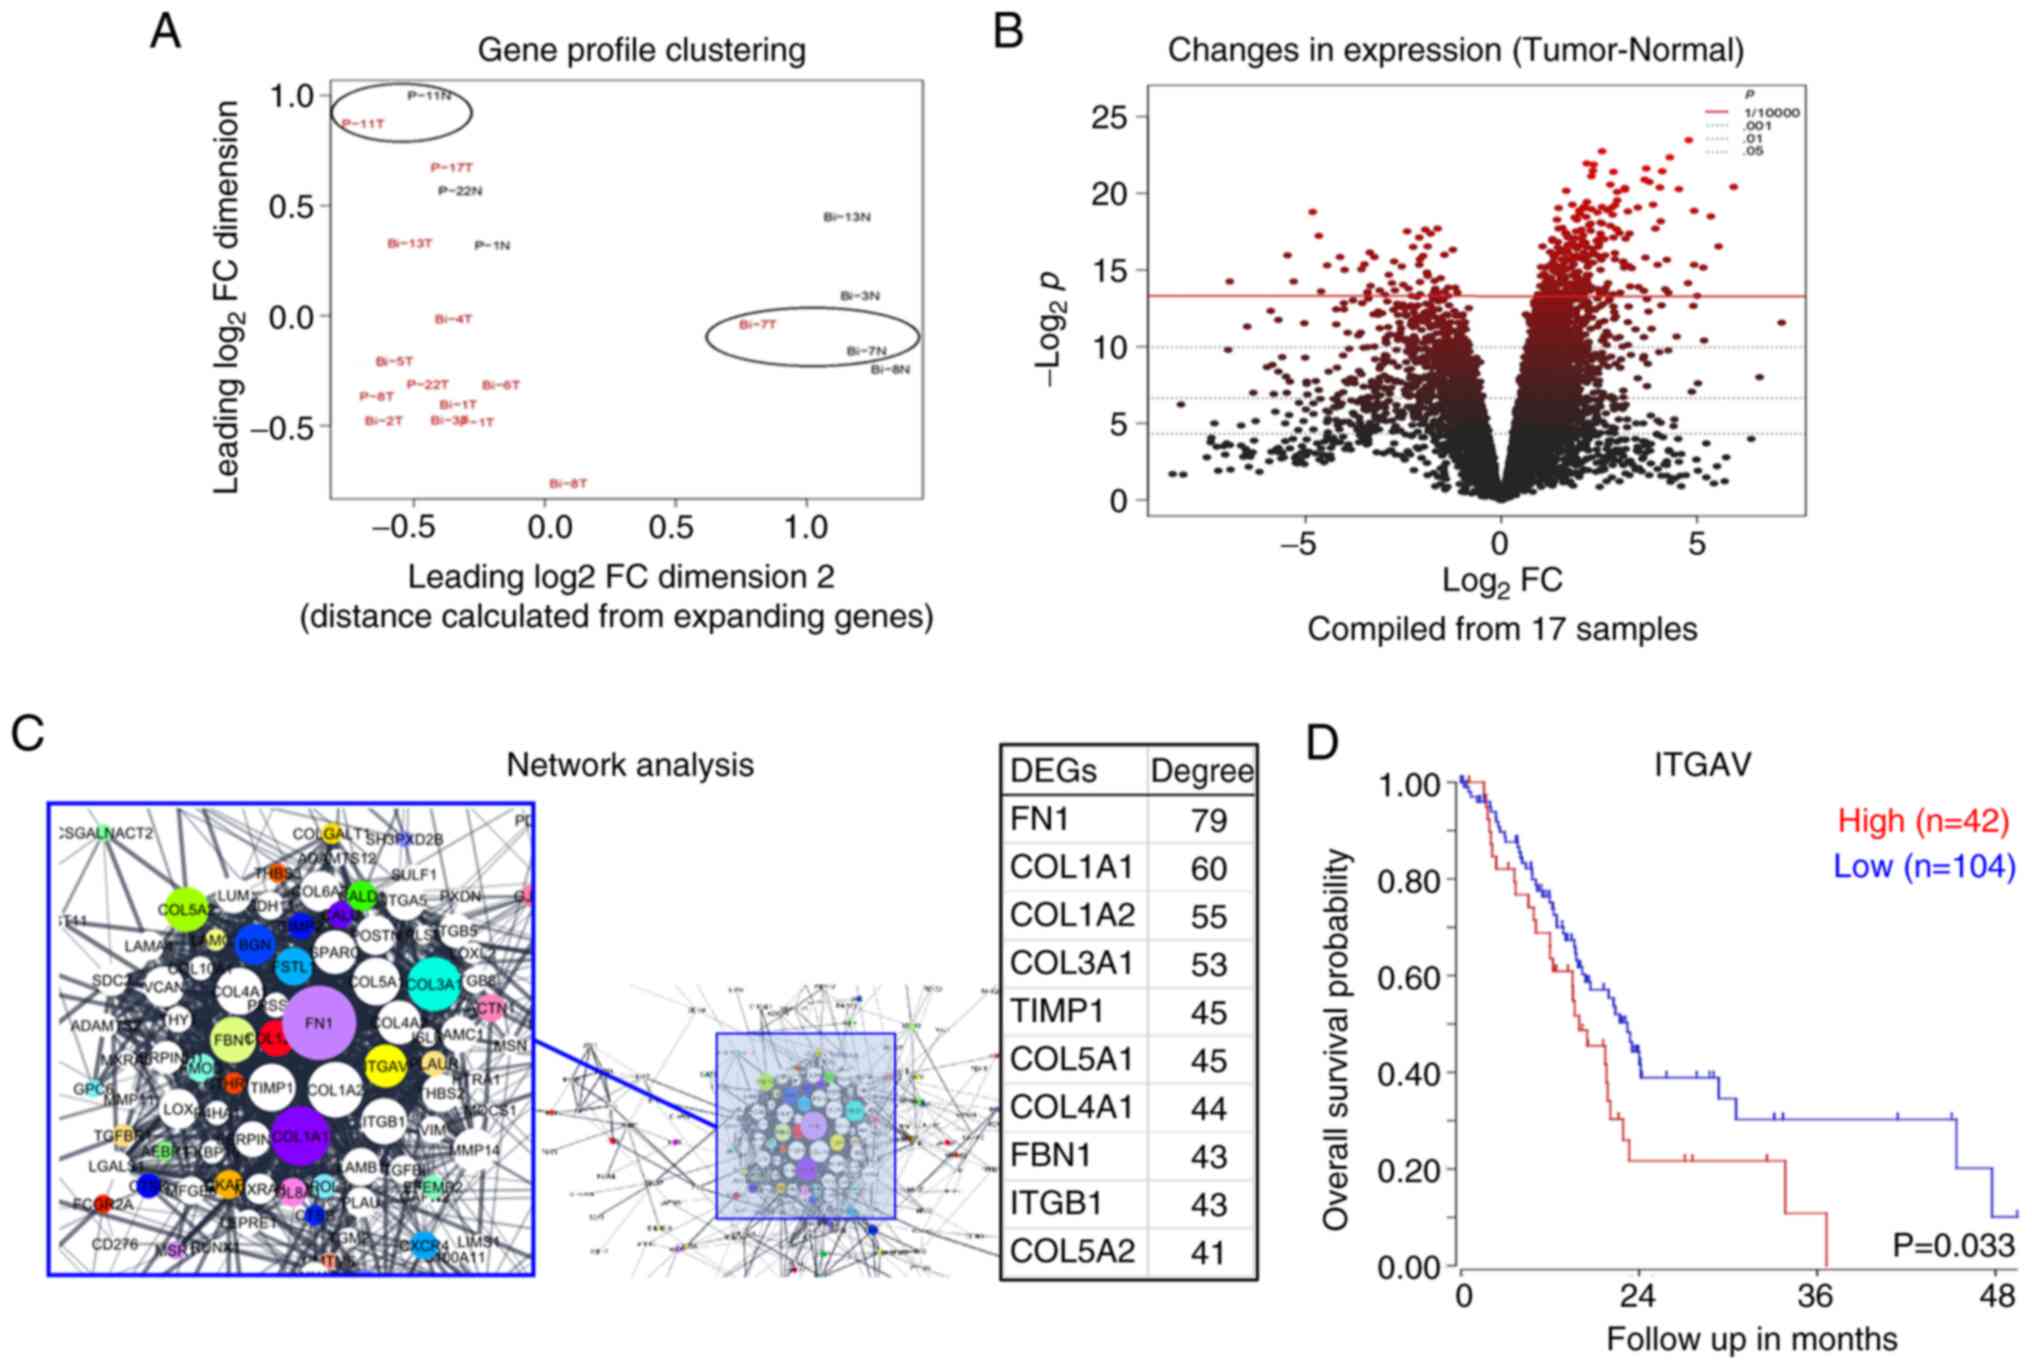
were excluded (Fig. 2A). Finally,
a total of 17 samples from 12 patients, including five pairs and
seven cancer tissue samples, were available and analyzed for
comprehensive total RNA bioinformatics analysis. RNA-seq analysis
results were verified by IHC using the aforementioned 107 cases.
The observation period was between January 2013 and July 2020, with
a median of 804 days (58-2,481 days). The median age was 70 years
(50-87 years) and the male-to-female ratio was 60:47 (Table I).
 | Table IClinicopathological parameters and
ITGAV status, as determined by immunohistochemistry. |
Table I
Clinicopathological parameters and
ITGAV status, as determined by immunohistochemistry.
| Characteristic | ITGAV status
| P-value |
|---|
| Low, n (%) | High, n (%) |
|---|
| Sex | | | 0.353a |
| Male | 48 (44.9%) | 12 (11.2%) | |
| Female | 34 (31.8%) | 13 (12.1%) | |
| Age, yearsd | 69.5 (51-87) | 71 (50-80) | 0.777b |
| Preoperative CEA,
ng/mld | 3.25
(0.5-28.5) | 3.4 (0.8-47.3) | 0.779b |
| Preoperative
CA19-9, U/mld | 104.01
(0-47,588.2) | 247.85
(0-31,800.7) | 0.100b |
| Operation type | | | 0.690c |
|
Pancreatoduodenectomy | 55 (51.4%) | 15 (14.0%) | |
| Distal
pancreatectomy | 25 (23.4%) | 10 (9.3%) | |
| Total
pancreatectomy | 2 (1.9%) | 0 (0.0%) | |
| Cytology | | | 0.621a |
| Negative | 72 (67.3%) | 21 (19.6%) | |
| Positive | 10 (9.3%) | 4 (3.7%) | |
| Margin status | | | 0.100c |
| R0 | 68 (63.6%) | 21 (19.6%) | |
| R1 | 12 (11.2%) | 4 (3.7%) | |
| R2 | 2 (1.9%) | 0 (0.0%) | |
|
Differentiation | | | 0.495c |
| Well | 37 (34.6%) | 9 (8.4%) | |
| Moderate | 38 (35.5%) | 15 (14.0%) | |
| Poor | 7 (6.5%) | 1 (0.9%) | |
| Interstitium
type | | | 0.532c |
| Medullary | 1 (0.9%) | 0 (0.0%) | |
| Intermediate | 76 (71.0%) | 22 (20.6%) | |
| Scirrhous | 5 (4.7%) | 3 (2.8%) | |
| Lymphatic
invasion | | | 0.690a |
| Negative | 23 (21.5%) | 6 (5.6%) | |
| Positive | 59 (55.1%) | 19 (17.8%) | |
| Vascular
invasion | | | 0.579a |
| Negative | 1 (0.9%) | 0 (0.0%) | |
| Positive | 81 (75.7%) | 25 (23.4%) | |
| Neural
invasion | | | 0.690a |
| Negative | 5 (4.7%) | 1 (0.9%) | |
| Positive | 77 (72.0%) | 24 (22.4%) | |
| Lymph node
metastasis | | | 0.259a |
| Negative | 26 (24.3%) | 5 (4.7%) | |
| Positive | 56 (52.3%) | 20 (18.7%) | |
| Max diameter,
cmd | 3.0 (1.0-10.0) | 3.5 (1.3-7.0) | 0.055b |
| Postoperative
adjuvant chemotherapy | | | 0.374a |
| Yes | 19 (17.8%) | 8 (7.5%) | |
| No | 63 (58.9%) | 17 (15.9%) | |
| pT (UICC) 8th | | | 0.023c |
| T1 | 18 (16.8%) | 1 (0.9%) | |
| T2 | 47 (43.9%) | 13 (12.1%) | |
| T3 | 17 (15.9%) | 11 (10.3%) | |
| pStage (UICC
8th) | | | 0.210c |
| IA | 12 (11.2%) | 0 (0.0%) | |
| IB | 10 (9.3%) | 4 (3.7%) | |
| IIA | 4 (3.7%) | 1 (0.9%) | |
| IIB | 29 (27.1%) | 8 (7.5%) | |
| III | 27 (25.2%) | 23 (21.5%) | |
RNA-seq
The expression levels were analyzed by mapping
11,272 mRNAs, and the number of DEGs whose expression fluctuated in
cancer tissues in comparison with adjacent normal tissues was 314
(Fig. 2B). When these genes were
analyzed by the KEGG pathway using GSEA, significant pathways
included ECM-receptor interaction, focal adhesion, protein
digestion, etc. (Table SI). When
the degree of centrality in DEGs was calculated, the top 10 were
examined to determine the relationship between gene expression and
prognosis using the R2 platform, as follows: FN1 (P=0.147), COL1A1
(P=0.098), COL1A2 (P=0.174), COL3A1 (P=0.206), COL5A1 (P=0.158),
TIMP1 (P=0.041), COL4A1 (P=0.086), ITGB1 (P=0.036), FBN1 (P=0.131),
COL5A2 (P=0.220), COL4A2 (P=0.121), SPARC (P=0.107), ITGAV
(P=0.033) and MMP14 (P=0.093) (Fig.
2C). Of these, COL1A1, COL1A2, COL4A1, ITGB1, COL4A2 and ITGAV
were mapped to the ECM-receptor interaction pathway. Of these
mapped DEGs, high expression of ITGAV was significantly associated
with poor prognosis (P=0.033, R2 platform; Fig. 2D); therefore, the
clinicopathological significance of the ITGAV high expression group
was verified by immunostaining.
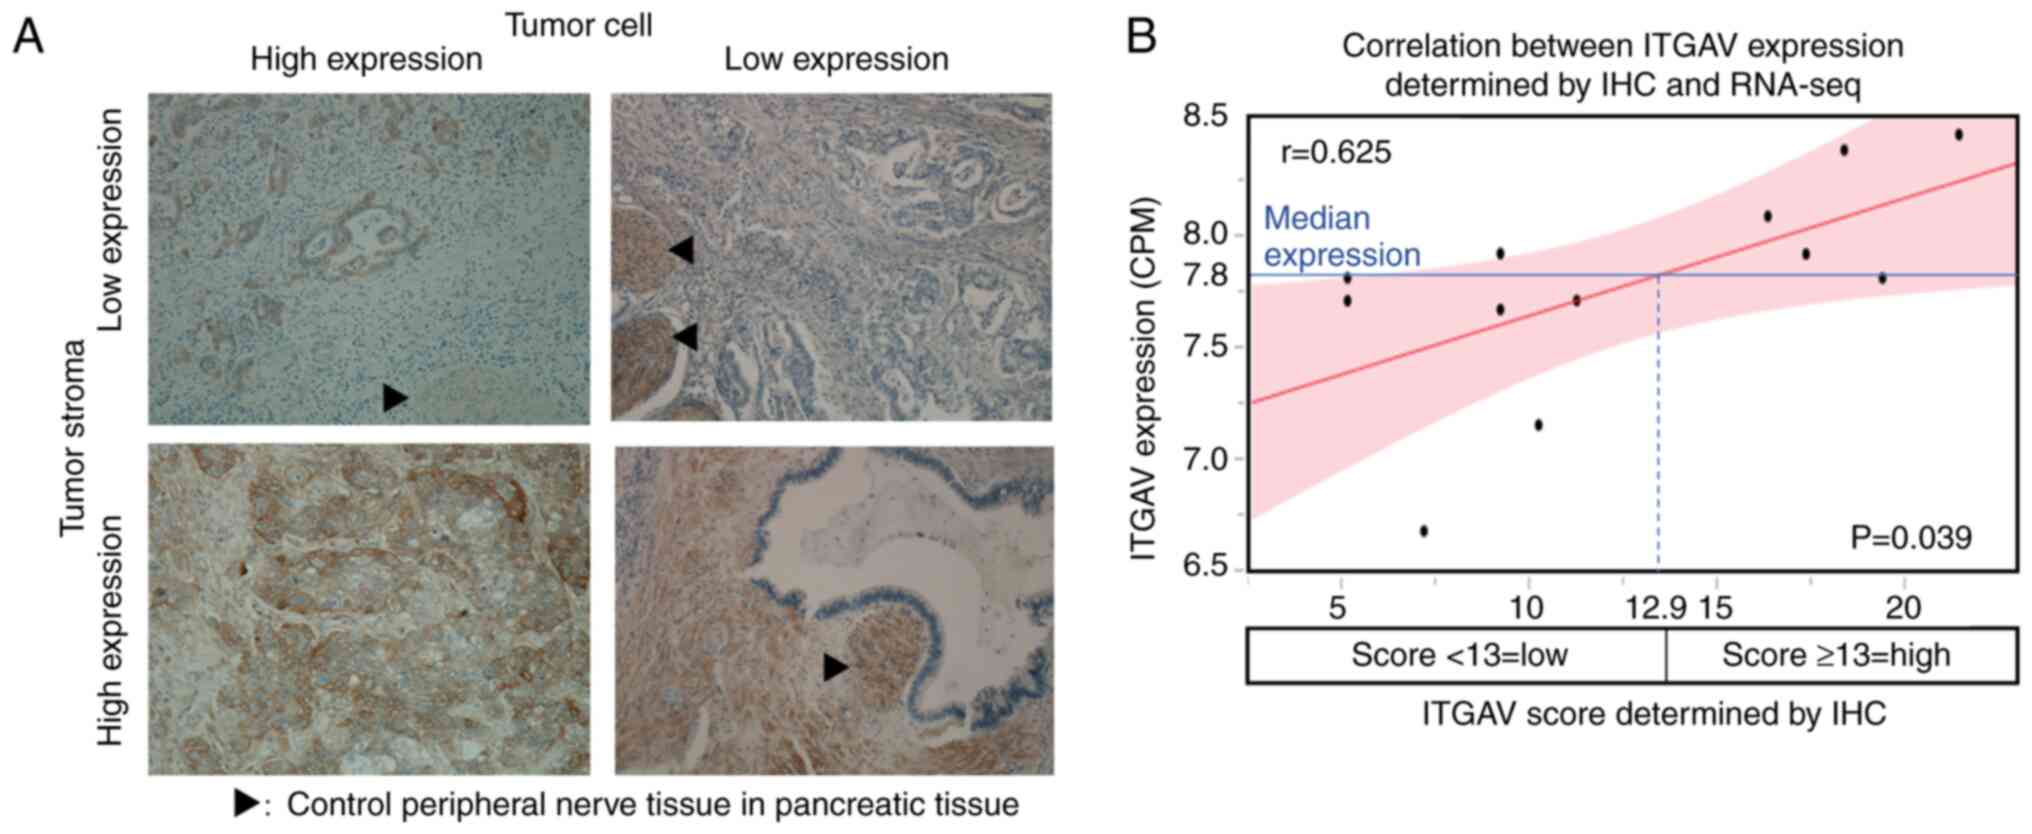
ITGAV IHC scoring
For ITGAV, tumor cells had an IHC score of 0-18
(median, 8), tumor interstitial tissue had an IHC score of 0-15
(median, 0), and tumor tissue as a whole had an IHC score of 0-32
(median, 9) (Fig. 3A).
Correlation between IHC scoring and
RNA-seq
With regard to ITGAV, there was a correlation
between RNA-seq expression levels and tumor cell IHC scores, but
there was no significant difference (r=0.544, ρ=0.502, P=0.096).
Similarly, no significant correlation between RNA-seq expression
levels and IHC scores was found in the interstitial tissue.
However, there was a significant correlation between RNA-seq
expression levels and IHC scores in the tumor tissue as a whole
(r=0.625, ρ=0.600, P=0.039). According to the regression line, the
IHC score which corresponded to the median RNA-seq expression level
was 12.9; therefore, the optimal IHC score corresponding to the
high expression of ITGAV by RNA sequencing was set to 13 (Fig. 3B).
Association between IHC status and
clinicopathological factors
High ITGAV expression was observed in 25 cases
(23.4%). No significant association was identified between ITGAV
and sex or age (cutoff by median value, 70 years; range, 50-87
years). The high ITGAV expression group tended to have a larger
tumor diameter (cutoff by median value, 3.3 cm; range, 1.0-11.6 cm)
and contained significantly more T2 and T3 cases (P=0.055 and
0.023, respectively). Other clinicopathological factors, such as
preoperative tumor markers (CEA; cutoff by median value, 3.3 ng/ml;
range, 0.5-47.3 ng/ml; and CA19-9; cutoff by median value, 137.4
U/ml; range, 0-47,588.2 U/ml) and lymph node metastases exhibited
no significant differences (Table
I).
Relationship between clinicopathological
factors and prognosis
The presence of the tumor marker CA19-9 was
associated with a significantly worse OS and DFS. Similarly,
positive nerve infiltration, tumor diameter, T factor and lymph
node metastasis also worsened OS and DFS. In addition, surgical
procedure, operation time, bleeding volume, vascular infiltration,
and postoperative adjuvant chemotherapy group were significantly
associated with OS, and the histological type and lymphatic vessel
infiltration were associated with DFS (Table II).
| Table IIUnivariate analysis of prognostic
factors for OS and DFS. |
Table II
Univariate analysis of prognostic
factors for OS and DFS.
| Variable | No. of patients
(%) | Univariate analysis
for OS
| Univariate analysis
for DFS
|
|---|
| Median, days (95%
confidence interval) | Log-rank
P-value | Median, days (95%
confidence interval) | Log-rank
P-value |
|---|
| Sex | | | 0.527 | | 0.760 |
| Male | 60 (56.1) | 864
(622-1,065) | | 391 (260-575) | |
| Female | 47 (43.9) | 990
(494-1,324) | | 356 (223-498) | |
| Age, years | | | 0.299 | | 0.949 |
| ≤70 | 55 (51.4) | 1,155
(730-1,276) | | 408 (282-561) | |
| >70 | 52 (48.6) | 804 (515-963) | | 277 (247-458) | |
| Preoperative CEA,
ng/ml | | | 0.110 | | 0.400 |
| ≤3.3 | 54 (50.0) | 1,156
(730-1,324) | | 402 (279-737) | |
| >3.3 | 53 (50.0) | 804 (572-911) | | 302 (225-458) | |
| Preoperative
CA-19-9, U/ml | | | 0.003 | | <0.001 |
| ≤137.4 | 54 (50.0) | 1,175
(817-1,487) | | 594 (373-777) | |
| >137.4 | 53 (50.0) | 572 (393-866) | | 252 (164-306) | |
| Operation type | | | 0.007 | | 0.113 |
| PD | 70 (65.4) | 730 (534-942) | | 307 (256-455) | |
| DP/TP | 37 (34.6) | 1,324 (864-NA) | | 458 (263-832) | |
| Operation time,
min | | | 0.003 | | 0.087 |
| ≤311 | 55 (51.4) | 1,175
(817-1,512) | | 428 (298-641) | |
| >311 | 52 (48.6) | 711 (515-911) | | 280 (243-498) | |
| Bleeding volume,
ml | | | 0.043 | | 0.123 |
| ≤600 | 54 (50.5) | 1,065
(746-1,512) | | 407 (282-575) | |
| >600 | 53 (49.5) | 777 (560-990) | | 280 (243-498) | |
| Cytology | | | 0.159 | | 0.056 |
| Negative | 91 (88.3) | 905
(746-1,175) | | 395 (298-526) | |
| Positive | 12 (11.7) | 454 (251-NA) | | 208 (106-484) | |
| Margin status | | | 0.612 | | 0.117 |
| R0 | 86 (83.5) | 864
(711-1,175) | | 356 (268-498) | |
| R1/R2 | 17 (16.5) | 866
(455-1,212) | | 380 (135-575) | |
|
Differentiation | | | 0.055 | | 0.035 |
| Well | 47 (43.9) | 1,187
(800-1,512) | | 498 (282-839) | |
| Moderate/Poor | 60 (56.1) | 777 (534-963) | | 298 (243-408) | |
| Lymphatic
invasion | | | 0.122 | | 0.001 |
| Negative | 29 (28.0) | 1,243
(746-1,881) | | 746 (282-NA) | |
| Positive | 78 (72.0) | 817 (615-979) | | 304 (253-408) | |
| Neural
invasion | | | 0.022 | | 0.020 |
| Negative | 6 (6.5) | NA (1,175-NA) | | NA (280-NA) | |
| Positive | 101 (93.5) | 817 (656-990) | | 356 (263-458) | |
| Vascular
invasion | | | 0.039 | | 0.147 |
| Negative
(v0/1) | 21 (19.6) | 1,512 (560-NA) | | 455
(279-1,064) | |
| Positive
(v2/3) | 85 (80.4) | 823 (711-990) | | 356 (256-484) | |
| Interstitium
type | | | 0.223 | | 0.807 |
| Int | 98 (91.6) | 905
(735-1,156) | | 360 (279-484) | |
| Med + Sci | 9 (8.4) | 396
(248-1,881) | | 209 (57-NA) | |
| Max diameter,
cm | | | 0.033 | | 0.003 |
| ≤3.3 | 57 (50.0) | 1,155
(804-1,324) | | 561 (312-777) | |
| >3.3 | 50 (50.0) | 711 (454-866) | | 263 (160-356) | |
| Lymph node
metastasis | | | <0.001 | | <0.001 |
| Negative | 31 (29.0) | 1,512 (990-NA) | | 962 (455-NA) | |
| Positive | 76 (71.0) | 735 (534-866) | | 271 (209-373) | |
| T factor (UICC
8th) | | | 0.010 | | 0.024 |
| T1/2 | 79 (76.7) | 990
(804-1,276) | | 455 (302-641) | |
| T3 | 28 (26.2) | 541 (304-864) | | 217 (144-343) | |
| Postoperative
adjuvant chemotherapy | | | 0.045 | | 0.143 |
| Yes | 80 (74.8) | 942
(804-1,243) | | 395 (298-526) | |
| No | 27 (25.2) | 599 (248-963) | | 225 (106-455) | |
| Stage (UICC
8th) | | | <0.001a | | <0.001a |
| IA | 12 (11.2) | | | | |
| IB | 14 (13.1) | | | | |
| IIA | 5 (4.7) | | | | |
| IIB | 37 (34.6) | 1,187 [817-1,487 (I
and II)] | | 498 [312-764 (I and
II)] | |
| III | 39 (36.4) | 560 [362-823
(III)] | | 256 [160-386
(III)] | |
| ITGAV status | | | 0.005 | | 0.003 |
| Low | 82 (76.6) | 1,065
(813-1,243) | | 441 (306-641) | |
| High | 25 (23.4) | 534 (287-804) | | 206 (119-302) | |
Relationship between ITGAV expression
status determined by IHC, prognosis and recurrence
The present study investigated the relationship
between prognosis and clinicopathological factors, including the
expression status of ITGAV. In the ITGAV high-expression group, the
prognosis was significantly worse alongside known prognostic
factors, such as lymph node metastasis, T factor and tumor markers.
Similar to lymph node metastasis, tumor diameter and tumor markers,
the ITGAV high-expression group also exhibited a significantly
worsened recurrence rate (Table
II).
Evaluation of prognosis and recurrence
predictors by multivariate analysis
Among the 10 significant factors for OS in
univariate analysis, tumor diameter was excluded because it has
almost the same meaning as factor T (The Union for International
Cancer Control; TNM Classification of Malignant Tumours, 8th
Edition) (13). Multivariate
analysis with the top seven of the 10 factors revealed that ITGAV,
preoperative CA-19-9, surgical procedure, nerve infiltration, T
factor and lymph node metastasis were independent prognostic
factors (Table III). Similarly,
multivariate analysis was performed on the eight significant
factors for DFS as determined by univariate analysis, and revealed
that ITGAV, neural invasion, T factor and lymph node metastasis
were independent recurrence factors (Table III).
| Table IIIMultivariate analysis of prognostic
factors for OS and DFS. |
Table III
Multivariate analysis of prognostic
factors for OS and DFS.
| Variable | OS
| DFS
|
|---|
| Hazard ratio | 95% confidence
interval | P-value | Hazard ratio | 95% confidence
interval | P-value |
|---|
| Preoperative
CA-19-9, U/ml | | | | | | |
| ≤137.4 (n=54) | 1 | | | 1 | | |
| >137.4
(n=53) | 1.761 | 1.065-2.932 | 0.028 | 1.717 | 0.981-3.020 | 0.058 |
| Operation type | | | | | | |
| PD (n=70) | 1 | | | | | |
| DP/TP (n=37) | 0.393 | 0.199-0.768 | 0.006 | NA | | |
| Operation time,
min | | | | | | |
| ≤311 (n=55) | 1 | | | | | |
| >311
(n=52) | 1.027 | 0.547-1.883 | 0.930 | NA | | |
|
Differentiation | | | | | | |
| Well (n=47) | | | | 1 | | |
| Moderate/Poor
(n=60) | NA | | | 1.273 | 0.770-2.409 | 0.303 |
| Lymphatic
invasion | | | | | | |
| Negative
(n=29) | | | | 1 | | |
| Positive
(n=78) | NA | | | 1.805 | 0.875-3.999 | 0.112 |
| Neural
invasion | | | | | | |
| Negative
(n=6) | 1 | | | 1 | | |
| Positive
(n=101) | 3.960 | 1.086-25.789 | 0.035 | 5.323 | 1.358-36.153 | 0.014 |
| Lymph node
metastasis | | | | | | |
| Negative
(n=31) | 1 | | | 1 | | |
| Positive
(n=76) | 2.694 | 1.464-5.254 | 0.001 | 3.015 | 1.560-4.760 | <0.001 |
| T factor (UICC
8th) | | | | | | |
| T1/2 (n=79) | 1 | | | 1 | | |
| T3 (n-28) | 2.326 | 1.317-4.014 | 0.004 | 2.126 | 1.171-3.794 | 0.014 |
| ITGAV status | | | | | | |
| Low (n=82) | 1 | | | 1 | | |
| High (n=25) | 1.873 | 1.048-3.247 | 0.035 | 2.152 | 1.168-3.329 | 0.015 |
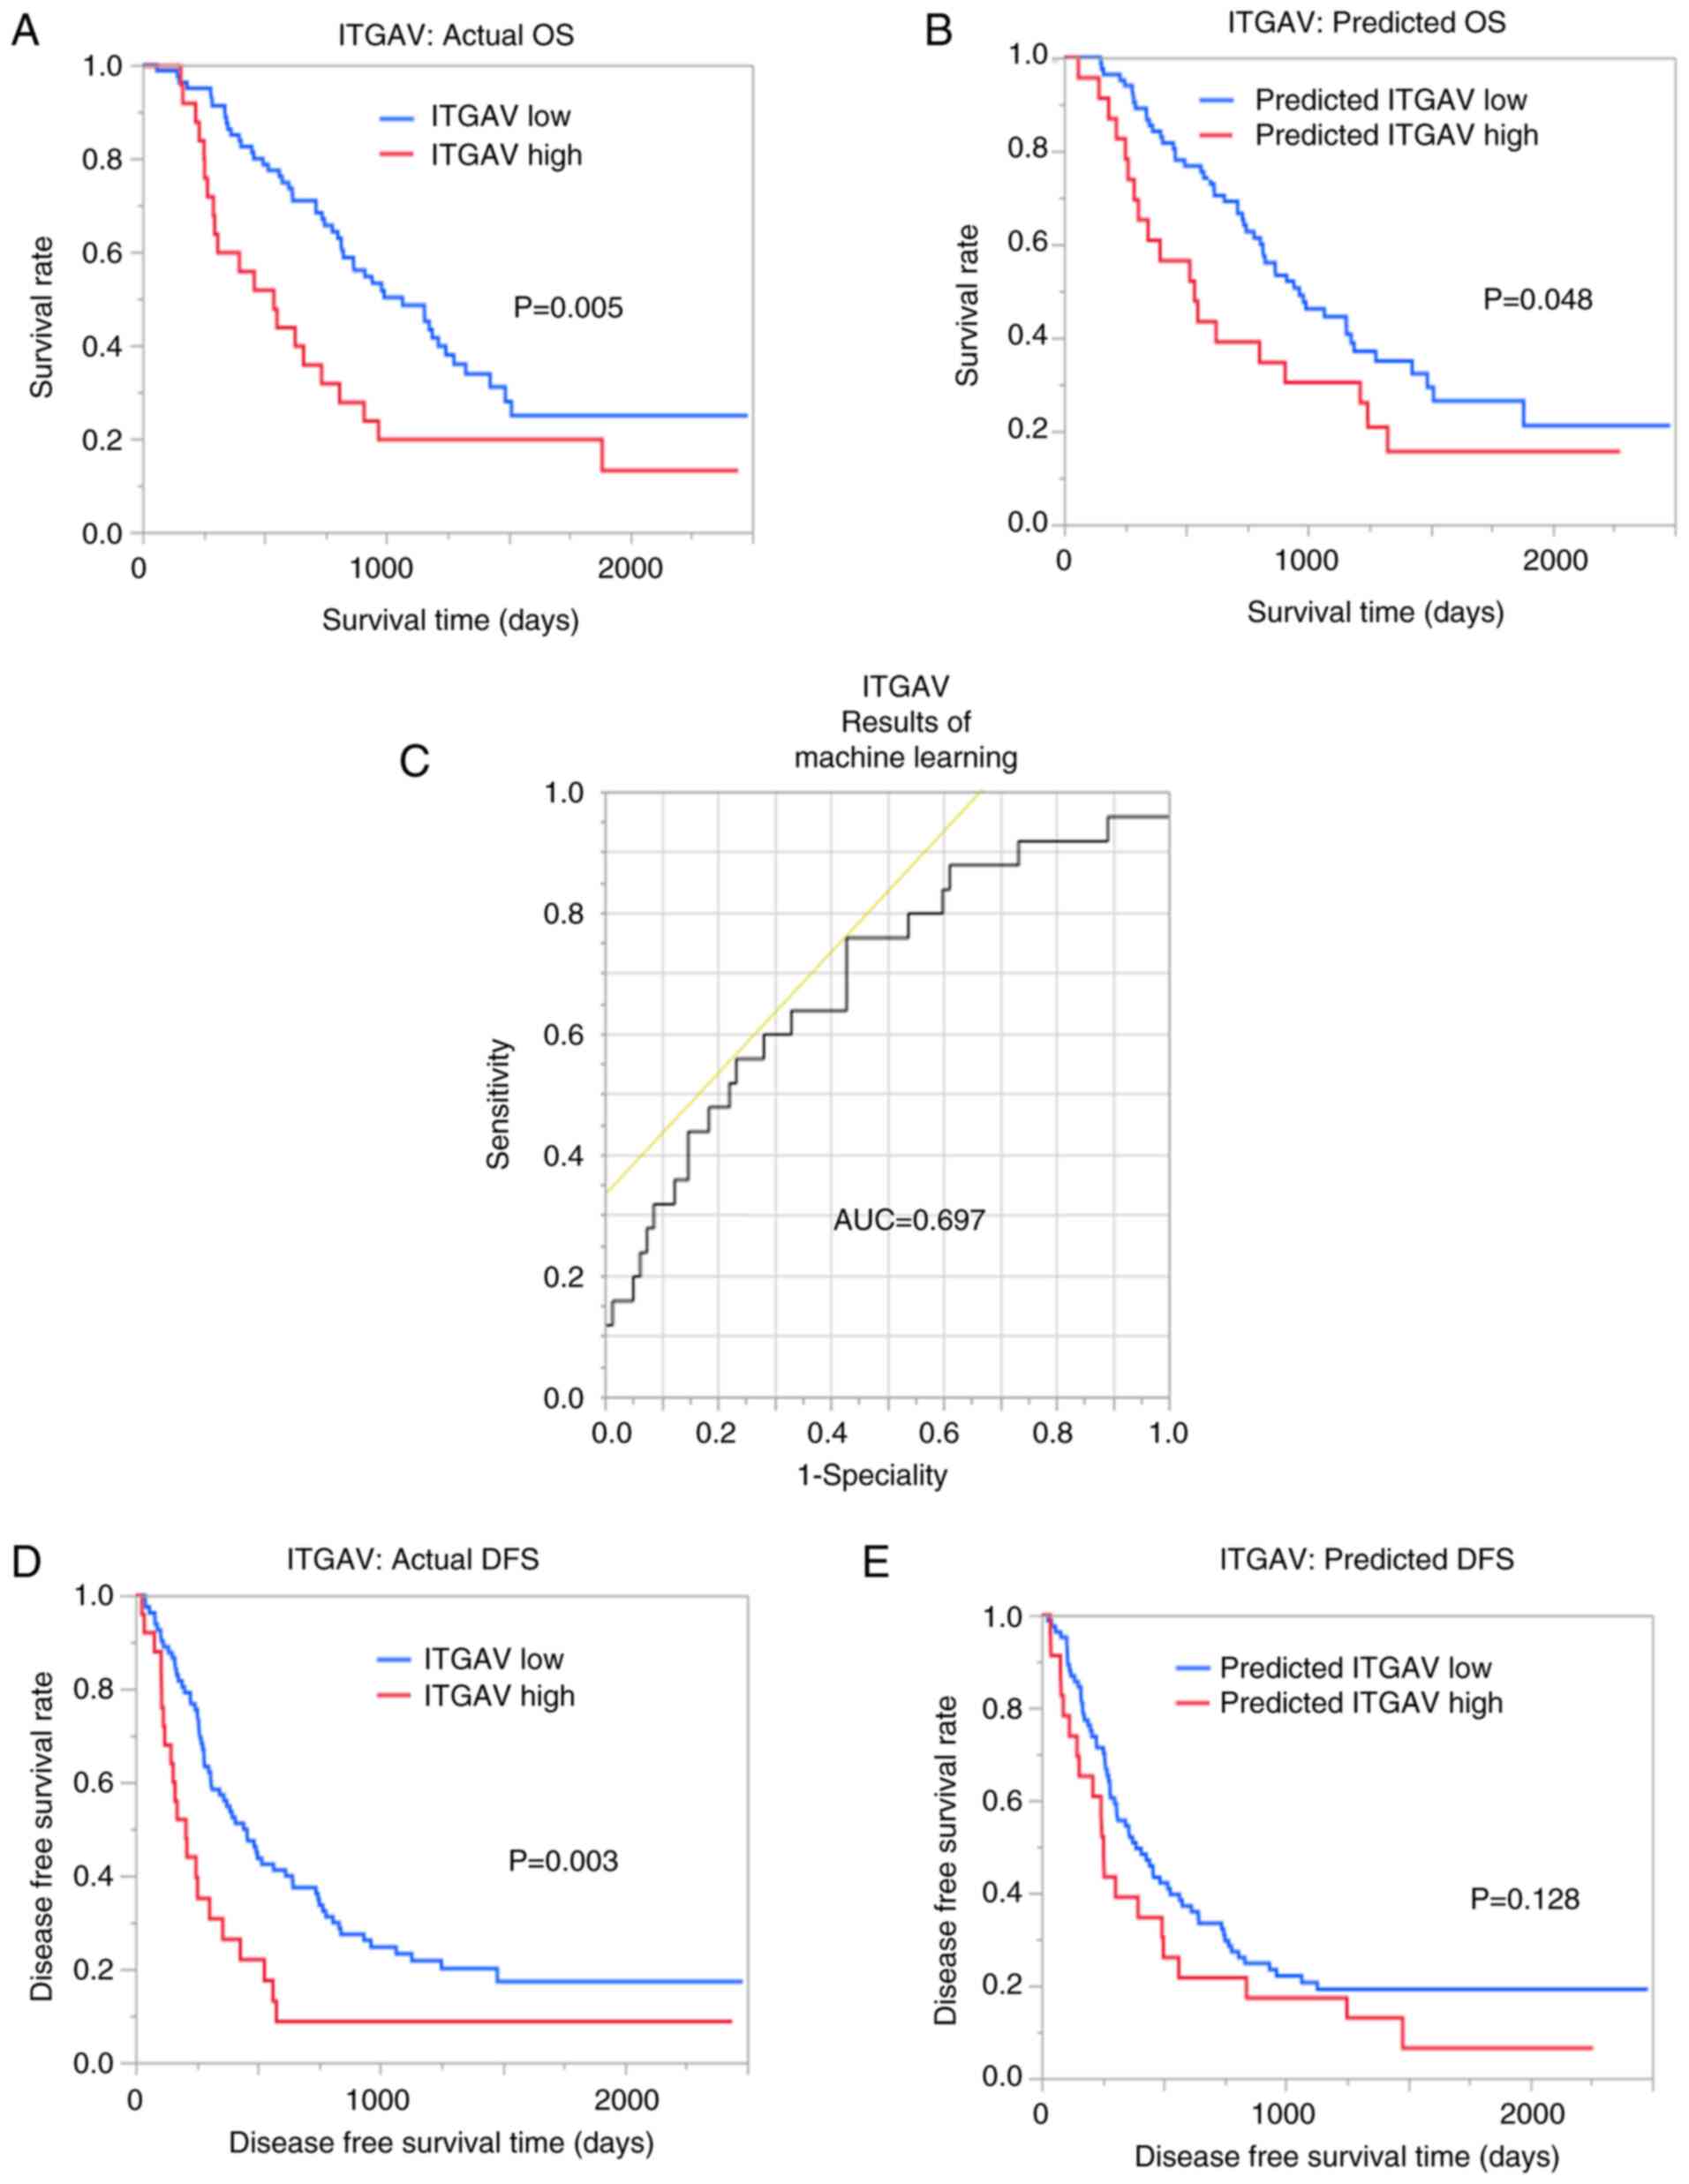
Predictive power of machine learning
models
The AUC for ITGAV was 0.671 and 0.697 with imaging
features of VOIpc and VOI+4 mm, respectively
(Fig. 4). Notably, OS was
significantly different between the groups with predicted ITGAV
from machine learning (P=0.048). In terms of DFS, predicted high
ITGAV expression was associated with a worse recurrence rate;
however, this finding was not significant (Fig. 4).
Discussion
The present study aimed to use CT images to predict
the expression of ITGAV, which was confirmed to be an independent
prognostic factor in pancreatic cancer using radiogenomics
analysis. The results indicated that the expression of ITGAV could
be predicted with appropriate sensitivity from CT images.
Integrin molecules consist of a dimer of an α
subunit and β subunit, and ITGAV forms α subunits consisting of
integrin α chains (14). Integrin
is a protein mainly present in the plasma membrane on the cell
surface, which is involved in cell-cell adhesion and signal
transduction, and adhesion between cells, the extracellular matrix
and the constructed extracellular microenvironment. ITGAV forms α
subunits, which form dimers with β1, β3, β5, β6 and β8 (15-17). In addition, according to recent
reports, αVβ3, αVβ5 and αVβ6 in tumor cells can activate TGFβ in
cancer tissues, and TGFβ can induce αVβ6 and αVβ8 in pancreatic
stellate cells in the tumor interstitium, causing interstitial
changes that induce infiltration and metastasis (18,19).
High ITGAV expression has been reported to
contribute to tumorigenesis, metastasis, proliferation and invasion
in breast cancer, and high ITGAV expression has been observed in a
group with nerve infiltration, lymph node metastasis and distant
metastasis in colorectal cancer (20,21). In addition, high ITGAV expression
in tumor cells has been shown to significantly shorten OS and DFS
in gastric cancer and colon cancer; however, there are few reports
of ITGAV in pancreatic cancer, and it was reported that no
relationship existed between high ITGAV expression in tumor cells
and prognosis (20,22,23). Regarding the interstitium, it has
been reported that high ITGAV expression was detected in 48% of
pancreatic stellate cells (PSCs) in the tumor interstitium
(23). In the high expression
group of ITGAV in PSCs in the tumor interstitium, the prognosis was
significantly poor, and it was poor due to the high expression of
ITGAV in PSCs in the peritumoral interstitium rather than in the
tumor cells (23). The proportion
of high expression in tumor cells and peritumoral interstitium was
generally consistent with the proportion in the present study
(3,23,24). Furthermore, also in the present
study, the high expression of ITGAV in tumor cells was not
associated with prognosis (P=0.802), whereas high expression of
ITGAV in the entire tumor was associated with a worse prognosis.
Therefore, high expression of ITGAV in pancreatic cancer tissue may
contribute to high expression in the peritumoral environment, and
ITGAV may reflect the malignant potential of the peritumoral
environment rather than tumor cells.
For antitumor treatment, various integrin
antagonists, such as αVβ3 and αVβ5, are in the development and
research stage, and antitumor effects have been reported in breast
cancer in vitro (20,25). In clinical trials using integrin
inhibitors, there are currently no reports showing that a single
agent is effective, but these agents are expected to be effective
in combination with multiple agents, such as immune checkpoint
inhibitors, and by case stratification (26). Although the effect of these agents
in pancreatic cancer has not been reported, it is expected that
ITGAV may contribute as a prognostic marker and treatment target in
pancreatic cancer if the development, research, and clinical
application of these integrin agents will progress in the
future.
Radiogenomics analysis has extended to cancer of
parenchymal organs, which yield easy to evaluate clinical images,
and to types of carcinoma with molecular markers for predicting
drug effects, such as lung cancer, breast cancer and glioblastoma
(9,27,28). Numerous studies have used
radiomics to analyze the prognosis, and the presence or absence of
lymph node metastasis from clinical images of pancreatic cancer,
such as preoperative CT images. However, few radiogenomics reports
have yielded molecular targets that can be evaluated from clinical
images (10,29-31).
As aforementioned, high ITGAV expression has been
reported to contribute to infiltration and metastasis in various
types of cancer. In the present study, tumor diameter was increased
in the ITGAV high-expression group and the T factor was more
advanced. Therefore, high ITGAV expression may reflect peritumoral
invasiveness in addition to changes in the extracellular
microenvironment. These findings may indicate a tendency for early
recurrence and deterioration of prognosis. Furthermore, in the
radiogenomics analysis, the high expression of ITGAV improved the
detection ability in the analysis, including the tumor peripheral
region (VOI+4 mm). These results may be reflected in the
improvement of detection ability by including VOI+4 mm
in image evaluation (21). In
addition, in the present study, evaluation using only CT images may
be the cause of the insufficient ability to discriminate ITGAV
status and predict the deterioration of the recurrence rate, and
the detectability may be improved by using another modality, such
as MRI.
The present study had limitations. RNA-seq was
performed on a small number of cases, which may be insufficient to
verify the correlation with IHC. Since this was a retrospective
study at a single institution, the number of cases may have been
insufficient to perform machine learning; because the number of
cases was small, model creation and verification were performed in
the same group. Therefore, model creation using more cases and
verification at other facilities should be performed in the
future.
In conclusion, bioinformatics analysis of RNA-seq
data for pancreatic cancer identified ITGAV as an important hub
gene. Immunohistochemical staining with multiple samples revealed
that ITGAV expression was an independent predictor of prognosis and
recurrence in multivariate analysis. Furthermore, high ITGAV
expression with suggested clinical significance and potential
clinical application was predicted by machine learning using CT
images.
Supplementary Data
Availability of data and materials
The datasets used and/or analyzed during the current
study are available from the corresponding author on reasonable
request. The microarray data generated in the present study may be
found in the Gene Expression Omnibus under accession number
GSE196009 or at the following URL: https://www.ncbi.nlm.nih.gov/geo/query/acc.cgi?acc=GSE196009.
Authors' contributions
YI, HYo and IH analyzed and interpreted the patient
data regarding pancreatic cancer, and wrote the manuscript. YI, IH
and HN confirm the authenticity of all the raw data. HYo and TU
extracted imaging features from CT, and analyzed the relationship
between imaging features and clinicopathological features. FI and
NK performed RNA extraction. MI performed the pathological
examination of the pancreatic cancer and interpreted the IHC
results. YM examined the validity of the artificial intelligence in
this study. SC, HA, HYa and WT collected clinical pathological
data. JL and HN performed bioinformatics analysis of RNA-seq data.
YN, YT and OS created libraries from the extracted mRNA and
sequenced them. HN oversaw this study comprehensively. All authors
read and approved the final manuscript.
Ethics approval and consent to
participate
All patients provided written informed consent, and
the study was approved by the Chiba Cancer Center Review Board
(approval no. H29-006). All procedures were in accordance with the
ethical standards of the responsible committee on human
experimentation and with the Helsinki Declaration of 1964 and its
later amendments.
Patient consent for publication
Not applicable.
Competing interests
The authors declare that they have no competing
interests.
Acknowledgments
Not applicable.
Funding
No funding was received.
References
|
1
|
Mizrahi JD, Surana R, Valle JW and Shroff
RT: Pancreatic cancer. Lancet. 395:2008–2020. 2020. View Article : Google Scholar : PubMed/NCBI
|
|
2
|
Spath C, Nitsche U, Muller T, Michalski C,
Erkan M, Kong B and Kleeff J: Strategies to improve the outcome in
locally advanced pancreatic cancer. Minerva Chir. 70:97–106.
2015.PubMed/NCBI
|
|
3
|
Krüger K, Büning C and Schriever F:
Activated T lymphocytes bind in situ to stromal tissue of colon
carcinoma but lack adhesion to tumor cells. Eur J Immunol.
31:138–145. 2001. View Article : Google Scholar : PubMed/NCBI
|
|
4
|
Waddell N, Pajic M, Patch AM, Chang DK,
Kassahn KS, Bailey P, Johns AL, Miller D, Nones K, Quek K, et al:
Whole genomes redefine the mutational landscape of pancreatic
cancer. Nature. 518:495–501. 2015. View Article : Google Scholar : PubMed/NCBI
|
|
5
|
Moffitt RA, Marayati R, Flate EL, Volmar
KE, Loeza SG, Hoadley KA, Rashid NU, Williams LA, Eaton SC, Chung
AH, et al: Virtual microdissection identifies distinct tumor- and
stroma-specific subtypes of pancreatic ductal adenocarcinoma. Nat
Genet. 47:1168–1178. 2015. View
Article : Google Scholar : PubMed/NCBI
|
|
6
|
Bailey P, Chang DK, Nones K, Johns AL,
Patch AM, Gingras MC, Miller DK, Christ AN, Bruxner TJ, Quinn MC,
et al: Genomic analyses identify molecular subtypes of pancreatic
cancer. Nature. 531:47–52. 2016. View Article : Google Scholar : PubMed/NCBI
|
|
7
|
Herskind C, Talbot CJ, Kerns SL, Veldwijk
MR, Rosenstein BS and West CM: Radiogenomics: A systems biology
approach to understanding genetic risk factors for radiotherapy
toxicity? Cancer Lett. 382:95–109. 2016. View Article : Google Scholar : PubMed/NCBI
|
|
8
|
Hoshino I and Yokota H: Radiogenomics of
gastroenterological cancer: The dawn of personalized medicine with
artificial intelligence-based image analysis. Ann Gastroenterol
Surg. 5:427–435. 2021. View Article : Google Scholar : PubMed/NCBI
|
|
9
|
Kickingereder P, Bonekamp D, Nowosielski
M, Kratz A, Sill M, Burth S, Wick A, Eidel O, Schlemmer HP,
Radbruch A, et al: Radiogenomics of glioblastoma: Machine
learning-based classification of molecular characteristics by using
multiparametric and multiregional MR imaging features. Radiology.
281:907–918. 2016. View Article : Google Scholar : PubMed/NCBI
|
|
10
|
Attiyeh MA, Chakraborty J, McIntyre CA,
Kappagantula R, Chou Y, Askan G, Seier K, Gonen M, Basturk O,
Balachandran VP, et al: CT radiomics associations with genotype and
stromal content in pancreatic ductal adenocarcinoma. Abdom Radiol
(NY). 44:3148–3157. 2019. View Article : Google Scholar
|
|
11
|
Ritchie ME, Phipson B, Wu D, Hu Y, Law CW,
Shi W and Smyth GK: Limma powers differential expression analyses
for RNA-sequencing and microarray studies. Nucleic Acids Res.
43:e472015. View Article : Google Scholar : PubMed/NCBI
|
|
12
|
Iwatate Y, Hoshino I, Yokota H, Ishige F,
Itami M, Mori Y, Chiba S, Arimitsu H, Yanagibashi H, Nagase H and
Takayama W: Radiogenomics for predicting p53 status, PD-L1
expression, and prognosis with machine learning in pancreatic
cancer. Br J Cancer. 123:1253–1261. 2020. View Article : Google Scholar : PubMed/NCBI
|
|
13
|
Brierley JD, Gospodarowicz MK and
Wittekind C: TNM Classification of Malignant Tumours. Wiley;
Chichester: 2017
|
|
14
|
Hynes RO: Integrins: Bidirectional,
allosteric signaling machines. Cell. 110:673–687. 2002. View Article : Google Scholar : PubMed/NCBI
|
|
15
|
Arcangeli A, Crociani O and Bencini L:
Interaction of tumour cells with their microenvironment: Ion
channels and cell adhesion molecules. A focus on pancreatic cancer.
Philos Trans R Soc Lond B Biol Sci. 369:201301012014. View Article : Google Scholar : PubMed/NCBI
|
|
16
|
Desgrosellier JS and Cheresh DA: Integrins
in cancer: Biological implications and therapeutic opportunities.
Nat Rev Cancer. 10:9–22. 2010. View
Article : Google Scholar
|
|
17
|
Brown NF and Marshall JF:
Integrin-Mediated TGFβ activation modulates the tumour
microenvironment. Cancers (Basel). 11:12212019. View Article : Google Scholar
|
|
18
|
Marsh D, Dickinson S, Neill GW, Marshall
JF, Hart IR and Thomas GJ: alpha vbeta 6 Integrin promotes the
invasion of morphoeic basal cell carcinoma through stroma
modulation. Cancer Res. 68:3295–3303. 2008. View Article : Google Scholar : PubMed/NCBI
|
|
19
|
Margadant C and Sonnenberg A:
Integrin-TGF-beta crosstalk in fibrosis, cancer and wound healing.
EMBO Rep. 11:97–105. 2010. View Article : Google Scholar : PubMed/NCBI
|
|
20
|
Cheuk IW, Siu MT, Ho JC, Chen J, Shin VY
and Kwong A: ITGAV targeting as a therapeutic approach for
treatment of metastatic breast cancer. Am J Cancer Res. 10:211–223.
2020.
|
|
21
|
Linhares MM, Affonso RJ Jr, Viana Lde S,
Silva SR, Denadai MV, de Toledo SR and Matos D: Genetic and
immunohistochemical expression of integrins ITGAV, ITGA6, and ITGA3
as prognostic factor for colorectal cancer: Models for global and
disease-free survival. PLoS One. 10:e01443332015. View Article : Google Scholar : PubMed/NCBI
|
|
22
|
Wang H, Chen H, Jiang Z, Lin Y, Wang X,
Xiang J and Peng J: Integrin subunit alpha V promotes growth,
migration, and invasion of gastric cancer cells. Pathol Res Pract.
215:1525312019. View Article : Google Scholar : PubMed/NCBI
|
|
23
|
Horioka K, Ohuchida K, Sada M, Zheng B,
Moriyama T, Fujita H, Manabe T, Ohtsuka T, Shimamoto M, Miyazaki T,
et al: Suppression of CD51 in pancreatic stellate cells inhibits
tumor growth by reducing stroma and altering tumor-stroma
interaction in pancreatic cancer. Int J Oncol. 48:1499–1508. 2016.
View Article : Google Scholar : PubMed/NCBI
|
|
24
|
Zhang B, Ye H, Ren X, Zheng S, Zhou Q,
Chen C, Lin Q, Li G, Wei L, Fu Z, et al: Macrophage-expressed CD51
promotes cancer stem cell properties via the TGF-β1/smad2/3 axis in
pancreatic cancer. Cancer Lett. 459:204–215. 2019. View Article : Google Scholar : PubMed/NCBI
|
|
25
|
Mattila E, Pellinen T, Nevo J, Vuoriluoto
K, Arjonen A and Ivaska J: Negative regulation of EGFR signalling
through integrin-alpha1beta1-mediated activation of protein
tyrosine phosphatase TCPTP. Nat Cell Biol. 7:78–85. 2005.
View Article : Google Scholar
|
|
26
|
Alday-Parejo B, Stupp R and Rüegg C: Are
integrins still practicable targets for anti-cancer therapy?
Cancers (Basel). 11:9782019. View Article : Google Scholar
|
|
27
|
Woodard GA, Ray KM, Joe BN and Price ER:
Qualitative radiogenomics: Association between oncotype DX test
recurrence score and BI-RADS mammographic and breast MR imaging
features. Radiology. 286:60–70. 2018. View Article : Google Scholar
|
|
28
|
Zhou M, Leung A, Echegaray S, Gentles A,
Shrager JB, Jensen KC, Berry GJ, Plevritis SK, Rubin DL, Napel S
and Gevaert O: Non-small cell lung cancer radiogenomics map
identifies relationships between molecular and imaging phenotypes
with prognostic implications. Radiology. 286:307–315. 2018.
View Article : Google Scholar
|
|
29
|
Attiyeh MA, Chakraborty J, Doussot A,
Langdon-Embry L, Mainarich S, Gönen M, Balachandran VP, D'Angelica
MI, DeMatteo RP, Jarnagin WR, et al: Survival prediction in
pancreatic ductal adenocarcinoma by quantitative computed
tomography image analysis. Ann Surg Oncol. 25:1034–1042. 2018.
View Article : Google Scholar : PubMed/NCBI
|
|
30
|
Liu P, Gu Q, Hu X, Tan X, Liu J, Xie A and
Huang F: Applying a radiomics-based strategy to preoperatively
predict lymph node metastasis in the resectable pancreatic ductal
adenocarcinoma. J Xray Sci Technol. 28:1113–1121. 2020.PubMed/NCBI
|
|
31
|
Xie T, Wang X, Li M, Tong T, Yu X and Zhou
Z: Pancreatic ductal adenocarcinoma: A radiomics nomogram
outperforms clinical model and TNM staging for survival estimation
after curative resection. Eur Radiol. 30:2513–2524. 2020.
View Article : Google Scholar : PubMed/NCBI
|