Introduction
Metabolic rewiring, a cellular mechanism of
adaptation to an unfavorable microenvironment, supports the
proliferation, survival and long-term maintenance of cancer cells
(1). In contrast to non-malignant
tissues, tumors are characterized by an increased rate of
glycolysis to meet their energy demands even in the presence of
oxygen, a phenomenon known as aerobic glycolysis or the Warburg
effect (2). Warburg metabolism,
consisting of a glucose conversion to lactate even when oxygen is
available, has emerged as a hallmark of cancer (3) and metabolic rewiring from glycolysis
to oxidative phosphorylation (OXPHOS) and vice versa is responsible
for driving cancer progression (4).
Solid tumors often contain a hypoxic area and
hypoxia has been shown to lead to a poor prognosis in cancer
patients (5), due to its
potential to increase malignancy, resistance to treatment and the
risk of metastasis (6). The major
transcriptional regulator of adaptive responses to hypoxia is the
hypoxia inducible factor 1 (HIF-1), a heterodimeric complex
composed of HIF-1α and HIF-1β/Aryl hydrocarbon receptor nuclear
translocator (7,8). Unlike the β-subunit, which is
ubiquitously expressed, the α-subunit is oxygen-sensitive and
stabilized under hypoxic conditions. The active form of the HIF-1αβ
complex induces the expression of a number of hypoxia-responsive
genes by binding to hypoxia response element (HRE) (9), including vascular endothelial growth
factor (VEGF) (10) and several
metabolic genes, such as glucose transporter 1 (GLUT1) (11), lactate dehydrogenase A (LDHA)
(12,13) and pyruvate dehydrogenase kinase 1
(PDK1) (14,15). This gene expression reprogramming
induced by HIF-1α activates angiogenesis and sustains a metabolic
rewiring toward Warburg metabolism (10,16). In this complex scenario, a crucial
role is played by molecular chaperones in connecting different
intracellular pathways (17).
TRAP1 is a member of the HSP90 molecular chaperone family,
overexpressed in ~60% of human colorectal carcinomas (CRCs), and
whose upregulation occurs early in CRC progression; thus, it is
hypothesized that it plays a role in the transition from low- to
high-grade adenomas (18). TRAP1
can regulate cancer cell adaptation to stress environmental
conditions (19-21) and modulate tumor energy
metabolism, promoting glycolysis and inhibiting OXPHOS in a
context- and tumor-dependent manner (22). In a recent study by the authors,
it was reported that TRAP1 favors Warburg metabolism through
increased glucose uptake and lactate production and downregulates
OXPHOS both in CRC cell lines and CRC patient-derived spheroids
(23). Furthermore, TRAP1 binds
and inhibits succinate dehydrogenase and cytochrome oxidase
(respiratory chain complexes II and IV, respectively) (24,25) with the downregulation of OXPHOS
and succinate accumulation. Since succinate stabilizes HIF-1α by
blocking prolyl hydrolases and, thus preventing its degradation
following ubiquitination, HIF-1α stabilization has been proposed as
the main mechanism underlying the role of TRAP1 in tumor
progression (24). Based on this
rationale and since no evidence is at present available on TRAP1
function under oxygen deprivation conditions, at least to the best
of our knowledge, the present study was designed to address the
hypothesis that TRAP1 may be a key regulator of the CRC cell
response to hypoxia.
Materials and methods
Cell cultures, reagents and cell
transfection procedures
The HCT116 cell line (CCL-247) was purchased from
the American Type Culture Collection (ATCC) and cultured in McCoy's
5A medium (cat. no. 26600023, Gibco; Thermo Fisher Scientific,
Inc.), supplemented with 10% fetal bovine serum (cat. no. 10270106,
Gibco; Thermo Fisher Scientific, Inc.), 1% glutamine (cat. no.
25030024, Gibco; Thermo Fisher Scientific, Inc.) and 1% penicillin
and streptomycin (cat. N 15140122, Gibco; Thermo Fisher Scientific,
Inc.). The 293T cell line (CRL-3216, ATCC) was cultured in Iscove's
modified Dulbecco's medium (IMDM cat. no. 12440053, Gibco; Thermo
Fisher Scientific, Inc.) supplemented with 10% heat-inactivated
fetal calf serum (cat. no. S11450H, R&D Systems, Inc.), 1%
glutamine (cat. no. 25030024, Gibco; Thermo Fisher Scientific,
Inc.) and 1% penicillin and streptomycin (cat. no. 15140122, Gibco;
Thermo Fisher Scientific, Inc.). The 293T cell line, characterized
by high transfectability and transgenic expression, was used as a
packaging cell line for generating viral particles. The
authenticity of the cell lines was verified at the beginning of the
study by STR profiling, in accordance with ATCC product
description. Cell lines were routinely tested for mycoplasma
contamination using the LookOut® Mycoplasma PCR
Detection kit (cat. no. MP0035, MilliporeSigma). All cell lines
were grown and maintained in a humidified incubator with 5%
CO2 and 95% (vol/vol) O2. Hypoxic experiments
were performed using the Galaxy 48-R incubator (New Brunswick
Scientific Co., Inc.; Effendorf AG) at 0.5% O2. HCT116
cells were also treated with hypoxia-mimic compound deferoxamine
(cat. no. D9533, MilliporeSigma) at 250 µM for 6 h as a
positive control of hypoxic experimental conditions.
TRAP1 transient silencing was performed using 80 nM
siRNAs purchased from Qiagen (target sequence, 5′-CCC GGT CCC TGT
ACT CAG AAA-3′; sense strand, 5′-CGG UCC CUG UAC UCAG AAA TT-3′;
antisense strand, 5′-UUU CUG AGU ACA GGG ACC GGG-3′; cat. no.
SI00115150, Qiagen GmbH). As a control, cells were transfected with
the same amount of control siRNA (target sequence, N/A; sense and
antisense sequence, proprietary; cat. no. SI03650318, Qiagen GmbH).
Transient transfections of siRNAs were performed 48 h before the
experiment using the HiPerFect Transfection Reagent (cat. no.
301705, Qiagen GmbH), according to the manufacturer's protocol.
mTOR inhibition in HCT116 cells was performed using
everolimus (Afinitor, Novartis) at 1 µM for 24 h.
Glucose uptake and lactate production
assays
Glucose uptake and lactate production were assessed
as previously described (23).
All experiments were performed at least in triplicate.
RNA extraction and reverse
transcription-quantitative PCR (RT-qPCR)
Total RNA was extracted using the RNeasy Plus Mini
kit (cat. no. 74034, Qiagen GmbH), according to the manufacturer's
instructions and reverse transcribed into cDNA using reverse
transcription reagents (Superscript IV Vilo, cat. no. 11756050,
Invitrogen; Thermo Fisher Scientific, Inc.), according to the
manufacturer's instructions. qPCR analyses were performed in the
CFX96 Touch™ Real-Time PCR Detection System (Bio-Rad Laboratories,
Inc.) using SsoAdvanced™ Universal SYBR®-Green Supermix
(cat. no. 1725271, Bio-Rad Laboratories, Inc.), according to the
manufacturer's instructions. The reaction was conducted according
to the following amplification protocol: 95°C for 3 min, 39 cycles
at 95°C for 10 sec, 60°C for 30 sec and 65-95°C for 5 sec. Primers
were purchased from MilliporeSigma or Invitrogen (Thermo Fisher
Scientific, Inc.) and are listed in Table SI. Gene expression was analyzed
according to 2−ΔΔCq relative quantification method
(26) using CFX Maestro software
version 1.0 (Bio-Rad Laboratories, Inc.).
Western blot analysis
Cell pellets were lysed in ice-cold RIPA buffer [20
mmol/l Tris (pH 7.5) containing 300 mmol/l sucrose, 60 mmol/l KC1,
15 mmol/l NaC1, 5% (v/v) glycerol, 2 mmol/l EDTA, 1% (v/v) Triton
X100, 1 mmol/l phenylmethylsulfonylfluoride, 2 mg/ml aprotinin, 2
mg/ml leupeptin and 0.2% (w/v) deoxycholate] as previously
described (27). The protein
concentration was measured using the Bio-Rad protein assay kit
(cat. no. 5000006, Bio-Rad Laboratories, Inc.), according to the
manufacturer's instructions. Samples were resolved by SDS-PAGE
using polyacrylamide 4-20% precast gels (Mini-PROTEAN TGX
Stain-Free Gels, cat. no. 4568094, Bio-Rad Laboratories, Inc.) and
transferred onto a nitrocellulose membrane (Trans-Blot Turbo
Transfer Pack, cat. no. 1704158, Bio-Rad Laboratories, Inc.). The
membrane was incubated for 60 min at room temperature with Western
Blocker Solution (cat. no. W0138, MilliporeSigma) and immunoblotted
with the following antibodies: Anti-TRAP1 (1:1,000 overnight 4°C;
cat. no. sc-73604, Santa Cruz Biotechnology, Inc.), anti-HIF-1α
(1:2,000 overnight 4°C; cat. no. ab16066, Abcam),
anti-monocarboxylate transporter 4 (MCT4) (1:1,000 overnight 4°C;
cat. no. sc-376140, Santa Cruz Biotechnology, Inc.), anti-GLUT1
(1:1,000 overnight 4°C; cat. no. ab32551, Abcam), anti-LDHA
(1:1,000 overnight 4°C; cat. no. sc-137243, Santa Cruz
Biotechnology, Inc.), anti-p70S6 kinase α (H-9) (1:1,000 overnight
4°C; cat. no. sc-8418, Santa Cruz Biotechnology, Inc.),
anti-phospho-p70 S6 kinase (Thr389) (1:1,000 overnight 4°C; cat.
no. 9205, Cell Signaling Technology, Inc.) and β-actin (1:2,000 1 h
room temperature; cat. no. sc-47778, Santa Cruz Biotechnology,
Inc.). The expression of specific proteins was detected using a
secondary antibody labeled with peroxidase 1:2,000 for 1 h room
temperature [goat anti-mouse (H + L)-HRP conjugate, cat. no.
1706516, Bio-Rad Laboratories, Inc.; goat anti-rabbit (H + L)-HRP
conjugate, cat. no. 1706515, Bio-Rad Laboratories, Inc.) and the
Clarity Western ECL Substrate (cat. no. 1705061, Bio-Rad
Laboratories, Inc.). Protein expression levels were quantified
using densitometric analysis, using ImageJ software v1.53e
(National Institutes of Health) and normalized according to the
expression of housekeeping genes.
shTRAP1 p9T organoids
Human p9T CRC organoids were generated by the Jacco
van Rheenen Research Group at the Department of Molecular Pathology
of Netherlands Cancer Institute of Amsterdam (NKI-AVL) and kindly
provided to the authors' laboratory. Organoids were cultured in a
humidified atmosphere at 37°C and 5% CO2 with basal
culture medium [Advanced DMEM/F12 (cat. no. 12634028, Gibco; Thermo
Fisher Scientific, Inc.), 10 mM HEPES (cat. no. 15630056, Gibco;
Thermo Fisher Scientific, Inc.), 2 mM Glutamax (cat. no. 35050061,
Gibco; Thermo Fisher Scientific, Inc.), 100 U/ml penicillin and
streptomycin (cat. no. 15140122, Gibco; Thermo Fisher Scientific,
Inc.)] supplemented with 10% R-Spondin conditioned medium, 10%
Noggin conditioned medium, 1X B27 (cat. no. 17504001, Gibco; Thermo
Fisher Scientific, Inc.), 1.25 mM n-acetyl cysteine (cat. no.
A9165, MilliporeSigma), 10 mM nicotinamide (cat. no. N0636,
MilliporeSigma), 500 nM A83-01 (cat. no. SML0788, MilliporeSigma),
3 µM SB202190 (cat. no. CAY-10010399, Vinci-Biochem), 50
ng/ml human recombinant EGF (cat. no. 354052, BD Biosciences), 10
nM Leu15-Gastrin (cat. no. G9145, MilliporeSigma) and 10 nM
prostaglandin E2 (cat. no. 14010, Vinci-Biochem). To confirm
correct sample identity, the organoids were regularly tested by SNP
analysis. Four different validated lentiviral reporter plasmids
(pLKO.1_TRC cloning vector, plasmid#10878, Addgene, Inc.) for
shTRAP1 were obtained from the NKI's Robotics and Screening Center
Facility and tested to verify the silencing efficiency induced in
CRC HCT116 cell line and organoids. Only two of these (shTRAP1#1
and shTRAP1#3) were selected for their high silencing efficiency
and reduced mortality. The full hairpin sequences were as follows:
shTRAP1#1, CCG GCC GCT ACA CCC TGC ACT ATA ACT CGA GTT ATA GTG CAG
GGT GTA GCG GTT TTT G; and shTRAP1#3, CCG GCA GAG CAC TCA CCC TAC
TAT GCT CGA GCA TAG TAG GGT GAG TGC TCT GTT TTT G.
A 3rd generation lentiviral system was used, that
includes pVSV-G (pMD2.G; plasmid #12259, Addgene, Inc.), pMDLg/pRRE
(plasmid #12251, Addgene, Inc.) and pREV AmpR (pRSV-Rev; plasmid
#12253, Addgene, Inc.) plasmids. The propagation of plasmids was
performed in the bacterial strain DH5a into LB medium. DNA was
isolated using the PureLink™ HiPure Plasmid Midiprep kit (cat. no.
K210004, Invitrogen; Thermo Fisher Scientific, Inc.).
The 293T cells were transfected with the pLKO.1
vector coding for shTRAP1 using the calcium phosphate-DNA
co-precipitation technique. The cell supernatant containing viral
particles was collected, filtered and directly used for cell
transduction, or ultracentrifuged (49,100 × g) for 2 h at 7°C for
organoid transduction. Lentiviral titers were determined using the
qPCR Lentivirus Titration kit (LV900, Applied Biological Materials,
Inc.), following the manufacturer's instructions. For the
experiments, the amount of lentiviral supernatant used was
calculated to achieve the multiplicity of infection (MOI) of 50. To
ensure efficient transduction, the 293T and HCT116 cells were
incubated with lentiviral supernatants at 37°C for 24 h in the
presence of polybrene (8 µg/ml, cat. no. TR-1003,
MilliporeSigma). Antibiotic selection was initiated at 24 h
post-transduction and was carried out for 5 consecutive days.
Tumor-derived p9T organoids were trypsinized using
TrypLE (cat. no. 12605010, Gibco; Thermo Fisher Scientific, Inc.),
mixed with 100 µl concentrated virus, 8 ng/ml polybrene and
10 µM Rho-associated, coiled-coil containing protein kinase
inhibitor (Y-27632; cat. no. Y0503, MilliporeSigma) in 15 ml tubes
and centrifuged at 600 × g for 1 h at 32°C. Subsequently, the
organoids were incubated at 37°C and 5% CO2 for 6 h.
Following incubation, the organoids were washed with Advance
DMEM/F12 medium and spun down for 5 min at 160 × g 4°C to eliminate
the virus. Following the removal of the virus-containing medium,
organoids were plated in ~50 µl BME (cat. no. 353300502,
Bio-Techne Corporation). Transduced organoids were grown in Advance
DMEM/12 full of growth factors and fresh Y-27632 for 3 days after
which selection was applied by the addition of puromycin (2
µg/ml, cat. no. A1113802, Thermo Fisher Scientific, Inc.)
for 4 days.
Gene expression profiles
Total RNA (300 ng) was transcribed for the synthesis
of cDNA and biotinylated cRNA, according to the protocol of the
Illumina TotalPrep RNA (cat. no. AMIL1791, Ambion; Thermo Fisher
Scientific, Inc.) amplification kit. The hybridization, marking and
scanning of 750 ng cRNA was performed on the Illumina Human HT12
v4.0 Expression BeadChip array (Illumina Inc.), following the
standard protocol. All analyses were performed in triplicate for
each sample. The BeadChip was then dried and scanned using the
Illumina HiScanHQ system (Illumina Inc.). Data analysis was carried
out through the free/open source environment R/Bioconductor
(28). Probes with a low quality
of fluorescence intensity signal were excluded from the subsequent
analysis steps. Normalization was performed using the neqc
procedure, a background correction through internal controls
followed by Quantile Normalization. The differential analysis
between the experimental conditions and the normalization were
performed using the limma package (29).
Functional enrichment analysis was carried out
through the Gene Set Enrichment Analysis (GSEA) (30) computational method and the MsigDB
database (31) for the collection
of annotated gene sets, focusing on the following categories:
Hallmark, Gene Ontology and Pathways. The gene expression data
generated in the present study have been deposited in the
ArrayExpress database at EMBL-EBI (www.ebi.ac.uk/array-express) under the accession no.
E-MTAB-10563.
Analysis of public datasets
TRAP1 expression analysis in CRC samples, compared
with normal tissue, was performed using the TNMplot database
(https://www.tnmplot.com/). The platform directly
compares tumor and normal samples and performs a Mann-Whitney U or
Kruskal-Wallis tests or a paired Wilcoxon test (in case of
availability of paired normal and adjacent tumor) for statistical
significance (32).
Statistical analysis
The unpaired t-test was performed using the t-test
Calculator of GraphPad (online version) for the analysis of
metabolic tests in silenced cells and related controls (Fig. 1C and D). Data are reported as mean
values of least three independent experiments (± SD). RT-qPCR data
were analyzed using two-way ANOVA and Sidak's multiple comparisons
test. Statistical analysis was performed using GraphPad 7.0
software (GraphPad Software, Inc.). A value of P<0.05 was
considered to indicate a statistically significant difference.
Results
TRAP1 promotes hypoxia-induced metabolic
rewiring in CRC cells via HIF-1α stabilization
In the preliminary analyses, TNMplot gene chip data
were used to confirm the increased expression of TRAP1 in human CRC
samples (n=160) compared to normal human colorectal mucosa (n=160).
Notably, while the normal colorectal mucosa was characterized by a
low TRAP1 mRNA expression, a significant upregulation of TRAP1
expression was observed in malignant tissues (Fig. S1A) (P<0.001 Kruskal-Wallis
test). Considering that hypoxia is the main stimulus to boost
glycolytic metabolism in cancer cells (12,33-36), in order to establish the role of
TRAP1 in hypoxia-induced metabolic rewiring, human CRC cells were
used in the present study and in preliminary experiments; the
optimal time for HCT116 cell exposure to 0.5% hypoxia to induce
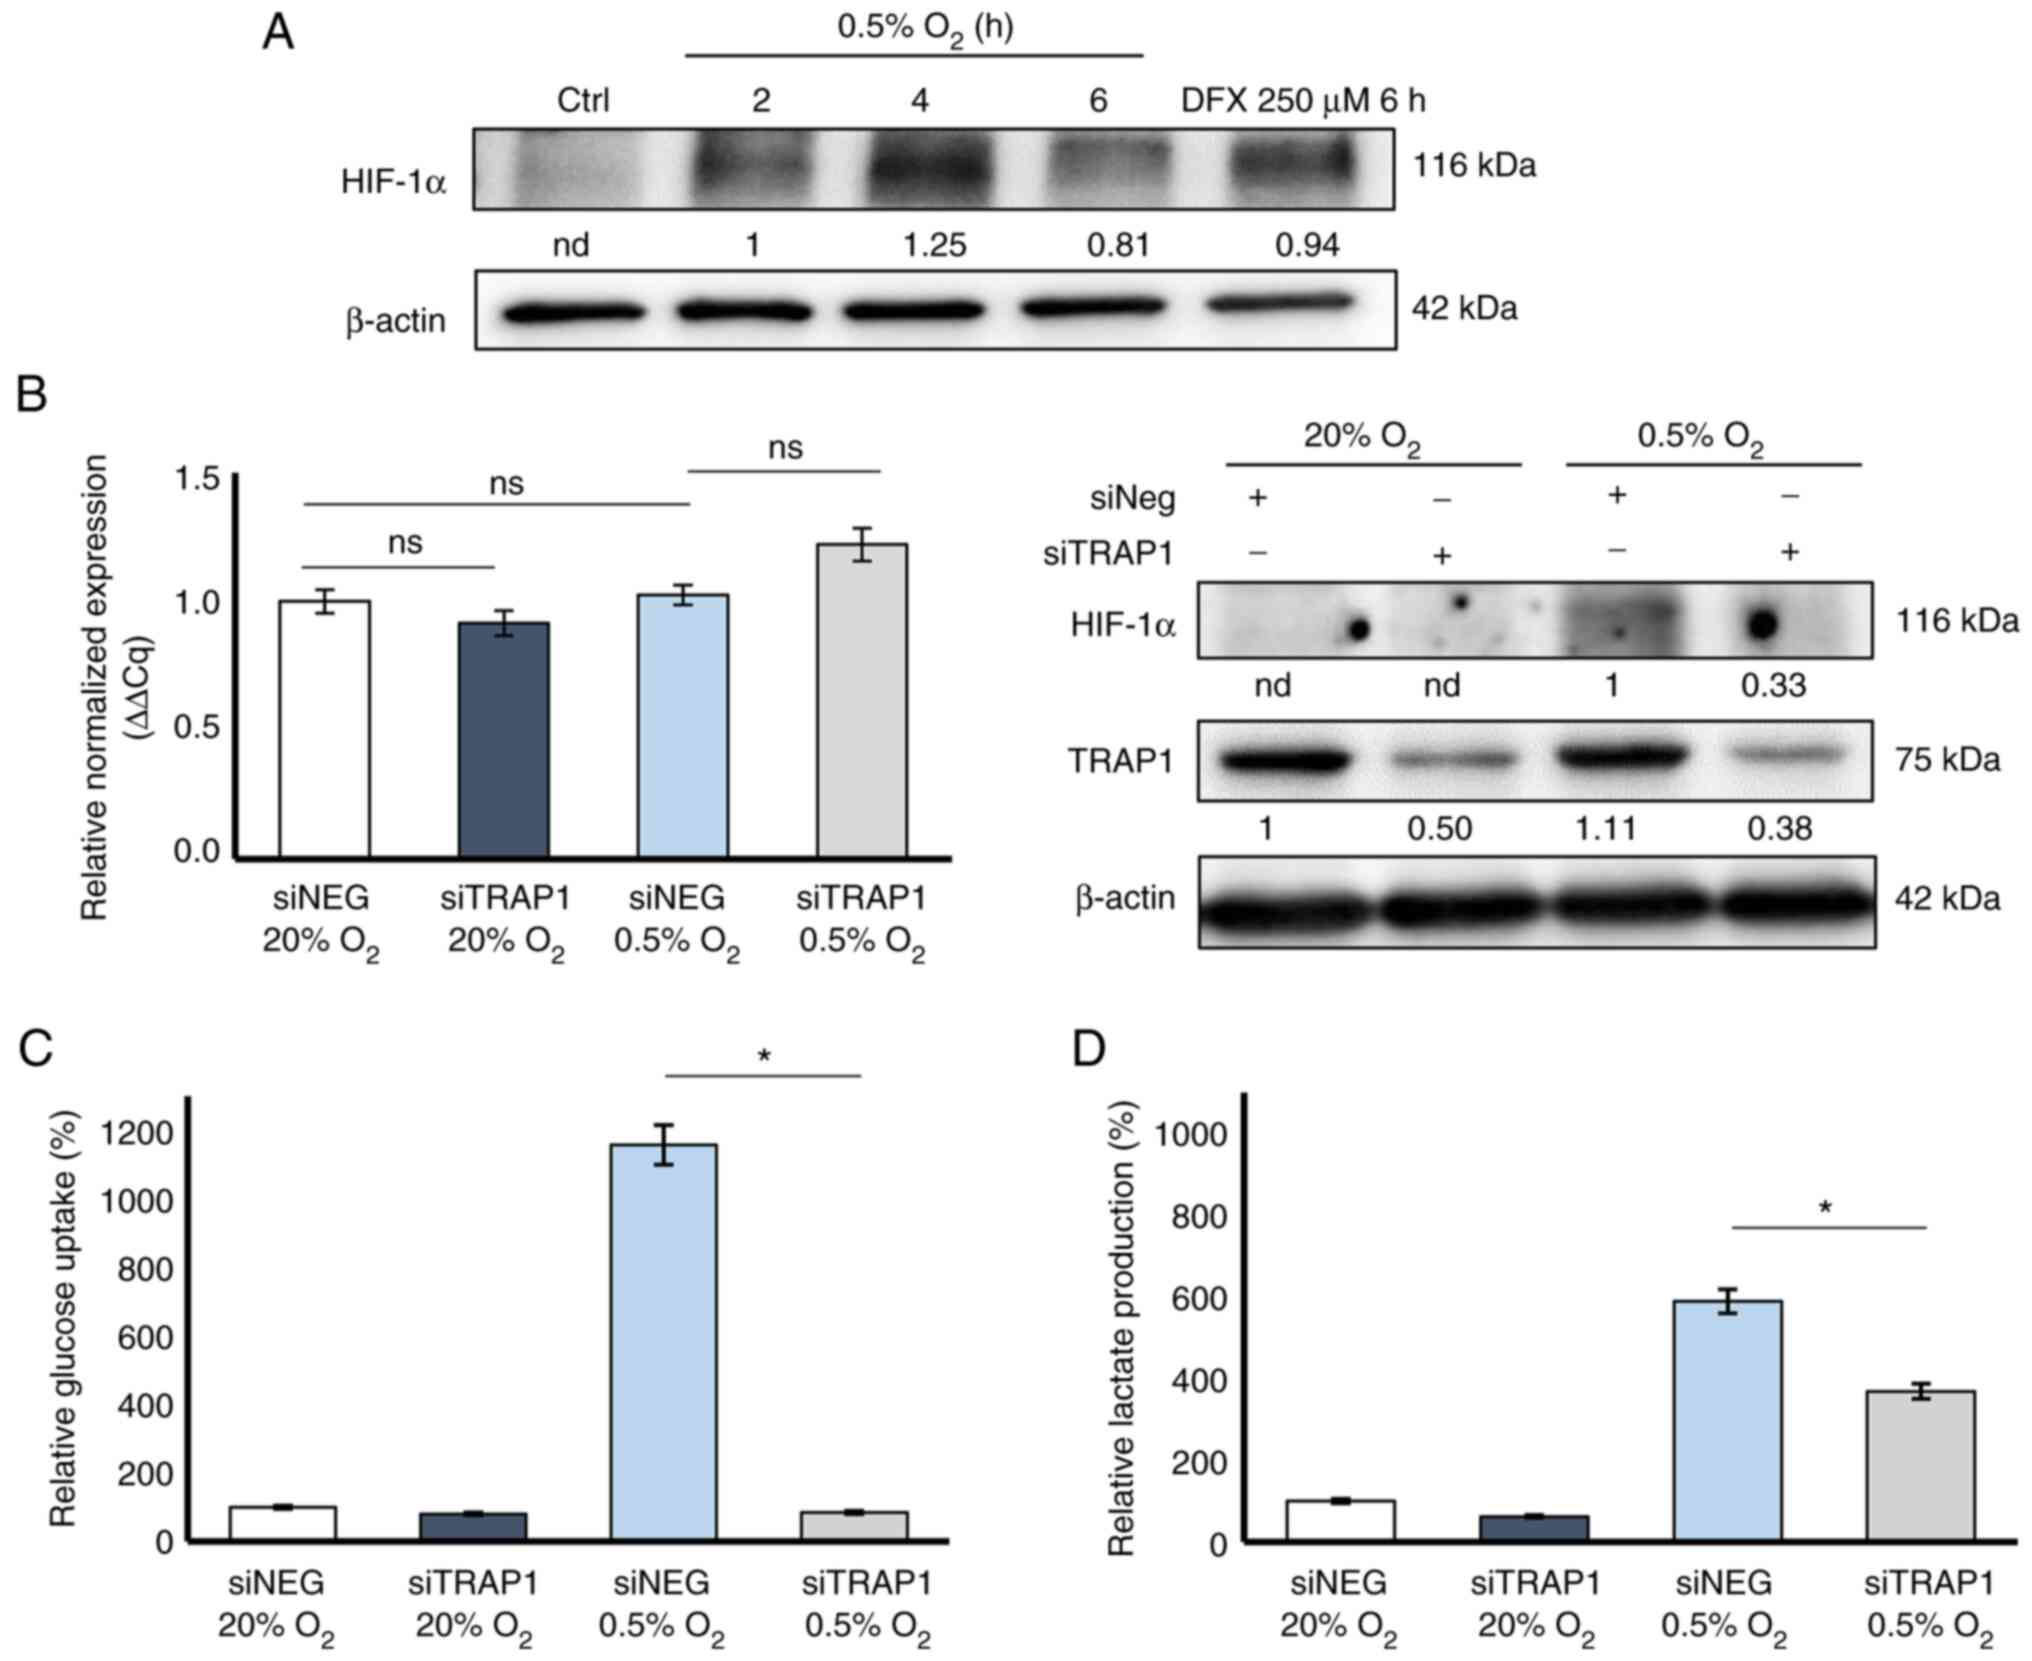
HIF-1α stabilization was evaluated. Western blot analysis revealed
that HIF-1α maximal stabilization was observed after 4 h of
exposure of the cells to 0.5% O2 compared to normoxic
conditions (20% O2; Fig.
1A). In these experiments, HCT116 cells exposed to 250
µM deferoxamine for 6 h were used as a positive control.
To examine the role of TRAP1 in controlling HIF-1α
stabilization in CRC, HCT116 cells were transiently silenced for
TRAP1 and exposed to 4 h of hypoxia or normoxia and evaluated for
HIF-1α stabilization using western blot analysis. Of note, although
there were no significant differences in HIF-1α gene expression
under the current experimental conditions (Fig. 1B, left panel), TRAP1 silencing
induced a partial inhibition of HIF-1α stabilization at the
post-translational level under hypoxic conditions (Fig. 1B, right panel).
In subsequent experiments, the association between
TRAP1-mediated HIF-1α stabilization and its role in metabolic
adaptive responses to reduced oxygen availability was investigated.
Thus, TRAP1-silenced HCT116 cells were exposed to 0.5 and 20%
O2 for 4 h and analyzed for glucose uptake and lactate
production. As was expected, hypoxia markedly enhanced both 2-DG
uptake (Fig. 1C) and lactate
production (Fig. 1D) in a
high-TRAP1 background (siNEG). Of note, TRAP1 silencing
significantly decreased 2-DG uptake (Fig. 1C) and partially impaired lactate
production (Fig. 1D) under
hypoxic conditions, thus suggesting that TRAP1 is required for
hypoxia-induced metabolic rewiring.
TRAP1 sustains HIF-1α-induced
transcriptional reprogramming in CRC cells and patient-derived
organoids
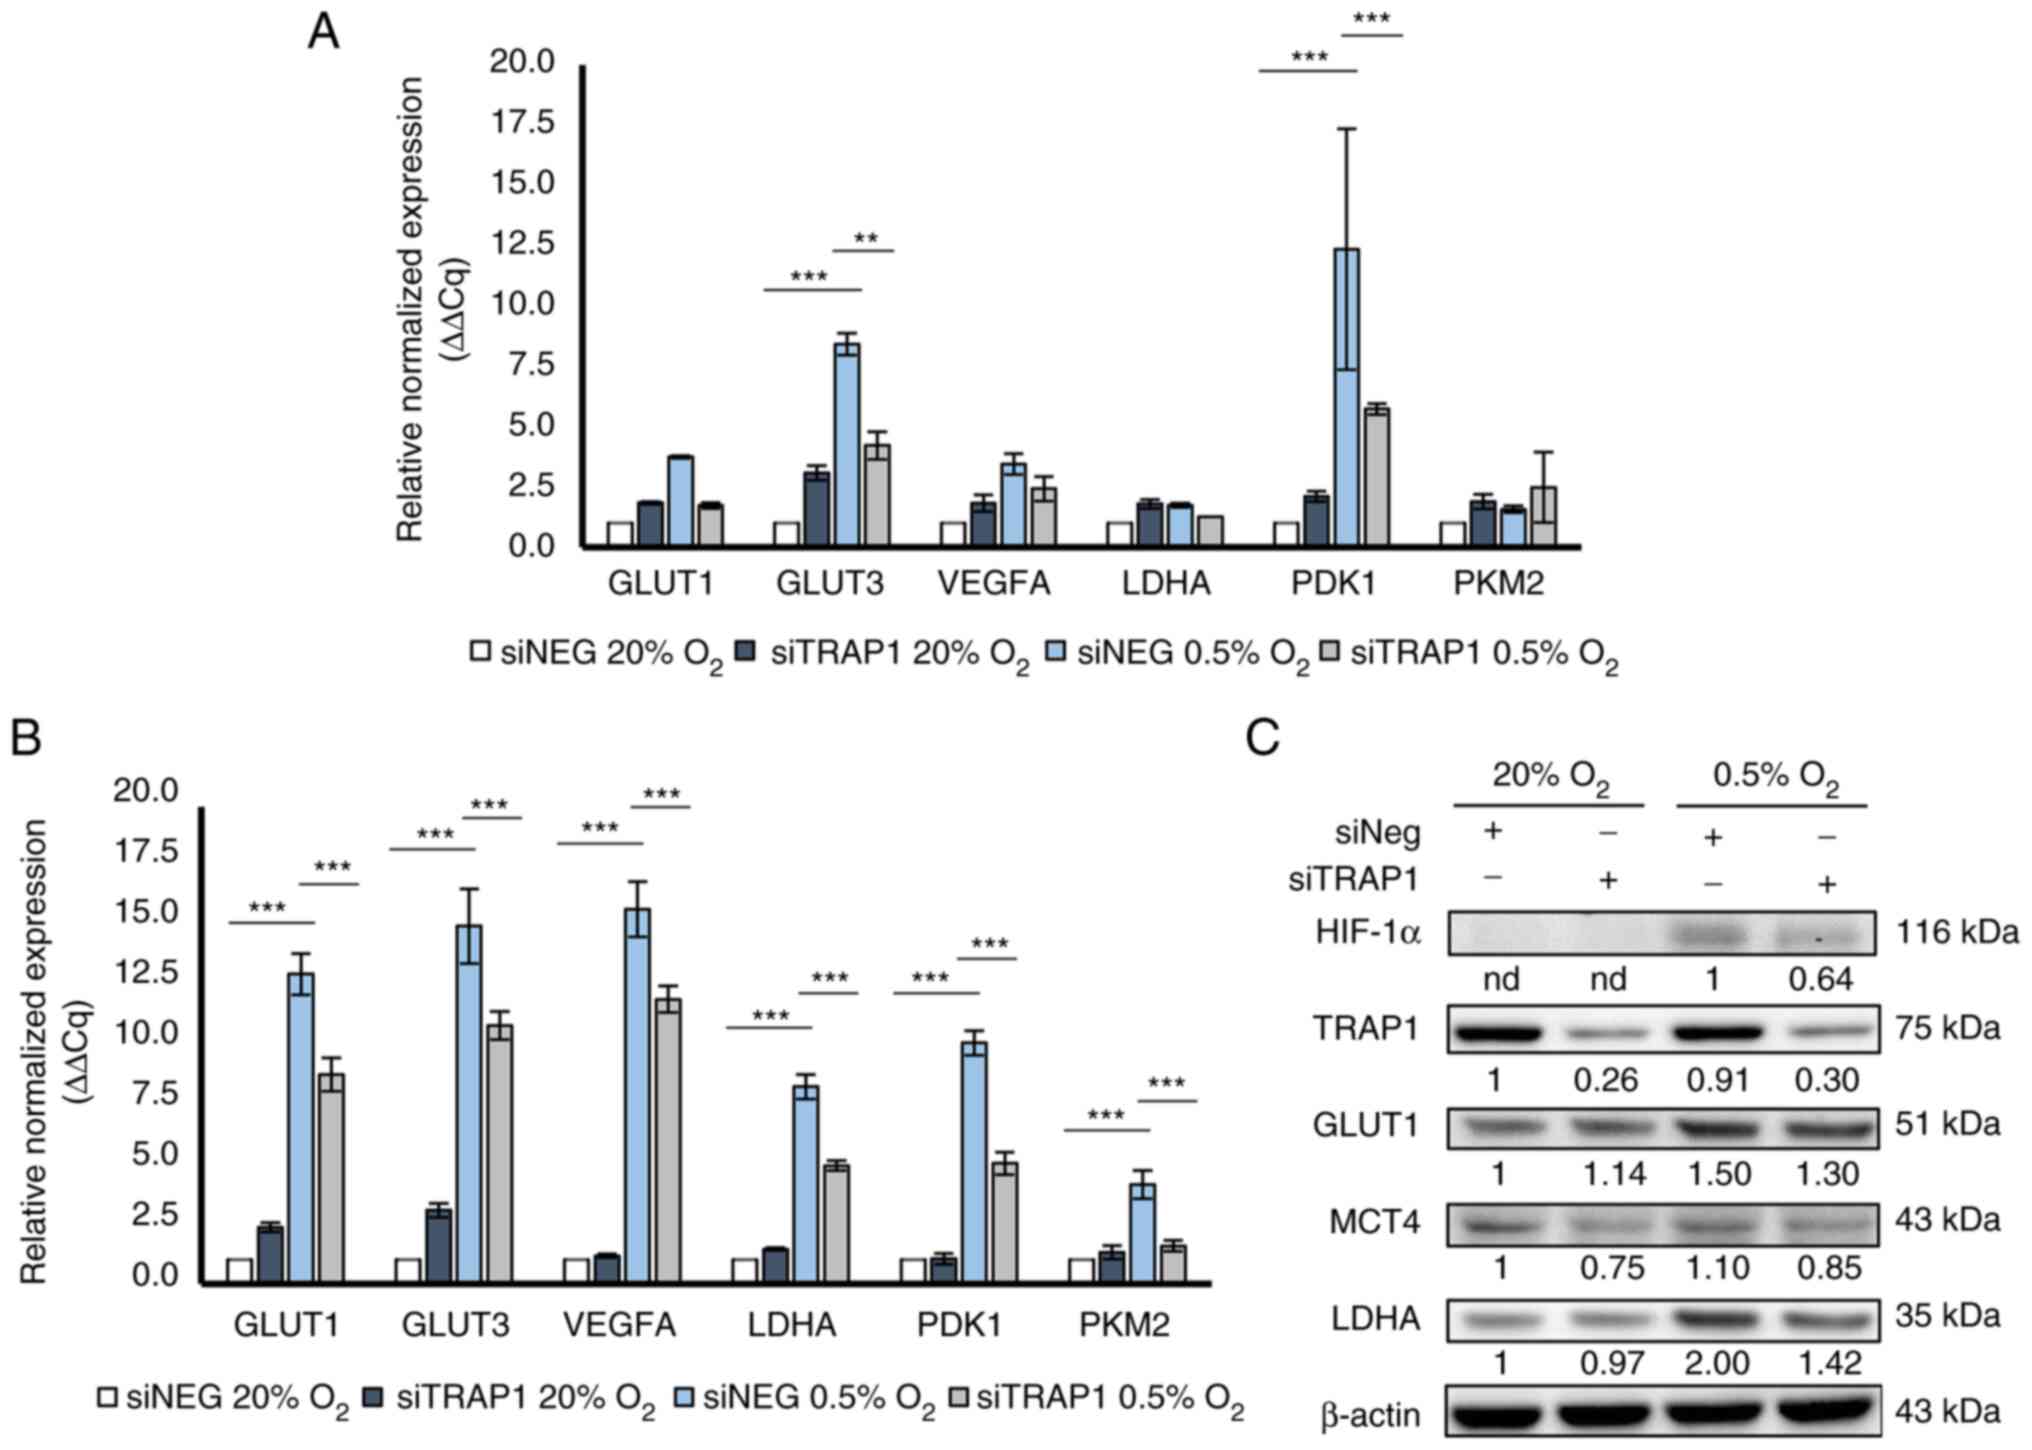
To functionally characterize TRAP1-dependent HIF-1α
stabilization in CRC, the role of TRAP1 in the HIF-1α-mediated
transcriptional reprogramming of metabolic genes under hypoxic
conditions was evaluated. HCT116 cells transiently silenced for
TRAP1 were incubated for 8 and 24 h at 20 and 0.5% O2
and assayed for the expression of both TRAP1 (Fig. S1B) and HIF-1α-inducible genes
commonly involved in metabolic and angiogenic pathways (i.e.,
GLUT1, GLUT3, VEGFA, LDHA, PDK1, PKM2) (Fig. 2). Of note, TRAP1-silenced HCT116
cells failed to significantly activate the expression of some of
the evaluated genes after 8 h of hypoxia compared to the control
cells; the differential expression of GLUT3 (P<0.01) and PDK1
(P<0.001) was statistically significant (Fig. 2A). Consistently, TRAP1 silencing
resulted in the reduced expression of all tested genes under 24 h
of hypoxia (P<0.001; Fig. 2B).
Under normoxic conditions, no significant differences were observed
between the TRAP1-silenced and control cells at all time points,
with similar expression levels observed for all tested genes
(Fig. 2A and B). In parallel
experiments, western blot analysis was used to evaluate HIF-1α
stabilization and the expression of certain HIF-1α-target genes,
i.e., GLUT1, LDHA and MCT4 in a high vs. low TRAP1 background under
hypoxic conditions (Fig. 2C).
Consistent with the RT-qPCR data, TRAP1 silencing led to the lower
stabilization of HIF-1α and to lower levels of GLUT1, LDHA and MCT4
under hypoxic conditions compared to the control cells.
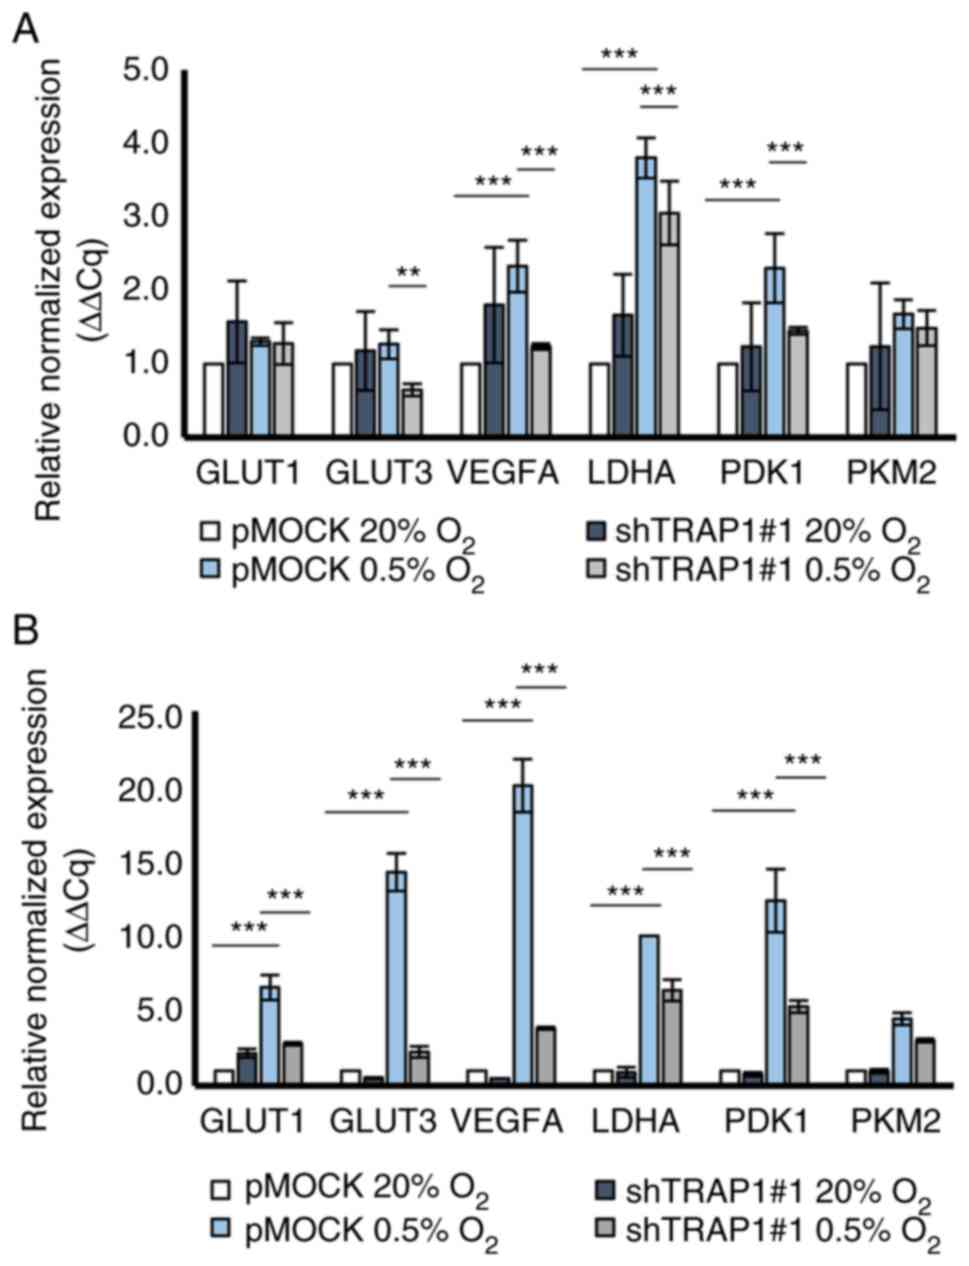
These experiments were further extended to a
3D-model of human CRC organoids, based on the rationale that the
growth of organoids within a 3D matrix favors the spontaneous
generation of hypoxic areas, as observed in tumors (37). For these experiments, pMOCK and
TRAP1-silenced p9T organoids were generated. Four different shTRAP1
lentiviruses (#1, #2, #3 and #4) were first tested for the
efficiency of transfection in both 293T and HCT116 cells evaluating
TRAP1 silencing using RT-qPCR and western blot analysis (Fig. S1C, left and right panels,
respectively), and shTRAP1 #1 and shTRAP1 #3 lentiviruses were
selected for their highest silencing effectiveness. In subsequent
experiments, shTRAP1 #1 and shTRAP1 #3 were tested for the
efficiency of transduction in p9T organoids (Fig. S1D) and shTRAP1 #1 p9T organoids
were used for further experiments aimed at validating the role of
TRAP1 in the regulation of HIF-1α transcriptional activity. pMOCK
and TRAP1-silenced p9T organoids were incubated for 8 and 24 h at
0.5 and 20% O2 and analyzed using RT-qPCR for TRAP1
(Fig. S1E) and HIF-1α inducible
genes (Fig. 3) expression levels.
The majority of genes exhibited a significant and progressive
upregulation in a TRAP1 high expression background under hypoxic
conditions starting from 8 h (Fig.
3A) and reaching the highest level at 24 h (Fig. 3B). Notably, TRAP1 silencing
resulted in a decreased expression of all tested genes under
hypoxic conditions (Fig. 3), with
maximal statistical significance at 24 h, as observed in the HCT116
cells.
TRAP1 silencing promotes ribosomal
biogenesis under hypoxic conditions
As data described above demonstrating a role of
TRAP1 in hypoxia-induced gene expression reprogramming, a whole
genome gene expression profiling was performed in TRAP1-silenced
and control HCT116 cells exposed to normoxia and hypoxia for 24 h.
As was expected, oxygen deprivation promoted significant gene
expression reprogramming with 2,665 downregulated and 2,041
upregulated genes compared to the normoxic control (abs logFC
≥0.60, P<0.05). Furthermore, 1,071 genes were differentially
expressed (347 downregulated and 724 upregulated) in TRAP1-silenced
compared to control HCT116 cells under hypoxic conditions (abs
logFC ≥0.60, P<0.05) (Table
SII).
GSEA was performed to obtain functional enrichments
of differentially expressed genes focusing on the following
categories: Hallmark, Gene Ontology (GO) and Pathway (abs
enrichment score ≥0.60, P<0.05) (Table SIII). Although very few Hallmarks
were enriched, the two most upregulated Hallmarks under hypoxic
conditions were HYPOXIA and ANGIOGENESIS, confirming that, under
the current experimental conditions, hypoxic stress regulated gene
expression to promote oncogenic and angiogenetic pathways (10-16). Furthermore, several GOs and
Pathways were functionally regulated in our experimental
conditions. In particular, 453 (227 downregulated and 226
upregulated) and 201 (62 downregulated and 139 upregulated) GOs
were enriched comparing hypoxia (siNEG 0.5% O2) vs.
normoxia (siNEG 20% O2) and a low vs. high TRAP1
background under hypoxic conditions (siTRAP1 0.5% O2 vs.
siNEG 0.5% O2), respectively. Among these, 58 enriched
GOs were present in both datasets and most of these exhibited an
opposite regulation after TRAP1 silencing under hypoxic conditions,
being up/downregulated in response to hypoxia in a high TRAP1
background and down/upregulated upon TRAP1 silencing under hypoxic
conditions (Table SIV).
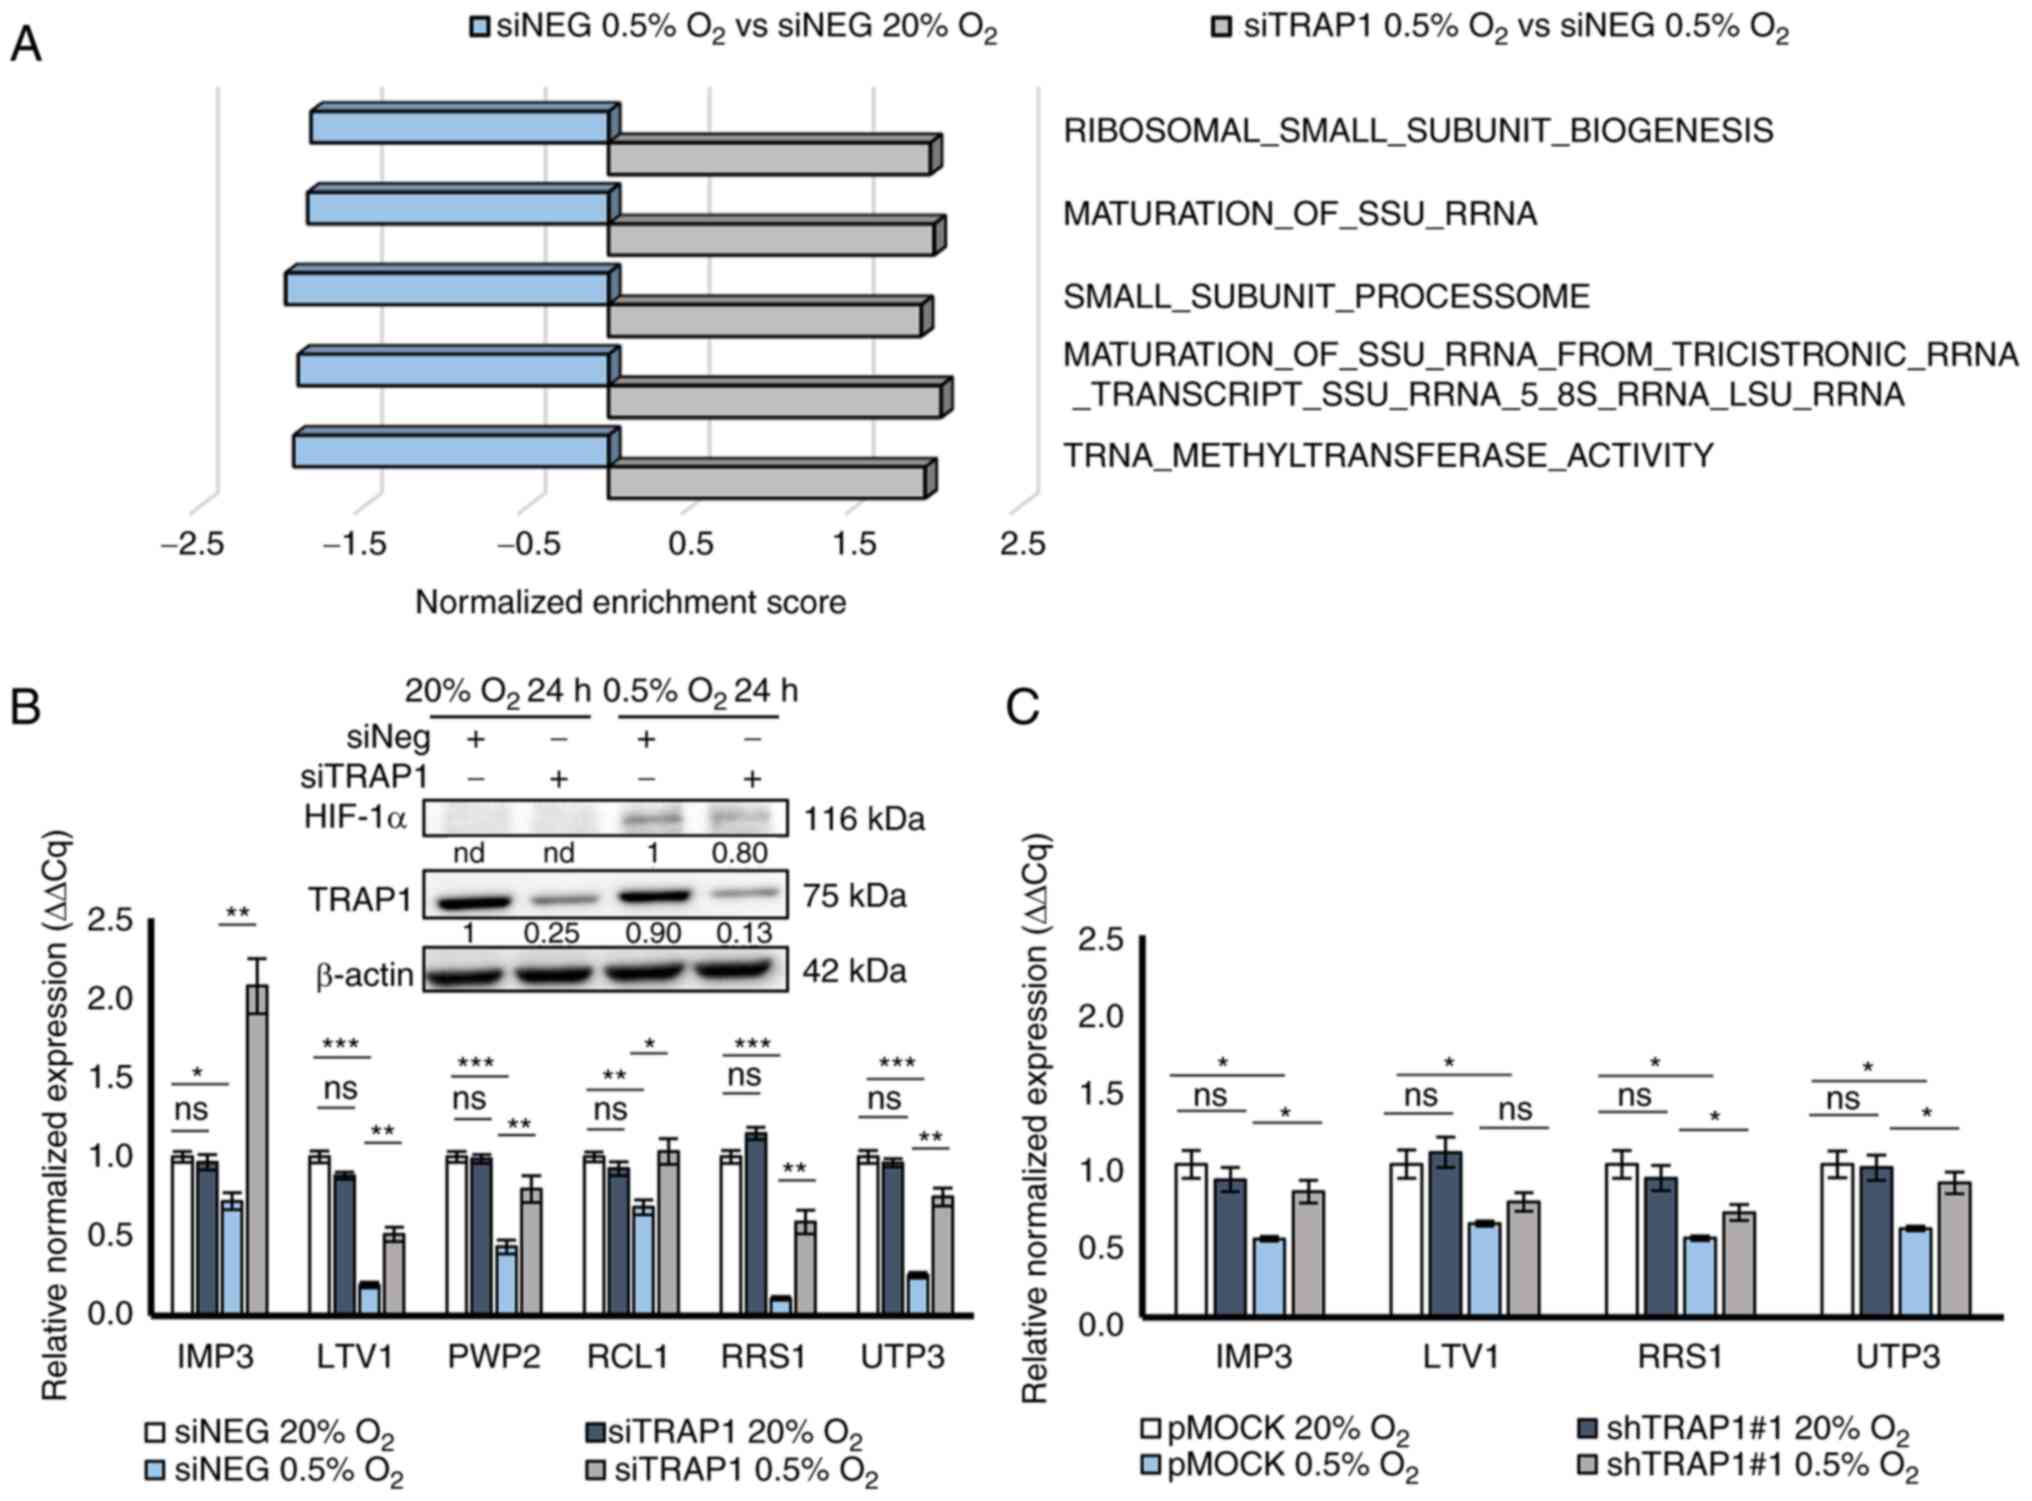
Focusing on the top five more significantly enriched
GOs in siTRAP1 0.5% O2 vs. siNEG 0.5% O2, a
positive regulation of ribosomal small subunit biogenesis emerged,
including the co-transcriptional assembly of tricistronic pre-rRNA
into the small subunit (SSU) processome and the subsequent
maturation of SSU rRNA 18S, contained in the 40S subunit of the
mature ribosome (Fig. 4A).
Noteworthy, these GOs were negatively regulated by hypoxia and
their downregulation was prevented by TRAP1 silencing under hypoxic
conditions. Instead, none of these GOs was enriched following TRAP1
silencing under normoxic conditions (siTRAP1 20% O2 vs.
siNEG 20% O2).
To validate the possible role of TRAP1 in sustaining
the ribosome biogenesis inhibition under hypoxic conditions, six
genes were selected (i.e., IMP3, LTV1, PWP2, RCL1, RRS1 and
UTP3) commonly involved in different steps of ribosome
biogenesis and maturation and differentially expressed in the
current experimental conditions, thus contributing to the
enrichment of previous GO categories (abs logFC ≥0.60, P<0.05).
The expression levels of these genes were evaluated using RT-qPCR
in both HCT116 cells and p9T organoids silenced or not for TRAP1
and exposed to hypoxia for 24 and 8 h, respectively (Fig. 4B and C). These time points were
selected based on data reported in Figs. 2 and 3, demonstrating an earlier
transcriptional reprogramming in response to hypoxia in CRC
organoids. No difference in expression was observed for all tested
genes in TRAP1-silenced cells (Fig.
4B) and shTRAP1#1 p9T organoids (Fig. 4C) compared to controls under
normoxic conditions; this was consistent with the GSEA data
demonstrating no enrichment of ribosome biogenesis/assembly GO
categories under normoxic conditions. Conversely, as was expected,
the hypoxic stimulus significantly suppressed the expression of
these genes in both the CRC experimental models and TRAP1 silencing
attenuated the inhibitory effects of hypoxia by promoting a higher
expression of these genes under hypoxic conditions (Fig. 4B and C). Two genes (i.e., PWP2 and
RCL1) were undetectable in p9T organoids and, thus, are not
illustrated in Fig. 4.
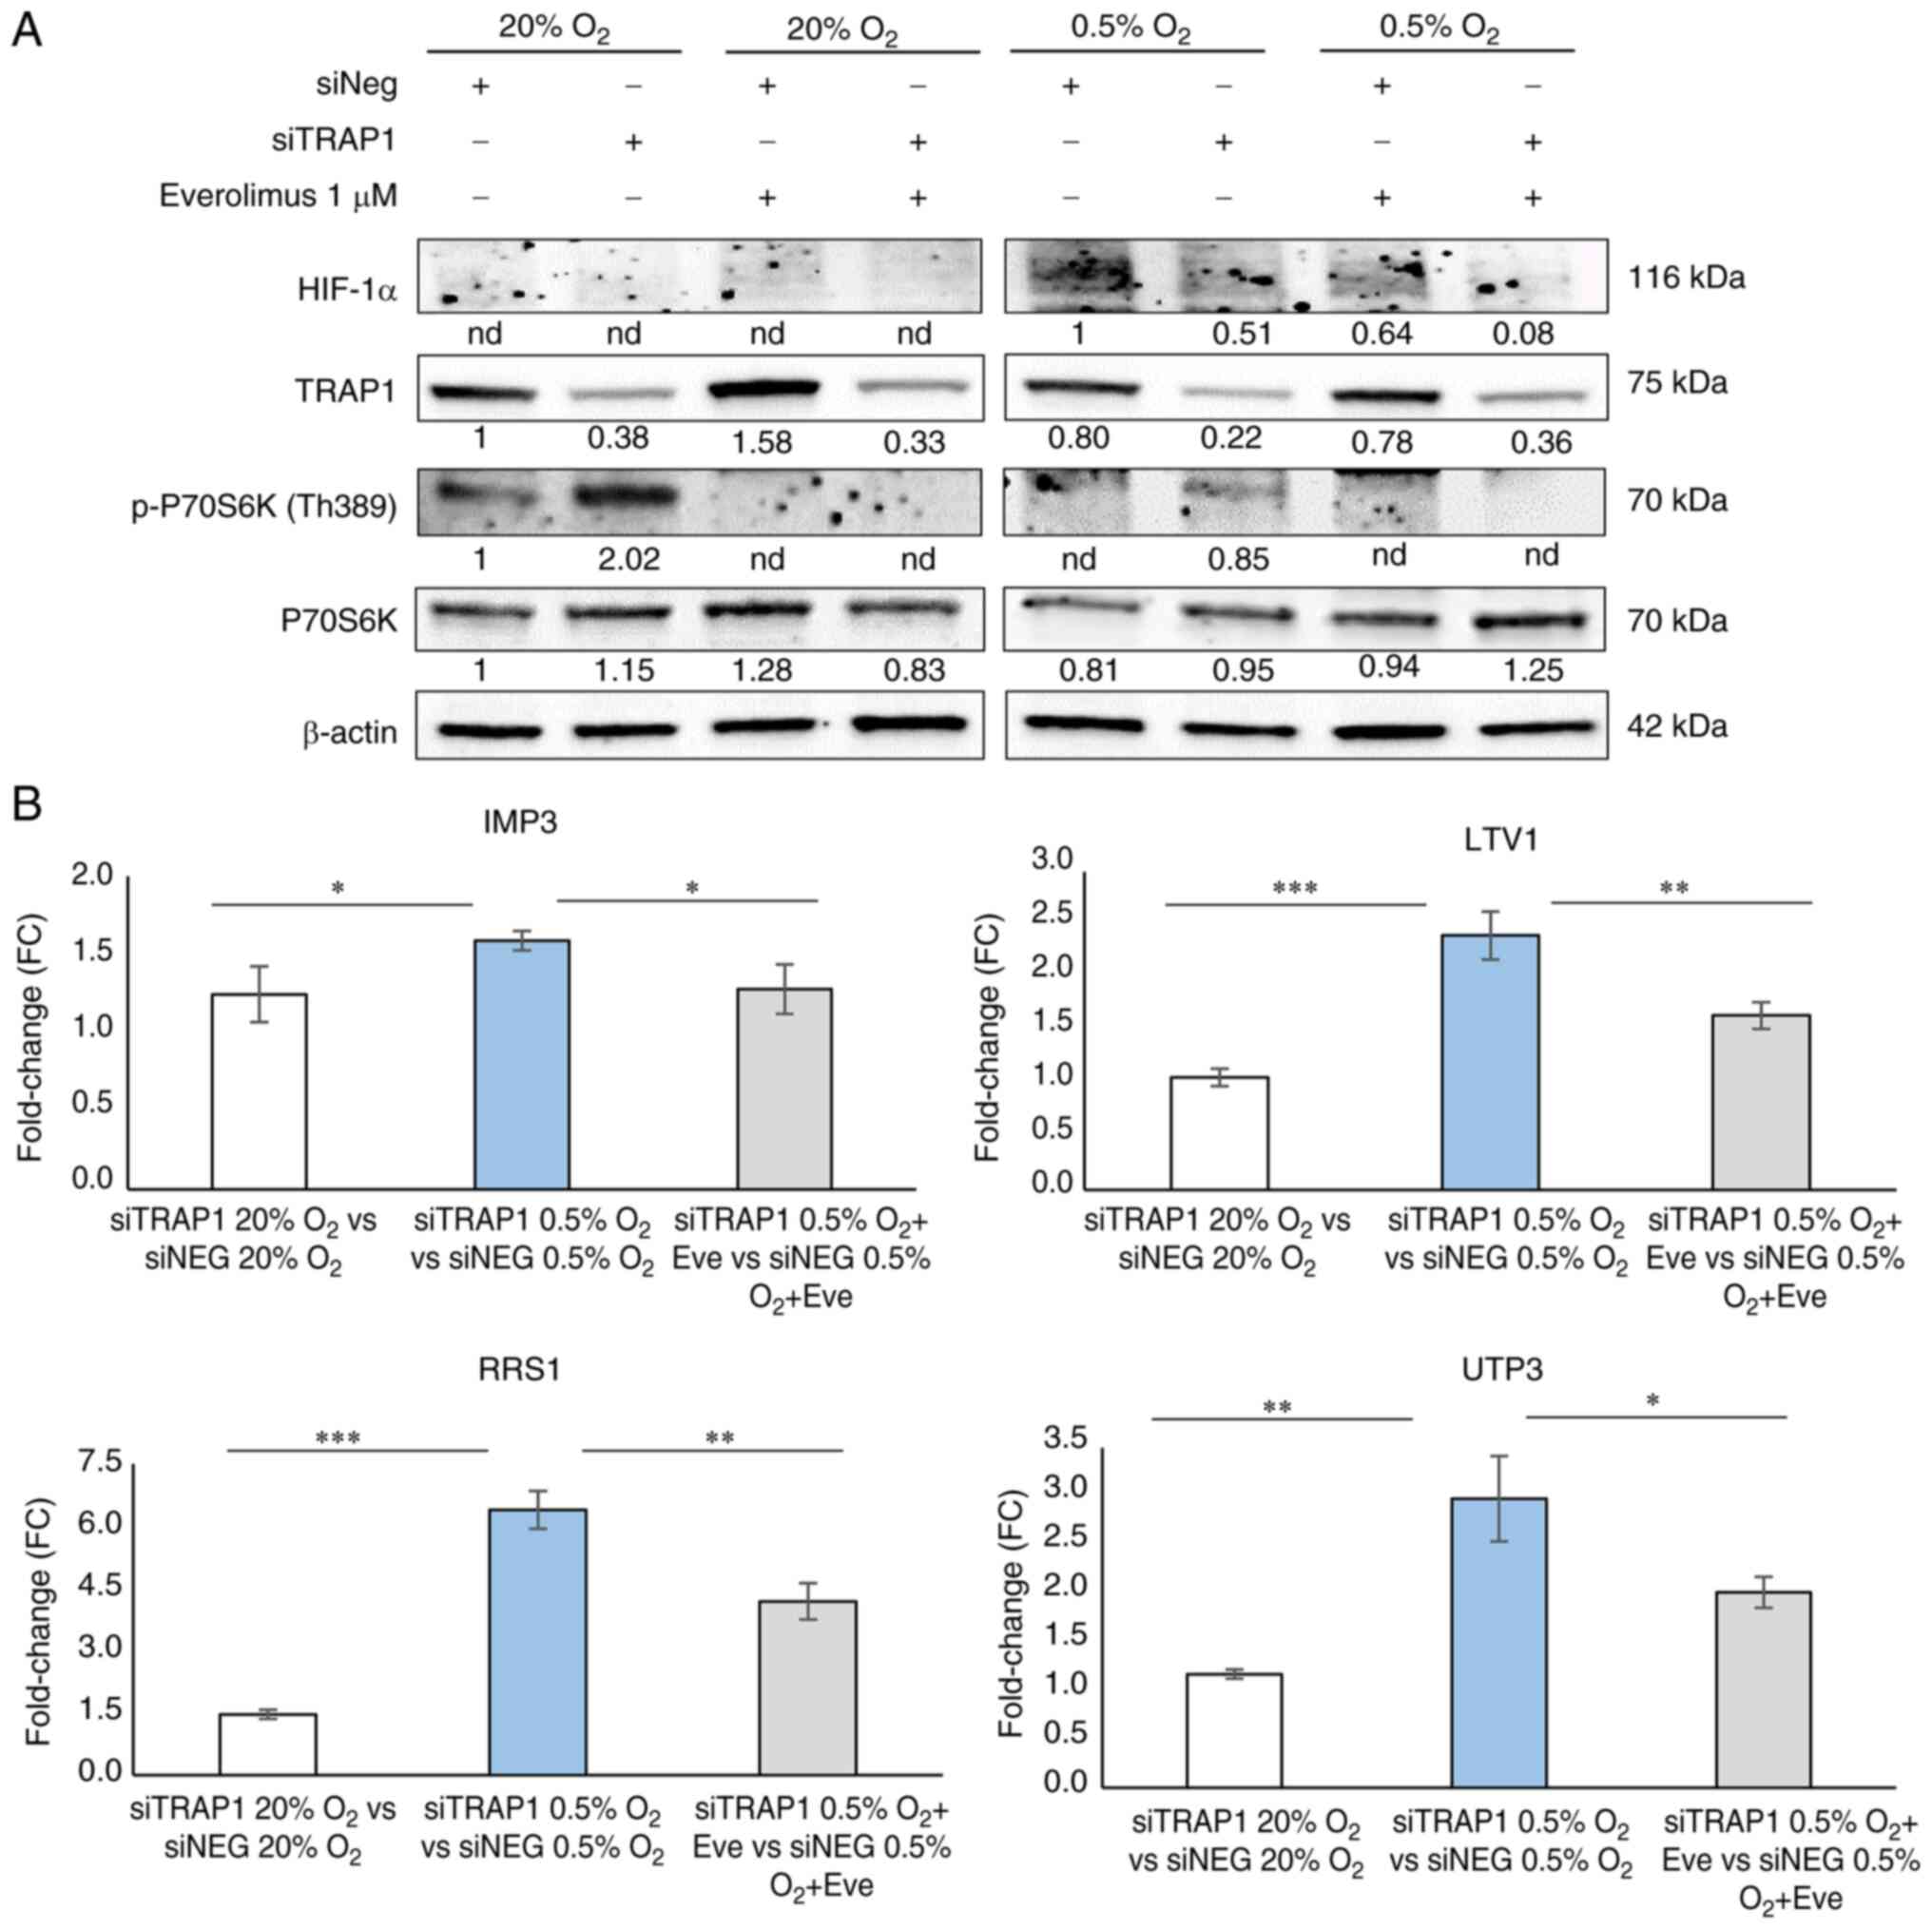
mTOR pathway is likely involved in the
TRAP1 regulation of ribosome biogenesis
Based on the hypothesis that the TRAP1 modulation of
ribosome biogenesis under hypoxic conditions may involve the
mTORC1/p70S6K pathway, western blot analysis was performed to
evaluate the phosphorylation status of p70S6K, a master regulator
of protein synthesis and ribosome biogenesis, in TRAP1-silenced
HCT116 cells exposed to hypoxia and treated with the mTOR inhibitor
everolimus at 1 µM for 24 h (Fig. 5A). Unlike oxygen deprivation that
suppressed p70S6K phosphorylation, TRAP1 silencing enhanced p70S6K
activation/phosphorylation compared to the respective controls and
this occurred both under normoxic and hypoxic conditions. Moreover,
the mTOR inhibitor, everolimus, hampered p70S6K phosphorylation
under normoxic and hypoxic conditions, and in high and low TRAP1
expression backgrounds (Fig.
5A).
To corroborate the link between the TRAP1 regulation
of the mTOR pathway and its control of ribosome biogenesis under
hypoxic conditions, four ribosome biogenesis-related genes (i.e.,
IMP3, LTV1, RRS1 and UTP3) were further evaluated
using RT-qPCR in TRAP1-silenced cells exposed to normoxia and
hypoxia for 24 h in the presence or absence of everolimus (Fig. 5B). Data are reported as the fold
change (FC) increase in gene expression in TRAP1-silenced cells
compared to the respective control under normoxic and hypoxic
conditions, and in the presence or absence of everolimus. As
observed in Fig. 4A, TRAP1
silencing resulted in the upregulation of the expression of these
genes under hypoxic conditions, and this occurred in parallel with
mTOR signaling activation (Fig.
5A). Of note, mTOR signaling inhibition by everolimus in
TRAP1-silenced cells attenuated the upregulation of these genes
(Fig. 5B). According to
previously described data, no significant differences (FC <1.5)
were observed after TRAP1 silencing under normoxic conditions
(siTRAP1 20% O2 vs. siNEG 20% O2).
Discussion
CRC is responsible for 10% of all cancer types,
affecting almost 1.9 million new individuals each year (38) and its mortality rate results in
almost 880,000 deaths/year, rendering CRC the second-leading cause
of cancer-related deaths (39,40). Despite important advancements in
CRC therapy, the vast majority of patients with metastatic disease
experience disease progression in response to current treatments
and thus, the identification of novel reliable biomarkers and/or
targetable pathways associated with CRC onset and progression is
required. In this context, metabolic pathways are currently
regarded as novel therapeutic targets in solid tumors (41,42), based on the rationale that
metabolic reprogramming is considered a hallmark of cancer and
supports cancer cell growth and proliferation as well as cell
adaptation to unfavorable microenvironments (43).
A frequent stressful condition for solid tumors is
the limited availability of oxygen, to which cancer cells can
rapidly adapt by activating several survival pathways and, among
others, stabilizing the transcription factor HIF-1α, which plays a
fundamental role in mediating cellular adaptive responses, inducing
the expression of several metabolic genes (11-15) and inhibiting high energy consuming
processes (44-47). Indeed, HIF-1α is widely considered
the master regulator of cancer cell response to oxygen deprivation
and its activation favors a rapid and sustained reprogramming of
cancer cells, leading to the induction of angiogenesis and
metabolic rewiring towards Warburg metabolism (10,16).
Molecular chaperones function as hub proteins
connecting metabolic pathways and cancer cell reprogramming
mechanisms (22,48). The authors have previously
reported that TRAP1 is upregulated in human CRCs (18,49) and that its expression is directly
associated with a poor clinical outcome (18), drug resistance (49) and the inhibition of mitochondrial
respiration (24). Recently, it
emerged that high TRAP1 levels enhance Warburg metabolism in CRC
tissues, patient-derived spheroids and cell lines and that this
molecular chaperone can modulate glycolysis controlling PFK1
activity/stability (23).
Furthermore, it has already been reported that TRAP1 is involved in
HIF-1α stabilization under normoxic conditions and that this
process occurs downstream of TRAP1 inhibition of succinate
dehydrogenase and respiratory chain (24). Indeed, TRAP1 inhibits complexes II
and IV of the respiratory chain with consequent succinate
accumulation and favors HIF-1α stabilization due to inhibition of
prolyl hydrolases and HIF-1α degradation (24,25).
In the present study, the role of TRAP1 in
controlling cell response to hypoxia was investigated in CRC cell
models, using both stabilized cell lines and organoids. It was
observed that TRAP1 supports hypoxia-induced metabolic rewiring,
increases glucose intake and lactate production and supports HIF-1α
stabilization under hypoxia, thus favoring cellular adaptation to
oxygen deprivation. Furthermore, TRAP1-mediated HIF-1α
stabilization functionally sustains HIF-1α-dependent gene
expression reprogramming in both human CRC cells and
patient-derived organoids. Thus, it can be hypothesized that TRAP1
is responsible for HIF-1α stabilization under either hypoxic or
normoxic conditions, and that this is likely finalized to reprogram
tumor metabolism and sustain the oncogenic program induced by
hypoxia.
In a translational perspective, it is important to
underline that these observations were not only reproduced, but
also more evident in CRC organoids, a tridimensional tumor model
that resembles several characteristics of human solid tumors
(50-52). In particular, the data of the
present study demonstrated an earlier transcriptional reprogramming
in response to hypoxia in organoids compared to monolayer cells,
since their growth within a 3D matrix already promotes the
formation of spontaneous hypoxic area which characterize solid
tumors (37). 2D cell cultures
cannot reproduce the spatial oxygen gradient and spatial
heterogeneity observed in vivo in tumors (53), as cancer cells are exposed to a
fixed concentration of oxygen partial pressure. Therefore, it is
not surprising that the 3D organoid model has often recently been
used to mimic hypoxic conditions and in vivo intratumoral
heterogeneity (54). Furthermore,
the present study suggested that a low TRAP1 expression background
induced a greater inhibitory effect on HIF-1α target gene
expression under hypoxic conditions in p9T organoids compared to
HCT116 cells, and this can be explained by the different cell
system and the higher efficacy and stability of shRNA silencing by
lentiviral transduction technology.
The adaptive response to hypoxic stress also
involves the inhibition of high-energy consuming processes as
ribosome biogenesis and protein synthesis (44-47). Indeed, hypoxia induces the
inhibition of the mTORC1 kinase (47,55-57), a master regulator of cellular
growth and proliferation and mRNA translation (58,59). mTORC1 is a conserved
serine/threonine kinase that phosphorylates downstream substrates
involved in protein synthesis as eukaryotic initiation factor 4E
(eIF4E)-binding protein 1 (4E-BP1) and ribosomal protein kinase S6
(S6K1 or p70S6K) (60). The
activation of mTORC1 stimulates protein synthesis and cell growth
by targeting effectors of both translation efficiency by existing
ribosomes and synthesis of new ribosomes (61). In particular, mTORC1 coordinates
the synthesis of ribosomal RNA (rRNA) and ribosomal proteins, the
major constituents of the ribosome (62-66). Indeed, mTORC1/p70S6K signaling is
required for the translation of mRNAs with 5′-terminal
oligopyrimidine tract (5′-TOP) sequences, among which many encode
for ribosomal proteins or regulators of translation (67-70). Additionally, p70S6K indirectly
enhances the transcription of the 45S ribosomal gene (rDNA) that
encodes for 18S, 28S and 5.8S rRNAs (63). In the present study, gene
expression analysis performed under hypoxic conditions and in a low
vs. high TRAP1 expression background, suggests that ribosome
biosynthesis is a main process downregulated in response to oxygen
deprivation and this requires high TRAP1 expression. This
observation is consistent with the findings of other studies
suggesting that TRAP1 influences adaptive biosynthetic processes
responsible for the optimization of cancer cell response to stress
(71), with TRAP1 being
responsible for the cell response to endoplasmic reticulum stress
(72), the quality control of
mitochondria-destined proteins (73) and the attenuation of protein
synthesis (70). Furthermore,
previous research by the authors has demonstrated a role of TRAP1
in regulating p70S6K phosphorylation and the cap-mediated
translation pathway in cancer cells (74). Thus, it can be hypothesized that
TRAP1 is at the crossroads between the HIF-1α and mTORC1 pathways,
both involved in cell responses to environmental stress conditions.
HIF-1α is responsible for mTORC1 inhibition (47,55-57) and as mTORC1 signaling is a key
regulator of ribosome biogenesis and protein synthesis (60-70), taken together, these data suggest
that this network is finalized at optimizing metabolic and
biosynthetic processes in cancer cells under conditions of oxygen
deprivation, thus, favoring the adaptation to a condition of
substrates and energy restriction. Of note, the upregulation of
such a network in cancer cells may provide survival and adaptive
mechanisms that sustain cancer progression in a hostile
environment. However, it is important to underline that these data
do not fully demonstrate the mechanistic link between HIF-1α
stabilization, mTORC1 inhibition and ribosome biogenesis
downregulation in a high TRAP1 expression background; thus, further
studies are required to depict the mechanisms involved at the
molecular level.
The findings of the present study support the
hypothesis that the intricate process of ribosomal subunits
synthesis and maturation is controlled by the TRAP1/HIF-1α/mTORC1
network at multiple steps. In this context, TRAP1 pathways
indirectly control the expression of several genes (i.e., PWP2,
IMP3, UTP3, RCL1, LTV1 and RRS1) coding for proteins
playing a role in different steps of ribosome production (75-85). Their expression is downregulated
in parallel with mTORC1 inhibition under hypoxic conditions in a
high TRAP1 expression background, it is preserved upon TRAP1
silencing under oxygen deprivation conditions, and it is
downregulated upon mTOR inhibition in a low TRAP1 expression
background. Taken together, these data suggest that the TRAP1
regulation of ribosome biosynthesis under hypoxic conditions occurs
through mTORC1 signaling regulation and that this involves the
modulation of multiple enzymes.
In conclusion, the results of the present study
support a role of TRAP1 in favoring human CRC adaptive responses to
oxygen deprivation. Indeed, TRAP1 i) controls HIF-1α stabilization
and maximizes Warburg metabolism in response to hypoxia; ii) is
able to sustain the oncogenic program induced by hypoxia; and iii)
modulates ribosome biogenesis in response to hypoxia to limit
cellular energy consumption and this occurs through the mTOR
pathway inhibition. Thus, TRAP1 may be considered a potential
target for developing innovative therapies aimed at blocking
molecular mechanisms that allow cancer cells to survive to
unfavorable environmental conditions.
Supplementary Data
Availability of data and materials
All data generated or analyzed during this study are
included in this published article (and in the supplementary
files).
Author's contributions
ML conceived the study and designed the experiments.
VLB performed the metabolic experiments and generated the
TRAP1-silenced organoids in collaboration with the research group
of Professor Jacco van Rheenen (mentioned above). GB and VLB
performed the RT-qPCR analysis. VLB and AP performed the western
blot analysis. FC, VC and MP performed the whole genome gene
expression profiling. PZ, GB and AP analyzed the whole genome gene
expression profiling data. FM contributed to the metabolic
experiments. GG, DSM and FE assisted in the design of the
experiments and in the analysis of the data. GB and ML wrote the
manuscript with the assistance of GG, DSM and FE. All authors have
read and approved the final manuscript. GB, VLB, VC and PZ confirm
the authenticity of all the raw data.
Ethics approval and consent to
participate
Organoids were generated by the Nederlands Kanker
Instituut-Antoni van Leeuwenhoek (NKI-AVL) and provided to the
authors' laboratory according to an MTA for Academic Institutions.
Organoids were generated in accordance with all applicable
Nederland laws and regulations, including but not limited to
patient's informed consent and in accordance with the NKI-AVL
Institutional Review Board procedure, and the approval of the
Medical Ethical Committee (MEC) of the NKI-AVL. Thus, according to
the MTA, the organoids were used only for research scopes following
the NKI-AVL institutional indications.
Patient consent for publication
Not applicable.
Competing interests
The authors declare that they have no competing
interests.
Acknowledgments
The authors would like to thank the research group
of Professor Jacco van Rheenen for their cooperation with the
generation of organoids, using samples from NKI-AVL Biobank.
Funding
The present study was supported by the '5 per mille' 2018-2019
LILT Investigator Grant. The present study was also supported by
PON AIM R&I 2014-2020-1879351-2. This manuscript has been
published with the financial support of the Department of Medical
and Surgical Sciences of the University of Foggia (project code
FINATENEO_DIRETTORE_ ASSNEQUALITA_MEDCHIR_2021) and the University
of Foggia (Fondo per i Progetti di Ricerca di Ateneo-PRA 2020).
References
|
1
|
Vander Heiden MG and DeBerardinis RJ:
Understanding the intersections between metabolism and cancer
biology. Cell. 168:657–669. 2017. View Article : Google Scholar : PubMed/NCBI
|
|
2
|
Liberti MV and Locasale JW: The Warburg
effect: How does it benefit cancer cells? Trends Biochem Sci.
41:211–218. 2016. View Article : Google Scholar : PubMed/NCBI
|
|
3
|
Schwartz L, Supuran CT and Alfarouk KO:
The Warburg effect and the hallmarks of cancer. Anticancer Agents
Med Chem. 17:164–170. 2017. View Article : Google Scholar
|
|
4
|
Yu L, Lu M, Jia D, Ma J, Ben-Jacob E,
Levine H, Kaipparettu BA and Onuchic JN: Modeling the genetic
regulation of cancer metabolism: Interplay between glycolysis and
oxidative phosphorylation. Cancer Res. 77:1564–1574. 2017.
View Article : Google Scholar : PubMed/NCBI
|
|
5
|
Jing X, Yang F, Shao C, Wei K, Xie M, Shen
H and Shu Y: Role of hypoxia in cancer therapy by regulating the
tumor microenvironment. Mol Cancer. 18:1572019. View Article : Google Scholar : PubMed/NCBI
|
|
6
|
Zhang Y, Zhang H, Wang M, Schmid T, Xin Z,
Kozhuharova L, Yu WK, Huang Y, Cai F and Biskup E: Hypoxia in
breast cancer-scientific translation to therapeutic and diagnostic
clinical applications. Front Oncol. 11:6522662021. View Article : Google Scholar : PubMed/NCBI
|
|
7
|
Miranda E, Nordgren IK, Male AL, Lawrence
CE, Hoakwie F, Cuda F, Court W, Fox KR, Townsend PA, Packham GK, et
al: A cyclic peptide inhibitor of HIF-1 heterodimerization that
inhibits hypoxia signaling in cancer cells. J Am Chem Soc.
135:10418–10425. 2013. View Article : Google Scholar : PubMed/NCBI
|
|
8
|
Burslem GM, Kyle HF, Nelson A, Edwards TA
and Wilson AJ: Hypoxia inducible factor (HIF) as a model for
studying inhibition of protein-protein interactions. Chem Sci.
8:4188–4202. 2017. View Article : Google Scholar : PubMed/NCBI
|
|
9
|
Nagao A, Kobayashi M, Koyasu S, Chow CCT
and Harada H: HIF-1-dependent reprogramming of glucose metabolic
pathway of cancer cells and its therapeutic significance. Int J Mol
Sci. 20:2382019. View Article : Google Scholar :
|
|
10
|
Saponaro C, Malfettone A, Ranieri G, Danza
K, Simone G, Paradiso A and Mangia A: VEGF, HIF-1α expression and
MVD as an angiogenic network in familial breast cancer. PLoS One.
8:e530702013. View Article : Google Scholar
|
|
11
|
Shen LF, Zhou SH and Yu Q: Relationships
between expression of glucose transporter protein-1 and hypoxia
inducible factor-1α, prognosis and 18F-FDG uptake in
laryngeal and hypopharyngeal carcinomas. Transl Cancer Res.
9:2824–2837. 2020. View Article : Google Scholar : PubMed/NCBI
|
|
12
|
Semenza GL: HIF-1 mediates metabolic
responses to intratumoral hypoxia and oncogenic mutations. J Clin
Invest. 123:3664–3671. 2013. View Article : Google Scholar : PubMed/NCBI
|
|
13
|
He G, Yi J, Bo Z and Wu G: The effect of
HIF-1α on glucose metabolism, growth and apoptosis of pancreatic
cancerous cells. Asia Pac J Clin Nutr. 23:174–180. 2014.
|
|
14
|
Goodwin J, Choi H, Hsieh MH, Neugent ML,
Ahn JM, Hayenga HN, Singh PK, Shackelford DB, Lee IK, Shulaev V, et
al: Targeting hypoxia-inducible factor-1α/pyruvate dehydrogenase
kinase 1 axis by dichloroacetate suppresses bleomycin-induced
pulmonary fibrosis. Am J Respir Cell Mol Biol. 58:216–231. 2018.
View Article : Google Scholar :
|
|
15
|
Kierans SJ and Taylor CT: Regulation of
glycolysis by the hypoxia-inducible factor (HIF): Implications for
cellular physiology. J Physiol. 599:23–37. 2021. View Article : Google Scholar
|
|
16
|
Samec M, Liskova A, Koklesova L, Mersakova
S, Strnadel J, Kajo K, Pec M, Zhai K, Smejkal K, Mirzaei S, et al:
Flavonoids targeting HIF-1: Implications on cancer metabolism.
Cancers (Basel). 13:1302021. View Article : Google Scholar
|
|
17
|
Condelli V, Crispo F, Pietrafesa M,
Lettini G, Matassa DS, Esposito F, Landriscina M and Maddalena F:
HSP90 molecular chaperones, metabolic rewiring, and epigenetics:
Impact on tumor progression and perspective for anticancer therapy.
Cells. 8:5322019. View Article : Google Scholar :
|
|
18
|
Maddalena F, Simeon V, Vita G, Bochicchio
A, Possidente L, Sisinni L, Lettini G, Condelli V, Matassa DS, Li
Bergolis V, et al: TRAP1 protein signature predicts outcome in
human metastatic colorectal carcinoma. Oncotarget. 8:21229–21240.
2017. View Article : Google Scholar : PubMed/NCBI
|
|
19
|
Amoroso MR, Matassa DS, Sisinni L, Lettini
G, Landriscina M and Esposito F: TRAP1 revisited: Novel
localizations and functions of a 'next-generation' biomarker
(review). Int J Oncol. 45:969–977. 2014. View Article : Google Scholar : PubMed/NCBI
|
|
20
|
Masgras I, Sanchez-Martin C, Colombo G and
Rasola A: The chaperone TRAP1 as a modulator of the mitochondrial
adaptations in cancer cells. Front Oncol. 7:582017. View Article : Google Scholar : PubMed/NCBI
|
|
21
|
Avolio R, Matassa DS, Criscuolo D,
Landriscina M and Esposito F: Modulation of mitochondrial metabolic
reprogramming and oxidative stress to overcome Chemoresistance in
Cancer. Biomolecules. 10:1352020. View Article : Google Scholar :
|
|
22
|
Matassa DS, Agliarulo I, Avolio R,
Landriscina M and Esposito F: TRAP1 regulation of cancer
metabolism: Dual role as oncogene or tumor suppressor. Genes
(Basel). 9:1952018. View Article : Google Scholar
|
|
23
|
Maddalena F, Condelli V, Matassa DS,
Pacelli C, Scrima R, Lettini G, Li Bergolis V, Pietrafesa M, Crispo
F, Piscazzi A, et al: TRAP1 enhances Warburg metabolism through
modulation of PFK1 expression/activity and favors resistance to
EGFR inhibitors in human colorectal carcinomas. Mol Oncol.
14:3030–3047. 2020. View Article : Google Scholar : PubMed/NCBI
|
|
24
|
Sciacovelli M, Guzzo G, Morello V, Frezza
C, Zheng L, Nannini N, Calabrese F, Laudiero G, Esposito F,
Landriscina M, et al: The mitochondrial chaperone TRAP1 promotes
neoplastic growth by inhibiting succinate dehydrogenase. Cell
Metab. 17:988–999. 2013. View Article : Google Scholar : PubMed/NCBI
|
|
25
|
Yoshida S, Tsutsumi S, Muhlebach G,
Sourbier C, Lee MJ, Lee S, Vartholomaiou E, Tatokoro M, Beebe K,
Miyajima N, et al: Molecular chaperone TRAP1 regulates a metabolic
switch between mitochondrial respiration and aerobic glycolysis.
Proc Natl Acad Sci USA. 110:E1604–E1612. 2013. View Article : Google Scholar : PubMed/NCBI
|
|
26
|
Livak KJ and Schmittgen TD: Analysis of
relative gene expression data using real-time quantitative PCR and
the 2(-Delta Delta C(T)) method. Methods. 25:402–408. 2001.
View Article : Google Scholar
|
|
27
|
Landriscina M, Laudiero G, Maddalena F,
Amoroso MR, Piscazzi A, Cozzolino F, Monti M, Garbi C, Fersini A,
Pucci P and Esposito F: Mitochondrial chaperone Trap1 and the
calcium binding protein Sorcin interact and protect cells against
apoptosis induced by antiblastic agents. Cancer Res. 70:6577–6586.
2010. View Article : Google Scholar : PubMed/NCBI
|
|
28
|
R Core Team: R: A language and environment
for statistical computing. R Foundation for Statistical Computing;
Vienna: 2019, https://www.R-project.org/.
|
|
29
|
Ritchie ME, Phipson B, Wu D, Hu Y, Law CW,
Shi W and Smyth GK: limma powers differential expression analyses
for RNA-sequencing and microarray studies. Nucleic Acids Res.
43:e472015. View Article : Google Scholar : PubMed/NCBI
|
|
30
|
Zito A, Lualdi M, Granata P, Cocciadiferro
D, Novelli A, Alberio T, Casalone R and Fasano M: Gene set
enrichment analysis of interaction networks weighted by node
centrality. Front Genet. 12:5776232021. View Article : Google Scholar : PubMed/NCBI
|
|
31
|
Liberzon A, Birger C, Thorvaldsdóttir H,
Ghandi M, Mesirov JP and Tamayo P: The molecular signatures
database (MSigDB) hallmark gene set collection. Cell Syst.
1:417–425. 2015. View Article : Google Scholar
|
|
32
|
Bartha Á and Győrffy B: http://TNMplot.comurisimpleTNMplot.com: A web tool
for the comparison of gene expression in normal, tumor and
metastatic tissues. Int J Mol Sci. 22:26222021. View Article : Google Scholar
|
|
33
|
Grandjean G, de Jong PR, James B, Koh MY,
Lemos R, Kingston J, Aleshin A, Bankston LA, Miller CP, Cho EJ, et
al: Definition of a novel feed-forward mechanism for
glycolysis-HIF1α signaling in hypoxic tumors highlights aldolase A
as a therapeutic target. Cancer Res. 76:4259–4269. 2016. View Article : Google Scholar : PubMed/NCBI
|
|
34
|
Xie H and Simon MC: Oxygen availability
and metabolic reprogramming in cancer. J Biol Chem.
292:16825–16832. 2017. View Article : Google Scholar : PubMed/NCBI
|
|
35
|
Nowak N, Kulma A and Gutowicz J:
Up-regulation of key glycolysis proteins in cancer development.
Open Life Sci. 13:569–581. 2018. View Article : Google Scholar : PubMed/NCBI
|
|
36
|
Hao X, Ren Y, Feng M, Wang Q and Wang Y:
Metabolic reprogramming due to hypoxia in pancreatic cancer:
Implications for tumor formation, immunity, and more. Biomed
Pharmacother. 141:1117982021. View Article : Google Scholar : PubMed/NCBI
|
|
37
|
Silva-Almeida C, Ewart MA and Wilde C: 3D
gastrointestinal models and organoids to study metabolism in human
colon cancer. Semin Cell Dev Biol. 98:98–104. 2020. View Article : Google Scholar
|
|
38
|
Sung H, Ferlay J, Siegel RL, Laversanne M,
Soerjomataram I, Jemal A and Bray F: Global cancer statistics 2020:
GLOBOCAN estimates of incidence and mortality worldwide for 36
cancers in 185 countries. CA Cancer J Clin. 71:209–249. 2021.
View Article : Google Scholar : PubMed/NCBI
|
|
39
|
Brenner H, Kloor M and Pox CP: Colorectal
cancer. Lancet. 383:1490–1502. 2014. View Article : Google Scholar
|
|
40
|
Kuipers EJ, Grady WM, Lieberman D,
Seufferlein T, Sung JJ, Boelens PG, van de Velde CJ and Watanabe T:
Colorectal cancer. Nat Rev Dis Primers. 1:150652015. View Article : Google Scholar : PubMed/NCBI
|
|
41
|
Luengo A, Gui DY and Vander Heiden MG:
Targeting metabolism for cancer therapy. Cell Chem Biol.
24:1161–1180. 2017. View Article : Google Scholar : PubMed/NCBI
|
|
42
|
Li J, Eu JQ, Kong LR, Wang L, Lim YC, Goh
BC and Wong ALA: Targeting metabolism in cancer cells and the
tumour microenvironment for cancer therapy. Molecules. 25:48312020.
View Article : Google Scholar :
|
|
43
|
Galluzzi L, Kepp O, Vander Heiden MG and
Kroemer G: Metabolic targets for cancer therapy. Nat Rev Drug
Discov. 12:829–846. 2013. View Article : Google Scholar : PubMed/NCBI
|
|
44
|
Shah AN, Alam MM, Cao T and Zhang L: The
role of ribosomes in mediating hypoxia response and tolerance in
Eukaryotes. Nova Science Publishers Inc; ISBN:
978-1-62417-698-22013
|
|
45
|
Staudacher JJ, Naarmann-de Vries IS,
Ujvari SJ, Klinger B, Kasim M, Benko E, Ostareck-Lederer A,
Ostareck DH, Bondke Persson A, Lorenzen S, et al: Hypoxia-induced
gene expression results from selective mRNA partitioning to the
endoplasmic reticulum. Nucleic Acids Res. 43:3219–3236. 2015.
View Article : Google Scholar : PubMed/NCBI
|
|
46
|
Ivanova IG, Park CV and Kenneth NS:
Translating the hypoxic response-the role of HIF protein
translation in the cellular response to low oxygen. Cells.
8:1142019. View Article : Google Scholar
|
|
47
|
Chee NT, Lohse I and Brothers SP:
mRNA-to-protein translation in hypoxia. Mol Cancer. 18:492019.
View Article : Google Scholar : PubMed/NCBI
|
|
48
|
Sanchez-Martin C, Serapian SA, Colombo G
and Rasola A: Dynamically shaping chaperones. allosteric modulators
of HSP90 family as regulatory tools of cell metabolism in
neoplastic progression. Front Oncol. 10:11772020. View Article : Google Scholar : PubMed/NCBI
|
|
49
|
Costantino E, Maddalena F, Calise S,
Piscazzi A, Tirino V, Fersini A, Ambrosi A, Neri V, Esposito F and
Landriscina M: TRAP1, a novel mitochondrial chaperone responsible
for multi-drug resistance and protection from apoptotis in human
colorectal carcinoma cells. Cancer Lett. 279:39–46. 2009.
View Article : Google Scholar : PubMed/NCBI
|
|
50
|
Van de Wetering M, Francies HE, Francis
JM, Bounova G, Iorio F, Pronk A, van Houdt W, van Gorp J,
Taylor-Weiner A, Kester L, et al: Prospective derivation of a
living organoid biobank of colorectal cancer patients. Cell.
161:933–945. 2015. View Article : Google Scholar : PubMed/NCBI
|
|
51
|
Sachs N, de Ligt J, Kopper O, Gogola E,
Bounova G, Weeber F, Balgobind AV, Wind K, Gracanin A, Begthel H,
et al: A living biobank of breast cancer organoids captures disease
heterogeneity. Cell. 172:373–386.e10. 2018. View Article : Google Scholar
|
|
52
|
Yan HHN, Siu HC, Law S, Ho SL, Yue SSK,
Tsui WY, Chan D, Chan AS, Ma S, Lam KO, et al: A comprehensive
human gastric cancer organoid biobank captures tumor subtype
heterogeneity and enables therapeutic screening. Cell Stem Cell.
23:882–897.e11. 2018. View Article : Google Scholar : PubMed/NCBI
|
|
53
|
Aggarwal V, Miranda O, Johnston PA and
Sant S: Three dimensional engineered models to study hypoxia
biology in breast cancer. Cancer Lett. 490:124–142. 2020.
View Article : Google Scholar : PubMed/NCBI
|
|
54
|
Qiu GZ, Jin MZ, Dai JX, Sun W, Feng JH and
Jin WL: Reprogramming of the tumor in the hypoxic niche: The
emerging concept and associated therapeutic strategies. Trends
Pharmacol Sci. 38:669–686. 2017. View Article : Google Scholar : PubMed/NCBI
|
|
55
|
Marhold M, Tomasich E, El-Gazzar A, Heller
G, Spittler A, Horvat R, Krainer M and Horak P: HIF1α regulates
mTOR signaling and viability of prostate cancer stem cells. Mol
Cancer Res. 13:556–564. 2015. View Article : Google Scholar
|
|
56
|
Tan VP and Miyamoto S: Nutrient-sensing
mTORC1: Integration of metabolic and autophagic signals. J Mol Cell
Cardiol. 95:31–41. 2016. View Article : Google Scholar : PubMed/NCBI
|
|
57
|
Chun Y and Kim J: AMPK-mTOR signaling and
cellular adaptations in hypoxia. Int J Mol Sci. 22:97652021.
View Article : Google Scholar : PubMed/NCBI
|
|
58
|
Melick CH, Meng D and Jewell JL: A-kinase
anchoring protein 8L interacts with mTORC1 and promotes cell
growth. J Biol Chem. 295:8096–8105. 2020. View Article : Google Scholar : PubMed/NCBI
|
|
59
|
Amin AG, Jeong SW, Gillick JL, Sursal T,
Murali R, Gandhi CD and Jhanwar-Uniyal M: Targeting the mTOR
pathway using novel ATP-competitive inhibitors, Torin1, Torin2 and
XL388, in the treatment of glioblastoma. Int J Oncol. 59:832021.
View Article : Google Scholar :
|
|
60
|
Morita M, Gravel SP, Hulea L, Larsson O,
Pollak M, St-Pierre J and Topisirovic I: mTOR coordinates protein
synthesis, mitochondrial activity and proliferation. Cell Cycle.
14:473–480. 2015. View Article : Google Scholar : PubMed/NCBI
|
|
61
|
Hannan KM, Sanij E, Hein N, Hannan RD and
Pearson RB: Signaling to the ribosome in cancer-it is more than
just mTORC1. IUBMB Life. 63:79–85. 2011. View Article : Google Scholar : PubMed/NCBI
|
|
62
|
Iadevaia V, Liu R and Proud CG: mTORC1
signaling controls multiple steps in ribosome biogenesis. Semin
Cell Dev Biol. 36:113–120. 2014. View Article : Google Scholar : PubMed/NCBI
|
|
63
|
Tee AR: The target of rapamycin and
mechanisms of cell growth. Int J Mol Sci. 19:8802018. View Article : Google Scholar :
|
|
64
|
Gentilella A, Kozma SC and Thomas G: A
liaison between mTOR signaling, ribosome biogenesis and cancer.
Biochim Biophys Acta. 1849:812–820. 2015. View Article : Google Scholar : PubMed/NCBI
|
|
65
|
Valvezan AJ, Turner M, Belaid A, Lam HC,
Miller SK, McNamara MC, Baglini C, Housden BE, Perrimon N,
Kwiatkowski DJ, et al: mTORC1 couples nucleotide synthesis to
nucleotide demand resulting in a targetable metabolic
vulnerability. Cancer Cell. 32:624–638.e5. 2017. View Article : Google Scholar : PubMed/NCBI
|
|
66
|
Pelletier J, Thomas G and Volarević S:
Ribosome biogenesis in cancer: New players and therapeutic avenues.
Nat Rev Cancer. 18:51–63. 2018. View Article : Google Scholar
|
|
67
|
Chaillou T, Kirby TJ and McCarthy JJ:
Ribosome biogenesis: Emerging evidence for a central role in the
regulation of skeletal muscle mass. J Cell Physiol. 229:1584–1594.
2014. View Article : Google Scholar : PubMed/NCBI
|
|
68
|
Chen L, Xu B, Liu L, Liu C, Luo Y, Chen X,
Barzegar M, Chung J and Huang S: Both mTORC1 and mTORC2 are
involved in the regulation of cell adhesion. Oncotarget.
6:7136–7150. 2015. View Article : Google Scholar : PubMed/NCBI
|
|
69
|
Rad E, Murray JT and Tee AR: Oncogenic
signalling through mechanistic target of rapamycin (mTOR): A driver
of metabolic transformation and cancer progression. Cancers
(Basel). 10:52018. View Article : Google Scholar
|
|
70
|
Yeh HS and Yong J: mTOR-coordinated
post-transcriptional gene regulations: From fundamental to
pathogenic insights. J Lipid Atheroscler. 9:8–22. 2020. View Article : Google Scholar : PubMed/NCBI
|
|
71
|
Matassa DS, Amoroso MR, Agliarulo I,
Maddalena F, Sisinni L, Paladino S, Romano S, Romano MF, Sagar V,
Loreni F, et al: Translational control in the stress adaptive
response of cancer cells: A novel role for the heat shock protein
TRAP1. Cell Death Dis. 4:e8512013. View Article : Google Scholar : PubMed/NCBI
|
|
72
|
Sisinni L, Maddalena F, Lettini G,
Condelli V, Matassa DS, Esposito F and Landriscina M: TRAP1 role in
endoplasmic reticulum stress protection favors resistance to
anthracyclins in breast carcinoma cells. Int J Oncol. 44:573–582.
2014. View Article : Google Scholar
|
|
73
|
Amoroso MR, Matassa DS, Laudiero G,
Egorova AV, Polishchuk RS, Maddalena F, Piscazzi A, Paladino S,
Sarnataro D, Garbi C, et al: TRAP1 and the proteasome regulatory
particle TBP7/Rpt3 interact in the endoplasmic reticulum and
control cellular ubiquitination of specific mitochondrial proteins.
Cell Death Differ. 19:592–604. 2012. View Article : Google Scholar :
|
|
74
|
Matassa DS, Agliarulo I, Amoroso MR,
Maddalena F, Sepe L, Ferrari MC, Sagar V, D'Amico S, Loreni F,
Paolella G, et al: TRAP1-dependent regulation of p70S6K is involved
in the attenuation of protein synthesis and cell migration:
Relevance in human colorectal tumors. Mol Oncol. 8:1482–1494. 2014.
View Article : Google Scholar : PubMed/NCBI
|
|
75
|
Delprato A, Al Kadri Y, Pérébaskine N,
Monfoulet C, Henry Y, Henras AK and Fribourg S: Crucial role of the
Rcl1p-Bms1p interaction for yeast pre-ribosomal RNA processing.
Nucleic Acids Res. 42:10161–10172. 2014. View Article : Google Scholar : PubMed/NCBI
|
|
76
|
Kharde S, Calviño FR, Gumiero A, Wild K
and Sinning I: The structure of Rpf2-Rrs1 explains its role in
ribosome biogenesis. Nucleic Acids Res. 43:7083–7095. 2015.
View Article : Google Scholar : PubMed/NCBI
|
|
77
|
Turowski TW and Tollervey D:
Cotranscriptional events in eukaryotic ribosome synthesis. Wiley
Interdiscip Rev RNA. 6:129–139. 2015. View Article : Google Scholar
|
|
78
|
Wang Y, Zhu Q, Huang L, Zhu Y, Chen J,
Peng J and Lo LJ: Interaction between Bms1 and Rcl1, two ribosome
biogenesis factors, is evolutionally conserved in zebrafish and
human. J Genet Genomics. 43:467–469. 2016. View Article : Google Scholar : PubMed/NCBI
|
|
79
|
Kornprobst M, Turk M, Kellner N, Cheng J,
Flemming D, Koš-Braun I, Koš M, Thoms M, Berninghausen O, Beckmann
R and Hurt E: Architecture of the 90S pre-ribosome: A structural
view on the birth of the eukaryotic ribosome. Cell. 166:380–393.
2016. View Article : Google Scholar : PubMed/NCBI
|
|
80
|
Sun Q, Zhu X, Qi J, An W, Lan P, Tan D,
Chen R, Wang B, Zheng S, Zhang C, et al: Correction: Molecular
architecture of the 90S small subunit pre-ribosome. Elife.
6:e298762017. View Article : Google Scholar : PubMed/NCBI
|
|
81
|
Chaker-Margot M, Barandun J, Hunziker M
and Klinge S: Architecture of the yeast small subunit processome.
Science. 355:eaal18802017. View Article : Google Scholar
|
|
82
|
Boissier F, Schmidt CM, Linnemann J,
Fribourg S and Perez-Fernandez J: Pwp2 mediates UTP-B assembly via
two structurally independent domains. Sci Rep. 7:31692017.
View Article : Google Scholar : PubMed/NCBI
|
|
83
|
Zhao S, Chen Y, Chen F, Huang D, Shi H, Lo
LJ, Chen J and Peng J: Sas10 controls ribosome biogenesis by
stabilizing Mpp10 and delivering the Mpp10-Imp3-Imp4 complex to
nucleolus. Nucleic Acids Res. 47:2996–3012. 2019. View Article : Google Scholar : PubMed/NCBI
|
|
84
|
Scaiola A, Peña C, Melanie Weisser M,
Böhringer D, Leibundgut M, Klingauf-Nerurkar P, Gerhardy S, Panse
VG and Ban N: Structure of a eukaryotic cytoplasmic pre-40S
ribosomal subunit. EMBO J. 37:e984992018. View Article : Google Scholar : PubMed/NCBI
|
|
85
|
Sá-Moura B, Kornprobst M, Kharde S, Ahmed
YL, Stier G, Kunze R, Sinning I and Hurt E: Correction: Mpp10
represents a platform for the interaction of multiple factors
within the 90S pre-ribosome. PLoS One. 15:e02349322020. View Article : Google Scholar
|