Introduction
Cervical cancer (CC) is the fourth-most common
malignancy affecting women worldwide, and the gradual increase in
its incidence and mortality has attracted considerable attention
(1). In particular, the incidence
and mortality due to CC is high in the Xinjiang region of China
(2). Metastasis is responsible
for >90% of cancer-related deaths, and effective therapies for
metastatic cancer are limited (3). Lymph node metastasis (LNM) and blood
metastasis are common in the early and late stages of the disease,
respectively. CC mainly metastasizes via the lymphatic vessels and
direct extension (4). Therefore,
the prevention of LNM is critical for CC therapy. Accumulating
evidence suggests that LNM is a complex process involving
mechanical forces within the tumor and host tissues, as well as
molecular factors contributed by tumor cell proliferation, cytokine
production and lymphangiogenesis (5). Lymphangiogenesis involves the
migration of endothelial cells into tumors and formation of new
lymph vessels (6,7). However, lymphangiogenesis and its
regulatory mechanisms in CC remain unclear.
Metabolic changes are now considered biomarkers for
distinguishing the characteristics of metastatic tumors (8). Alterations in glucose metabolism,
characterized by an increased aerobic glycolysis (the Warburg
effect), is well-established as one of the hallmarks of cancer
(9), which contributes to tumor
growth and metastasis by providing energy and substrates for
biosynthesis (10,11). The authors previously tested
plasma samples from patients with CC and healthy individuals using
1H-nuclear magnetic resonance (1H-NMR)-based
untargeted metabolomics and found that glycolysis-related enzymes
were upregulated in CC tissues (12). This highlights the importance of
aerobic glycolysis in the progression of CC.
Receptor for activated C kinase 1 (RACK1) receptor,
a multifunctional scaffolding protein, is involved in nucleating
cell signaling hubs, regulating protein activity, and modulating
the migration and invasion of tumor cells (13). A previous study demonstrated that
RACK1 was highly expressed in CC tissues and positively associated
with the poor prognosis of patients with CC (14). However, the metabolic significance
and biological function of RACK1 in CC remain unclear. Based on the
aforementioned evidence, it was hypothesized that RACK1 promotes
LNM by regulating glycolysis in CC.
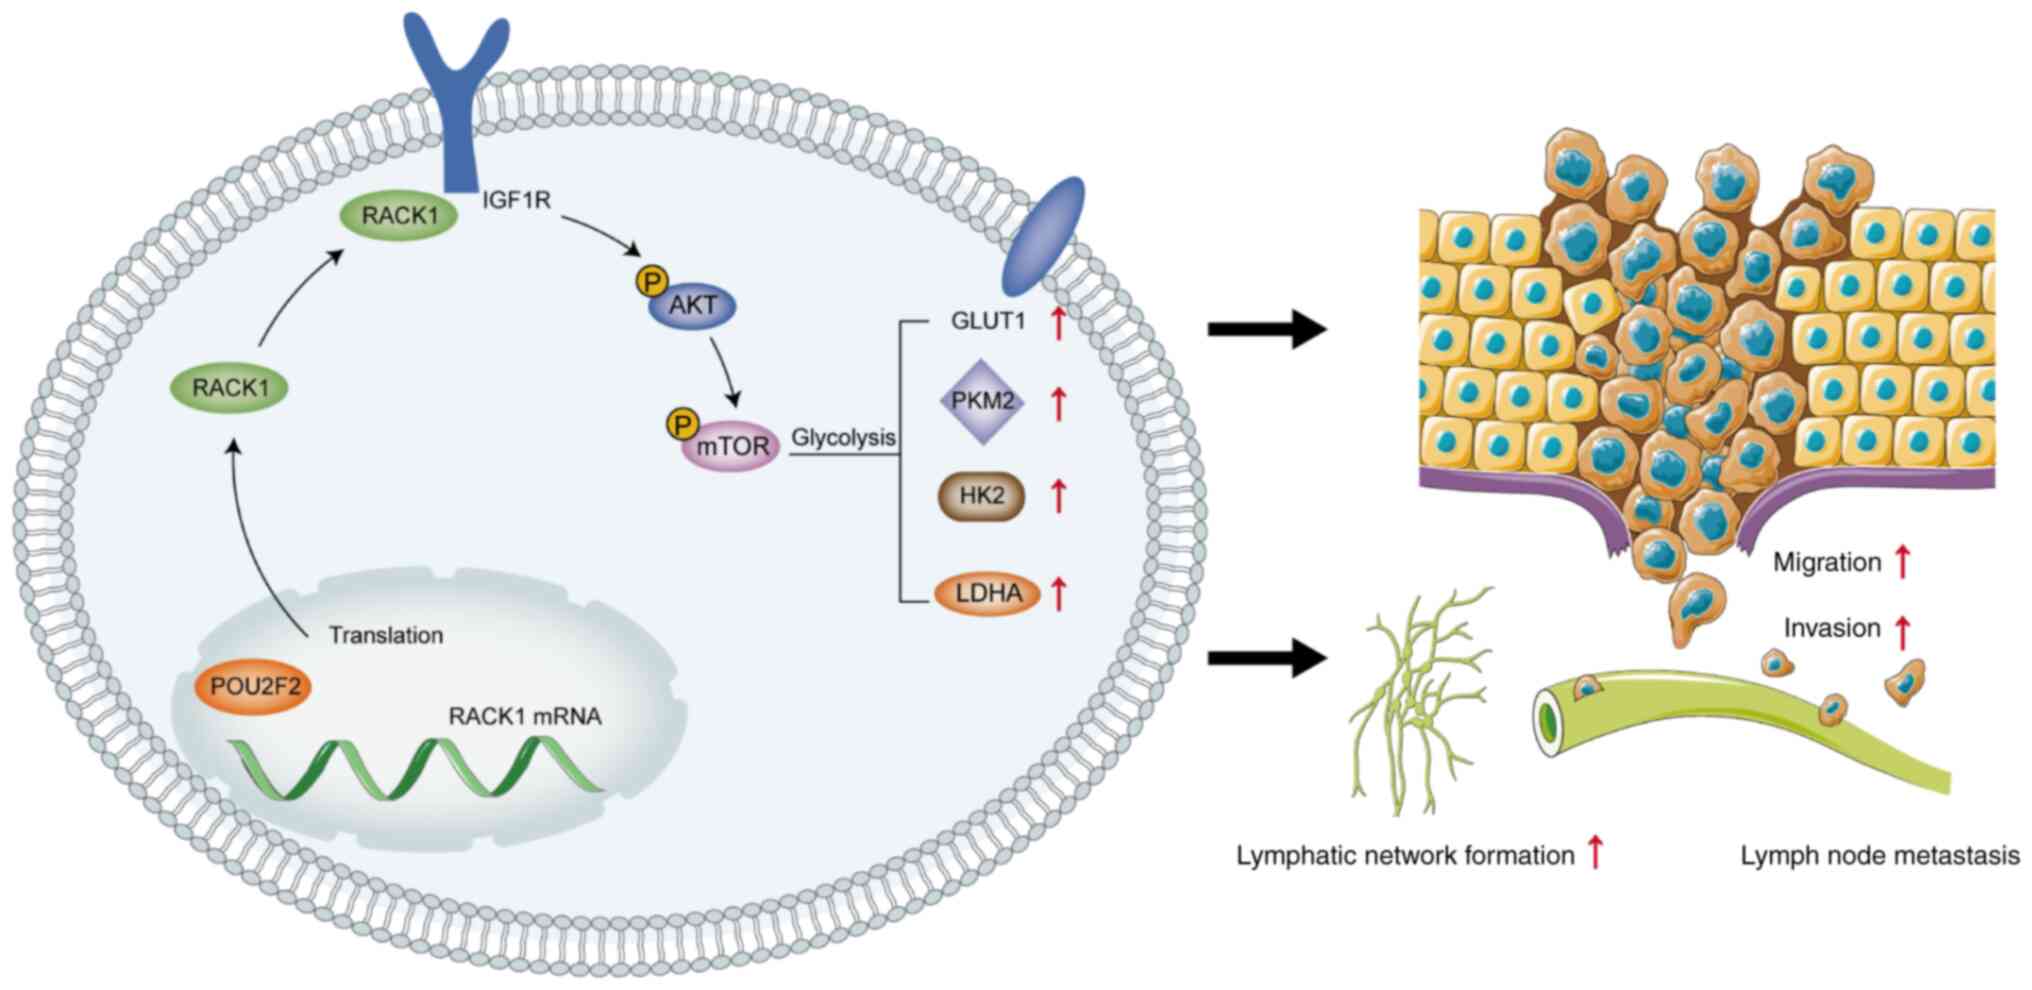
The present study investigated whether RACK1
facilitates CC progression. RACK1 was found to regulate glycolysis
and lymphangiogenesis by interacting with insulin-like growth
factor 1 receptor (IGF1R) and activating protein kinase B
(AKT)/mammalian target of rapamycin (mTOR) signaling. In addition,
the POU class 2 homeobox 2 (POU2F2)-mediated overexpression of
RACK1 modulated the malignant progression of CC via the sustained
activation of the AKT/mTOR signaling pathway. The findings
presented herein reveal potential novel mechanisms for CC LMN and
provide promising novel therapeutic targets. These novel
therapeutic targets and treatment options may effectively prevent
the aggressiveness of CC.
Materials and methods
Clinical samples
CC tissues (n=104; age range, 28-68 years; mean age,
49.52±8.90 years) and normal adjacent cervical epithelial tissues
[used as a negative control (NC), n=31; age range, 21-56 years;
mean age, 40.81±9.45 years] were collected from the Department of
Pathology of First Affiliated Hospital of Xinjiang Medical
University (Urumqi, China) between April, 2011 and June, 2021. The
normal adjacent cervical epithelial tissues were collected >3 cm
from the tumor edge. The inclusion criteria for patient recruitment
were as follows: i) None of the patients received chemotherapy or
radiation prior to surgery; ii) a confirmed the diagnosis by two
pathologists; and iii) patients who agreed to participate in the
study. The exclusion criteria were as follows: i) Patients with
other diseases, including other types of tumors; and ii) patients
who refused to participate in the study. The patients with CC were
diagnosed by histopathological analysis according to the
tumor-node-metastasis (TNM) classification of the International
Federation of Gynecology and Obstetrics (FIGO) (15). The study was carried out in
accordance with the guidelines of the Ethics Committee of the First
Affiliated Hospital of Xinjiang Medical University (authorization
no. IACUC-20180223-128). Written informed consent was obtained from
all patients and their relatives.
Cells and cell culture
Human CC cell lines [MS751 (cat. no. CL-0387), SiHa
(cat. no. CL-0210), HeLa (cat. no. CL-0101) and Caski (cat. no.
CL-0048)], H8 (cat. no. CP-H059), an immortalized cervical
epithelial cell line, and human lymphatic endothelial cells (HLECs,
cat. no. CP-H026) were purchased from Procell Life Science &
Technology Co., Ltd. The SiHa, HeLa and H8 cells were cultured in
Dulbecco's modified Eagle's medium (DMEM) supplemented with
penicillin/streptomycin and fetal bovine serum (FBS) (Gibco; Thermo
Fisher Scientific, Inc.). The MS751 cells were cultured in minimal
essential medium (MEM; containing NEAA) medium (Procell Life
Science & Technology Co., Ltd.) supplemented with 10% FBS, and
the Caski cells were cultured in Roswell park Memorial Institute
(RPMI)-1640 medium (Biological Industries) supplemented with
penicillin/streptomycin (Biological Industries)and 10% FBS. All
cell lines were authenticated using STR profiling to confirm their
identities and cultured in an incubator with 5% CO2 at
37°C. HLECs were obtained from Procell Life Science &
Technology Co., Ltd. and cultured in endothelial cell medium (ECM;
ScienCell Research Laboratories, Inc.).
Lentiviral or plasmid transfection
To knockdown RACK1, a lentivirus containing
short hairpin RNA (shRNA) targeting RACK1 or a non-target
oligonucleotide was synthesized by Shanghai Genechem Co., Ltd. The
shRNA target sequences were as follows: shRACK1-1, 5′-AGC TGA AGA
CCA ACC ACA T-3′; shRACK1-2, 5′-TGT GGT TAT CTC CTC AGA T-3′;
non-specific control shRNA (shNON), 5′-TTC TCC GAA CGT GTC ACG
T-3′. In brief, the lentiviral constructs for RACK1 knockdown
(shRACK1) and scramble control (shNON) were constructed into GV493
(Shanghai Genechem Co., Ltd.). All the plasmids were co-transfected
with pHelper 1.0 (20 µg) and pHelper 2.0 (10 µg) into
293T cells (National Collection of Authenticated Cell Cultures,
Shanghai, China, https://www.cellbank.org.cn/) using transfection
reagent prepared by Shanghai Genechem Co., Ltd. in accordance with
the manufacturer's recommendations. The supernatant was collected
after culturing for 48 h. For CC cell infection, cells
(1×10⁴ cell/well) were cultured for 24 h, and
recombinant lentivirus in serum-free growth medium was then added
at a multiplicity of infection (MOI=30) at 37°C for 72 h. Stable
cell lines were selected using 5 µg/ml puromycin
(MilliporeSigma) and the knockdown efficiency was confirmed using
western blot analysis. The POU2F2 overexpression plasmid and
control plasmid were purchased from Shanghai Genechem Co., Ltd. For
transient transfection, CC cells (1×10⁵ cell/well) in
6-well plates were transfected with POU2F2 overexpression plasmid
(5 µg/ml) and control plasmid (4 µg/ml) at 37°C.
After culturing for 24 h, the cells were harvested for subsequent
experiments, and the overexpression efficiency was confirmed using
western blot analysis. Plasmid transfections were performed using
Lipofectamine® 3000 reagent (Invitrogen; Thermo Fisher
Scientific, Inc.) according to the manufacturer's protocol. The
overexpression target sequences are listed in Table SI.
RNA extraction and reverse
transcription-quantitative polymerase chain reaction (RT-qPCR)
RNA was extracted from the CC cells using
Trizol® reagent (Invitrogen; Thermo Fisher Scientific,
Inc.). The reverse transcription of the extracted RNA was performed
using a RevertAid First Strand cDNA synthesis kit (cat. no. K1622,
Thermo Fisher Scientific, Inc.) following the manufacturer's
instructions. PCR amplification was performed using the QuantiNova
SYBR-Green PCR kit (cat. no. 208054, Qiagen GmbH). The cycling
conditions were as follows: 95°C for 5 sec; followed by 40 cycles
at 60°C for 10 sec, and 95°C for 2 min. The relative expression of
target genes was calculated using the 2−ΔΔCq method
(16), and ACTB was used
as the reference gene for normalization. The sequences of the
primers used are listed in Table
SII.
Western blot analysis
Cells were lysed in radioimmunoprecipitation assay
buffer containing a protease/phosphatase inhibitor cocktail
(Beijing Solarbio Science & Technology Co., Ltd.). The protein
concentration estimated using the BCA method, and total proteins
(30 µg) were separated in 10% sodium dodecyl
sulfate-polyacrylamide gels and transferred onto polyvinylidene
fluoride membranes (MilliporeSigma). The membranes were then
blocked with 5% skim milk for 2 h at room temperature and probed
with primary antibodies over-night at 4°C and
horseradish-peroxidase-labeled secondary antibodies for 2 h at room
temperature. Following three washes the membranes using
Tris-buffered saline with Tween-20 (TBST) buffer, the signal was
detected using an enhanced chemiluminescence detection system (ECL;
Biosharp) and analyzed using the FluorChem™ E system (FluorChem F,
ProteinSimple). The band intensities were quantified using ImageJ
software (version 1.52a; National Institutes of Health). The
primary and secondary antibodies used in the present study are
listed in Table SIII.
Immunohistochemistry (IHC)
IHC was performed on formalin-fixed
paraffin-embedded sections of clinical CC and mouse xenograft
tissues. The paraffin-embedded tissue sections (4-µM-thick)
were rehydrated, blocked with 3% hydrogen peroxide, and treated
with hot EDTA buffer (75°C for 10 min; 50°C for 10 min).
Subsequently, primary antibodies were added and incubated overnight
at 4°C. Secondary anti-body incubation (cat. no. PV9000; ZSJQ-Bio)
was performed at room temperature for 30 min. Color reaction was
developed using 3,3′-diaminobenzidine tetrachloride (DAB) chromogen
solution. The staining intensity was scored independently by two
observers. Briefly, the standard for the proportion of positive
staining (1, <5%; 2, 5-30%; 3, 30-70%; 4, >70%) and staining
intensity (0, no staining; 1, weak; 2, moderate; 3, strong) were
multiplied for each observer and then averaged. The primary
antibodies used and their corresponding experimental conditions are
listed in Table SIII.
1H NMR spectroscopy
1H NMR spectroscopy was used for
metabolomics analysis as previously described (12). Briefly, cell supernatants were
defrosted at room temperature. Each sample (200 µl) was
mixed with 400 µl saline (0.9% w/v NaCl in 20% v/v
D2O and 80% v/v H2O) at room temperature and
vortex-mixed, followed by centrifugation (4°C, 10,000 x g, 10 min).
Subsequently, 550 µl supernatant were transferred into a
5-mm NMR tube for 1H NMR (Varian 600 spectrometer with
599.93 MHz resonance frequency of 1H NMR). Transverse
relaxation weighting experiments were performed per the
Carr-Purcell-Meiboom-Gill sequence with water peak suppression.
Parameters were set as follows: Relaxation delay, 2.0 sec;
acquisition time, 1.64 sec; and spectral width, 10,000 Hz, which
resulted in an acquisition time of 1.64 sec and a relaxation delay
of 2 sec. The raw data were processed according to a previous study
(12). Briefly, the 1H
NMR spectra were processed and corrected for phase and baseline
using the Topspin 2.0 software (Brokers Biospin). The
base-line-corrected 1H NMR spectra were manually phased,
which were referenced to the anomeric proton of α-glucose at δ
5.233, and the spectra were placed into 2,834 integrated regions of
0.003 ppm. The regions of water resonance (δ 4.66-5.20) were
excluded for eliminating the baseline effects. The peak area of
each bin was then calculated. Normalization were performed using
the SIMCA-P+11 software package (Umetrics Inc.) to compensate for
the concentration differences among the samples. The spectral
segments for each NMR spectrum were normalized to the total
integrated area of each spectrum. Principal component analysis
(PCA) and the orthogonal projection to latent structure with
discriminant analysis (OPLS-DA) methods with unit variance (UV)
scaling were carried out for class discrimination and biomarker
identification. PCA was conducted using mean-centered scaling and
the results are presented in scatter plots; each pointing the
former represented one sample, whereas the latter indicated the
magnitude and manners of the NMR signals (thus metabolites) to
classification. The data were visualized with the score plots of
the first two principal components (PCs 1 and 2) in order to
provide the most efficient 2D representation of the information
contained in the dataset. Based on the number of samples in each
group, a correlation coefficient (determined using the Pearson's
product-moment correlation coefficient) of 0.33 was used as the
cut-off value that calculated discrimination at the level of
P=0.05. The normalized NMR dataset was subjected to classical
statistical analysis (one-way ANOVA) using SPSS 23.0 software
(SPSS, Inc.).
Bioinformatics analysis
The Gene Expression Omnibus (GEO) datasets, GSE6791
dataset (https://www.ncbi.nlm.nih.gov/geo/query/acc.cgi?acc=GSE6791),
GSE9750 dataset (https://www.ncbi.nlm.nih.gov/geo/query/acc.cgi?acc=GSE9750),
GSE26511 dataset (https://www.ncbi.nlm.nih.gov/geo/query/acc.cgi?acc=GSE26511)
were used for analyzing the expression of RACK1 in cervical
cancer tissues. Hitpredict (http://www.hitpredict.org/) and Genemania (http://genemania.org/) were used to predict the
candidate factors that interacted with RACK1. The UCSC Genome
Browser (http://genome-asia.ucsc.edu/index.html), HUMANTFDB
(http://bioinfo.life.hust.edu.cn/HumanTFDB/#!/predict)
and PROMO (http://alggen.lsi.upc.es/cgi-bin/promo_v3/promo/promoinit.cgi?dirDB=TF_8.3)
were used to predict potential complementary base pairing between
RACK1 and transcription factors. MetaboAnalyst (https://www.metaboanalyst.ca/) were used for analyzing
the differential metabolic pathway of knockdown of RACK1 in CC
cells. JASPAR database (https://jaspar.genereg.net/) were used to predict
potential binding sites between RACK1 and IGF1R.
Transwell migration assay of CC cells or
HLECs
For the Transwell migration assay of CC cells,
2×10⁴ cells were placed in the upper chamber of a
Transwell (Corning, Inc.). Basic medium containing 10% FBS was
added to the lower chamber as a chemoattractant and the cells were
incubated at 37°C for 24 h. For examining migration, HLECs
(1×10⁵) were placed in the upper chamber with serum-free
EGM, whereas the lower chamber was filled with conditioned medium
derived from 1×10⁵ CC cells mixed with EGM medium at a
1:1 ratio as the chemoattractant and incubated at 37°C for 24 h.
The cells that adhered to the reverse side of the membrane were
fixed with 4% paraformaldehyde solution at 4°C for 30 min and
stained with 0.1% crystal violet (Beijing Solarbio Science &
Technology Co., Ltd.) at room temperature for 30 min and counted
under an inverted microscope (Nikon E400, Nikon Corporation) in
five randomly selected fields.
Matrigel invasion assay
Matrigel-coated invasion chambers (BD Biosciences)
were used to assess cell invasion. Briefly, 2×10⁴ CC
cells were seeded in the upper chamber of the Transwell insert in
serum-free culture medium and cultured at 37°C for 24-48 h. The
penetrated cells were fixed with 4% paraformaldehyde and stained
using 0.1% crystal violet at room temperature for 30 min. The
number of penetrating cells in each group was counted under an
inverted microscope (Nikon E400, Nikon Corporation).
Determination of glucose consumption and
lactate production
Glucose and lactate detection kits purchased from
Nanjing Jiancheng Bioengineering Institute (cat. no. A09-2 and
A154-1-1) were used to determine the glucose and lactate
concentrations before and after 24 h of CC cell culture, following
the manufacturer's protocols.
Co-immunoprecipitation (Co-IP)
Co-IP assays were performed to detect the
interaction between RACK1 and IGF1R using protein A/G magnetic
beads (Bimake). The MS751 and SiHa cells were collected, lysed, and
centrifuged at 4°C and 12,000 x g for 20 min to obtain the
supernatant, which was then mixed with primary antibody (Table SIII) and incubated overnight at
4°C. Protein A beads were added and incubated at room temperature
for additional 4 h. The beads were washed thrice with phosphate
buffered saline-Tween 20 (PBST) for 5 min each time; 30 µl
loading buffer were then added and boiled for 5 min at 100°C. The
supernatant was used for western blot analysis.
Immunofluorescence
The cells were seeded on coverslips and incubated
with antibodies specific for IGF1R and RACK1 (Table SIII) at room temperature for 2 h.
The coverslips were then incubated with Alexa Fluor 594 goat
anti-rabbit IgG and Alexa Fluor 488 goat anti-mouse IgG (Table SIII) at room temperature for 2 h
and stained with 4,6-diamidino-2-phenylindole (DAPI,
MilliporeSigma) for at room temperature for 10 min. Randomized
fields were imaged using a confocal laser microscope (LSM 980,
Zeiss AG).
HLEC tube formation assay
Serum-free conditioned medium was prepared by
culturing the CC cells (1×10⁷ cells per 10 cm dish) in
10 ml serum-free medium for 24 h. The media were collected and
centrifuged at 1,000 x g at room temperature for 5 min to remove
cell debris and stored at 4°C to concentrate the conditioned
medium. The HLECs were seeded into 24-well plates (pre-coated with
100 µl Matrigel) containing cell conditioned medium and
incubated for at 37°C 10-16 h. Tube formation was quantified by
measuring the total length of tube structures or the number of
branch sites/nodes in three random fields under a microscope (Nikon
E400, Nikon Corporation).
Dual luciferase reporter assay
A plasmid with the RACK1 promoter was
designed and constructed by Shanghai GeneChem Co., Ltd. The
wild-type and mutant sequences of the RACK1 promoter,
GV712-RACK1-WT and GV712-RACK1-mut, respectively,
were amplified and cloned into the GV712-basic vector. The cells
were then collected and lysed at 48 h following transfected by
using Lipofectamine® 3000 (Invitrogen; Thermo Fisher
Scientific, Inc.), and the luciferase activity was detected using
the dual luciferase reporter assay system (cat. no. E1910, Promega
Corporation), and the reporter luciferase activity was normalized
against Renilla luciferase activity.
Chromatin immunoprecipitation-PCR
(ChIP-PCR)
ChIP was performed according to the instructions
provide with the SimpleChIP® enzymatic chromatin IP kit
(agarose beads) (cat. no. 9002, Cell Signaling Technology, Inc.).
The cells were (1×10⁷) fixed with 1% formaldehyde for 10
min at room temperature, and fixation was terminated using 0.125 M
glycine. The cell lysis buffer was then added, and the samples were
sonicated to generate 200-1,000 bp fragments. The resulting cell
lysates were immunoprecipitated using a POU2F2 anti-body
(ProteinTech Group, Inc.) and analyzed using RT-qPCR as described
above. The cycling conditions were as follows: 94°C for 60 sec;
57°C for 30 sec; followed by 35 cycles at 72°C for 30 sec, 72°C for
2 min. Subsequently, 10 µl of each PCR product was removed
for analysis using a 2% agarose gel. The anti-POU2F2 antibody and
the primers used for the PCR of ChIP samples are listed in Tables SII and SIII.
Tumor xenograft model
All animal experiments were approved by the Ethics
Committee of the First Affiliated Hospital of Xinjiang Medical
University (authorization no. IACUC-20180223-128). Xenograft models
were established and the study protocol was carried out as
previously described (17,18).
Female BALB/c nude mice were purchased from Beijing Vital River
Laboratory Animal Technology Co., Ltd. The animals were kept under
standard laboratory conditions (temperature, 22±2°C; relative
humidity, 50±10%; 12-h light/dark cycle) with access to food and
water ad libitum. The female nude mice were 3 weeks old with
an average weight of 12.82 g. A total of 32 nude mice were randomly
assigned to four groups, and 8 nude mice were used per group. For
the xenograft LNM model, 5×10⁵ MS751 and SiHa cells were
inoculated into the footpads of the mice. The mice were euthanized
via cervical dislocation 4 weeks after the first injection of tumor
cells. Footpad tumors and popliteal lymph nodes were removed and
stained with hematoxylin and eosin (H&E). Briefly, the tumor
tissues were fixed in 4% paraformaldehyde for 7 days at room
temperature, embedded in paraffin, then cut into 4-µm-thick
sections. The slides were stained using the hematoxylin and eosin
(H&E) staining lit (Beijing Solarbio Science & Technology
Co., Ltd.), following the manufacturer's instructions.
IGF1 and rapamycin (Rapa) and
2-deoxy-D-glucose (2-DG) treatments
The CC cell lines were treated with the IGF1
(catalog no. 100-11; PeproTech, Inc.) at 200 ng/ml for 0, 6, 12 and
24 h at 37°C. The cells in six-well plates were treated with IGF1
(200 ng/ml) and the mTOR inhibitor, Rapa (cat. no. AY-22989;
MedChemExpress) at 10 or 20 nM for 24 h at 37°C. Cells were
harvested and used for protein isolation. Cervical cancer cells
were treated 10 mM 2-DG (cat. no. HY-13966; MedChemExpress) at 37°C
for 24 h. The cells were harvested and used for Transwell invasion
and migration assays, and the supernatant were used for HLEC tube
formation assay.
Statistical analysis
The results are presented as the mean ± standard
error of the mean (SEM). IBM SPSS Statistics for Windows, version
23.0 (IBM Corp.) and GraphPad Prism software (5.0 version; GraphPad
Software, Inc.) were used for the statistical analyses. A
two-tailed unpaired Student's t-test and one-way analysis of
variance (ANOVA) with Tukey's post hoc test were used for
comparisons between two or multiple groups, respectively. The
associations between RACK1 expression and the patient
clinicopathological characteristics were evaluated using Pearson's
χ2 test. Correlations between measured variables were
analyzed using Spearman's rank correlation analysis. A value of
P<0.05 was considered to indicate a statistically significant
difference.
Results
RACK1 is highly expressed in CC cell
lines, and regulates CC cell migration, invasion and
lymphangiogenesis
The present study first evaluated the effects of
RACK1 expression in patients with CC using published data. The
analysis of the GEO database (GEO submission: GSE6791) revealed
that RACK1 expression was higher in patient-derived CC tissues than
in normal cervical tissues (Fig.
S1A). However, the analysis of the GSE9750 dataset revealed
that RACK1 expression was downregulated in CC tissues compared to
normal cervical tissues (Fig.
S1A). Subsequently, the analysis of the GSE26511 dataset
revealed that RACK1 expression was not significantly associated
with LNM (P=0.0706; Fig. S1B).
Although no statistically significant differences were observed
between CC and normal cervical tissues, RACK1 expression was
positively associated with LNM. The mRNA and protein expression of
RACK1 was then examined in the normal human cervical cell line, H8,
and in four CC cell lines (Fig. 1A
and B). RACK1 expression in the MS751 and SiHa cells was higher
than that in the normal cervical cells; in particular, the MS751
cells, a CC cell line with a high metastatic potential, exhibited
the highest RACK1 expression. These results suggest that RACK1 is a
potential biomarker for human CC with LMN.
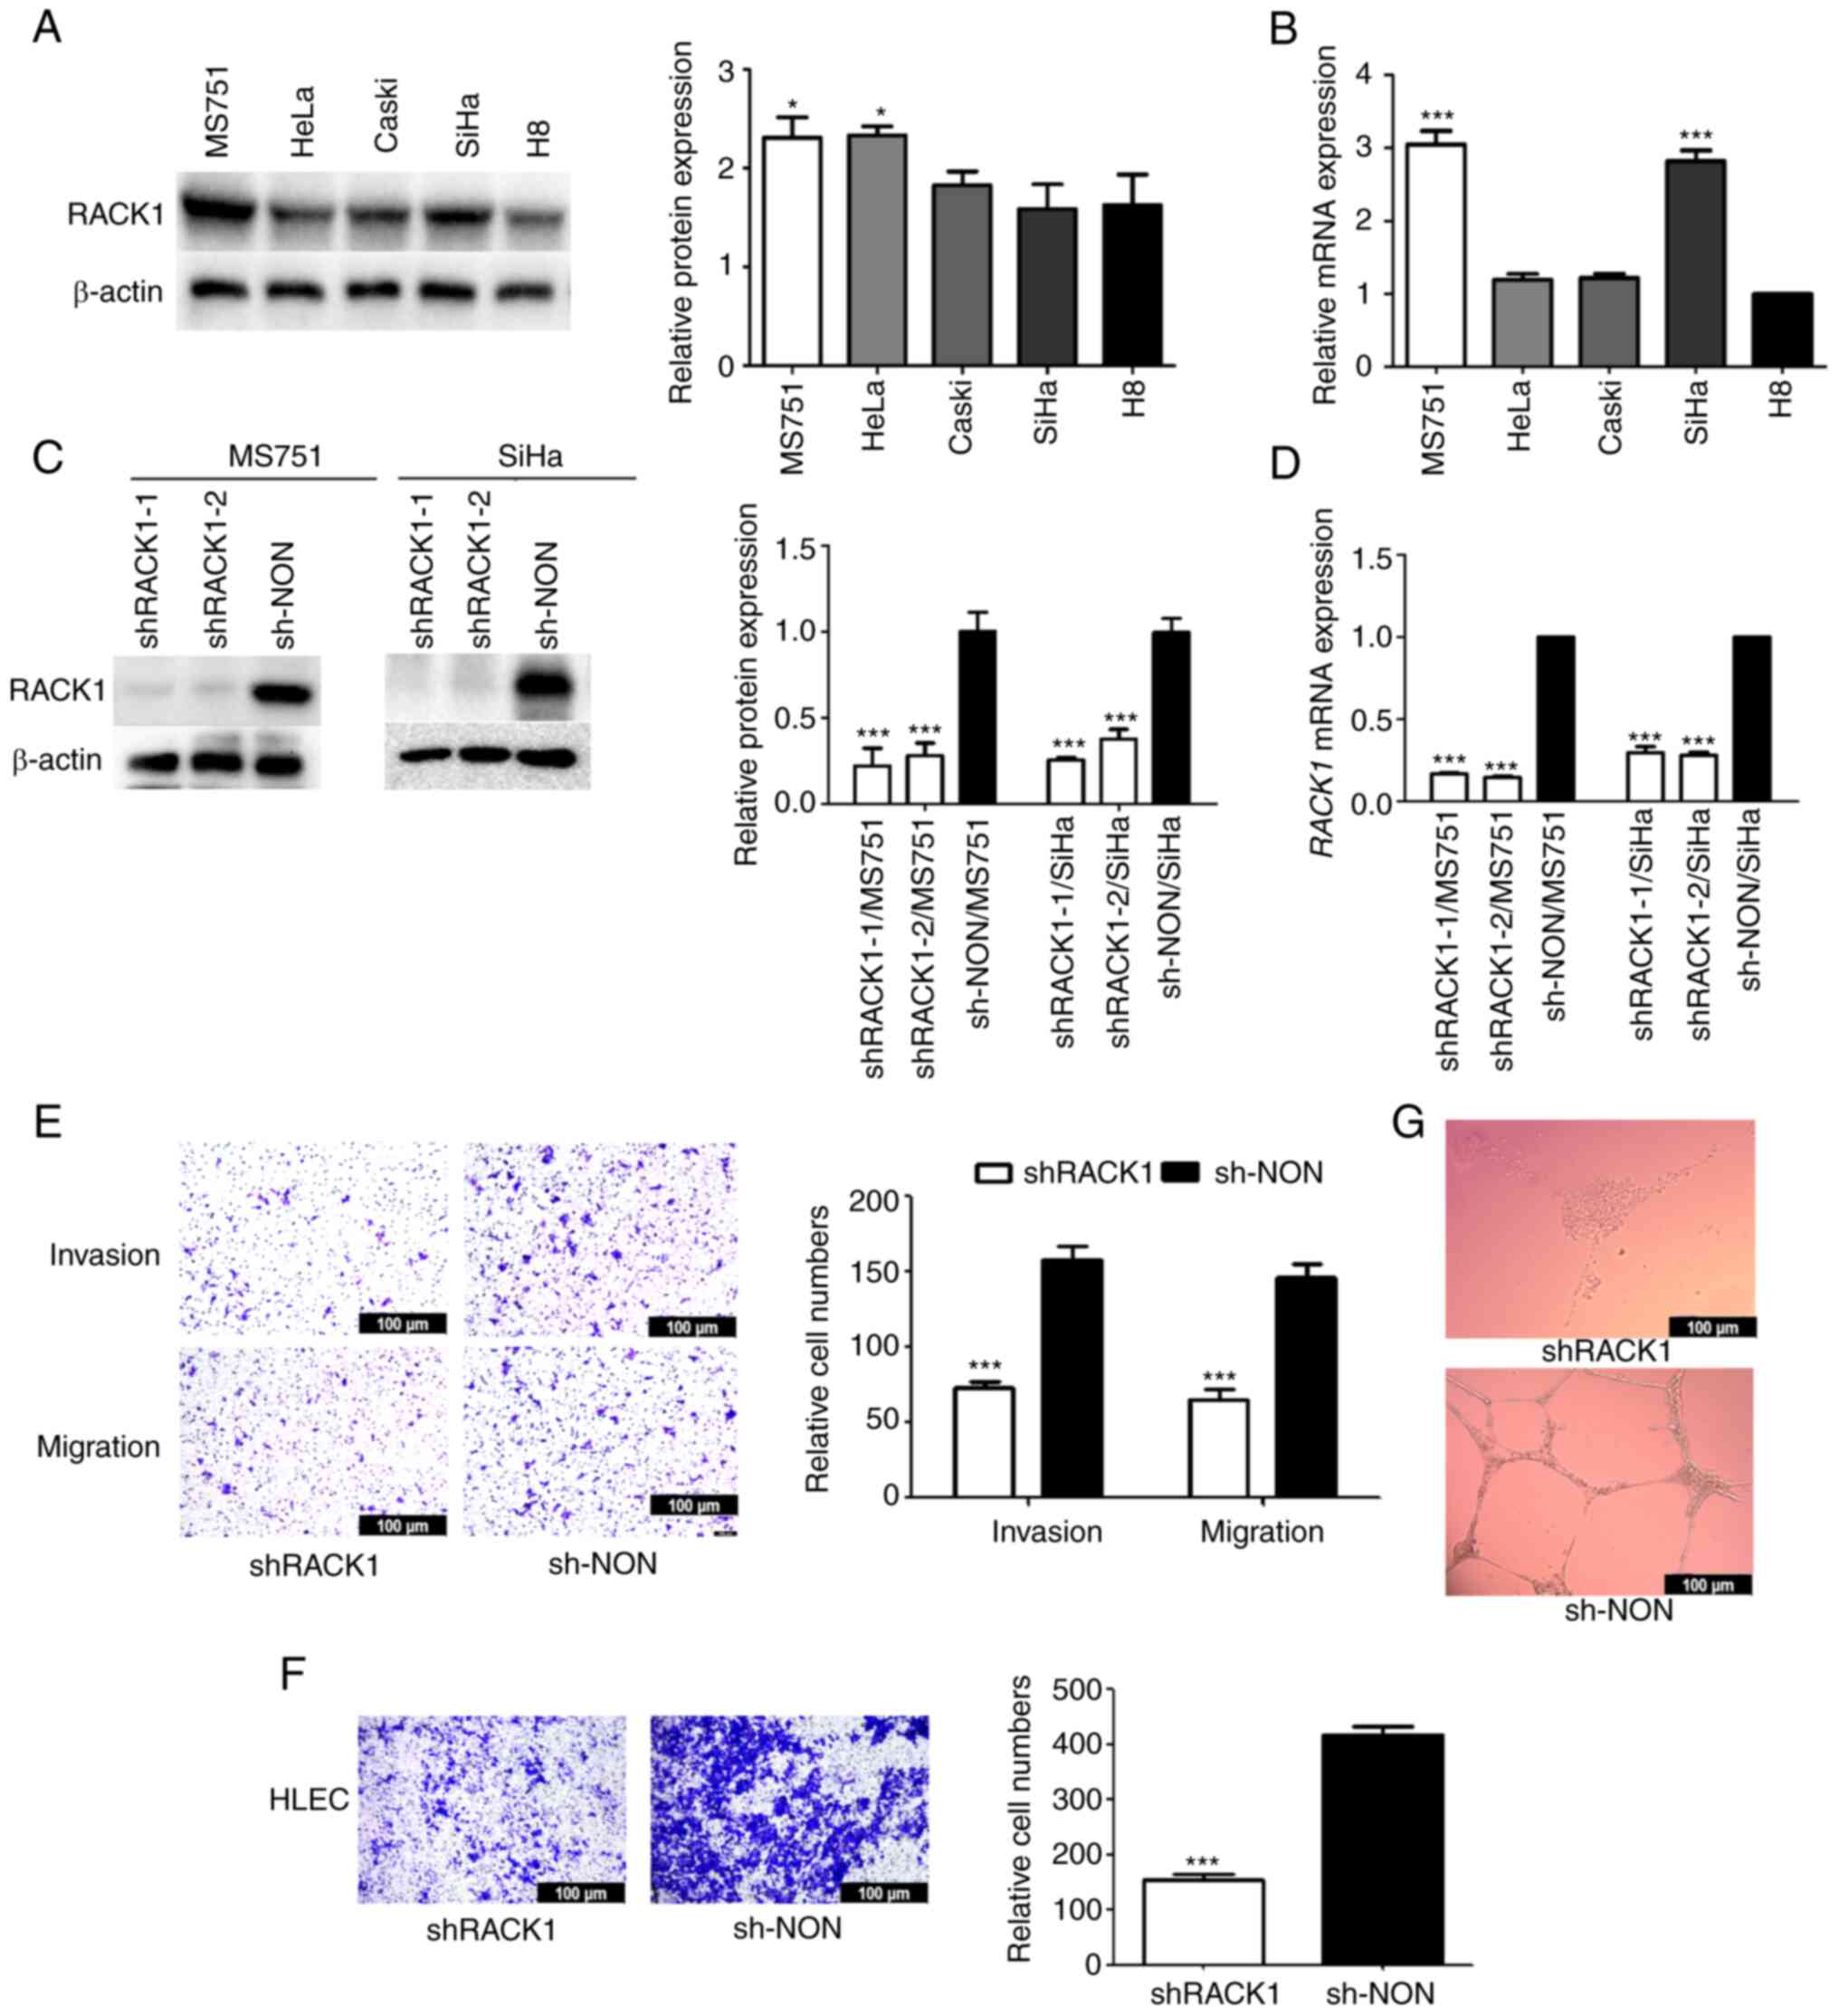 | Figure 1RACK1 is highly expressed in CC cell
lines and regulates CC cell migration and invasion in vitro.
(A) Protein levels of RACK1 in CC cell lines (MS751, HeLa, Caski
and SiHa) and normal cell line (H8) detected using western blot
analysis (left panel), with the protein bands assessed (right
panel). (B) RACK1 mRNA level in cell lines (MS751, HeLa,
Caski, SiHa and H8) detected using RT-qPCR. (C) RACK1 expression in
MS751 and SiHa cells transfected with specific shRACK1 lentiviral
vectors (shRACK1-1 and shRACK1-2) was examined using western blot
analysis and (D) RT-qPCR. (E) Transwell assays were performed to
investigate the effects of RACK1 on the invasion and migration of
MS751 cells (left panel), with the quantified bands assessed (right
panel). (F) Transwell assays were performed to investigate the
effects of RACK1 on the migration ability of HLECs (left panel),
with the quantified bands assessed (right panel). (G) Effects of
RACK1 on tube formation by HLECs. All data were obtained from three
independent experiments. The data of two groups were analyzed using
the Student's t-test and the data of more than two groups were
analyzed using one-way ANOVA and are presented as the mean ± SD.
Data were compared with the the H8 cell line or the shNON group
(*P<0.05 and ***P<0.001). CC, cervical
cancer; RACK1, receptor for activated C kinase 1; HLECs, human
lymphatic endothelial cells; RT-qPCR, reverse
transcription-quantitative PCR. |
In the present study, two CC cell lines, MS751 and
SiHa, were used to examine the biological function of RACK1.
Non-specific control shRNA (shNON) and RACK1-shRNAs (shRACK1-1 and
shRACK1-2) were transfected into the MS751 and SiHa cells, and
stably transfected cell lines were established following selection
with puromycin. The results revealed that RACK1 knockdown
effectively downregulated RACK1 mRNA and protein expression
in the MS751 and SiHa cell lines (Fig. 1C and D). Transwell assays using
the MS751 and SiHa cells revealed that compared to the control
group transfected with shNON, the shRNA-mediated silencing of
RACK1 decreased the invasive and migratory ability of the
MS751 and SiHa cells (Figs. 1E
and S1C). Consistent with these
results, RACK1 knockdown decreased the expression of N-cadherin and
promoted that of E-cadherin, which are essential proteins
contributing to the invasiveness of cancer cells (Fig. 2C). Subsequently, the effect of
RACK1 on the tube formation of HLECs, which is crucial for LNM in
cancer, was evaluated. The culture supernatants from MS751 cells in
which RACK1 was knocked down inhibited the migration of the
HLECs (Fig. 1F) and suppressed
lymphangiogenesis (Fig. 1G). On
the whole, these results demonstrated that RACK1 functioned as a
critical tumor promoter and d contributed to the aggressiveness of
CC cells.
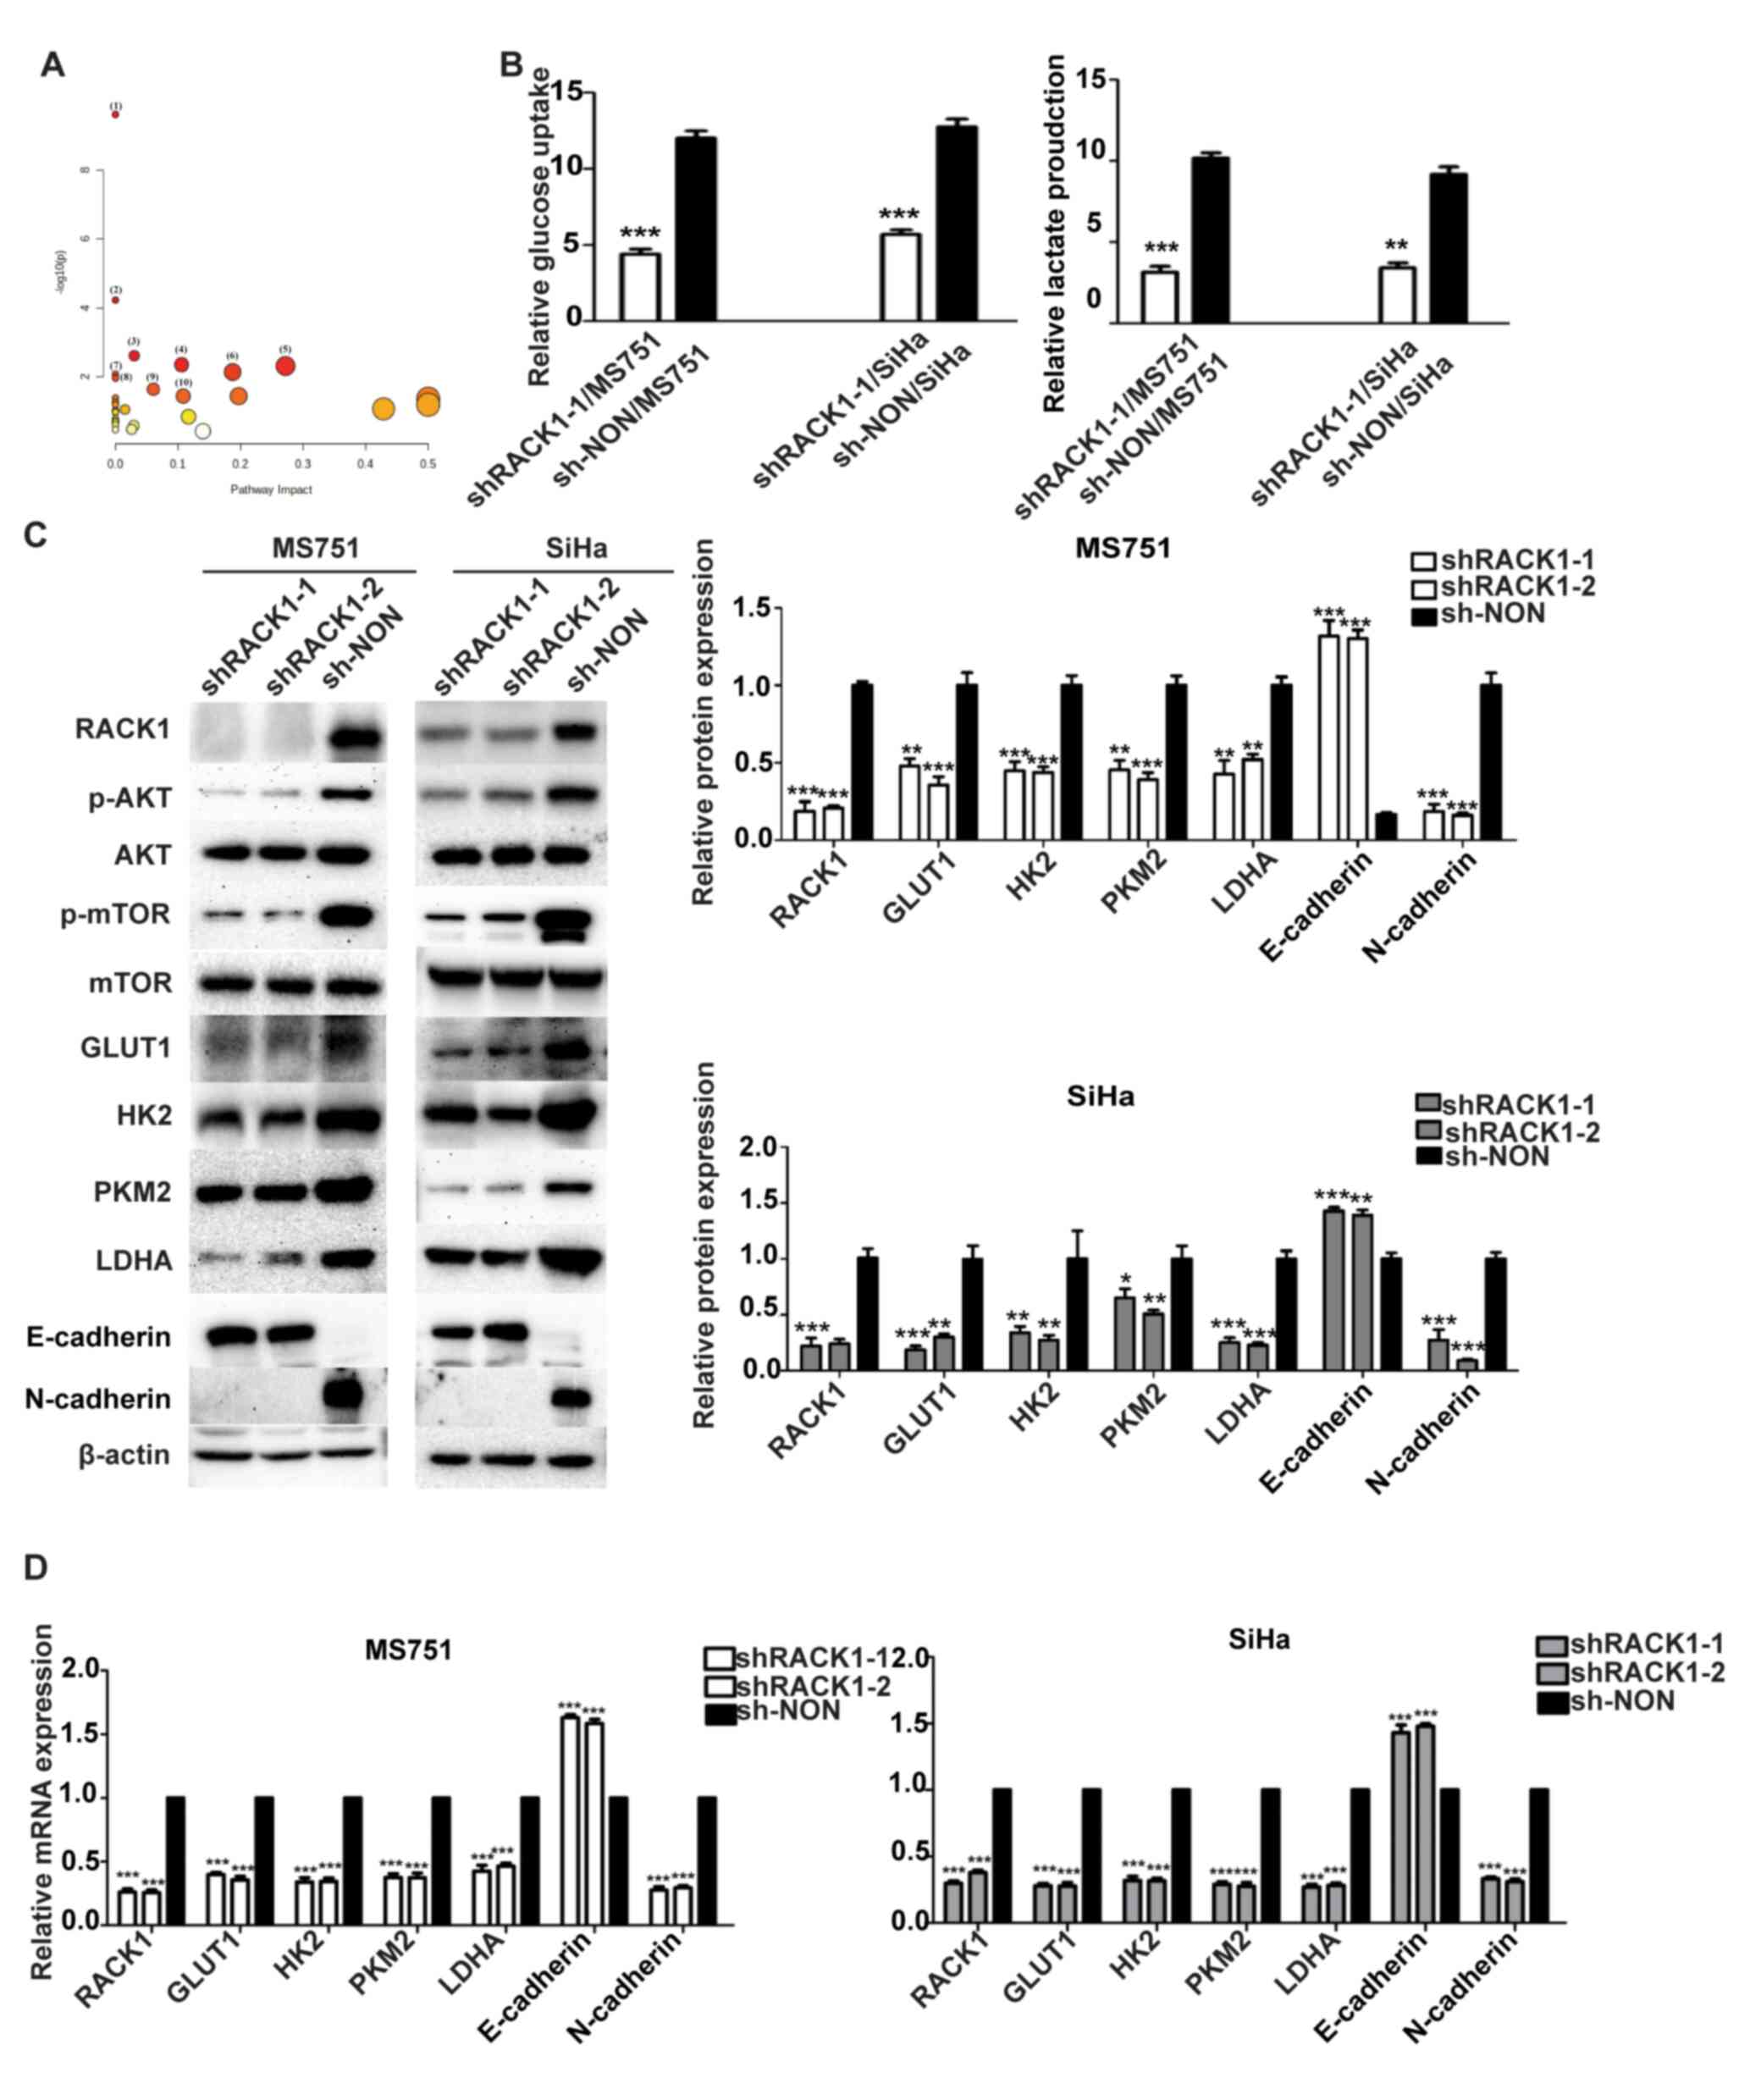 | Figure 2RACK1 enhances the glycolysis in
cervical cancer cells. (A) Common differential metabolites in the
metabolic pathway of the supernatant of shRACK1/MS751 and
shRACK1/SiHa cells. (1)
Aminoacyl-tRNA biosynthesis; (2)
Valine, leucine and isoleucine biosynthesis; (3) glycolysis/gluconeogenesis; (4) Glyoxylate and dicarboxylate
metabolism; (5) glycine, serine
and threonine metabolism; (6)
arginine and proline metabolism; (7) valine, leucine and isoleucine
degradation; (8) butanoate
metabolism; (9) pyruvate
metabolism; (10) glutathione
metabolism. (B) Effect of RACK1 on glucose uptake and lactate
production. (C) Effect of RACK1 on the expression of the AKT/mTOR
pathway, GLUT1, HK2, PKM2, LDHA, E-cadherin and N-cadherin, as
evaluated using western blot analysis (left panel), with the
protein bands assessed (right panel). (D) Effect of RACK1 on the
mRNA expression of the GLUT1, HK2, PKM2, LDHA, E-cadherin and
N-cadherin, as evaluated using reverse transcription-quantitative
PCR analysis. All data were obtained from three independent
experiments. The data of two groups were analyzed using the
Student's t-test and the data of more than two groups were analyzed
using one-way ANOVA and are presented as the mean ± SD. Data were
compared with the shNON group (*P<0.05,
**P<0.01 and ***P<0.001). RACK1,
receptor for activated C kinase 1; mTOR, mammalian target of
rapamycin; GLUT1, glucose transporter 1; HK2, hexokinase 2; LDHA,
lactate dehydrogenase A; PKM2, pyruvate kinase M2. |
RACK1 regulates glycolysis in CC
cells
Metabolic changes play crucial roles in regulating
cellular aggressiveness (19). As
RACK1 is a crucial regulator of cellular function, it was
hypothesized that RACK1 knockdown may contribute to the metabolic
reprogramming of CC cells. To define the metabolic alterations
induced by RACK1, the present study first examined the differential
metabolites produced after knocking down RACK1 in MS751 and
SiHa cells using 1H-NMR analysis. Table SIV presents 19 species of
differential metabolites in shRACK1/MS751 cells compared to those
in shNON/MS751 cells, among which, the levels of 13 species
increased and those of 6 species decreased. Table SV shows 24 species of
differential metabolites in shRACK1/SiHa cells compared to those in
shNON/SiHa cells, among which, the levels of 16 increased and those
of eight decreased. Moreover, 17 species of common differential
metabolites were identified in the shRACK1/MS751 and shRACK1/SiHa
cells, of which 13 were upregulated and 4 were downregulated
(Table SVI). Of note, a
significant association was found between RACK1 knockdown and the
levels of common differential metabolites of
glycolysis/gluconeogenesis using MetaboAnalyst 5.0 (https://www.metaboanalyst.ca/) (Fig. 2A and Table SVII). Aerobic glycolysis
facilitates tumor metastasis by elevating glucose uptake and
lactate production (20,21). Hence, the present study used
glucose uptake and lactate production as glycolysis indices in CC
cells. The results revealed that RACK1 knockdown in the
MS751 and SiHa cells significantly decreased glucose uptake by 63
and 56%, and lactate production by 66 and 63%, respectively,
indicating that RACK1 knockdown significantly suppressed
glucose consumption and lactate production (Fig. 2B). Consistent with these
observations, the glycolytic enzymes, hexokinase 2 (HK2), lactate
dehydrogenase A (LDHA), glucose transporter 1 (GLUT1) and pyruvate
kinase M2 (PKM2) were found to be downregulated by RACK1 knockdown
(Fig. 2C and D). These results
indicate that RACK1 enhances glycolysis by affecting the expression
of relevant metabolic enzymes.
RACK1 affects glycolysis and
lymphangiogenesis by interacting with IGF1R in CC cells
The present study then searched for candidate
factors that interacted with RACK1 using Hitpredict and 263
candidates were identified. These factors were further mapped using
Genemania, and four over-lapping factors that interacted with RACK1
were considered candidates (Fig.
3A). IGF1R has been reported to regulate the expression of
glycolysis-related genes in various cancers (22). Previous studies have demonstrated
that RACK1 interacts with IGF1R to influence its biological
function in tumor cells (23,24). Subsequently, the present study
investigated whether RACK1 interacts with the IGF1R in CC cell
lines. The interaction between RACK1 and IGF1R was analyzed and
demonstrated using a protein-protein molecular docking experiment.
Co-IP analysis of CC cells demonstrated the exogenous interaction
of RACK1 with IGF1R (Figs. 3C and
S2A). Immunofluorescence
revealed the colocalization of RACK1 and IGF1R in the cytoplasm of
CC cells, which was consistent with the results of the Co-IP assay
(Fig. 3B).
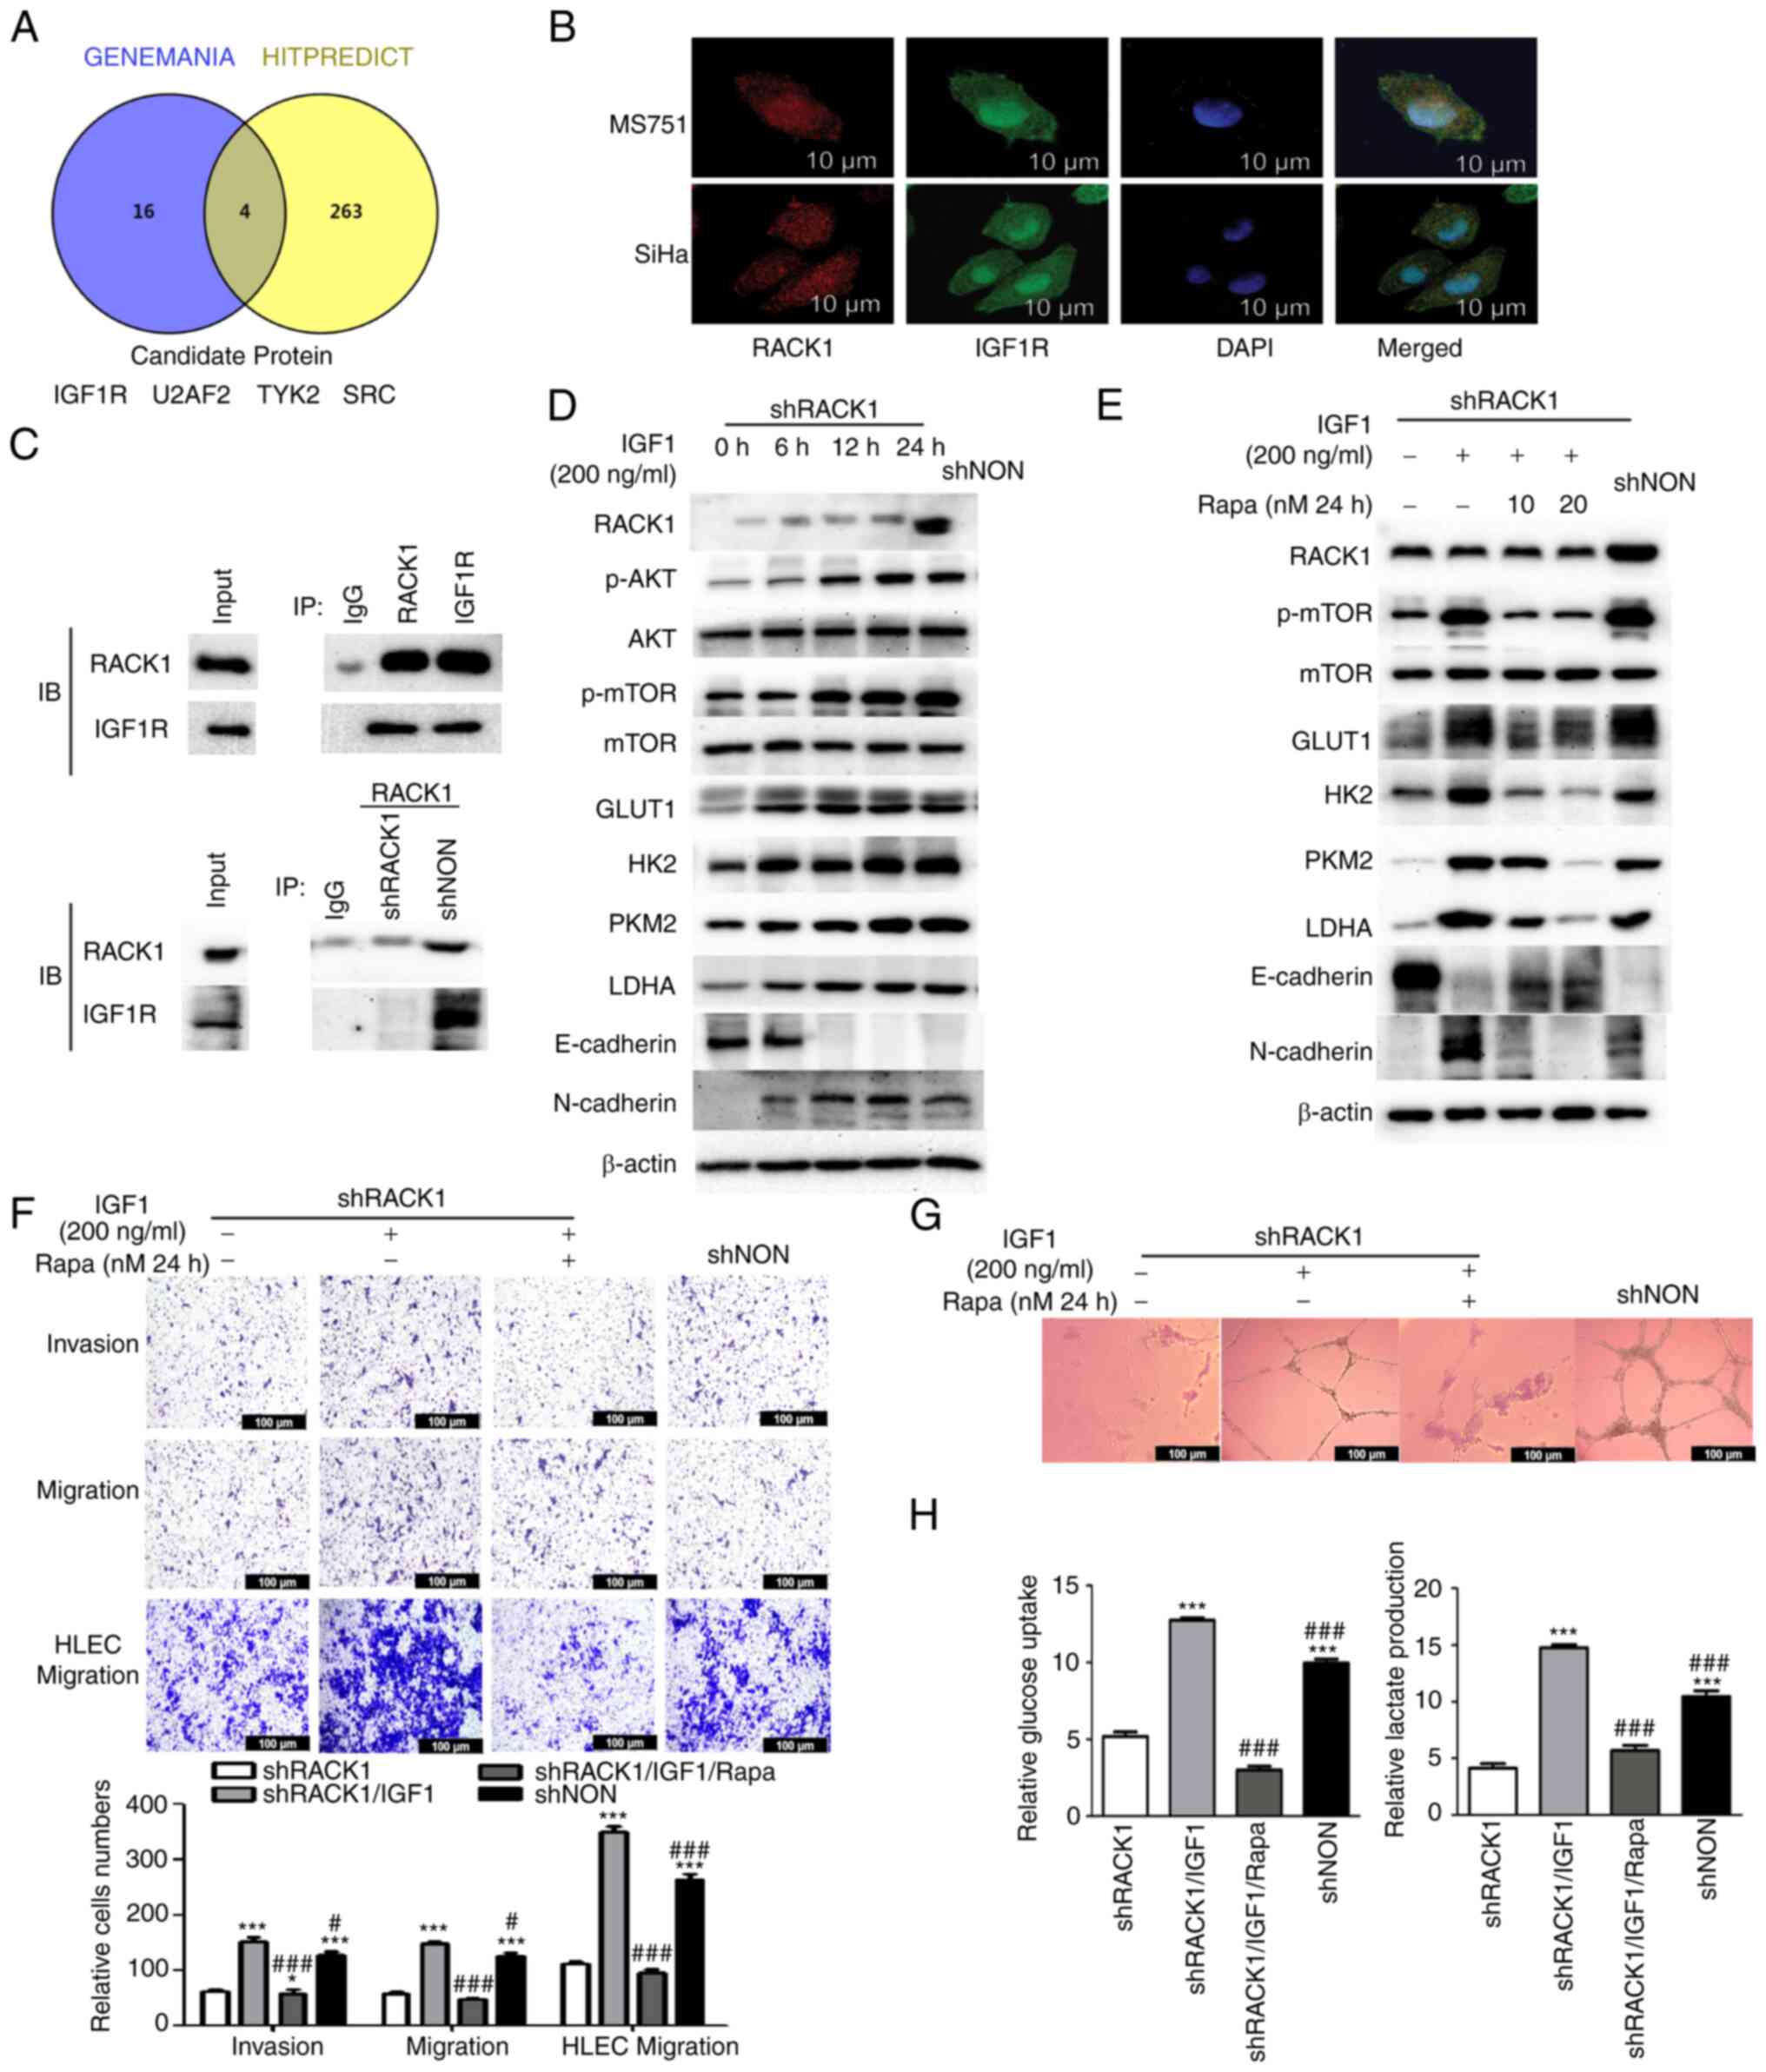 | Figure 3RACK1 interacts with IGF1R promotes
the glycolysis, aggressiveness and lymphangiogenesis by activating
IGF1R/AKT/mTOR signaling in MS751 cells. (A) Venn diagram showing
the factors interacting with RACK1, co-existing in the Hitpredict
and Genemania databases. (B) Association between RACK1 and IGF1R
expression was analyzed using immunofluorescence staining in MS751
and SiHa cells. Nuclei were stained with DAPI (blue). (C) Co-IP
assays were used to detect the interaction between RACK1 and IGF1R
in MS751 cells (upper panel). Co-IP assay was used to detect the
interaction between RACK1 and IGF1R in shRACK1/MS751 and
shNON/MS751 cells (lower panel). (D) shRACK1/MS751 cells were
stimulated for different time periods (6, 12 and 24 h) with 200
ng/ml IGF1. The RACK1, p-AKT (ser472 + ser474 + ser473), p-mTOR
(ser2448), AKT, mTOR, GLUT1, HK2, PKM2 and LDHA, E-cadherin and
N-cadherin expression was examined using western blot analysis. (E)
shRACK1/MS751 cells were stimulated for 24 h with 200 ng/ml IGF1
and various concentrations (10 and 20 nM) of Rapa. The expression
of RACK1, p-mTOR (ser2448), mTOR, GLUT1, HK2, PKM2, LDHA,
E-cadherin and N-cadherin was examined using western blot analysis.
(F) Transwell assays were performed to investigate the effects of
IGF1 and IGF1 combined with Rapa on the invasion and migration of
MS751 and HLECs cells (upper panel), with the quantified bands
assessed (lower panel). (G) Effect of IGF1 and IGF1 combined with
Rapa on tube formation by HLECs. (H) Effect of IGF1 and IGF1
combined with Rapa on glucose uptake and lactate production in
MS751 cells. Data were analyzed using one-way ANOVA and are
presented as the mean ± SD. Data were compared with the shRACK1
group (*P<0.05 and ***P<0.001). or
shRACK1 + IGF1 group (#P<0.05 and
###P<0.001). RACK1, receptor for activated C kinase
1; mTOR, mammalian target of rapamycin; GLUT1, glucose transporter
1; HK2, hexokinase 2; LDHA, lactate dehydrogenase A; PKM2, pyruvate
kinase M2; Rapa, rapamycin; IGF1, insulin-like growth factor 1;
HLECs, human lymphatic endothelial cells. |
Previous research has demonstrated that the AKT/mTOR
signaling pathway is a IGF1R target in cancer cells (25). Therefore, it was hypothesized that
RACK1 may activate AKT/mTOR signaling by interacting with IGF1R in
CC cells. The expression patterns of the key genes involved in
AKT/mTOR signaling, namely, phospho-AKT (ser472 + S474 + S473)
(p-AKT), total AKT (AKT), and phospho-mTOR (S2448) (p-mTOR), were
further validated by analyzing their post-transcriptional levels
using western blot analysis (Figs.
2C and S5A). It was observed
that RACK1 knockdown significantly decreased the binding between
RACK1 and IGF1R (Figs. 3C and
S2A), and reduced the
phosphorylation levels of AKT and mTOR, although the total AKT and
mTOR expression levels were not markedly altered. Thus, it was
hypothesized that RACK1 may positively regulate AKT/mTOR signaling
by interacting with the IGF1R.
The present study then investigated the functional
significance of IGF1R as regards the metabolic and metastatic roles
of RACK1 in CC cells. It was found that IGF1 promoted AKT/mTOR
signaling in CC cells. Moreover, IGF1 regulated the activation of
AKT/mTOR signaling in CC cells in a time-dependent manner. The
results of western blot analysis indicated that IGF1 significantly
increased AKT and mTOR phosphorylation at 6, 12 and 24 h, and the
level of AKT and mTOR phosphorylation was the highest at 24 h
(Figs. 3D and S5B). Therefore, the 24 h time point was
selected as the time point for the administration of IGF1 in
subsequent experiments. It was found that the activation of
AKT/mTOR signaling by IGF1 partially reversed the biological
effects of RACK1. As was expected, the reduction in the
invasive-ness and migration (Figs.
3F and S2E) of CC cells, as
well as the inhibition of the migration of HLECs (Fig. 3F) and lymphangiogenesis (Fig. 3G) induced by RACK1
knockdown were largely reversed by IGF1 treatment. Consistent with
this finding, it was observed that IGF1 treatment promoted
N-cadherin and decreased E-cadherin expression in CC cells in which
RACK1 was knocked down (Figs.
3D, S2B, S3A and S4A).
Subsequently, the present study investigated whether the activation
of AKT/mTOR signaling by IGF1 was involved in RACK1-mediated
glycolytic metabolism. IGF1 treatment increased glucose uptake and
lactate production (Figs. 3H and
S2C). Western blot analyses also
confirmed that the expression of glycolysis-related enzymes in
cells in which RACK1 was knocked down returned to levels
comparable to those in control cells (Figs. 3D, S2B, S3A and S4A). Hence, these results
suggested that RACK1 contributed to the IGF1R-mediated aerobic
glycolysis and lymphangiogenesis of CC cells.
RACK1 influences glycolysis and
lymphangiogenesis by activating IGF1R/AKT/mTOR signaling
Previous research has demonstrated that the
IGF1R/AKT/mTOR signaling pathway is associated with aerobic
glycolysis in cancer cells (26).
The present study further determined whether IGF1R/AKT/mTOR is
involved in regulating CC cell glycolysis. For this purpose, a
rescue experiment was performed to analyze the association between
IGF1R and the AKT/mTOR signaling pathway. Rapa, an mTOR inhibitor,
efficiently attenuated the IGF1-induced promotion of glycolysis in
CC cells, as indicated by the level of glucose uptake and lactate
production (Figs. 3H and S2C). Rapa also abrogated the increase
in the IGF1-induced phosphorylation of mTOR and glycolysis-related
enzyme expression (Figs. 3E,
S2D, S3B, S4B and S5C).
Furthermore, Rapa reversed the IGF1-induced promotion of the
invasion and migration of CC cells and HLECs (Figs. 3F and S2E) and lymphangiogenesis (Fig. 3G). Subsequently, Rapa inhibition
experiments were performed in IGF1-treated cells and it was
observed that Rapa treatment considerably increased the expression
of E-cadherin and decreased N-cadherin expression (Figs. 3E, S2D, S3B and S4B). Collectively, these
results indicated that in CC cells, RACK1 promoted glycolysis,
migration, invasion and lymphangiogenesis via IGF1R/AKT/mTOR
signaling.
RACK1 is a direct target of POU2F2
Cancer metabolism is regulated by a complex network
of different factors in various contexts (27). Hence, the present investigated the
molecular mechanisms through which RACK1 mediates the activation of
the IGF1R/AKT/mTOR signaling pathway and aerobic glycolysis. The
upstream regulatory machinery of RACK1 was also
investigated. Three types of software (UCSC, HUMANTFDB and PROMO)
were used to predict potential complementary base pairing between
RACK1 and transcription factors, and only POU2F2 was found
to be present in the data from all three software packages
(Fig. 4A). A previous study
indicated that POU2F2 was expressed at significantly higher levels
in CC (28). Recent research has
also highlighted the importance of POU2F2 in glucose metabolism and
its association with the oncogenic AKT/mTOR signaling pathway
(29). Herein, the JASPAR
database predicted a POU2F2 response element in the RACK1
promoter (Fig. 4B). A
dual-luciferase reporter assay was performed to confirm whether
POU2F2 binds to the 3′ untranslated region (3′UTR) of the
RACK1 mRNA. The relative luciferase activity was
significantly high in the CC cells co-transfected with
GV238-RACK1-3′ UTR and the POU2F2 overexpression plasmid.
The mutation of the 3′UTR of RACK1 mRNA abrogated this
effect (Figs. 4C and S6A), suggesting that POU2F2 binds to
the 3′ UTR of RACK1 mRNA. Furthermore, the results of
ChIP-PCR revealed that POU2F2 bound to the RACK1 promoter in
CC cells (Figs. 4D and S6B).
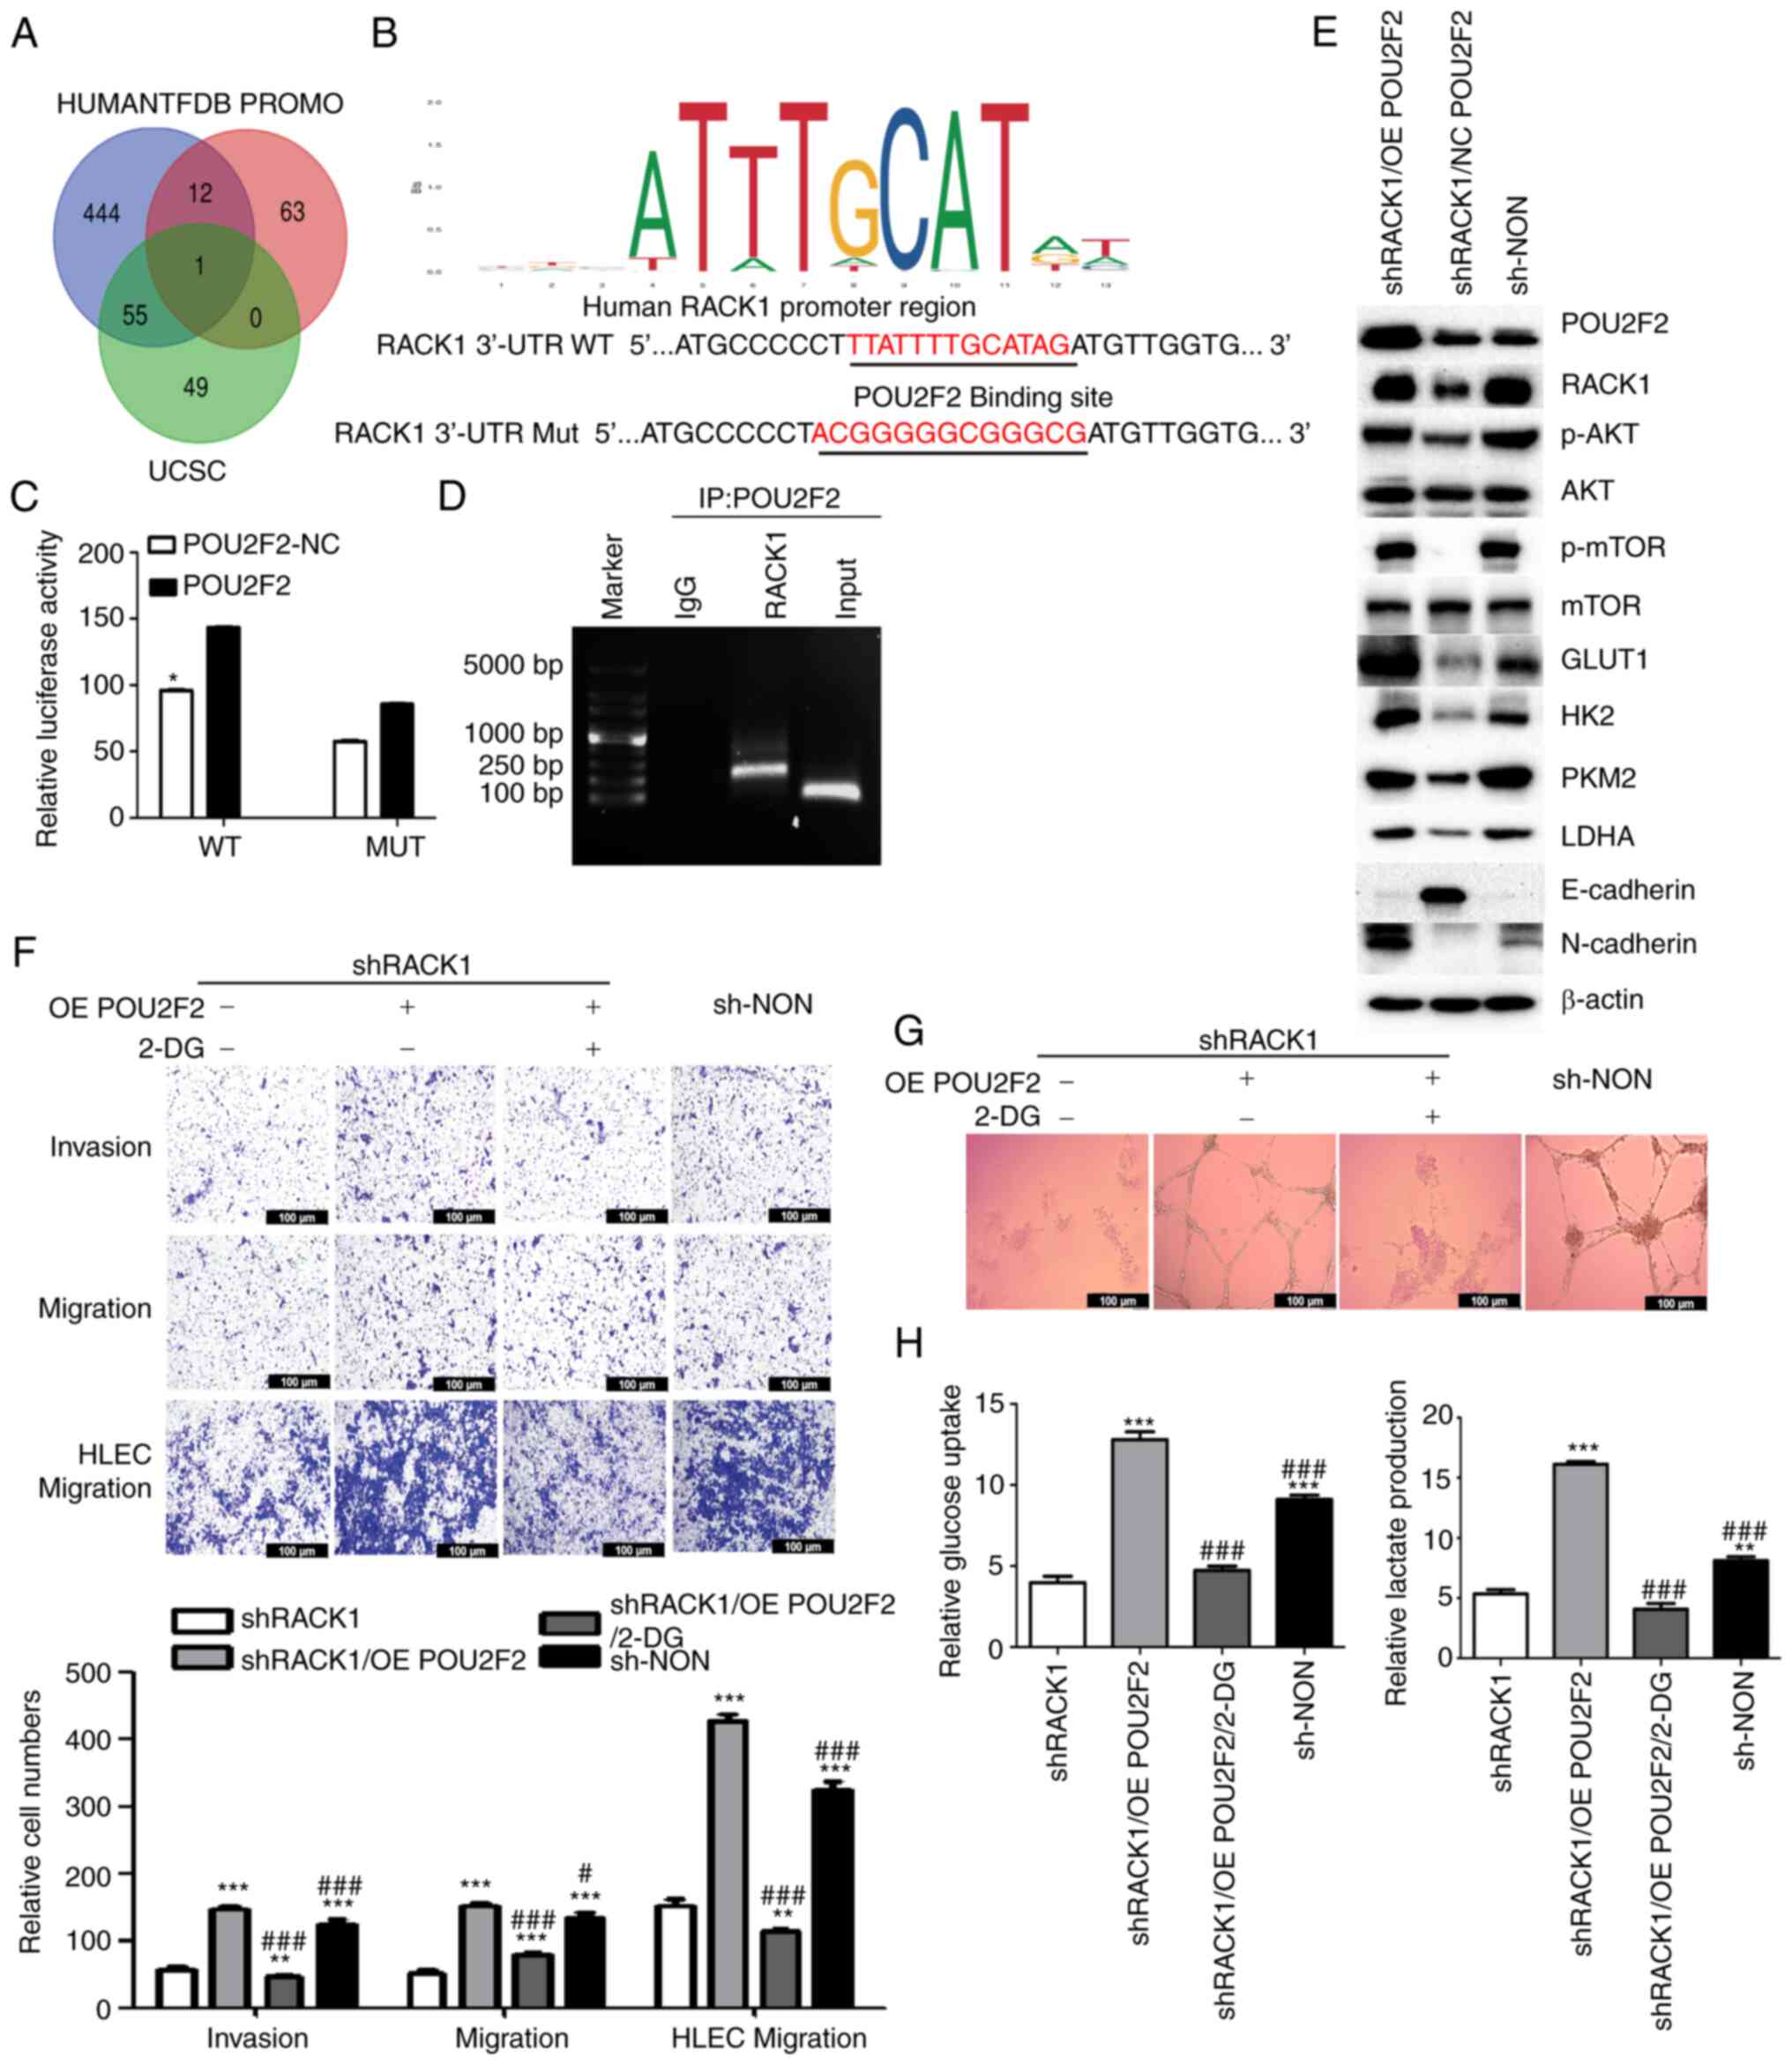 | Figure 4RACK1 is a direct target of POU2F2.
(A) Venn diagram showing the transcription factor binding to RACK1
co-existing in UCSC, HUMANTFDB and PROMO database. (B) POU2F2 DNA
binding sites are present in the human RACK1 promoter
region. The top panel shows the WT and MUT forms of the putative
POU2F2 target sequences in RACK1 3′-UTR. Red font (upper
panel) refers to the putative POU2F2 targeting sequence in the
RACK1 3′-UTR. Red font (lower panel) refers to mutations in
the POU2F2 targeting sequence in RACK1 3′-UTR. (C)
Luciferase reporter assays of WT and MUT RACK1 luciferase
reporters transfected with POU2F2 in MS751 cells. (D) ChIP-PCR
assay was used to detect POU2F2-binding sites in the sequence of
the RACK1 promoter. (E) Effect of POU2F2 on the expression
of RACK1, p-AKT (ser472 + ser474 + ser473), p-mTOR (ser2448), AKT,
mTOR, GLUT1, HK2, PKM2, LDHA, E-cadherin and N-cadherin in
shRACK1/MS751 cells, as evaluated using western blot analysis. (F)
POU2F2 OE-shRACK1/MS751 cells were stimulated for 24 h with 10 mM
2-DG. Effect of POU2F2 and 2-DG combined with POU2F2 on the
invasion and migration of shRACK1/MS751 cells and migration of
HLECs (upper panel), with the quantified bands assessed (lower
panel). (G) Effect of POU2F2 on tube formation of HLECs. (H) Effect
of POU2F2 on glucose uptake and lactate production in MS751 cells.
Data were analyzed using one-way ANOVA and are presented as the
mean ± SD. Data were compared with the shRACK1 group
(**P<0.01 and ***P<0.001) or OE
POU2F2/shRACK1 group (#P<0.05 and
###P<0.001). RACK1, receptor for activated C kinase
1; POU2F2, POU class 2 homeobox 2; WT, wild-type; MUT, mutant type;
2-DG, 2-deoxy-D-glucose; mTOR, mammalian target of rapamycin; HK2,
hexokinase 2; LDHA, lactate dehydrogenase A; GLUT1, glucose
transporter 1; PKM2, pyruvate kinase M2; HLECs, human lymphatic
endothelial cells; OE, overexpression. |
Subsequently, rescue experiments were performed by
transfecting MS751 and SiHa cells with a POU2F2 overexpression
plasmid to further investigate the effects of POU2F2 on
RACK1/IGF1R/AKT/mTOR signaling pathway activation. Firstly, the
overexpression of POU2F2 was validated using western blot analysis
and RT-qPCR in two cervical cancer cells (Fig. S6C-E). Then we found that upon
POU2F2 overexpression, RACK1 expression levels increased to
an extent similar to that observed in shNON cells (Figs. 4E, S3C, S4C and S6F). Moreover, POU2F2
overexpression abrogated the inhibitory effects of RACK1
knockdown on migration and invasiveness of CC and HLECs (Figs. S6H and 4F), and lymphangiogenesis (Fig. 4G). The reduction in the
phosphorylation levels of AKT and mTOR, and in the expression of
glycolytic enzymes induced by RACK1 knockdown was attenuated
by POU2F2 overexpression (Figs.
4E, S3C, S4C, S5D and S6F).
It was also observed that POU2F2 overexpression efficiently
restored the levels of glucose uptake and lactate production
inhibited by RACK1 knockdown in CC cells (Figs. 4H and S6G). Based on these results, it was
concluded that POU2F2 is required for RACK1-mediated aggressiveness
and aerobic glycolysis by activating IGF1R/AKT/mTOR signaling.
RACK1 promotes CC invasion, migration and
lymphangiogenesis by activating aerobic glycolysis
Increased aerobic glycolysis has been shown to be
associated with various malignant phenotypes of cancer cells,
including metastatic CC (30,31). In the present study, to determine
whether the effects of RACK1 on CC cell aggressiveness are
dependent on aerobic glycolysis, 2-DG, a glycolytic inhibitor, was
added to the cell culture medium. 2-DG decreased the invasiveness
and migration of CC and HLECs (Figs.
4F and S6H), as well as
lymphangiogenesis (Fig. 4G), even
following POU2F2 overexpression which resulted in RACK1
re-expression. In addition, the results revealed that POU2F2
overexpression increased N-cadherin and decreased E-cadherin
expression (Figs. 4E, S3C, S4C and S6F). These results
suggested that RACK1 may perform oncogenic functions in CC cells by
activating CC cell aggressiveness in a glycolysis-dependent
manner.
RACK1 promotes LNM and aerobic glycolysis
of CC in vivo
To examine the effects of RACK1 on the growth and
LNM of CC in vivo, shRACK1/SiHa, shNON/SiHa, shRACK1/MS751
and shNON/MS751 cells were injected into the footpads of mice to
establish a xenograft model. After 4 weeks, the mice were
euthanized, the size of the footpad tumors was measured and the
inguinal lymph nodes were removed. Notably, the shRACK1/SiHa and
shRACK1/MS751 injections prominently inhibited metastasis in the
primary tumor of the inguinal lymph nodes of nude mice compared to
those observed in mice that received the shNON/SiHa and shNON/MS751
injections (Figs. 5A and S7A). As the lentiviral plasmids were
labeled with green fluorescent protein (GFP), the transfected
cancer cells that metastasized to the lymph nodes could be
identified based on GFP fluorescence (Figs. 5A and S7A). The LNM rate was lower in the
shRACK1/MS751 (25%, 2/8) and shRACK1/SiHa (37.5%, 3/8) groups than
in the shNON/SiHa (87.5%, 7/8) and shNON/MS751 (87.5%, 7/8) groups.
It was found that the tumor size and lymph node volume were smaller
in shRACK1/MS751 and shRACK1/SiHa groups than in shNON/SiHa and
shNON/MS751 groups (Figs. 5C and
E, and S7D and E). Moreover,
IHC revealed lower density of lymphatic vessels, as indicated by
lower levels of podoplanin (PDPN) in the shRACK1/SiHa and
shRACK1/MS751 groups than in the shNON/SiHa and shNON/MS751 groups
(Figs. 5B and S7B), suggesting that RACK1 markedly
induced LNM in vivo. Furthermore, the results revealed lower
levels of N-cadherin, GLUT1, PKM2, HK2 and LDHA, and the higher
expression of E-cadherin in the tissues from the shRACK1/SiHa and
shRACK1/MS751 groups than in those of the shNON/SiHa and
shNON/MS751 groups (Figs. 5D and
S7C). Collectively, these
findings revealed that downregulation of RACK1 inhibited
aerobic glycolysis and the aggressiveness of CC in vivo.
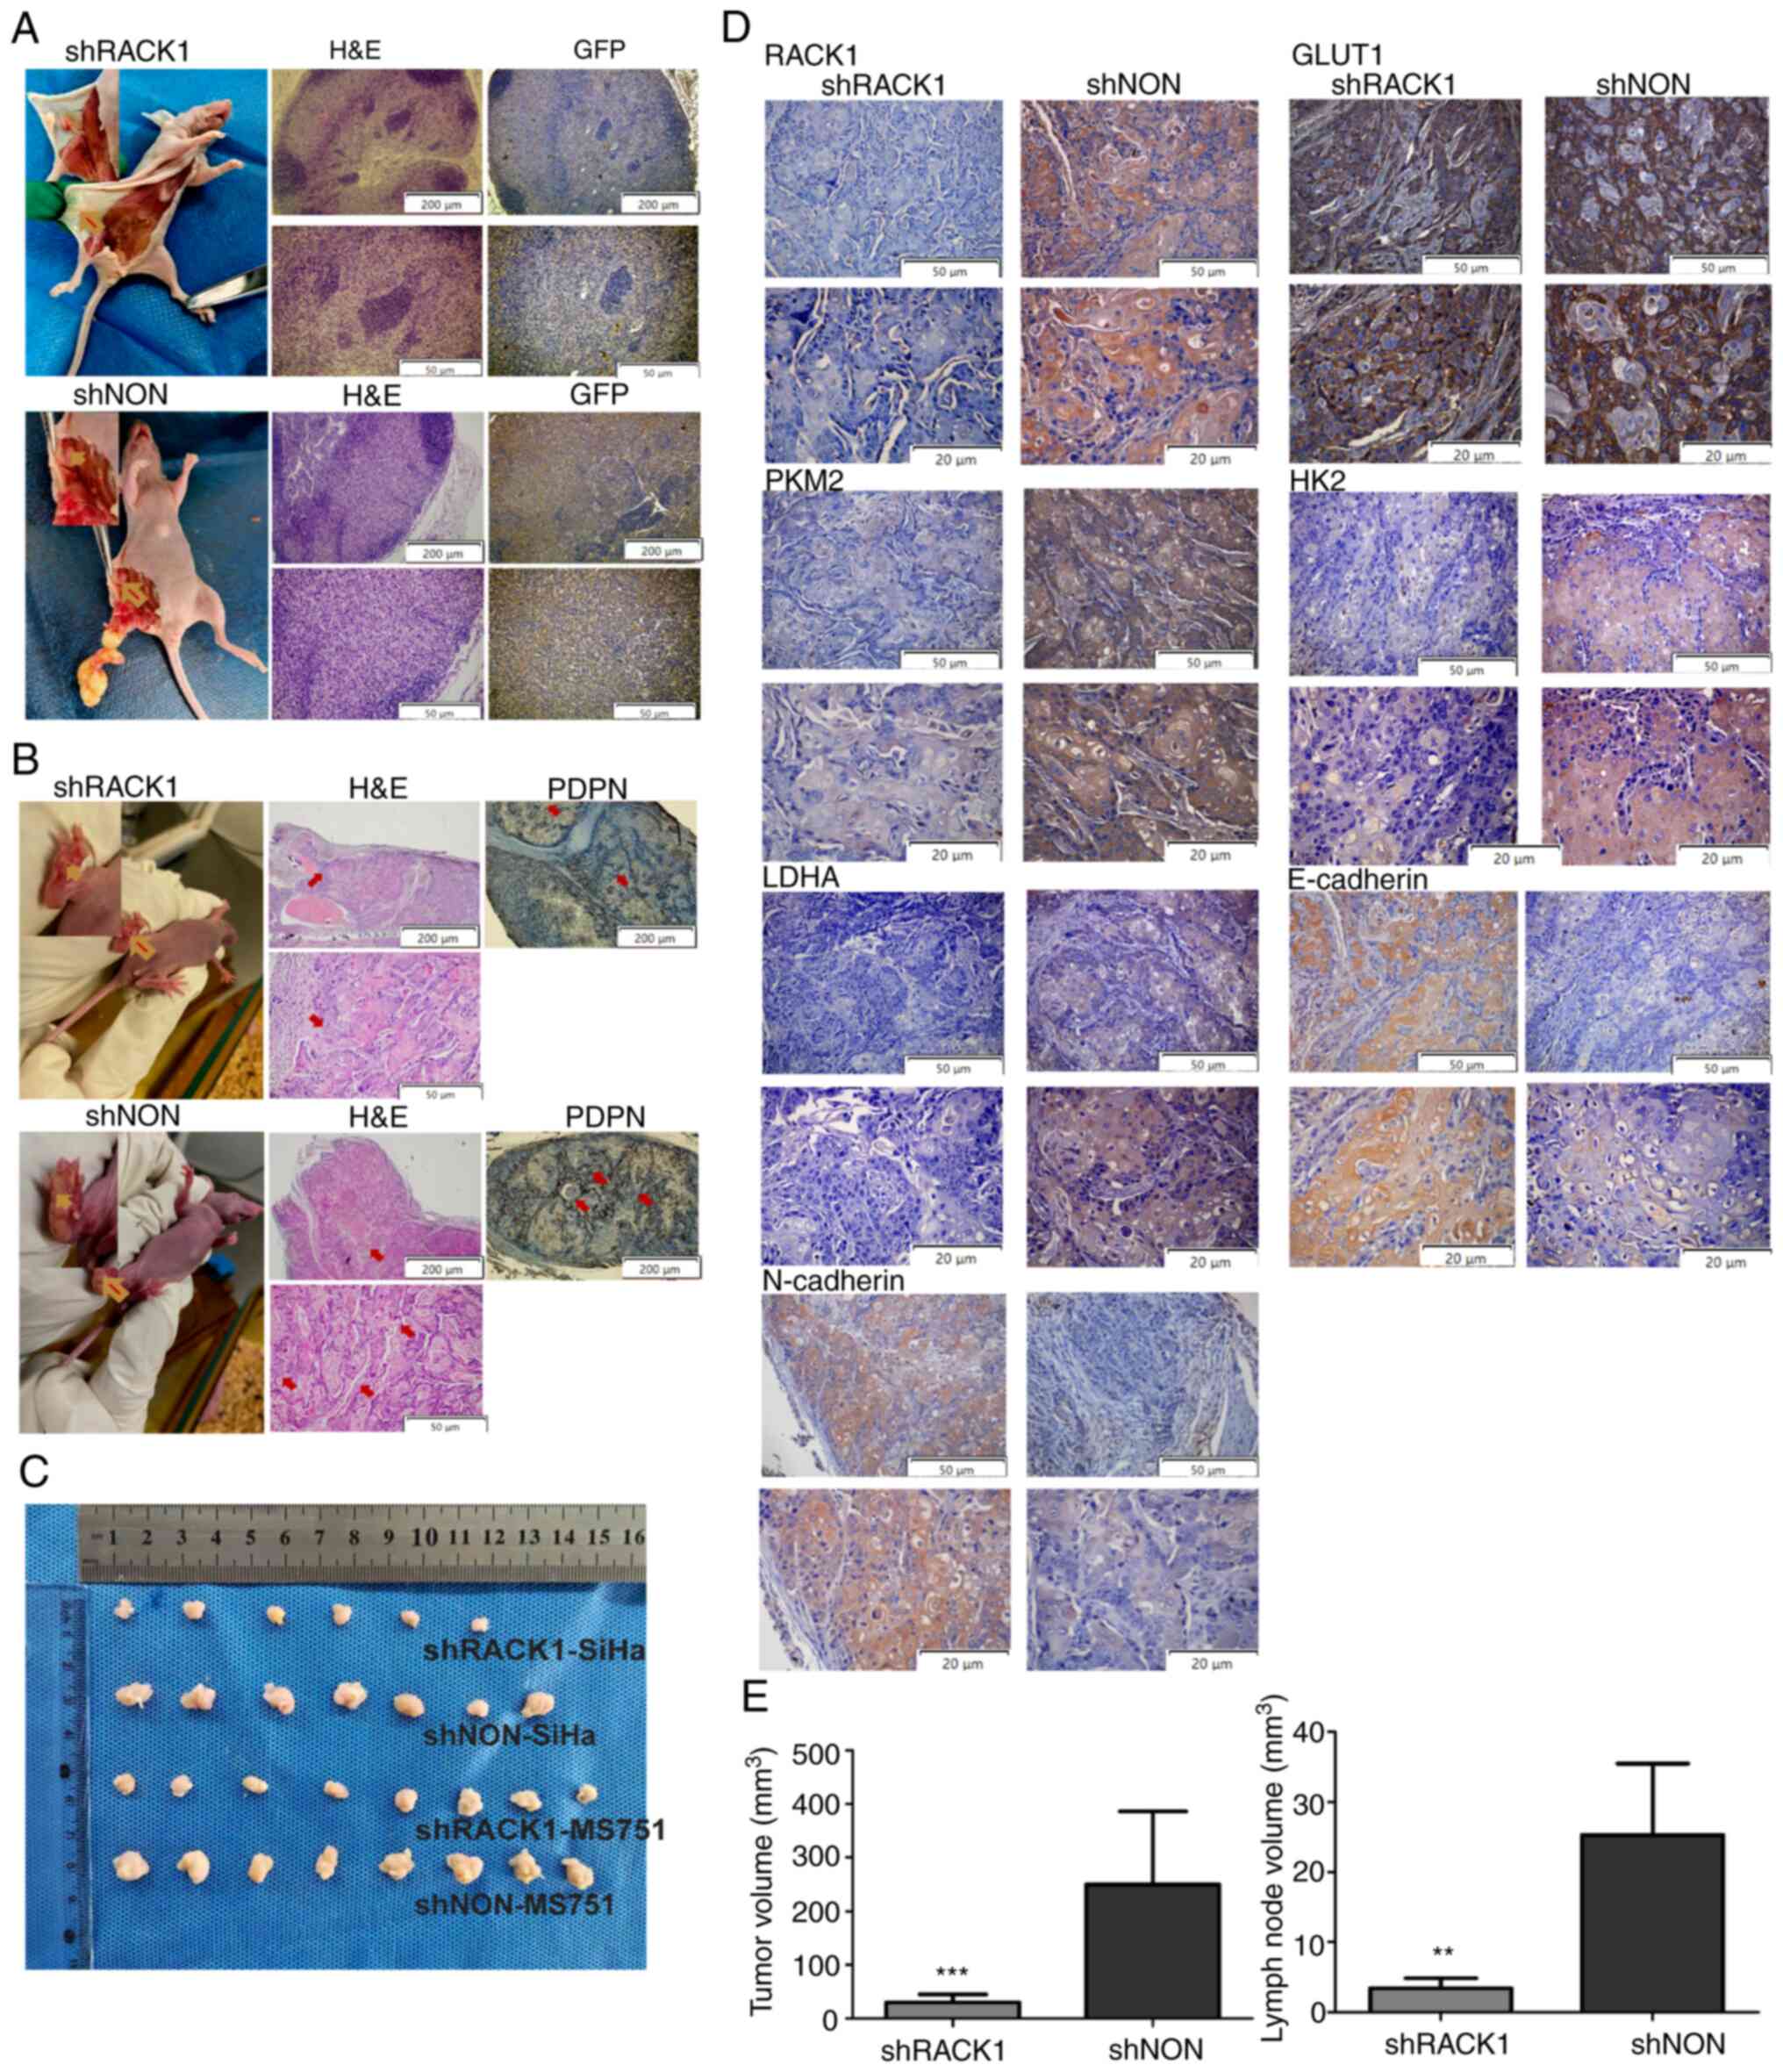 | Figure 5RACK1 enhances the LNM of MS751 cells
in vivo. (A) Representative images of inguinal lymph nodes
in different groups of nude mice (n=8, left panel). Representative
images of inguinal lymph nodes of H&E staining in different
groups of nude mice (middle panel). Representative images of
anti-GFP IHC analysis for inguinal lymph nodes in different groups
of nude mice (right panel). (B) Representative images of footpads
primary tumor in different groups of nude mice (left panel).
Representative images of footpads primary tumor tissues of H&E
staining (middle panel) and percentages of PDPN-indicated lymphatic
vessels density in different groups of nude mice (right panel). (C)
The image of all tumors with a ruler. (D) Representative images of
RACK1, GLUT1, PKM2, HK2, LDHA, E-cadherin and N-cadherin expression
in footpad primary tumor tissues in IHC analysis. (E) The bar graph
summarizes the tumor size assessed (left panel), and lymph node
volume assessed (right panel). Data were compared with the shNON
group (**P<0.01 and ***P<0.001). Data
are presented as the mean ± SD and were analyzed using the t-test.
IHC, immunohistochemistry; RACK1, receptor for activated C kinase
1; LNM, lymph node metastasis; HK2, hexokinase 2; LDHA, lactate
dehydrogenase A; GLUT1, glucose transporter 1; PKM2, pyruvate
kinase M2; PDPN, podoplanin. |
RACK1 expression correlates with POU2F2,
IGF1R and HK2 expression in clinical CC specimens
To determine the association between RACK1
expression and aerobic glycolysis in clinical CC specimens,
paraffin-embedded tissues from 104 clinical CC specimens were
examined using IHC. The results revealed that RACK1 was more highly
expressed in CC tissues than in normal cervical epithelial tissues.
Moreover, RACK1 overexpression was significantly associated with
tumor differentiation and positive lymph nodes, but not with tumor
size or FIGO stage (Fig. S8A and
Table I). Subsequently, the
expression of RACK1, POU2F2, IGF1R and HK2 was profiled using IHC.
Consistent with the observations in tumor cell lines and xenograft
models, the distribution and intensity of RACK1 positively
correlated with POU2F2, IGF1R and HK2 expression in CC tissues
(Fig. S8B-D). As shown in
Fig. 6, the CC samples exhibited
a strong RACK1 expression, which was associated with a strong
POU2F2, IGF1R, and HK2 expression (representative case 1).
Similarly, CC samples with medium RACK1 levels expressed medium
levels of POU2F2, IGF1R and HK2 (representative case 2). CC samples
with a weak RACK1 expression expressed low levels of POU2F2, IGF1R
and HK2 (representative case 3). CC samples not expressing RACK1
did not express POU2F2, IGF1R and HK2 (representative case 4).
Taken together, these results suggest that the molecular mechanisms
through which RACK1 induces aerobic glycolysis and LNM include the
activation of the POU2F2-mediated IGF1R/AKT/mTOR signaling pathway
in patients with CC (Fig. 7).
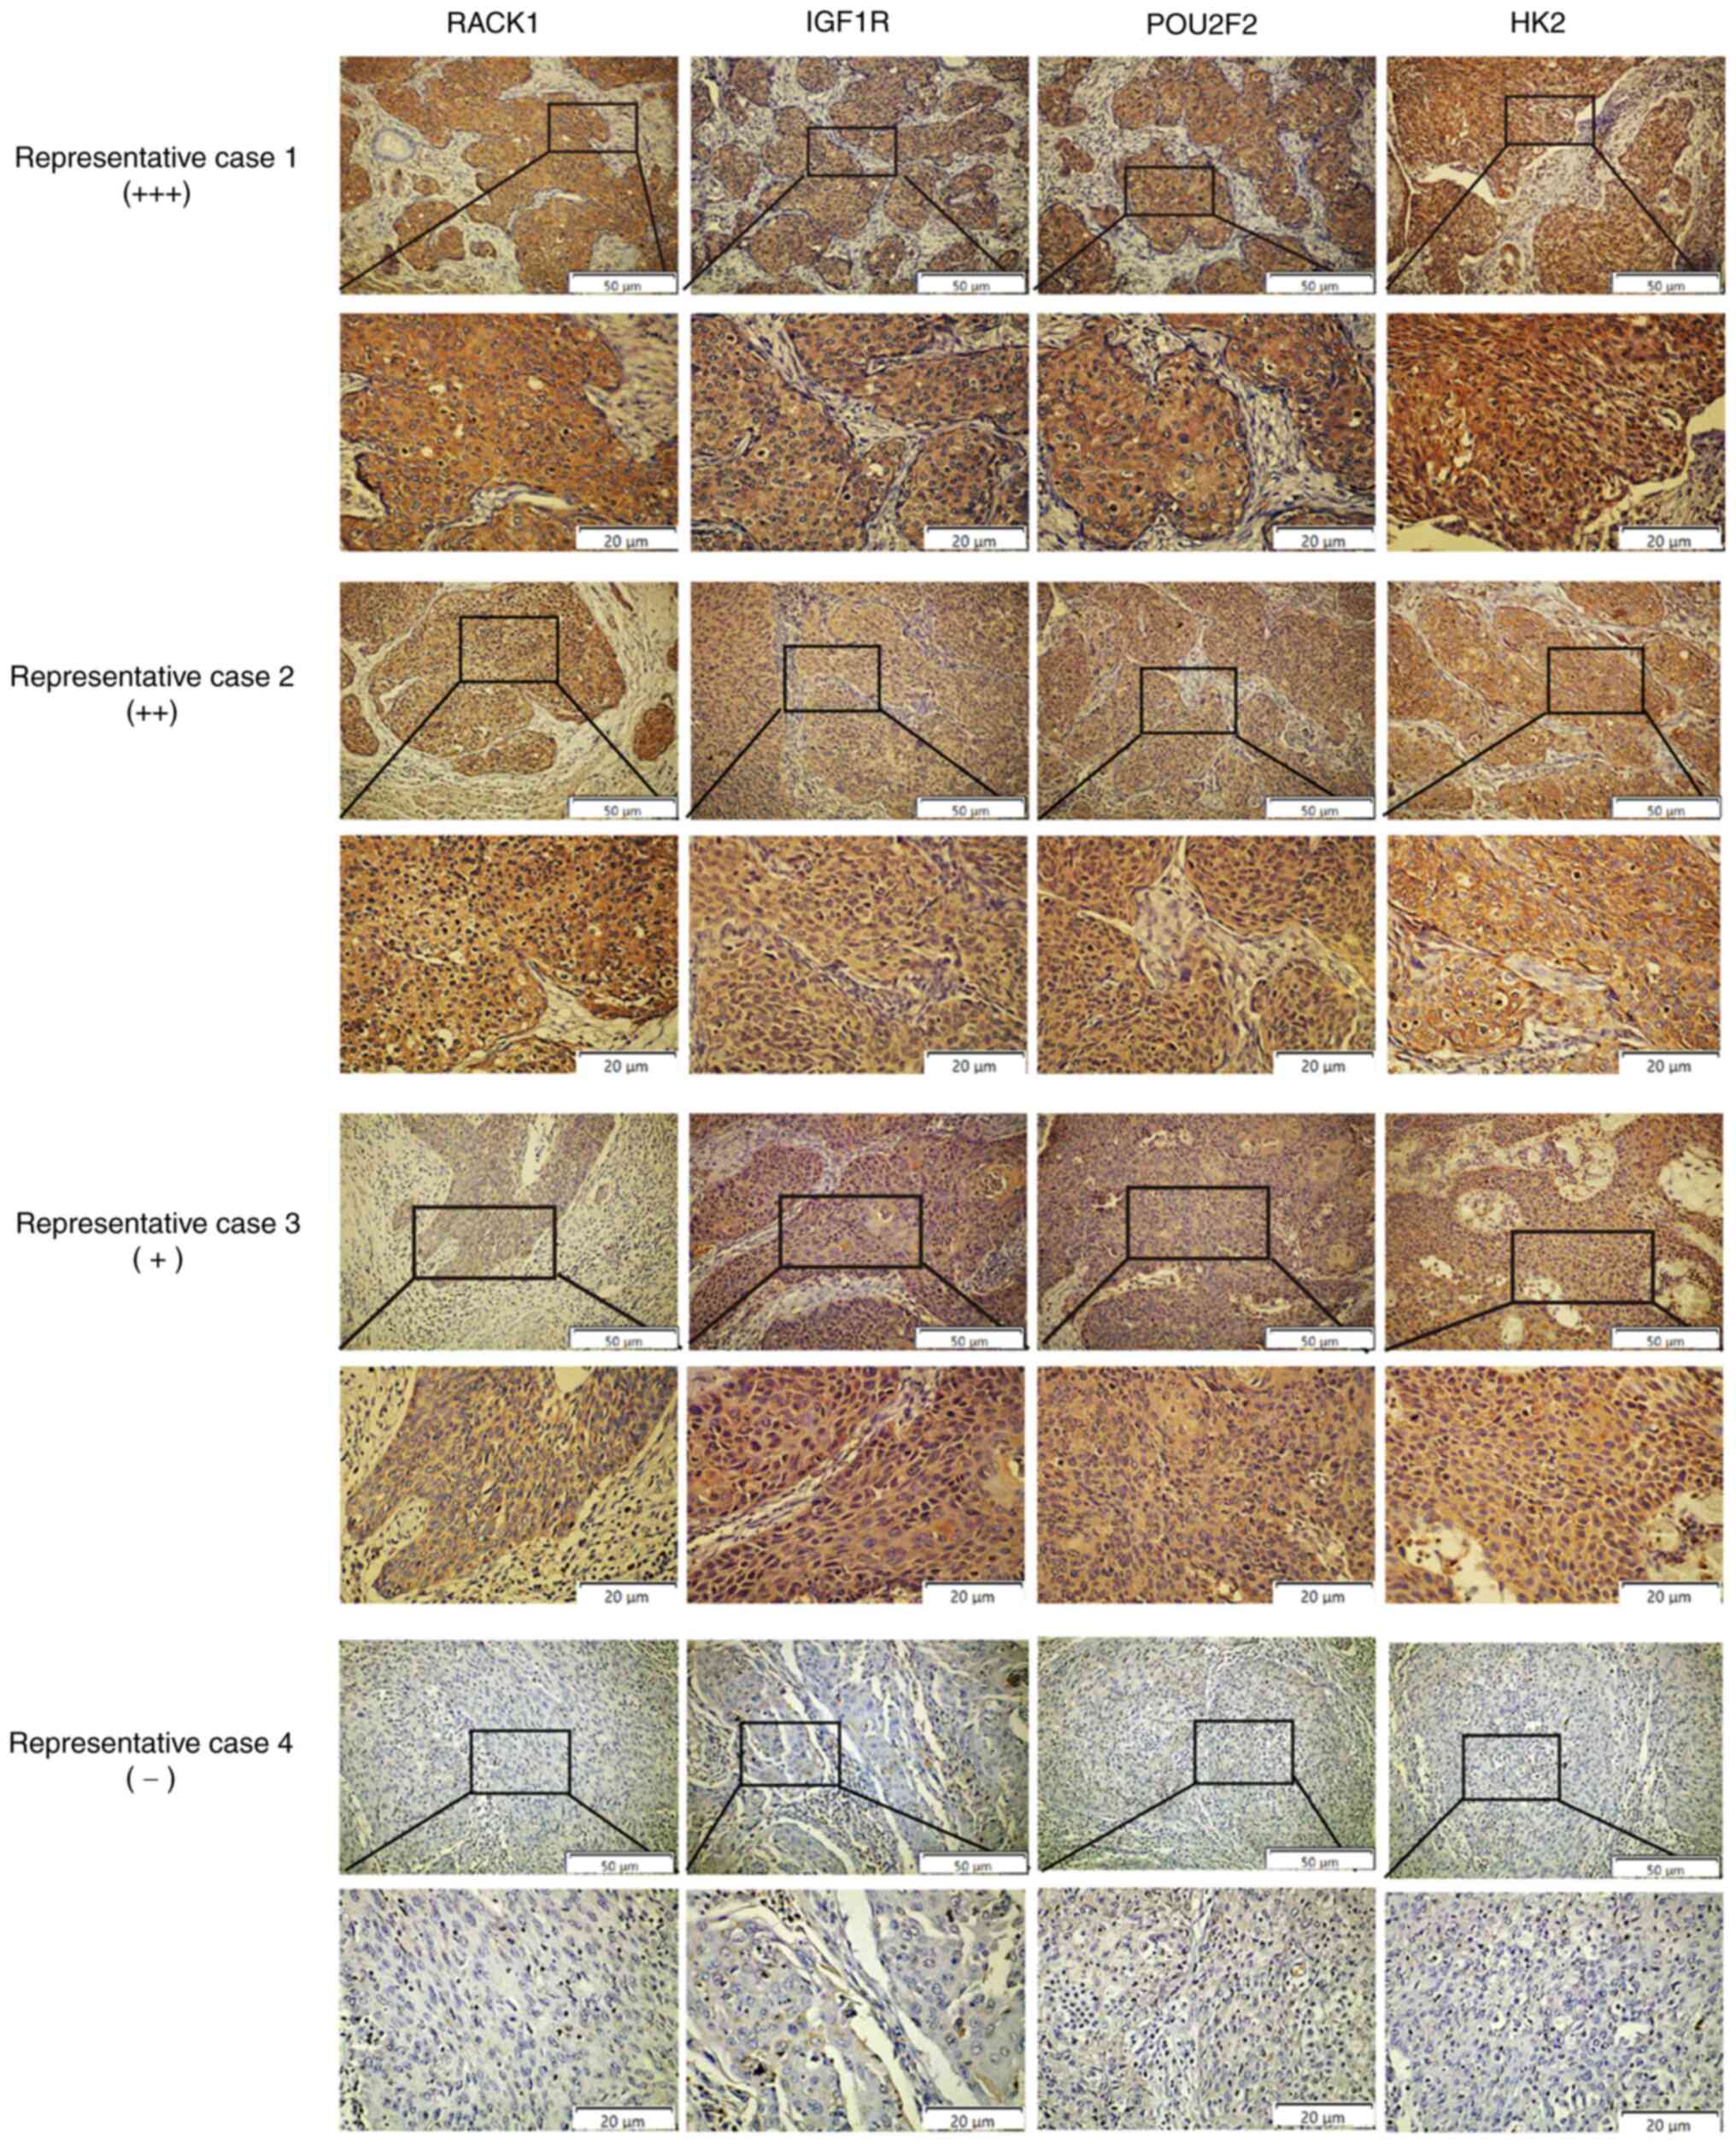 | Figure 6Associations between RACK1, IGF1R,
POU2F2, and HK2 expression in tissues from patients with CC.
Representative images of IHC staining in case 1 for RACK1, IGF1R,
POU2F2 and HK2 (strong RACK1 expression). Representative images of
IHC staining in case 2 for RACK1, IGF1R, POU2F2 and HK2 (medium
RACK1 expression). Representative images of IHC staining in case 3
for RACK1, IGF1R, POU2F2 and HK2 (weak RACK1 expression).
Representative images of IHC staining in case 4 for RACK1, IGF1R,
POU2F2 and HK2 (negative RACK1 expression). CC, cervical cancer;
IHC, immunohistochemistry; RACK1, receptor for activated C kinase
1; LNM, lymph node metastasis; HK2, hexokinase 2; LDHA, lactate
dehydrogenase A; GLUT1, glucose transporter 1; PKM2, pyruvate
kinase M2; IGF1R, insulin-like growth factor 1 receptor; POU2F2,
POU class 2 homeobox 2. |
 | Table IRACK1 expression in cervical
carcinoma according to the histopathological characteristics of the
patients with cervical cancer. |
Table I
RACK1 expression in cervical
carcinoma according to the histopathological characteristics of the
patients with cervical cancer.
|
Characteristics | N | Negative | Weak | Moderate | Strong | χ2 | P-value |
|---|
| Cervical cancer
tissues | 104 | 21 | 24 | 43 | 16 | | |
| Cervicitis
tissues | 31 | 24 | 6 | 0 | 1 | 39.223 | <0.001 |
|
Differentiation | | | | | | | |
| Well | 20 | 1 | 1 | 10 | 8 | | |
| Moderate/poor | 84 | 20 | 23 | 33 | 8 | 16.538 | 0.010 |
| L/N metastasis | | | | | | | |
| Negative | 57 | 17 | 15 | 17 | 8 | | |
| Positive | 47 | 4 | 9 | 26 | 8 | 10.568 | 0.014 |
| FIGO stage | | | | | | | |
| ≤IIB | 68 | 13 | 19 | 28 | 8 | | |
| >IIB | 36 | 8 | 5 | 15 | 8 | 3.801 | 0.284 |
| Tumor size | | | | | | | |
| <2.5 cm | 51 | 14 | 8 | 22 | 7 | | |
| ≥2.5 cm | 53 | 7 | 16 | 21 | 9 | 5.237 | 0.155 |
Discussion
LNM is associated with a poor prognosis of patients
with CC, as effective treatment modalities are currently lacking
(32). Therefore, the elucidation
of the molecular mechanisms under-lying LNM may provide clinically
preventive and therapeutic strategies for patients with CC and LNM.
However, the precise mechanisms underlying LNM in CC remain largely
unknown. In the present study, the expression of RACK1 in CC and
its key role in promoting LNM were investigated. It was observed
that POU2F2 directly regulated RACK1, and that RACK1 interacted
with IGF1R. Therefore, RACK1 links POU2F2 to the IGF1R/AKT/mTOR
signaling pathway. The interaction of RACK1 with the
POU2F2/IGF1R/AKT/mTOR pathway promoted CC glycolysis, and the
subsequent regulatory effects on LNM was dependent on glycolysis
(Fig. 7). These findings
indicated that RACK1 plays a pivotal role in CC progression,
indicating that RACK1 may be a potential therapeutic target for
CC.
RACK1 has been described as one of seven critical
network nodes with specific properties, which plays a critical role
in the invasion and distant metastasis of tumors (33,34). Wu et al (14) observed the high and specific
expression of RACK1 in meta-static CC tissue; however, Wang et
al (35) observed a lower
RACK1 expression in CC tissues than in normal cervical tissues. In
the present study, the analysis of the data in the GEO database
revealed that RACK1 was upregulated or down-regulated in CC.
RACK1 was upregulated in cancer tissues in the GSE6791
dataset, but was downregulated in cancer tissues in the GSE9750
dataset. Thus, the potential molecular mechanisms underlying the
functions of RACK1 in CC are unclear. In the present study,
it was demonstrated that RACK1 was upregulated in CC tissues and
cell lines, particularly in CC cells with a high metastatic
potential (MS751 cell lines). Moreover, RACK1 knockdown
inhibited tumor cell invasion, migration and lymphangiogenesis, and
reduced glycolysis in vitro. Furthermore, RACK1
knockdown decreased the rate of LNM in vivo. The
invasiveness of CC has been shown to be related to the acquisition
of epithelial-to-mesenchymal transition (EMT) (36). It has also been observed that
following the knockdown of RACK1, MS751 and SiHa cells
exhibit an increased E-cadherin and decreased N-cadherin expression
both in vitro and in vivo, which are critical markers
of EMT (37), suggesting a novel
mechanism by which RACK1 regulates invasion in CC. These data
suggest that RACK1 may represent a potential molecular target for
clinical intervention in patients with CC and LNM.
Alterations in the levels of intracellular
metabolic intermediates that accompany cancer-associated metabolic
reprogramming have profound effects on tumor progression (38). Accumulating evidence has
demonstrated that glucose is required as an energy source, and that
cellular glycolysis levels are crucial for cancer metastasis
(11,39). Previously, the authors used
1H NMR spectroscopy to analyze plasma samples from
patients with cervical intraepithelial neoplasia (CIN) and CC, as
well as normal individuals, and found aberrations in the levels of
glycolysis-related enzymes (12).
In addition, RACK1 is involved in glucose metabolism during cancer
metastasis (40). PER1 utilizes
the PER1/RACK1/PI3K/AKT pathway to promote glycolysis, and
regulation of metastasis is dependent on glycolysis in oral
squamous cell carcinoma (41).
RACK1 interacts with FGFR to promote the phosphorylation of PKM2,
thereby increasing tumor metastasis via glycolysis in lung squamous
cell carcinoma (20). Hence, the
present study investigated whether RACK1 modulates glycolysis to
promote LNM in CC. The results of 1H NMR analysis
indicated notable associations between RACK1 downregulation and the
glycolysis/gluconeogenesis pathways. Consistent with the
aforementioned findings, it was found that RACK1 knockdown
decreased intracellular glucose uptake and lactate production by
downregulating the expression of key glycolytic enzymes in CC
cells, such as GLUT1, PKM2, HK2 and LDHA. Therefore, the inhibition
of aberrant glycolysis by targeting RACK1 may be a novel strategy
for treating patients with CC with LNM. However, based on the
results of 1H NMR analysis, it was concluded that
RACK1-induced metabolic changes involve not only aerobic
glycolysis, but also glutamine metabolism; thus, this needs to be
investigated in the future.
Another important finding of the present study is
that RACK1 activated the AKT/mTOR pathway by interacting with IGF1R
in CC. IGF1R plays a key role in regulating glucose metabolism and
promotes cell invasion and metastasis (42). Previous studies have demonstrated
the pro-tumor properties of IGF1R in CC (43,44). IGF1R is considered to be one of
the regulators of the AKT/mTOR pathway. Kiely et al
(45) identified RACK1 as an
IGF1R-interacting protein that negatively affects the activation of
the AKT pathway. However, Zhang et al (24) found that RACK1-IGF1R interaction
resulted in the activation of AKT, but did not observe any change
in AKT activation in MCF7 cells. In a recent study, RACK1
interacted with IGF1R, enabling activation of the AKT pathway,
which favors the progression of prostate cancer (46) and renal cell carcinoma (47). The present study demonstrated that
RACK1 interacted with IGF1R and that knockdown of RACK1
decreased the binding of RACK1 with IGF1R, leading to inactivation
of the AKT/mTOR pathway in CC cells. It has also been demonstrated
that the aberrant activation of the AKT/mTOR pathway is associated
with cancer progression (48,49). Moreover, the glycolytic processes
regulated by the AKT/mTOR pathway is crucial for cancer metastasis
(50), although the activation of
the AKT/mTOR pathway by RACK1 in glycolytic processes and LNM in CC
remains unknown. The present study performed rescue experiments to
elucidate the mechanisms by which the AKT/mTOR pathway regulates CC
cell lymphangiogenesis and glycolysis. The results revealed that
IGF1 restored the activation of the AKT/mTOR pathway, and promoted
cancer cell lymphangiogenesis and glycolysis in CC. Based on these
results, it is suggested that RAPA, an mTOR inhibitor, inhibits CC
cell progression and glycolysis by decreasing mTOR phosphorylation.
These findings indicate that RACK1 constitutively activates the
AKT/mTOR pathway, which is crucial for the progression and
glycolysis of CC. However, IGF1R is not the only target of RACK1,
as at least three factors have been predicted to interact with
RACK1 using bioinformatics analysis. The precise molecular
mechanisms through which RACK1 interacts with IGF1R in CC remain
unclear. The identification of the minimal binding motif in RACK1
required for its interaction with IGF1R is thus warranted in the
future.
A previous study reported the high expression of
POU2F2 in tumor tissues and that it promotes tumorigenesis and
metastasis (51). POU2F2 is a
member of the POU transcription factor family that coordinates
numerous cell responses, from internal cues of pluripotency and
differentiation to external stimuli of proliferation and apoptosis,
in a time-and cell-specific manner (52). Moreover, recent research has
indicated that POU2F2 significantly promotes CC cell proliferation
(28). However, the contribution
of abnormal POU2F2 expression in LMN of CC remains unclear. In the
present study, bioinformatics analysis revealed that POU2F2 was the
only upstream regulator of RACK1 and was predicted to form
complementary base pairs with RACK1. A POU2F2 binding sequence
(5′-TTA TTT TGC ATA G-3′) was found in the RACK1 promoter
using JASPAR database prediction. It was found that POU2F2
over-expression restored the expression of RACK1 in shRACK1 cells.
Herein, for the first time, to the best of our knowledge, it was
demonstrated that POU2F2 transcriptionally activated RACK1 by
directly binding to the RACK1 promoter region from +680 to
+692, thereby stimulating the AKT/mTOR signaling pathway, and
promoting CC lymphangiogenesis and glycolysis. CC cells stably
overexpressed POU2F2 when treated with 2-DG, a glycolysis
inhibitor, in functional rescue experiments. It was found that the
inhibition of glycolysis suppressed the migration and invasion
observed with RACK1 re-expression upon the overexpression of POU2F2
in CC cells, indicating the critical role of aberrant glycolysis in
RACK1-induced LNM in CC. Furthermore, the high expression of RACK1
was detected in the lymph nodes in clinical CC specimens, which
positively correlated with POU2F2, IGF1R and HK2 expression in CC
tissues. These results indicated that the
POU2F2/RACK1/IGF1R/AKT/mTOR pathway may be a promising biomarker
for CC. In addition, these findings improve the understanding of
the upstream regulatory machinery of RACK1 and highlight a novel
treatment strategy aimed at preventing RACK1-mediated CC LNM.
Supplementary Data
Availability of data and materials
The datasets used and/or analyzed during the
current study are available from the corresponding author on
reasonable request.
Authors′ contributions
LX and AH designed the study. LX, JL, YH, MT, BM
and HT performed the experiments. LX and JL drafted the manuscript.
JL, HT and MT analyzed the data. AH managed the project
administration. JL and BM confirm the authenticity of all the raw
data. YH and BM processed the figures/images. All authors have read
and approved the manuscript.
Ethics approval and consent to
participate
The present study was performed in accordance with
the guide-lines of the Ethics Committee of the First Affiliated
Hospital of Xinjiang Medical University. Written informed consent
was obtained from all patients and their relatives. The illiterate
elderly patients authorized their children to sign the written
informed consent these patients also placed a thumbprint on the
written consent form to represent informed consent. All animal
experiments were approved by the Ethics Committee of the First
Affiliated Hospital of Xinjiang Medical University (authorization
no. IACUC-20180223-128).
Patient consent for publication
Not applicable.
Competing interests
The authors declare that they have no competing
interests.
Acknowledgements
Not applicable.
Funding
The present study was funded by the Xinjiang Uygur Autonomous
Region Science and Technology Plan Project, P.R. China (grant no.
2021D14002).
Abbreviations:
|
CC
|
cervical cancer
|
|
RACK1
|
receptor for activated C kinase 1
|
|
IGF1R
|
insulin-like growth factor 1
receptor
|
|
POU2F2
|
POU class 2 homeobox 2
|
|
AKT
|
protein kinase B
|
|
mTOR
|
mammalian target of rapamycin
|
|
HK2
|
hexokinase 2
|
|
LDHA
|
lactate dehydrogenase A
|
|
GLUT1
|
glucose transporter 1
|
|
PKM2
|
pyruvate kinase M2
|
|
PDPN
|
podoplanin
|
|
2-DG
|
2-deoxy-D-glucose
|
|
LNM
|
lymph node metastasis
|
|
IHC
|
immunohistochemistry
|
|
1H NMR
|
H nuclear magnetic resonance
|
|
shRNA
|
short hairpin RNA
|
|
Co-IP
|
co-immunoprecipitation
|
|
Rapa
|
rapamycin
|
|
ChIP
|
chromatin immunoprecipitation
|
References
|
1
|
Kagabu M, Yoshino N, Saito T, Miura Y,
Takeshita R, Murakami K, Kawamura H, Baba T and Sugiyama T: The
efficacy of a third-generation oncolytic herpes simplex viral
therapy for an HPV-related uterine cervical cancer model. Int J
Clin Oncol. 26:591–597. 2021. View Article : Google Scholar
|
|
2
|
Husaiyin S, Jiao Z, Yimamu K, Maisaidi R,
Han L and Niyazi M: Thinprep cytology combined with hpv detection
in the diagnosis of cervical lesions in 1622 patients. PLoS One.
16:e02609152021. View Article : Google Scholar
|
|
3
|
Yang H, Kuo YH, Smith ZI and Spangler J:
Targeting cancer metastasis with antibody therapeutics. Wiley
Interdiscip Rev Nanomed Nanobiotechnol. 13. pp. e16982021,
View Article : Google Scholar
|
|
4
|
Federico C, Sun J, Muz B, Alhallak K,
Cosper PF, Muhammad N, Jeske A, Hinger A, Markovina S, Grigsby P,
et al: Localized delivery of cisplatin to cervical cancer improves
its therapeutic efficacy and minimizes its side effect profile. Int
J Radiat Oncol Biol Phys. 109:1483–1494. 2021. View Article : Google Scholar
|
|
5
|
Swartz MA and Lund AW: Lymphatic and
interstitial flow in the tumour microenvironment: Linking
mechanobiology with immunity. Nat Rev Cancer. 12:210–219. 2012.
View Article : Google Scholar
|
|
6
|
Fagiani E, Lorentz P, Bill R, Pavotbawan
K, Kopfstein L and Christofori G: Vegf receptor-2-specific
signaling mediated by vegf-e induces hemangioma-like lesions in
normal and in malignant tissue. Angiogenesis. 19:339–358. 2016.
View Article : Google Scholar
|
|
7
|
Liu D, Zeinolabediny Y, Caccuri F, Ferris
G, Fang WH, Weston R, Krupinski J, Colombo L, Salmona M, Corpas R,
et al: P17 from hiv induces brain endothelial cell angiogenesis
through egfr-1-mediated cell signalling activation. Lab Invest.
99:180–190. 2019. View Article : Google Scholar
|
|
8
|
Park MK, Zhang L, Min KW, Cho JH, Yeh CC,
Moon H, Hormaechea-Agulla D, Mun H, Ko S, Lee JW, et al: Neat1 is
essential for metabolic changes that promote breast cancer growth
and metastasis. Cell Metab. 33:2380–2397. 2021. View Article : Google Scholar
|
|
9
|
Vaupel P, Schmidberger H and Mayer A: The
warburg effect: Essential part of metabolic reprogramming and
central contributor to cancer progression. Int J Radiat Biol.
95:912–919. 2019. View Article : Google Scholar
|
|
10
|
Luo P, Zhang C, Liao F, Chen L, Liu Z,
Long L, Jiang Z, Wang Y, Wang Z, Liu Z, et al: Transcriptional
positive cofactor 4 promotes breast cancer proliferation and
metastasis through c-myc mediated warburg effect. Cell Commun
Signal. 17:362019. View Article : Google Scholar
|
|
11
|
Yang J, Ren B, Yang G, Wang H, Chen G, You
L, Zhang T and Zhao Y: The enhancement of glycolysis regulates
pancreatic cancer metastasis. Cell Mol Life Sci. 77:305–321. 2020.
View Article : Google Scholar
|
|
12
|
Hasim A, Ali M, Mamtimin B, Ma JQ, Li QZ
and Abudula A: Metabonomic signature analysis of cervical carcinoma
and precancerous lesions in women by (1)H NMR spectroscopy. Exp
Ther Med. 3:945–951. 2012. View Article : Google Scholar
|
|
13
|
Wu J, Meng J, Du Y, Huang Y, Jin Y, Zhang
J, Wang B, Zhang Y, Sun M and Tang J: Rack1 promotes the
proliferation, migration and invasion capacity of mouse
hepatocellular carcinoma cell line in vitro probably by pi3k/rac1
signaling pathway. Biomed Pharmacother. 67:313–319. 2013.
View Article : Google Scholar
|
|
14
|
Wu H, Song S, Yan A, Guo X, Chang L, Xu L,
Hu L, Kuang M, Liu B, He D, et al: Rack1 promotes the invasive
activities and lymph node metastasis of cervical cancer via
galectin-1. Cancer Lett. 469:287–300. 2020. View Article : Google Scholar
|
|
15
|
Tokunaga H, Shimada M, Ishikawa M and
Yaegashi N: TNM classification of gynaecological malignant tumours,
eighth edition: Changes between the seventh and eighth editions.
Jpn J Clin Oncol. 49:311–320. 2019. View Article : Google Scholar
|
|
16
|
Livak KJ and Schmittgen TD: Analysis of
relative gene expression data using real-time quantitative PCR and
the 2(-Delta Delta C(T)) method. Methods. 25:402–408. 2001.
View Article : Google Scholar
|
|
17
|
Liu D, Li C, Trojanowicz B, Li X, Shi D,
Zhan C, Wang Z and Chen L: Cd97 promotion of gastric carcinoma
lymphatic metastasis is exosome dependent. Gastric Cancer.
19:754–766. 2016. View Article : Google Scholar
|
|
18
|
Cui B, Chen J, Luo M, Liu YY, Chen HL, Lü
D, Wang LW, Kang YZ, Feng Y, Huang LB and Zhang P: PKD3 promotes
metastasis and growth of oral squamous cell carcinoma through
positive feedback regulation with PD-L1 and activation of
ERK-STAT1/3-EMT signalling. Int J Oral Sci. 13:82021. View Article : Google Scholar
|
|
19
|
Bower AJ, Li J, Chaney EJ, Marjanovic M,
Spillman DR Jr and Boppart SA: High-speed imaging of transient
metabolic dynamics using two-photon fluorescence lifetime imaging
microscopy. Optica. 5:1290–1296. 2018. View Article : Google Scholar
|
|
20
|
Li HM, Yang JG, Liu ZJ, Wang WM, Yu ZL,
Ren JG, Chen G, Zhang W and Jia J: Blockage of glycolysis by
targeting pfkfb3 suppresses tumor growth and metastasis in head and
neck squamous cell carcinoma. J Exp Clin Cancer Res. 36:72017.
View Article : Google Scholar
|
|
21
|
Wan J, Liu Y, Long F, Tian J and Zhang C:
Circpvt1 promotes osteosarcoma glycolysis and metastasis by
sponging mir-423-5p to activate wnt5a/ror2 signaling. Cancer Sci.
112:1707–1722. 2021. View Article : Google Scholar
|
|
22
|
Lenz G, Hamilton A, Geng S, Hong T, Kalkum
M, Momand J, Kane SE and Huss JM: T-darpp activates igf-1r
signaling to regulate glucose metabolism in trastuzumab-resistant
breast cancer cells. Clin Cancer Res. 24:1216–1226. 2018.
View Article : Google Scholar
|
|
23
|
Hermanto U, Zong CS, Li WQ and Wang LH:
RACK1, an insulin-like growth factor I (IGF-I) receptor-interacting
protein, modulates IGF-I-dependent integrin signaling and promotes
cell spreading and contact with extracellular matrix. Mol Cell
Biol. 22:2345–2365. 2002. View Article : Google Scholar
|
|
24
|
Zhang W, Zong CS, Hermanto U,
Lopez-Bergami P, Ronai Z and Wang LH: Rack1 recruits stat3
specifically to insulin and insulin-like growth factor 1 receptors
for activation, which is important for regulating
anchorage-independent growth. Mol Cell Biol. 26:413–424. 2006.
View Article : Google Scholar
|
|
25
|
Lin T, Yang Y, Ye X, Yao J and Zhou H: Low
expression of mir-99b promotes progression of clear cell renal cell
carcinoma by up-regulating igf1r/akt/mtor signaling. Int J Clin Exp
Pathol. 13:3083–3091. 2020.
|
|
26
|
Ellis BC, Graham LD and Molloy PL: Crnde,
a long non-coding rna responsive to insulin/igf signaling,
regulates genes involved in central metabolism. Biochim Biophys
Acta. 1843:372–386. 2014. View Article : Google Scholar
|
|
27
|
Sun T, Liu Z and Yang Q: The role of
ubiquitination and deubiquitination in cancer metabolism. Mol
Cancer. 19:1462020. View Article : Google Scholar
|
|
28
|
Zhou L and Xu XL: Long non-coding rna
arap1-as1 facilitates the progression of cervical cancer by
regulating mir-149-3p and pou2f2. Pathobiology. 88:301–312. 2021.
View Article : Google Scholar
|
|
29
|
Yang R, Wang M, Zhang G, Li Y, Wang L and
Cui H: Pou2f2 regulates glycolytic reprogramming and glioblastoma
progression via pdpk1-dependent activation of pi3k/akt/mtor
pathway. Cell Death Dis. 12:4332021. View Article : Google Scholar
|
|
30
|
Guler OC, Torun N, Yildirim BA and Onal C:
Pretreatment metabolic tumour volume and total lesion glycolysis
are not independent prognosticators for locally advanced cervical
cancer patients treated with chemoradiotherapy. Br J Radiol.
91:201705522018. View Article : Google Scholar
|
|
31
|
Cegla P, Burchardt E, Roszak A,
Czepczynski R, Kubiak A and Cholewinski W: Influence of biological
parameters assessed in [18f]fdg pet/ct on overall survival in
cervical cancer patients. Clin Nucl Med. 44:860–863. 2019.
View Article : Google Scholar
|
|
32
|
Osaku D, Komatsu H, Okawa M, Iida Y, Sato
S, Oishi T and Harada T: Re-classification of uterine cervical
cancer cases treated with radical hysterectomy based on the 2018
figo staging system. Taiwan J Obstet Gynecol. 60:1054–1058. 2021.
View Article : Google Scholar
|
|
33
|
Duan F, Wu H, Jia D, Wu W, Ren S, Wang L,
Song S, Guo X, Liu F, Ruan Y and Gu J: O-glcnacylation of rack1
promotes hepatocellular carcinogenesis. J Hepatol. 68:1191–1202.
2018. View Article : Google Scholar
|
|
34
|
Han H, Wang D, Yang M and Wang S: High
expression of rack1 is associated with poor prognosis in patients
with pancreatic ductal adenocarcinoma. Oncol Lett. 15:2073–2078.
2018.
|
|
35
|
Wang J and Chen S: Rack1 promotes
mir-302b/c/d-3p expression and inhibits ccno expression to induce
cell apoptosis in cervical squamous cell carcinoma. Cancer Cell
Int. 20:3852020. View Article : Google Scholar
|
|
36
|
Zhu X, Chen L, Liu L and Niu X:
EMT-mediated acquired EGFR-TKI resistance in NSCLC: Mechanisms and
strategies. Front Oncol. 9:10442019. View Article : Google Scholar
|
|
37
|
Mahmood MQ, Ward C, Muller HK, Sohal SS
and Walters EH: Epithelial mesenchymal transition (EMT) and
non-small cell lung cancer (NSCLC): A mutual association with
airway disease. Med Oncol. 34:452017. View Article : Google Scholar
|
|
38
|
Torresano L, Nuevo-Tapioles C,
Santacatterina F and Cuezva JM: Metabolic reprogramming and disease
progression in cancer patients. Biochim Biophys Acta Mol Basis Dis.
1866:1657212020. View Article : Google Scholar
|
|
39
|
Li S, Zhu K, Liu L, Gu J, Niu H and Guo J:
Lncarsr sponges mir-34a-5p to promote colorectal cancer invasion
and metastasis via hexokinase-1-mediated glycolysis. Cancer Sci.
111:3938–3952. 2020. View Article : Google Scholar
|
|
40
|
Liang J, Yang Y, Bai L, Li F and Li E:
Drp1 upregulation promotes pancreatic cancer growth and metastasis
through increased aerobic glycolysis. J Gastroenterol Hepatol.
35:885–895. 2020. View Article : Google Scholar
|
|
41
|
Gong X, Tang H and Yang K: Per1 suppresses
glycolysis and cell proliferation in oral squamous cell carcinoma
via the per1/rack1/pi3k signaling complex. Cell Death Dis.
12:2762021. View Article : Google Scholar
|
|
42
|
Baserga R: The Igf-I receptor in cancer
research. Exp Cell Res. 253:1–6. 1999. View Article : Google Scholar
|
|
43
|
Han L: Mir-99a inhibits proliferation and
migration of cervical cancer cells by targeting igf1r. J BUON.
26:1782–1788. 2021.
|
|
44
|
Sin STK, Li Y, Liu M, Ma S and Guan XY:
Trop-2 exhibits tumor suppressive functions in cervical cancer by
dual inhibition of igf-1r and alk signaling. Gynecol Oncol.
152:185–193. 2019. View Article : Google Scholar
|
|
45
|
Kiely PA, Sant A and O'Connor R: Rack1 is
an insulin-like growth factor 1 (igf-1) receptor-interacting
protein that can regulate igf-1-mediated akt activation and
protection from cell death. J Biol Chem. 277:22581–22589. 2002.
View Article : Google Scholar
|
|
46
|
Caromile LA, Dortche K, Rahman MM, Grant
CL, Stoddard C, Ferrer FA and Shapiro LH: Psma redirects cell
survival signaling from the mapk to the pi3k-akt pathways to
promote the progression of prostate cancer. Sci Signal.
10:eaag33262017. View Article : Google Scholar
|
|
47
|
He X, Wang J, Messing EM and Wu G:
Regulation of receptor for activated c kinase 1 protein by the von
hippellindau tumor suppressor in igf-i-induced renal carcinoma cell
invasiveness. Oncogene. 30:535–547. 2011. View Article : Google Scholar
|
|
48
|
Wu Q, Ma J, Wei J, Meng W, Wang Y and Shi
M: Foxd1-as1 regulates foxd1 translation and promotes gastric
cancer progression and chemoresistance by activating the
pi3k/akt/mtor pathway. Mol Oncol. 15:299–316. 2021. View Article : Google Scholar
|
|
49
|
Li ZQ, Qu M, Wan HX, Wang H, Deng Q and
Zhang Y: Foxk1 promotes malignant progression of breast cancer by
activating PI3K/AKT/MTOR signaling pathway. Eur Rev Med Pharmacol
Sci. 23:9978–9987. 2019.
|
|
50
|
Zheng Y, Wu C, Yang J, Zhao Y, Jia H, Xue
M, Xu D, Yang F, Fu D, Wang C, et al: Insulin-like growth factor
1-induced enolase 2 deacetylation by hdac3 promotes metastasis of
pancreatic cancer. Signal Transduct Target Ther. 5:532020.
View Article : Google Scholar
|
|
51
|
Wang SM, Tie J, Wang WL, Hu SJ, Yin JP, Yi
XF, Tian ZH, Zhang XY, Li MB, Li ZS, et al: Pou2f2-oriented network
promotes human gastric cancer metastasis. Gut. 65:117–1438. 2016.
View Article : Google Scholar
|
|
52
|
Bentrari F, Chantôme A, Knights A, Jeannin
JF and Pance A: Oct-2 forms a complex with oct-1 on the inos
promoter and represses transcription by interfering with
recruitment of rna polii by oct-1. Nucleic Acids Res. 43:9757–9765.
2015.
|