Introduction
Death associated proteins, DAPs, are a small group
of proteins that appear to be responsive proteins in interferon
gamma-induced programme cell death (1,2).
There are two members of the DAP protein family, namely DAP1 and
DAP3, which have molecular weights of 15 and 46 kDa, respectively.
Whilst DAP1 has been shown to be a regulator of autophagy (3) and lost in certain malignancies
including breast cancer (4),
neurological tumours (5) and
pancreatic cancer (6), the roles
of DAP3 in cancer cells and in clinical cancer setting conditions
are far from clear.
DAP3 is responsive to interferon-beta (IFN-β) and
-gamma (IFN-γ)-induced anoikis and apoptosis that require IPS1
(interferon-beta promoter stimulator 1) (1,7,8).
DAP3 has been shown to be highly expressed in pancreatic cancer
(6), glioblastoma multiforme
(9), late stage thymomas (9,10),
the non-epithelial derived tumour, Burkitt Lymphoma and a subtype
of acute lymphoblastic leukaemia (11). By sharp contrast, the levels of
DAP3 were low in gastric (12) and
breast cancer (10,13) when compared with the respective
normal counterpart tissues. In addition, DAP3 in cells derived from
certain solid cancers could be used as an indicator for patients'
response to drug and radiation therapies (12,14).
For example, knocking down DAP3 in human lung cancer A549 and H1299
cells markedly increased the rate of cell death and reduced the
fraction of cell survival in response to radiation and chemo drug
treatment (14). In human hepatoma
cell line Hep3B, DAP3 is one of the prominent responsive genes
regulated by a P53-regulating protein TP63 (15). The reasons for discrepancies of the
roles played by DAP3 in cells are not clear. One possibility is the
dependency on cell types and cancer types, a phenomenon known for a
few cancer-related molecules. The idea that the discrepancies may
be due to DAP3 gene mutation is less convincing as there has been
little evidence of mutation in the key regions of the DAP3 gene
(16). A recent study has shown
that in pancreatic cancer, high levels of DAP3 were associated with
a significantly shorter overall survival (OS) and disease-free
survival (DFS) of the patients and that there was a close
relationship between DAP3 expression and lymph node involvement
(6). In addition, it has been
reported recently that DAP3 is able to mediate the variant splicing
event via forming substrate-specific splicing inducing
ribonucleoprotein complexes and by modulating splicing factors to
cause indirect effect on splicing (17), a possible reason for DAP3 to
contribute to the poor outcome of patients.
Previously, a protein that interacts with DAP3
protein has been reported and named DELE1 (DAP3 Binding Cell Death
Enhancer 1, also known as KIAA0141). DELE1 has been identified by a
yeast two-hybrid screening in HeLa cells (18). DELE1 overexpression has been shown
to render cell apoptosis in response to tumour necrosis factor and
TRAIL (18). By interacting with
DAP3, DELE1 may coordinate a cell death event in cells as silencing
DELE1 would reduce death receptor (DR)-mediated apoptosis. DELE1
protein contains a mitochondrial targeting sequence at the
N-terminus and two Tetratricopeptide Repeat Motifs (TPR) motifs in
protein-protein interaction domains (18), and was subsequently found to be a
key component, together with Overlapping Activity With M-AAA
Protease (OMA1) and Heme-Regulated Eukaryotic Initiation Factor
EIF-2-Alpha Kinase (HRI) in mitochondria stress signalling pathways
(19-21). It has been reported that DAP3
knockdown results in mitochondria fragmentation (14,22).
These findings suggested that DAP3, by interacting with DELE1,
regulates cell functions and cell death via the mitochondria
signalling pathways. DAP3 and DELE1 are important growth/death
regulators of cancer cells and have important clinical values.
However, the roles played by the two molecules markedly vary
depending on cell and tumour types. Along this line, only very
limited tumour types have been investigated. In addition,
investigation on both DAP3 and DELE1 together in a single clinical
cancer type has not been conducted.
Colon cancer is one of the leading cancer types
globally and ranks the fifth in both new cases
(1.15×10⁶, 6.0% of total) and number of deaths
(0.58×10⁶, 5.8% of total) (23). Its incidence and death rate are
higher in countries with high human development index compared with
those with medium/low indexes. Whilst surgery, if the tumour is
discovered early, remains an important option for colon cancer
treatment, chemotherapies and radiation therapies are essential for
late-staged colon cancer patients. However, there are limited
chemotherapeutic agents for colon cancer patients, commonly used
including fluorouracil, oxaliplatin, capecitabline (Xeloda) and
Irinotecan, which are often used in combinations. With the
recognition of the importance of angiogenesis in the development
and progression of colon cancer, anti-angiogenic therapies are also
available for these patients; for example, the anti-VEGF humanised
antibody therapy, Avastin/Bevatuzumab, has become a choice for
patients with colorectal cancers (CRCs). Despite all the latest
options of treatment, survival of the patients, particularly those
in late state remains very poor, namely 90, 80, 70 and 10% for
stage 1, 2, 3 and 4 tumours, respectively. Amongst a wide range of
studies on the factors linked to the outcome of the patients, a
recent study from the US has indicated that the clinical outcome of
colon cancer (stage-3) appeared to be independent of race, when
patients of white and black ethnicity were compared, and unrelated
to median household income (24),
arguing that more wider factors, including biological factors, may
contribute to the outcomes of the patients.
In light of the important roles of DAP3 and DELE1 in
cancer cells and the limited information on their roles in clinical
cancers, in the present study, the expression of both DAP3 and
DELE1 in gene transcript and protein levels were investigated and
their potential prognostic and therapeutic value in human CRC was
explored. In the present study, for the first time to the best of
our knowledge, it was reported that both DAP3 and DELE1 were
overexpressed in colon cancer and that their high levels serve as a
significant indicator for the clinical outcomes. Furthermore,
silencing DAP3 and DELE1 or DAP3/DELE1 together in colon cancer
cell models significantly increased the sensitivity to
chemotherapeutic drugs in vitro.
Materials and methods
Reagents
Primary antibodies used in the current study
included anti-DAP3 antibody (cat. no. sc-373911) and anti-DELE1
antibody (cat. no. sc-515080; both from Santa Cruz Biotechnologies
Inc.). Anti-DAP-3 antibody was a mouse monoclonal IgG1 (Kappa light
chain) against human DAP3 (Synthetic peptide corresponding to Human
DAP3 aa 63-95 conjugated to keyhole limpet hemocyanin; END PAK HGD
QHE GQH YNI SPQ DLE TVF PHG LPP RFV MQ VKTFS), whilst anti-DELE1
antibody was also a mouse monoclonal IgG1 (Kappa light chain)
against human DELE1 (Synthetic peptide corresponding to Human
DELE-1 aa 338-400 conjugated to keyhole limpet hemocyanin vs. LLK
QAA DSG LRE AQAFLGVLFTKEPYLDEQRAVKYLWLAANNGDSQSR YHL GIC YEK GLG).
The secondary antibody used was goat anti-mouse IgG-HRP (cat. no.
abs20001; Absin Bioscience, Inc.). Anti-human DELE1 siRNA was
purchased from Santa Cruz Biotechnologies, Inc. An anti-human DAP3
ribozyme transgene that was specifically used to target and
knockdown human DAP3 was prepared as previously reported (12).
Colorectal cohort for gene transcript
analysis
A cohort of 94 colorectal fresh tumour tissues and
matched normal tissues (15 cm away from tumour margins) were
collected immediately after surgery at the University Hospital of
Wales (Heath Park, Cardiff, Wales, UK) and stored at −80°C until
further processing. Patients with other cancers, family history of
cancers and patients who received chemotherapies before surgery
were excluded. The median age of the patients was 73 years (range
25-88 years) and the cohort had 43 female and 51 male patients. The
collection was approved by the local research ethics committee Bro
Taff Research Ethics Committee (Ref. 05/DMD/3562). Written informed
consent was given by all patients. The clinical, pathological and
outcome information were retrospectively collected after surgery
and during the follow-up. Frozen sections were produced for routine
histology and immunohistochemical studies, where sections were cut
at 6 µm thickness, and 20 sequential sections of 20
µm thickness were collected and homogenised for RNA
extraction. Reverse transcription of the tissue RNA was conducted
using a RT kit (Sigma-Aldrich; Merck KGaA), by following the
manufacturer's instructions.
Colon cancer cell line
Human CRC cell line, RKO, was purchased from ECACC
(European Collection of Animal Cell Culture). RKO cells were
cultured in Dulbecco's Modified Eagle's Medium (DMEM) supplemented
with 10% fetal bovine serum (both from Sigma-Aldrich; Merck KGaA)
and antibiotics (penicillin and streptomycin at 100 unit/ml and 100
µg/ml, respectively). Cells were maintained at 37°C with 5%
CO2.
Quantitative analyses of gene
transcripts
Transcript levels of DAP3 and DELE1 in colorectal
tissues and colon cancer cells were determined by reverse
transcription-quantitative polymerase chain reaction. RNA was
extracted from described experimental materials by using
TRIzol® reagents (Sigma-Aldrich; Merck KGaA), following
the manufacturers' instructions. RNA samples were then quantified
to 500 ng/µl and were processed using a reverse
transcription kit (Promega Corporation) to synthesise cDNA, by
following the manufacturer's protocol. The chemistry for qPCR was
based on Ampliflor Uniprimer™ (Intergen), a molecular beacon-based
technology with modifications (25,26).
StepOne plus systems (Thermo Fisher Scientific, Inc.) was applied
in the present study for amplification and quantification. The
primer sequences including those for GAPDH, DAP3 and DELE1 are
listed in Table I. To one of the
target specific primers, a Z-sequence,
ACTGAACCTGACCGTACA-(underlined in Table I) was added at the 5' end of the
primer. The Z-sequence complements the stem region of the
FAM-tagged probe, Ampliflor Uniprimer™ for amplification and
detection. An internal DNA standard with known quantity was
included in all the assays for calculation of expression levels as
previously reported (12). GAPDH
was used as a house-keeping gene for a loading control.
 | Table IPrimer sequences using in the qPCR
analyses. |
Table I
Primer sequences using in the qPCR
analyses.
| Gene name | Primer sequence
5′→3′ |
|---|
| DAP3 | F:
AAAGCACTGAGAAAGGGAGT |
| R: ACTGAACCTGACCGTACACCTCTTTAGGTCTTTCAGCA |
| DELE1 | F:
GTCATGAGCATGGCAGAG |
| R: ACTGAACCTGACCGTACAACCTGGCATAGCGGTACT |
| GAPDH | F:
AAGGTCATCCATGACAACTT |
| R: ACTGAACCTGACCGTACAGCCATCCACAGTCTTCTG |
Immunohistochemical (IHC) analysis
The IHC staining of DAP3 and DELE1 was performed
using a tissue microarray (TMA) (52 cases of colon cancer and 62
cases of adjacent tissue as control). Sections were dewaxed in
xylene and rehydrated through a graded series of ethanol/distilled
water, ending with a final wash in PBS. Following a 2-h blocking
step with 10% horse serum (Sigma-Aldrich; Merck KGaA), the sections
were incubated overnight at 4°C with the appropriate primary
antibody (diluted to a final concentration of 2 µg/ml in the
blocking serum). After washing thoroughly in PBS, the staining
protocol proceeded using the Vectastain Universal Elite ABC Kit
(cat. no. PK-6200; Vectastain Universal Elite ABC kit, Vector
Laboratories, Inc.). Briefly, sections were incubated for 30 min
with the biotinylated secondary antibody from the kit, made
following the manufacturer's protocol, washed with PBS, incubated
at room temperature for 30 min with ABC tertiary reagent before the
staining was developed using 3,3'-Diaminobenzidine (DAB) substrate.
The slides were then briefly washed in tap water prior to
counterstaining with Gill's haematoxylin, before bluing in tap
water, dehydrating in a graded series of ethanol, clearing in
xylene and mounted with DPX. The staining was examined using a
light microscope by independent pathologists to determine the
aberrant expression of DAP3 and DELE1 in colon cancer. The ethics
approval (approval no. 2022-019) for this protocol was granted by
the Yuhuangding Hospital Research Ethics Committee (Yantai,
China).
Implication of DAP3 and DELE1 in
responses of patients to therapies and angiogenesis
The public dataset from The Cancer Genome Atlas
(TCGA) was explored (27). The
relationship of levels of DAP3 and DELE1 with patients' responses
to chemotherapies was analysed at www.rocplot.com (accessed 6-11 February 2021)
(28). The responses were tested
by the ROC method for the chosen gene probes (208822_s_at for DAP3
and 201977_s_at for DELE1) to allow classification of the patients
based on their responses to chemotherapies. The levels of DAP3 and
DELE1 in the chemo-responsive and chemo-resistant groups were
compared using Mann-Whitney U test. Correlation with angiogenic
markers was analysed using Spearman's correlation analysis.
DAP3 and DELE1 knockdown cell models
RKO cells were transfected by the anti-DAP3 ribozyme
created in our laboratory as previously reported (29) by using the pEF6/V5-HIS TOPO TA
vector (Invitrogen/ThermoFisher Scientific, Inc.) to create the
DAP3 knockdown cell model. An empty circular pEF6/V5-HIS TOPO
vector, obtained from Invitrogen; Thermo Fisher Scientific, Inc.
was used as a transfection control. In both cases, blasticidin (2
µg/ml) was used as a selection antibiotic to create a stable
transfection cell model. In addition, a DELE1 siRNA (h) (cat. no.
sc-91731; Santa Cruz Biotechnologies, Inc.) was applied to silence
the protein expression of DELE1 in RKO cells. In this case, a
control siRNA (cat. no. sc-37007) was used as a transfection
control. The dual knockdown cell models were also established by
using anti-DAP3 ribozyme and DELE1 siRNA. These transfections were
conducted using Lipofectamine™ 3000 transfection reagent (Thermo
Fisher Scientific, Inc.), by following the instruction provided by
the manufacturer. In brief, transfections were performed once RKO
cells reached 70% confluence in a six-well plate. For every two
transfections, solution A was prepared by mixing 15 µl of
Lipofectamine™ 3000 transfection reagent with 250 µl of
Opti-MEM™. Solution B was prepared by mixing Opti-MEM™ with 5
µg of plasmid or 150 pmol of siRNA to a final volume of 250
µl, and an additional 10 µl of P3000 reagent was
supplemented into solution B if plasmid was used for transfection.
Solution A was mixed with solution B followed by incubating for 15
min at room temperature. A total of 250 µl of the complex
was then added to each well and cells were incubated at 37°C with
5% CO2 for 48 h. Blasticidin was used to maintain the
transfected DAP3 knocked down cells at the concentration of 1
µg/ml.
Cell growth and cytotoxicity assays
Two days after transient transfection, 4 types of
RKO cells (wild type, DAP3 knockdown, DELE1 knockdown and double
knockdown) were harvested and seeded in each well (12,000 cells in
100 µl medium) on a 96-well-plate treated with indicated
chemotherapy drugs at different concentrations. The 96-well plates
were then added with serial diluted chemotherapy drugs including
5-fluorouracil (5-FU; range 0.16-100 µM), Docetaxel (DTX;
range 0.1-1,000 nM) and Methotrexate (MTX; range 32-4,000 nM).
After incubation with chemotherapy drugs for 48 h, the cells were
fixed with 4% formaldehyde at room temperature for 15 min, followed
by crystal violet (0.5%) staining for 10 min. After gently washing
the plate to remove the excess crystal violet, 100 µl of
acetic acid (10%) was added into each well of the dry plate.
Absorbance at the wavelength of 595 nm was read to assess the
cytotoxicity of the drugs in each group. Each group was repeated
three times. IC50 values were calculated based on
logarithmic trend line.
Metabolic assays
Metabolic assay kits were purchased from Promega
Corporation to evaluate the metabolic profile of CRC cells
following the genetic modifications, which were performed according
to the manufacturer's instructions. Griess Reagent System (Promega
Corporation) was carried out to measure nitrite
(NO2−) concentration to study the impact of
DAP3 and DELE1 on nitric oxide levels (NO) (27). Briefly, 3×10⁴ cells of
each of the generated RKO models were seeded in a 96-well plate in
triplicate and incubated overnight at 37°C with 5% CO2.
Sodium Nitrite (100 µM) was added in the 96-well plate in
triplicate and 6 series of two-fold dilution were performed to
create a Nitrite Standard Reference Curve. A total of 50 µl
of Sulfanilamide solution was supplemented into each test sample
and incubated at room temperature, avoiding light for 10 min,
followed by adding NED solution (50 µl) and further
incubation in the dark at room temperature for 10 min. The
absorbance was then measured using a LT4500 Plate Reader (Wolf
Laboratories, Ltd.) at 540 nm and normalised based on the Nitrite
Standard Curve.
NAD(P)H-GloTM Detection System was used to
investigate concentrations of reduced forms of nicotinamide adenine
dinucleotide (NADH) and nicotinamide adenine dinucleotide phosphate
(NADPH) (Promega Corporation) (Ward and Thompson, 2012). In brief,
30,000 cells of each RKO model were seeded in a
CELLSTAR® 96 well plate (Sigma-Aldrich; Merck KGaA) in
triplicate, followed by incubating overnight at 37°C with 5%
CO2. During the period of the experiment, 50 µl
of NAD(P)H-GloTM Detection Reagent was prepared by mixing
Reconstituted Luciferin Detection Reagent, Reductase and Reductase
Substrate provided by the manufacturer together, and was
supplemented into each test sample. After shaking gently, the plate
was incubated at room temperature for 60 min, followed by carrying
out GloMax®-Multi Detection System (Promega Corporation)
to measure the luciferase signal.
To perform lactate and glucose detection assays,
four types of RKO cells including wild type, DAP3 knockdown, DELE1
knockdown and dual knockdown of DAP3 and DELE1 were seeded on a
96-well-plate at the density of 3×10⁴ cells per well
(three wells for each type) and incubated at 37°C overnight.
Following transfer of 2 µl of cell culture supernatant to
the spare wells of the plate, the medium was diluted with 98
µl of PBS. Then 50 µl of the prepared samples were
mixed thoroughly with the lactate detection reagent (Promega
Corporation) at the ratio of 1:1, and the plate was further
incubated at the room temperature for 60 min.
GloMax®-Multi Detection System (Promega Corporation) was
applied to determine the lactate in the samples quantified by
luminescence recording. Another 2 µl of supernatant from the
wells was transferred to the spare wells and diluted with 98
µl of PBS in the same method listed, then the diluted medium
was further diluted 2-fold with PBS. After that, 50 µl of
the diluted samples were transferred to a new 96-well-plate and
mixed with 50 µl of the glucose detection reagent (Promega
Corporation). After incubation at room temperature for 1 h, the
glucose levels in these samples were determined using
GloMax®-Multi Detection System (Promega Corporation)
quantified by the luminescence.
Statistical methods
All statistical analyses were conducted using SPSS
(version 27.0; IBM Corp.). Survival analysis was performed by
Kaplan-Meier with log ranked method and Cox Regression. Correlation
was determined by Spearman's correlation methods. Pairwise sample
comparisons were obtained by unpaired Student's t-test and
Mann-Whitney U test for normally and non-normally distributed data
sets as appropriate. Comparison of multiple groups were conducted
by ANOVA test followed by Bonferroni correction. P<0.05 was
considered to indicate a statistically significant difference.
Results
Distribution of DAP3 and DELE1 protein in
colorectal tissues and CRC. DAP3 staining in normal and tumour
tissues
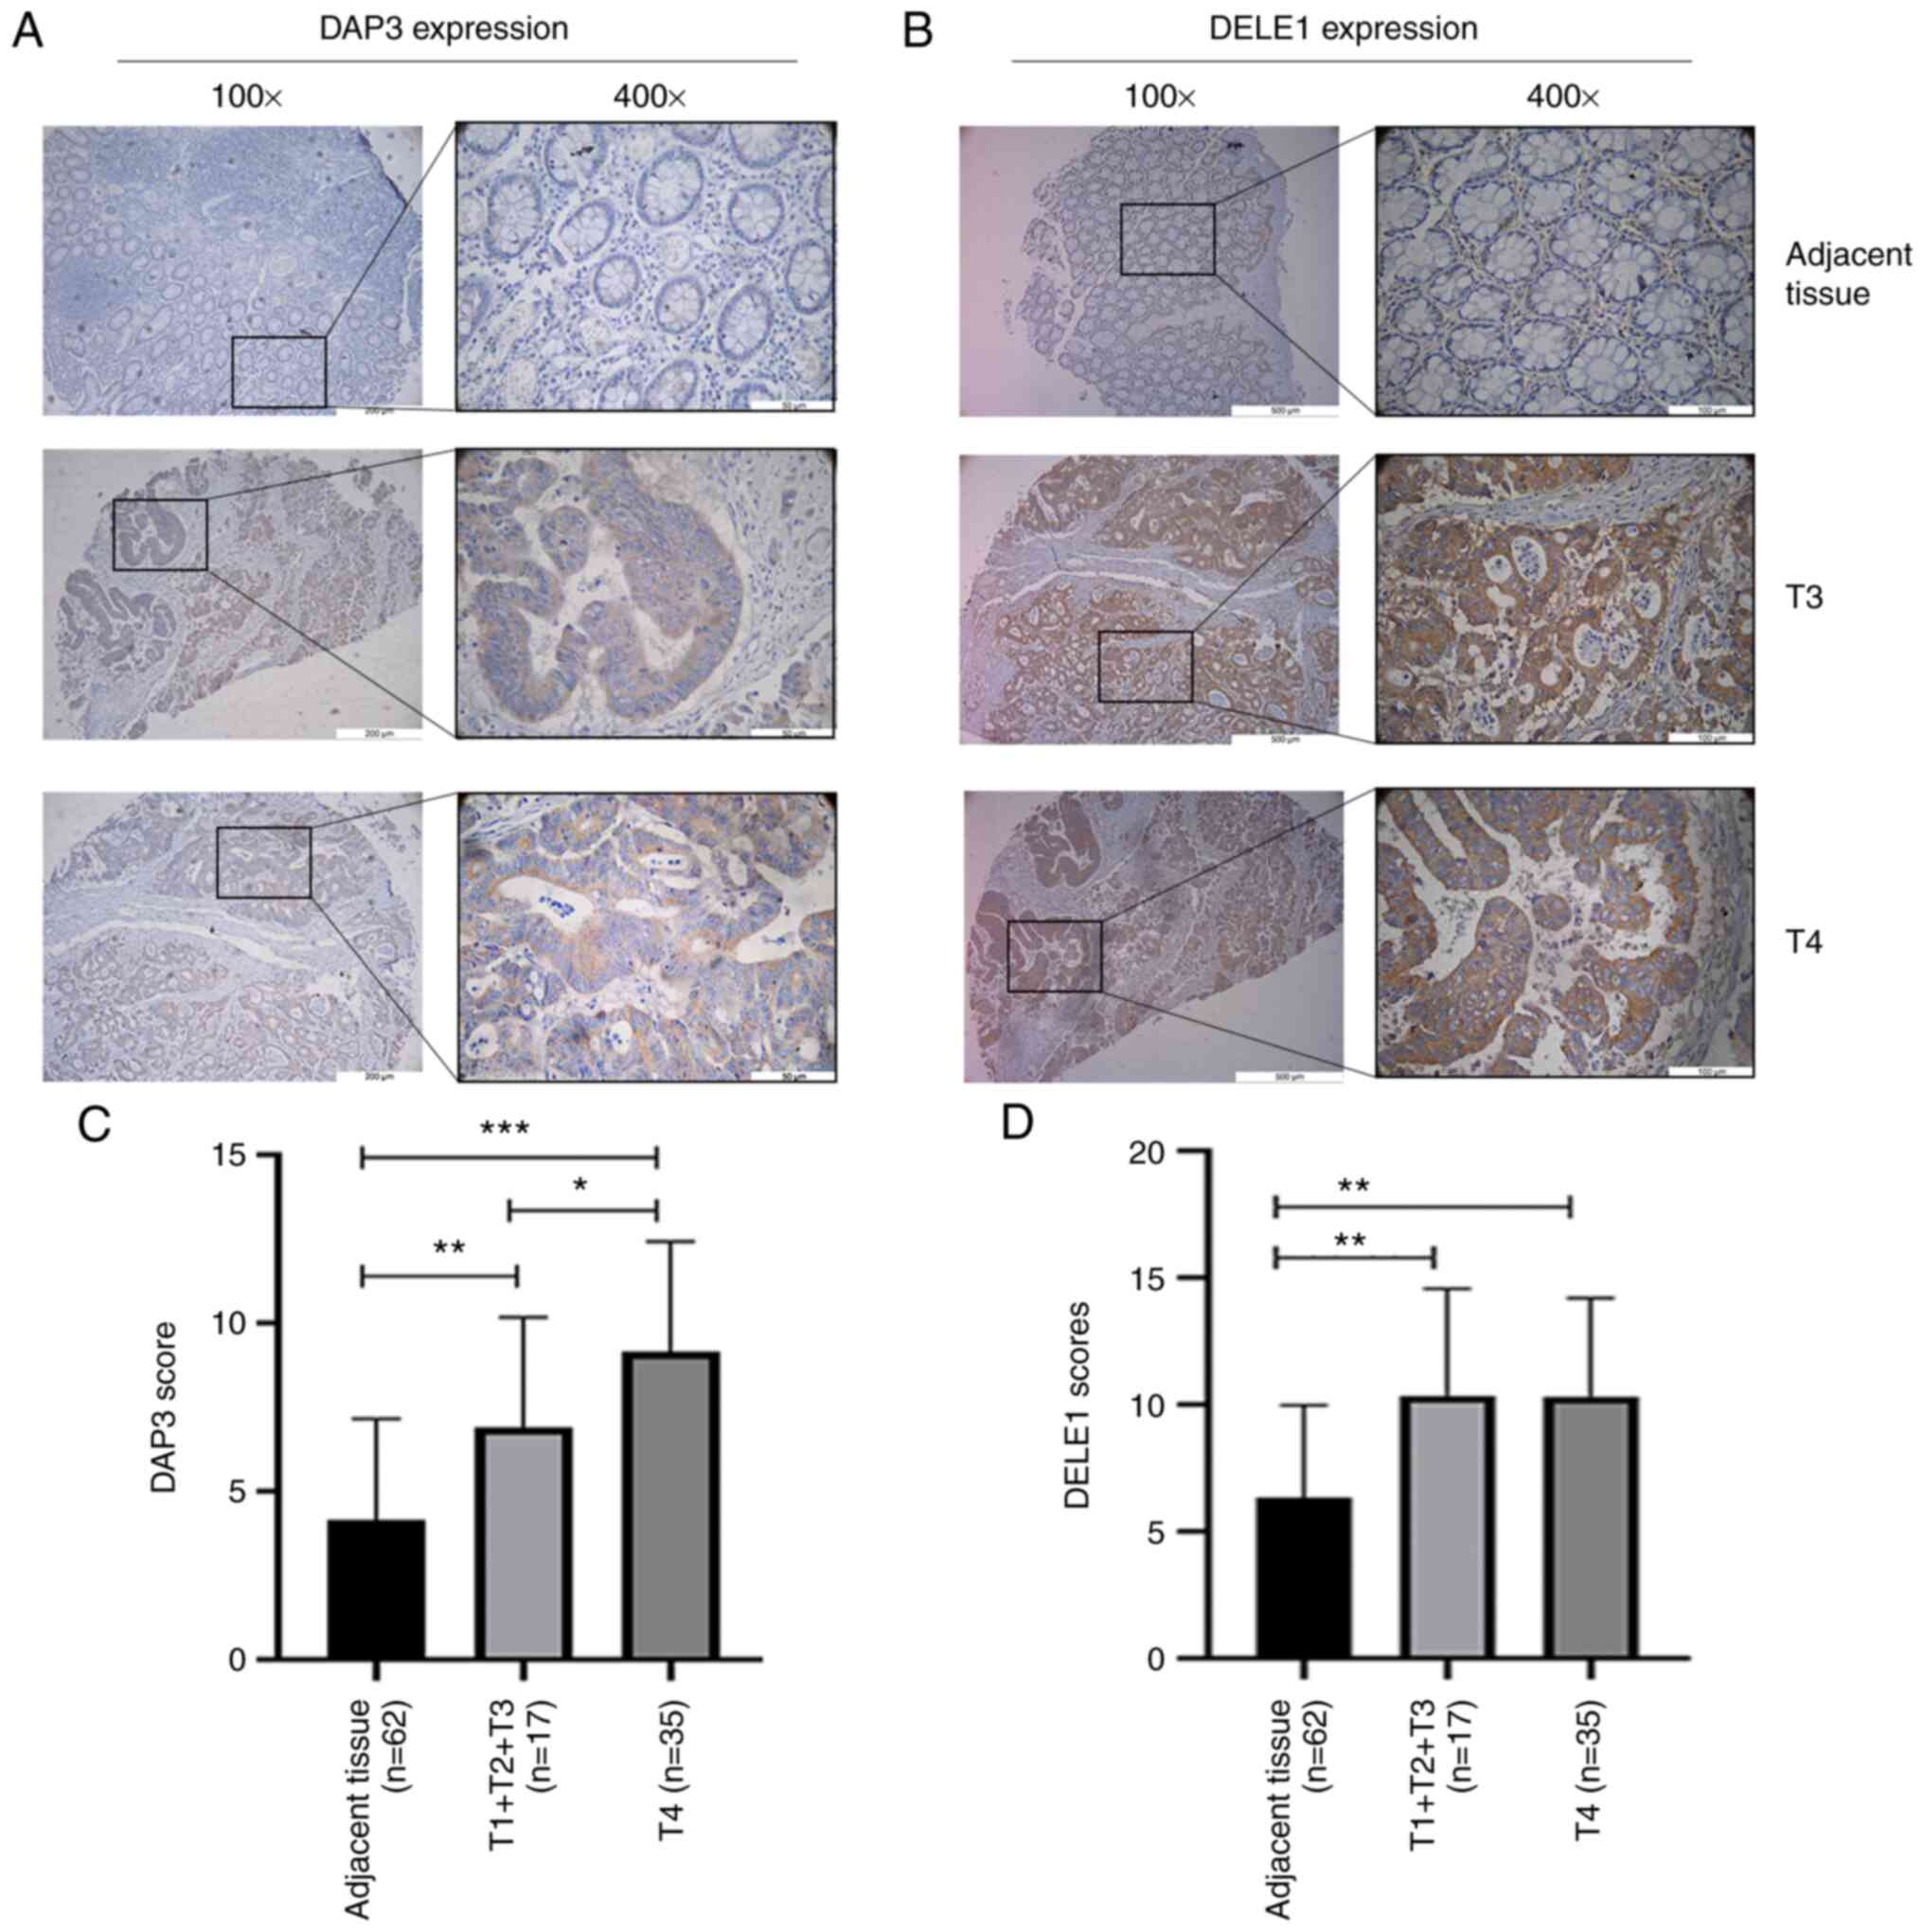
DAP3 was detected largely in the cytoplasm of cells,
particularly in CRC cells. Compared with normal epithelial cells of
the colon, CRC cells had marked staining in their cytoplasm.
Neither normal or malignant cells showed significant staining in
the nucleus (Fig. 1A and C).
Additionally, neither the stromal cells nor infiltrating
lymphocytes had a significant level of DAP3 staining.
DELE1 staining in normal and tumour
tissues
Staining of DELE1 protein appeared to be more
diverse than that of DAP3 (Fig. 1B and
D). In normal colon tissues, the DELE1 staining appeared to be
primarily in the cytoplasmic region of mucosal cells. Notably,
basal/stem cells also showed strong DELE1-positivity in their
cytoplasmic regions. There was, occasionally, the staining in the
stromal region. In submucosal tissues, there were clear indications
that endothelial cells (both vascular and lymphatic vessels) had
DELE1-positive staining. Tumour tissues stained more prominently
than normal tissues, again mainly in the cytoplasmic region of
cancer cells. Moreover, there were membrane visible staining on
cancer cells.
Expression and distribution pattern of
DAP3 and DELE1 gene transcripts in CRC
Comprehensive analysis of DAP3 and DELE1 gene
transcripts was then carried out, and it was found that tumour
tissues had markedly higher levels of DAP3 and DELE1 than normal
tissues (P=0.007 and P=0.006, respectively) (Table II). It was also examined if the
ratio of expression levels of DAP3 and DELE1 may be of interest but
no significant difference between tumour and normal tissues was
identified (Table II). DAP3 and
DELE1 were respectively examined in the subgroups of different
clinical and pathological groups including tumour staging (TNM
staging and Dukes staging), differentiation, nodal status and
invasiveness of tumour. The differentiation status of tumours did
not show a consistent pattern for DAP3 (P=0.81) and DELE1
(P=0.124). Although tumours with positive node showed higher levels
of DAP3 and DELE1, compared with node negative tumours, the
differences were not significant (P=0.25 for DAP3 and P=0.32 for
DELE1). There appeared to be a step wise increase of DAP3 from TNM1
to TNM4 tumours, from T1 to T3 stage tumours and from Dukes-A to
Dukes-C tumours, though the differences were not significant
(P=0.257 for TNM staging, P=0.443 for T staging and P=0.222 for
Dukes staging). A similar observation was revealed with DELE1
expression in these groups (Table
II). The expression levels of DAP3 and DELE1 in patients with
different clinical outcome were also compared. As shown in Table II, tumours from patients who
developed colon cancer-related incidence, died of colon cancer and
developed distant metastasis tend to have higher levels of DAP3
than their counterpart group, yet the differences were not
significant (P=0.31, 0.32 and 0.31 respectively). The same trend
was observed with DELE1. The lack of statistical significance is
largely owing to relatively smaller numbers in each group and the
type of comparison, which further led to subsequent survival
analyses by taking into consideration the survival time.
| Table IITranscript levels of DAP3 and DELE1
in colorectal cancers. |
Table II
Transcript levels of DAP3 and DELE1
in colorectal cancers.
| Factor | n=174 | DAP3/GAPDH
| DELE1/GAPDH
| DAP3/DELE1 ratio
| DELE1/DAP3 ratio
|
|---|
| Mean ± SD | P-valuea | Mean ± SD | P-value | Mean ± SD | P-value | Mean ± SD | P-value |
|---|
| Tissue type | | | | | | | | | |
| Normal | 80 | 852±282 | 0.0073 | 816±223 | 0.0007 | 671638±383780 | | 33.6±15.6 | |
| Tumour | 94 | 60.4±55.5 | | 23±18.9 | |
1743780±1379284 | 0.46 | 219388±219121 | 0.32 |
| Paired normal | 68 | 614±217 | 0.0065 | 737±230 | 0.0022 | 800594±456831 | | 36.1±18.3 | |
| Paired tumour | 68 | 2.46±1.61 | | 2.41±1.82 | |
2285996±1937511 | 0.46 | 368±345 | 0.34 |
|
Differentiation | | | | | | | | | |
| High | 2 | 0.0862±0.0495 | 0.81b | 0.0317±0.0317 | 0.124b | 3463±3461 | 0.723b | 0.234±0.234 | 0.151b |
| Moderate | 54 | 2.17±1.76 | 0.24 vs. High | 1.289±0.793 | 0.12 vs. High | 482620±328897 | 0.15 vs. High | 30.5±24.2 | 0.22 vs. High |
| Poor | 14 | 0.1237±0.0464 | 0.62 vs. High | 133±133 | 0.34 vs. High | 223±152 | 0.52 vs. High |
1424310±1424301 | 0.34 vs. High |
| Node
involvement | | | | | | | | | |
| Negative | 39 | 0.1145±0.0378 | 0.25 | 0.809±0.689 | | 15307±11904 | | 42.4±32.4 | |
| Positive | 31 | 3.72±3.09 | | 58.9±57.5 | 0.32 | 869584±601742 | 0.17 | 687596±687594 | 0.33 |
| TNM staging | | | | | | | 0.257b | 12.7±10.5 | 0.617b |
| TNM1 | 9 | 0.0673±0.0305 | 0.257b | 2.93±2.91 | 0.66b | 6097±5283 | | | |
| TNM2 | 30 | 0.1292±0.0486 | 0.29 vs. TNM1 | 0.1517±0.0599 | 0.37 vs. TNM1 | 18268±15674 | 0.47 vs TNM1 | 51.6±42.3 | 0.38 vs TNM1 |
| TNM3 | 26 | 4.24±3.73 | 0.27 vs. TNM1 | 69.3±69. | 0.35 vs. TNM1 | 1076586±741109 | 0.16 vs. TNM1 | 830844±830842 | 0.33 vs. TNM1 |
| TNM4 | 6 | 10.37±9.19 | 0.31 vs. TNM1 | 24.9±19 | 0.31 vs. TNM1 | 146±145 | 0.29 vs. TNM1 | 4.16±2.5 | 0.45 vs. TNM1 |
| T-stage | | | | | | | | | |
| T1 | 2 |
0.01887±0.00883 | 0.443b | 0.025±0.0232 | 0.411b | 3.1±2.52 | 0.544b | 0.958±0.78 | 0.408b |
| T2 | 10 | 0.0584±0.0285 | 0.22 vs. T1 | 2.63±2.62. | 0.35 vs. T1 | 6103±5282 | 0.28 vs. T1 | 11.29±9.49. | 0.31 vs. T1 |
| T3 | 40 | 0.493±0.254 | 0.07 vs. T1 | 1.111±0.857 | 0.21 vs. T1 | 613039±425466 | 0.16 vs. T1 | 39.5±32.4 | 0.24 vs. T1 |
| T4 | 18 | 5.47±5.27 | 0.32 vs. T1 | 102±102 | 0.33 vs. T1 | 29212±29134 | 0.33 vs. T1 |
1172957±1172954 | 0.33 vs. T1 |
| Dukes staging | | | | | | | | | |
| A | 7 | 0.0808±0.0382 | 0.222b | 3.76±3.75 | 0.49b | 7836±6751 | 0.69b | 16±13.4 | 0.529b |
| B | 33 | 0.1252±0.0444 | 0.46 vs.
Dukes-A | 0.139±0.0547 | 0.37 vs.
Dukes-A |
3813543±3796518 | 0.32 vs.
Dukes-A | 46.9±38.4 | 0.45 vs.
Dukes-A |
| C | 32 | 5.47±3.46 | 0.13 vs.
Dukes-A | 60.7±55.6 | 0.32 vs.
Dukes-A | 837377±579922 | 0.16 vs.
Dukes-A | 664676±664674 | 0.33 vs.
Dukes-A |
| Anatomical
locations | | | | | | | | | |
| Left colon | 22 | 0.517±0.364 | | 83.5±82.1 | | 381033±352801 | | 907399±906325 | |
| Right colon | 28 | 3.32±3.2 | | 0.0642±0.0445 | | 868459±601806 | | 46.9±43.9 | |
| Transverse
colon | 2 | 0.566±0.566 | | 0.054±0.054 | | 5.25±5.22 | | 19.5±19.4 | |
| Degree of
invasion | | | | | | | | | |
| Rectum | 22 | 0.418±0.294 | | 1.98±1.58 | |
6629901±6534644 | | 7.23±5.36 | |
| Non-invasive
tumours | 50 | 2±1.87 | | 35.8±35.2 | |
3054729±2621118 | | 415920±415411 | |
| Invasive
tumours | 26 | 0.717±0.379 | 0.50 | 1.6±1.33 | 0.34 | 520278±501286 | 0.43 | 3.77±1.88 | |
| DFS | | | | | | | | | |
| Disease free | 35 | 0.088±0.0222 | | 0.0661±0.0372 | |
3569682±3566832 | | 680±640 | |
| With cancer
related incidences | 23 | 4.71±4.47 | 0.31 | 79.9±78.4 | 0.32 | 696353±667844 | 0.39 | 997017±997011 | 0.33 |
| Patients remaining
well | 36 | 0.0961±0.0228 | | 0.0642±0.0361 | |
3888757±3571007 | | 680±640 | |
| Death | | | | | | | | | |
| Patients died of
colorectal cancer | 22 | 4.7±4.48 | 0.32 | 83.7±82.1 | 0.32 | 694060±667980 | 0.26 | 997017±997011 | 0.33 |
| Metastatic
diseases | | | | | | | | | |
| No metastatic
diseases | 50 | 0.277±0.161 | | 0.61±0.535 | |
2862940±2457943 | | 480±448 | |
| With distant
metastasis | 19 | 6.15±5.58 | 0.31 | 98.1±95.8 | 0.32 | 34347±31121 | 0.3 |
1246265±1246264 | 0.33 |
| Local
recurrence | | | | | | | | | |
| With no local
recurrence | 58 | 1.86±1.6 | | 31.5±30.8 | |
2440911±2264820 | | 356504±356068 | |
| With local
recurrence | 7 | 0.363±0.17 | 0.36 | 0.0157±0.0154 | 0.31 | 81060±71508 | 0.07 | 0.017±0.0157 | 0.32 |
DAP3 and DELE1 are prognostic indicators
for the OS and DFS and a good indicator for recurrence of CRC
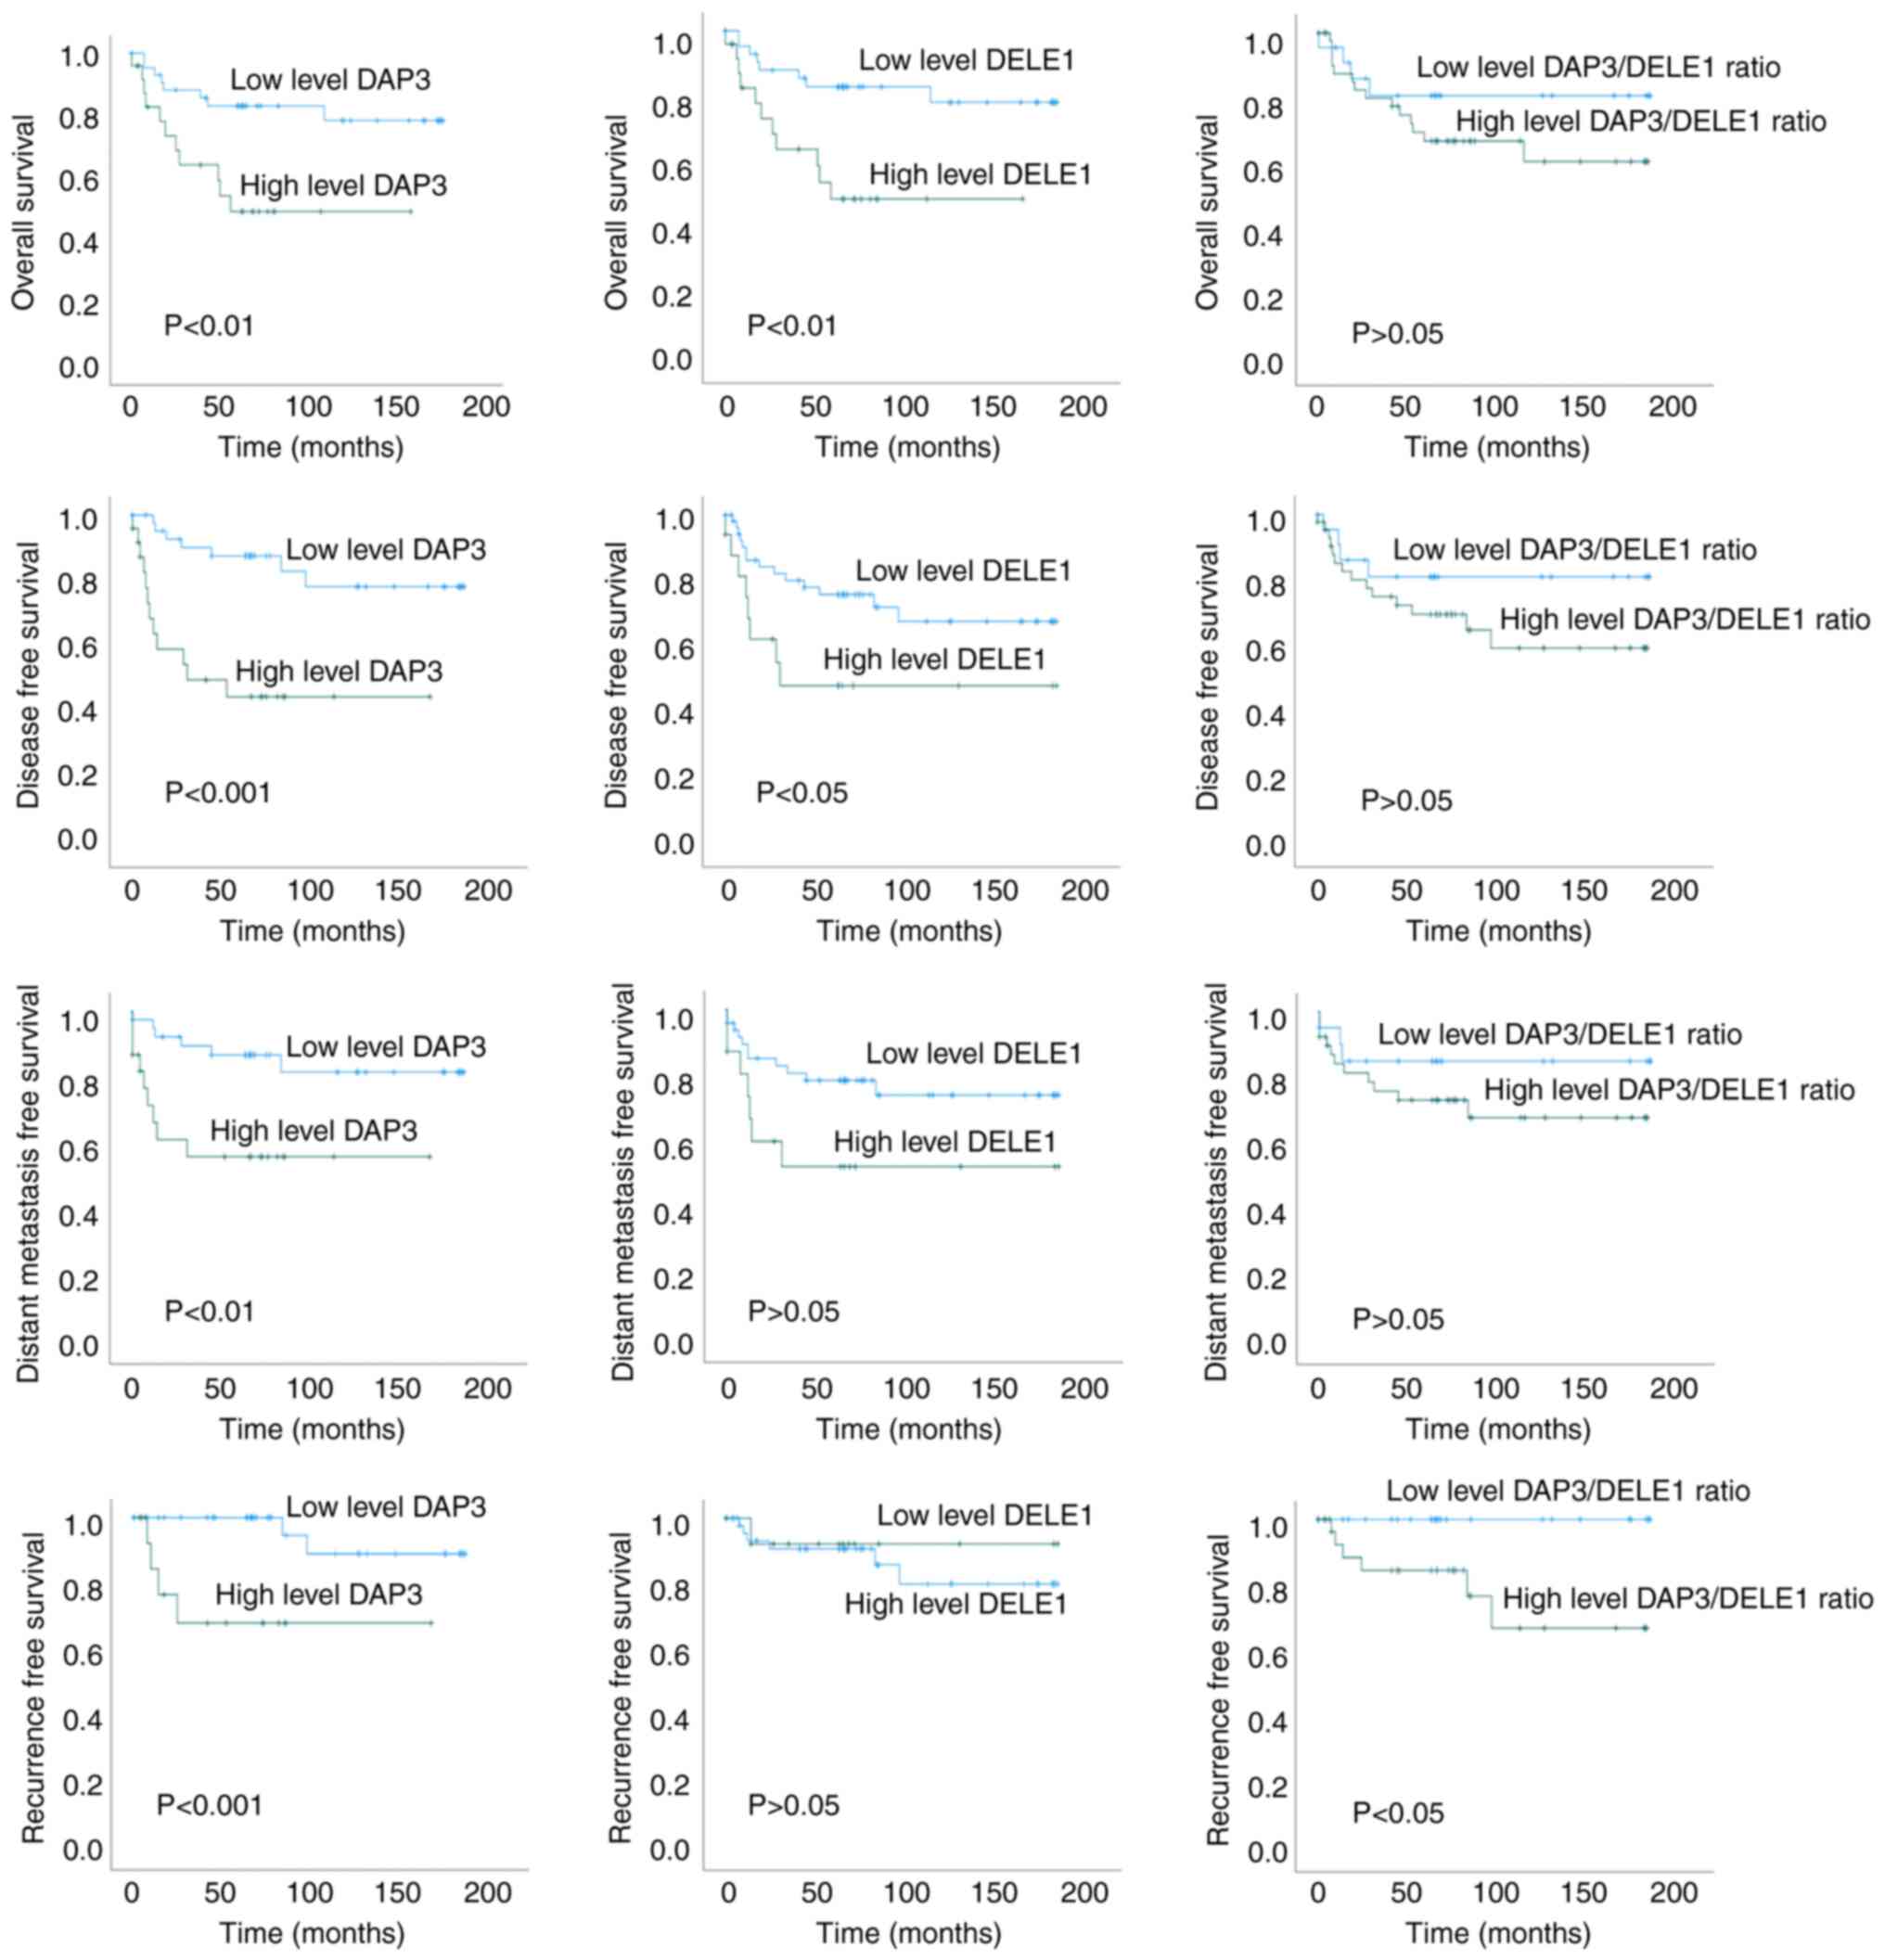
DAP3 and DELE1 are strongly linked to the OS, DFS,
distant metastasis free survival (DMFS) and recurrence of the
patients (Fig. 2). Levels of DAP3
and DELE1 had significant association with the DFS of the patients
(P<0.001 and P=0.043, respectively, for DAP3 and DELE1) and the
OS (P=0.006 and P=0.068, respectively, for DAP3 and DELE1) of the
patients. Levels of both DAP3 and DELE1 were revealed to
significantly differ between patients who developed recurrence from
those who did not. Kaplan Meier's models showed a significant
difference for both DAP3 and DELE1 in the time to recurrence.
Neither DAP3 nor DELE1 had differing levels in
tumour with or without lymph node involvement. An interesting
feature of the expression pattern of both DAP3 and DELE1 was a
significant correlation of expression levels of both molecules in
normal colorectal tissues (r=0.732, P<0.0001) but not in tumour
tissues (P<0.05). Collectively, DAP3 (P=0.002) and DELE1
(P=0.01), together with T staging (P=0.024) are independent
prognostic indicators for the OS of the patients. DAP3 (P=0.001),
together with TNM staging (P=0.003), Dukes staging (P=0.026) and
Nodal status (P=0.024) are also independent prognostic factors for
the DFS of the patients. The significance and the hazard ratio of
this relationship is summarized in Table III.
| Table IIIThe value of DAP3, DELE1, and
clinical factors in predicting the overall, disease free,
metastasis free, and recurrence free survivals of the patients. |
Table III
The value of DAP3, DELE1, and
clinical factors in predicting the overall, disease free,
metastasis free, and recurrence free survivals of the patients.
| Factors | Hazard ratio | P-valuea |
|---|
| Overall
survival | DAP3 | 3.427 | 0.01 |
| DELE1 | 2.227 | 0.076 |
| DAP3/DELE1
ratio | 1.901 | 0.258 |
| Dukes stage | 1.852 | 0.049 |
| TNM stage | 1.243 | 0.043 |
| T staging | 2.940 | 0.003 |
| Lymph node
involvement | 1.625 | 0.202 |
| Tumour
differentiation | 1.461 | 0.227 |
| Anatomical
location | 1.101 | 0.596 |
| DAP3 | 4.999 | <0.001 |
| Disease free
survival | DELE1 | 2.388 | 0.05 |
| DAP3/DELE1
ratio | 1.951 | 0.239 |
| Dukes Stage | 2.366 | 0.010 |
| TNM stage | 1.331 | 0.007 |
| T staging | 2.464 | 0.008 |
| Lymph node
involvement | 1.625 | 0.037 |
| Tumour
differentiation | 1.259 | 0.622 |
| Anatomical
location | 1.103 | 0.558 |
| DAP3 | 3.691 | 0.014 |
| Distant metastasis
free survival | DELE1 | 2.434 | 0.067 |
| DAP3/DELE1
ratio | 1.991 | 0.291 |
| Dukes Stage | 2.864 | 0.007 |
| TNM stage | 1.5 | 0.001 |
| T staging | 4.705 | 0.001 |
| Lymph node
involvement | 1.736 | 0.03 |
| Tumour
differentiation | 1.521 | 0.399 |
| Anatomical
location | 1.543 | 0.252 |
| DAP3 | 6.326 | 0.038 |
| Recurrence free
survival | DELE1 | 0.613 | 0.651 |
| DAP3/DELE1
ratio | 5.017 | 0.025 |
| Dukes Stage | 2.191 | 0.169 |
| TNM stage | 1.483 | 0.055 |
| T staging | 17.525 | 0.008 |
| Lymph node
involvement | 1.742 | 0.193 |
| Tumour
differentiation | 1.167 | 0.853 |
| Anatomical
location | 1.037 | 0.915 |
Association of DAP3 and DELE1 with drug
resistance under clinical settings
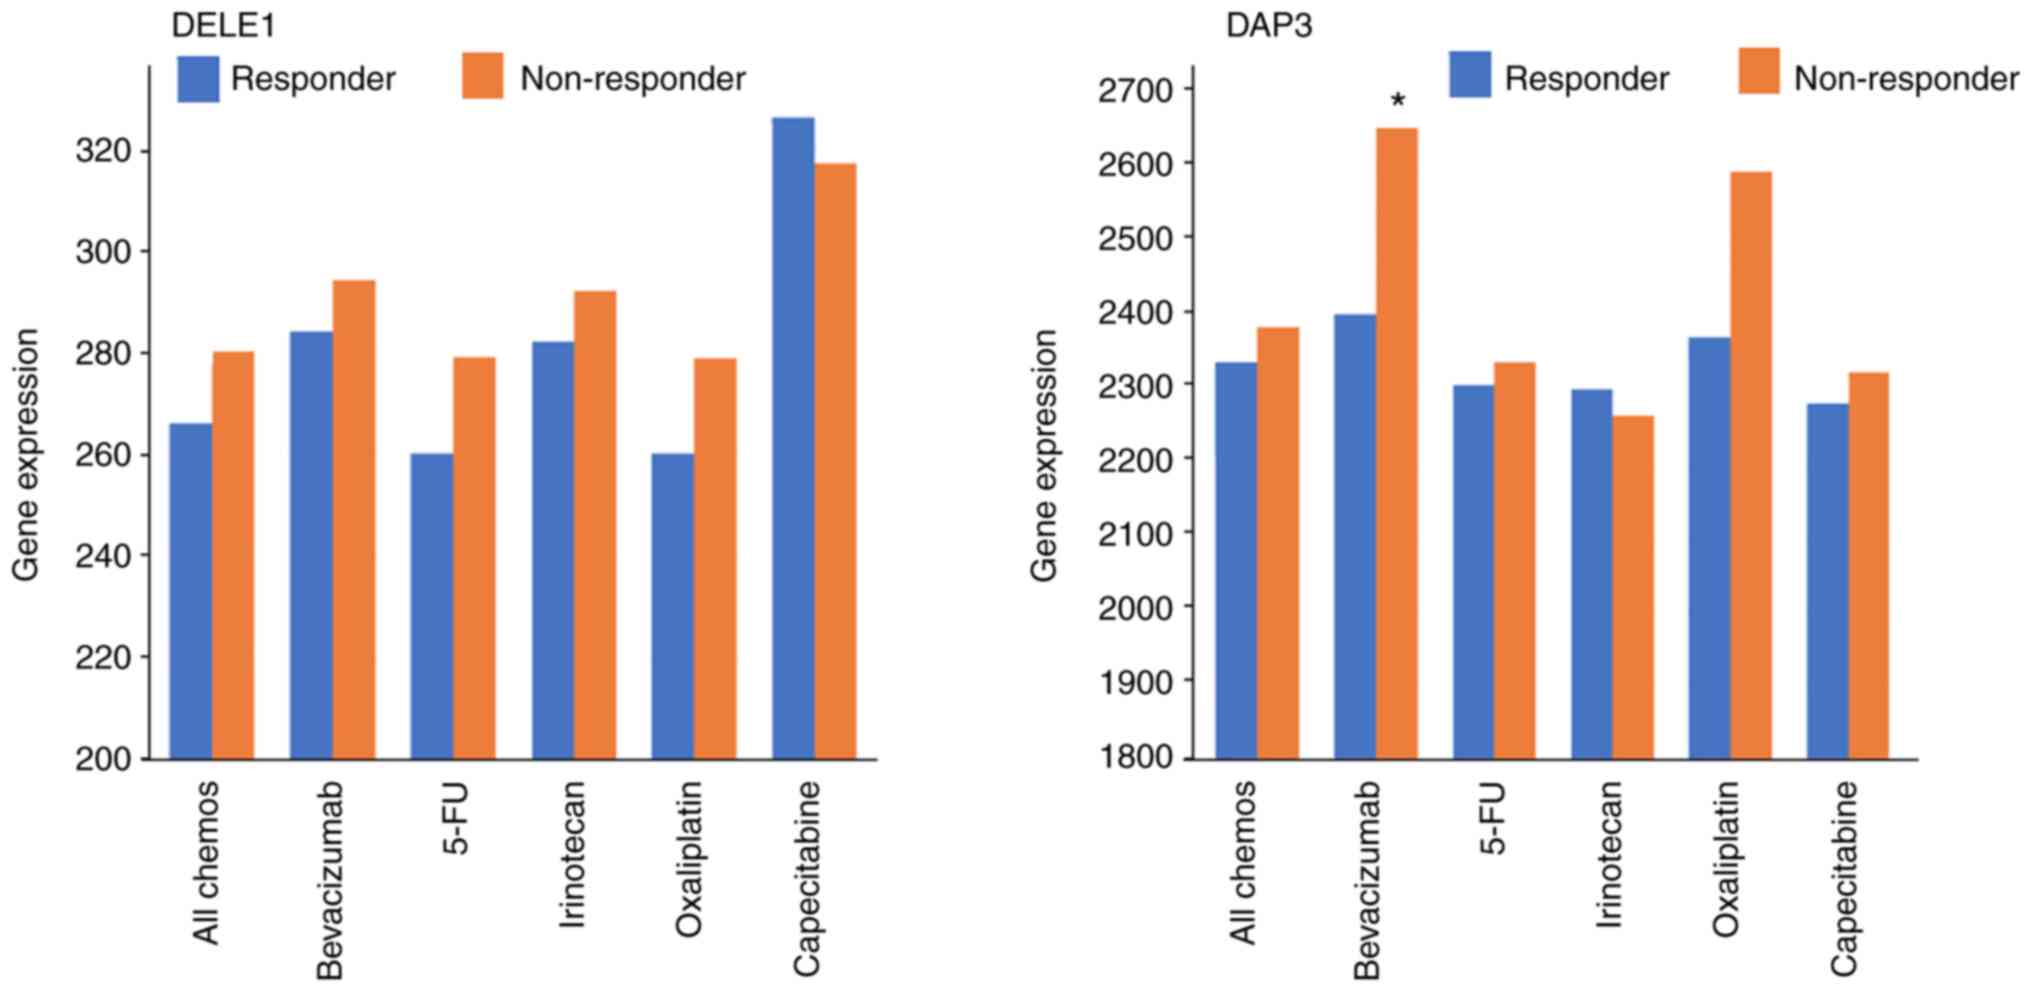
Based on the TCGA dataset, it was found that
patients who did not respond to chemotherapies had higher levels of
DELE1 than those who responded, although this is yet to reach
significance (P=0.11). The same but weaker trend was observed with
DAP3. It appeared that high levels of DELE1 are exhibited in those
who did not respond to 5-FU and Oxaliplatin and high levels of DAP3
in those who did not respond to Oxaliplatin (Fig. 3, Table III). There was no significant
difference amongst the other groups except for in Bevacizumab, in
which patients who had no response presented significantly higher
DAP3 transcript than those who responded (P=0.041; Table IV).
| Table IVResponse to the chemotherapeutic
drugs with differential DAP3 and DELE1 expression. |
Table IV
Response to the chemotherapeutic
drugs with differential DAP3 and DELE1 expression.
| Treatment | Responses | n | DELE1a | P-valueb | DAP3a | P-valueb |
|---|
| All
chemotherapies | Responder | 195 | 266 (42-517) | 0.11 | 2340
(1337-5060) | 0.74 |
| Non-responder | 220 | 280 (134-618) | | 2388
(1102-5805) | |
| Bevacizumab | Responder | 28 | 284 (169-494) | 0.48 | 2405
(1383-4073) | 0.041 |
| Non-responder | 28 | 294 (199-486) | | 2658
(1979-4002) | |
| 5-FU | Responder | 148 | 260 (42-517) | 0.36 | 2309
(1337-5060) | 0.97 |
| Non-responder | 155 | 279 (134-537) | | 2340
(1102-5306) | |
| Irinotecan | Responder | 60 | 282 (42-517) | 0.81 | 2303
(1350-4412) | 0.98 |
| Non-responder | 69 | 292 (162-537) | | 2268
(1102-5306) | |
| Oxaliplatin | Responder | 97 | 260 (138-409) | 0.14 | 2374
(1337-5060) | 0.43 |
| Non-responder | 77 | 279 (138-493) | | 2598
(1115-5805) | |
| Capecitabine | Responder | 16 | 326 (151-485) | 0.74 | 2284
(1486-3546) | 0.81 |
| Non-responder | 41 | 317 (164-618) | | 2326
(1103-4004) | |
Correlation between of DAP3 and
angiogenesis markers in CRC
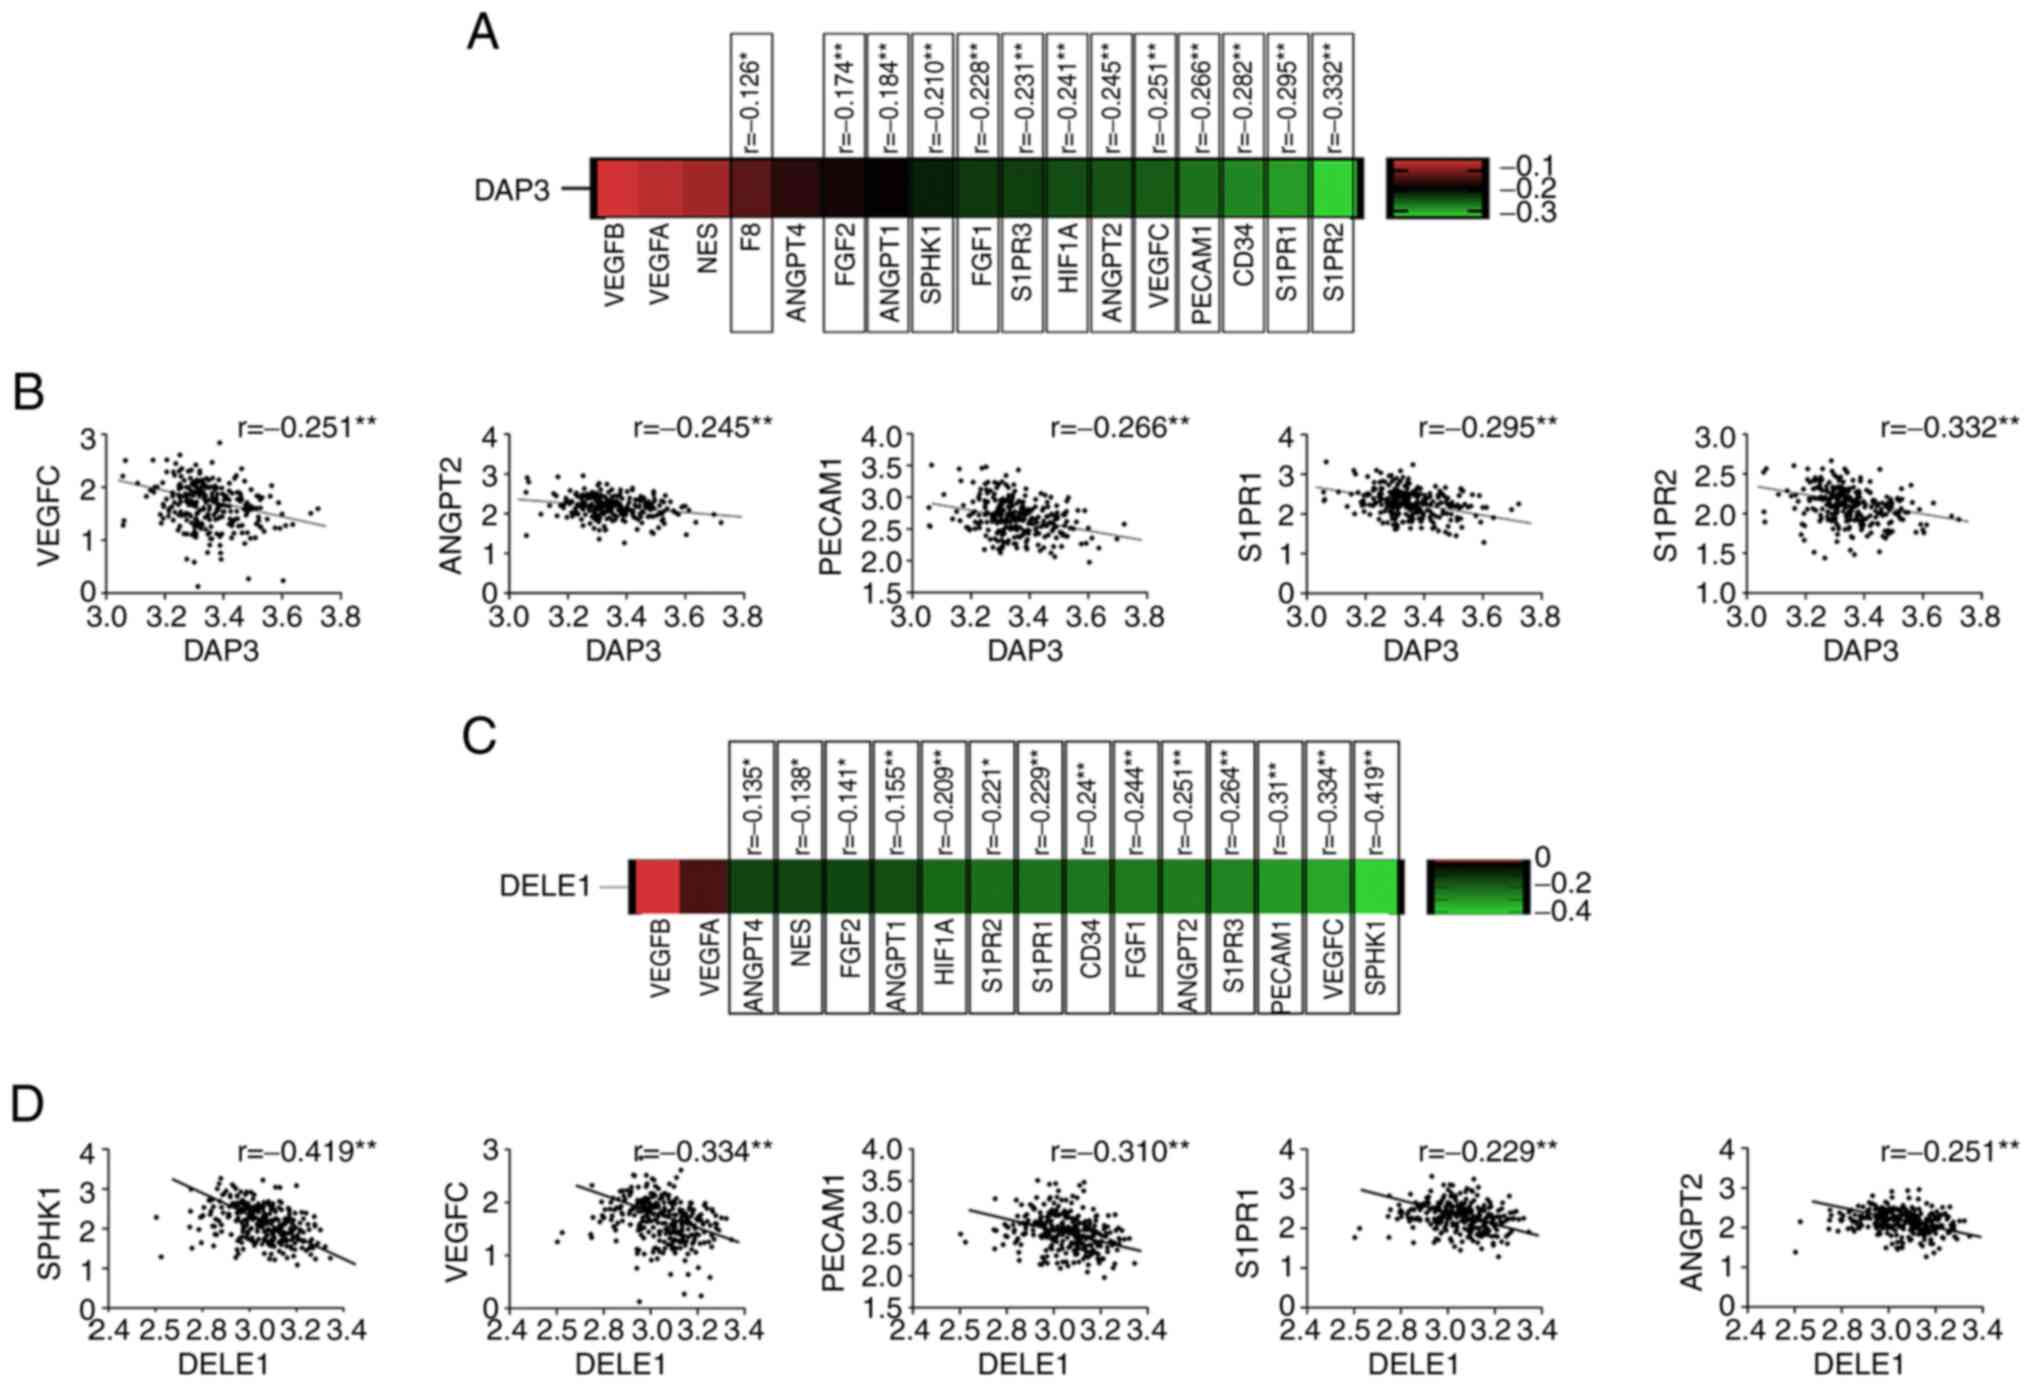
The finding that lower expression of DAP3 in the CRC
tumour presented an improved response to the Bevacizumab led to the
evaluation of its implication in the CRC by examining the TCGA-COAD
cohort. Inverse correlation was revealed between DAP3 and most of
the angiogenic markers/regulators, including Factor VIII (F8),
CD34, platelet and endothelial cell adhesion molecule 1 (PECAM1),
HIF1A, VEGFC, FGF1, FGF2, angiopoietin (ANGPT) 1, ANGPT2, SPHK1,
Sphingosine-1-Phosphate Receptor (S1PR) 1, S1PR2 and S1PR3
(Fig. 4). Correlation between DAP3
and certain angiogenic factors was also analysed in the cohort
using Spearman's correlation analysis. An inverse correlation was
identified between DAP3 and PECAM1 or VEGFR3, but not others
determined. By contrast, in this CRC cohort, DAP3 was positively
correlated with VEGFR1 and VEGFR2 (Table V).
| Table VCorrelation between DAP3 and
angiogenic factors in the Beijing CRC cohorta. |
Table V
Correlation between DAP3 and
angiogenic factors in the Beijing CRC cohorta.
| VEGF A | VEGF B | VEGF C | VEGF D | VEGF R1 | VEGF R2 | VEGF R3 | Podoplanin | PECAM1 |
|---|
| DAP3 | r=−0.122 | r=−0.116 | r=−0.08 | r=−0.065 | r=0.289 | r=0.329 | r=−0.272 | r=−0.04 | r=−0.292 |
| p=0.235 | p=0.157 | p=0.299 | p=0.442 | p<0.001 | p=0 | p=0.005 | p=0.641 | p<0.001 |
| n=97 | n=151 | n=170 | n =143 | n=161 | n=152 | n=106 | n=137 | n=143 |
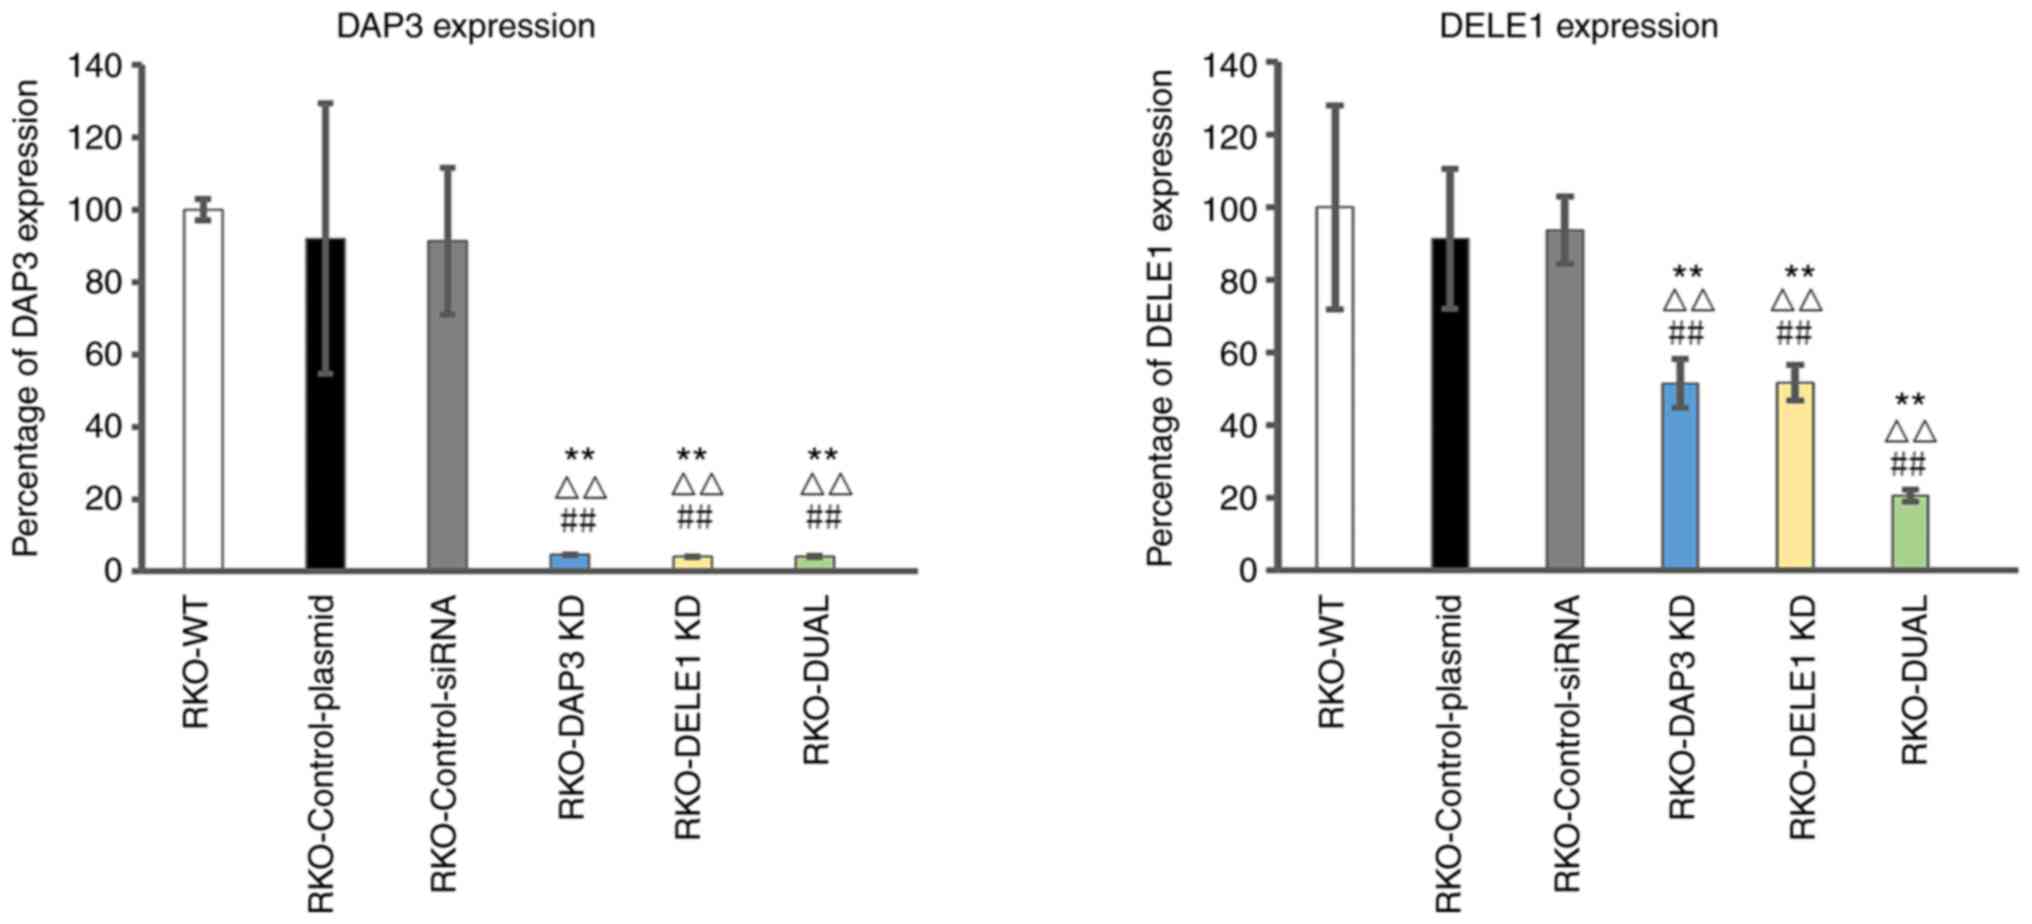
Association of DAP3 and DELE1 with drug
resistance under in vitro conditions
Using siRNA against DAP3 and DELE1, the expression
of DAP3 and DELE1 in CRC cells was respectively knocked down
(Fig. 5). Compared with the wild
type colon cells, the control plasmid and control siRNA only
resulted in minor and insignificant changes of the respective gene
transcript (P>0.05) (Fig. 5,
left panel for DAP3 and right panel for DELE1). The anti-DAP3
ribozyme transgene resulted in over 90% reduction of the DAP3
transcripts (P<0.001, vs. wild type cells and control
transfection) (Fig. 5, left
panel), whilst the anti-DELE1 siRNA resulted in over 50% reduction
of the DELE1 transcripts (P<0.001 vs. wild type cells and
control transfection). A double knockdown of DAP3 and DELE1 was
also created in the same cells. Notably, DAP3 and DELE1 transcripts
were even lower in double knockdown cells than the others (Fig. 5, left panel for DAP3 and right
panel for DELE1).
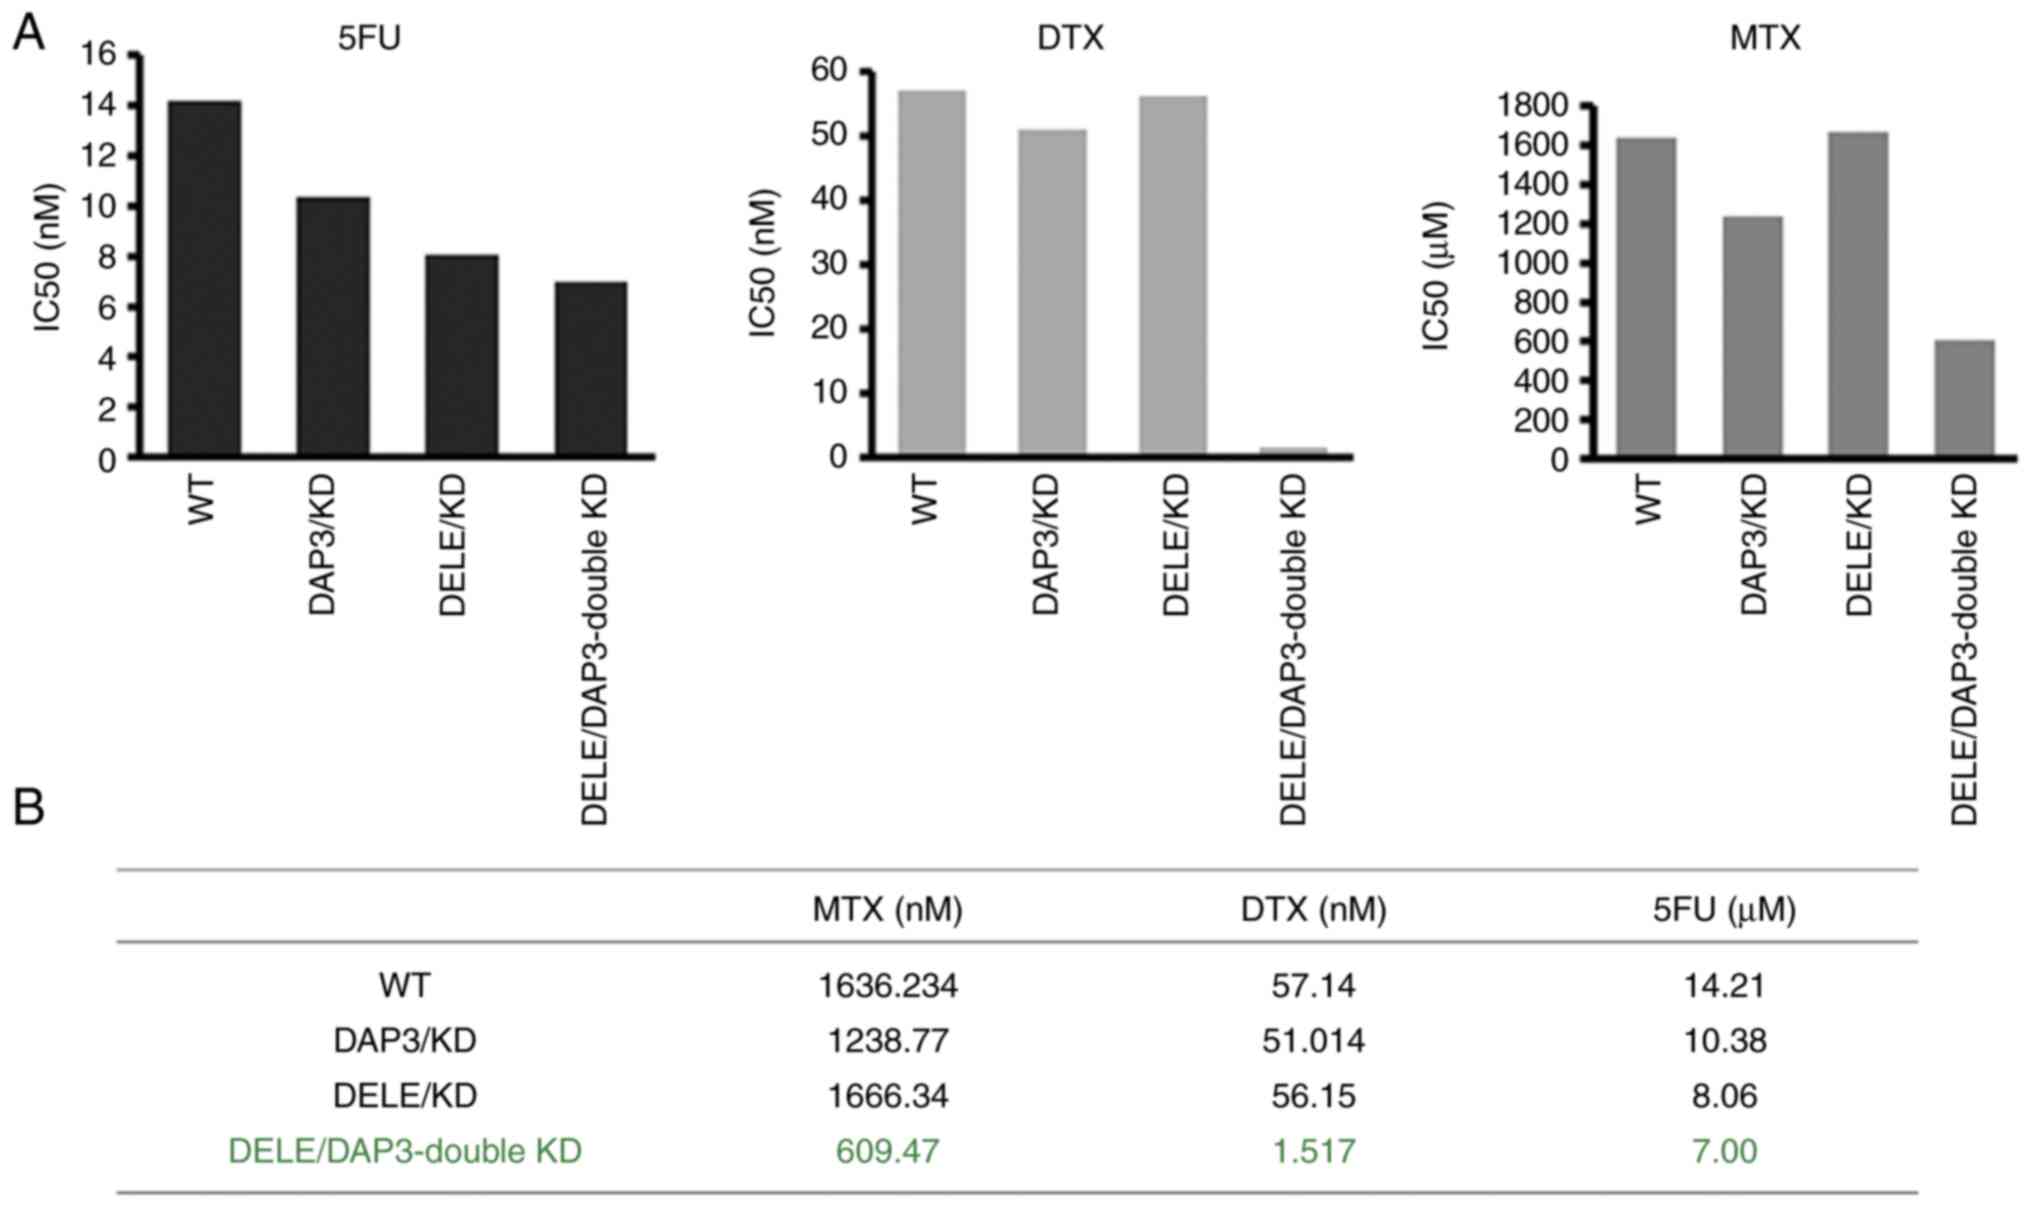
With the sub-models of CRC cells created, the
relationship of DAP3 and DELE1 expression levels and cancer
cellular responses to chemotherapy drugs were then determined. As
revealed in Fig. 6, knockdown of
DAP3 and knockdown of DELE1 sensitised the cells to 5-FU, MTX and
DTX. Notably, the DAP3/DELE1 double knockdown resulted in cells
markedly sensitive to all the drugs tested, compared with single
knockdowns and controls (Fig.
6).
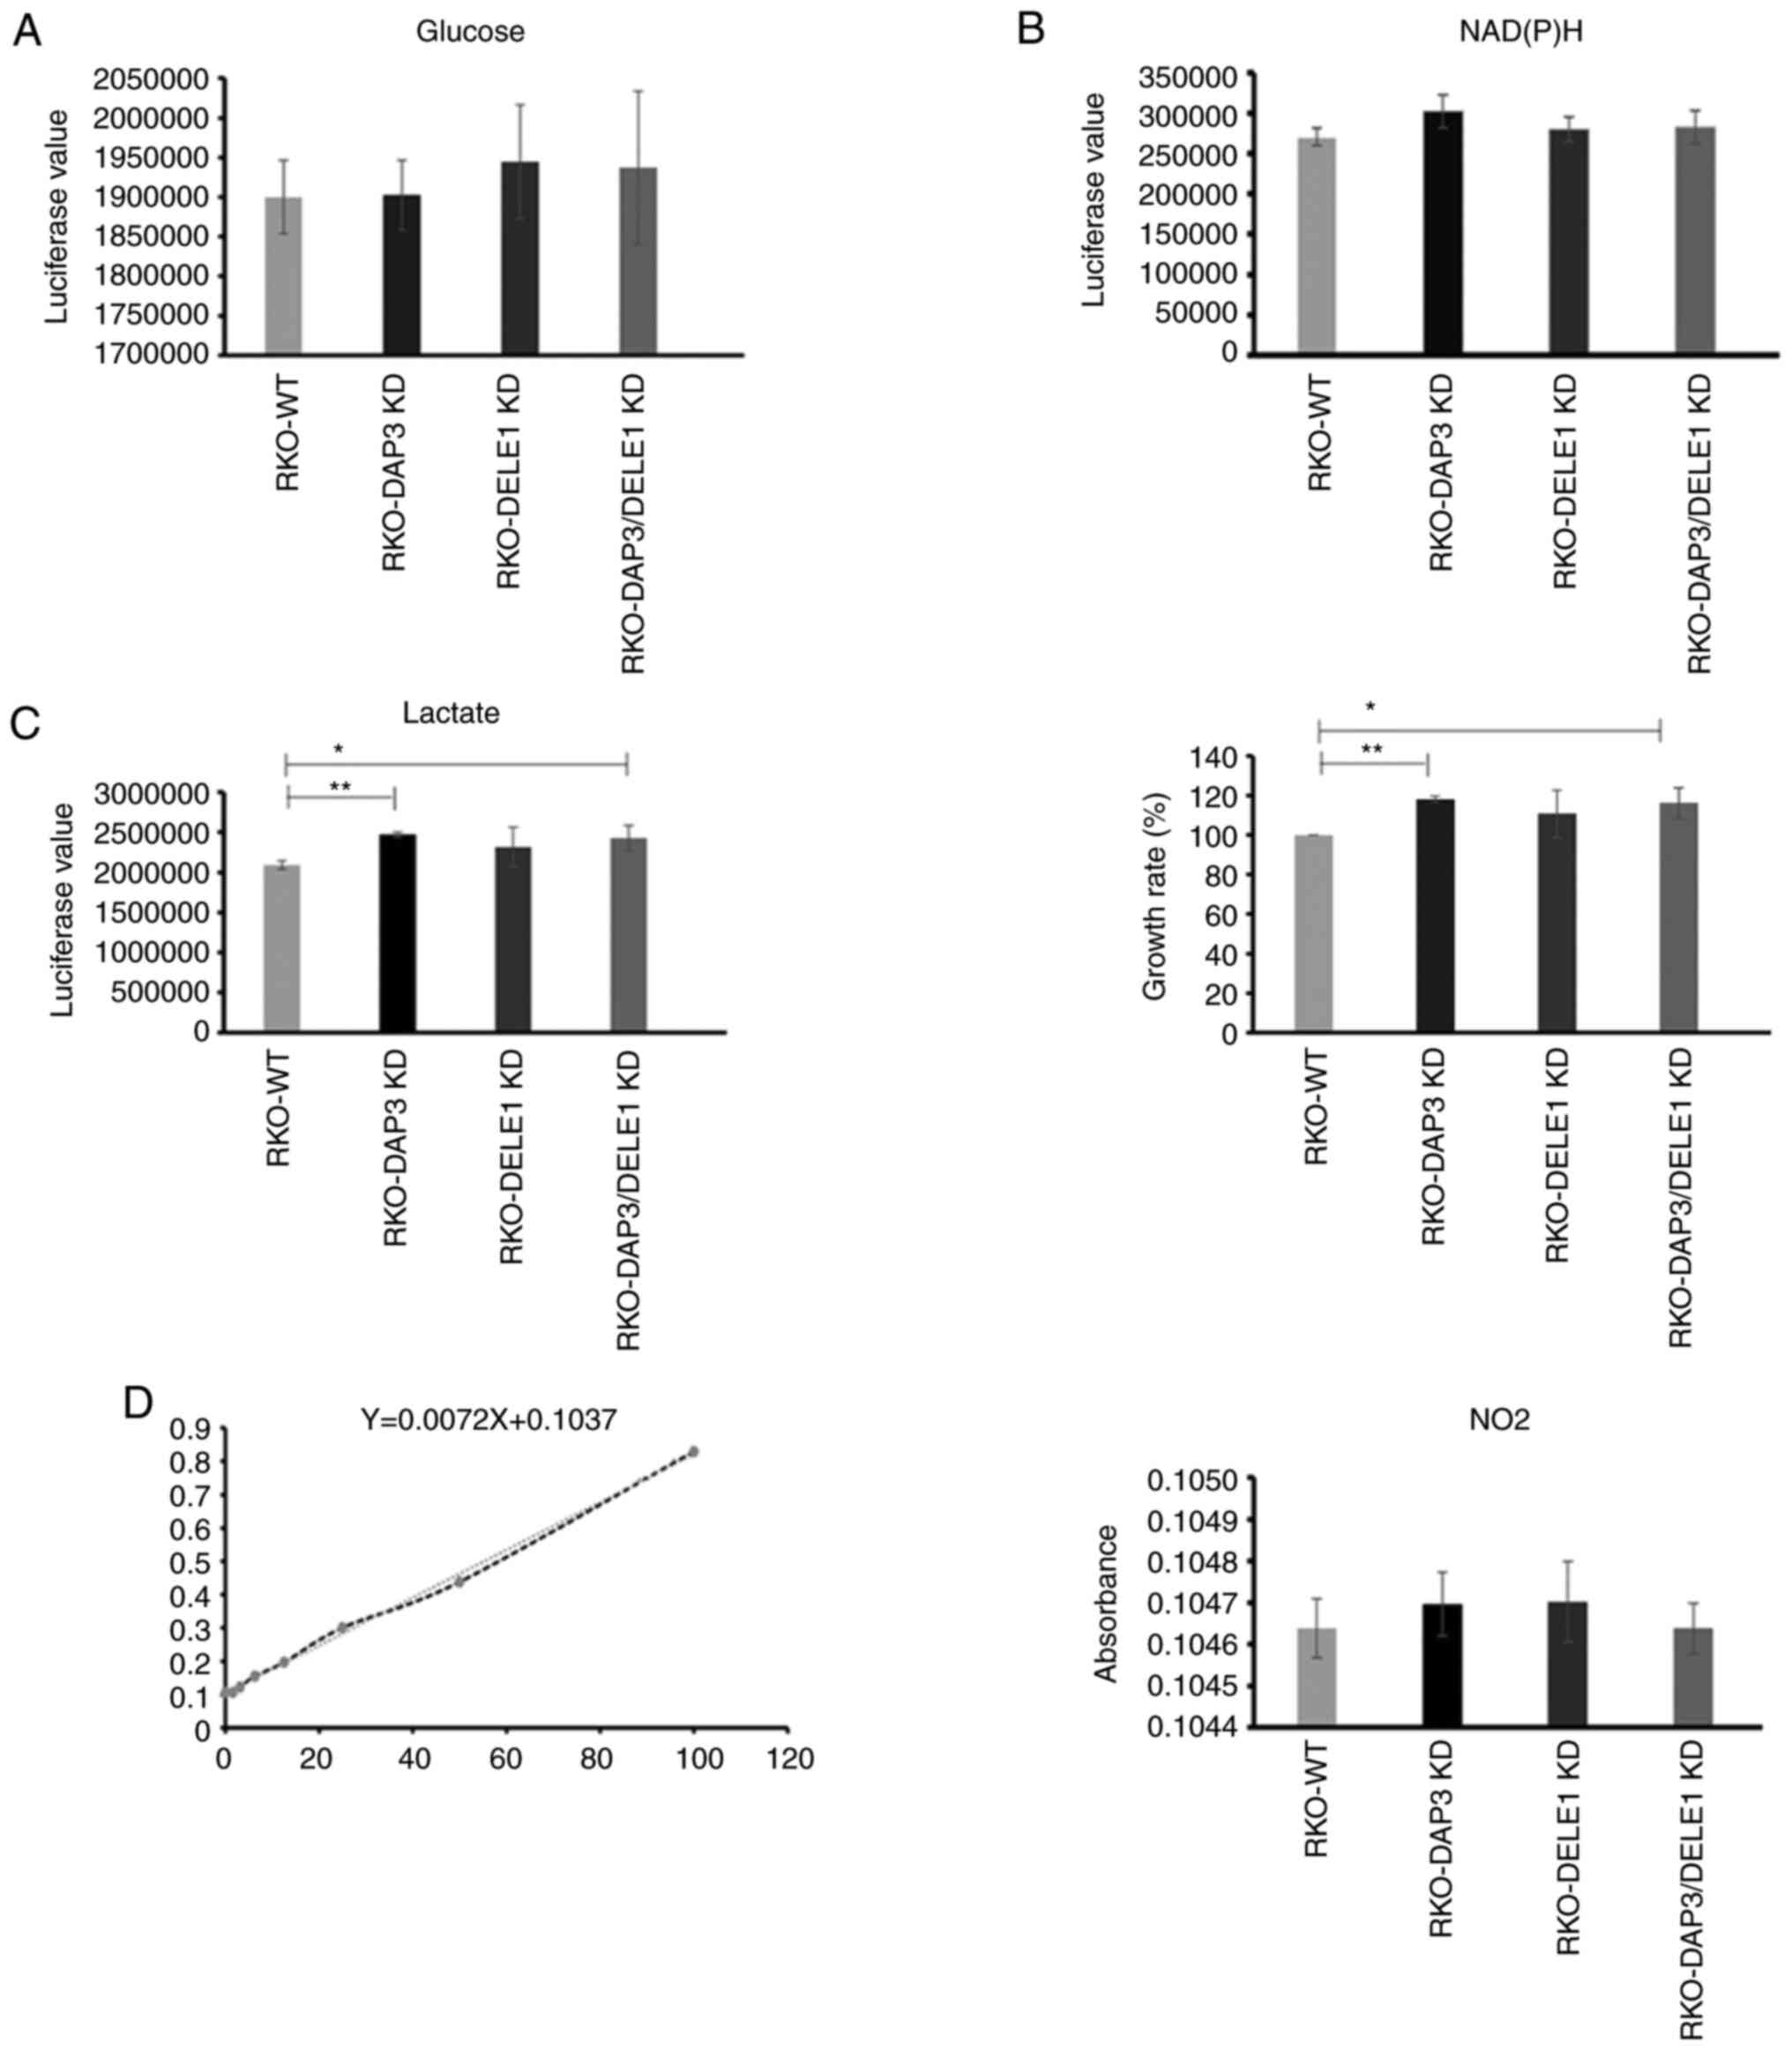
DAP3 and DELE1 knockdown do not cause a
significant change in mitochondrial metabolic rate
To evaluate if DAP3 knockdown, DELE1 knockdown and
in particular the combined knockdown of both DAP3 and DELE1 had any
impact on mitochondrial metabolism, the generated cells were
examined for their rates of metabolism including glucose
consumption, lactate production and reactive oxygen species (ROS).
Elevated lactate production together with the enhanced cell growth
rate were found in DAP3 knockdown and DAP3/DELE1 combined knockdown
cells, compared with control cells. However, neither of the other
pathways displayed a significant change after DAP3 knockdown, DELE1
knockdown or the DAP3/DELE1 double knockdown (Fig. 7).
Discussion
DAP3 is known as a critical molecule associated with
apoptosis of various cell types in response to interferon gamma.
Our previous analysis of its expression in a clinical cohort
revealed that DAP3 was highly expressed in pancreatic tumour
tissues and was significantly associated with shorter survival
(6). A databased analysis has also
shown that high levels of DAP3 in lung adenocarcinoma is linked to
poor survival of the patients (28). However, DAP3 silencing promoted
tumour progression including the enhanced adhesion, migration and
invasion in breast cancer cells (29). These recent studies have thus
indicated that the diverse and occasionally contrasting roles of
DAP3 in different cell types and different tumour types are of
significant interest including that observed in the current
research (6,9,12,13,29).
In the present study, expression of DAP3, on both protein (IHC) and
gene transcripts levels, increased in colon cancer tissue compared
with the normal adjacent tissue. DAP3 expression was correlated
with the tumour staging again on both protein and gene levels.
Higher DAP3 expression was associated with the poorer OS, DFS, DMFS
and recurrence-free survival (RFS), according to the analysis in
the clinical cohort. In order to determine the role of DAP3 in
colon cells, in vitro DAP3 knockdown cell models were
created using the ribozyme. Results from the cell toxicity test
showed that downregulated DAP3 expression increased the cell
sensitivity to the chemotherapeutic drugs. Additionally,
differential DAP3 expression was observed in patients with
different Bevacizumab responses in the current study. Since
Bevacizumab exerted its activity as the inhibitor of the
angiogenesis in the tumour, a panel of biomarkers were measured to
investigate the correlation of DAP3 with neovascular in the
TCGA-COAD dataset. From the current analysis, DAP3 expression was
inversely correlated with most of the angiogenesis biomarkers, such
as VEGFC, ANGPT2, PECAM1, S1PR1 and S1PR2, which indicated that
high DAP3 expression may be associated with low angiogenic
activities in the tumours and consequently affects response to the
anti-angiogenic therapy. To date, there is no evidence showing a
direct involvement of DAP3 in angiogenesis. Further exploration may
shed light on how exactly DAP3 is involved in the tumour-associated
angiogenesis in addition to its potential for predicting response
to anti-angiogenic treatment.
Full length DELE1 was cleaved into shorter fragments
(S-DELE1) in the cytosol to translate the mitochondria stress, and
the stress signal was activated through an HRI dependent pathway
which relayed the mitochondrial stress to ATF4. It has been shown
that DELE1, via the OMA1-DELE1-HRI HRI mitochondrial pathway may
mediate both detrimental and beneficial responses depending on the
mitochondria stress sources (21).
DELE1 was reported to act as an upstream molecule to activate
Caspase-3, -8, and -9 to induce cell apoptosis. DELE1 silence
suppressed caspase activation and enhanced viability (18). In the present study, markedly
increased DELE1 expression was observed in the colon cancer
tissues. Although no significant difference was shown between the
early and the advanced stage from the IHC result, higher DELE1 was
correlated with the significantly poor OS and DMFS, as demonstrated
by our colon cancer cohort analysis.
Both DAP3 and its Binding Cell Death Enhancer-1,
DELE1, were reported as the molecules inducing apoptosis, and the
role of DAP3 was exerted via binding with DELE1 (18). Previous analysis in the colon
cohort revealed that high level of DAP3/DELE1 ratio was associated
with the poor RFS. To further investigate the interaction between
DAP3 and DELE1, a dual knockdown cell model in RKO cells was
created. While validating DAP3 knockdown efficiency, it was found
that DELE1 expression was also downregulated simultaneously; in
addition, in DELE1 silencing cells, low DAP3 expression was also
observed, which indicated a positive regulation loop of these two
proteins may exist in colon cancer cells. The recent findings that
DAP3 acts as a variant splicing regulator of multiple genes
provides some support to this possibility (17).
The findings that knocking down DELE1 and DAP3
influences drug sensitivity are interesting. In vitro cell
toxicity tests demonstrated that DELE1 silencing in RKO cells
enhanced the sensitivity of the chemotherapeutic drugs (5-FU and
MTX). The resistance to the chemotherapeutic drugs was more
significantly reduced in the dual knockdown group, compared with
the other three groups. This is well supported by the clinical
observations based on the TCGA dataset. Drug resistance has
connections with mitochondrial metabolism as previously reported
(30). It has been found that
DELE1 protein contains a mitochondrial targeting sequence (18) and may act as a key player, together
with OMA1, in mitochondria stress signalling pathways and indeed
drug response in ovarian cancer cells (19-21,31).
It was therefore possible that DAP3 and DELE1 resulted drug
resistance may have the mitochondrial link (32,33).
For example, resistance to 5-FU has been indicated to increase
mitochondrial mass, downregulate ATP synthase, and higher rates of
oxygen consumption (34,35). Yet the exact links between
mitochondrial function and drug resistance are less clear and need
a great deal of investigation. ROS accumulation was considered to
be a key ready for resistance to imatinib (36). A previous study revealed that
resistance to paclitaxel is independent to glucose metabolism
(37). In the present study,
increased lactate production was found after the DAP3 silence
compared with the control cells. Since lactate was involved in
histone modification, namely, histone lysine lactylation, which is
linked to the cancer progression and drug resistance (38), our finding on increased cell
sensitivity to therapeutic drugs by DAP3 and DELE1 knock down
indicated that DAP3 and DELE1-associated drug resistance in CRC is
unlikely to be dependent on the glucose and ROS events and further
investigation into other mitochondrial pathway and mitochondrial
independent events is needed.
In conclusion, DAP3 and DELE1 are valuable
prognostic indicators in human CRC. Since DAP3 and DELE1 may play a
role in regulating mitochondrial stress (21), our findings suggested that
targeting DAP3 and DELE1, at least in human CRC, represents a novel
approach for improving current therapy.
Availability of data and materials
The datasets used and/or analysed during the current
study are available from the corresponding author on reasonable
request.
Authors' contributions
WGJ, LY and AJS conceived the study. LS, JZ, HZ, LY
and AJS conducted in vitro experiments. WGJ, RH and XS
sourced the cohorts. AJS, LY, QPD and WGJ conducted genetic
analysis. HZ, XS, AJ, JZ, TAM and FR conducted histological and
immunohistochemical analyses. AJS, WGJ, JZ and XS confirm the
authenticity of all the raw data. All authors participated in data
analyses and manuscript preparation. All authors read and approved
the final version of the manuscript.
Ethics approval and consent to
participate
The present study was conducted in accordance with
the Declaration of Helsinki and was approved by the local research
ethics committee Bro Taff Research Ethics Committee (Ref.
05/DMD/3562) and by the Yuhuangding Hospital Research Ethics
Committee (approval no. 2022-019; Yantai, China). Written informed
consent was obtained from all subjects whose tissues were involved
in the study.
Patient consent for publication
Not applicable.
Competing interests
The authors declare that they have no competing
interests.
Acknowledgments
The authors wish to thank Dr Ann-Marie Toms of the
University Hospital of Wales (Cardiff) for her assistance in
patient's follow-up.
Funding
The present study was supported by Cardiff China Medical
Scholarship, Taishan Scholars Project (grant no. ts20190991) and
RealCan Fellowship.
References
|
1
|
Deiss LP, Feinstein E, Berissi H, Cohen O
and Kimchi A: Identification of a novel serine/threonine kinase and
a novel 15-kD protein as potential mediators of the gamma
interferon-induced cell death. Genes Dev. 9:15–30. 1995.
|
|
2
|
Kissil JL, Deiss LP, Bayewitch M, Raveh T,
Khaspekov G and Kimchi A: Isolation of DAP3, a novel mediator of
interferon-gamma-induced cell death. J Biol Chem. 270:27932–27936.
1995.
|
|
3
|
Koren I, Reem E and Kimchi A: DAP1, a
novel substrate of mTOR, negatively regulates autophagy. Curr Biol.
20:1093–1098. 2010.
|
|
4
|
Wazir U, Jiang WG, Sharma AK and Mokbel K:
The mRNA expression of DAP1 in human breast cancer: Correlation
with clinicopathological parameters. Cancer Genomics Proteomics.
9:199–201. 2012.
|
|
5
|
Wybranska I, Polus A, Mikolajczyk M, Knapp
A, Sliwa A, Zapala B, Staszel T and Dembinska-Kiec A:
Apoptosis-related gene expression in glioblastoma (LN-18) and
medulloblastoma (Daoy) cell lines. Hum Cell. 26:137–148. 2013.
|
|
6
|
Sui L, Ye L, Sanders AJ, Yang Y, Hao C,
Hargest R and Jiang WG: Expression of death associated proteins
DAP1 and DAP3 in human pancreatic cancer. Anticancer Res.
41:2357–2362. 2021.
|
|
7
|
Miyazaki T, Shen M, Fujikura D, Tosa N,
Kim HR, Kon S, Uede T and Reed JC: Functional role of
death-associated protein 3 (DAP3) in anoikis. J Biol Chem.
279:44667–44672. 2004.
|
|
8
|
Takeda S, Iwai A, Nakashima M, Fujikura D,
Chiba S, Li HM, Uehara J, Kawaguchi S, Kaya M, Nagoya S, et al:
LKB1 is crucial for TRAIL-mediated apoptosis induction in
osteosarcoma. Anticancer Res. 27:761–768. 2007.
|
|
9
|
Mariani L, Beaudry C, McDonough WS,
Hoelzinger DB, Kaczmarek E, Ponce F, Coons SW, Giese A, Seiler RW
and Berens ME: Death-associated protein 3 (Dap-3) is overexpressed
in invasive glioblastoma cells in vivo and in glioma cell lines
with induced motility phenotype in vitro. Clin Cancer Res.
7:2480–2489. 2001.
|
|
10
|
Sasaki H, Ide N, Yukiue H, Kobayashi Y,
Fukai I, Yamakawa Y and Fujii Y: Arg and DAP3 expression was
correlated with human thymoma stage. Clin Exp Metastasis.
21:507–513. 2004.
|
|
11
|
Davidsson J, Andersson A, Paulsson K,
Heidenblad M, Isaksson M, Borg A, Heldrup J, Behrendtz M,
Panagopoulos I, Fioretos T and Johansson B: Tiling resolution array
comparative genomic hybridization, expression and methylation
analyses of dup(1q) in Burkitt lymphomas and pediatric high
hyperdiploid acute lymphoblastic leukemias reveal clustered
near-centromeric breakpoints and overexpression of genes in
1q22-32.3. Hum Mol Genet. 16:2215–2225. 2007.
|
|
12
|
Jia Y, Ye L, Ji K, Zhang L, Hargest R, Ji
J and Jiang WG: Death-associated protein-3, DAP-3, correlates with
preoperative chemotherapy effectiveness and prognosis of gastric
cancer patients following perioperative chemotherapy and radical
gastrectomy. Br J Cancer. 110:421–429. 2014.
|
|
13
|
Wazir U, Jiang WG, Sharma AK and Mokbel K:
The mRNA expression of DAP3 in human breast cancer: Correlation
with clinicopathological parameters. Anticancer Res. 32:671–674.
2012.
|
|
14
|
Sato Y, Yoshino H, Kashiwakura I and
Tsuruga E: DAP3 is involved in modulation of cellular radiation
response by RIG-I-Like receptor agonist in human lung
adenocarcinoma cells. Int J Mol Sci. 22:4202021.
|
|
15
|
Gressner O, Schilling T, Lorenz K, Schulze
Schleithoff E, Koch A, Schulze-Bergkamen H, Lena AM, Candi E,
Terrinoni A, Catani MV, et al: TAp63alpha induces apoptosis by
activating signaling via death receptors and mitochondria. EMBO J.
24:2458–2471. 2005.
|
|
16
|
Woo Lee J, Hwa Soung Y, Young Kim S, Woo
Nam S, Sang Park W, Young Lee J, Jin Yoo N and Hyung Lee S:
Mutational analysis of proapoptotic death associated protein 3
(DAP3) P-loop domain in common human carcinomas. Acta Oncol.
45:489–490. 2006.
|
|
17
|
Han J, An O, Ren X, Song Y, Tang SJ, Shen
H, Ke X, Ng VH, Tay DJ, Tan HQ, et al: Multilayered control of
splicing regulatory networks by DAP3 leads to widespread
alternative splicing changes in cancer. Nat Commun.
13:17932022.
|
|
18
|
Harada T, Iwai A and Miyazaki T:
Identification of DELE, a novel DAP3-binding protein which is
crucial for death receptor-mediated apoptosis induction. Apoptosis.
15:1247–1255. 2010.
|
|
19
|
Fessler E, Eckl EM, Schmitt S, Mancilla
IA, Meyer-Bender MF, Hanf M, Philippou-Massier J, Krebs S, Zischka
H and Jae LT: A pathway coordinated by DELE1 relays mitochondrial
stress to the cytosol. Nature. 579:433–437. 2020.
|
|
20
|
Alavi MV: OMA1-An integral membrane
protease? Biochim Biophys Acta Proteins Proteom.
1869:1405582021.
|
|
21
|
Guo X, Aviles G, Liu Y, Tian R, Unger BA,
Lin YT, Wiita AP, Xu K, Correia MA and Kampmann M: Mitochondrial
stress is relayed to the cytosol by an OMA1-DELE1-HRI pathway.
Nature. 579:427–432. 2020.
|
|
22
|
Xiao L, Xian H, Lee KY, Xiao B, Wang H, Yu
F, Shen HM and Liou YC: Death-associated protein 3 regulates
mitochondrial-encoded protein synthesis and mitochondrial dynamics.
J Biol Chem. 290:24961–24974. 2015.
|
|
23
|
Sung H, Ferlay J, Siegel RL, Laversanne M,
Soerjomataram I, Jemal A and Bray F: Global cancer statistics 2020:
GLOBOCAN estimates of incidence and mortality worldwide for 36
cancers in 185 countries. CA Cancer J Clin. 71:209–249. 2021.
|
|
24
|
Lee S, Zhang S, Ma C, Ou FS, Wolfe EG,
Ogino S, Niedzwiecki D, Saltz LB, Mayer RJ, Mowat RB, et al: Race,
income, and survival in stage III colon cancer: CALGB 89803
(Alliance). JNCI Cancer Spectr. 5:pkab0342021.
|
|
25
|
Nazarenko IA, Bhatnagar SK and Hohman RJ:
A closed tube format for amplification and detection of DNA based
on energy transfer. Nucleic Acids Res. 25:2516–2521. 1997.
|
|
26
|
Jiang WG, Watkins G, Lane L, Cunnick GH,
Douglas-Jones A, Mokbel K and Mansel RE: Prognostic value of rho
GTPases and rho guanine nucleotide dissociation inhibitors in human
breast cancers. Clin Cancer Res. 9:6432–6440. 2003.
|
|
27
|
Chae SY, Lee M, Kim SW and Bae YH:
Protection of insulin secreting cells from nitric oxide induced
cellular damage by crosslinked hemoglobin. Biomaterials.
25:843–850. 2004.
|
|
28
|
Zhou Y, Xu B, Zhou Y, Liu J, Zheng X, Liu
Y, Deng H, Liu M, Ren X, Xia J, et al: Identification of key genes
with differential correlations in lung adenocarcinoma. Front Cell
Dev Biol. 9:6754382021.
|
|
29
|
Wazir U, Sanders AJ, Wazir AM, Ye L, Jiang
WG, Ster IC, Sharma AK and Mokbel K: Effects of the knockdown of
death-associated protein 3 expression on cell adhesion, growth and
migration in breast cancer cells. Oncol Rep. 33:2575–2582.
2015.
|
|
30
|
Guerra F, Arbini AA and Moro L:
Mitochondria and cancer chemoresistance. Biochim Biophys Acta
Bioenerg. 1858:686–699. 2017.
|
|
31
|
Cheng M, Yu H, Kong Q, Wang B, Shen L,
Dong D and Sun L: The mitochondrial PHB2/OMA1/DELE1 pathway
cooperates with endoplasmic reticulum stress to facilitate the
response to chemotherapeutics in ovarian cancer. Int J Mol Sci.
23:13202022.
|
|
32
|
Porporato PE, Filigheddu N, Pedro JM,
Kroemer G and Galluzzi L: Mitochondrial metabolism and cancer. Cell
Res. 28:265–280. 2018.
|
|
33
|
Missiroli S, Perrone M, Genovese I, Pinton
P and Giorgi C: Cancer metabolism and mitochondria: Finding novel
mechanisms to fight tumours. EBioMedicine. 59:1029432020.
|
|
34
|
Shin YK, Yoo BC, Chang HJ, Jeon E, Hong
SH, Jung MS, Lim SJ and Park JG: Down-regulation of mitochondrial
F1F0-ATP synthase in human colon cancer cells with induced
5-fluorouracil resistance. Cancer Res. 65:3162–3170. 2005.
|
|
35
|
Vellinga TT, Borovski T, de Boer VC,
Fatrai S, van Schelven S, Trumpi K, Verheem A, Snoeren N, Emmink
BL, Koster J, et al: SIRT1/PGC1α-dependent increase in oxidative
phosphorylation supports chemotherapy resistance of colon cancer.
Clin Cancer Res. 21:2870–2879. 2015.
|
|
36
|
Kluza J, Jendoubi M, Ballot C, Dammak A,
Jonneaux A, Idziorek T, Joha S, Dauphin V, Malet-Martino M,
Balayssac S, et al: Exploiting mitochondrial dysfunction for
effective elimination of imatinib-resistant leukemic cells. PLoS
One. 6:e219242011.
|
|
37
|
Li J, Zhao S, Zhou X, Zhang T, Zhao L,
Miao P, Song S, Sun X, Liu J, Zhao X and Huang G: Inhibition of
lipolysis by mercaptoacetate and etomoxir specifically sensitize
drug-resistant lung adenocarcinoma cell to paclitaxel. PLoS One.
8:e746232013.
|
|
38
|
Chen AN, Luo Y, Yang YH, Fu JT, Geng XM,
Shi JP and Yang J: Lactylation, a novel metabolic reprogramming
code: Current status and prospects. Front Immunol.
12:6889102021.
|