Introduction
Head and neck squamous cell carcinoma (HNSC) is a
common cancer worldwide (1). It is
estimated that there will be 139,170 new cases and 75,640 deaths
associated with HNSC in China in 2022 (2). HNSC originates from the epithelial
cells of the oral cavity, pharynx and larynx, and accounts for
>90% of cancers in the head and neck region (3). Of all HNSC cases, ~25% are oral
squamous cell carcinoma (OSCC) (4). The main risk factors for OSCC are
smoking and drinking (5).
Treatment for patients with early stage OSCC include surgery or
radiation therapy, and for patients with advanced OSCC,
multidisciplinary treatment strategies are required (6). However, the 5-year survival rate of
patients with OSCC is <50% (7,8).
Bone marrow stromal antigen 2 (BST2) is an antiviral
protein also known as tetherin, CD317 and HM1.24 (9). The main function of BST2 is to
suppress the release of enveloped viruses by tethering the envelope
of newly synthesized virions and binding them to the surface of
cells (10). Much is known about
the role of BST2 in immunity, but few previous studies have
evaluated the role of BST2 in cancer, including its potential role
in liver cancer (11) and breast
cancer (12).
STAT1, a member of the STAT family of transcription
factors, is the major mediator of the cellular response to
interferons (IFNs) (13). However,
the role of STAT1 in OSCC has not been previously elucidated.
Therefore, in the present study the regulation of
the BST2 promoter by STAT1 was evaluated, and how this in turn
affected the biological behavior (metastasis, invasion and
proliferation) of OSCC was assessed.
Materials and methods
Bioinformatic analysis
The TCGA_HNSC tumor dataset from The Cancer Genome
Atlas (portal.gdc.cancer.gov) and
Genotype-Tissue Expression (ngdc.cncb.ac.cn) databases were analyzed using the
Gene Expression Profiling Interactive Analysis (GEPIA) database
(gepia.cancer-pku.cn) and the linkedomics database (www.linkedomics.org). Briefly, expression levels of
specific genes in different tumors were analyzed by methods such as
the Gene Expression Profile and Gene Expression box plots. Kyoto
Encyclopedia of Genes and Genomes (KEGG, www.linkedomics.org) signal pathway enrichment
analysis of specific genes was performed using the linkedomics
database.
The University of California Santa Cruz Genome
Browser (UCSC; genome.ucsc.edu) and JASPAR
(genome.ucsc.edu) databases were used to predict
the transcription factors of BST2. Briefly, UCSC was used to
predict transcription factors, and JASPAR was used to predict the
specific sequences that transcription factors acted on.
Human oral squamous carcinoma cell lines
and culture
SCC-15, SCC-25 and CAL-27 cell lines were cultured
in DMEM (Gibco; Thermo Fisher Scientific, Inc.) with 10% fetal
bovine serum (FBS; Invitrogen; Thermo Fisher Scientific, Inc.) and
incubated at 37°C with 5% CO2. All cell lines were
purchased from the American Type Culture Collection.
Small interfering RNA (siRNA) and plasmid
transfection
SCC-15 cells (1×10⁵ cells/well) were
plated in 6-well plates. Using si-RNA Transmate Reagent (Suzhou
GenePharm Co., Ltd.) the cells were transfected with negative
control (NC) or siRNAs targeting BST2 or STAT1 (Table I). SiRNAs transfection was
performed at 37°C and the culture medium was replaced with fresh
culture medium after 6 h. Follow-up procedures were performed 24 h
later. Plasmid transfection for overexpression (oe-BST2; vector
pcDNA3.1, NM_004335.4, 1.5 µg/well) or negative control
(oe-NC; empty vector pcDNA3.1, 1.5 µg/well) was performed
using Lipofectamine™ 3000 Reagent (Invitrogen; Thermo Fisher
Scientific, Inc.) at 37°C, and the culture medium was replaced 24 h
later and subsequent treatment were performed. The siRNA sequences
and plasmids were purchased from Suzhou GenePharm Co. Ltd.
 | Table Isi-RNA sequences. |
Table I
si-RNA sequences.
| Target | Sequence
(5′-3′) |
|---|
| STAT1 | S:
GCGUAAUCUUCAGGAUAAUTT |
| A:
AUUAUCCUGAAGAUUACGCTT |
| BST2 | S:
GCAAUGUCACCCAUCUCCUTT |
| A:
AGGAGAUGGGUGACAUUGCTT |
| Negative
control | S:
UUCUCCGAACGUGUCACGUTT |
| A:
ACGUGACACGUUCGGAGAATT |
RNA extraction and reverse
transcription-quantitative (RT-q) PCR
The total RNA of a cell or tissue was extracted
using a UNIQ-10 Column Trizol Total RNA Isolation Kit (Sangon
Biotech Co., Ltd.), and complementary DNA was generated using
PrimeScript RT Master Mix (Takara Bio, Inc.) and PCR Veriti
thermocycler (Thermo Fisher Scientific, Inc.). The thermocycling
conditions used were as follows: 37°C for 15 min, 85°C for 5 sec
and were then cooled to 4°C upon completion. Quantitative PCR
assays were performed using a A28134 QuantStudio® 5
Real-Time PCR Instrument (Thermo Fisher Scientific, Inc.) and iTaq
Universal SYBR Green Supermixi reagent (Bio-Rad Laboratories, Inc.)
in 8 Strip Real-time PCR Tubes (Sangon Biotech Co., Ltd.). The
sequences of the primers (Sangon Biotech Co., Ltd.) used were
presented in Table II. The
thermocycling conditions used were as follows: 95°C for 30 sec, 40
cycles of 95°C for 3 sec and 60°C for 30 sec, then 60°C for 20 sec
and 95°C for 1 sec. The relative expression of each gene was
calculated using the 2−ΔΔCq method with β-actin as the
internal reference (14). The
primer sequences were purchased from Suzhou GenePharm Co. Ltd.
| Table IISequences of primers used for reverse
transcription-quantitative PCR. |
Table II
Sequences of primers used for reverse
transcription-quantitative PCR.
| Gene | Sequence
(5′-3′) |
|---|
| STAT1 | F:
GTTTGTGGTGGAAAGACAGCC |
| R:
TCTCTCATTCACATCTCTCAACTT |
| BST2 | F:
CTGGGGGTGCCCTTGATTAT |
| R:
AGCCATTAGGGCCATCACAGT |
| β-actin | F:
CATGTACGTTGCTATCCAGGC |
| R:
CTCCTTAATGTCACGCACGAT |
Cell proliferation assay with Cell
Counting Kit-8 (CCK-8)
Briefly, 1,000 SCC-15 cells were plated in 96-well
plates in 100 µl DMEM (Gibco; Thermo Fisher Scientific,
Inc.) with 10% FBS (Invigentech Inc.). The cells were cultured for
24, 48 and 72 h. The CCK-8 stock solution (Dojindo, Japan) was
diluted 1:10 with 100% DMEM, serum-free medium (Gibco; Thermo
Fisher Scientific). The original medium was removed and the assay
reagents were added to the well. After the cells were incubated for
1.5 h, results were assessed as the OD 450 nm on a SpectraMax M5
microplate reader (Molecular Devices, LLC.).
Scratch test assay
Transfected or untreated SCC-15 cells
(8×10⁵ cells/well) were cultured to ~100% confluence.
The cells were scratched with a 1 ml pipette tip. Cells that were
floating in suspension were removed using PBS. The cells were
cultured in serum-free medium at 37°C for 48 h. The cells were
imaged using a DMi8 light microscope (Leica Microsystems GmbH).
ImageJ (version 1.8.0.345; National Institutes of Health) was used
to assess the micrographs.
Transwell cell invasion assay
Transfected or untreated SCC-15 cells
(5×10⁴/well, 200 µl) were plated in the upper
chamber of the Transwell insert (8 µm/pore; cat. no. 354480;
Corning, Inc.) with serum-free DMEM (Gibco; Thermo Fisher
Scientific), and the chamber was placed in a well containing 600
µl DMEM (Gibco; Thermo Fisher Scientific) with 20% FBS. The
cells were incubated at 37°C for 48 h. The Transwell chambers were
supplied pre-treated with Matrigel the chamber to assess the
invasion ability of the cells. Finally, after removing cells from
the wells, cells in the lower chamber were fixed using 4% formalin
at room temperature for 15 min. The cells were washed with PBS and
stained with 1× Giemsa Staining Solution (Beijing Solarbio Science
& Technology Co., Ltd.) at room temperature for 30 min. The
final results were imaged using a DMi8 light microscope (Leica
Microsystems GmbH). ImageJ (version 1.8.0.345; National Institutes
of Health) was used to assess the micrographs.
Clone formation assay
Following transfection, SCC-15 cells
(1×10⁴ cells/ml) were plated into 60 mm-dishes and
incubated for 10 days at 37°C. Then, the cells were fixed using 4%
formaldehyde at room temperature for 15 min and stained with 1×
Giemsa Staining Solution (Beijing Solarbio Science & Technology
Co., Ltd.) for 30 min. The size of cloned cell colonies was
quantified using ImageJ (version 1.8.0.345; National Institutes of
Health).
Dual-luciferase reporter assay
SCC-15 cells (80% confluence) were co-transfected
with BST-wild-type (WT; TTT CTG GGA AA; 50 ng) or BST2-mutant (MUT;
CCG ACT TAG GC; 50 ng) and oe-STAT1 (1.5 µg, vector
pcDNA3.1, NM_007315.4) or oe-NC (1.5 µg, empty vector
pcDNA3.1) using Lipofectamine 3000 (Invitrogen; Thermo Fisher
Scientific, Inc.), according to the aforementioned method. After 48
h of incubation, the luciferase activity was evaluated using the
Dual Luciferase Reporter Gene Assay Kit (cat. no. KGAF040; Nanjing
KeyGen Biotech Co., Ltd.). The results were analyzed using a
SpectraMax M5 microplate reader (Molecular Devices, LLC.) with
Renilla luciferase activity as the internal reference. The
WT, MUT BST2, the STAT1 overexpression plasmid and the luciferase
reporter plasmid were purchased from Nanjing KeyGen Biotech Co.,
Ltd.
Western blotting
Transfected cells were washed and incubated in RIPA
with PMSF (100:1) for at 4°C for 30 min. The lysate was centrifuged
at 10,000 × g at 4°C for 10 min and precipitates were removed. The
protein concentration was measured using a BCA Protein Assay Kit
(Beijing Solarbio Science & Technology Co., Ltd.). The proteins
(20 µg/lane) were separated using SDS-PAGE electrophoresis
in 4 to 20% polyacrylamide gels and transferred to PVDF membranes
(Invitrogen; Thermo Fisher Scientific, Inc.). The PVDF containing
protein membranes were blocked in 5% skim milk at room temperature
for 120 min. The membranes were then incubated overnight with
primary antibodies against STAT1 (1:1,000; cat. no. 10144-2-AP;
ProteinTech Group, Inc.), phosphorylated (p)-STAT1 (1:1,000; cat.
no. ab109461; Abcam), AKT (pan; 1:1,000; cat. no. 4691S; Cell
Signaling Technology, Inc.), p-AKT (1:2,000; cat. no. 4060S; Cell
Signaling Technology, Inc.), ERK1/2 (1:1,000; cat. no. 11257-1-AP;
ProteinTech Group, Inc.), p-ERK1/2 (1:1,000; cat. no.
28733-1-AP-ProteinTech Group, Inc.) or β-actin (1:2,000; cat. no.
20536-1-AP; ProteinTech Group, Inc.) at 4°C. Membranes were then
washed with TBST with 0.1% Tween and incubated with Goat
anti-rabbit IgG (H&L) secondary antibodies (1:10,000; cat. no.
bs13278; Bioworld Technology, Inc.) at 25°C for 1 h. The protein
bands were visualized using an Amersham Imager 680 (Cytiva) with
ECL (cat. no. WBKLS0500; MilliporeSigma). The relative expression
of each protein was calculated using ImageJ (version 1.8.0.345;
National Institutes of Health) with β-actin as an internal
reference.
Lentiviral transduction
The plasmids and reagents used in the manufacture of
Lentivirus-RNA interference-STAT1 (Levi-RNAi-STAT1) were purchased
from Suzhou GenePharma Co., Ltd. Briefly, lentivirus-RNAi was
produced using a second generation system and 293T cells were used
as the interim cells. The 293T cells were purchased from the
American Type Culture Collection. A total of 20 µg GV vector
plasmid, 15 µg pHelper 1.0 vector plasmid and 10 µg
pHelper 2.0 vector plasmid were transfected into 293T cells and
cultured at 37°C for 6 h. After 6 h, the old culture medium was
replaced with fresh culture medium and incubation was continued at
37°C for 48 h. The supernatant was then collected and centrifuged
at 4°C and 4,000 × g for 10 min. The supernatant was discarded, PBS
added, and then centrifuged at 10,000 × g at 4°C for 5 min. The
supernatant was then collected and used as the virus stock solution
(1×10⁸ TU/ml). The MOI value (MOI=50) was determined
according to the manufacturer's protocol. The target SCC15 cells
(1×10⁴ cells/well) were plated in a 6-well plate and
incubated at 37°C for 24 h. The virus stock solution was diluted
and added to the six-well plate. The cells were cultured at 37°C
for 12 h. Culture medium was replaced with fresh medium 12 h after
transduction. Transfected cells were screened for 3 days at 1
µg/ml purinomycin at 37°C and then screened for a further 48
h at 0.5 µg/µl purinomycin at 37°C to obtain cells
with STAT1-downregulated. STAT1-downregulated expression cells were
kept in 0.25 µg/µl purinomycin for maintenance. The
STAT1-downregulated express cell strains obtained through the above
steps were then used in in vivo experiments. The
lentiviral-encapsulated si-RNA sequences were presented in Table I.
In vivo tumor model
All animal studies were approved by the Tianjin
Institute of Environmental and Operational Medicine Experimental
Animal Ethics Committee (approval no. IACUC of AMMS-04-2022-018).
Female athymic mice (n=24; age, 5 weeks; weight, 17-20 g) were
randomly divided into three groups as follows: i) control group
(n=8, SCC-15 cells), ii) Levi-RNAi-siNC group (n=8, SCC-15 cells
transfected with RNAi-NC lentivirus), and iii) Levi-RNAi-siSTAT1
group (n=8, SCC-15 cells transfected with RNAi-STAT1 lentivirus). A
total of 100 µl of cells in PBS (5×10⁷ cells/ml)
were injected subcutaneously into dorsal skin of mice
(5×10⁶ cells/mouse). The tumor volume was measured every
three days once the tumors were visible (volume=length/2 ×
width2). The animal experiment was terminated when the
tumor volume in the control group reached ~1,500 mm3 or
signs of decreased mobility, self-harm or necrosis were observed.
The mice were euthanized with CO2 (60% displacement of
cage volume/min). Subcutaneous tumor tissues and other tissues were
collected after the absence of a heartbeat and spontaneous
breathing for 15 min. Finally, three mice were randomly selected
and their tumors were collected for western blotting, RT-qPCR,
hematoxylin and eosin (H&E) staining and immunohistochemical
(IHC) staining experiments.
IHC analysis
Lung, heart, liver and tumor tissues were collected
from cell-derived xenograft (CDX) models. Tissues were washed with
normal saline and immediately fixed in 4% paraformaldehyde at room
temperature for 24 h. Tissues were cut into 5 µm sections.
The paraffin-embedded sections were dewaxed at 58°C and put it into
dimethylbenzene for 10 min, 100% alcohol for 5 min, 95% alcohol for
5 min and then 75% alcohol for 5 min at room temperature for
rehydration, and then washed with water and placed in water to
prepare for antigen retrieval. The antigen retrieval solution
(EDTA) was added to a pressure cooker and heated to a boil using an
induction cooker. The dewaxed and hydrated tissue sections were
placed in boiling EDTA for 1.5 min before being removed and cooled
naturally to room temperature. Sections were then washed three
times with PBS. The sections were soaked in 3%
H2O2 for 30 min, and were then washed three
times with PBS.
The sections were soaked in PBS with 10% Tween at
room temperature for 3 min and then blocked using 100% goat serum
(cat. no. AR1009; Wuhan Boster Biological Technology, Ltd., Wuhan,
China.) at 25°C for 30 min. The serum on the sections was removed
and sections were incubated at 37°C for 1 h with primary antibodies
as follows: STAT1 (1:900; cat. no. 10144-2-AP; ProteinTech Group,
Inc.); p-STAT1 (1:900; cat.no. ab109461; Abcam); BST2 (1:900;
cat.no. 13560-1-AP; ProteinTech Group, Inc.). Sections were then
rinsed with PBS and then rinsed three times with water. The
sections were then soaked and rinsed in PBS with 10% Tween three
times. Sections were then incubated with Goat anti-rabbit IgG
(H&L) secondary antibodies (1:2,000; cat. no. ab205718; Abcam)
for 45 min at 37°C. Then DAB was added to allow assessment of the
color development under the microscope. After color development,
the reaction was terminated with water and the sections were
soaked. Then, hematoxylin dye solution was added at room
temperature for 2 min, and then rinsed with distilled water, and
the color separation solution (cat. no. BP022, BIOSSCI) was added,
then rinsed with water three times. The slides were sequentially
dehydrated in 100% absolute ethanol at 25°C for 10 sec. A
charge-coupled device light microscope was used for assessment and
imaging of the section.
H&E staining
Lung, heart, liver and tumor tissues obtained from
the CDX model were made into sections according to the
aforementioned method in the immunohistochemical analysis section.
The sections were dewaxed in dimethylbenzene for 5 min and
dehydrated in 100, 95, 85 and 75% alcohol for 5 min, respectively.
After that, the sections were stained with hematoxylin for 5 min
and differentiated with 1% hydrochloric acid alcohol for 5 sec.
Sections were then stained with eosin for 15 sec and dehydrated in
95 and 100% alcohol for 1 min each, before clearing with
dimethylbenzene for 5 min. Subsequently, the sections were fixed
using neutral balsam. All stages of H&E staining were performed
at 25°C. Finally, the sections were imaged using a DMi8 light
microscope (Leica Microsystems GmbH).
Statistical analysis
Data were collected from three independent
experiments and GraphPad Prism 9 (GraphPad Software; Dotmatics) was
used for data analysis. Data were presented as the mean ± SD.
Unpaired Student's t-test was used to analyze differences between
groups and one-way analysis of variance with Tukey's post-hoc test
was used to analyze multiple groups. P<0.05 considered to
indicate a statistically significant difference.
Results
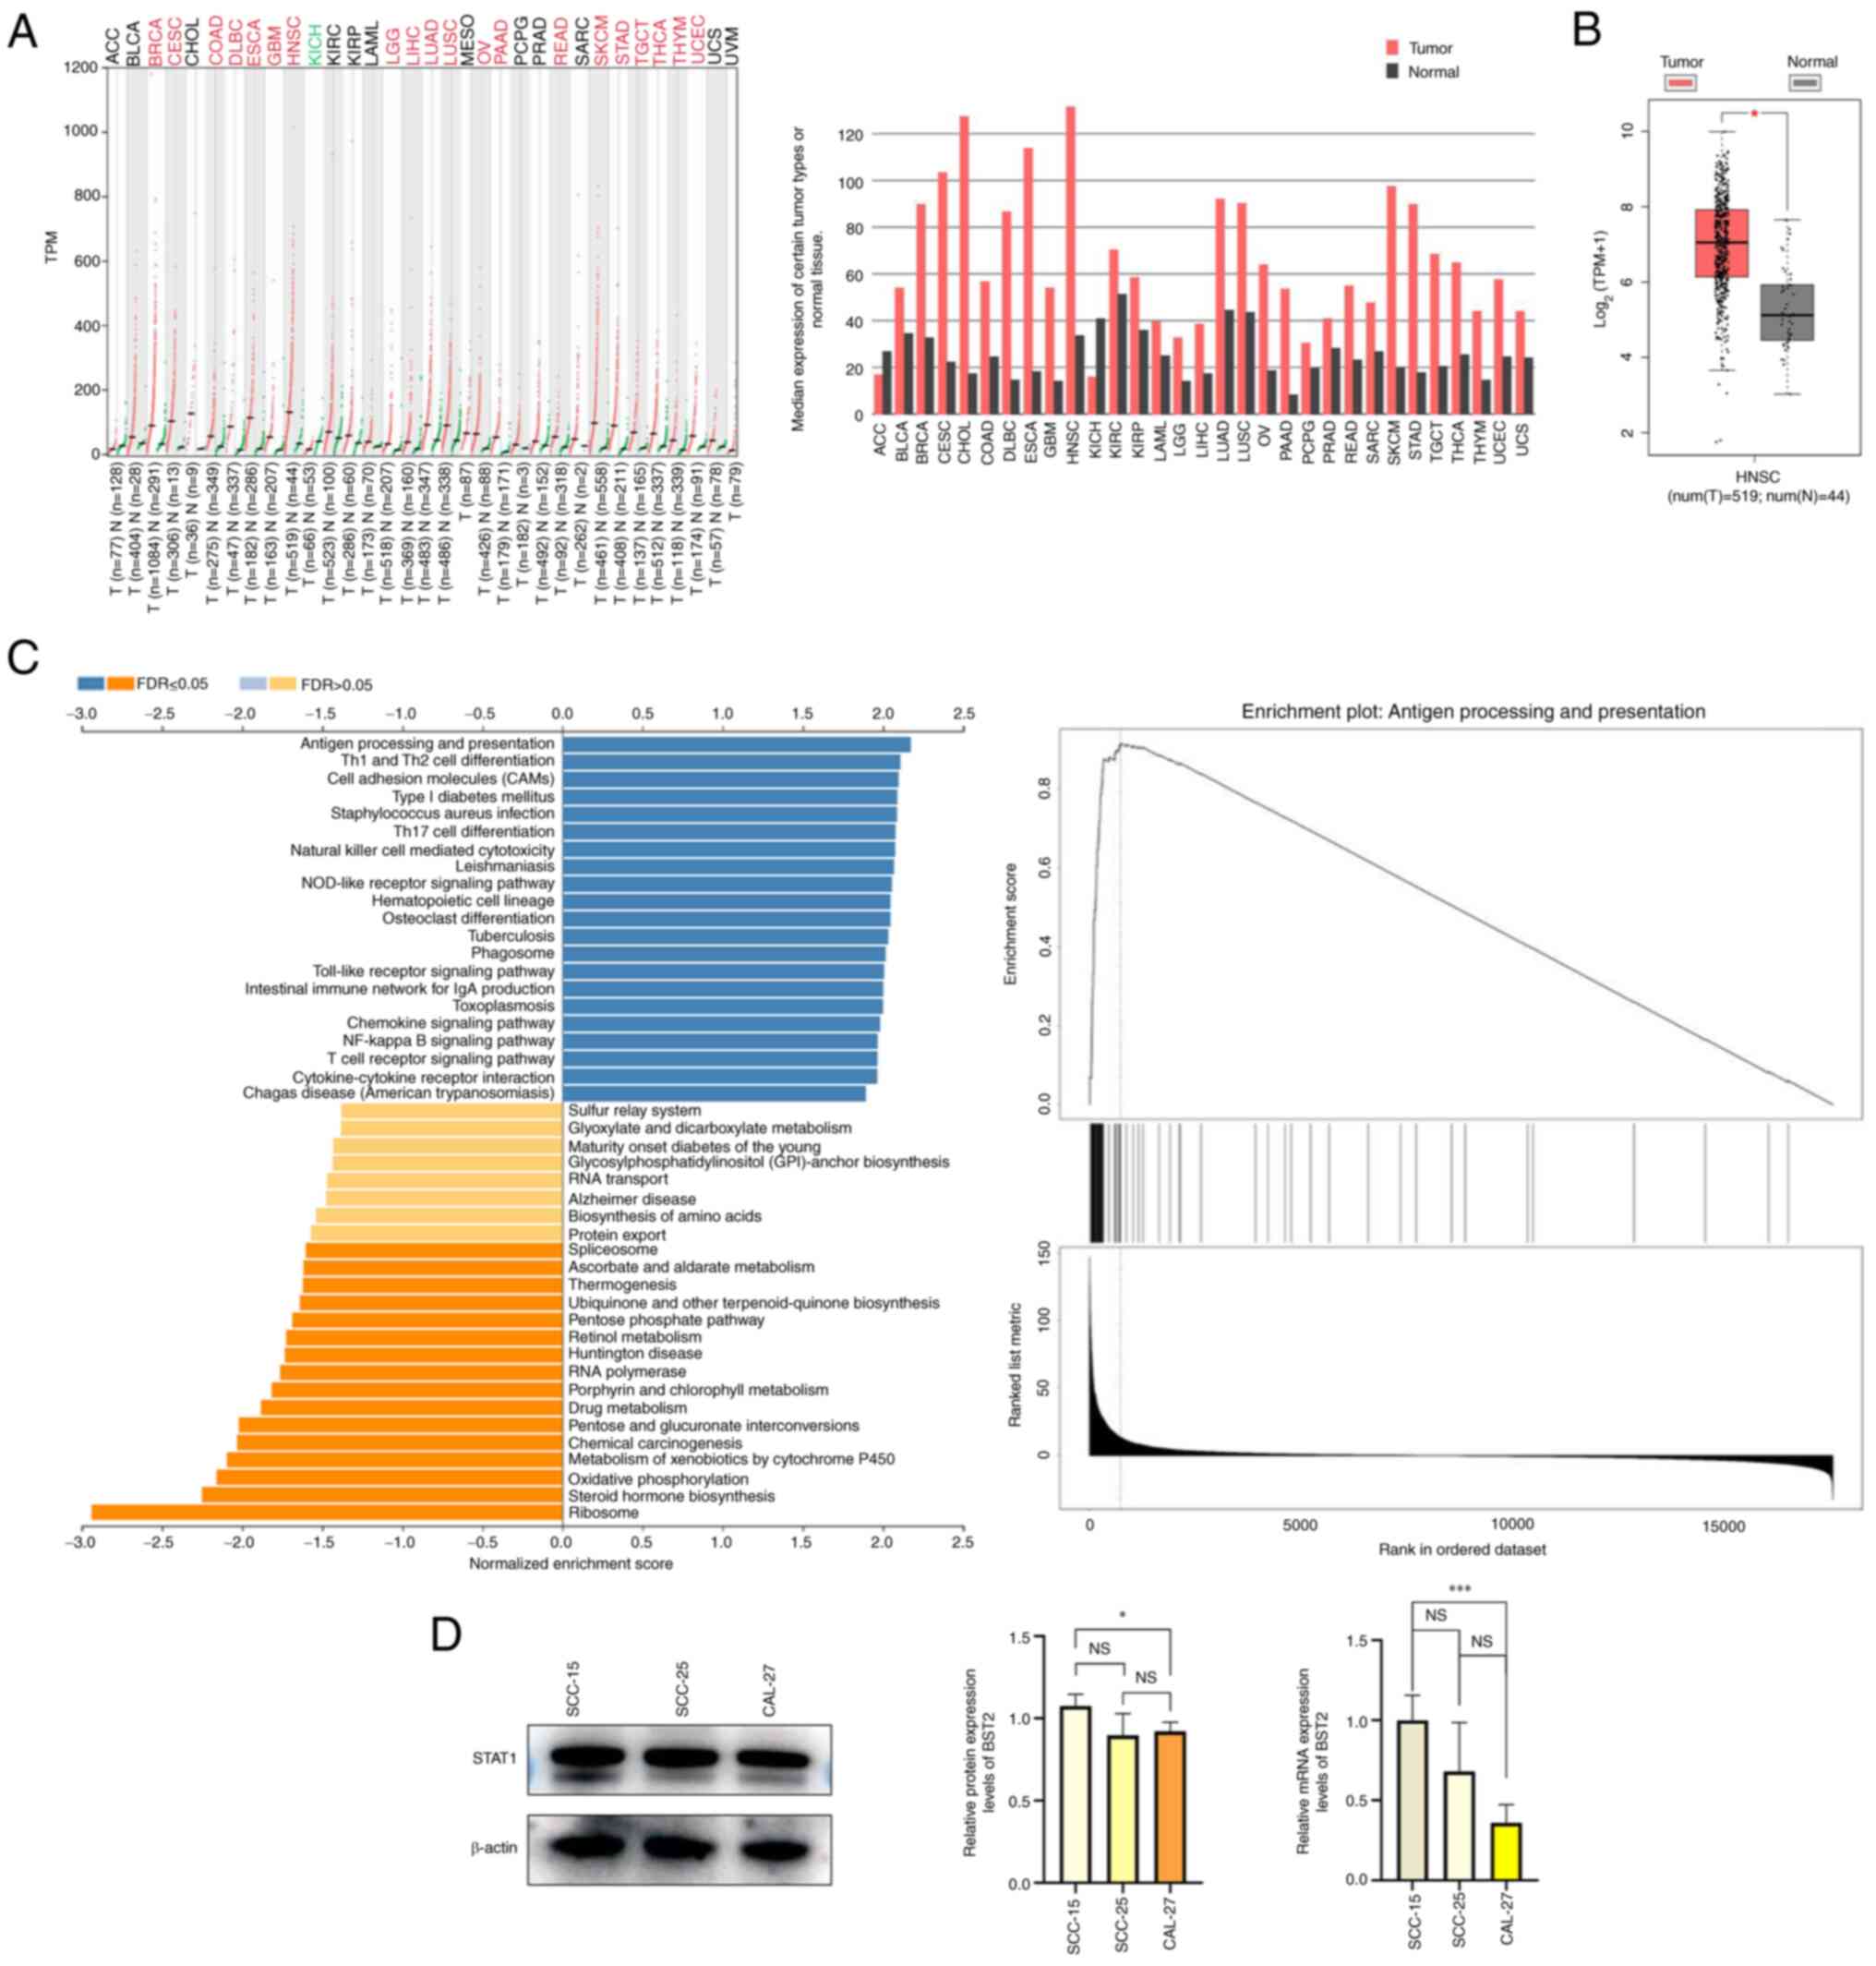
BST2 is highly expressed in HNSC and OSCC
cell lines
The GEPIA database was used to analyze the
expression levels of BST2 in HNSC. The BST2 expression levels in
HNSC were markedly abnormally elevated (Fig. 1A). KEGG pathways were analyzed
using the linkedomics database (15). BST2 was enriched in immune-related
pathways, which may be a reason which has limited the number of
studies on BST2 in cancer (Fig.
1C). GEPIA was also used to analyze BST2 expression in tumor
and normal tissues. The results showed that the expression of BST2
in tumor tissues was significantly higher than that in normal
tissues. (Fig. 1B). BST2 mRNA and
protein expression levels in different cell lines was analyzed by
RT-qPCR and western blotting, respectively. The expression level of
BST2 in SCC15 cell line was statistically different from that in
the CAL27 cell line, while there was no significant statistical
difference between BST2 and SCC15 (Fig. 1D). Based on bioinformatic analysis,
BST2 was highly expressed in HNSC compared with other types of
tumor. Moreover, western blotting and RT-qPCR experiments
demonstrated that the protein and mRNA expression levels of BST2 in
the SCC-15 cell line were markedly higher than those in the SCC-25
and CAL-27 cell lines. Therefore, the SCC-15 cell line was selected
for use in subsequent experiments.
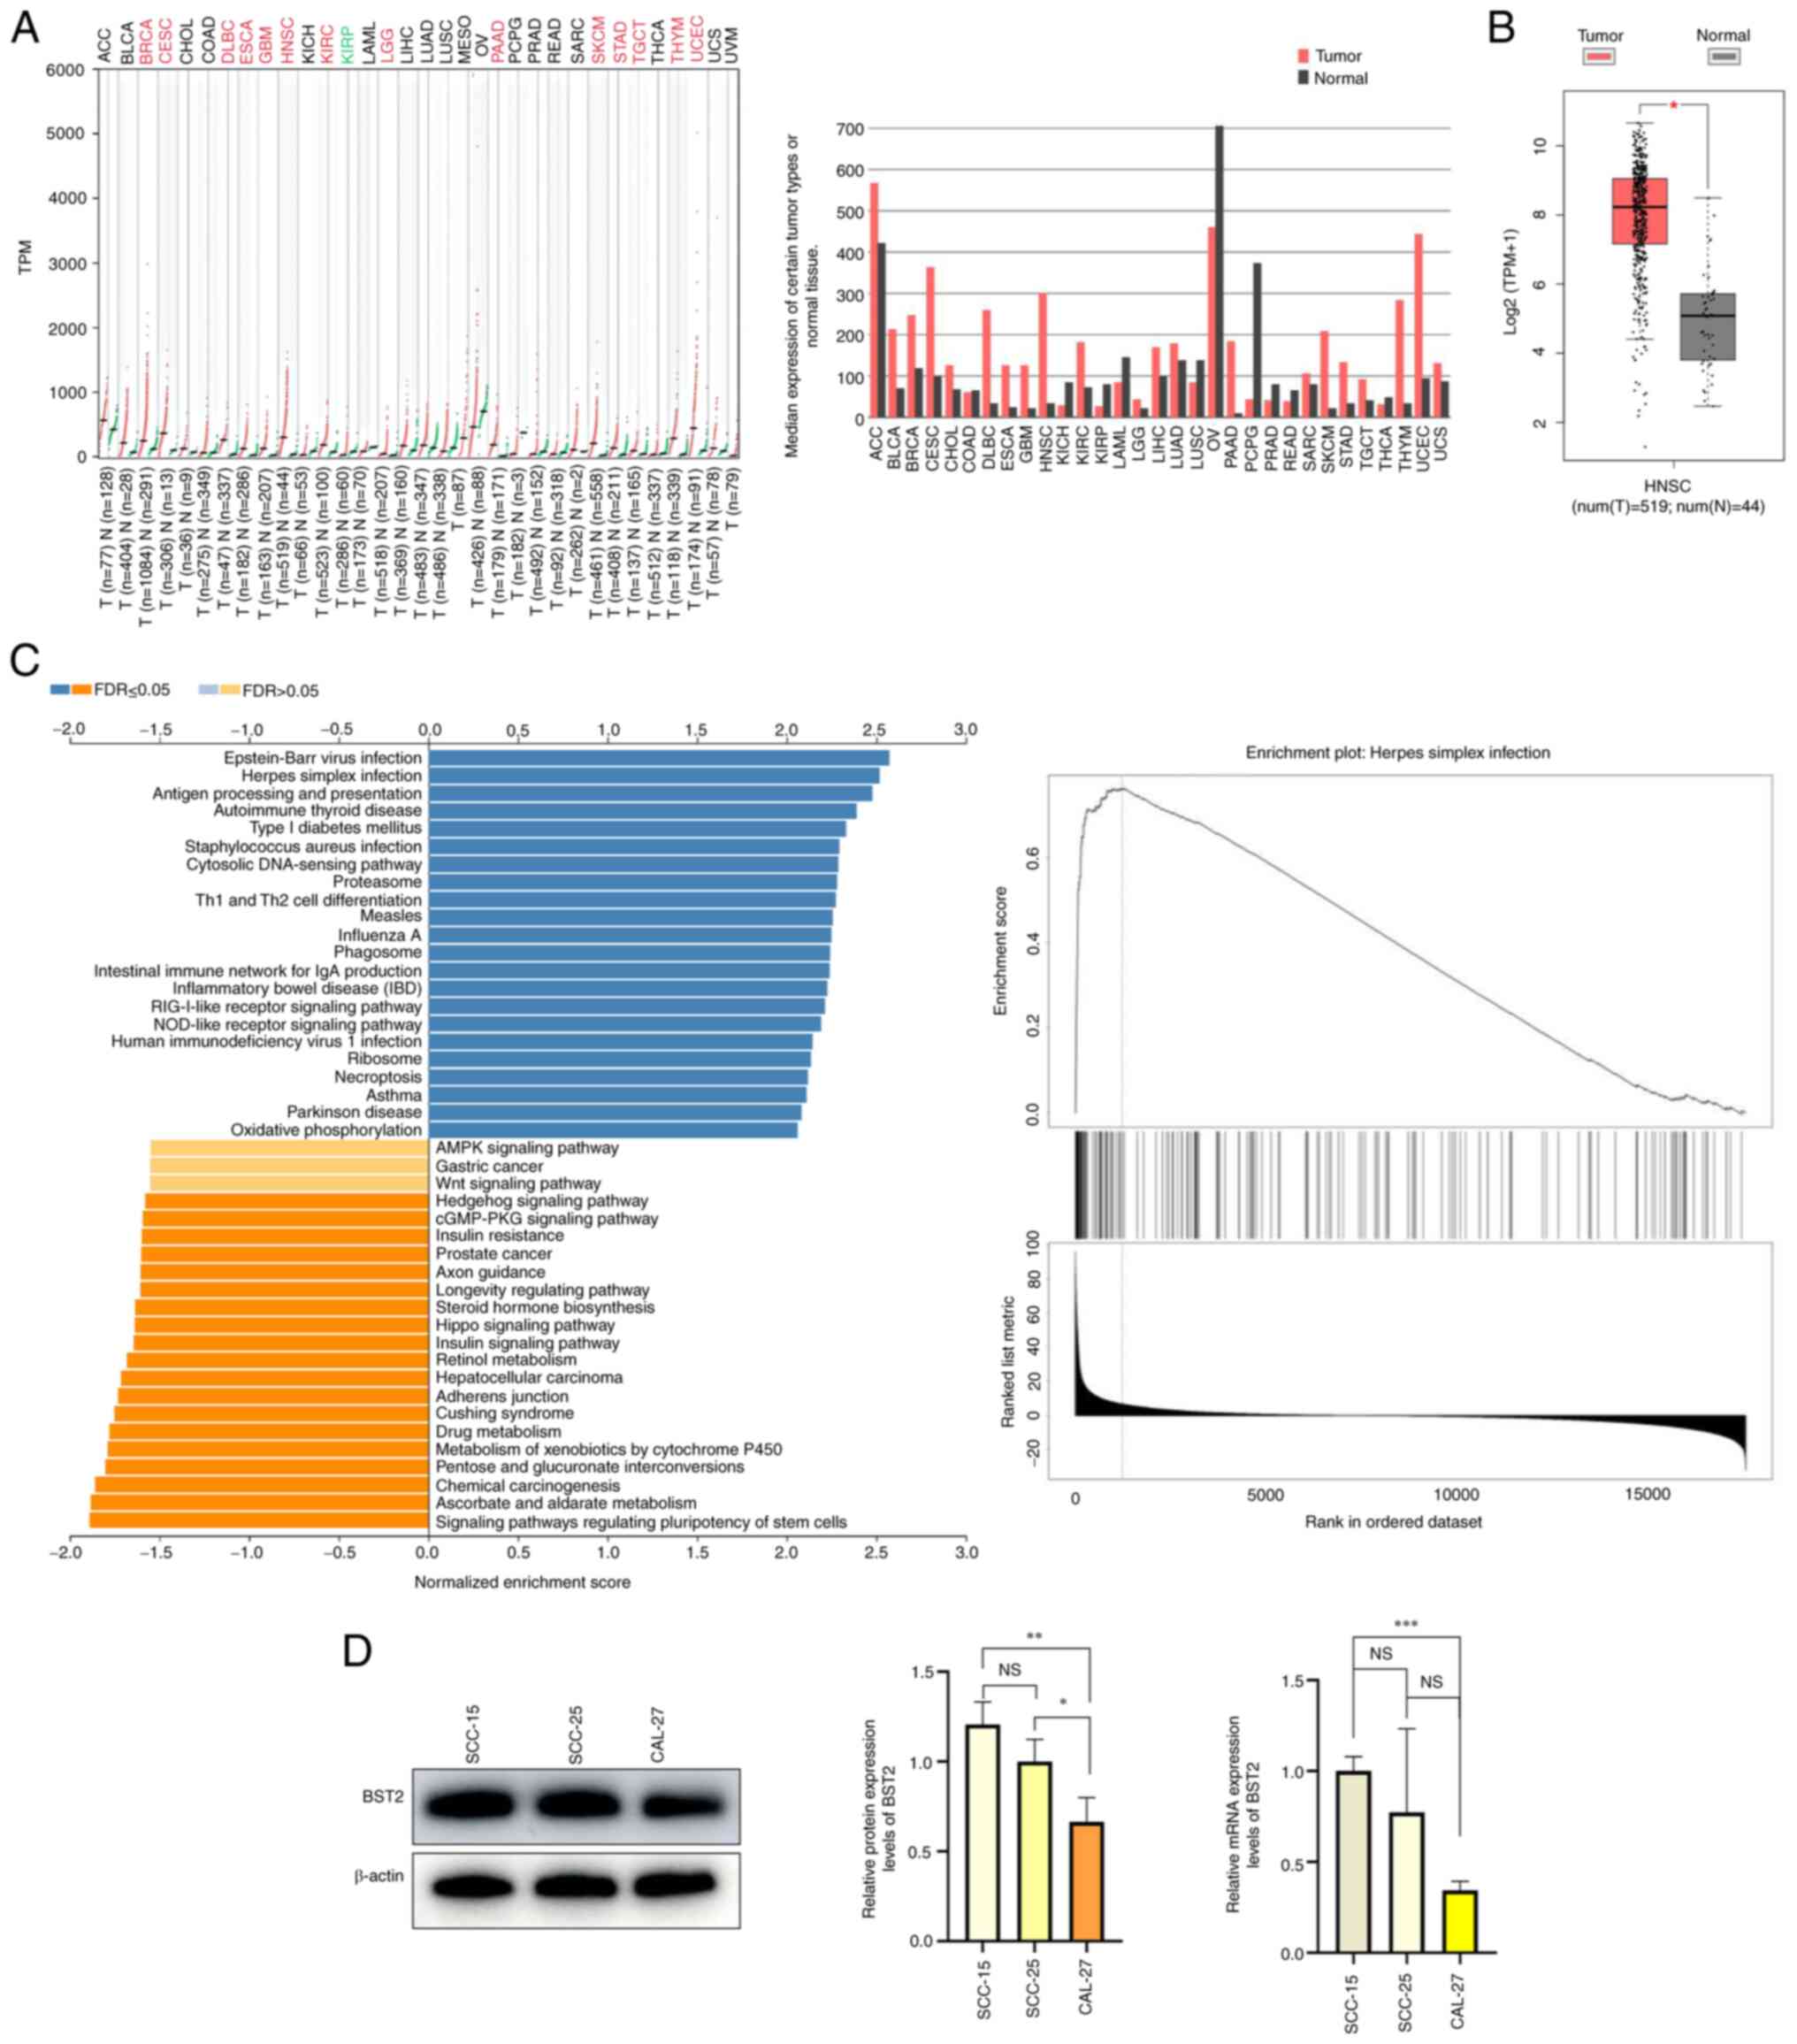 | Figure 1BST2 is highly expressed in HNSC and
OSCC cell lines. (A) The mRNA expression levels of BST2 in
different tumor types from the Gene Expression Profiling
Interactive Analysis database (B) Differential expression of BST2
between normal and tumor tissue (tumor tissues, n=519; normal
tissues, n=44). (C) Kyoto Encyclopedia of Genes and Genomes pathway
analysis performed by linkedomics database. (D) The protein and
mRNA expression levels of BST2 in different OSCC cell lines.
*P<0.05, **P<0.01 and
***P<0.001. HNSC, head and neck squamous cell
carcinoma; OSCC, oral squamous cell carcinoma; TPM, transcripts per
million; FDR, false discovery rate; BST2, bone marrow stromal
antigen 2; NS, not significant; T, tumor; N, normal. |
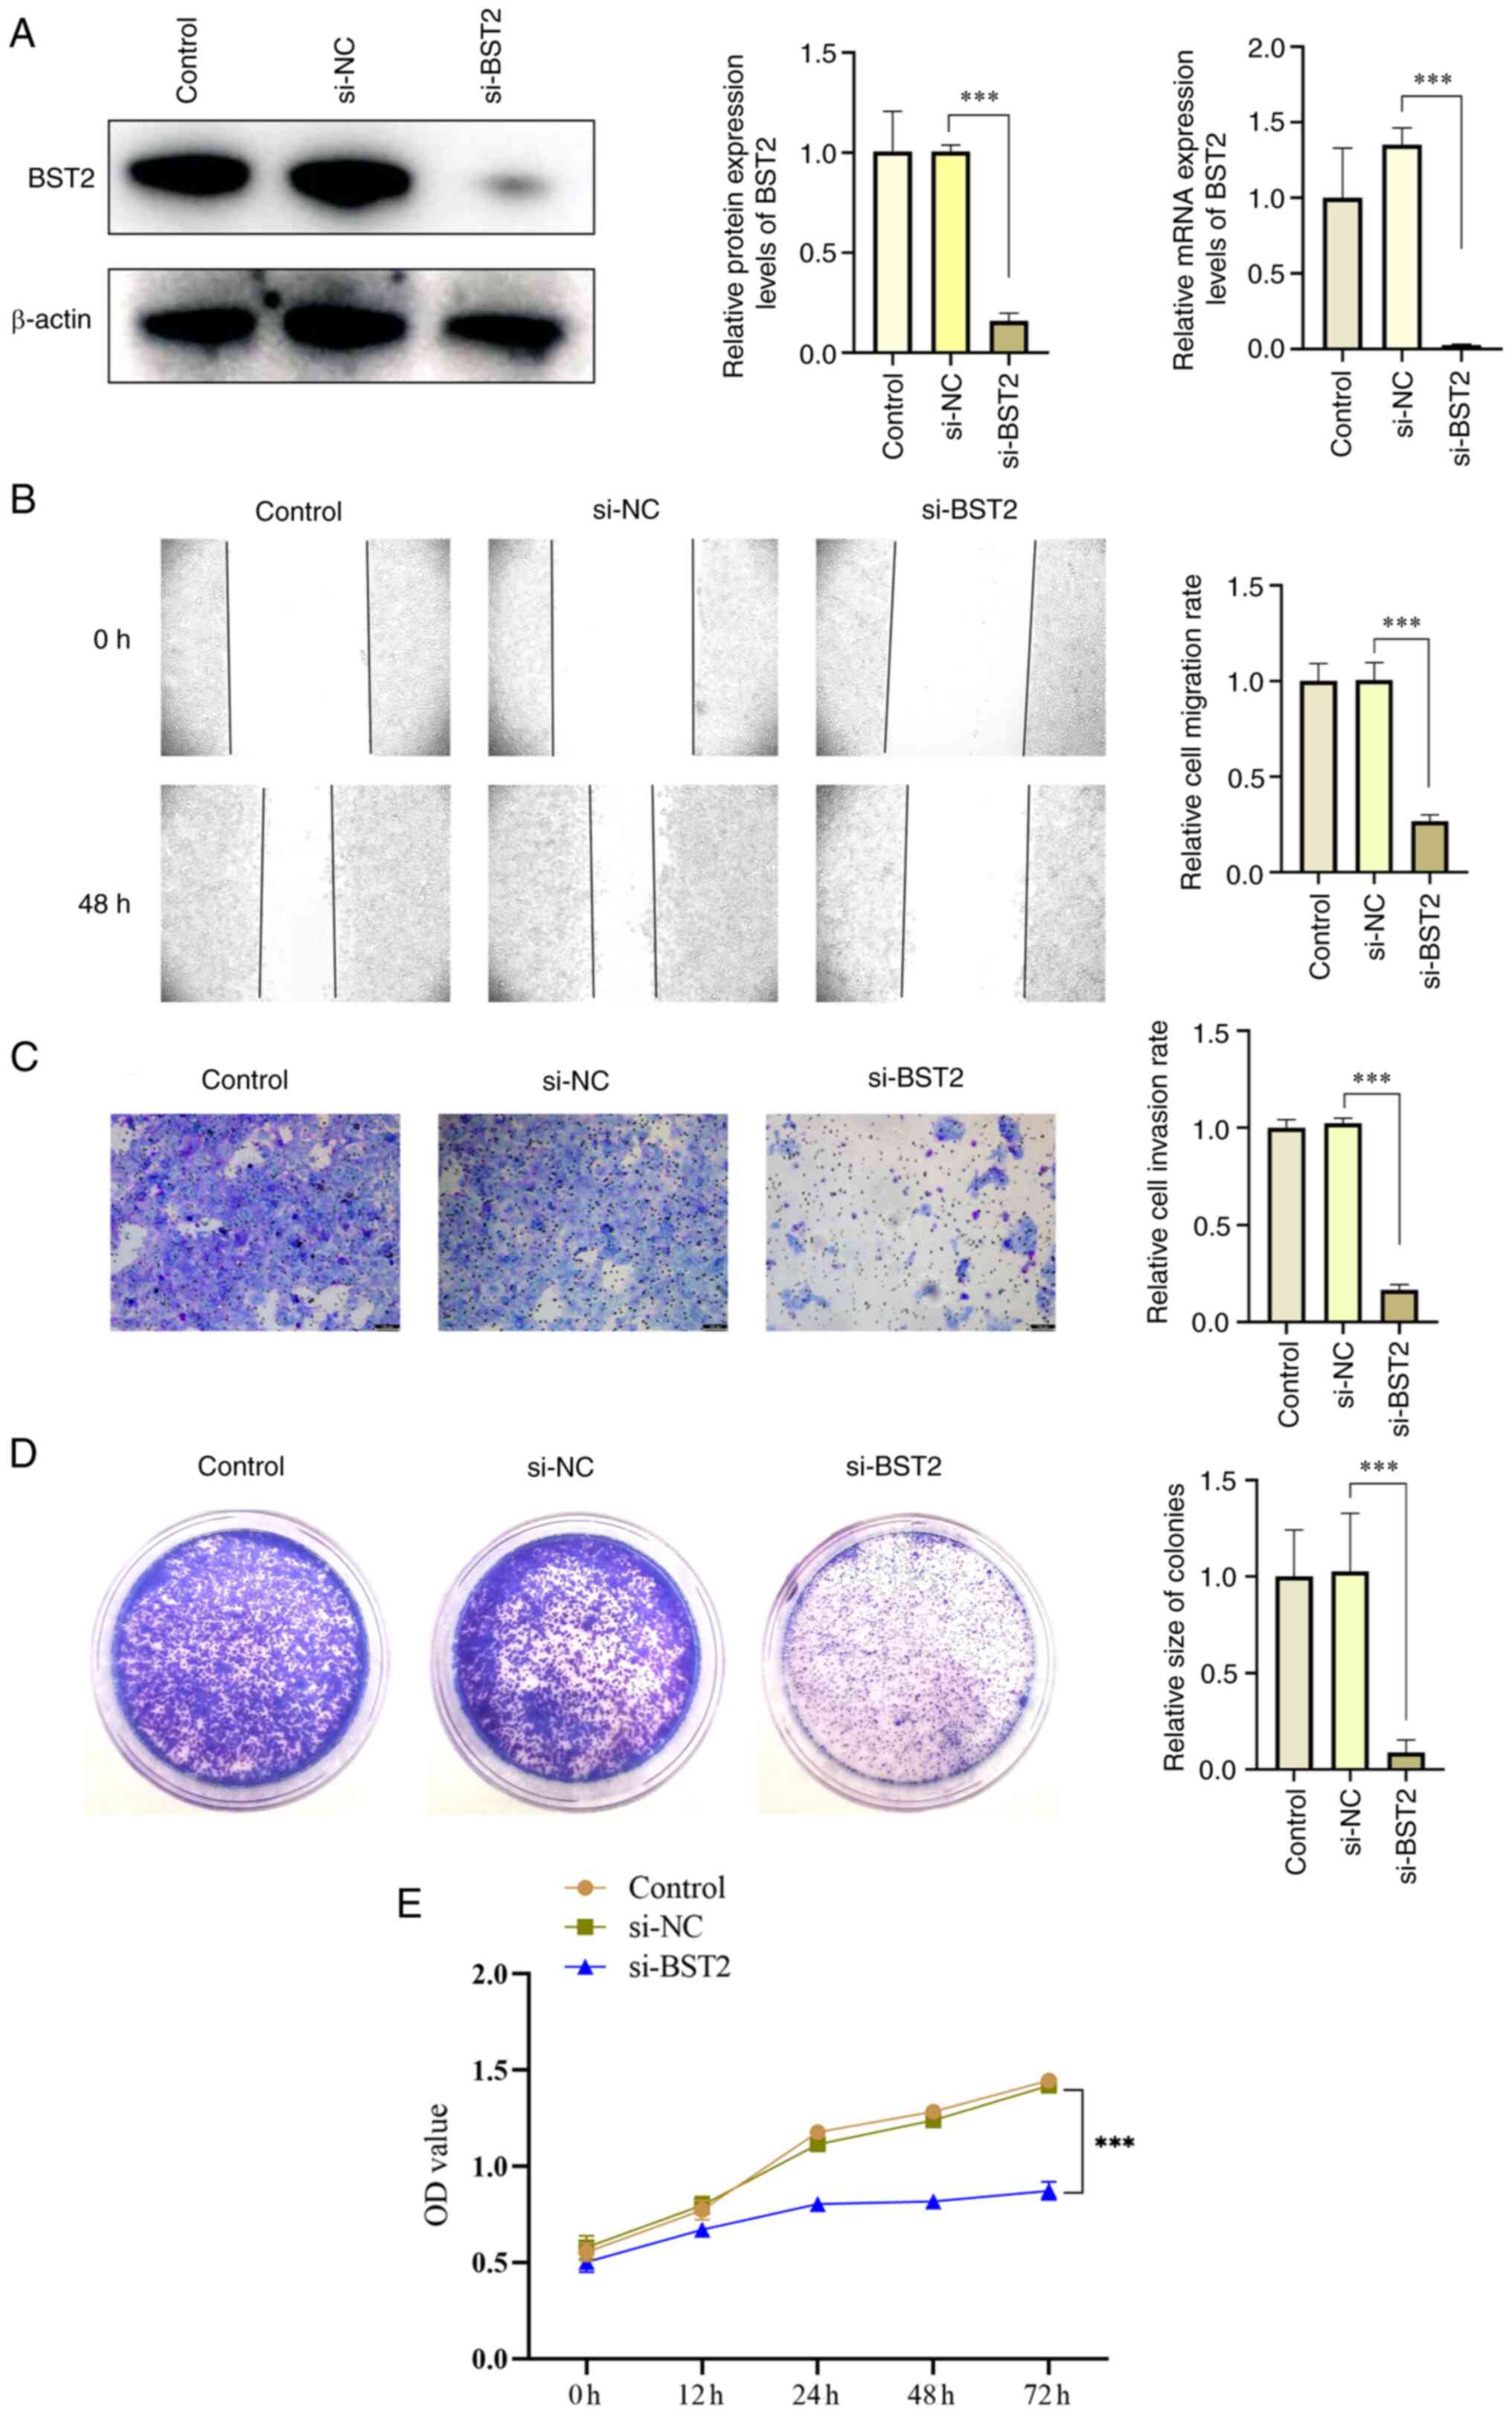
BST2 downregulation suppresses migration,
invasion, and proliferation of OSCC cells
SCC-15 cells were transfected with siRNA targeting
BST2, and the efficiency of BST2 gene downregulation was evaluated
using western blotting and RT-qPCR, which demonstrated a
significant downregulation efficiency (Fig. 2A). Furthermore, scratch test
assays, Transwell cell invasion assays and clone formation assays
were used to evaluate changes in the biological behavior after BST2
downregulation. The results demonstrated that the migration,
invasion and proliferation ability of SCC-15 cells was
significantly decreased after BST2 downregulation (Fig. 2B-E).
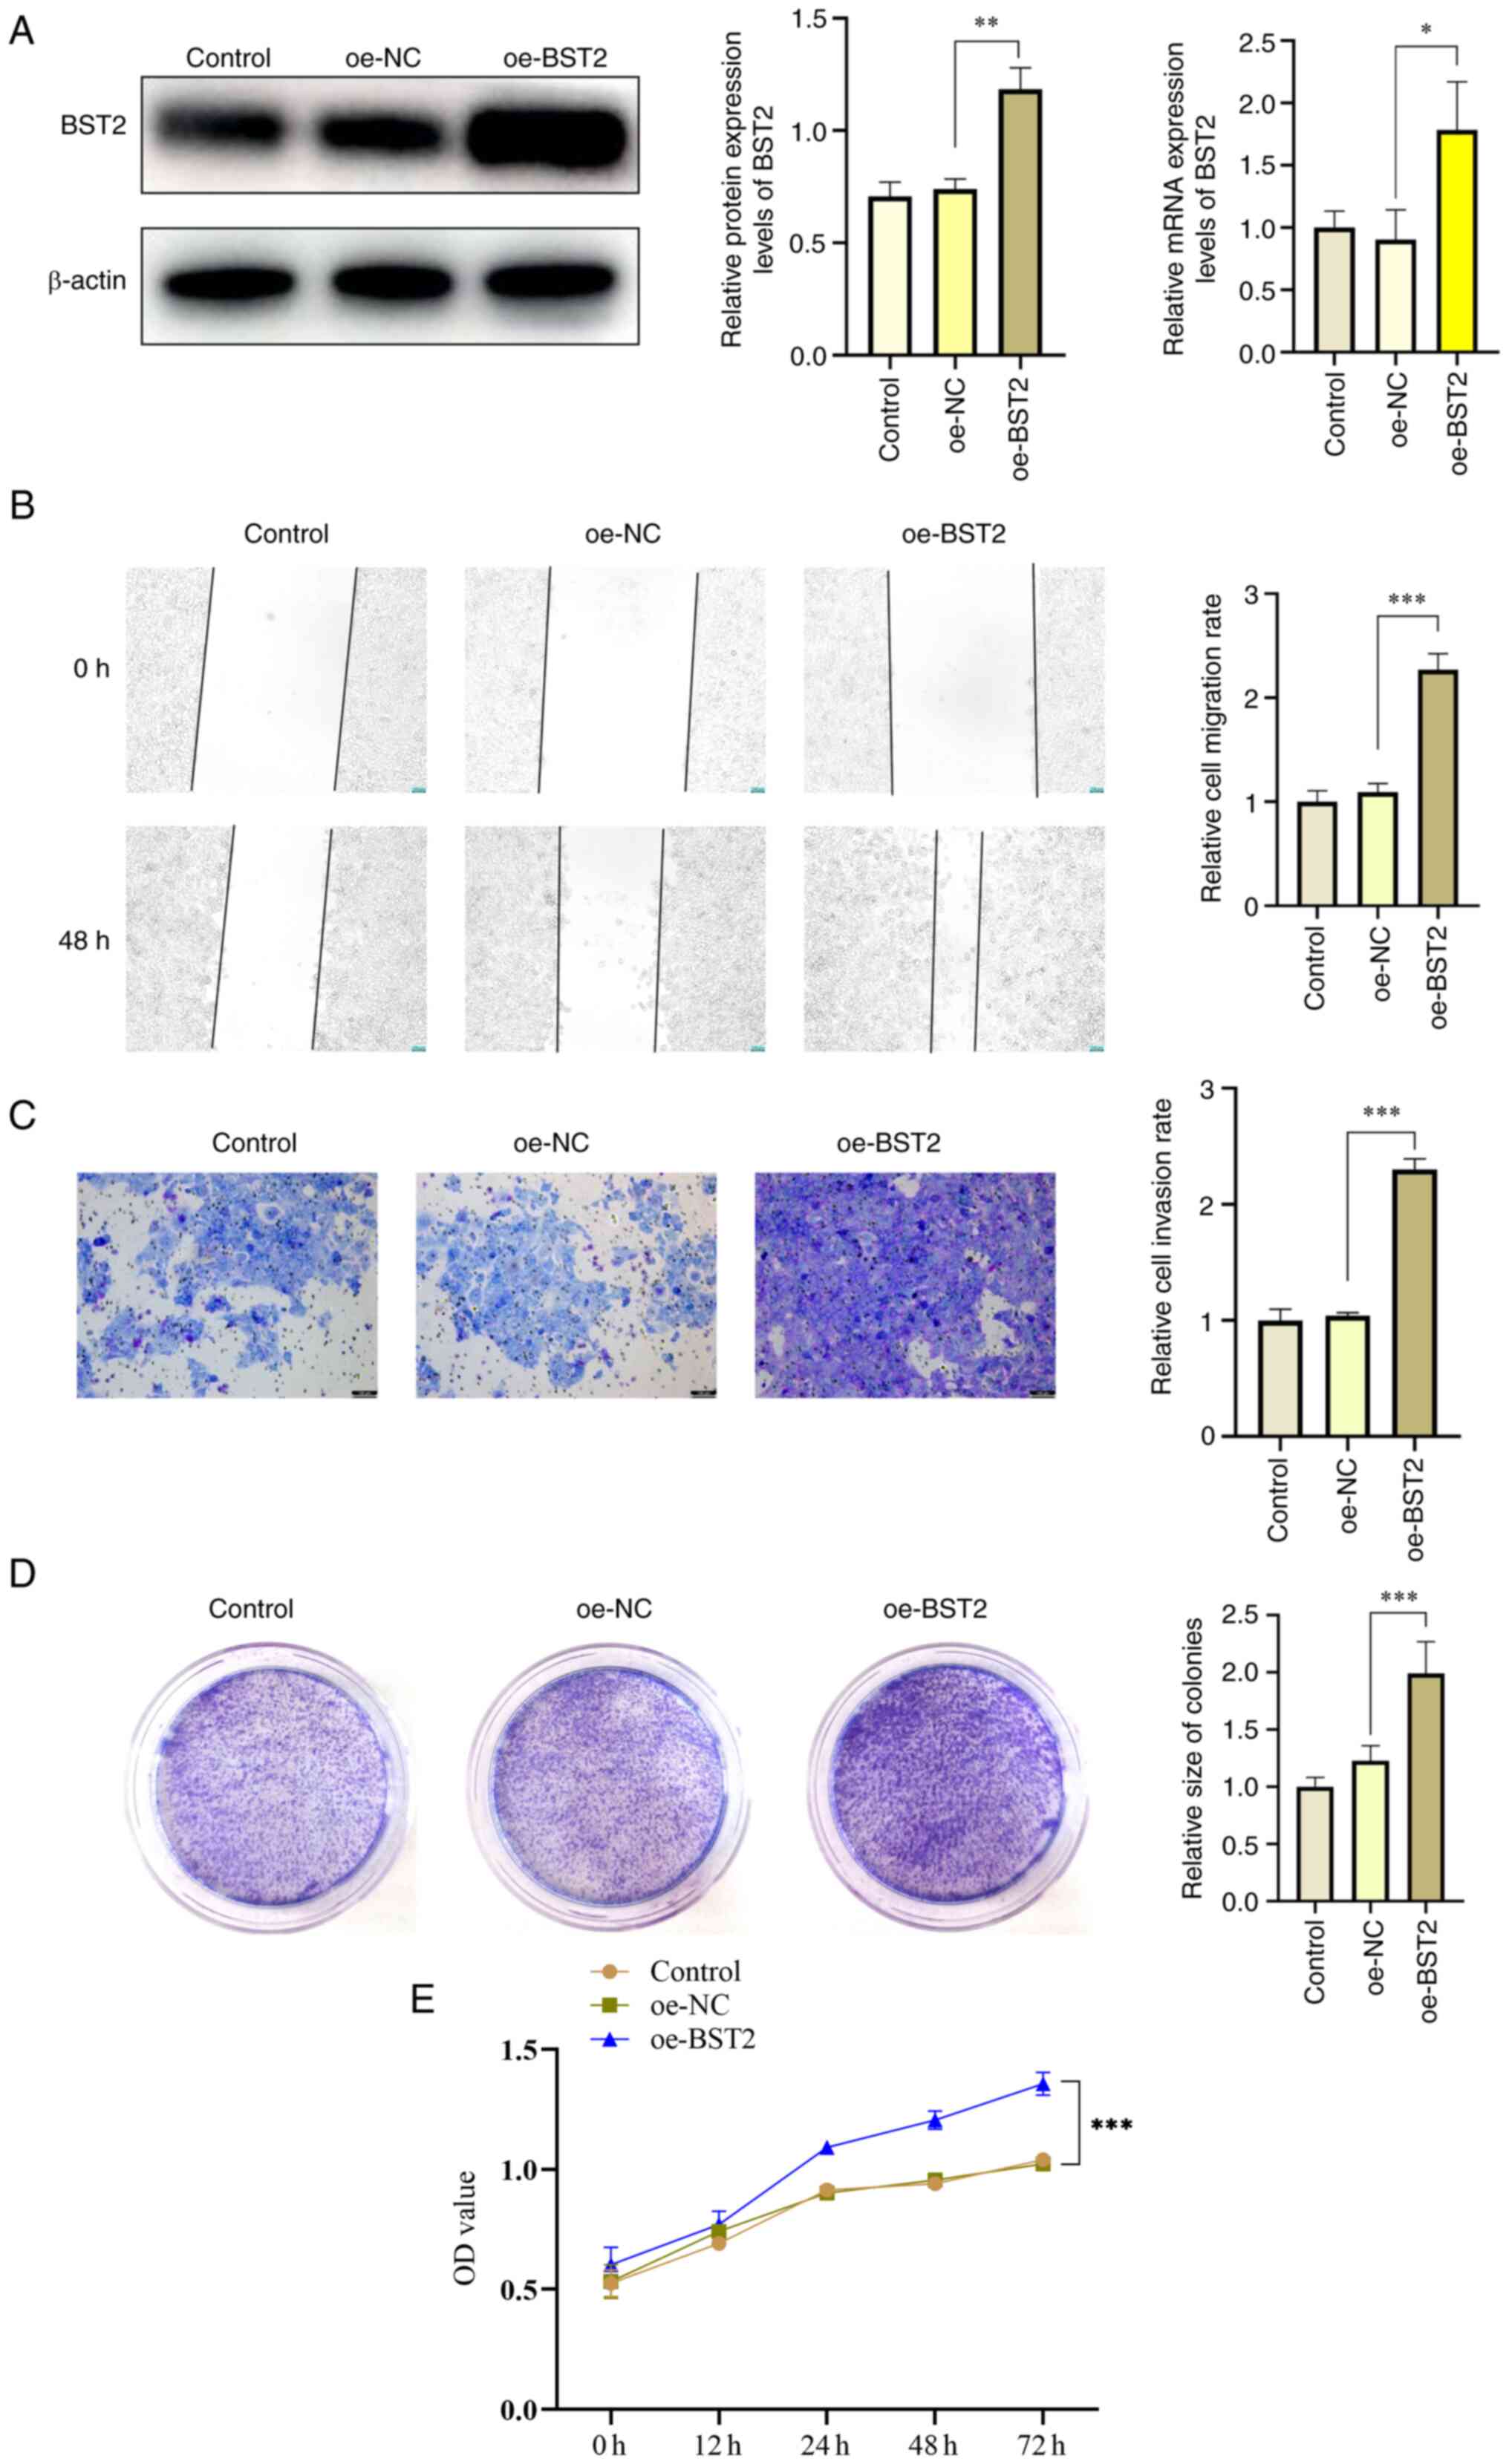
BST2 overexpression increases migration,
invasion, and proliferation of OSCC cells
To further evaluate the role of BST2 in OSCC, a BST2
overexpression plasmid was constructed and the effects of BST2
overexpression on the migration, invasion and proliferation of OSCC
were assessed. Western blotting and RT-qPCR were used to verify the
overexpression efficiency, which demonstrated significant
overexpression of BST2 (Fig. 3A).
Moreover, it was demonstrated that the proliferation ability of
OSCC was significantly increased after overexpression of BST2 via
scratch test assays, Transwell cell invasion assays and clone
formation assay (Fig. 3B-E). These
data suggest that BST2 serves a role in promoting tumor growth in
OSCC.
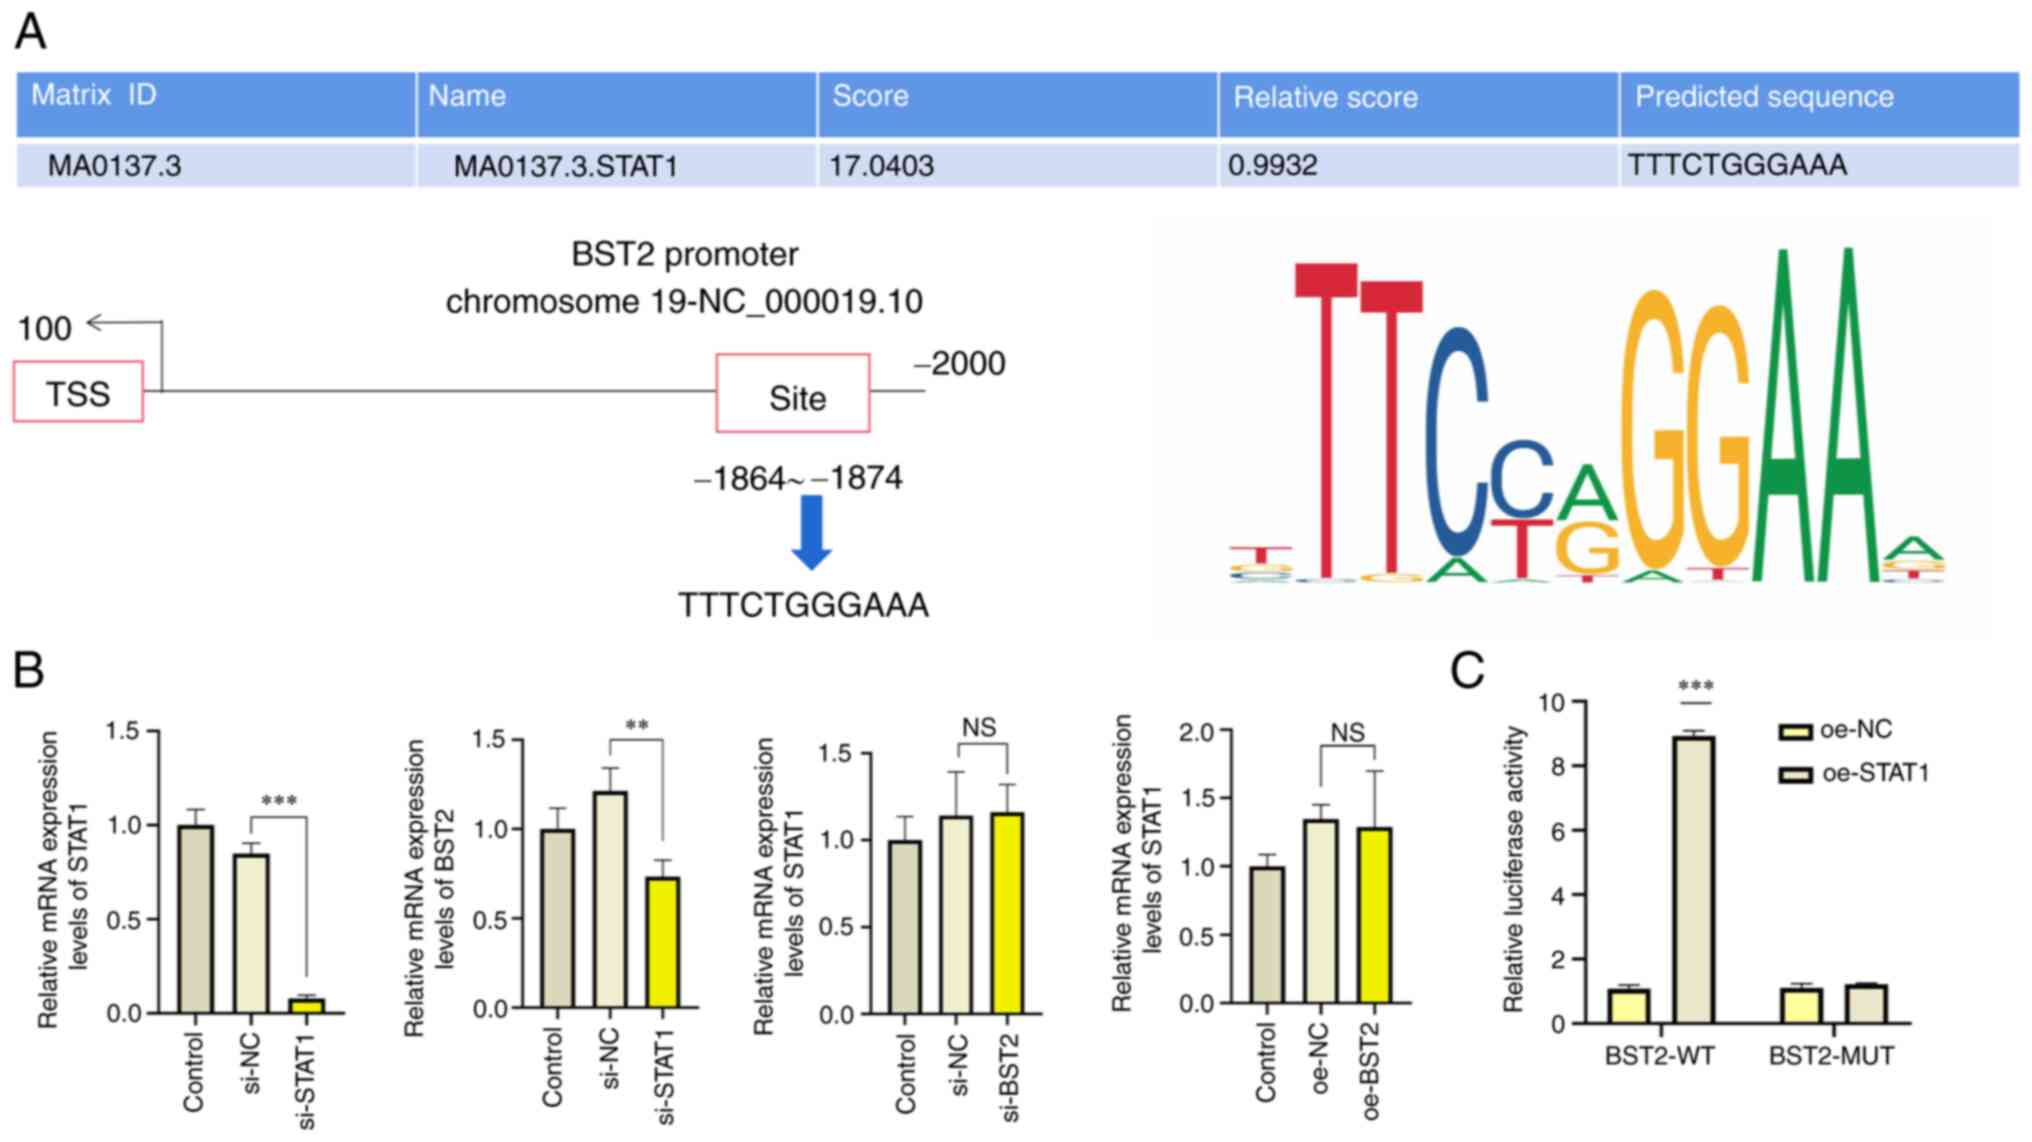
STAT1 binds to the BST2 promoter to
activate BST2 expression in OSCC
Proteomics databases, including the JASPAR and UCSC
databases, were used to predict the binding sites between STAT1 and
BST2 (Fig. 4A). In SCC-15 cells
transfected with si-STAT1, the mRNA expression levels of STAT1 and
BST2 were significantly downregulated compared with si-NC groups
(Fig. 4B). However, after
overexpression or downregulation of BST2, STAT1 mRNA levels were
not significantly different compared with the control group.
Furthermore, results of the dual-luciferase reporter assay
demonstrated that relative luciferase activity was significantly
increased in SCC-15 cells co-transfected with BST2-WT promoter
reporter and oe-STAT1 compared with the BST2-WT promoter reporter
and oe-NC (Fig. 4C). Which
suggested that the transcription factor STAT1 may regulate BST2 in
OSCC. These data demonstrated, for the first time using the
dual-luciferase reporter assay, that STAT1 could regulate BST2
through regulation of its specific promoter sequence.
STAT1 is upregulated in HNSC and OSCC
cell lines
The GEPIA database was used to analyze STAT1
expression in a panel of cancers. The expression level of STAT1 in
HNSC was markedly higher compared with other tumor types (Fig. 5A). The linkedomics database was
used to perform KEGG analysis on STAT1, which demonstrated that
STAT1 was enriched in immune-related pathways. In previous studies,
bioinformatics analysis of BST2 has focused on immunity (41), which has resulted in BST2 being
poorly studied in tumors, this may be one of the reasons limiting
studies on STAT1 in OSCC. (Fig.
5C). STAT1 expression was significantly increased in OSCC
(Fig. 5B). Western blotting and
RT-qPCR were used to assess STAT1 protein and mRNA expression
levels, respectively, in SCC-15, SCC-25 and CAL-27 OSCC cell lines
(Fig. 5D). The above
bioinformatics analysis indicated that both STAT1 and BST2 were
highly expressed in OSCC and suggested that there may be a
functional relationship between STAT1 and BST2 in OSCC.
STAT1 positively regulates
BST2/AKT/ERK1/2 pathway facilitates migration, invasion, and
proliferation of OSCC cells
To further assess the relationship between STAT1 and
BST2 and to elucidate the downstream pathways involved, si-RNA was
used to down-regulate STAT1 and BST2 expression and overexpression
plasmids were used to up-regulate BST2 expression. Western blotting
demonstrated that BST2 protein expression levels decreased
significantly following si-RNA downregulation of STAT1, whereas
STAT1 phosphorylation and STAT1 protein expression levels did not
significantly change after overexpression or silencing of BST2
(Fig. 6A). This further indicated
that STAT1 regulated BST2 expression in OSCC. Moreover, the
downstream pathway of BST2 was evaluated. Western blotting
demonstrated that the activity of the AKT/ERK1/2 signaling pathway
significantly increased when BST2 was up-regulated and
significantly decreased when BST2 was down-regulated. When STAT1
was silenced, the BST2/AKT/ERK1/2 signaling pathway was also
down-regulated (Fig. 6A). This
indicated that BST2 activated the AKT/ERK1/2 signaling pathway in
OSCC.
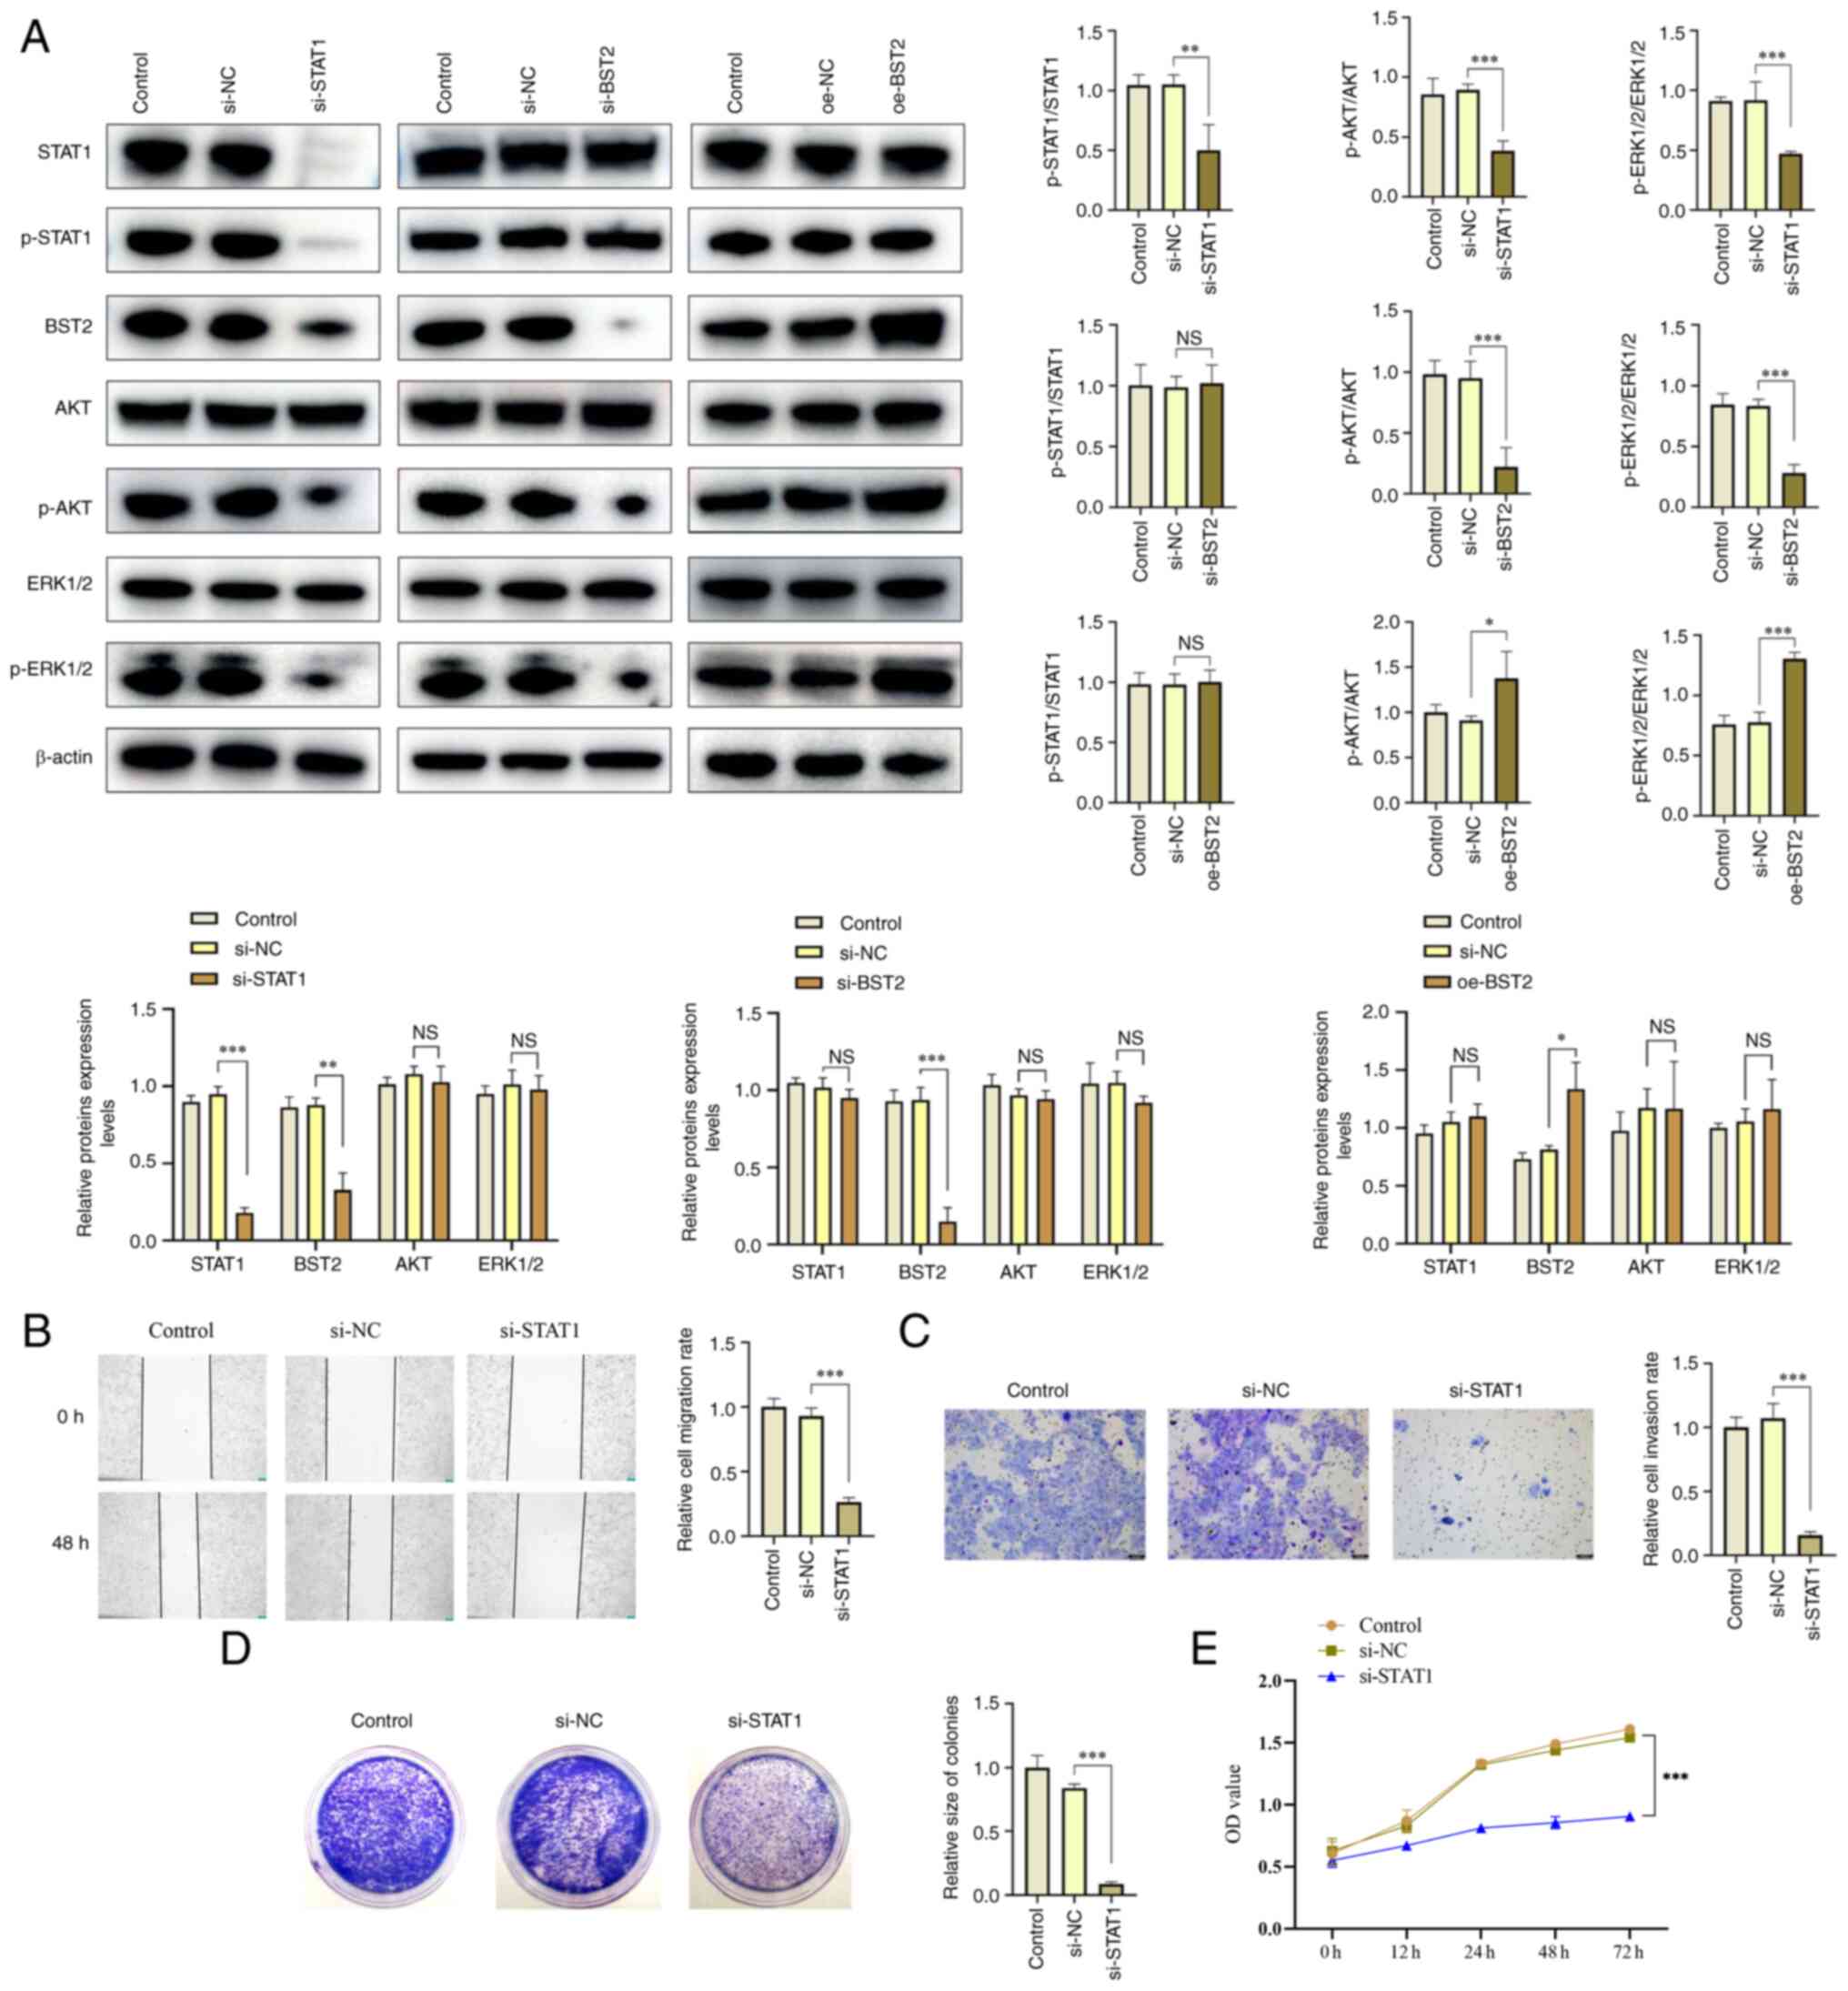 | Figure 6STAT1 positively regulates
BST2/AKT/ERK1/2 and biological behavior of OSCC. (A) Western
blotting analysis of the protein expression levels of STAT1, BST2,
AKT and ERK1/2 and the extent of AKT and ERK1/2 phosphorylation
after using si-RNA or oe plasmid to regulate STAT1 or BST2 in
SCC-15 cells. (B) Cell scratch test assay (magnification, ×50), and
(C) Transwell assay (magnification, ×100) were used to assess the
migration and invasion ability of SCC-15 cells after STAT1
downregulation. (D) Clone formation and (E) cell proliferation
assays were performed to assess changes in the viability and
proliferation of SCC-15 cells after STAT1 downregulation.
*P<0.05, **P<0.01 and
***P<0.001. BST2, bone marrow stromal antigen 2; si,
small interfering; oe, overexpression; NC, negative control; p,
phosphorylated; NS, not significant. |
Similarly, scratch test assays, Transwell cell
invasion assays and clone formation assays were used to assess the
effects of STAT1 on migration, invasion and proliferation of OSCC
cells. The results demonstrated that the proliferation, migration
and invasion of si-STAT1 OSCC cells was significantly decreased
compared with si-NC OSCC cells (Fig.
6B-E). These data suggested that STAT1 and BST2 serve a
synergistic role in OSCC.
STAT1 and BST2 serve a synergistic role
in the biological behavior of OSCC
si-RNA and plasmids were used to co-transfect SCC-15
cells to further evaluate the relationship between STAT1 and BST2,
and the AKT/ERK1/2 signaling pathway. Compared with the si-NC
group, the BST2/AKT/ERK1/2 signaling pathway was markedly inhibited
after down-regulation of STAT1. However, when BST2 was upregulated
simultaneously with STAT1 downregulation, the activation of the
BST2/AKT/ERK1/2 signaling pathway was rescued (Fig. 7A). Furthermore, similar results
were demonstrated in the cell scratch test assay, Transwell assay
and proliferation assay, namely that the inhibitory effects of
si-STAT1 on the biological behavior of OSCCs were reversed by
overexpression of BST2 (Fig.
7B-D).
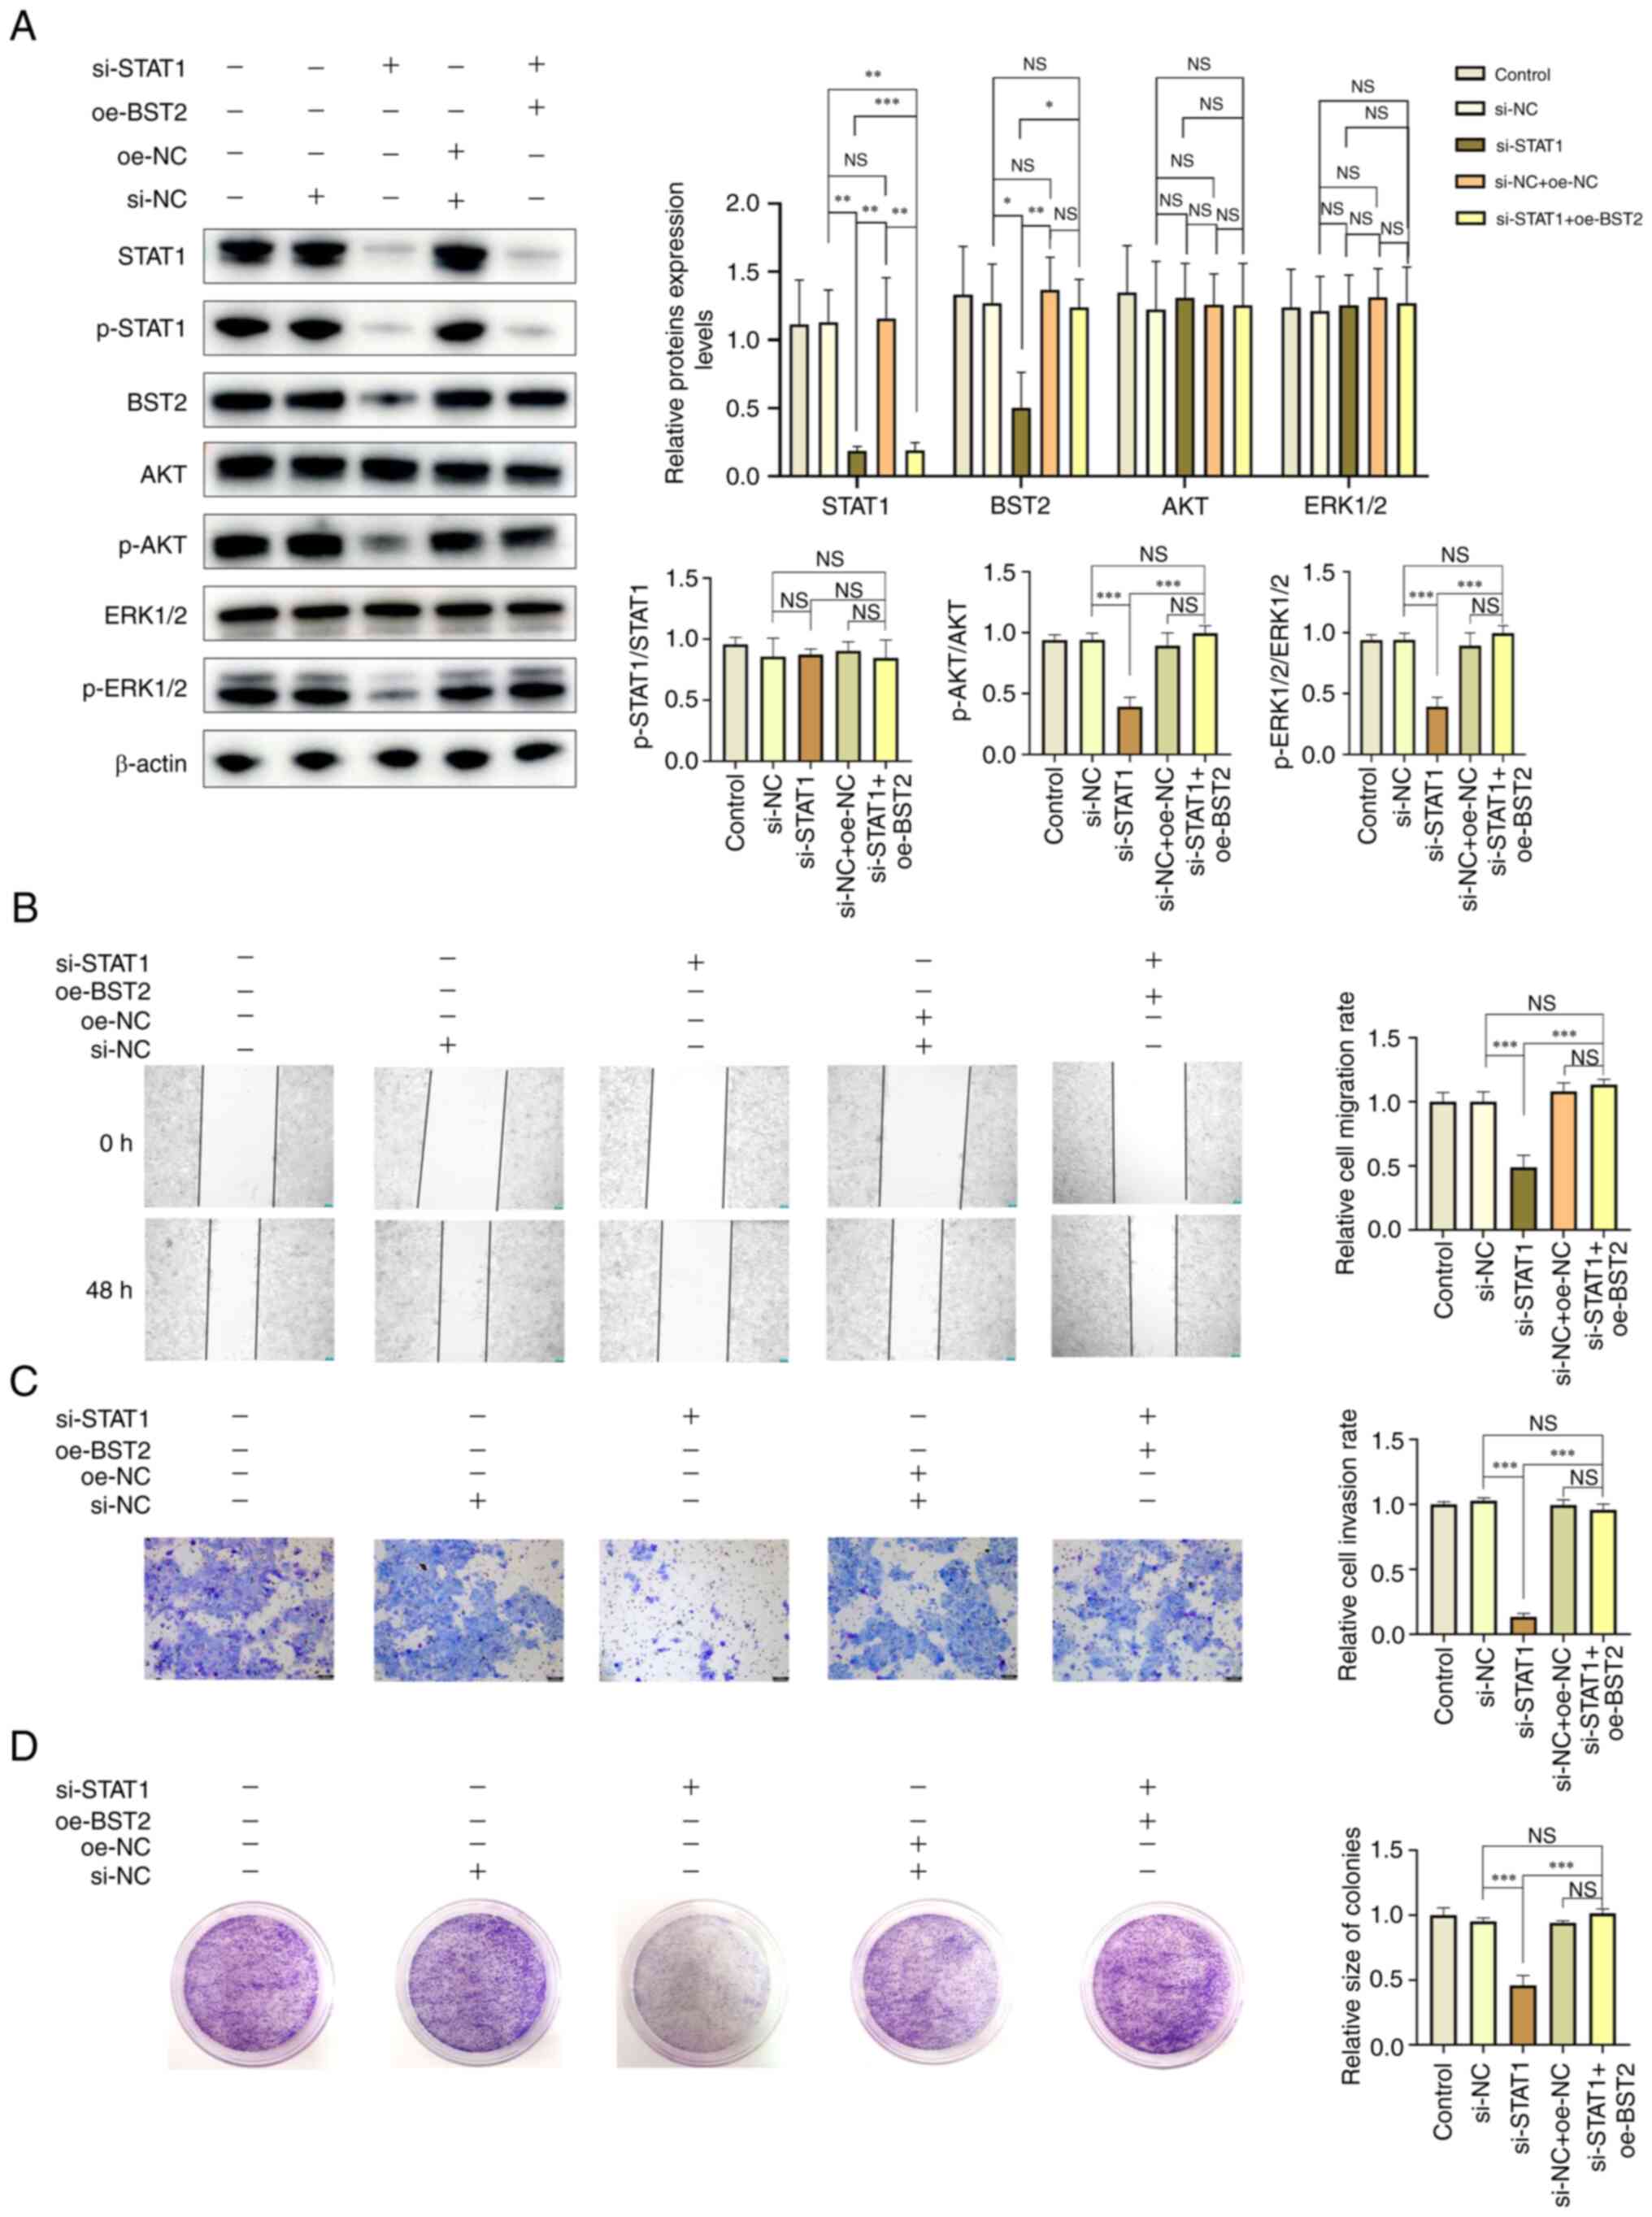 | Figure 7STAT1 and BST2 serve a synergistic
role in the biological behavior of oral squamous cell carcinoma.
(A) Western blotting analysis of the protein expression levels of
STAT1, BST2, AKT, ERK1/2 and the extent of AKT and ERK1/2
phosphorylation after using si-RNA or oe plasmid to regulate STAT1
or BST2 in SCC-15 cells. (B) Cell scratch test assay
(magnification, ×50), (C) Transwell assay (magnification, ×100) and
(D) clone formation assay were used to assess the migration,
invasion and proliferation of SCC-15 cells after using si-RNA or oe
plasmid to regulate STAT1 or BST2. *P<0.05,
**P<0.01 and ***P<0.001. BST2, bone
marrow stromal antigen 2; si, small interfering; oe,
overexpression; NC, negative control; p, phosphorylated; NS, not
significant. |
STAT1 knockdown suppresses proliferation
of OSCC via inhibition of the AKT/ERK1/2 signaling pathway in
vivo
SCC-15 cells were transfected with si-STAT1or si-NC
virus, screened to generate stable clones, and used to construct
CDX models using 5-week-old Balb/C nude mice. Excised tumors and
tumor growth curves were presented (Fig. 8A). The weight gain and the slope of
the growth curve in the si-STAT1 group were greater than those in
the si-NC group (Fig. 8A), which
indicated that the quality of life of the mice was improved after
silencing si-STAT1. Western blotting and RT-qPCR were used to
assess the expression of STAT1, BST2, and AKT/ERK1/2 in
vivo. The protein expression levels of STAT1 and BST2, and the
extent of AKT, ERK1/2 and STAT1 phosphorylation were markedly
inhibited in the si-STAT1 group compared with the si-NC group
(tumors from three representative mice were selected from each
group) (Fig. 8B). Furthermore,
H&E and IHC staining were performed on the tumor tissues
collected from the CDX Model. The data demonstrated that an OSCC
model was constructed. In the IHC experiment, the expressions of
STAT1, P-STAT1 and BST2 were decreased significantly (Fig. 8C). Which was further demonstrated
by the western blotting and RT-qPCR results (Fig. 8D). At the end of the experiment,
the lungs and livers of the mice were collected for H&E
staining. However, H&E staining demonstrated no metastasis in
any of the three groups (S1). It
was hypothesized that the period of the animal experiment was too
short for the tumors to reach the point of metastasis; however, as
the tumors grew in the mice, the tumors reduced the mice's quality
of life. Therefore, it was necessary to terminate the experiment at
the point chosen and euthanize the mice to avoid excessive tumor
growth affecting the quality of life of mice. As all animals were
euthanized at the same time, there were no survival curves. One of
the mice in the control and si-NC groups was euthanized early due
to necrosis and subsequently excluded from analysis; therefore, n=7
in Control and si-NC groups and n=8 in the si-STAT1 group.
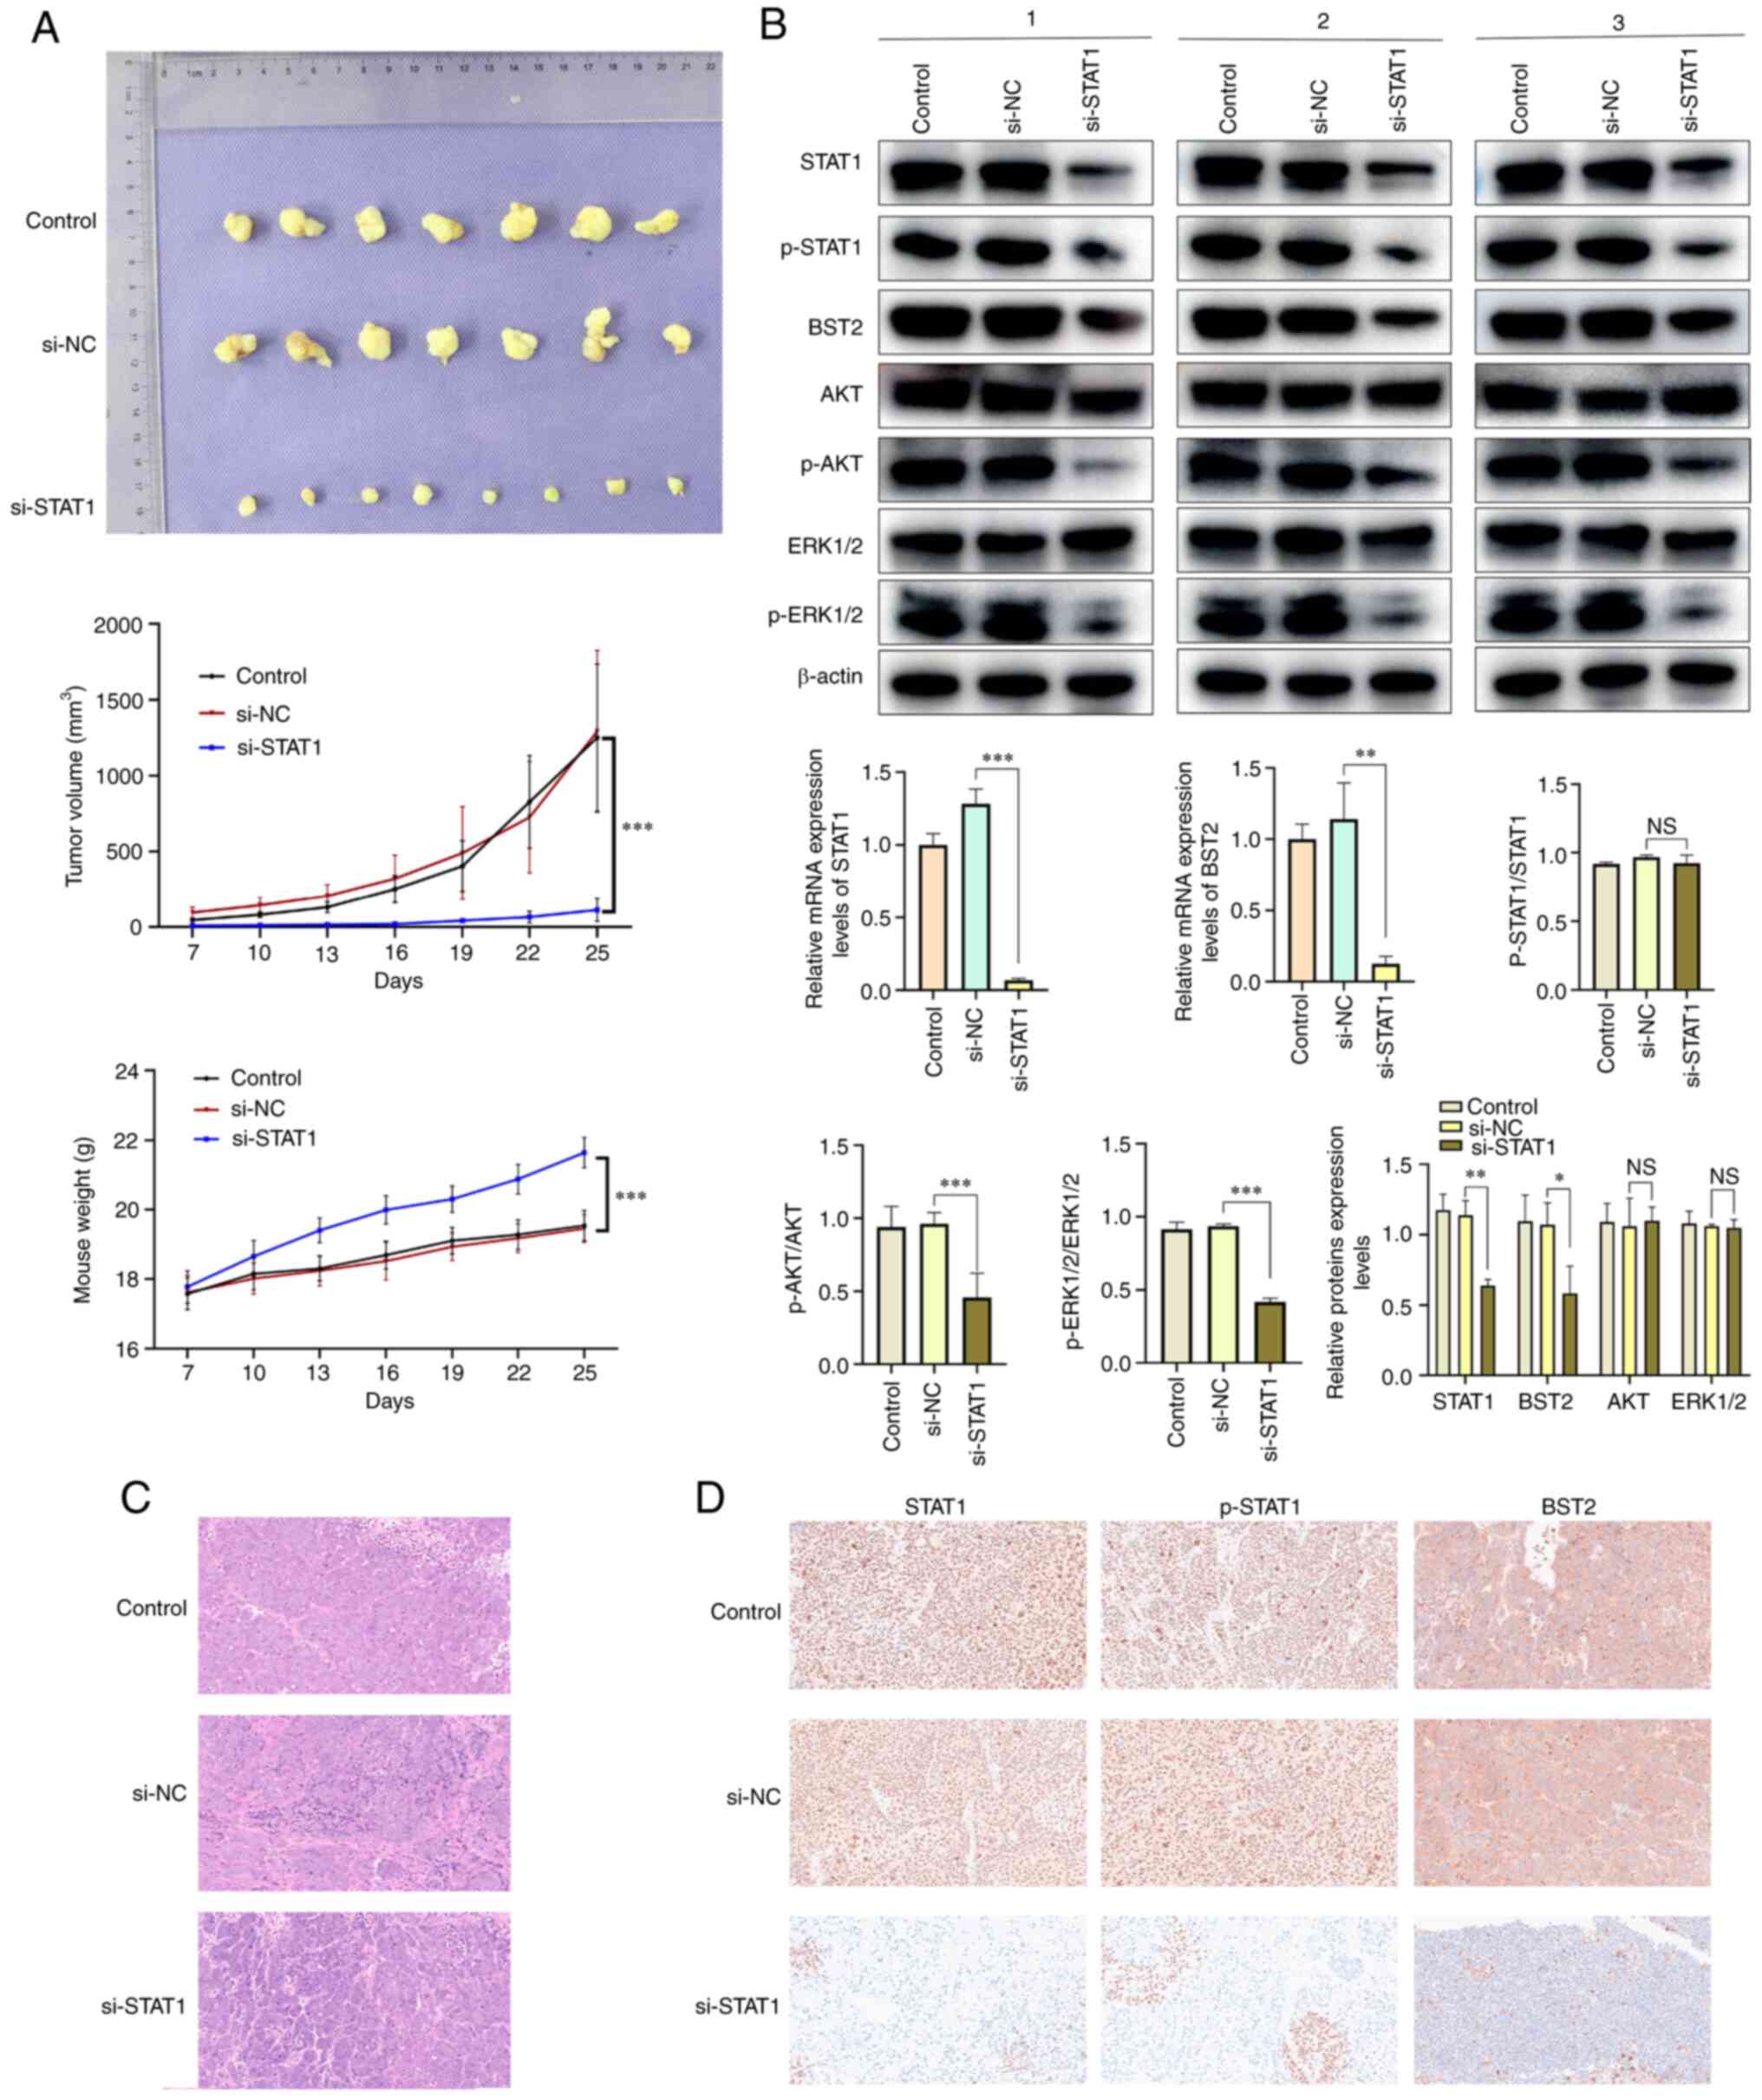 | Figure 8(A) Photograph of tumors excised from
mice, growth curve of subcutaneous tumor volume, and the weight of
mice. (B) The protein expression levels of STAT1, BST2, AKT and
ERK1/2 and the extent of STAT1, AKT and ERK1/2 phosphorylation in
vivo after downregulation of STAT1 (n=3 selected from each group)
and mRNA expression levels of STAT1 and BST2. Representative images
of (C) hematoxylin and eosin and (D) immunohistochemical staining
for STAT1, p-STAT1 and BST2 of oral squamous cell carcinoma tumor
samples (magnification, ×200). *P<0.05,
**P<0.01 and ***P<0.001. BST2, bone
marrow stromal antigen 2; si, small interfering; oe,
overexpression; NC, negative control; p, phosphorylated; NS, not
significant. |
Discussion
OSCC is a malignant tumor with high morbidity and
mortality and is a threat to human health (16). OSCC often involves the tongue and
lips, and can easily spread to other organs, including the lungs
and lymph nodes (17-19). The lack of specific detection of
OSCC tumor boundaries makes it difficult to determine the extent of
disease at the time of treatment and often adversely affects a
patient's appearance and quality of life after surgery (20). Although multi-disciplinary therapy,
conservation of function surgery and reconstruction of function
surgery treatments are available, patients are often at risk of
disfigurement and disease recurrence (21,22).
Therefore, finding new tumor markers and novel treatment methods
for OSCC is very important (23,24).
The present study demonstrated that BST2 was highly
expressed in tumors. BST2 is best characterized as an antiviral
protein (25), but its role in
cancer cannot be ignored. BST2 can act as a tumor-promoting factor
in breast cancer (26), but
evidence for the role of BST2 in OSCC is lacking. Therefore, the
present study was performed to evaluate the role of BST2 as a
potential biomarker or therapeutic target in OSCC.
The present study demonstrated that the
downregulation of BST2 mRNA and protein expression levels
significantly reduced the cell viability, migration, invasion and
proliferation of OSCC cells. Increasing the mRNA and protein
expression levels of BST2 in OSCC cells significantly increased
cell viability, migration, invasion and proliferation. These data
indicated that high expression of BST2 has a pro-tumor role in
OSCC. Using online tools, it was transcription factors that might
regulate BST2 were predicted and it was demonstrated that STAT1
could act as a transcription factor, which bound to a specific
sequence in the BST2 promoter region. This prediction was verified
using a dual-luciferase reporter assay and led to the evaluation of
the role of STAT1 in OSCC.
Members of the STAT family of transcription factors
form dimers that translocate from the cytoplasm to the nucleus to
act as transcriptional activators, under the stimulation of
cytokines and growth factors, such as interferons epidermal growth
factor, PDGF and IL6 (27). STAT1,
like other STAT family members, dimerizes upon IFN stimulation and
translocates to the nucleus where it acts as a transcription factor
(28). STAT1 has previously,
mainly been studied in breast cancer (29). In breast cancer, STAT1 can be
activated by numerous receptors, and it enhances the metastasis,
invasion and proliferation of breast cancer cells (30). In the present study, STAT1 was
highly expressed in OSCC and acted on the promoter region of BST2
to regulate BST2 expression. Furthermore, the protein and mRNA
expression levels of STAT1 were downregulated in OSCC, which
demonstrated that knockdown of STAT1 reduced the migration,
invasion and proliferation of OSCC cells. The pathways which
mediated the interaction between STAT1 and BST2 in OSCC were
evaluated.
The AKT/ERK1/2 signaling pathway is vital for cell
survival and apoptosis. AKT serves a key role in cell metabolism,
apoptosis, cell proliferation and cell migration (31). Furthermore, ERK is activated by
phosphorylation and translocated from the cytoplasm to the nucleus,
where it mediates the transcriptional activation of upstream
factors, and participates in cellular functions, including
proliferation, cytoskeleton construction and apoptosis (32). The present study evaluated the
signaling pathway through which STAT1/BST2 regulates the biological
behavior of OSCC, and demonstrated that STAT1/BST2 acts via the
AKT/ERK1/2 signaling pathway. When BST2 and STAT1 expression were
altered, corresponding changes were seen in the AKT/ERK1/2
signaling pathway.
To further evaluate the STAT1/BST2/AKT/ERK1/2
signaling pathway, BST2 was overexpressed simultaneously with
downregulation of STAT1. When STAT1 was down-regulated, the
migration, invasion and proliferation of OSCC cells was
significantly decreased. However, simultaneous overexpression of
BST2 and STAT1 knockdown restored the AKT/ERK1/2 signaling pathway,
and the reduction of OSCC migration, invasion, and proliferation
caused by down-regulation of STAT1 was reversed by BST2
overexpression.
To evaluate the role of the STAT1/BST2/AKT/ERK1/2
signaling pathway in OSCC in vivo, a CDX model was
established using athymic nude mice. The CDX model demonstrated
that the growth of tumors in the si-STAT1 group was significantly
lower than those in the Control and si-NC groups. This further
demonstrated the important role of STAT1/BST2 in OSCC.
Unfortunately, regarding the regulation of the BST2
promoter region by STAT1, while three sequences with high scores
were predicted, only one sequence was verified. Therefore, while it
was demonstrated that STAT1 can regulate BST2 through the sequence
which was assessed, it was not assessed whether the other promoter
sequences in the BST2 promoter region could regulate BST2.
Therefore, the present study did not demonstrate whether STAT1 can
only regulate BST2 through the sequence assessed in the present
study. However, this was sufficient to demonstrate that STAT1 can
regulate BST2 by regulating its promoter region. Moreover,
co-immunoprecipitation experiments were not performed to assess the
correlation between STAT1 and BST2 at the protein level, which will
need to assessed in future experiments.
Furthermore, it was hypothesized that STAT1 and BST2
are highly expressed in certain cancers where the local immune
system where the tumor forms is damaged and, the tumor tissue forms
tumor microenvironment with an altered immune system independent of
the external environment. Since tumor cells are attacked by the
body's immune system, the immune system within tumor tissue may be
more active than that of normal tumor tissue (33). This may be a reason why the
expression levels of the immune-related proteins STAT1 and BST2 are
higher in OSCC than in normal tissues (34-37).
Further in-depth research on STAT1 and BST2 in tumor immunity is
required.
Few studies have previously reported on role BST2
serves in OSCC. In the present study, STAT1 was identified as an
upstream target that controls BST2 expression in OSCC. Furthermore,
STAT1 regulated BST2 through the TTT CTG GGA AA sequence to promote
the metastasis, invasion and proliferation capability of OSCC.
STAT1 is commonly studied in the JAK signaling pathway (38,39);
however, the present study demonstrated that STAT1 regulated
AKT/ERK signaling by regulating BST2. To the best of our knowledge,
the present study is the first to report this finding. STAT1
(40) and BST2 (41) have previously been studied mainly
as interferon-stimulated genes.
The present study demonstrated that BST2 is
abnormally expressed in OSCC, but the role of BST2 in OSCC has not
been elucidated. Given the abnormal expression of BST2 in OSCC, the
present study evaluated the regulation of BST2, determined that
STAT1 is a transcription factor that influences BST2 expression,
and identified the signaling pathway through which STAT1/BST2
affects the biological behavior of OSCC.
In summary, the present study demonstrated the roles
of STAT1 and BST2 in OSCC. Moreover, it was demonstrated that BST2
was regulated by the transcription factor STAT1 and could promote
OSCC metastasis, invasion and proliferation via activation of the
AKT/ERK1/2 signaling pathway. Immune-related STAT1/BST2 serves an
important role in the survival of OSCC. We believe that in the
future, we will have a better understanding of the role of the
STAT1 and BST2 genes in tumors. Moreover, the combination of this
signaling pathway and immunotherapy could become a new target for
the treatment of OSCC.
Supplementary Data
Availability of data and materials
The datasets used and/or analyzed during the current
study are available from the corresponding author on reasonable
request.
Authors' contributions
FS, XW and GC were responsible for conception and
design. FS and SS were responsible for analysis and interpretation
of the data FS drafted the manuscript. XW and GC revised the
manuscript critically for intellectual content. FS, XW and GC
confirm the authenticity of all the raw data. All authors read and
approved the final version of manuscript.
Ethics approval and consent to
participate
The overall duration of the animal experiments was
35 days. All animal studies were approved by the Tianjin Institute
of Environmental and Operational Medicine Experimental Animal
Ethics Committee (approval no. IACUC of AMMS-04-2022-018).
Patient consent for publication
Not applicable.
Competing interests
The authors declare that they have no competing
interests.
Acknowledgments
We are grateful to Professor Xinxing Wang (Tianjin
Institute of Environmental and Operational Medicine) and Professor
Gang Chen (The School and Hospital of Stomatology, Tianjin Medical
University) for their help with the experiments in this study.
Funding
This work was supported by the National Natural Science
Foundation of China (grant nos. 31971106, BWS21L013, 21WS09002 and
JK20211A010213).
References
|
1
|
Sung H, Ferlay J, Siegel RL, Laversanne M,
Soerjomataram I, Jemal A and Bray F: Global cancer statistics 2020:
GLOBOCAN estimates of incidence and mortality worldwide for 36
cancers in 185 countries. CA Cancer J Clin. 71:209–249. 2021.
View Article : Google Scholar : PubMed/NCBI
|
|
2
|
Xia C, Dong X, Li H, Cao M, Sun D, He S,
Yang F, Yan X, Zhang S, Li N and Chen W: Cancer statistics in China
and United States, 2022: profiles, trends, and determinants. Chin
Med J (Engl). 135:584–590. 2022. View Article : Google Scholar : PubMed/NCBI
|
|
3
|
Sun Z, Sun X, Chen Z, Du J and Wu Y: Head
and neck squamous cell carcinoma: Risk factors, molecular
alterations, immunology and peptide vaccines. Int J Pept Res Ther.
28:192022. View Article : Google Scholar
|
|
4
|
Boldrup L, Coates PJ, Laurell G, Wilms T,
Fahraeus R and Nylander K: Downregulation of miRNA-424: A sign of
field cancerisation in clinically normal tongue adjacent to
squamous cell carcinoma. Br J Cancer. 112:1760–1765. 2015.
View Article : Google Scholar : PubMed/NCBI
|
|
5
|
Chow LQM: Head and Neck Cancer. N Engl J
Med. 382:60–72. 2020. View Article : Google Scholar : PubMed/NCBI
|
|
6
|
Gavrielatou N, Doumas S, Economopoulou P,
Foukas PG and Psyrri A: Biomarkers for immunotherapy response in
head and neck cancer. Cancer Treat Rev. 84:1019772020. View Article : Google Scholar : PubMed/NCBI
|
|
7
|
Horton JD, Knochelmann HM, Day TA, Paulos
CM and Neskey DM: Immune evasion by head and neck cancer:
Foundations for combination therapy. Trends Cancer. 5:208–232.
2019. View Article : Google Scholar : PubMed/NCBI
|
|
8
|
Fan T, Wang X, Zhang S, Deng P, Jiang Y,
Liang Y, Jie S, Wang Q, Li C, Tian G, et al: NUPR1 promotes the
proliferation and metastasis of oral squamous cell carcinoma cells
by activating TFE3-dependent autophagy. Signal Transduct Target
Ther. 7:1302022. View Article : Google Scholar : PubMed/NCBI
|
|
9
|
Kuang CM, Fu X, Hua YJ, Shuai WD, Ye ZH,
Li Y, Peng QH, Li YZ, Chen S, Qian CN, et al: BST2 confers
cisplatin resistance via NF-κB signaling in nasopharyngeal cancer.
Cell Death Dis. 8:e28742017. View Article : Google Scholar
|
|
10
|
Presle A, Frémont S, Salles A, Commere PH,
Sassoon N, Berlioz-Torrent C, Gupta-Rossi N and Echard A: The viral
restriction factor tetherin/BST2 tethers cytokinetic midbody
remnants to the cell surface. Curr Biol. 31:2203–2213.e5. 2021.
View Article : Google Scholar : PubMed/NCBI
|
|
11
|
Pan XB, Qu XW, Jiang D, Zhao XL, Han JC
and Wei L: BST2/Tetherin inhibits hepatitis C virus production in
human hepatoma cells. Antiviral Res. 98:54–60. 2013. View Article : Google Scholar : PubMed/NCBI
|
|
12
|
Cai D, Cao J, Li Z, Zheng X, Yao Y, Li W
and Yuan Z: Up-regulation of bone marrow stromal protein 2 (BST2)
in breast cancer with bone metastasis. BMC Cancer. 9:1022009.
View Article : Google Scholar : PubMed/NCBI
|
|
13
|
Levy DE, Kessler DS, Pine R and Darnell JE
Jr: Cytoplasmic activation of ISGF3, the positive regulator of
interferon-alpha-stimulated transcription, reconstituted in vitro.
Genes Dev. 3:1362–1371. 1989. View Article : Google Scholar : PubMed/NCBI
|
|
14
|
Knapek KJ, Georges HM, Van Campen H,
Bishop JV, Bielefeldt-Ohmann H, Smirnova NP and Hansen TR: Fetal
lymphoid organ immune responses to transient and persistent
infection with Bovine viral Diarrhea virus. Viruses. 12:8162020.
View Article : Google Scholar : PubMed/NCBI
|
|
15
|
Vasaikar SV, Straub P, Wang J and Zhang B:
LinkedOmics: Analyzing multi-omics data within and across 32 cancer
types. Nucleic. Acids Res. 46:D956–D963. 2018. View Article : Google Scholar
|
|
16
|
Liu J, Jiang X, Zou A, Mai Z, Huang Z, Sun
L and Zhao J: circIGHG-induced epithelial-to-mesenchymal transition
promotes oral squamous cell carcinoma progression via
miR-142-5p/IGF2BP3 signaling. Cancer Res. 81:344–355. 2021.
View Article : Google Scholar
|
|
17
|
Cao M, Shi E, Wang H, Mao L, Wu Q, Li X,
Liang Y, Yang X, Wang Y and Li C: Personalized targeted therapeutic
strategies against oral squamous cell carcinoma. An evidence-based
review of literature. Int J Nanomedicine. 17:4293–4306. 2022.
View Article : Google Scholar : PubMed/NCBI
|
|
18
|
Chen X, Liu Q, Chen Y, Wang L, Yang R,
Zhang W, Pan X, Zhang S, Chen C, Wu T, et al: Carboxylesterase 2
induces mitochondrial dysfunction via disrupting lipid homeostasis
in oral squamous cell carcinoma. Mol Metab. 65:1016002022.
View Article : Google Scholar : PubMed/NCBI
|
|
19
|
Haidari S, Obermeier KT, Kraus M, Otto S,
Probst FA and Liokatis P: Nodal disease and survival in oral
cancer: Is occult metastasis a burden factor compared to
preoperatively nodal positive neck? Cancers (Basel). 14:42412022.
View Article : Google Scholar : PubMed/NCBI
|
|
20
|
Chen X, Chen DR, Liu H, Yang L, Zhang Y,
Bu LL, Sun ZJ and Cai L: Local delivery of gambogic acid to improve
anti-tumor immunity against oral squamous cell carcinoma. J Control
Release. 351:381–393. 2022. View Article : Google Scholar : PubMed/NCBI
|
|
21
|
Ju WT, Xia RH, Zhu DW, Dou SJ, Zhu GP,
Dong MJ, Wang LZ, Sun Q, Zhao TC, Zhou ZH, et al: A pilot study of
neoadjuvant combination of anti-PD-1 camrelizumab and VEGFR2
inhibitor apatinib for locally advanced resectable oral squamous
cell carcinoma. Nat Commun. 13:53782022. View Article : Google Scholar : PubMed/NCBI
|
|
22
|
Poell JB, Wils LJ, Brink A, Dietrich R,
Krieg C, Velleuer E, Evren I, Brouns ER, de Visscher JG, Bloemena
E, et al: Oral cancer prediction by noninvasive genetic screening.
Int J Cancer. 152:227–238. 2022. View Article : Google Scholar : PubMed/NCBI
|
|
23
|
de Wit JG, van Schaik JE, Voskuil FJ, Vonk
J, de Visscher SAHJ, Schepman KP, van der Laan BFAM, Doff JJ, van
der Vegt B, Plaat BEC, et al: Comparison of narrow band and
fluorescence molecular imaging to improve intraoperative tumour
margin assessment in oral cancer surgery. Oral Oncol.
134:1060992022. View Article : Google Scholar : PubMed/NCBI
|
|
24
|
Sun Y, Zhou Q, Sun J, Bi W, Li R, Wu X, Li
N, Song L, Yang F and Yu Y: DDX59-AS1 is a prognostic biomarker and
correlated with immune infiltrates in OSCC. Front Genet.
13:8927272022. View Article : Google Scholar : PubMed/NCBI
|
|
25
|
Wang SM, Huang KJ and Wang CT: Severe
acute respiratory syndrome coronavirus spike protein counteracts
BST2-mediated restriction of virus-like particle release. J Med
Virol. 91:1743–1750. 2019. View Article : Google Scholar : PubMed/NCBI
|
|
26
|
Mahauad-Fernandez WD and Okeoma CM:
Cysteine-linked dimerization of BST-2 confers anoikis resistance to
breast cancer cells by negating proapoptotic activities to promote
tumor cell survival and growth. Cell Death Dis. 8:e26872017.
View Article : Google Scholar : PubMed/NCBI
|
|
27
|
Yu H, Pardoll D and Jove R: STATs in
cancer inflammation and immunity: A leading role for STAT3. Nat Rev
Cancer. 9:798–809. 2009. View Article : Google Scholar : PubMed/NCBI
|
|
28
|
Seidel HM, Milocco LH, Lamb P, Darnell JE
Jr, Stein RB and Rosen J: Spacing of palindromic half sites as a
determinant of selective STAT (signal transducers and activators of
transcription) DNA binding and transcriptional activity. Proc Natl
Acad Sci USA. 92:3041–3045. 1995. View Article : Google Scholar : PubMed/NCBI
|
|
29
|
Wong GL, Manore SG, Doheny DL and Lo HW:
STAT family of transcription factors in breast cancer: Pathogenesis
and therapeutic opportunities and challenges. Semin Cancer Biol.
86:84–106. 2022. View Article : Google Scholar : PubMed/NCBI
|
|
30
|
Feng J, Li Y, Zhu L, Zhao Q, Li D, Li Y
and Wu T: STAT1 mediated long non-coding RNA LINC00504 influences
radio-sensitivity of breast cancer via binding to TAF15 and
stabilizing CPEB2 expression. Cancer Biol Ther. 22:630–639. 2021.
View Article : Google Scholar : PubMed/NCBI
|
|
31
|
Gu Y, Wang R, Chen P, Li S, Chai X, Chen
C, Liu Y, Cao Y, Lv D, Hong Z, et al: In situ synthesis and
unidirectional insertion of membrane proteins in
liposome-immobilized silica stationary phase for rapid preparation
of microaffinity chromatography. Acta Pharm Sin B. 12:3682–3693.
2022. View Article : Google Scholar : PubMed/NCBI
|
|
32
|
Mao X, Wang X, Jin M, Li Q, Jia J, Li M,
Zhou H, Liu Z, Jin W, Zhao Y and Luo Z: Critical involvement of
lysyl oxidase in seizure-induced neuronal damage through
ERK-Alox5-dependent ferroptosis and its therapeutic implications.
Acta Pharm Sin B. 12:3513–3528. 2022. View Article : Google Scholar : PubMed/NCBI
|
|
33
|
Jeremiah N, Ferran H, Antoniadou K, De
Azevedo K, Nikolic J, Maurin M, Benaroch P and Manel N: RELA tunes
innate-like interferon I/III responses in human T cells. J Exp Med.
220:e202206662023. View Article : Google Scholar : PubMed/NCBI
|
|
34
|
Ivashkiv LB: IFNγ: Signalling, epigenetics
and roles in immunity, metabolism, disease and cancer
immunotherapy. Nat Rev Immunol. 18:545–558. 2018. View Article : Google Scholar : PubMed/NCBI
|
|
35
|
Lau CM, Adams NM, Geary CD, Weizman OE,
Rapp M, Pritykin Y, Leslie CS and Sun JC: Epigenetic control of
innate and adaptive immune memory. Nat Immunol. 19:963–972. 2018.
View Article : Google Scholar : PubMed/NCBI
|
|
36
|
Yang J, Zhang Q, Wang J, Lou Y, Hong Z,
Wei S, Sun K, Wang J, Chen Y, Sheng J, et al: Dynamic profiling of
immune micro-environment during pancreatic cancer development
suggests early intervention and combination strategy of
immunotherapy. EBioMedicine. 78:1039582022. View Article : Google Scholar
|
|
37
|
Cao W and Bover L: Signaling and ligand
interaction of ILT7: receptor-mediated regulatory mechanisms for
plasmacytoid dendritic cells. Immunol Rev. 234:163–176. 2010.
View Article : Google Scholar : PubMed/NCBI
|
|
38
|
Feketshane Z, Adeyemi SA, Ubanako P,
Ndinteh DT, Ray SS, Choonara YE and Aderibigbe BA: Dissolvable
sodium alginate-based antibacterial wound dressing patches: Design,
characterization, and in vitro biological studies. Int J Biol
Macromol. 1234602023. View Article : Google Scholar : PubMed/NCBI
|
|
39
|
Zhang Y, Zhang Z, Chen L and Zhang X:
Tumor cells-derived conditioned medium induced pro-tumoral
phenotypes in macrophages through calcium-nuclear factor κB
interaction. BMC Cancer. 22:13272022. View Article : Google Scholar
|
|
40
|
Ren X, Wang D, Zhang G, Zhou T, Wei Z,
Yang Y, Zheng Y, Lei X, Tao W, Wang A, et al: Nucleic DHX9
cooperates with STAT1 to transcribe interferon-stimulated genes.
Sci Adv. 9:eadd50052023. View Article : Google Scholar : PubMed/NCBI
|
|
41
|
Gringhuis SI, Kaptein TM, Remmerswaal EBM,
Drewniak A, Wevers BA, Theelen B, D'Haens GRAM, Boekhout T and
Geijtenbeek TBH: Fungal sensing by dectin-1 directs the
non-pathogenic polarization of TH17 cells through
balanced type I IFN responses in human DCs. Nat Immunol.
23:1735–1748. 2022. View Article : Google Scholar : PubMed/NCBI
|