Introduction
Understanding the multifaceted roles of various
factors in tumor development and progression is central to
understanding cancer biology. For instance, cancer driver genes,
which were initially identified in specific tumor types, may exert
different effects on other tumor types (1). Cellular regulators, bioactive
molecules, and transcription factors also display distinct
activities across different cell types (2-4).
Similarly, the molecular classification of tumors is largely
determined by their tissue of origin (5-7).
Therefore, elucidating these diverse regulatory mechanisms is
essential for developing more effective, personalized
treatments.
Serine protease inhibitor clade E member 1
(SERPINE1), also known as plasminogen activator inhibitor-1, is
also a multifaceted molecule that plays significant roles in
various biological processes (8).
It is particularly involved in the intricate interplay between
tumor progression and the modulation of immune responses through
mechanisms such as promoting vascular formation via interactions
with endothelial cells, regulating extracellular matrix remodeling
and cellular motility, protecting tumor cells from programmed cell
death, and influencing inflammatory responses and immune cell
functions (9). Paradoxically,
although SERPINE1 functions as a plasminogen activator inhibitor
and should theoretically exert tumor-suppressive effects, high
SERPINE1 expression is generally associated with tumor
aggressiveness, tumor metastasis and a poor prognosis (10). Given its protumorigenic role,
SERPINE1 is a pivotal target for cancer treatment. However, three
major challenges complicate its clinical development: First,
concentration-dependent biphasic effects, in which moderate
SERPINE1 levels may inhibit tumor growth while excessive levels
promote progression; second, context-dependent functionality, as
the effects of SERPINE1 are modulated by the tumor microenvironment
and can be opposite in different cell types and tissue contexts;
and third, pathway pleiotropy, with SERPINE1 exerting diverse
biological effects through multiple signaling pathways, including
the urokinase-type plasminogen activator (uPA)/urokinase-type
plasminogen activator receptor (uPAR) system, integrin pathway, and
transforming growth factor-beta (TGF-β) pathway (11).
Numerous studies have demonstrated that SERPINE1 has
antiapoptotic and proproliferative effects (12-18). For instance, SERPINE1 inhibits
drug-induced apoptosis in human promyelocytic leukemia cell lines
and prostate cancer cell lines by activating the NF-κB pathway
(12). SERPINE1 facilitates tumor
growth in esophageal squamous cell carcinoma through the activation
of AKT and ERK1/2 signaling (13). SERPINE1 exerts its tumor-promoting
effects on bladder and cervical cancer cells by promoting
G1 phase progression via the upregulation of cyclin
D3/CDK4/6 and cyclin E/CDK2 complexes (14). SERPINE1 promotes neuronal survival
via low-density lipoprotein receptor-related protein 1 by
activating the PI3K/AKT pathway and inhibiting the JNK/NF-κB
pathway (15). However, the
anti-proliferative activity of SERPINE1 has been observed in
certain contexts. For instance, high expression of SERPINE1 in
human renal epithelial cells leads to proliferative defects, which
are mediated by a loss of klotho expression, the consequent
upregulation of p53, and increased phosphorylation of SMAD3
(16). The suppression of
SERPINE1 allows ageing fibroblasts to bypass senescence through the
p53-p21-Rb pathway (17,18).
SERPINE1 also exerts stimulatory, inhibitory, and
neutral effects on invasion/metastasis. Its proinvasive/metastatic
effects are described hereafter. SERPINE1 facilitates tumor cell
migration by inducing detachment from vitronectin and promoting
redirected migration to fibronectin (19). SERPINE1 enables invasion by
inhibiting uPAR-bound uPA to protect the integrity of matrix
proteins essential for adhesion and migration (20). SERPINE1 facilitates glioblastoma
spread by altering adhesion and reprogramming transcription
(21). Through upregulation of
matrix metalloproteinase-13 (MMP-13) expression and secretion,
SERPINE1 increases invasion and facilitates pulmonary metastasis in
osteosarcoma (22). The SERPINE1
and CCL5 signaling pathways in endothelial cells cooperate to
potentiate the metastatic spread of triple-negative breast cancer
cells that have undergone the epithelial-mesenchymal transition
(EMT) (23). In non-small cell
lung cancer (NSCLC), a SERPINE1/PIAS3/Stat3/miR-34a positive
feedback loop enhances EMT-mediated metastasis (24). Its anti-invasive/metastatic
effects include the following: Overexpression of SERPINE1
suppresses the hepatic metastasis of pancreatic cancer and inhibits
the invasiveness of glioma cells (25,26); SERPINE1, upregulated by TGF-β,
suppresses the migration and invasion of melanoma cells by
inhibiting the plasminogen activation system (27); the increased expression of
SERPINE1 in malignant prostate cells results in the acquisition of
a less invasive phenotype (28);
and SERPINE1 contributes to fibrous adhesion in injured flexor
tendons by reducing MMP activity (29).
SERPINE1 modulates cell proliferation and invasion
through complex regulatory networks. Additional mechanisms
potentially contribute to these processes, whereas previously
identified mechanisms may exhibit context-dependent functional
variations. The present study aims to elucidate potentially novel
mechanisms underlying the role of SERPINE1 in regulating cellular
proliferation and invasion, providing fundamental support for the
development of SERPINE1-directed antitumor interventions.
Materials and methods
Gene expression profiling interactive
analysis 2 (GEPIA2) and cancer single-cell state atlas
(CancerSEA)
Kaplan-Meier survival curves were generated using
the GEPIA2 database (30)
(http://gepia2.cancer-pku.cn/), with
expression data (in transcripts per million; TPM) and clinical
survival data sourced from The Cancer Genome Atlas (TCGA) Research
Network (accessed July 11, 2016; version: Legacy, GRCh37 (hg19);
https://www.cancer.gov/about-nci/organization/ccg/research/structural-genomics/tcga).
For a given type of cancer, the cohort was split into two groups
based on SERPINE1 expression using a quartile-based cutoff: Tumors
with expression levels at or above the 75th percentile were
classified as the 'High expression' group, and those at or below
the 25th percentile as the 'Low expression' group; a method that
minimizes outlier effects. The platform plotted the Kaplan-Meier
estimator for each group and the statistical significance of the
difference between survival curves is computed using the log-rank
(Mantel-Cox) test, outputting the hazard ratio (HR) with its 95%
confidence interval and the log-rank P-value. This specific
pan-cancer comparison was generated using the 'Survival Map'
function in GEPIA2. For breast cancer (BRCA), there are 1,085 tumor
samples and 291 normal samples; for low-grade glioma (LGG), 518
tumor samples and 207 normal samples; and for skin cutaneous
melanoma (SKCM), 461 tumor samples and 558 normal samples.
To decode the functional relevance of SERPINE1 at
single-cell resolution, the present study used the CancerSEA
database (31) (http://biocc.hrbmu.edu.cn/CancerSEA), which
employs an established pipeline involving 14 manually curated
cancer-relevant functional states represented by specific gene
signatures, quantifies the activity of each state in individual
cancer cells (from 41,900 cells across 25 types of cancers) using
Gene Set Variation Analysis (GSVA), and evaluates the relationship
between SERPINE1 expression and each functional state's GSVA score
via Spearman's rank correlation coefficient, with significant
associations defined as absolute Spearman's ρ>0.3 and
Benjamini-Hochberg adjusted P-value [false discovery rate
(FDR)]<0.05; these significant correlation coefficients were
visualized in a heatmap.
Cell lines and cell culture
The human breast cancer cell line MDA-MB-231
(abbreviated as 231), glioma cell line H4, melanoma cell line C918
and 293T cells were obtained from the Cell Resource Center (Peking
Union Medical College, Beijing, China). Cell lines were
authenticated by short tandem repeat testing and mycoplasma
contamination was absent. Cells were cultured in Dulbecco's
modified Eagle's medium (cat. no. KGL1206-500; Jiangsu KeyGen
Biotech Co., Ltd.) supplemented with 10% fetal bovine serum (FBS;
cat. no. 164210, Pricella; Elabscience Bionovation Inc.) and 1%
penicillin/streptomycin and maintained at 37°C with 5%
CO2 in a humidified incubator.
Cell transfection
A third-generation lentiviral system was used to
establish stable knockdown or overexpression cell lines. All
lentiviral constructs were purchased from Genechem Co., Ltd.
(Shanghai, China). Lentiviruses were produced using the Lenti-Pac
HIV Expression Packaging Kit (cat. no. LT001; GeneCopoeia, Inc.)
according to the manufacturer's instructions. Briefly, 293T cells
were co-transfected with 2.5 μg of lentiviral expression
plasmid and 2.5 μg of Lenti-Pac mixed packaging plasmid
(containing packaging and envelope components) at 37°C with 5%
CO2. At 48 h post-transfection, viral supernatants were
collected, centrifuged, and filtered. Target cells were infected at
a multiplicity of infection (MOI) of 3. After 14 days of selection
with puromycin (4 μg/ml) (cat. no. HY-B1743; MedChemExpress)
or G418 (800 μg/ml) (cat. no. HY-17561; MedChemExpress),
stably transduced cells were maintained in medium containing the
same antibiotic concentrations and used for subsequent experiments.
This procedure was applied in experiments involving SERPINE1
knockdown, SERPINE1 rescue, and uPAR overexpression.
For SERPINE1 knockdown, two lentiviral constructs
were utilized: an shRNA targeting SERPINE1 (abbreviated as shSE1)
and a scrambled control shRNA (abbreviated as shc). The two shSE1
constructs targeted two sequences: 5'-AGACCAACAAGTTCAACTATA-3'
(Target 1) and 5'-TCTCTGCCCTCACCAACATTC-3' (Target 2). The
scrambled control shc targeted the sequence
5'-TTCTCCGAACGTGTCACGT-3'. These constructs were used to transduce
MDA-MB-231, C918, and H4 cells. Stable cell lines were selected
with puromycin (4 μg/ml) for 14 days before being used in
subsequent experiments.
A functional rescue experiment was performed to
confirm that the observed phenotypes were specifically caused by
SERPINE1 knockdown rather than by off-target effects. An
shRNA-resistant SERPINE1 cDNA construct was generated by
introducing six synonymous mutations into the 21-nt region
(TCTCTGCCCTCACCAACATTC) targeted by the shRNA, thereby preserving
the native amino acid sequence while preventing shRNA binding. The
mutated DNA sequence (5'-TCCCTGCCATCGACTACATTC-3') was subsequently
cloned and inserted into a lentiviral expression vector. This
rescue lentivirus, along with a control empty vector (abbreviated
as vec), were used to infect stable SERPINE1-knockdown cells
(shSE1). The resulting cell lines were designated shSE1 + SE1
(rescued) and shSE1 + vec (control). Stable cell lines were
selected with G418 (800 μg/ml) for 14 days before being used
in subsequent experiments.
For uPAR overexpression, 231-shSE1 cells were
infected with a lentivirus containing plasminogen activator,
urokinase receptor (PLAUR) cDNA (abbreviated as ex-PLAUR) or the
corresponding empty vector control (abbreviated as vec). Stable
cell lines were selected with G418 (800 μg/ml) for 14 days
before being used in subsequent experiments.
Small RNA interference (RNAi)
transfection
For RNA interference targeting HSP90α (HSP90AA1),
H4-shSE1 cells were seeded into 6-well plates and grown to 70-80%
confluence. Transfection was performed using
Lipofectamine® 2000 (Invitrogen; Thermo Fisher
Scientific, Inc.) and siRNA Set A (three siRNA pairs targeting
human HSP90AA1(si-HSP90AA1) and a negative control (siNC; cat. no.
HY-RS06415; MedChemExpress) according to each manufacturer's
protocol.
The siHSP90AA1 construct targeted three sequences:
5'-GTTATCCTACACCTGAAAGAA-3' (Target 1), 5'-AGCTGCATATTAACCTTATAC-3'
(Target 2), and 5'-TACTTGGAGGAACGAAGAATA-3' (Target 3). The
negative control siRNA (siNC) targeted the sequence
5'-AATTCTCCGAACGTGTCACGT-3'.
Enzyme-linked immunosorbent assay
(ELISA)
The concentration of SERPINE1 in the cell culture
supernatant was measured using a human SERPINE1 ELISA Kit (cat. no.
EH0538; Wuhan Fine Biotech Co., Ltd.). When the cells reached ~80%
confluence, the culture medium was replaced with serum-free medium.
After 24 h, the conditioned medium was collected and assayed
strictly according to the manufacturer's protocol. The experiment
was performed with three replicates in each group. The absorbance
was read using a BioTek Synergy Mx microplate reader (Agilent
Technologies, Inc.).
Western blotting
Transfected cells were harvested and lysed using
RIPA buffer (cat. no. R0020; Beijing Solarbio Science &
Technology Co., Ltd.) supplemented with 1 mM PMSF (cat. no.
HY-B0496MedChemExpress), 10 mM DTT (cat. no.
HY-15917MedChemExpress), and 10 μM protein kinase inhibitor
(cat. no. P1006; Beyotime Biotechnology) on ice for 30 min. Equal
amounts of protein (20 μg, quantified by BCA (cat. no.
PC0020; Beijing Solarbio Science & Technology Co., Ltd.) were
separated by SDS-PAGE (4-20% gradient gel; cat. no. ET15420L; ACE
Biotechnology) and transferred to 0.2 μm pore size PVDF
membranes (cat. no. ISEQ00010; Merck Sharp & Dohme-Hoddesdon).
Following the blocking of nonspecific binding sites using 5%
skimmed milk (cat. no. P0216; Beyotime Biotechnology) or bovine
serum albumin (cat. no. NGP0028A; Beyotime Biotechnology) for 1 h
at room temperature, the membranes were incubated with primary
antibodies (incubation overnight at 4°C) against SERPINE1 (cat. no.
13801-1-AP; Proteintech Group, Inc), GAPDH (cat. no. sc-25778;
Santa Cruz Biotechnology, Inc.), MCM3 (cat. no. PA5-79646; Thermo
Fisher Scientific, Inc.), phosphorylated (p-)MCM3 (Ser112; cat. no.
TA2362; Abmart Pharmaceutical Technology Co., Ltd.), ERK (cat. no.
sc-514302; Santa Cruz Biotechnology, Inc.), uPAR (cat. no. ab10379;
Abcam), Histone H3 (cat. no. 4499), p-p53 (Ser15; cat. no. 9284),
p53 (cat. no. 2524), p-SMAD3 (Ser423/425; cat. no. 9520), SMAD3
(cat. no. 9523), p-Rb (Ser807/811; cat. no. 8516), Rb (cat. no.
9309), CyclinD1 (cat. no. 55506), CyclinE1 (cat. no. 20808), p21
(cat. no. 2947), p-p38 (cat. no. 4511), p38 (cat. no. 8690), p-ERK
(cat. no. 4370), p-JNK (cat. no. 9255), JNK (cat. no. 9252), p-AKT
(Ser473; cat. no. 4060), AKT (cat. no. 9272), HSP90α (cat. no.
4877) and MMP-1 (cat. no. 54376) were from Cell Signaling
Technology, Inc.) and subsequently incubated with the corresponding
secondary antibodies (dilution 1:4,000) for 2 h at room
temperature. The secondary antibodies used were horseradish
peroxidase (HRP)-conjugated goat anti-rabbit (cat. no. ZB-2301;
Beijing Zhongshan Jinqiao Biotechnology Co., Ltd.) and
HRP-conjugated goat anti-mouse (cat. no. ZB-2305; Beijing Zhongshan
Jinqiao Biotechnology Co., Ltd.). Chemiluminescence was detected
using WesternBright ECL HRP substrate (cat. no. R-03031-D2;
Advansta Inc.). Bands were visualized using the C-DiGit Blot
Scanner (LI-COR Biosciences), and a densitometric analysis was
performed using ImageJ software (version: 1.52a) (National
Institutes of Health). Three independent replicates were performed
for each experimental condition.
Clonogenic assays
A colony formation assay was performed to evaluate
clonogenic survival by seeding single-cell suspensions at
1×10³ cells/well in 6-well plates. After 14 days, the
colonies were fixed with 100% methanol for 10 min at room
temperature. Following fixation, colonies were stained with 0.1%
crystal violet solution for 30 min at room temperature. Colonies
were defined as clusters containing ≥50 cells or visible colonies
measuring >0.1 mm in diameter. The colony-forming efficiency was
calculated as follows: (number of colonies formed/number of cells
seeded) ×100%. Three replicates were performed for each group.
Tumorigenicity
Subcutaneous xenograft and lung metastasis models
were established to compare tumor growth and metastasis between the
SERPINE1 knockdown (shSE1) and control (shc) groups of MDA-MB-231
and C918 cells in vivo. A total of 44 male BALB/c nu/nu mice
[SiPeiFu (Beijing) Biotechnology Co., Ltd.] were used in this
study. For the subcutaneous xenograft model, 20 mice (4 groups, n=5
per group) were used. For the lung metastasis model, 24 mice (4
groups, n=6 per group) were used. The mice were either 4 weeks of
age, weighing 17-19 g (subcutaneous xenograft model), or 6 weeks of
age, weighing 20-22 g (lung metastasis model), at the start of the
experiments. The animals were housed under specific pathogen-free
(SPF) conditions at a controlled temperature (22±1°C) and humidity
(40-60%), with a 12 h light/dark cycle, and provided with
sterilized food and water ad libitum.
Humane endpoints were established to minimize animal
suffering and were strictly monitored throughout the study. Mice
were euthanized if any of the following criteria were met: i) Tumor
volume >1,500 mm3; ii) body weight loss exceeded 15%
of initial weight; iii) signs of severe lethargy, hunched posture,
or inability to access food or water; iv) ulceration or necrosis of
tumor tissue; v) significant respiratory distress or impaired
mobility. All endpoints were monitored by trained personnel, and no
animals reached the predetermined humane endpoint criteria during
this study.
For the subcutaneous xenograft model, four-week-old
mice were subcutaneously injected in the axillary region with
5×10⁶ cells (231-shc, 231-shSE1, C918-shc, or
C918-shSE1) in 100 μl of PBS (n=5) to evaluate tumor cell
growth. Subcutaneous tumors were measured using calipers every
three days, and the tumor volume was calculated using the formula:
Volume (mm3)=0.5 × length × (width)2. Tumors
were excised and weighed after the mice were sacrificed by cervical
dislocation. The maximum diameter of the excised tumors ranged from
5 to 10 mm. The maximum volume of the excised tumors did not exceed
1,500 mm3.
For the lung metastasis model, six-week-old mice
were injected via the tail vein with 1×10⁴ cells
(231-shc, 231-shSE1, C918-shc, or C918-shSE1) in 50 μl of
PBS (n=6) to analyze lung metastatic colonization. Lung metastases
were assessed four weeks later by performing a gross examination,
hematoxylin and eosin (H&E) and green fluorescent protein (GFP)
staining.
Regarding the different sample sizes (n), the
variation in mouse numbers per group between the subcutaneous
tumorigenicity (n=5) and hematogenous metastasis (n=6) experiments
arises from a sample size adjustment that accounts for the
anticipated technical success rates of each model. The sample size
for each experiment was initially calculated by power analysis
(α=0.05; power=80%; two-sided t-test; effect size=3.5), yielding a
baseline requirement of n=4 per group, which was then increased to
n=5 for the tumorigenicity assay to account for an expected tumor
formation rate of ~80% for the MDA-MB-231 and C918 cell lines, and
to n=6 for the metastasis assay to accommodate an expected
detectable metastasis formation rate of ~70%. This adjustment was
made to ensure an adequate final number of evaluable animals per
group.
All the experimental protocols were performed in
accordance with the guidelines and regulations of the Institutional
Animal Care and Use Committee at Tianjin Medical University
(approval no. TMUaMEC 2022045). All methods are reported in
accordance with the ARRIVE guidelines.
H&E staining and immunohistochemical
staining
For histological analysis, xenograft tumor tissues
were harvested, fixed overnight in 10% neutral-buffered formalin at
room temperature. Following fixation, tissues were processed
through a graded ethanol series (70, 80, 95 and 100% ethanol, 1 h
each), cleared in xylene (2 changes, 1 h each), and embedded in
paraffin at 60°C. The paraffin-embedded tissues were sectioned at 5
μm thickness.
For H&E staining, sections were deparaffinized
in xylene (2×15 min) and rehydrated through a graded ethanol series
(100, 95, 80, 70% ethanol, 5 min each) to distilled water.
Hematoxylin staining was performed at room temperature for 3-5 min,
followed by rinsing in running tap water for 1 min and 1% acid
alcohol differentiation solution for 30 sec. After rinsing in
running tap water for 1 min, sections were then counterstained with
eosin Y at room temperature for 2-3 min. After staining, sections
were dehydrated through graded ethanol (70, 80, 95 and 100%
ethanol, 1 min each), cleared in xylene (2×5 min), and mounted with
coverslips using mounting with neutral resin.
For immunostaining, slides were deparaffinized,
rehydrated through a graded alcohol series, and subjected to
antigen retrieval in citrate buffer using a high-pressure cooker
for 15 min. Subsequently, sections were treated with 3%
H2O2 for 10 min, washed with PBS, and blocked
with 5% normal goat serum (cat. no. ZLI-9056; ZSGB-BIO) for 1 h at
room temperature. Following blocking, sections were incubated with
primary antibodies overnight at 4°C. Primary antibodies used were:
Anti-GFP (cat. no. 2956; Cell Signaling Technology, Inc.) at 1:100
dilution, anti-p-MCM3 (Ser112; cat. no. TA2362; Abmart
Pharmaceutical Technology Co., Ltd.) at 1:300 dilution and
anti-MCM3 (cat. no. PA5-79646; Thermo Fisher Scientific, Inc.) at
1:500 dilution. Antigen-antibody binding was detected using a
HRP-conjugated goat anti-rabbit secondary antibody (ready-to-use
solution, cat. no. AFIHC003; Aifang Biological) for 1 h at room
temperature. Antigen-antibody binding was visualized using DAB
chromogen solution (ready-to-use solution, cat. no. AFZD002; Aifang
Biological). Sections were counterstained with hematoxylin at room
temperature, dehydrated, and mounted with neutral resin. Images
were captured using a light microscope (80i; Nikon
Corporation).
The numbers of tissue samples used for H&E and
immunohistochemical staining were n=5 for subcutaneous transplanted
tumors and n=6 for pulmonary metastases.
RNA sequencing (RNA-seq) and
bioinformatics analysis
For RNA-seq, RNA was extracted from cells transduced
with shSE1 and shc using Trizol reagent (cat. no. R0016; Beyotime
Biotechnology). RNA-seq was performed using one biological
replicate per group. The total RNA quantity and purity were
analyzed using an RNA 6000 Nano LabChip Kit (cat. no. 5067-1511;
Agilent Technologies, Inc.) on a Bioanalyzer 2100 system (Agilent
Technologies, Inc.). High-quality RNA samples with a RNA Integrity
Number (RIN) >7.0 were used to construct a sequencing library.
mRNA was purified from total RNA (5 μg) using Dynabeads
Oligo (dT; Thermo Fisher Scientific, Inc.) with two rounds of
purification. Following purification, the mRNA was fragmented into
short fragments using divalent cations under elevated temperature
[Magnesium RNA Fragmentation Module (cat. no. e6150; New England
BioLabs, Inc.) under 94°C 5-7 min]. Then the cleaved RNA fragments
were reverse-transcribed to create the cDNA by SuperScript II
Reverse Transcriptase (cat. no. 1896649; Invitrogen; Thermo Fisher
Scientific, Inc.), which were next used to synthesized U-labeled
second-stranded DNAs with E. coli DNA polymerase I (cat. no.
m0209; New England BioLabs, Inc.), RNase H (cat. no. m0297; New
England BioLabs, Inc.) and dUTP Solution (cat. no. R0133; Thermo
Fisher Scientific, Inc.). An A-base was then added to the blunt
ends of each strand, preparing them for ligation to the indexed
adapters. Each adapter contained a T-base overhang for ligating the
adapter to the A-tailed fragmented DNA. Dual-index adapters were
ligated to the fragments, and size selection was performed with
AMPureXP beads. After the heat-labile UDG enzyme (cat. no. m0280;
New England BioLabs, Inc.) treatment of the U-labeled
second-stranded DNAs, the ligated products were amplified with PCR
by the following conditions: initial denaturation at 95°C for 3
min; 8 cycles of denaturation at 98°C for 15 sec, annealing at 60°C
for 15 sec, and extension at 72°C for 30 sec; and then final
extension at 72°C for 5 min. The average insert size for the final
cDNA libraries were 300±50 bp. Final library concentrations were
determined using Qubit dsDNA HS Assay Kit (Thermo Fisher
Scientific, Inc.) and diluted to 2 nM in TE buffer. Libraries were
pooled equimolarly and subjected to 2×150 bp paired-end sequencing
(PE150) on the Illumina NovaSeq 6000 platform (Illumina Inc.). The
reads were further filtered using Cutadapt (https://cutadapt.readthedocs.io/en/stable/, version
cutadapt-1.9) to obtain high-quality reads. Reads from all the
samples were aligned to the Homo sapiens reference genome
using HISAT2 (https://daehwankimlab.github.io/hisat2/, version
hisat2-2.2.1). StringTie (http://ccb.jhu.edu/software/stringtie/, version
stringtie-2.1.6) and ballgown (http://www.bioconductor.org/packages/release/bioc/html/ballgown.html)
were used to estimate the expression levels of all transcripts by
calculating fragments per kilobase of transcript per million mapped
reads (FPKM) values.
An analysis of differentially expressed genes (DEGs)
between two comparative groups (shSE1 vs. shc) was performed using
edgeR (version 3.38.4, https://bioconductor.org/packages/release/bioc/html/edgeR.html)
with the glmQLFit and glmQLFTest functions. Genes whose FDR was
<0.05 and whose absolute fold change was ≥2 were considered
DEGs.
Gene Ontology (GO) enrichment analysis and Kyoto
Encyclopedia of Genes and Genomes (KEGG) pathway enrichment
analysis (32) were performed
using clusterProfiler (version 4.4.4, https://bioconductor.org/packages/release/bioc/html/clusterProfiler.html)
with the enrichGO and enrichKEGG functions, respectively. Gene set
enrichment analysis (GSEA) was conducted using the clusterProfiler
GSEA function with the Molecular Signatures Database (MSigDB)
hallmark gene sets. Weighted correlation network analysis (WGCNA)
was performed using the OmicShare platform (https://www.omicshare.com/tools) to identify
co-expression modules.
Detection of cell cycle, cell
cycle-related proteins and exogenous TGF-β1 treatment
C918-shc and C918-shSE1 cells were stained with
propidium iodide in the presence of 100 μg/ml RNase A (cat.
no. E-CK-A351; Elabscience; Elabscience Bionovation Inc.) to
examine the distribution of cells in different phases of the cell
cycle. The fluorescence was detected and analyzed using a BD
FACSVerse flow cytometer (BD Biosciences). The expression of 89
human cell cycle-related proteins was assessed using a label-based
antibody array (cat. no. AAH-BLG-CYC-4, RayBiotech, Inc.) according
to the manufacturer's protocol. Each protein on the array was
detected using four biological replicates.
The cells were treated with 0.5 ng/ml recombinant
human TGF-β1 (cat. no. HY-P70543; MedChemExpress) or vehicle (4 mM
HCl supplemented with 0.1% BSA) for 24 h to determine how exogenous
TGF-β1 alters the expression of cell cycle-related proteins in
C918-shSE1 cells, with three replicates per group. After treatment,
the cells were harvested and were subjected to western blotting
analysis and cell cycle detection.
Induction and quantitation of
anoikis
Poly-hydroxyethyl methacrylate (cat. no. P3932;
MilliporeSigma) was dissolved in ethanol at 100 mg/ml and coated on
6-well plates. Cells were plated on these wells and incubated for
72 h to induce anoikis. Subsequently, suspended cells were
harvested, and anoikis was quantified using an Annexin V-APC/DAPI
apoptosis detection kit (cat. no. E-CK-A258; Elabscience
Bionovation Inc.) according to the manufacturer's instructions.
Briefly, cells were washed twice with cold PBS and resuspended in
100 μl binding buffer. Annexin V-APC (5 μl) and DAPI
(5 μl) were added to each sample and incubated for 15 min at
room temperature protected from light. After incubation, 400
μl binding buffer was added to each tube, and samples were
analyzed immediately by flow cytometry using a BD FACSVerse
instrument (BD Biosciences). The total apoptotic rate was
calculated as the percentage of Annexin V-positive cells (including
both early apoptotic (Annexin V+/DAPI−) and
late apoptotic/necrotic (Annexin V+/DAPI+)
cells). Data were analyzed using FlowJo software (version 10.6.2;
BD Biosciences). Three replicates were performed for each
group.
Migration and invasion assays
To detect the effects of SERPINE1 downregulation on
migration and invasion in 231, H4, and C918 cells, Transwell assays
were performed with SERPINE1 downregulation (shSE1) and control
(shc) groups. The number of migrated cells was quantified from
three randomly selected microscopic fields per membrane. Images
were captured using a light microscope (80i; Nikon
Corporation).
For the Transwell migration assays, 8-μm
Transwell chambers (cat. no. 725321; Wuhan NEST Biotechnology Co.,
Ltd.) were used. Serum-starved cells (1×10⁴ cells/well)
were plated in the upper chambers with 100 μl of FBS-free
medium, and 400 μl of 10% FBS medium was added to the lower
chambers. The cells that migrated through the membrane were counted
and images captured after 24 h.
For the Transwell invasion assays, 4×10⁴
cells in 100 μl of FBS-free medium were plated in the top
chamber precoated with Matrigel (cat. no. 0827045; Xiamen Mogengel
Biotechnology Co., Ltd.) or neutralized Collagen Type I (cat. no.
08-115; MilliporeSigma). Matrigel was kept chilled on ice
throughout all preparation steps. First, frozen Matrigel was thawed
overnight at 4°C in a refrigerator. Then, the Matrigel was diluted
with chilled serum-free medium at a ratio of 1:2 (Matrigel:medium).
Next, 100 μl of the diluted Matrigel was added to the top
chamber of each Transwell insert. Finally, the plates were placed
in a humidified incubator at 37°C for 60 min to allow the Matrigel
to form a gel. Collagen I solutions were neutralized on ice with
0.1 N NaOH and diluted with serum-free medium to a final
concentration of 2.1 mg/ml. Then, 100 μl of the diluted
collagen solution was added to the top chamber of each Transwell
insert. At 48 h post-seeding, images were taken of the cells that
had invaded the Matrigel or Collagen I. For the aforementioned
migration and invasion assays, each group was performed in
triplicate.
Analysis of the MMP array
MMPs and their inhibitors, tissue inhibitors of
metal proteases (TIMPs), were evaluated using a Human MMP Array
(cat. no. QAH-MMP-1-1; RayBiotech, Inc.) with tenfold concentrated
cell supernatants and the assays were conducted in four
replicates.
Fluorescence-based MMP activity
assays
The activities of MMP-1 and MMP-13 in cell lysates
were measured using fluorescence kits (cat. nos. GMS50069.1.v.A for
MMP-1 and GMS50076.1.v.A for MMP-13; GENMED) according to the
manufacturer's protocol. The fluorescence intensity was recorded
every 5 min for 30 min at 37°C using a Bio-Tek SynergyMx plate
reader (excitation/emission wavelengths: 490/525 nm; Agilent
Technologies, Inc.). The experiment was performed with three
replicates in each group.
Identification of gene coexpression
modules
WGCNA was employed to identify modules in BRCA, LGG,
and SKCM tissues that were markedly associated with SERPINE1
expression. Genes within these modules were then subjected to a GO
enrichment analysis.
Statistical analysis
Statistical analyses were conducted using GraphPad
Prism 10 (Dotmatics). The data are presented as the means ± SDs.
Comparisons between groups were analyzed using a two-tailed
Student's t test. For multiple comparisons, two-way ANOVA followed
by Šídák's multiple comparisons test were performed. Significance
levels were indicated as follows: ***P<0.001,
**P<0.01, *P<0.05, and 'ns' indicated
not significant. All experiments were performed in triplicate,
unless noted otherwise. P<0.05 was considered to indicate a
statistically significant difference.
Results
Prognostic significance and cellular
functional states associated with SERPINE1
The present study explored the prognostic value of
SERPINE1 by correlating its expression with the overall survival of
patients with various cancers using GEPIA2 and TCGA data. A map of
the HR of survival (Fig. 1A)
revealed the prognostic significance of SERPINE1 across type of
cancers. Notably, BRCA, LGG and SKCM showed distinct associations
(Fig. 1B): A significant negative
association was observed in LGG (Logrank P=2.4e-9), a borderline
association was observed in BRCA (Logrank P=0.051), and a
significant positive correlation was observed in SKCM (Logrank
P=0.0065). SERPINE1 expression was markedly higher in LGG tissues
than in normal tissues (Fig. 1C).
At the single-cell level, SERPINE1 was related to distinct
functional states in various types of cancer cell (Fig. 1D). These findings highlighted the
differential prognostic relevance of SERPINE1 across type of
cancers, probably because differently involved signaling pathways
affect cell survival, proliferation, and invasion.
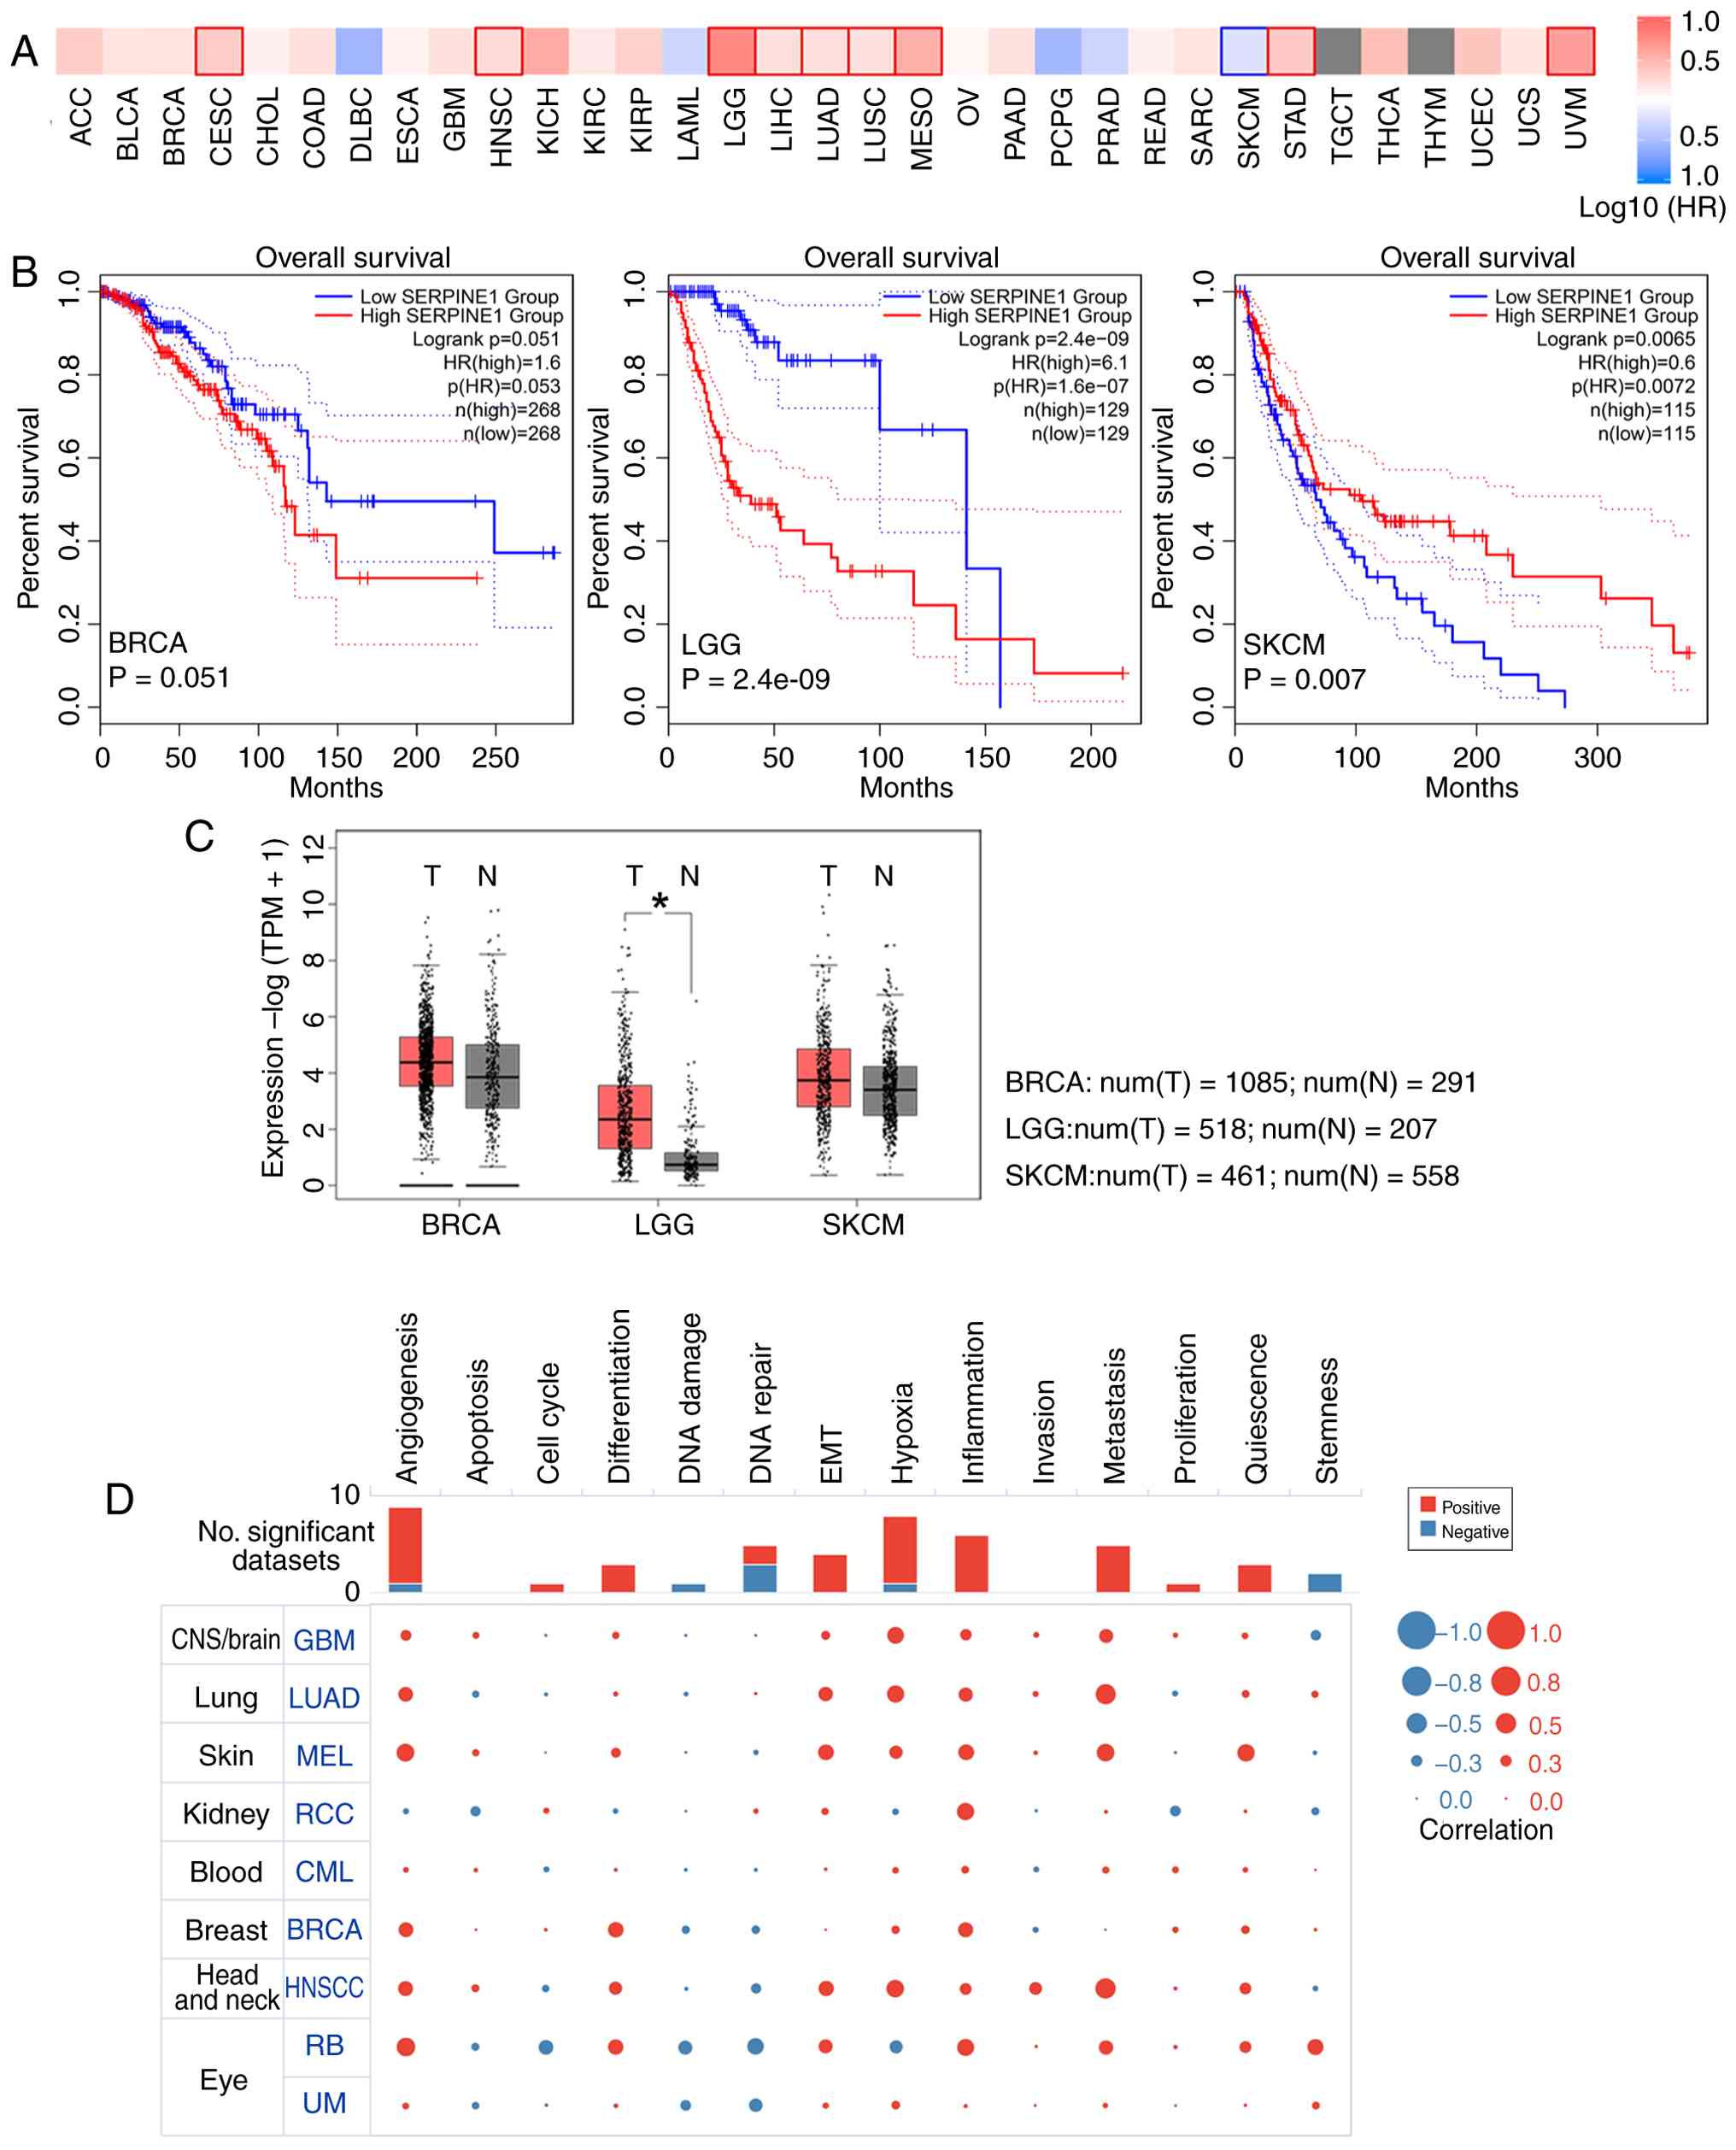 | Figure 1Prognostic significance and cellular
functional states of SERPINE1. (A) Heatmap of survival (GEPIA2)
showing the HRs for SERPINE1 expression across type of cancers
(expression data and clinical survival data are sourced from The
Cancer Genome Atlas projects. The cohort was split into two groups
based on the expression level of SERPINE1. GEPIA2 employs a
quartile-based cut-off: tumors with SERPINE1 expression levels at
or above the 75th percentile are classified into the 'high
expression' group, and those with SERPINE1 expression at or below
the 25th percentile are classified into the 'low expression' group.
This method minimizes the effects of outliers. Red and blue
indicate higher and lower risks, respectively; highlighted boxes
denote significant outcomes (P<0.05). (B) Kaplan-Meier curves
for the significance of the effect of SERPINE1 on overall survival.
The statistical significance of the difference between survival
curves was computed using the log-rank (Mantel-Cox) test. The
analysis outputs HR with its confidence interval and the log-rank
P-value, all of which are annotated in the figure. (C) SERPINE1
expression in BRCA, LGG, and SKCM tumors compared with normal
tissues (GEPIA2). For BRCA, there were 1,085 tumor samples and 291
normal samples; for LGG, 518 tumor samples and 207 normal samples;
and for SKCM, 461 tumor samples and 558 normal samples. (D) Average
correlation of SERPINE1 expression with functional states in
cancers (CancerSEA database). Correlations with an absolute
Spearman's ρ>0.3 and a Benjamini and Hochberg adjusted P-value
(false discovery rate) <0.05 were considered significant.
*P<0.05. SERPINE1, serine protease inhibitor clade e
member 1; GEPIA2, gene expression profiling interactive analysis 2;
HR, hazard ratio; BRCA, breast cancer; LGG, low-grade glioma; SKCM,
skin cutaneous melanoma. |
Diverse effects of SERPINE1 on cell
proliferation
Variable effects of SERPINE1 on cell proliferation
have been reported. A total of three tumor cell lines (MDA-MB-231,
H4 and C918) were selected for in vivo and in vitro
studies. MDA-MB-231 (abbreviated as 231) cells, a widely
established model, was chosen because of its aggressive
triple-negative breast cancer phenotype and metastatic potential
(33); the H4 glioma cell line, a
commonly used model for brain tumor biology, has gene expression
profiles similar to those of low-grade glioma, especially in terms
of cell proliferation and invasion-related genes (34,35); and the cutaneous melanoma cell
line C918 has notably high SERPINE1 expression levels (detected
across melanoma cell lines in our laboratory; data not shown) and a
high capacity for invasion and metastasis. Additionally, Yu et
al (36) reported that this
cell line harbors a BRAF (G464E) mutation and a KRAS (G12D)
mutation. Western blotting showed that SERPINE1 expression was
detected in all three cell lines. Knockdown was achieved using two
distinct shRNA-expressing lentiviruses alongside a control
lentivirus. Efficient knockdown was confirmed at the protein, mRNA
and secretory protein levels (Figs.
2A and S1A-B). Compared with
those in the controls (shc), the colony-forming efficiency and
proliferation in the 231-shSE1 and H4-shSE1 cells decreased but
that in the C918-shSE1 cells increased (Fig. 2B and S1C). A rescue experiment was conducted
to further validate these findings. In SERPINE1-knockdown cells,
the re-expression of an shRNA-resistant SERPINE1 construct rescued
the levels of both the intracellular protein and secreted SERPINE1
(Fig. S1D). Consequently, the impaired clonogenic and proliferation
abilities caused by SERPINE1 knockdown were reversed (Fig.
S1E-F).
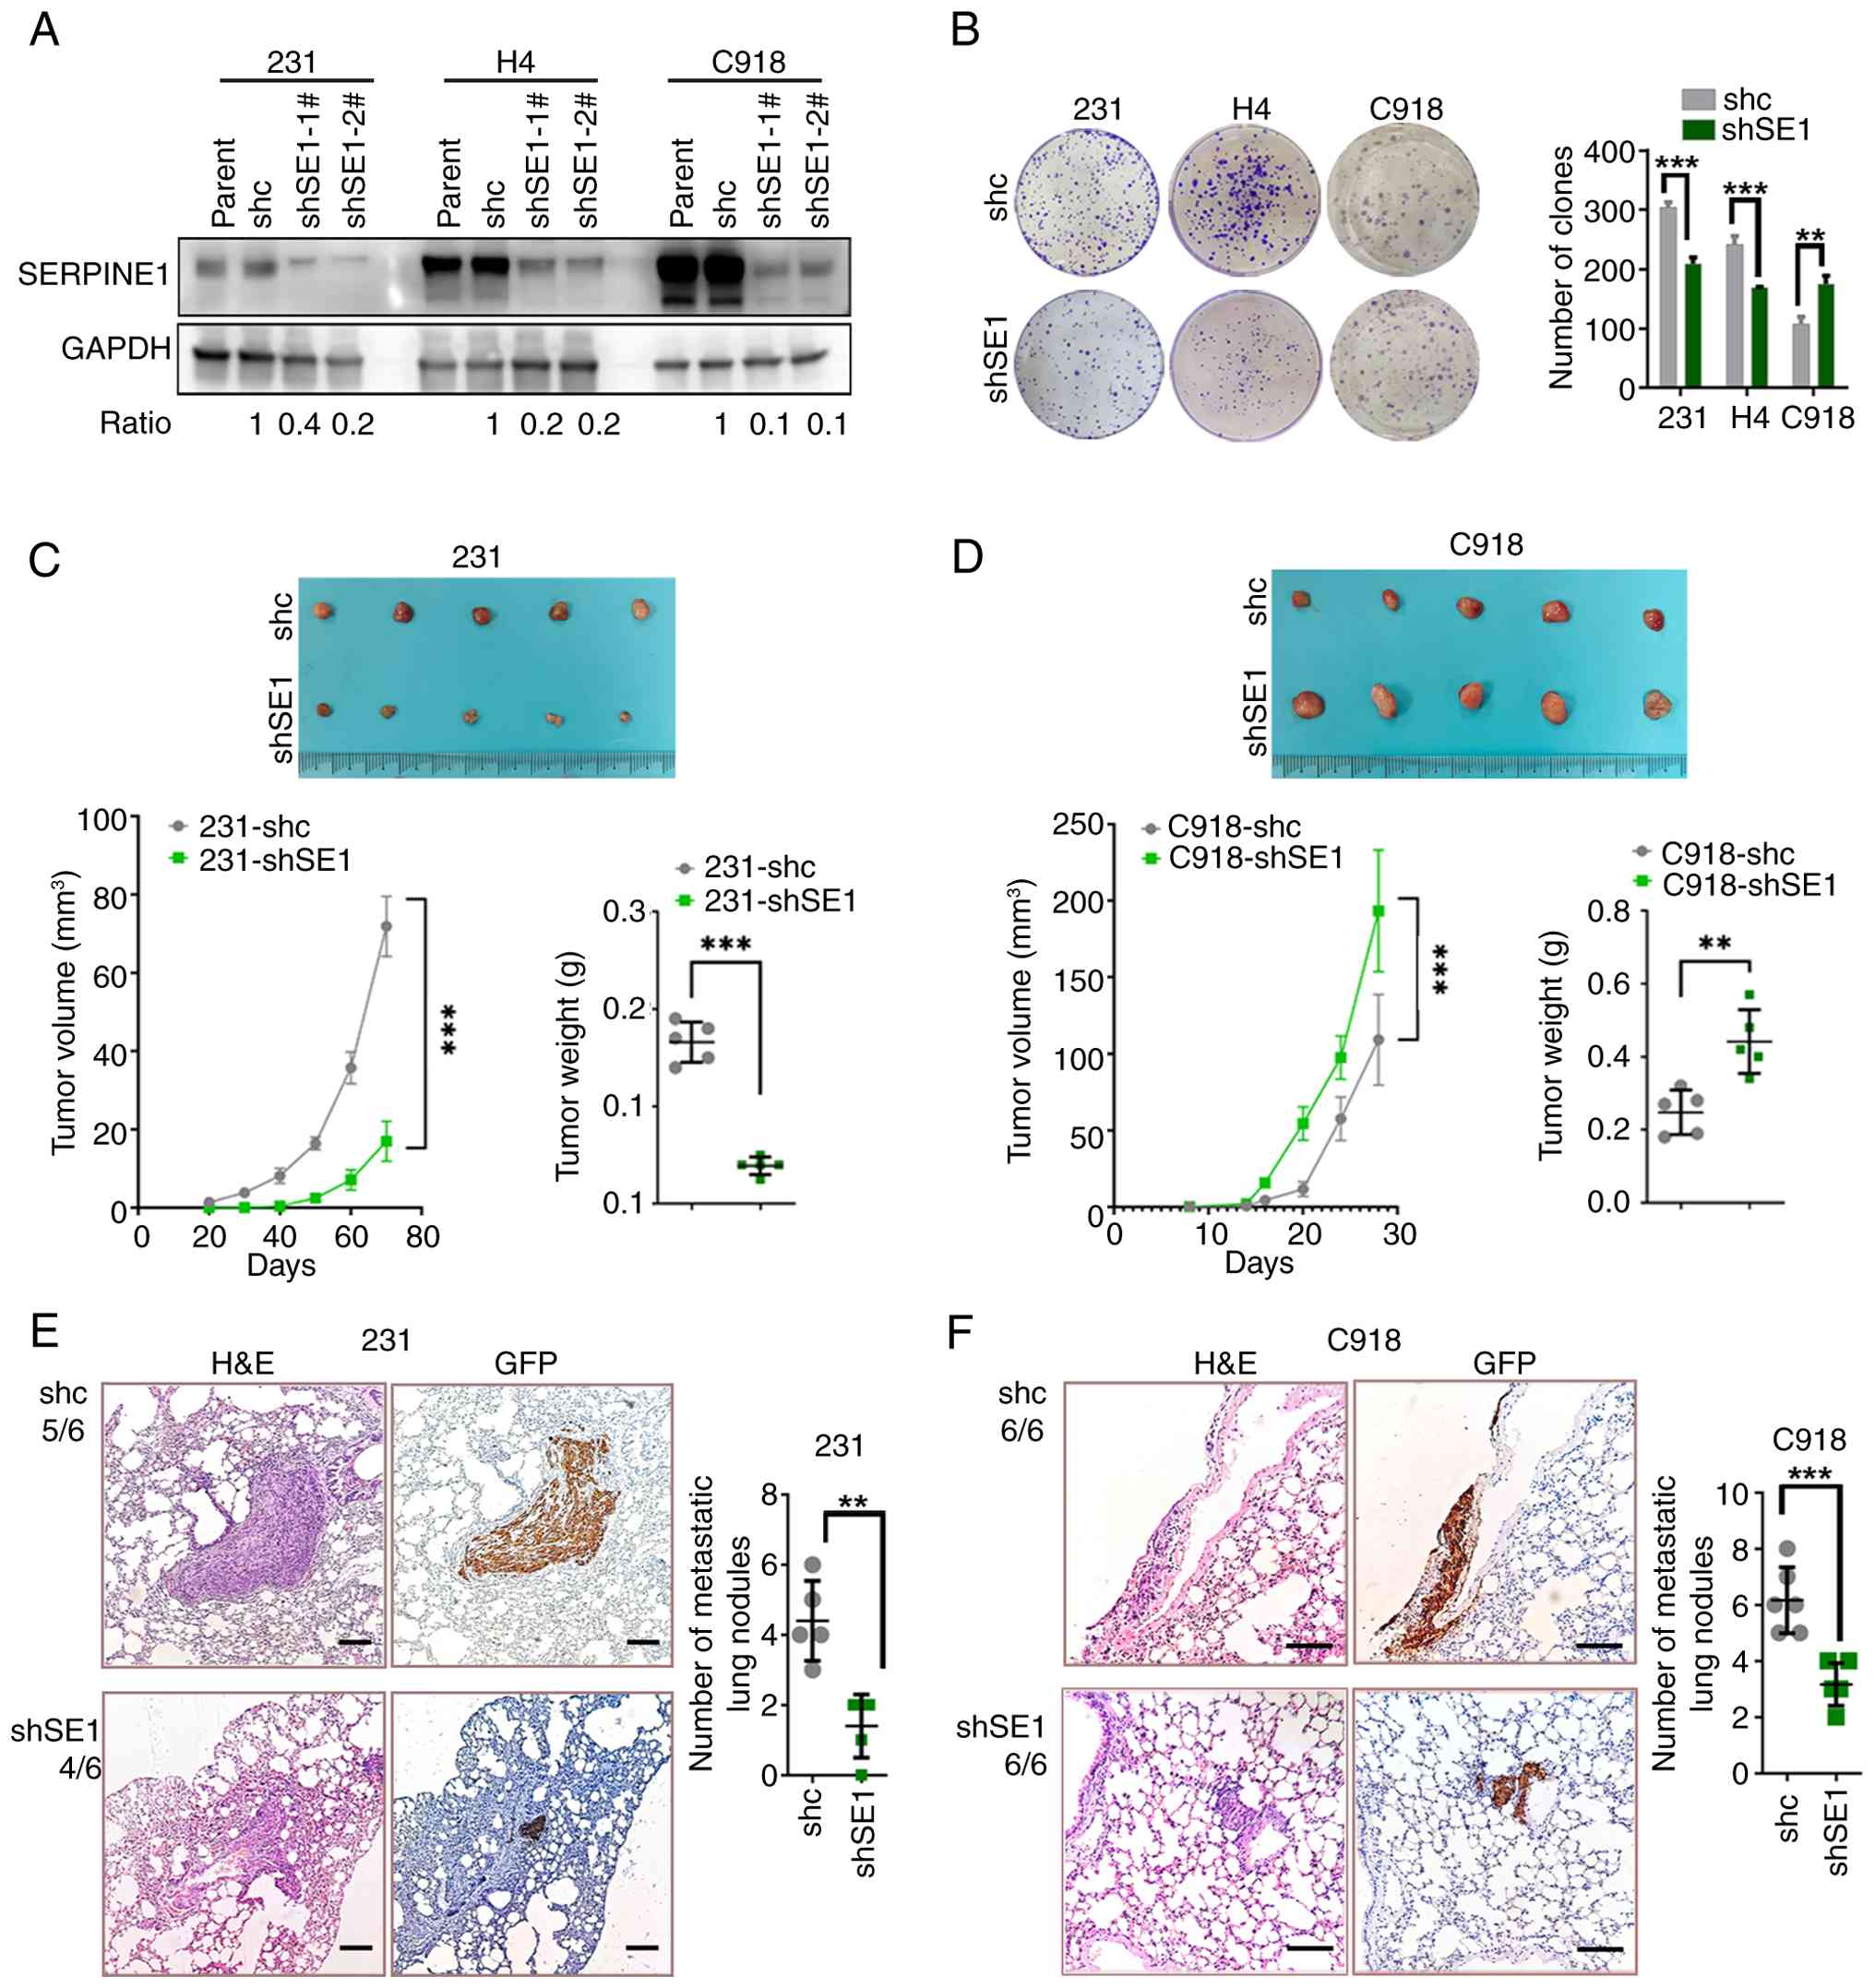 | Figure 2Diverse effects of SERPINE1 knockdown
on cell proliferation. (A) Western blotting showing SERPINE1
protein levels in 231, H4, and C918 cells following transfection
with the shSE1 and shc with GAPDH serving as the loading control.
Band intensities were measured using ImageJ software and are
presented as ratios. These ratios were calculated as (target
protein/GAPDH levels) in the experimental group divided by those in
the control group. Data represent mean ± SDs of three independent
experiments. (B) Colony formation ability of shSE1 and control
(shc) cells. Statistical significance was determined using a
two-sided Student's t test. The data are presented as the means ±
SDs of three independent experiments. (C-D) Xenograft tumors
derived from (C) 231 and (D) C918 cells with shSE1 and shc cells;
the tumor growth and weight were compared between shSE1 and shc
groups. Statistical significance was determined using two-way ANOVA
followed by Šídák's multiple comparisons test (tumor growth) and a
two-sided Student's t test (tumor weight). The data are presented
as the means ± SDs. n=5. (E-F) Lung metastatic foci in nude mice
were stained with H&E and GFP (scale bar, 100 μm). The
fractions (numerator/denominator) adjacent to the images represent
the lung metastatic focus rate (defined as the number of mice with
lung metastases per total number of injected mice). The lung
metastatic focus rate was: 4 of 6 for 231-shSE1 versus 5 of 6 for
231-shc; and 6 of 6 for both C918-shSE1 and C918-shc. Statistical
significance was determined using a two-sided Student's t test. The
data are presented as the means ± SDs. n=6.
***P<0.001, **P<0.01. SERPINE1, serine
protease inhibitor clade e member 1; shRNA, short hairpin RNA;
shSE1, shRNA targeting SERPINE1; shc, shRNA scrambled control;
H&E, hematoxylin and eosin staining; GFP, green fluorescent
protein. |
A subcutaneous xenograft mouse model was
established. Compared with control mice (231-shc), reduced tumor
volumes were observed in 231-shSE1 tumor-bearing mice. In contrast,
increased tumor volumes were detected in C918-shSE1 tumor-bearing
mice compared with their controls (C918-shc; Fig. 2C and D). The metastatic potential
was further evaluated using a lung metastasis mouse model, which
involved a tail vein injection of GFP-expressing cells. GFP
expression was consistently maintained in all the cells (Fig. S1G).
Notably, fewer lung metastatic nodules produced by 231-shSE1 and
C918-shSE1 cells were detected than those produced by control
cells. Lung nodule formation rate (defined as the number of mice
with lung metastases per total number of injected mice) was: 4 of 6
for 231-shSE1 versus 5 of 6 for 231-shc; and 6 of 6 for both
C918-shSE1 and C918-shc (Fig. 2E and
F). H4 cells, which lack tumorigenic capacity, were excluded
from the in vivo experiments. These results suggested that
SERPINE1 can either promote or inhibit tumor cell proliferation
in vivo and in vitro. Tumor metastasis is a complex,
multistep process influenced by various factors and is not solely
contingent on cell proliferation.
SERPINE1-mediated cell cycle
regulation
The present study explored the mechanisms underlying
the differences in cell proliferation by conducting an RNA-seq
analysis to compare gene expression between the SERPINE1 knockdown
and control groups of 231, H4 and C918 cells. DEGs were visualized
in volcano plots (Fig. S2A). The GO enrichment analysis revealed
key biochemical functions of these DEGs (Fig. 3A). Notably, in the comparison
between C918-shSE1 and C918-shc cells, DEGs were markedly enriched
for terms related to cell cycle regulation. These included
'Regulation of transcription involved in the G1/S
transition of the mitotic cell cycle', 'DNA strand elongation
involved in DNA replication', 'Double-strand break repair via
break-induced replication', 'DNA replication initiation' and 'DNA
replication'. A heatmap displays the expression levels of the DEGs
belonging to these enriched biological processes (Fig. 3B). Among these genes,
minichromosome maintenance complex component 3 (MCM3), a key
component of the DNA replication machinery, unwinds DNA at
replication origins and is involved in the synthesis of new DNA
strands during S phase. After replication, MCM3 is phosphorylated
(p-MCM3) and dissociates from the nuclear structure (37,38). As detected by RNA-seq, MCM3 mRNA
expression was 2.35-fold higher in C918-shSE1 cells than in control
C918-shc cells (Fig. 3B). Western
blotting analysis showed an increased ratio of p-MCM3 to total MCM3
protein in C918-shSE1 compared with C918-shc (Fig. 3C). In addition, the proportion of
p-MCM3-positive cells was also higher in C918-shSE1-derived
xenografts. However, SERPINE1 knockdown did not markedly affect
MCM3 or p-MCM3 levels in 231 and H4 cells (Figs. 3C and S2B).
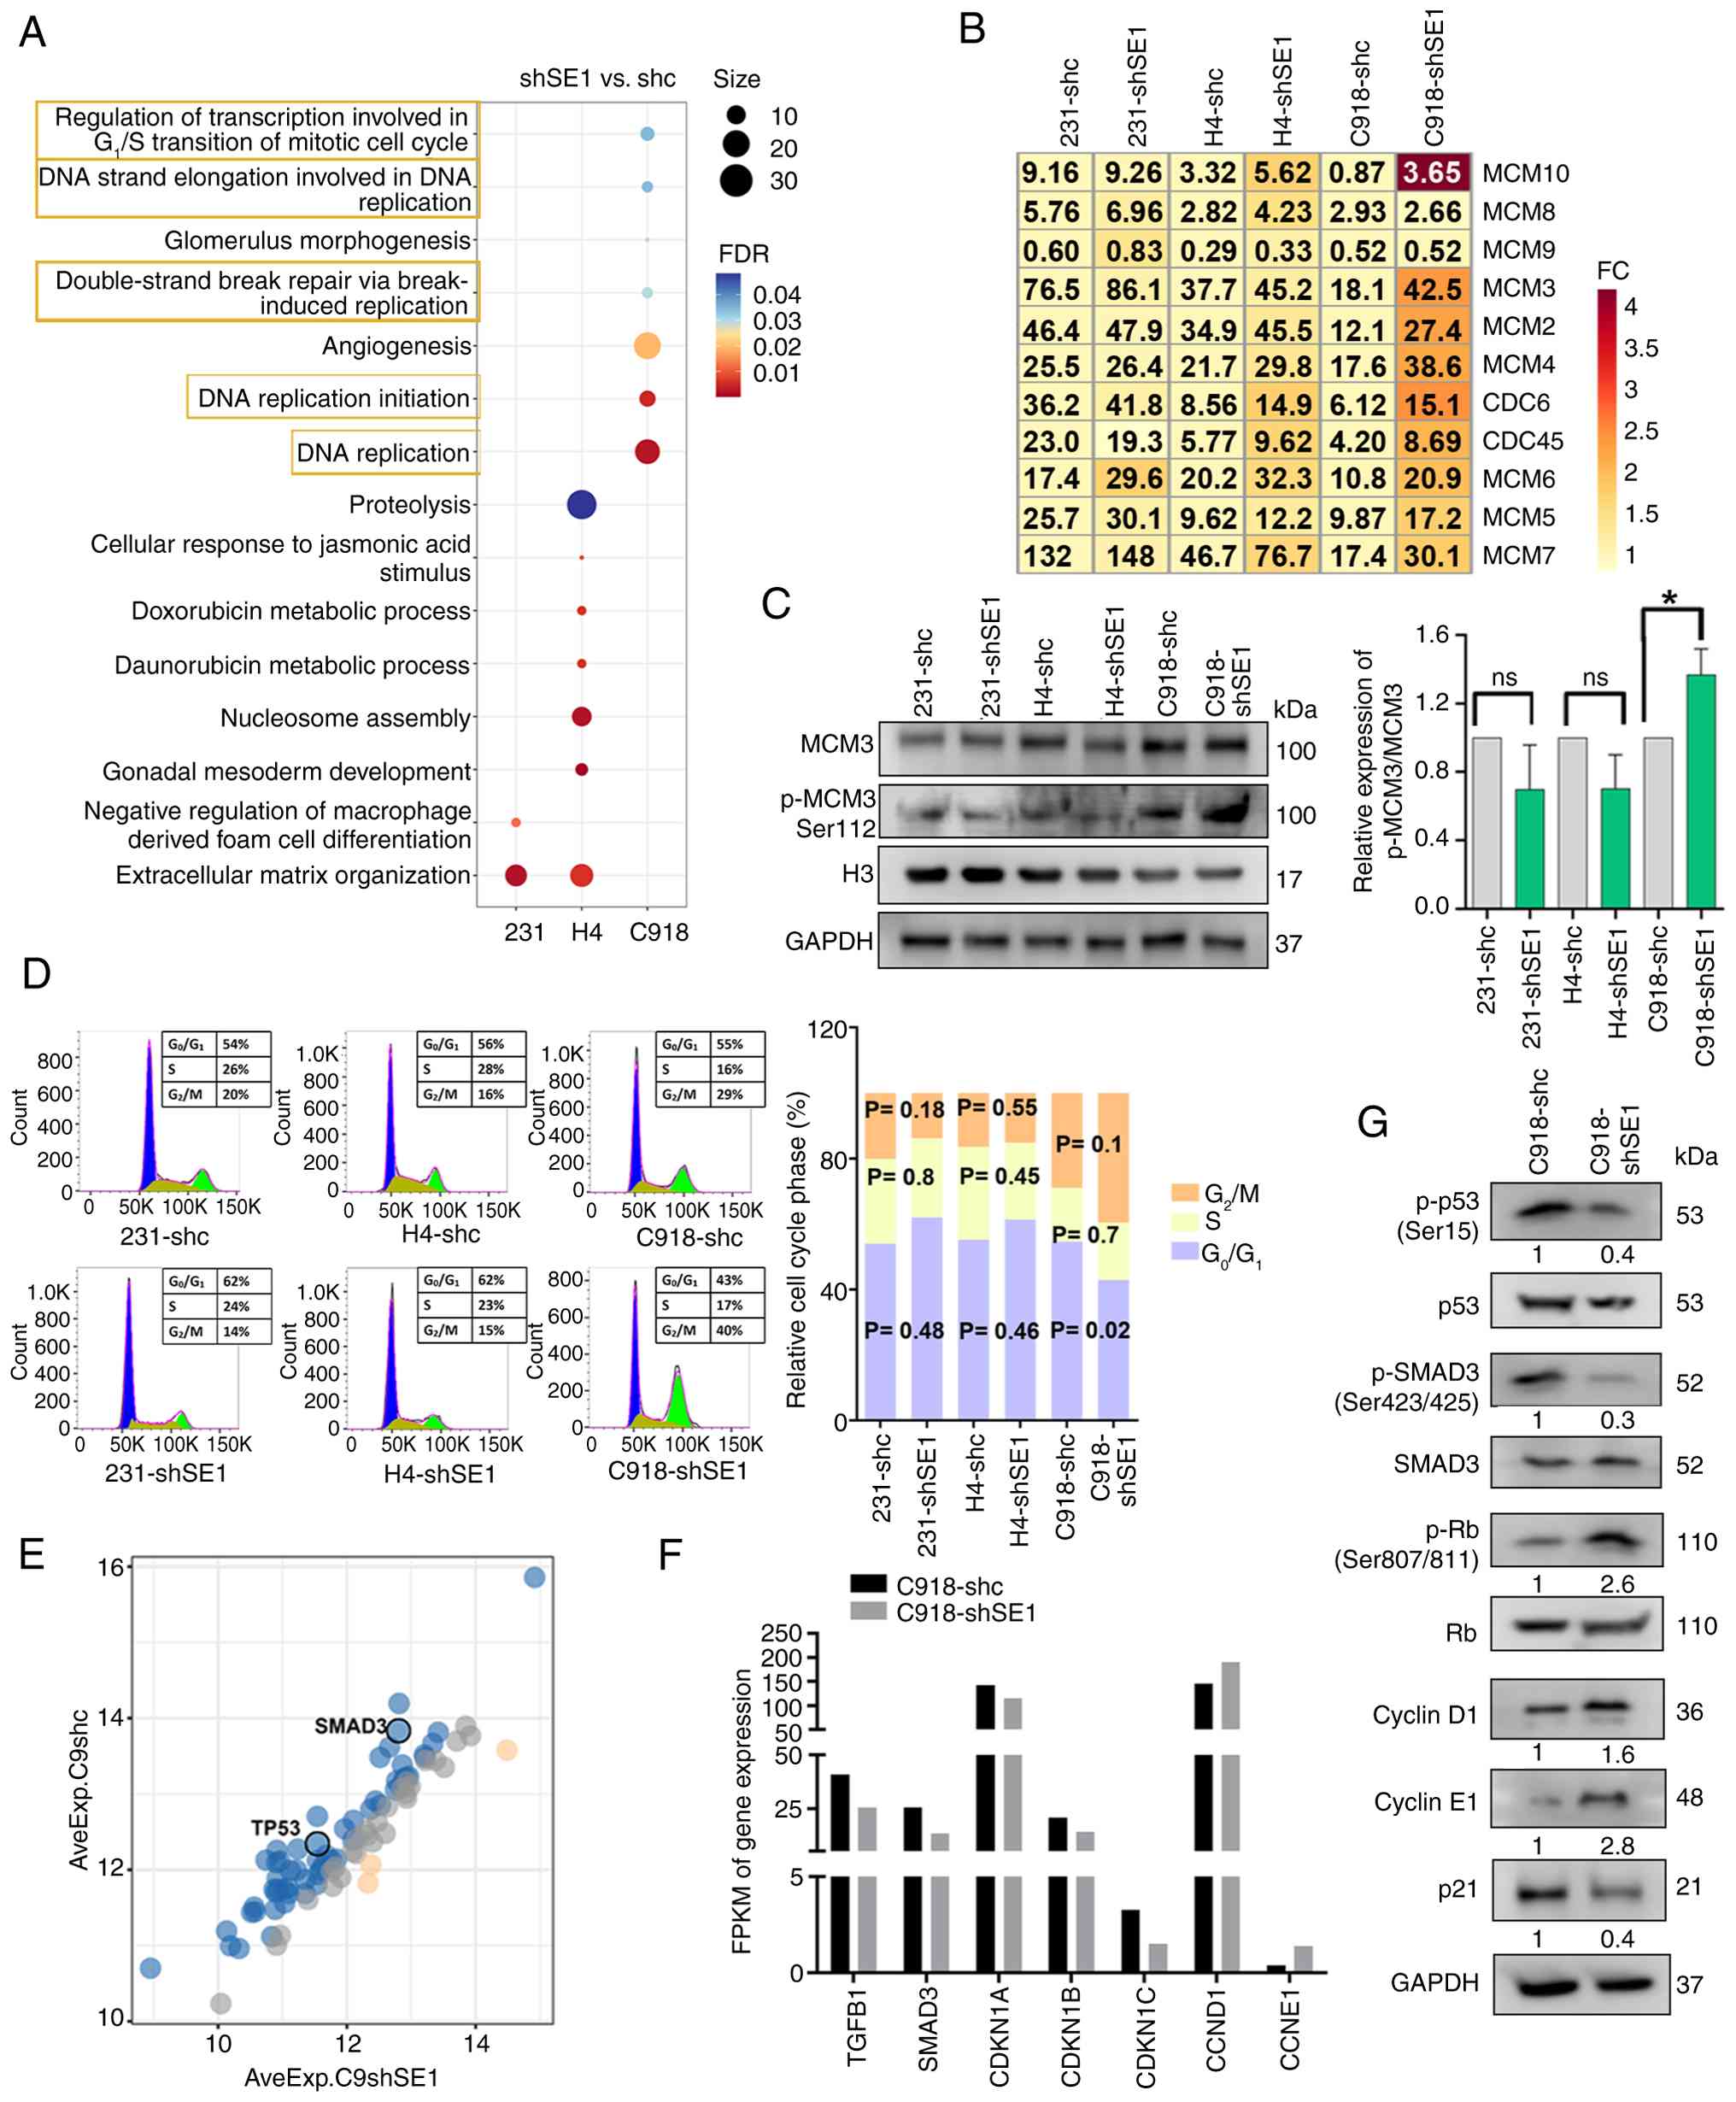 | Figure 3SERPINE1-mediated cell cycle
regulation. (A) The GO enrichment analysis of DEGs obtained from
RNA-seq revealed significant changes in biological processes after
SERPINE1 knockdown between shSE1 and shc groups across three cell
lines. RNA-seq was performed using one biological replicate per
group. (B) Heatmap of DEGs associated with the highlighted
processes in (A). (C) Western blotting was performed on nuclear and
cytoplasmic extracts to detect MCM3 and p-MCM3 levels (histone H3
and GAPDH were used as controls). The relative levels of p-MCM3 and
MCM3 were normalized to the expression of histone H3 and GAPDH,
respectively. The relative p-MCM3/MCM3 ratio was subsequently
calculated. Data represent mean ± SDs of three independent
experiments. (D) Flow cytometry of the cell cycle phase
distribution (G0/G1, S, and G2/M
phases). Statistical significance was determined using a two-sided
Student's t test. The data are presented as the means ± SDs of
three independent experiments. (E) Scatter plot of 89 cycle
regulators from the protein array, highlighting SMAD3 and TP53.
Blue indicates downregulated proteins (fold change ≥1.2); red
indicates upregulated proteins (fold change ≤0.83); and grey
indicates no change in the protein level. n=4 (F) RNA-seq data
showing changes in the indicated gene expression between shSE1 and
shc groups across three cell lines. RNA-seq was performed using one
biological replicate per group. (G) Western blotting of the
indicated proteins in C918 cells (shSE1 vs. shc). The ratios
indicate the relative changes in the expression levels of the
indicated proteins. Data represent mean ± SDs of three independent
experiments. *P<0.05; ns, not significant. SERPINE1,
serine protease inhibitor clade e member 1; GO, Gene Ontology;
DEGs, differentially expressed genes; RNA-seq, RNA sequencing;
shRNA, short hairpin RNA; shSE1, shRNA targeting SERPINE1; shc,
shRNA scrambled control; FDR, false discovery rate; p-,
phosphorylated. |
The effect of SERPINE1 knockdown on the cell cycle
was then assessed. In C918-shSE1 cells, the proportion of cells in
G0/G1 phase decreased markedly compared with
the C918-shc control (P=0.02), while the proportion in
G2/M phase showed an increasing trend (P=0.1). No
significant changes in cell cycle distribution were observed in
either 231-shSE1 or H4-shSE1 cells compared with their respective
shc controls (Fig. 3D).
Furthermore, the present study profiled 89 cell cycle-related
regulatory proteins using a protein array to elucidate the
underlying molecular mechanisms in C918 cells. SERPINE1 knockdown
in C918 cells decreased the levels of key regulatory proteins,
including p53 and SMAD3 (Figs. 3E
and S3A). RNA-seq analysis
showed decreased mRNA levels of TGFB1, SMAD3, and CDKN1A/B/C and
increased mRNA levels of CCND1 and CCNE1 in C918-shSE1 cells
compared with those in control cells (Fig. 3F). Western blotting revealed
reduced p53 and SMAD3 phosphorylation, increased Rb
phosphorylation, increased cyclin D1 and cyclin E1 levels, and
decreased p21 levels in C918-shSE1 cells (Fig. 3G). Given these findings, the
present study sought to confirm that the observed cell cycle
alterations were specifically due to SERPINE1 loss. In C918 cells
with SERPINE1 knockdown, re-expression of an shRNA-resistant
SERPINE1 construct reversed the alterations in the cell cycle
distribution and the expression of associated regulatory proteins
caused by SERPINE1 downregulation (Fig. S3B-D).
TGF-β acts as an upstream regulator of both SERPINE1
and the p53/SMAD3 pathway. Following SERPINE1 knockdown in C918
cells, TGF-β levels were reduced compared with those in control
cells. Based on this finding, the present study treated
SERPINE1-knockdown C918 cells with exogenous TGF-β1. The results
showed that exogenous TGF-β1 supplementation reversed cell cycle
progression and the corresponding changes in protein expression
caused by SERPINE1 knockdown (Fig. S3E-F).
These results indicated that SERPINE1 plays a
crucial role in C918 cell cycle progression by modulating p53 and
SMAD3, which function downstream of the TGF-β pathway.
Mechanistically, SERPINE1 may enhance upstream signaling by
promoting TGF-β1 generation, thereby resulting in a self-amplifying
cascade effect.
SERPINE1-mediated modulation of the
ERK/p38 ratio and anoikis
The mechanisms underlying the effects of SERPINE1
knockdown on the proliferation of 231 cells and H4 cells have not
yet been elucidated. Given the influence of SERPINE1 on the
uPA/uPAR axis, it may indirectly modulate cancer cell proliferation
by affecting the balance between ERK activity and p38 activity
(39-41). The present study aimed to evaluate
the ratio of ERK/p38 activities, a known determinant of cancer cell
proliferation or dormancy. SERPINE1 knockdown increased p-p38
levels in both 231 and H4 cells. In 231-shSE1 cells, p-ERK levels
were markedly decreased, while no significant change was observed
in H4-shSE1 cells. This decrease in the phosphorylation of these
proteins reduced the ERK/p38 activity ratio in both 231-shSE1 and
H4-shSE1 cells compared with their respective shc controls. No
significant changes in p-ERK or p-p38 levels were detected in
C918-shSE1 cells compared with the C918-shc control. Additionally,
the levels of phosphorylated JNK and AKT, which markedly and
variably affect cancer cell proliferation (42,43), remained unchanged following
SERPINE1 downregulation (Fig.
4A).
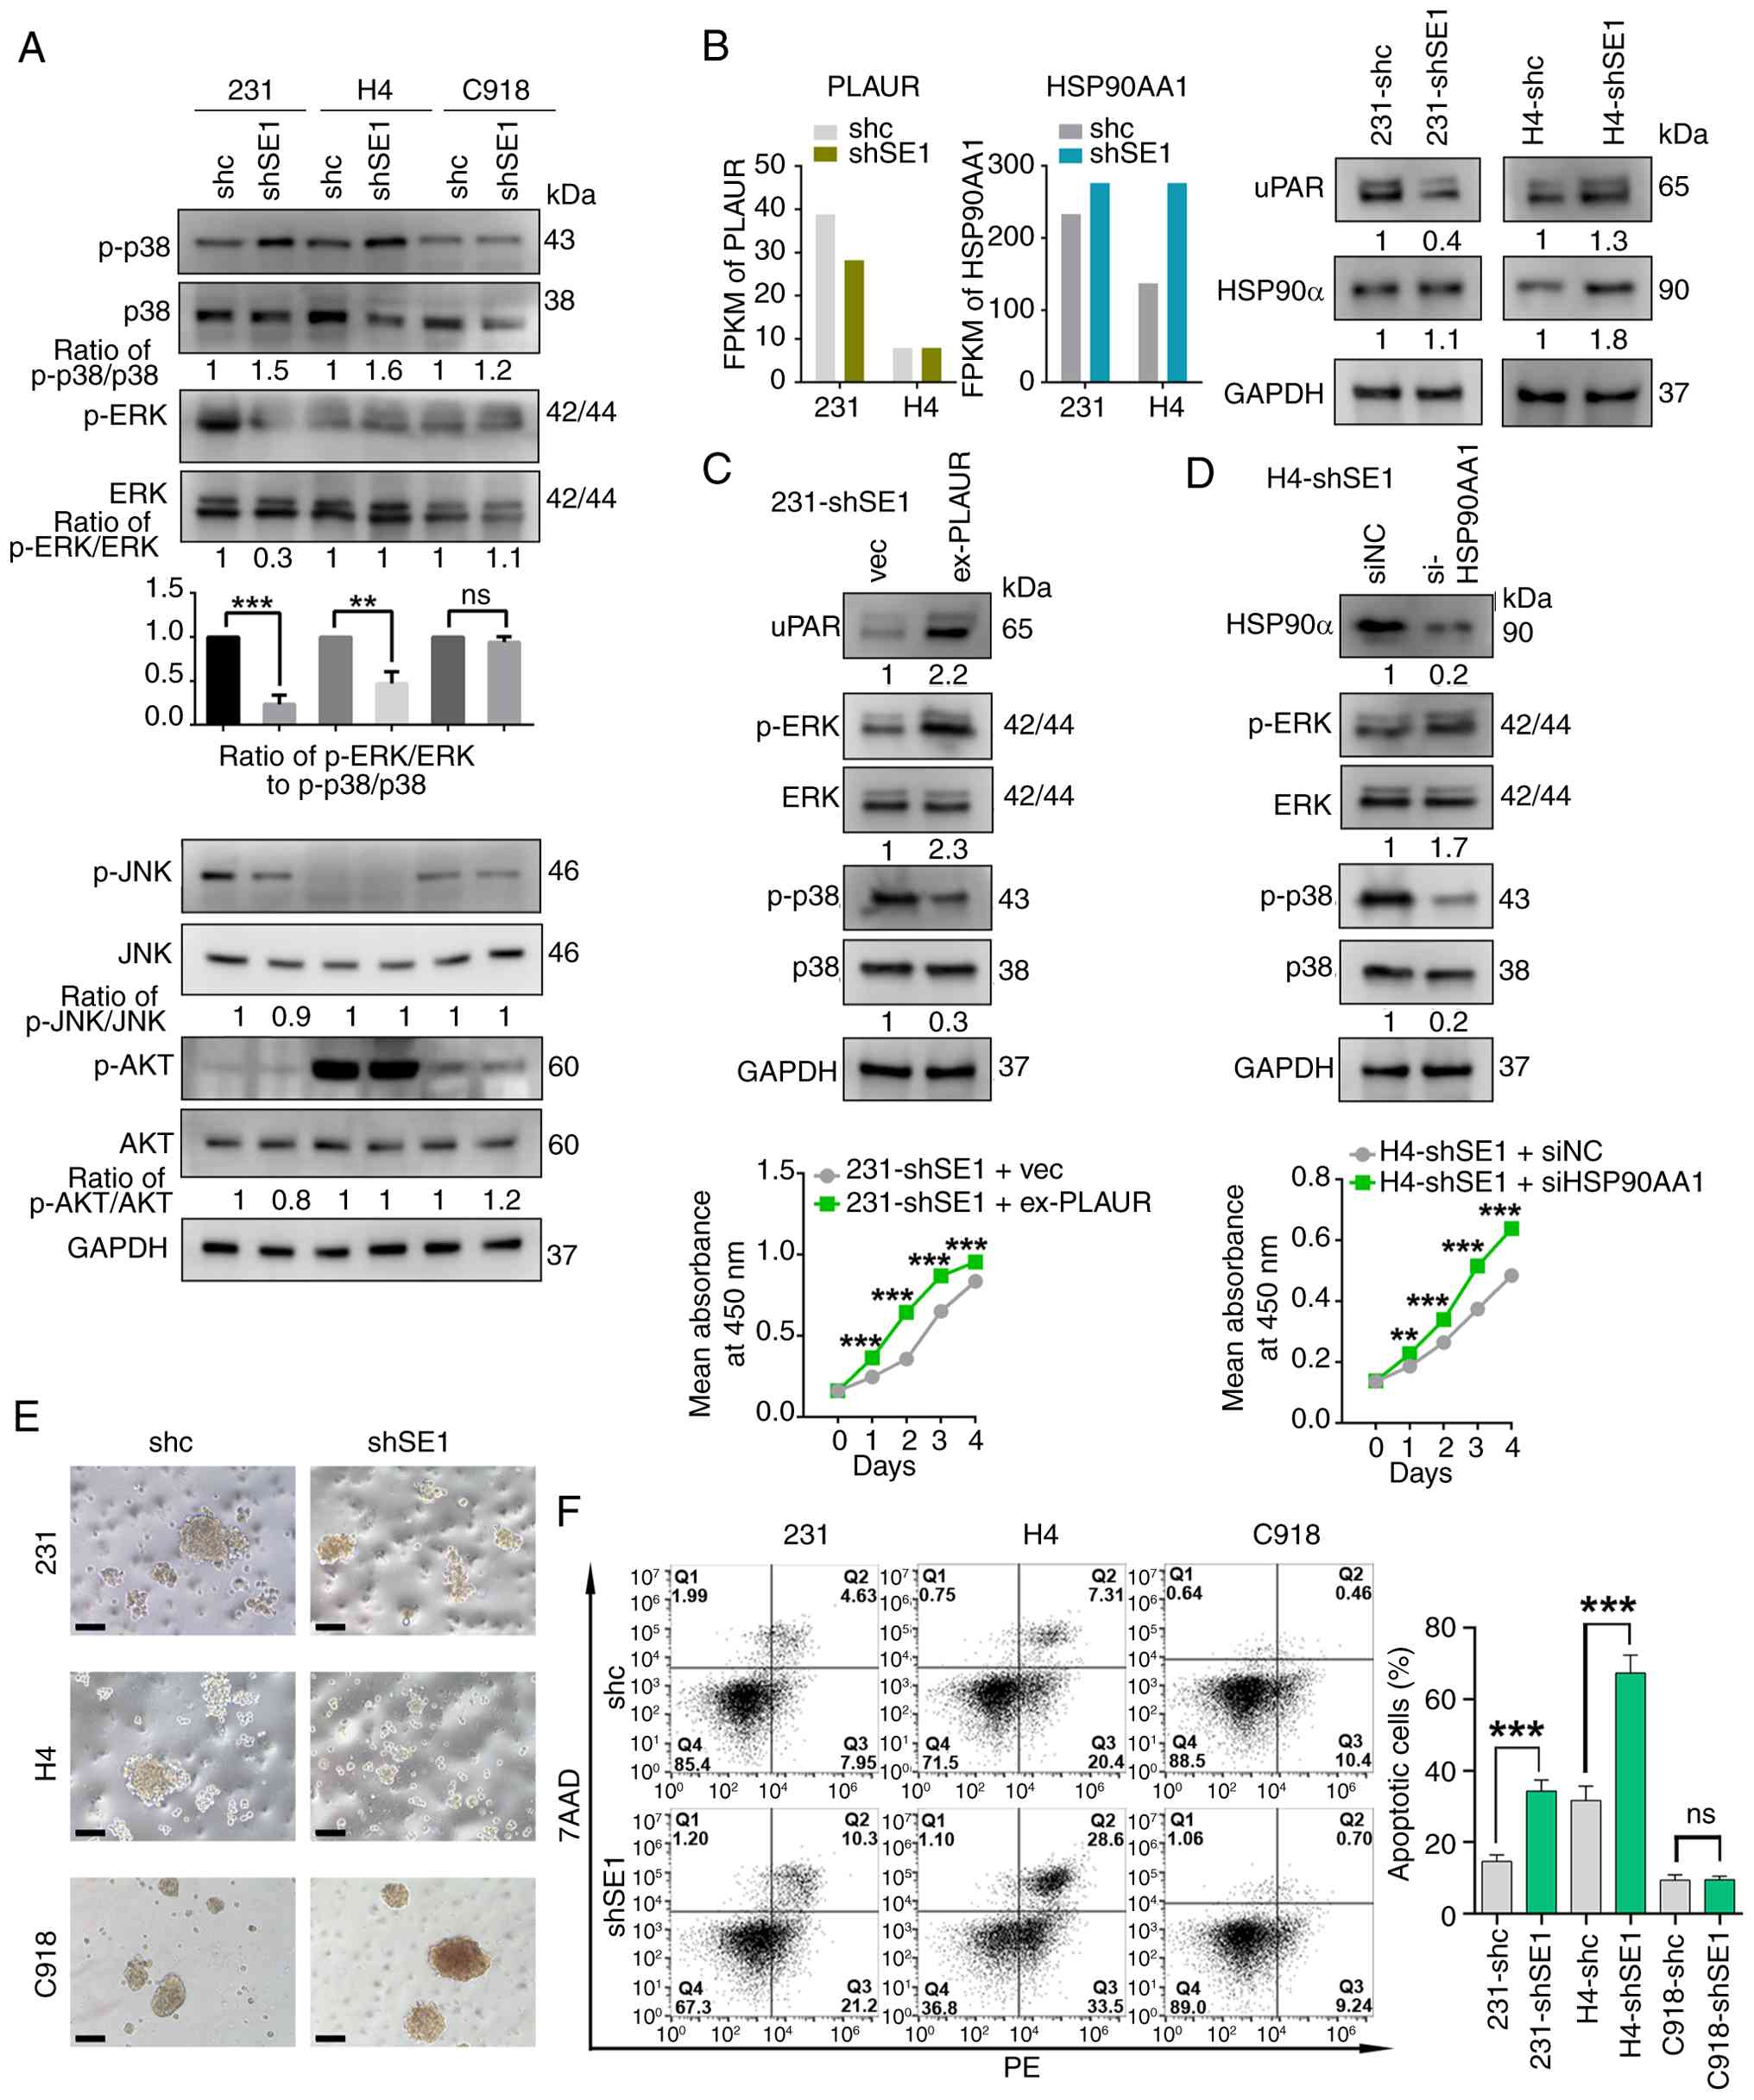 | Figure 4SERPINE1-mediated modulation of the
ERK/p38 ratio and anoikis. (A) Upper panel: western blotting
showing ERK, p-ERK, p38, and p-p38 levels. Quantitative data showed
the p-ERK/ERK and p-p38/p38 ratios in SERPINE1 knockdown cells
compared with control cells. Lower panel: western blotting analysis
of p-AKT, AKT, p-JNK and JNK (normalized to total protein) levels
in the shSE1 and shc groups. The numbers beneath the bands
represent the ratios of the expression levels of the indicated
proteins. Data represent mean ± SDs of three independent
experiments. (B) PLAUR and HSP90AA1 mRNA and protein levels in
shSE1 and shc cells analyzed using RNA-seq (left panel) and western
blotting (right panel). The numbers beneath the bands represent the
ratios of the expression levels of the indicated proteins and
represent mean ± SDs of three independent experiments. RNA-seq was
performed using one biological replicate per group. (C-D) Upper
panel: (C) 231-shSE1 cells were infected with lentivirus containing
PLAUR cDNA (ex-PLAUR) or the corresponding empty vector control
(vec). (D) H4-shSE1 cells were transfected with siRNA targeting
HSP90AA1 (si-HSP90AA1) or siNC. The expression levels of uPAR and
HSP90α, as well as the activity of ERK and p38, were detected by
western blotting, with GAPDH serving as the loading control. Data
represent mean ± SDs of three independent experiments. Lower panel:
Cell proliferation was assessed by CCK-8 assay in 231-shSE1 cells
infected with ex-PLAUR or vec, and in H4-shSE1 cells transfected
with si-HSP90AA1 or siNC. Statistical significance was determined
using two-way ANOVA followed by Šídák's multiple comparisons test.
The data are presented as the means ± SDs. n=6. (E) Morphology of
shSE1 and shc cells cultured under suspension condition. (scale
bar, 100 μm). (F) Apoptotic cells cultured under suspension
condition were analyzed by flow cytometry following Annexin
V-PE/7AAD staining (72 h of suspension culture). Statistical
significance was determined using a two-sided Student's t test. The
data are presented as the means ± SDs of three independent
experiments. **P<0.01 ***P<0.001, ns,
not significant. SERPINE1, serine protease inhibitor clade e member
1; p-, phosphorylated; shRNA, short hairpin RNA; shSE1, shRNA
targeting SERPINE1; shc, shRNA scrambled control; PLAUR,
plasminogen activator, urokinase receptor; HSP90AA1, heat shock
protein 90 alpha family class a member 1; RNA-seq, RNA sequencing;
vec, empty vector control; siRNA, short interfering RNA; siNC,
negative control siRNA; uPAR, urokinase-type plasminogen activator
receptor; HSP90α, heat shock protein 90-alpha. |
Given that uPAR regulates the ERK/p38 pathway
(40,44), the present study measured the
protein and mRNA levels of uPAR. SERPINE1 downregulation reduced
uPAR expression in 231 cells but not in H4 cells (Fig. 4B). Therefore, the present study
further analyzed gene sets associated with SERPINE1 expression in
BRCA, LGG and SKCM tumors using the GEPIA2 platform. The KEGG
pathway enrichment analysis of the three gene sets revealed that
the IL-17 signaling pathway was quite noticeably enriched in LGG
(FDR=0.05), while it was not markedly enriched in BRCA (FDR=0.30)
or SKCM (FDR=0.27; Fig. S4). Similarly, the KEGG pathway enrichment
analysis of genes that were differentially expressed after SERPINE1
knockdown in the three cell lines revealed the unique enrichment of
the IL-17 signaling pathway in H4 cells (Fig. S5). IL-17 signaling
promotes p38 phosphorylation through the Act1-TRAF6 axis. HSP90α
enhances this process by stabilizing Act1, thereby facilitating
IL-17-mediated p38 activation (45,46). As predicted, the present study
found that HSP90α protein and mRNA expression increased in H4-shSE1
cells but not in 231-shSE1 cells (Fig. 4B). Then, the present study tested
the effects of uPAR and HSP90α on ERK/p38 activity and cell growth
by overexpressing uPAR in 231-shSE1 cells and knocking down HSP90α
in H4-shSE1 cells. The overexpression of uPAR in 231-shSE1 cells
reversed the changes in the ERK/p38 activity ratio and cell growth,
increasing p-ERK levels and decreasing p-p38 levels (Fig. 4C). HSP90α knockdown in H4-shSE1
cells modulated ERK/p38 signaling and cell proliferation by
reducing p-p38 levels and increasing p-ERK levels (Fig. 4D).
To explore additional mechanisms, the present study
used WGCNA to focus on SERPINE1-associated modules in TCGA datasets
for BRCA, LGG and SKCM (Fig. S6A-E). Considering the role of the
Wnt pathway in tumor stemness in BRCA and SKCM and the prominence
of cellular differentiation pathways in LGG, the present study
proceeded to examine changes in stemness in vitro. Cancer
stem cells (CSCs), which are characterized by self-renewal and
stem-like properties, can be modulated by SERPINE1 (47). Using a suspension culture of CSCs,
the present study investigated the expression of the stemness
marker CD133, a key CSC marker, across different tumor types. The
percentage of CD133-positive cells was slightly increased in
231-shSE1 (mean 0.35 vs. 0.23%; P=0.001) and H4-shSE1 (mean 0.39
vs. 0.26%; P=0.014) cells and slightly decreased in C918-shSE1
cells (mean 0.94 vs. 1.65%; P=0.0003) compared with that in control
cells (Fig. S7A). Given the low proportion of CD133-positive cells,
further research is needed to determine whether these minor changes
can affect the overall cell proliferation phenotype.
Considering that SERPINE1 is involved in cellular
senescence and apoptosis, which also impact proliferation, the
present study performed SA-β-galactosidase (SA-β-gal) staining and
apoptosis assays on adherent cells. No significant differences in
SA-β-gal positivity or apoptosis were detected between the SERPINE1
knockdown and control groups (Fig. S7B and C). These findings
indicated that reducing SERPINE1 expression alone may not be
adequate to induce cellular senescence and apoptosis in adherent
cells.
Consequently, the present study explored anoikis in
nonadherent suspension cultures and found that SERPINE1
downregulation markedly induced anoikis in 231 and H4 cells but not
in C918 cells (Fig. 4E and F).
Similarly, following the restoration of SERPINE1 expression, the
alterations caused by SERPINE1 knockdown, including changes in the
ERK/p38 ratio, the expression of uPAR and HSP90α, and anoikis were
reversed (Fig. S8A-C). Overall, SERPINE1 downregulation promotes
the proliferation of C918 cells by inducing cell cycle progression
but inhibits the proliferation of 231 and H4 cells by altering the
ERK/p38 balance and inducing anoikis.
Variable effects of SERPINE1 on cell
migration and invasion
Multiple studies have established a role for
SERPINE1 in promoting tumor migration and invasion (19-24). Corroborating this role, key
motility-related KEGG pathways ('Regulation of actin cytoskeleton',
'Leukocyte transendothelial migration', and 'Focal adhesion') were
enriched in high-SERPINE1 groups of BRCA, LGG, and SKCM (Fig. 5A). Then, the present study
explored cell migration and invasion using the conventional
Transwell method under in vitro conditions. In the Transwell
migration assay, SERPINE1 knockdown inhibited the migration of 231,
H4 and C918 cells in all the shSE1 groups compared with their
respective shc controls (Fig.
5B). Furthermore, the present study assessed the capacity of
cells to invade the extracellular matrix by performing a Transwell
invasion assay in which the porous membrane was coated with
Matrigel (a commonly used extracellular matrix comprising ~60%
laminin, 30% type IV collagen, 8% entactin and some growth factors)
and collagen I to allow invasive cells to migrate chemotactically.
In chambers coated with Matrigel and collagen I, the number of
cells that migrated through the Transwell membrane was decreased in
231-shSE1 and C918-shSE1 cells compared with the control group,
whereas it was increased in H4-shSE1 cells, suggesting that
downregulation of SERPINE1 enhances the invasive ability of H4
cells (Fig. 5C and D). In
addition, after SERPINE1 expression was restored, the impairments
in cell migration and invasion caused by SERPINE1 knockdown were
reversed (Fig. S9A-C). These
data suggested that the effects of SERPINE1 on cell migration and
invasion are also controversial.
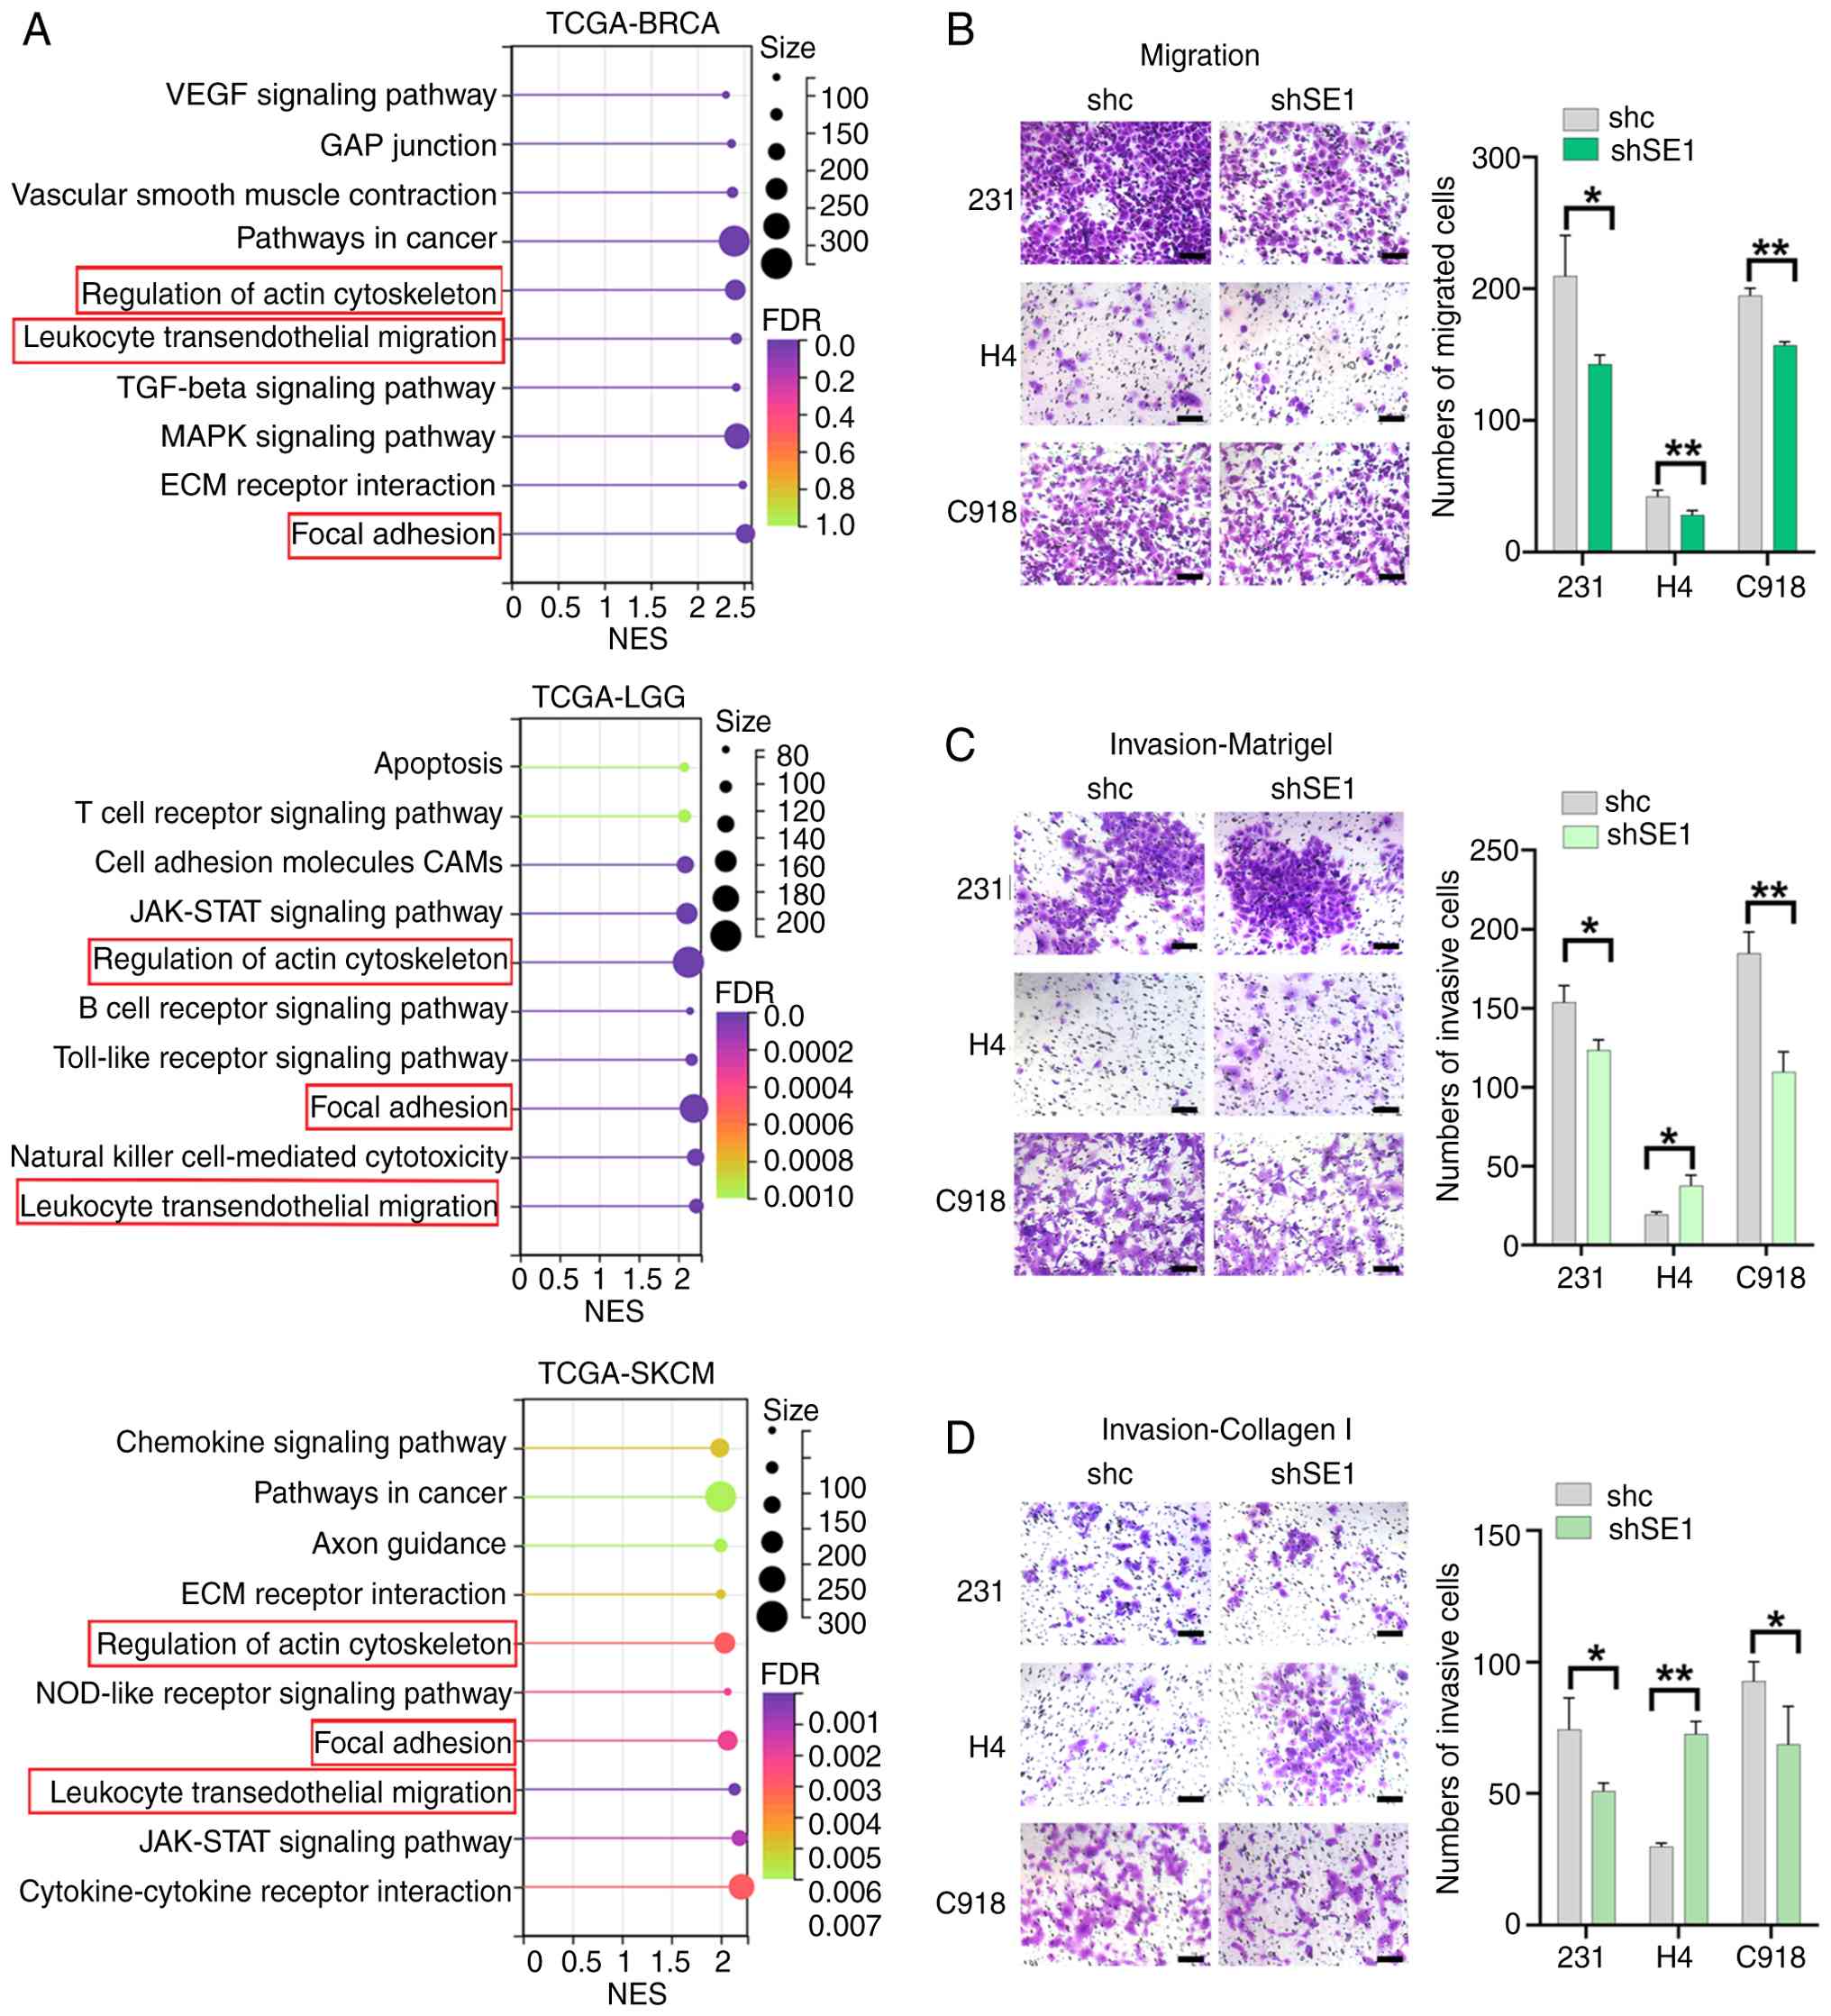 | Figure 5Variable effects of SERPINE1 on cell
migration and invasion. (A) KEGG enrichment analysis via GSEA
comparing high and low SERPINE1 expression in BRCA, LGG, and SKCM
(TCGA dataset). Representative images and quantification of
Transwell assays of the migration (B) of shSE1 and shc cells.
Representative images and quantification of Transwell invasion
assays through (C) Matrigel and (D) collagen type I. Cells from
three random fields in triplicate wells were counted. Scale bar,
100 μm. Statistical significance was determined using a
two-sided Student's t test. The data are presented as the means ±
SDs of three independent experiments. **P<0.01,
*P<0.05. SERPINE1, serine protease inhibitor clade e
member 1; KEGG, Kyoto Encyclopedia of Genes and Genomes; GSEA, gene
set enrichment analysis; BRCA, breast cancer; LGG, low-grade
glioma; SKCM, skin cutaneous melanoma; TCGA, The Cancer Genome
Atlas; NES, normalized enrichment score; FDR, false discovery
rate. |
SERPINE1 regulates MMP and TIMP
activities
The results of the invasion assay prompted a further
investigation into the underlying mechanisms involved. MMPs, a
family of enzymes, facilitate the degradation of extracellular
matrix components, including collagen, elastin, fibronectin,
laminin and proteoglycans (48).
Due to their crucial roles in ECM proteolysis and cell motility,
semiquantitative antibody arrays were used to analyze the
expression profiles of seven MMPs and three TIMPs in cell
supernatants. To this end, the present study found that SERPINE1
knockdown differentially altered MMP/TIMP levels across cell lines:
in the 231-shSE1 group, levels of MMP-1, -9, -10, and -13 decreased
relative to the 231-shc control; in the H4-shSE1 group, levels of
MMP-1 and TIMP-2 increased, while those of MMP-2, -8, -13, and
TIMP-4 decreased compared with the H4-shc control; in the
C918-shSE1 group, levels of MMP-1, -3, -10, and -13 decreased
relative to the C918-shc control (Fig. 6A). Notably, MMP-1 expression was
reduced in 231-shSE1 and C918-shSE1 cells but increased in H4-shSE1
cells and MMP-13 expression was consistently reduced in all the
SERPINE1 knockdown groups. To confirm the activity results of these
two MMPs, the present study subsequently quantified the levels of
MMP-1 and MMP-13 activity using a fluorescent ELISA. Results showed
that MMP-1 activity was markedly decreased in 231-shSE1 and
C918-shSE1 cells compared with the control group, whereas it was
increased in H4-shSE1 cells. For MMP-13 activity, a decrease was
observed in 231-shSE1 and H4-shSE1 cells relative to controls;
however, no significant difference was found between the knockdown
group and the control group in C918 cells (Fig. 6B). Following the restoration of
SERPINE1 expression, the reduced activity of MMP-1 and MMP-13
caused by SERPINE1 knockdown was reversed (Fig. S10). Although
SERPINE1 downregulation in H4 cells induced complex alterations in
the levels of MMPs and TIMPs, the net effect was an increase in
cellular invasiveness. This outcome might be predominantly
attributed to the increased levels of MMP-1, which could override
the combined effects of other altered MMPs and TIMPs on governing
cell invasion.
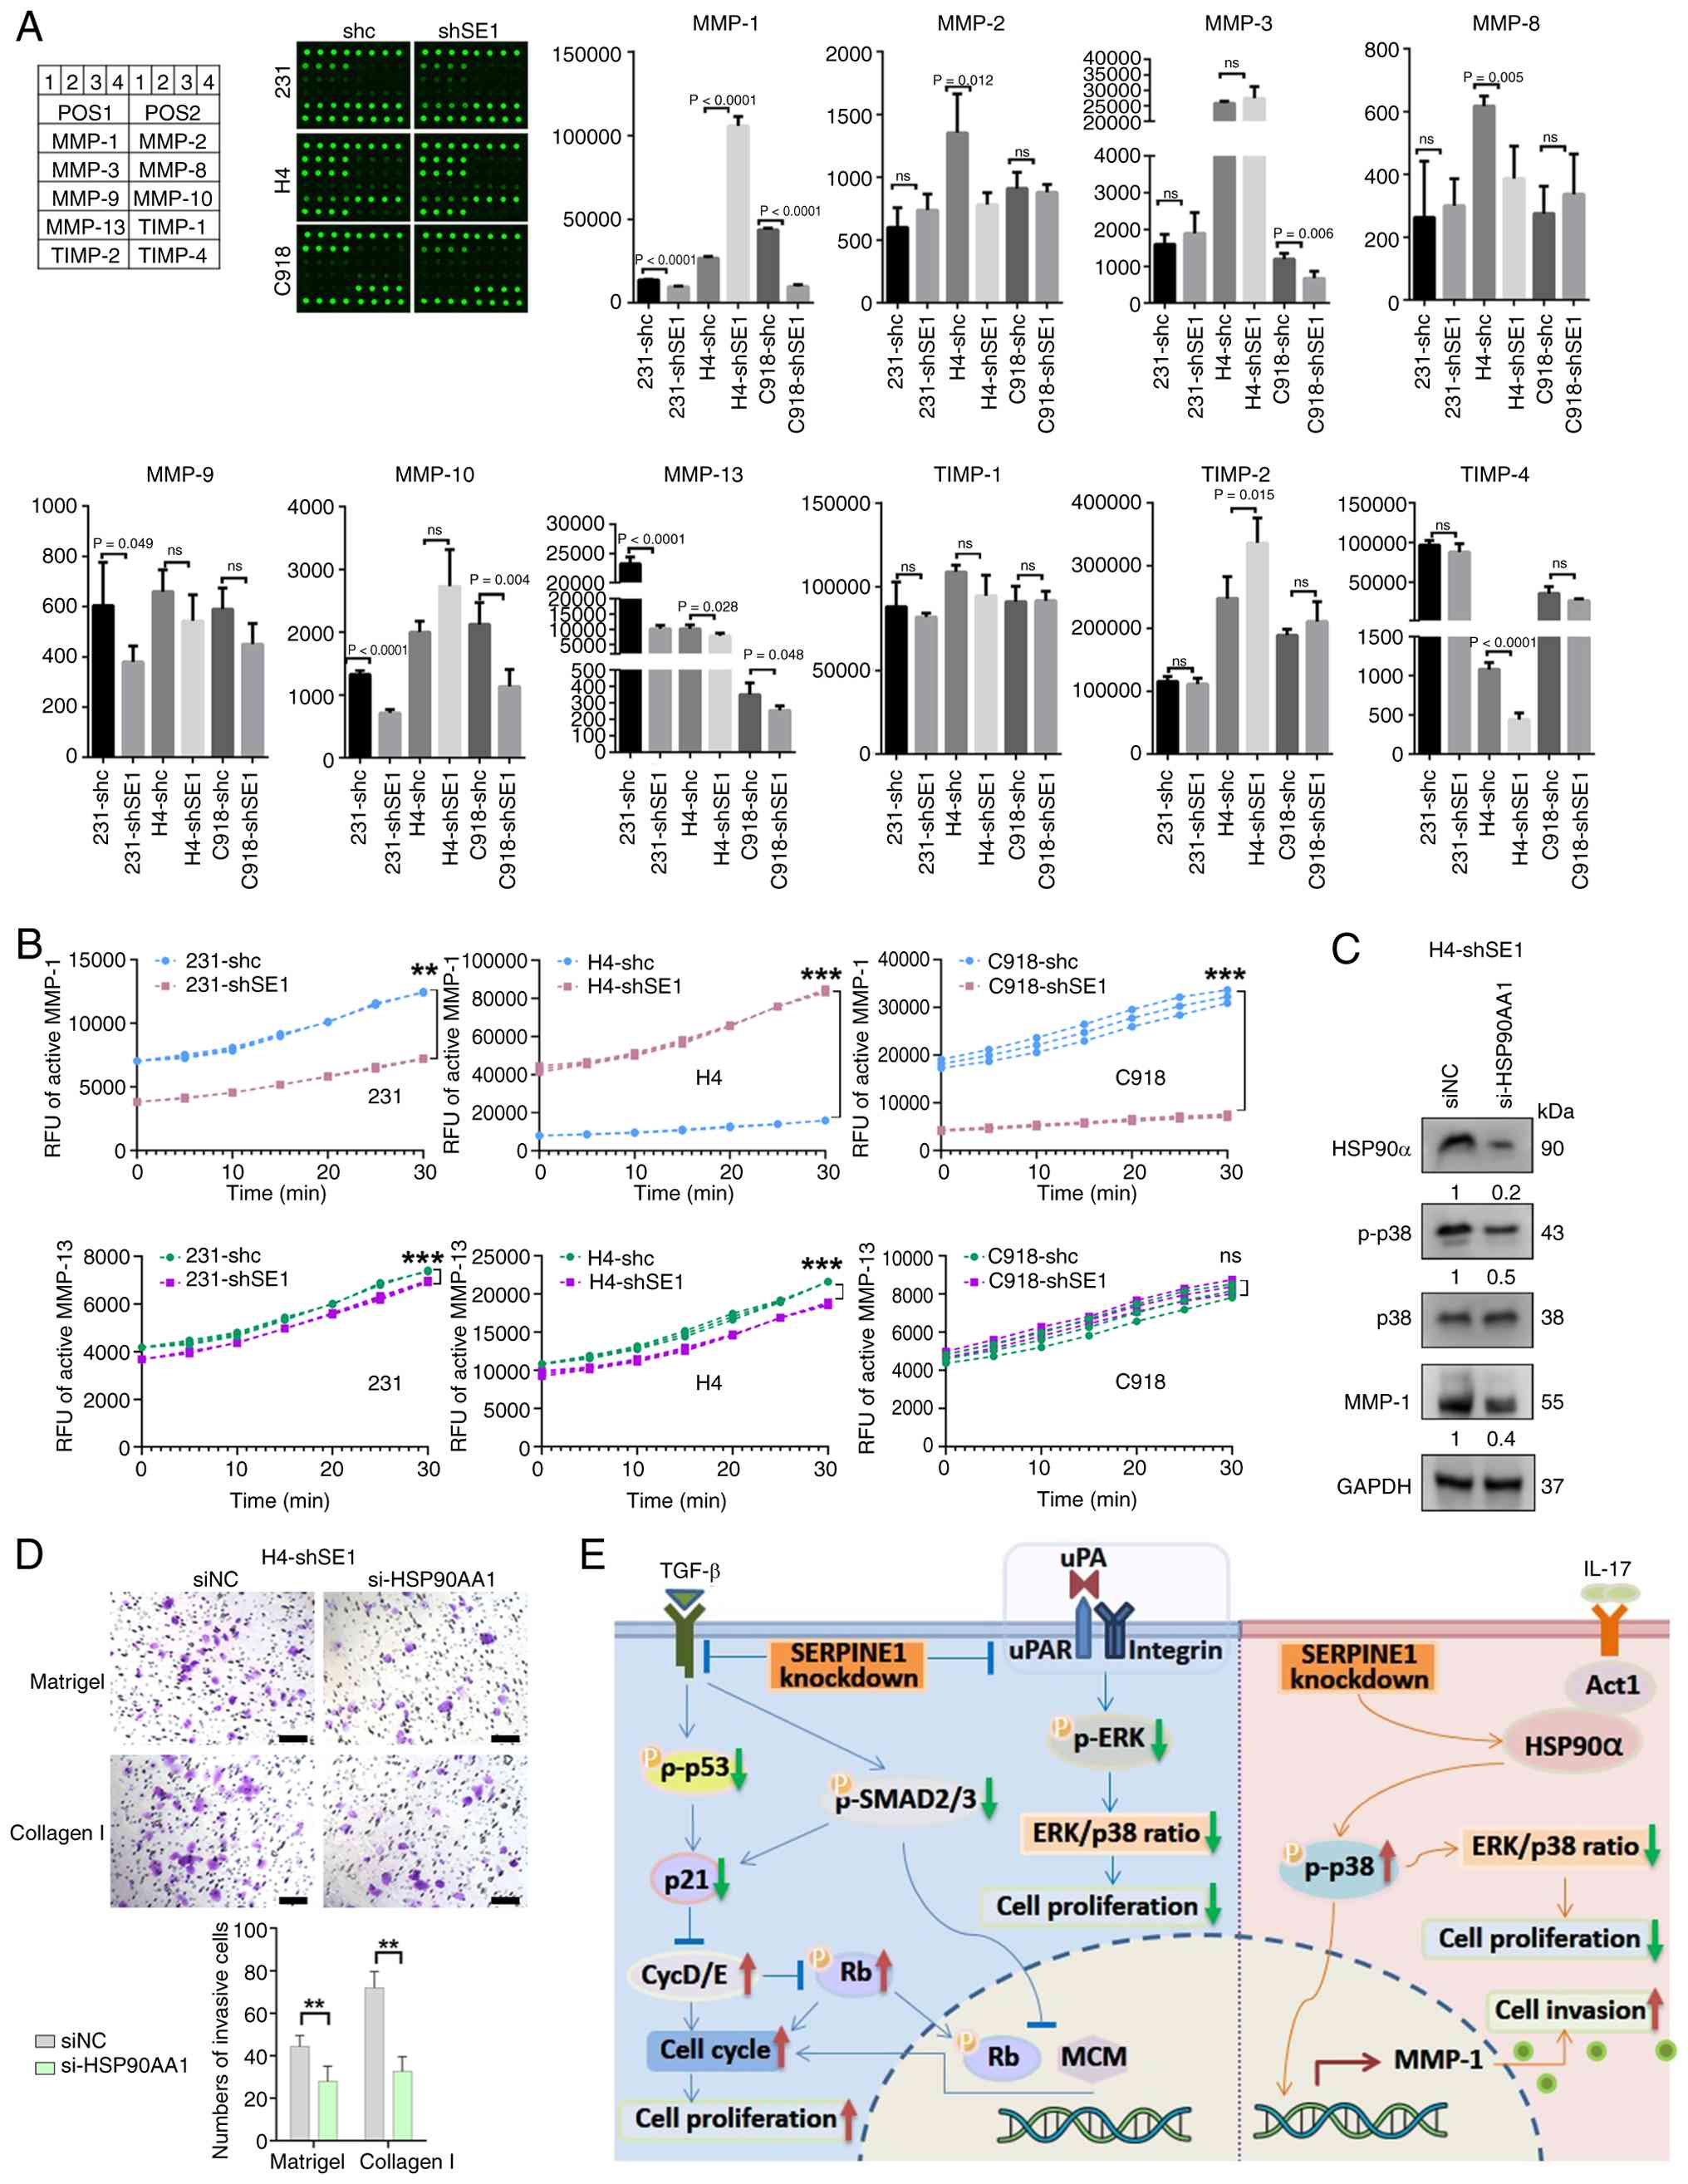 | Figure 6SERPINE1 regulates MMP activity. (A)
MMP and TIMP levels in the supernatants of shSE1 and shc cells
after 24 h of incubation and 10-fold concentration. Statistical
significance was determined using a two-sided Student's t test. The
data are presented as the means ± SDs. n=4. (B) Quantification of
active MMP-1 and MMP-13 levels in cell lysates using fluorescence
ELISA. Statistical significance was determined using two-way ANOVA
followed by Šídák's multiple comparisons test. The data are
presented as the means ± SDs of three independent experiments. (C)
Western blotting showing the levels of the indicated proteins in
H4-shSE1 cells at 72 h after transfection with the si-HSP90AA1 or
siNC. The numbers beneath the bands represent the ratios of the
expression levels of the indicated proteins and represent mean ±
SDs of three independent experiments. (D) Representative images and
quantification of Transwell invasion assays through Matrigel and
collagen type I in H4-shSE1 cells transfected with the si-HSP90AA1
or siNC (scale bar, 100 μm). Statistical significance was
determined using a two-sided Student's t-test. The data are
presented as the means ± SDs of three independent experiments. (E)
Diagram showing the mechanisms underlying the effects of SERPINE1
on cancer proliferation and invasion. SERPINE1 knockdown influences
cell proliferation and invasion through distinct signaling
pathways. With respect to proliferation, SERPINE1 knockdown reduces
TGF-β levels, and this reduction alters the activity of SMAD3, p53,
and MCM3 to promote cell cycle progression. SERPINE1 knockdown
interferes with the uPAR-mediated balance of the ERK/p38 ratio; it
may also affect this ratio by modulating HSP90α expression and p38
activity, which suppress cell proliferation. In terms of invasion,
SERPINE1 downregulation increases MMP-1 levels via the HSP90α-p38
pathway, thereby promoting cellular invasion.
***P<0.001, **P<0.01, ns, not
significant. SERPINE1, serine protease inhibitor clade e member 1;
MMP, matrix metalloproteinases; TIMP, tissue inhibitors of metal
proteases; shRNA, short hairpin RNA; shSE1, shRNA targeting
SERPINE1; si, short interfering RNA; siHSP90AA1, short interfering
heat shock protein 90 alpha family class a member 1; NC, negative
control; uPAR, urokinase-type plasminogen activator receptor; p-,
phosphorylated; MCM3, minichromosome maintenance complex component
3; HSP90α, heat shock protein 90-alpha. |
The activity of MMP-1, a key collagenase, is
critical for collagen degradation and tumor progression. Its
expression is regulated by growth factors, hormones, and cytokines,
including those in the IL-17 pathway. HSP90α modulates the IL-17
pathway and stimulates MMP-1 expression via p38-mediated
transcription (49,50). This previously established
regulatory axis may account for our observations. Indeed, RNA-seq
revealed a twofold increase in HSP90AA1 mRNA expression in H4-shSE1
cells compared with controls (Fig. S11). Furthermore, western
blotting analysis showed increased p-p38 levels. Together, these
results suggested that the upregulation of MMP-1 expression in
H4-shSE1 cells may be mediated by the HSP90α-p38 axis. Consistent
with this interpretation, this finding was confirmed by
siRNA-mediated knockdown of HSP90α, which reduced p-p38 and MMP-1
levels (Fig. 6C), supporting the
role of the HSP90α-p38 axis in regulating MMP-1 expression.
Additionally, HSP90α knockdown reversed the invasion-enhancing
effect of SERPINE1 downregulation on H4 cells (Fig. 6D).
Discussion
The differential effect of a single gene on various
types of tumor, which occasionally exerts opposing effects, poses a
significant challenge in oncological research. The relatively poor
correlation between gene expression levels and their associated
biological effects raises the question of which factors dictate
these divergent outcomes. The present study focused on the role of
SERPINE1 in cell proliferation and invasion (Fig. 6E). It showed that SERPINE1
downregulation suppressed the proliferation of 231 and H4 cells via
uPAR- and HSP90α-mediated pathways, respectively, which decreased
the ERK/p38 activity ratio. Moreover, SERPINE1 downregulation
increased proliferation and cell cycle progression in C918 cells by
inhibiting p53 and SMAD3 activities and partially disrupting MCM3
function. SERPINE1 downregulation decreased the invasiveness of 231
and C918 cells, increased the invasiveness of H4 cells and altered
the expression and activity of certain MMPs and TIMPs.
Specifically, MMP-1 levels were decreased in 231 and C918 cells but
were increased in H4 cells. Notably, the HSP90α-p38 pathway
mediated the upregulation of MMP-1 in H4 cells. Given the diverse
roles of SERPINE1, the development of SERPINE1 inhibitors for
various types of tumor requires careful consideration.
In the present study, SERPINE1 knockdown promoted
growth and cell cycle progression of C918 cells by decreasing the
phosphorylation of p53 and SMAD3 (crucial transcription factors in
the TGF-β pathway) and subsequently upregulating the expression of
cell cycle-related proteins. These findings contradict those of a
previous study (14) indicating
that SERPINE1 facilitates G1 to S phase progression.
Notably, SERPINE1 is a major target gene of TGF-β/p53. Moreover,
the suppression of p53 resulted in the downregulation of SERPINE1
mRNA and protein levels. SERPINE1 also induced apoptosis in
senescent type II pneumocytes by upregulating p53 expression,
suggesting the formation of a reciprocal amplification loop between
p53 and SERPINE1 (18,51). Additionally, exogenous SERPINE1 is
sufficient to trigger TGF-β production, which in turn upregulates
SERPINE1 expression, establishing a positive feed-forwards loop
within the SERPINE1/TGF-β signaling pathway (16,52). Although the molecular mechanisms
underlying the regulatory effects of SERPINE1 on TGF-β and p53
expression have not yet been fully elucidated, the present study
provided novel insights, as it reveals that SERPINE1 knockdown can
promote cell cycle progression via alternative pathways in a target
gene-dependent manner.
Notably, SERPINE1 knockdown resulted in the
upregulation of the expression of multiple MCM proteins at the
transcript level. The MCM protein family, comprising six
evolutionarily conserved subunits, is essential for initiating DNA
replication and functions as a DNA helicase during the replication
elongation phase. A study suggests that SERPINE1 overexpression
inhibits hepatitis C virus replication, possibly mediated by the
TGF-β signaling pathway (53).
Specifically, TGF-β1 prevents S phase entry and induces cell cycle
arrest by inhibiting the dissociation of the Rb-MCM complex
(54). These studies corroborate
the present findings that SERPINE1 downregulation is associated
with reduced SMAD3 activity and cell cycle progression, indicating
that SERPINE1 may modulate MCM activity via TGF-β, thereby exerting
a multifaceted effect on the cell cycle.
The ERK/p38 signaling axis represents a crucial
balanced mechanism that determines whether cells undergo
proliferation or dormancy during cancer progression. This inverse
relationship acts as a molecular switch controlling cancer cell
fate: Dominant ERK signaling promotes proliferation and invasion,
largely through sustained cyclin D1 expression, whereas predominant
p38 activation induces cell cycle arrest and tumor dormancy
(39). Consistent with this role,
high uPAR expression has been shown to maintain an elevated ERK/p38
activity ratio, thereby generating strong mitogenic signals that
drive cell cycle progression (40). In support of this mechanism, Xue
et al (44) demonstrated
that in pancreatic ductal adenocarcinoma cell lines, treatment with
uPAR siRNA substantially reduced phosphorylated ERK levels but
increased phosphorylated p38 levels. SERPINE1 knockdown decreased
the ratio of active ERK to active p38 in 231-shSE1 cells, with
p-ERK levels more markedly reduced than the levels of p38
phosphorylation. These observations may be attributed to the
indirect effects of SERPINE1 on cancer cell proliferation through
its interactions with uPA and uPAR, which incorporate β1 integrins,
stimulate cancer cell growth and promote the transition from
dormancy by activating focal adhesion kinase and the ERK signaling
pathway. Genes such as uPA, uPAR, SERPINE1 and MMPs are targets of
TGF-β1 and exhibit positive feedback within the SERPINE1/TGF-β
signaling pathway (16,52,55). Consistent with these findings, the
present study showed that the overexpression of PLAUR restored the
ERK/p38 ratio and cell growth.
In H4 cells, SERPINE1 knockdown markedly decreased
p38 phosphorylation, whereas ERK phosphorylation remained largely
unchanged. Unlike 231-shSE1 cells, in which reduced transcription
levels of PLAU and PLAUR were detected, no significant alterations
in PLAU and PLAUR mRNA levels were observed in H4-shSE1 cells.
Therefore, the present study analyzed gene sets related to SERPINE1
expression in BRCA, LGG and SKCM tumors to identify enriched
signaling pathways. Notably, the IL-17 signaling pathway was
markedly enriched in LGG. Similarly, the KEGG pathway enrichment
analysis of DEGs after SERPINE1 knockdown in the three cell lines
revealed the unique enrichment of the IL-17 signaling pathway in H4
cells. Lin et al (56)
reported that interleukin-17D drives lung cancer progression by
engaging the p38 MAPK pathway to recruit tumor-associated
macrophages. Xiang et al (57) reported that IL-17 enhances the
self-renewal of ovarian CD133(+) CSLCs via the NF-κB and p38 MAPK
pathways, as evidenced by the activation of both signaling
molecules upon IL-17 stimulation. IL-17 has been shown to promote
p38 phosphorylation via the Act1-TRAF6 axis (46,58,59). HSP90α stabilizes Act1, enhancing
this process and facilitating IL-17-mediated p38 activation.
Consistent with these findings, an analysis of the H4-shSE1 cell
RNA-seq revealed that the upregulation of the expression of the
HSP90α gene and downregulation of HSP90α expression in H4-shSE1
cells transfected with a small interfering RNA reversed the changes
in the ERK/p38 ratio and cell growth. To date, no studies have
reported direct or indirect interactions between SERPINE1 and
HSP90α. Tomcik et al (60)
showed that HSP90 expression was increased in a TGF-β-dependent
manner, suggesting that SERPINE1 downregulation may lead to reduced
TGF-β levels through a feedback mechanism, consequently decreasing
HSP90α expression.
Additionally, in contrast to the 231 cells and H4
cells used in the present study, the C918 cells seem to be an
exception to the regulation of cell proliferation and dormancy by
ERK/p38 signaling. It may developed a resistance strategy to bypass
the antiproliferative effects of increased p38 activity, despite
having high levels of ERK and p38 (40,61). The role of SERPINE1 in regulating
apoptosis has been explored in several previous studies. It
stimulates anoikis by impairing cell adhesion to vitronectin and
resistance to apoptosis when cells migrate to other extracellular
matrix proteins by inhibiting intrinsic and extrinsic apoptotic
pathways and promoting AKT- and ERK-mediated survival pathways
(62-66). The present study confirmed this
finding in the suspension cultures of 231 and H4 cells but not in
C918 cells. Multiple factors influencing resistance to anoikis have
been identified (67). Weems
et al (68) recently
showed that dynamic blebbing on the plasma membrane promotes
melanoma cell resistance to anoikis by initiating the
survival-promoting effects of NRAS signaling pathways. The present
finding that C918 cells harboring the KRAS (G12D) oncogene remain
resistant to SERPINE1 knockdown-induced anoikis in suspension
culture may be due to dynamic blebbing, a common morphological
response in aggressive melanoma.
Studies have shown that SERPINE1 promotes tumor cell
migration and invasion. SERPINE1 knockdown restrained the migration
of differentiated thyroid cancer cells (69). Induced secretion of SERPINE1 led
to increased MMP-1 levels and cell motility in human colon and
liver cancer cell lines (70).
SERPINE1 inhibition reduced cell spreading by modulating
cell-substrate attachment and migration in glioblastoma cells
(21). However, some studies have
reported divergent or even contradictory outcomes, such as the role
of SERPINE1 in mediating the formation of fibrotic adhesions in
injured flexor tendons by suppressing MMP activity (29). Additionally, treatment with a
SERPINE1 inhibitor increases the membrane-type MMP-1-dependent
motility of chronic myeloid leukemia stem cells (66). In the present study, SERPINE1
downregulation inhibited the migration of three cell lines.
Interestingly, SERPINE1 downregulation reduced the invasion of 231
and C918 cells but increased H4 cell invasion by markedly
upregulating MMP-1 expression and activity via the HSP90α-p38 axis.
Although this mechanism has not been previously reported, some
supportive hints and relevant associations can be identified in
existing literature. Wu et al (71) indicated that p38 activity is
crucial for the ability of IL-17A/IL-17RA to promote NSCLC
metastasis. Wu et al (72)
reported that IL-17A facilitates human periodontal ligament
fibroblast migration by upregulating the expression of MMP-1, which
is mediated by the IL-17 receptor, p38 MAPK, and NF-κB pathways.
Shibabaw et al (73)
identified that the IL-17A/NF-κB/MMP axis promotes bone-metastatic
breast cancer. The mechanism by which SERPINE1 affects the IL-17
signaling pathway remains unclear; however, the unique effect of
the IL-17 pathway on H4 cells may explain their distinct behavior
compared with that of the other two cell lines. Additionally,
although the expression of TIMP-2, an inhibitor of MMPs, increases
alongside that of MMP-1, it did not counteract the net proinvasive
effect of SERPINE1 downregulation in H4 cells.
Extensive evidence has established that SERPINE1
plays key roles in tumor invasion, metastasis and angiogenesis,
indicating that SERPINE1 is a promising therapeutic target in
specific types of cancers. The development of various targeting
approaches, ranging from conventional small-molecule inhibitors to
novel miRNA-mediated modulators, reflects the broad and versatile
potential of SERPINE1-targeted therapy. However, the biological
complexity of SERPINE1 presents significant challenges. It operates
within intricate signaling networks, interacts with multiple
binding partners and is influenced by feedback mechanisms that can
produce opposing biological effects, complicating its direct
targeting. Further considerations include its
concentration-dependent biphasic activity, context-dependent
functional switching and unpredictable outcomes arising from
pathway pleiotropy (11,66,74). Therefore, integrating molecular
profiling through precision oncology to inform the design of
rational multitarget therapies may be essential. Shifting from a
reactive to a predictive treatment paradigm in this way could
increase antitumor efficacy while minimizing adverse effects.
The present study had several limitations. First,
the conclusions are derived from analyses across three models.
While these findings provide some evidence, incorporating a broader
panel of cell lines in future work would further strengthen and
generalize these findings. Second, the phenotypes observed in the
present study reflect the net effect of SERPINE1 operating in both
intracellular and extracellular compartments; accordingly,
correlating extracellular SERPINE1 levels with functional outcomes
would be valuable for distinguishing its compartment-specific
contributions. Third, further studies are needed to elucidate how
SERPINE1 affects the IL-17 signaling pathway and how MCM
specifically regulates cell cycle progression.
In conclusion, the present study explored the
diverse roles of SERPINE1 in cell proliferation and invasion via
distinct mechanisms. This understanding of complex regulatory
networks provides a more nuanced perspective on SERPINE1 function,
moving beyond simplistic oncogene or tumor suppressor
classifications. Thus, these insights remain valuable for
developing precise therapeutic strategies and advancing
personalized medicine, with broader validation representing a key
future direction.
Supplementary Data
Abbreviations:
|
BRCA
|
breast cancer
|
|
CancerSEA
|
cancer single-cell state atlas
|
|
CSCs
|
cancer stem cells
|
|
DEGs
|
differentially expressed genes
|
|
ELISA
|
enzyme-linked immunosorbent assay
|
|
EMT
|
epithelial-mesenchymal transition
|
|
FBS
|
fetal bovine serum
|
|
FDR
|
false discovery rate
|
|
FPKM
|
fragments per kilobase of transcript
per million mapped reads
|
|
GEPIA2
|
gene expression profiling interactive
analysis 2
|
|
GFP
|
green fluorescent protein
|
|
GO
|
Gene Ontology
|
|
GSEA
|
gene set enrichment analysis
|
|
HR
|
hazard ratio
|
|
HSP90α
|
heat shock protein 90-alpha
|
|
HSP90AA1
|
heat shock protein 90 alpha family
class a member 1
|
|
KEGG
|
Kyoto Encyclopedia of Genes And
Genomes
|
|
LGG
|
low-grade glioma
|
|
MCM3
|
minichromosome maintenance complex
component 3
|
|
MMP
|
matrix metalloproteinases
|
|
PLAUR
|
plasminogen activator, urokinase
receptor
|
|
RNA-seq
|
RNA sequencing
|
|
SA-β-gal
|
sa-β-galactosidase
|
|
SERPINE1
|
serine protease inhibitor clade e
member 1
|
|
SKCM
|
skin cutaneous melanoma
|
|
TCGA
|
the cancer genome atlas
|
|
uPA
|
urokinase-type plasminogen
activator
|
|
uPAR
|
urokinase-type plasminogen activator
receptor
|
|
WGCNA
|
weighted correlation network
analysis
|
Availability of data and materials
The sequence data generated in the present study
may be found in the Gene Expression Omnibus (GEO) with the primary
accession code GSE300877 or at the following URL: https://www.ncbi.nlm.nih.gov/geo/query/acc.cgi?acc=GSE300877.
Authors' contributions
WW curated the data, conducted the investigation
and validation, and wrote the original draft. PZ curated the data
and conducted the investigation and validation. TW performed
validation. WW conducted validation and formal analysis. JL
performed validation. QH was responsible for conceptualization,
supervision and project administration. JM contributed to
conceptualization, funding acquisition, investigation, methodology,
validation, and writing, review and editing. WW and JM confirm the
authenticity of all the raw data. All authors read and approved the
final manuscript.
Ethics approval and consent to
participate
All animal experimental protocols were carried out
in accordance with the guidelines and regulations of the
Institutional Animal Care and Use Committee at Tianjin Medical
University (approval no. TMUaMEC 2022045).
Patient consent for publication
Not applicable.
Competing interests
The authors declare that they have no competing
interests.
Acknowledgements
The authors thank RayBiotech Biotechnology Co.,
Ltd. (Guangzhou, China) for providing services and data analysis
related to the detection of cell cycle-related proteins and MMP
arrays.
Funding
The present study was supported by the National Natural Science
Foundation of China (grant no. 82002901).
References
|
1
|
Peters L, Venkatachalam A and Ben-Neriah
Y: Tissue-predisposition to cancer driver mutations. Cells.
13:1062024. View Article : Google Scholar : PubMed/NCBI
|
|
2
|
Wu K, El Zowalaty AE, Sayin VI and
Papagiannakopoulos T: The pleiotropic functions of reactive oxygen
species in cancer. Nat Cancer. 5:384–399. 2024. View Article : Google Scholar : PubMed/NCBI
|
|
3
|
Colak S and Ten Dijke P: Targeting TGF-β
signaling in cancer. Trends Cancer. 3:56–71. 2017. View Article : Google Scholar : PubMed/NCBI
|
|
4
|
Boutelle AM and Attardi LD: p53 and tumor
suppression: It takes a network. Trends Cell Biol. 31:298–310.
2021. View Article : Google Scholar : PubMed/NCBI
|
|
5
|
Schneider G, Schmidt-Supprian M, Rad R and
Saur D: Tissue-specific tumorigenesis: Context matters. Nat Rev
Cancer. 17:239–253. 2017. View Article : Google Scholar : PubMed/NCBI
|
|
6
|
Hoadley KA, Yau C, Hinoue T, Wolf DM,
Lazar AJ, Drill E, Shen R, Taylor AM, Cherniack AD, Thorsson V, et
al: Cell-of-origin patterns dominate the molecular classification
of 10,000 tumors from 33 types of cancer. Cell. 173291–304.
(e296)2018. View Article : Google Scholar : PubMed/NCBI
|
|
7
|
Poulin EJ, Bera AK, Lu J, Lin YJ, Strasser
SD, Paulo JA, Huang TQ, Morales C, Yan W, Cook J, et al:
Tissue-specific oncogenic activity of KRAS(A146T). Cancer Discov.
9:738–755. 2019. View Article : Google Scholar : PubMed/NCBI
|
|
8
|
Lijnen HR: Pleiotropic functions of
plasminogen activator inhibitor-1. J Thromb Haemost. 3:35–45. 2005.
View Article : Google Scholar : PubMed/NCBI
|
|
9
|
Li L, Li F, Xu Z, Li L, Hu H, Li Y, Yu S,
Wang M and Gao L: Identification and validation of SERPINE1 as a
prognostic and immunological biomarker in pan-cancer and in ccRCC.
Front Pharmacol. 14:12138912023. View Article : Google Scholar : PubMed/NCBI
|
|
10
|
Kubala MH and DeClerck YA: The plasminogen
activator inhibitor-1 paradox in cancer: A mechanistic
understanding. Cancer Metastasis Rev. 38:483–492. 2019. View Article : Google Scholar : PubMed/NCBI
|
|
11
|
Sillen M and Declerck PJ: A narrative
review on plasminogen activator inhibitor-1 and its
(Patho)physiological role: To target or not to target? Int J Mol
Sci. 22:27212021. View Article : Google Scholar : PubMed/NCBI
|
|
12
|
Kwaan HC, Wang J, Svoboda K and Declerck
PJ: Plasminogen activator inhibitor 1 may promote tumour growth
through inhibition of apoptosis. Br J Cancer. 82:1702–1708.
2000.PubMed/NCBI
|
|
13
|
Che Y, Wang J, Li Y, Lu Z, Huang J, Sun S,
Mao S, Lei Y, Zang R, Sun N and He J: Cisplatin-activated PAI-1
secretion in the cancer-associated fibroblasts with paracrine
effects promoting esophageal squamous cell carcinoma progression
and causing chemoresistance. Cell Death Dis. 9:7592018. View Article : Google Scholar : PubMed/NCBI
|
|
14
|
Giacoia EG, Miyake M, Lawton A, Goodison S
and Rosser CJ: PAI-1 leads to G1-phase cell-cycle progression
through cyclin D3/cdk4/6 upregulation. Mol Cancer Res. 12:322–334.
2014. View Article : Google Scholar : PubMed/NCBI
|
|
15
|
Soeda S, Koyanagi S, Kuramoto Y, Kimura M,
Oda M, Kozako T, Hayashida S and Shimeno H: Anti-apoptotic roles of
plasminogen activator inhibitor-1 as a neurotrophic factor in the
central nervous system. Thromb Haemost. 100:1014–1020. 2008.
View Article : Google Scholar
|
|
16
|
Gifford CC, Lian F, Tang J, Costello A,
Goldschmeding R, Samarakoon R and Higgins PJ: PAI-1 induction
during kidney injury promotes fibrotic epithelial dysfunction via
deregulation of klotho, p53, and TGF-beta1-receptor signaling.
FASEB J. 35:e217252021. View Article : Google Scholar
|
|
17
|
Kortlever RM and Bernards R: Senescence,
wound healing and cancer: The PAI-1 connection. Cell Cycle.
5:2697–2703. 2006. View Article : Google Scholar : PubMed/NCBI
|
|
18
|
Jiang C, Liu G, Luckhardt T, Antony V,
Zhou Y, Carter AB, Thannickal VJ and Liu RM: Serpine 1 induces
alveolar type II cell senescence through activating p53-p21-Rb
pathway in fibrotic lung disease. Aging Cell. 16:1114–1124. 2017.
View Article : Google Scholar : PubMed/NCBI
|
|
19
|
Brooks TD, Slomp J, Quax PH, De Bart AC,
Spencer MT, Verheijen JH and Charlton PA: Antibodies to PAI-1 alter
the invasive and migratory properties of human tumour cells in
vitro. Clin Exp Metastasis. 18:445–453. 2000. View Article : Google Scholar
|
|
20
|
Liu G, Shuman MA and Cohen RL:
Co-expression of urokinase, urokinase receptor and PAI-1 is
necessary for optimum invasiveness of cultured lung cancer cells.
Int J Cancer. 60:501–506. 1995. View Article : Google Scholar : PubMed/NCBI
|
|
21
|
Seker F, Cingoz A, Sur-Erdem İ, Erguder N,
Erkent A, Uyulur F, Selvan ME, Gümüş ZH, Gönen M, Bayraktar H, et
al: Identification of SERPINE1 as a regulator of glioblastoma cell
dispersal with transcriptome profiling. Cancers (Basel). 11. pp.
16512019, View Article : Google Scholar
|
|
22
|
Hirahata M, Osaki M, Kanda Y, Sugimoto Y,
Yoshioka Y, Kosaka N, Takeshita F, Fujiwara T, Kawai A, Ito H, et
al: PAI-1, a target gene of miR-143, regulates invasion and
metastasis by upregulating MMP-13 expression of human osteosarcoma.
Cancer Med. 5:892–902. 2016. View Article : Google Scholar : PubMed/NCBI
|
|
23
|
Zhang W, Xu J, Fang H, Tang L, Chen W, Sun
Q, Zhang Q, Yang F, Sun Z, Cao L, et al: Endothelial cells promote
triple-negative breast cancer cell metastasis via PAI-1 and CCL5
signaling. FASEB J. 32:276–288. 2018. View Article : Google Scholar
|
|
24
|
Lin X, Lin BW, Chen XL, Zhang BL, Xiao XJ,
Shi JS, Lin JD and Chen X: PAI-1/PIAS3/Stat3/miR-34a forms a
positive feedback loop to promote EMT-mediated metastasis through
Stat3 signaling in non-small cell lung cancer. Biochem Biophys Res
Commun. 493:1464–1470. 2017. View Article : Google Scholar : PubMed/NCBI
|
|
25
|
Inoue M, Sawada T, Uchima Y, Kimura K,
Nishihara T, Tanaka H, Yashiro M, Yamada N, Ohira M and Hirakawa K:
Plasminogen activator inhibitor-1 (PAI-1) gene transfection
inhibits the liver metastasis of pancreatic cancer by preventing
angiogenesis. Oncol Rep. 14:1445–1451. 2005.PubMed/NCBI
|
|
26
|
Hjortland GO, Bjørnland K, Pettersen S,
Garman-Vik SS, Emilsen E, Nesland JM, Fodstad O and Engebraaten O:
Modulation of glioma cell invasion and motility by adenoviral gene
transfer of PAI-1. Clin Exp Metastasis. 20:301–309. 2003.
View Article : Google Scholar : PubMed/NCBI
|
|
27
|
Humbert L and Lebrun JJ: TGF-beta inhibits
human cutaneous melanoma cell migration and invasion through
regulation of the plasminogen activator system. Cell Signal.
25:490–500. 2013. View Article : Google Scholar
|
|
28
|
Soff GA, Sanderowitz J, Gately S, Verrusio
E, Weiss I, Brem S and Kwaan HC: Expression of plasminogen
activator inhibitor type 1 by human prostate carcinoma cells
inhibits primary tumor growth, tumor-associated angiogenesis, and
metastasis to lung and liver in an athymic mouse model. J Clin
Invest. 96:2593–2600. 1995. View Article : Google Scholar : PubMed/NCBI
|
|
29
|
Freeberg MAT, Farhat YM, Easa A,
Kallenbach JG, Malcolm DW, Buckley MR, Benoit DSW and Awad HA:
Serpine1 knockdown enhances MMP activity after flexor tendon injury
in mice: Implications for adhesions therapy. Sci Rep. 8:58102018.
View Article : Google Scholar : PubMed/NCBI
|
|
30
|
Tang Z, Kang B, Li C, Chen T and Zhang Z:
GEPIA2: An enhanced web server for large-scale expression profiling
and interactive analysis. Nucleic Acids Res. 47:W556–W560. 2019.
View Article : Google Scholar : PubMed/NCBI
|
|
31
|
Yuan H, Yan M, Zhang G, Liu W, Deng C,
Liao G, Xu L, Luo T, Yan H, Long Z, et al: CancerSEA: A cancer
single-cell state atlas. Nucleic Acids Res. 47:D900–D908. 2019.
View Article : Google Scholar :
|
|
32
|
Kanehisa M, Furumichi M, Sato Y, Matsuura
Y and Ishiguro-Watanabe M: KEGG: Biological systems database as a
model of the real world. Nucleic Acids Res. 53:D672–D677. 2025.
View Article : Google Scholar :
|
|
33
|
Jura J: Animal models for the treatment of
human diseases. Ann Anim Sci. 24:1153–1159. 2024. View Article : Google Scholar
|
|
34
|
Zhou YF, Wang QX, Zhou HY and Chen G:
Autophagy activation prevents sevoflurane-induced neurotoxicity in
H4 human neuroglioma cells. Acta Pharmacol Sin. 37:580–588. 2016.
View Article : Google Scholar : PubMed/NCBI
|
|
35
|
Sun Y, Zhang Y, Cheng B, Dong Y, Pan C, Li
T and Xie Z: Glucose may attenuate isoflurane-induced caspase-3
activation in H4 human neuroglioma cells. Anesth Analg.
119:1373–1380. 2014. View Article : Google Scholar : PubMed/NCBI
|
|
36
|
Yu X, Ambrosini G, Roszik J, Eterovic AK,
Stempke-Hale K, Seftor EA, Chattopadhyay C, Grimm E, Carvajal RD,
Hendrix MJ, et al: Genetic analysis of the 'uveal melanoma' C918
cell line reveals atypical BRAF and common KRAS mutations and
single tandem repeat profile identical to the cutaneous melanoma
C8161 cell line. Pigment Cell Melanoma Res. 28:357–359. 2015.
View Article : Google Scholar
|
|
37
|
Bochman ML and Schwacha A: The Mcm
complex: Unwinding the mechanism of a replicative helicase.
Microbiol Mol Biol Rev. 73:652–683. 2009. View Article : Google Scholar : PubMed/NCBI
|
|
38
|
Lin DI, Aggarwal P and Diehl JA:
Phosphorylation of MCM3 on Ser-112 regulates its incorporation into
the MCM2-7 complex. Proc Natl Acad Sci USA. 105:8079–8084. 2008.
View Article : Google Scholar : PubMed/NCBI
|
|
39
|
Aguirre-Ghiso JA, Estrada Y, Liu D and
Ossowski L: ERK(MAPK) activity as a determinant of tumor growth and
dormancy; regulation by p38(SAPK). Cancer Res. 63:1684–1695.
2003.PubMed/NCBI
|
|
40
|
Aguirre-Ghiso JA, Liu D, Mignatti A,
Kovalski K and Ossowski L: Urokinase receptor and fibronectin
regulate the ERK(MAPK) to p38(MAPK) activity ratios that determine
carcinoma cell proliferation or dormancy in vivo. Mol Biol Cell.
12:863–879. 2001. View Article : Google Scholar : PubMed/NCBI
|
|
41
|
Guereno M, Pastore MD, Lugones AC, Cercato
M, Todaro L, Urtreger A and Peters MG: Glypican-3 (GPC3) inhibits
metastasis development promoting dormancy in breast cancer cells by
p38 MAPK pathway activation. Eur J Cell Biol. 99:1510962020.
View Article : Google Scholar : PubMed/NCBI
|
|
42
|
Revathidevi S and Munirajan AK: Akt in
cancer: Mediator and more. Semin Cancer Biol. 59:80–91. 2019.
View Article : Google Scholar : PubMed/NCBI
|
|
43
|
Wu Q, Wu W, Fu B, Shi L, Wang X and Kuca
K: JNK signaling in cancer cell survival. Med Res Rev.
39:2082–2104. 2019. View Article : Google Scholar : PubMed/NCBI
|
|
44
|
Xue A, Xue M, Jackson C and Smith RC:
Suppression of urokinase plasminogen activator receptor inhibits
proliferation and migration of pancreatic adenocarcinoma cells via
regulation of ERK/p38 signaling. Int J Biochem Cell Biol.
41:1731–1738. 2009. View Article : Google Scholar : PubMed/NCBI
|
|
45
|
Wang C, Wu L, Bulek K, Martin BN, Zepp JA,
Kang Z, Liu C, Herjan T, Misra S, Carman JA, et al: The
psoriasis-associated D10N variant of the adaptor Act1 with impaired
regulation by the molecular chaperone hsp90. Nat Immunol. 14:72–81.
2013. View Article : Google Scholar :
|
|
46
|
Huangfu L, Li R, Huang Y and Wang S: The
IL-17 family in diseases: From bench to bedside. Signal Transduct
Target Ther. 8:4022023. View Article : Google Scholar : PubMed/NCBI
|
|
47
|
Lee YC, Yu CC, Lan C, Lee CH, Lee HT, Kuo
YL, Wang PH and Chang WW: Plasminogen activator inhibitor-1 as
regulator of tumor-initiating cell properties in head and neck
cancers. Head Neck. 38(Suppl 1): E895–E904. 2016. View Article : Google Scholar
|
|
48
|
Nagase H, Visse R and Murphy G: Structure
and function of matrix metalloproteinases and TIMPs. Cardiovasc
Res. 69:562–573. 2006. View Article : Google Scholar : PubMed/NCBI
|
|
49
|
Cortez DM, Feldman MD, Mummidi S, Valente
AJ, Steffensen B, Vincenti M, Barnes JL and Chandrasekar B: IL-17
stimulates MMP-1 expression in primary human cardiac fibroblasts
via p38 MAPK- and ERK1/2-dependent C/EBP-beta, NF-kappaB, and AP-1
activation. Am J Physiol Heart Circ Physiol. 293:H3356–H3365. 2007.
View Article : Google Scholar : PubMed/NCBI
|
|
50
|
Feng W, Li W, Liu W, Wang F, Li Y and Yan
W: IL-17 induces myocardial fibrosis and enhances RANKL/OPG and
MMP/TIMP signaling in isoproterenol-induced heart failure. Exp Mol
Pathol. 87:212–218. 2009. View Article : Google Scholar : PubMed/NCBI
|
|
51
|
Rana T, Jiang C, Banerjee S, Yi N,
Zmijewski JW, Liu G and Liu RM: PAI-1 regulation of p53 expression
and senescence in type II alveolar epithelial cells. Cells.
12:20082023. View Article : Google Scholar : PubMed/NCBI
|
|
52
|
Samarakoon R and Higgins PJ: Integration
of non-SMAD and SMAD signaling in TGF-beta1-induced plasminogen
activator inhibitor type-1 gene expression in vascular smooth
muscle cells. Thromb Haemost. 100:976–983. 2008. View Article : Google Scholar
|
|
53
|
Yang CH, Li HC, Ku TS, Wu PC, Yeh YJ,
Cheng JC, Lin TY and Lo SY: Hepatitis C virus down-regulates
SERPINE1/PAI-1 expression to facilitate its replication. J Gen
Virol. 98:2274–2286. 2017. View Article : Google Scholar : PubMed/NCBI
|
|
54
|
Nepon-Sixt BS and Alexandrow MG: TGFbeta1
cell cycle arrest is mediated by inhibition of MCM assembly in
Rb-deficient conditions. Mol Cancer Res. 17:277–288. 2019.
View Article : Google Scholar
|
|
55
|
Czekay RP, Wilkins-Port CE, Higgins SP,
Freytag J, Overstreet JM, Klein RM, Higgins CE, Samarakoon R and
Higgins PJ: PAI-1: An integrator of cell signaling and migration.
Int J Cell Biol. 2011:5624812011. View Article : Google Scholar : PubMed/NCBI
|
|
56
|
Lin Z, Huang Q, Liu J, Wang H, Zhang X,
Zhu Z, Zhang W, Wei Y, Liu Z and Du W: Interleukin-17D promotes
lung cancer progression by inducing tumor-associated macrophage
infiltration via the p38 MAPK signaling pathway. Aging (Albany NY).
14:6149–6168. 2022. View Article : Google Scholar : PubMed/NCBI
|
|
57
|
Xiang T, Long H, He L, Han X, Lin K, Liang
Z, Zhuo W, Xie R and Zhu B: Interleukin-17 produced by tumor
microenvironment promotes self-renewal of CD133+ cancer stem-like
cells in ovarian cancer. Oncogene. 34:165–176. 2015. View Article : Google Scholar
|
|
58
|
Li X, Bechara R, Zhao J, McGeachy MJ and
Gaffen SL: IL-17 receptor-based signaling and implications for
disease. Nat Immunol. 20:1594–1602. 2019. View Article : Google Scholar : PubMed/NCBI
|
|
59
|
Zhang X, Li B, Lan T, Chiari C, Ye X, Wang
K and Chen J: The role of interleukin-17 in inflammation-related
cancers. Front Immunol. 15:14795052024. View Article : Google Scholar
|
|
60
|
Tomcik M, Zerr P, Pitkowski J,
Palumbo-Zerr K, Avouac J, Distler O, Becvar R, Senolt L, Schett G
and Distler JH: Heat shock protein 90 (Hsp90) inhibition targets
canonical TGF-β signalling to prevent fibrosis. Ann Rheum Dis.
73:1215–1222. 2014. View Article : Google Scholar
|
|
61
|
Korabiowska M, Betke H, Brinck U, Grohmann
U, Hönig JF and Droese M: Loss of growth arrest DNA damage genes
expression in oral melanomas. In Vivo. 13:483–485. 1999.
|
|
62
|
Schneider DJ, Chen Y and Sobel BE: The
effect of plasminogen activator inhibitor type 1 on apoptosis.
Thromb Haemost. 100:1037–1040. 2008. View Article : Google Scholar
|
|
63
|
Zhang YP, Wang WL, Liu J, Li WB, Bai LL,
Yuan YD and Song SX: Plasminogen activator inhibitor-1 promotes the
proliferation and inhibits the apoptosis of pulmonary fibroblasts
by Ca(2+) signaling. Thromb Res. 131:64–71. 2013. View Article : Google Scholar
|
|
64
|
Bajou K, Peng H, Laug WE, Maillard C, Noel
A, Foidart JM, Martial JA and DeClerck YA: Plasminogen activator
inhibitor-1 protects endothelial cells from FasL-mediated
apoptosis. Cancer Cell. 14:324–334. 2008. View Article : Google Scholar : PubMed/NCBI
|
|
65
|
Zhao C and Liu Z: MicroRNA 617 Targeting
SERPINE1 inhibited the progression of oral squamous cell carcinoma.
Mol Cell Biol. 41:e00565202021. View Article : Google Scholar : PubMed/NCBI
|
|
66
|
Yahata T, Ibrahim AA, Hirano KI, Muguruma
Y, Naka K, Hozumi K, Vaughan DE, Miyata T and Ando K: Targeting of
plasminogen activator inhibitor-1 activity promotes elimination of
chronic myeloid leukemia stem cells. Haematologica. 106:483–494.
2021. View Article : Google Scholar :
|
|
67
|
Adeshakin FO, Adeshakin AO, Afolabi LO,
Yan D, Zhang G and Wan X: Mechanisms for modulating anoikis
resistance in cancer and the relevance of metabolic reprogramming.
Front Oncol. 11:6265772021. View Article : Google Scholar : PubMed/NCBI
|
|
68
|
Weems AD, Welf ES, Driscoll MK, Zhou FY,
Mazloom-Farsibaf H, Chang BJ, Murali VS, Gihana GM, Weiss BG, Chi
J, et al: Blebs promote cell survival by assembling oncogenic
signalling hubs. Nature. 615:517–525. 2023. View Article : Google Scholar : PubMed/NCBI
|
|
69
|
Yu XM, Jaskula-Sztul R, Georgen MR,
Aburjania Z, Somnay YR, Leverson G, Sippel RS, Lloyd RV, Johnson BP
and Chen H: Notch1 signaling regulates the aggressiveness of
differentiated thyroid cancer and inhibits SERPINE1 expression.
Clin Cancer Res. 22:3582–3592. 2016. View Article : Google Scholar : PubMed/NCBI
|
|
70
|
Kim WT, Mun JY, Baek SW, Kim MH, Yang GE,
Jeong MS, Choi SY, Han JY, Kim MH and Leem SH: Secretory SERPINE1
expression is increased by antiplatelet therapy, inducing MMP1
expression and increasing colon cancer metastasis. Int J Mol Sci.
23:95962022. View Article : Google Scholar : PubMed/NCBI
|
|
71
|
Wu Z, He D, Zhao S and Wang H:
IL-17A/IL-17RA promotes invasion and activates MMP-2 and MMP-9
expression via p38 MAPK signaling pathway in non-small cell lung
cancer. Mol Cell Biochem. 455:195–206. 2019. View Article : Google Scholar
|
|
72
|
Wu Y, Zhu L, Liu L, Zhang J and Peng B:
Interleukin-17A stimulates migration of periodontal ligament
fibroblasts via p38 MAPK/NF-kappaB -dependent MMP-1 expression. J
Cell Physiol. 229:292–299. 2014. View Article : Google Scholar
|
|
73
|
Shibabaw T, Teferi B and Ayelign B: The
role of Th-17 cells and IL-17 in the metastatic spread of breast
cancer: As a means of prognosis and therapeutic target. Front
Immunol. 14:10948232023. View Article : Google Scholar : PubMed/NCBI
|
|
74
|
Nuha N, Higgins SP, Czekay RP, Higgins CE,
Guo L, Lee H and Higgins PJ: SERPINE1 drives molecular synergies in
colorectal cancer. Am J Physiol Cell Physiol. 330:C9–C25. 2026.
View Article : Google Scholar
|


