Introduction
Pancreatic cancer is a highly lethal disease.
Approximately 227,000 individuals succumb to the disease annually
throughout the World. The prognosis of pancreatic cancer is poor,
with a 5-year survival rate of 5% or less (1). The surgery adaptation is 20% or less
in newly diagnosed cases of pancreatic cancer (2). Pancreatic cancer cells have
aggressive biological characteristics, while the antitumor effects
of radiation and chemotherapy are insufficient to treat the disease
(3).
Gemcitabine [2′,2′-difluorodeoxycytidine (dFdC)], a
nucleic acid analogue, is one of a few chemotherapeutic drugs used
in the treatment of pancreatic cancer. Regarding the action
mechanism, gemcitabine is metabolized to dFdC diphosphate (dFdCDP)
and dFdC triphosphate (dFdCTP) in the cells (4). Since dFdCTP are incorporated into the
DNA strand by DNA polymerase, DNA replication is obstructed. After
that, apoptosis is induced (5).
Consequently, the dCTP density in the cells is decreased. In
addition, gemcitabine inhibits ribonucleotide reductase (6). Consequently, DNA synthesis is
decreased.
Deletion, amplification and methylation of DNA are
important for pancreatic cancer tumor development and progression
(1,2). Pancreatitis-associated protein (PAP),
a pancreatic stress protein, is induced in pancreatic acinaracinar
cells in acute pancreatitis, demonstrating anti-apoptotic as well
as anti-inflammatory actions (7).
Ectopic PAP expression was detected in pancreatic ductal
adenocarcinoma (8). Additionally,
PAP levels in serum (9) and
pancreatic juice (10) were
increased in pancreatic cancer. Pancreatic stress proteins, other
than PAP, include p8 and tumor protein 53-induced nuclear protein 1
(TP53INP1). The actions of p8 resemble those of PAP. Notably, p8 is
crucial in the gemcitabine resistance (11).
However, TP53INP1 expression decreases in cancer
cells, as well as having a tumor suppressor gene character
(12–14). TP53INP1 protein expression is
induced in a gemcitabine-treated pancreatic cancer cell line
(PANC-1) (15), therefore, an
association between the gemcitabine sensitivity of pancreatic
cancer and TP53INP1 was suspected. The p53 gene is mutated in most
human cancer cells, including pancreatic cancer. TP53INP1 is
closely correlated with p53, with a pro-apoptotic potential
(12). TP53INP1 controls
transcriptional activities of p53 by homeodomain-interacting
protein kinase 2 (HIPK2) (16).
Overexpression of TP53INP1 stops the cell cycle, while inducing
cell apoptosis (17).
The present study was conducted to clarify the
molecular mechanisms of gemcitabine sensitivity regarding TP53INP1.
Moreover, the significance of TP53INP1 in cell cycles, check points
and gemcitabine sensitivity was delineated.
Materials and methods
TP53INP1−/−and
TP53INP1+/+ mouse embryonic fibroblasts (MEFs)
TP53INP1-deficient mice were generated as
described previously (18). At
14.5 days post coitum, TP53INP1−/−-MEF and
TP53INP1+/+-MEF were prepared from embryos derived from
the homozygous breeding of TP53INP1-deficient mice and of
their wild-type littermates, according to earlier reports in the
literature (12,14,19).
These cells were transformed and immortalized by transduction with
the pBabe-E1A/rasV12 retroviral vector, encoding the
constitutively active ras. The TP53INP1 genotypes of the
respective MEFs were determined by polymerase chain reaction (PCR).
Genotype analyses were conducted on genomic DNA from MEF, with the
following PCR primers F, R1 and R2: F, 5′-AATGTATGCAATCTTAGCTGA
TGC-3′; R1: 5′-TCTTGAGGTAACATAGTGAAATGC-3′; and R2:
5′-CCAAACACTGTCACTGTATTGATA-3′. PCR analysis was performed as
described in an earlier study (18).
Cell culture and treatment
TP53INP1−/−-MEF and
TP53INP1+/+-MEF were maintained in Dulbecco’s Modified
Eagle’s Medium (DMEM) Glutamax medium supplemented with 10% fetal
bovine serum (FBS) and 1% penicillin/streptomycin (Invitrogen
Corp., Groningen, The Netherlands) at 37°C under 5% in
CO2 atmosphere. The ras-transformed MEFs at early
passages were used for subsequent experiments.
TP53INP1−/−-MEF and
TP53INP1+/+ MEF were treated with 0, 5, 10 and 20 ng/ml
gemcitabine (Eli Lilly and Co., Indianapolis, IN, USA) for 24
h.
Western blot analysis
Whole cell lysates were prepared using RIPA buffer
with a protease inhibitor cocktail (Roche Diagnostics KK, Basel,
Switzerland). A 25 μg aliquot of each cellular protein
sample was diluted in loading buffer (Bio-Rad Laboratories, Inc.,
Berkeley, CA, USA). The proteins were separated in sodium
dodecylsulfatepolyacrylamide gel electrophoresis (SDS-PAGE) and
transferred to Immobilon-P polyvinylidene fluoride 7 (PVDF)
membranes (Millipore Corp., Billerica, MA, USA). Subsequent to
blocking with 5% skimmed milk solution, the membrane was treated
with monoclonal antibodies against p21, p53, TP53INP1 (Abcam,
Cambridge, UK), Rb (Cell Signaling Technology, Inc., Beverly, MA,
USA), and β-actin (Sigma-Aldrich Corp., St. Louis, MO, USA). A Cell
Cycle/Checkpoint Antibody Sampler kit (Cell Signaling Technology,
Inc.) was also used. The respective bound antibodies were detected
with an IgG rabbit monoclonal antibody (SouthernBiotech,
Birmingham, AL, USA), then visualized with Immune Star LD (Wako
Pure Chemical Industries, Ltd., Osaka, Japan), using Fuji Xerox
LAS4000 image analyzer (Fujifilm Corp., Tokyo, Japan). The
intensity of each protein signal was measured using Multi
Gauge® (Fujifilm Corp.).
Reverse transcription-PCR (RT-PCR)
Total RNA was extracted from
TP53INP1−/−-MEF and TP53INP1+/+-MEF, using an
RNeasy Mini kit (Qiagen GmbH, Hilden, Germany). The RT reaction was
conducted with a SuperScript™ III First-Strand Synthesis System
(Invitrogen Corp.) using random hexamers to generate complementary
DNA (cDNA) according to the manufacturer’s instructions. RT-PCR was
conducted using TaqMan probe; TaqMan® Fast Universal PCR
Master mix (Applied Biosystems, Foster City, CA, USA). Sequences of
the primers were CDKN1A (p21) mixed primers; Mm00432448_m1 (Applied
Biosystems), glyceraldehyde-3-phosphate dehydrogenase (GAPDH) mixed
primers; Mm99999915_g1 (Applied Biosystems). RT-PCR was conducted,
using a Real-Time PCR system (Applied Biosystems 7900HT Fast;
Applied Biosystems) as well as the ΔΔCT method. The result was
analyzed with the SDS software ver. 2.3 (Applied Biosystems).
The same experiments were performed 3 times. The
mean number of cells in each experiment was calculated with
standard deviations (SDs).
Flow cytometry (FCM)
The cells at the exponential growth phase were
labeled with 5-bromo-2-deoxyuridine (BrdU) (Sigma-Aldrich Corp.) [1
mM dissolved in phosphate-buffered saline (PBS)] in a final
concentration of 10 μM in the medium. BrdU labeling and
subsequent handling of the cells were conducted under subdued
light. Subsequent to 15 min of incubation at 37°C, the
BrdU-containing medium was removed, and the cells were rinsed twice
with PBS. The labeled cells were trypsinized and counted, using a
hemocytometer and centrifuged at 5,000 × g for 5 min at 4°C. The
pelleted cells were suspended and fixed in ice-cold 70% ethanol
(∼2×10⁶ cells/ml) and stored at −20°C until
analysis.
The fixed cells were resuspended in 1 ml PBS
containing 0.5% Triton X-100, treated with 2N-HCl for 30 min at
room temperature and neutralized with 0.1 M sodium tetraborate (pH
8.5). Subsequent to washing twice with washing solution [PBS
containing 0.5% Tween-20 and 1% bovine serum albumin (BSA)], the
cells were stained with fluorescein isothiocyanate (FITC)-labeled
mouse anti-BrdU antibody or FITC-labeled mouse IgG1κ isotype as a
negative control (both antibodies included in FITC Mouse Anti-Human
BrdU set; Becton-Dickinson, Franklin Lakes, NJ, USA) overnight at
4°C. The stained cells were washed twice with 1 ml ice-cold PBS and
incubated with 0.25% RNase (Sigma-Aldrich Corp.) for 30 min at room
temperature. The cells were then stained with 5 μg/ml
propidium iodide (PI; Sigma-Aldrich Corp.) and examined using FCM
(FACSCalibur; Becton-Dickinson) for green and red fluorescence,
which determined the relative number of BrdU-labeled cells and
cells examined, respectively.
Colony formation assay
A total of 200 exponentially growing
TP53INP1−/−-MEFs or INP1+/+-MEFs were seeded
on a 6-cm dish and grown in DMEM Glutamax medium, containing 10%
FBS at 37°C in a 5% CO2 atmosphere. After a week, the
colonies per dish were counted; each cell line was counted
immediately.
When cells were confluent, gemcitabine was added to
the medium 3 days subsequent to cell seeding.
TP53INP1−/− and TP53INP1+/+ cells were
treated with 0, 5, 10 and 20 ng/ml gemcitabine for 24 h. Cell
growth was determined using the colony formation assay. The same
experiments were performed 3 times. The mean number of colonies in
each experiment was calculated.
Statistical analysis
Data were analyzed using the Student’s t-test.
Values were given as the mean ± SEM and P<0.05 was considered to
indicate a statistically significant difference. The results were
analyzed using Excel (Microsoft Corp.).
Results
Characteristics of TP53INP1-deficient and
the wild-type MEFs
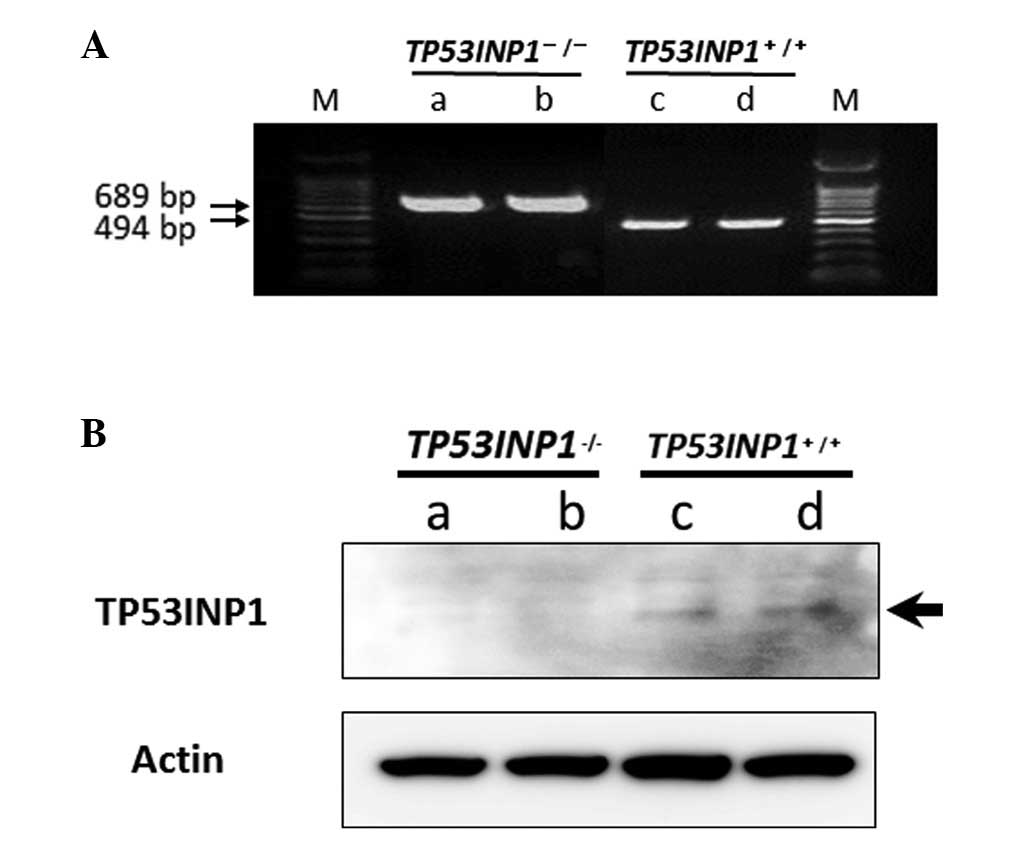
The TP53INP1, a nuclear localization protein
gene, was amplified using PCR. Null mutation mice were generated by
genotyping (18). As confirmed by
PCR (Fig. 1A) and western blot
analysis, TP53INP1 was deficient in TP53INP1−/- MEFs,
but expressed in TP53INP1+/+-MEFs, respectively
(Fig. 1B).
TP53INP1−/−-MEFs and
TP53INP1+/+-MEFs were cultured and the colonies were
confirmed. Subsequently, several subclones were established from
the TP53INP1−/−-MEFs and TP53INP1+/+-MEFs.
Two subclones from cells of each type (subclones a and b from the
TP53INP1−/−-MEFs; subclones c and d from the
TP53INP1+/+-MEFs) were selected.
Proliferation of
TP53INP1−/−-MEFs and TP53INP1+/+-MEFs
Cell proliferation was measured by colony formation
assay. The proliferation of TP53INP1−/−-MEFs tended to
be faster compared to TP53INP1+/+-MEFs (a, b and c, d,
respectively) (Fig. 2).
Sensitivities of
TP53INP1−/−-MEFs and TP53INP1+/+-MEFs to
gemcitabine
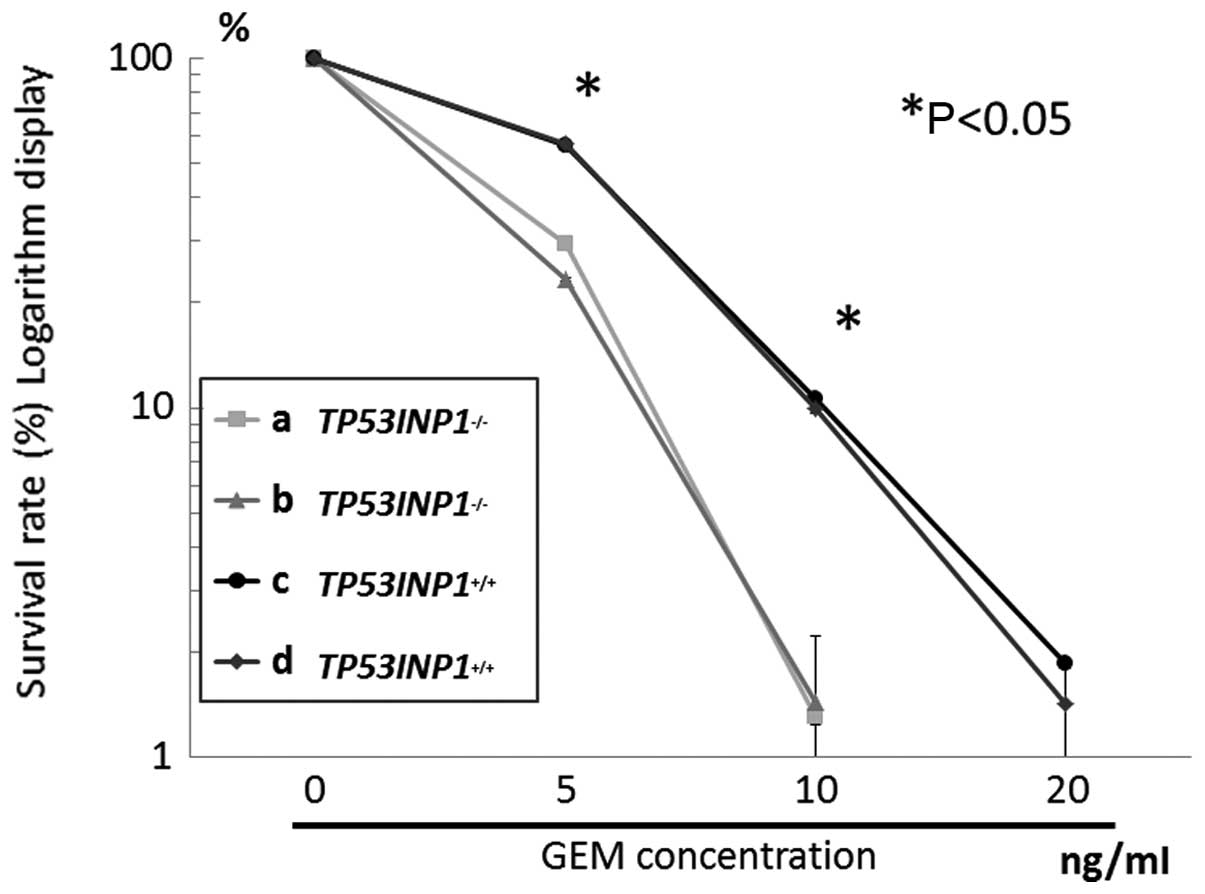
Cells were treated with gemcitabine for 24 h, then
cell growth was assayed. Gemcitabine inhibited a significantly
greater TP53INP1−/− cell growth compared to
TP53INP1+/+ cells, in a concentration-dependent manner
(Fig. 3) (P<0.05). According to
the curve indicating the survival rate, IC50 of
TP53INP1−/− was estimated as 2–3 ng/ml, while that of
TP53INP1+/+ was 5–10 ng/ml.
Effects of gemcitabine on the cell cycle
status of TP53INP1−/−-MEFs and
TP53INP1+/+-MEFs
TP53INP1−/−-MEFs and
TP53INP1+/+-MEFs were treated with gemcitabine at 10
ng/ml for 24 and 48 h. Subsequent to treatment, each cell cycle
status was determined using FCM. Differences in each peak of G1, S
and G2/M of TP53INP1−/−-MEF and
TP53INP1+/+-MEF were impossible to confirm based on the
results of FCM. Gemcitabine treatment generated almost equal
apoptosis in both cell lines.
p21 and p53 expression in
TP53INP1−/−-MEFs and TP53INP1+/+-MEFs
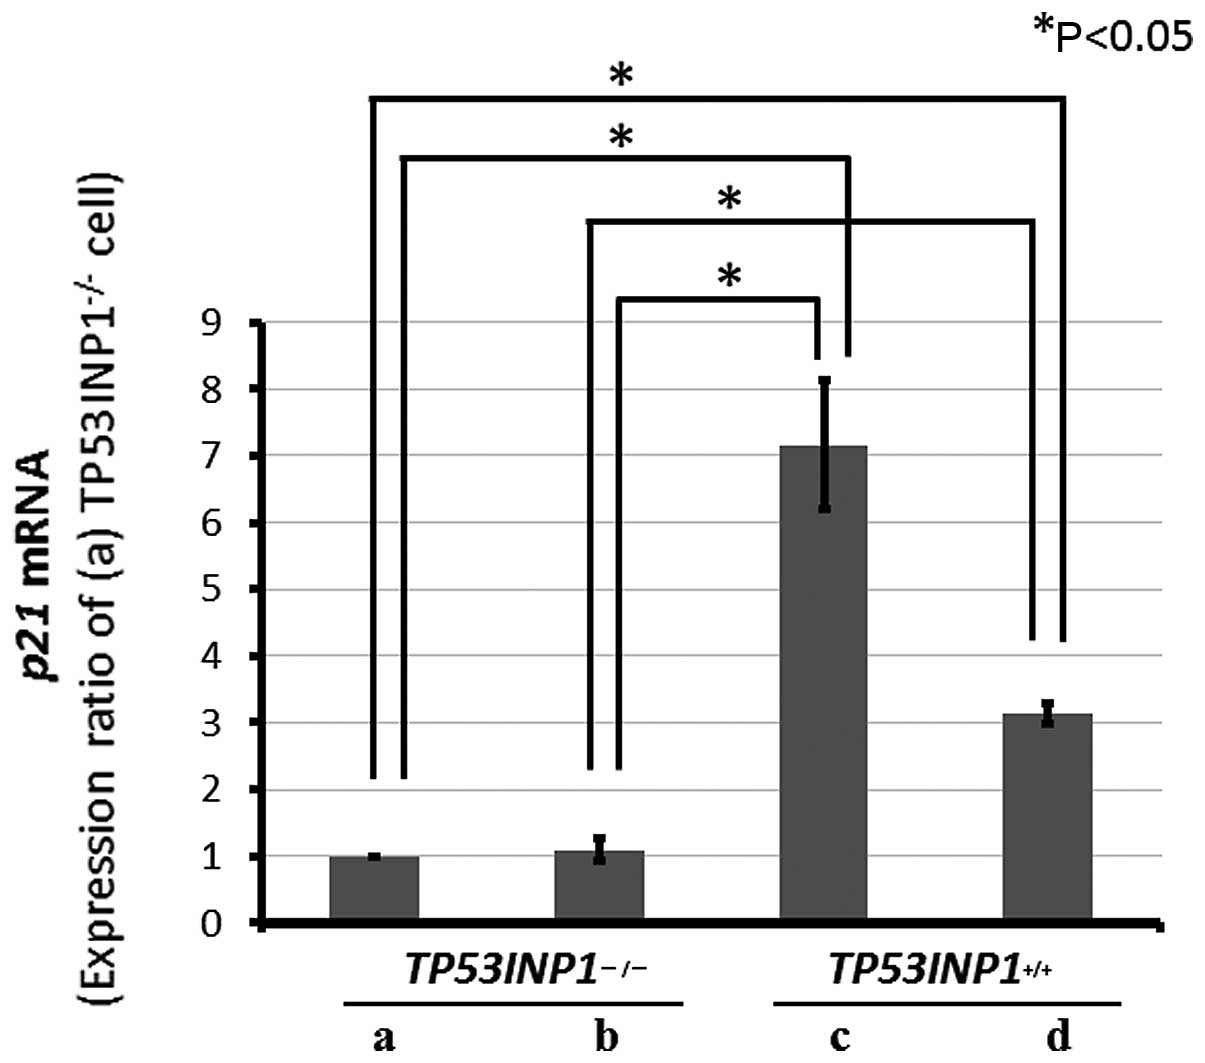
A previous report (16) demonstrated that TP53INP1
overexpression induced p21 expression, while findings of the
present study confirmed the decrease of the mRNA and protein
expressions induced by the TP53INP1 knockout. Moreover, another
study described that oxidative stress decreased the p21 expression
in TP53INP1 knockout cells; thus, the change in p21 expression was
examined using gemcitabine treatment.
Subsequent to gemcitabine treatment in both cell
lines, in RT-PCR, the p21 mRNA expression was significantly
decreased in the TP53INP1−/−-MEFs compared to
TP53INP1+/+-MEFs (P<0.05) (Fig. 4).
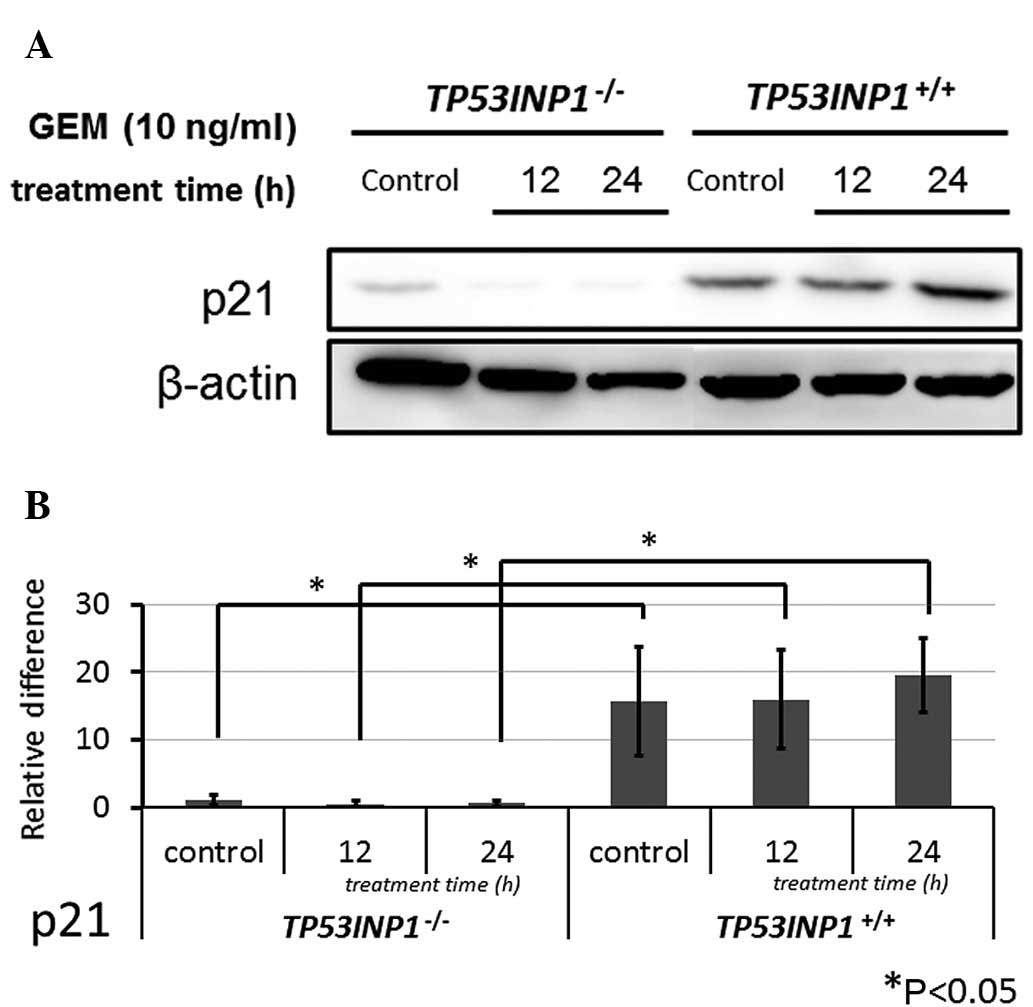
Subsequent to the same treatment in both cell lines,
western blot analysis revealed that the protein expression of p21
was significantly lower in TP53INP1−/−-MEFs compared to
TP53INP1+/+-MEFs (P<0.05) (Fig. 5).
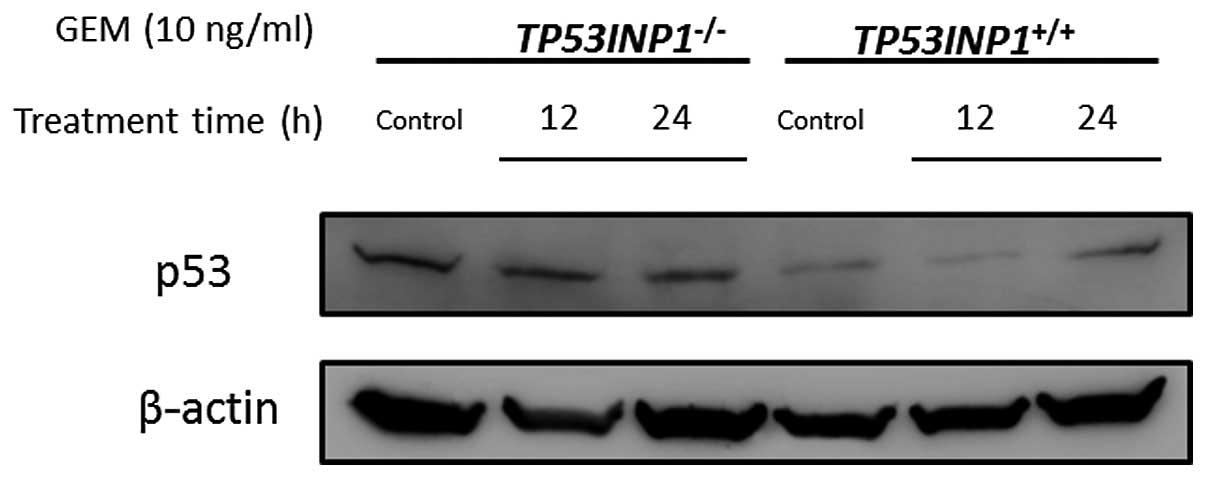
It is already widely acknowledged that p53 is
located upstream of p21. A previous study described that a
decreased p21 expression resulted from a decreased p53 expression
(21). In TP53INP1−/−
cells, the p21 expression decreased in RNA and protein. Whether or
not these results were derived from the status of p53 expression
was investigated. The expression of p53 was verified by western
blotting in both TP53INP1−/−-MEF and
TP53INP1+/+-MEF. This experiment demonstrated that p53
expression was not decreased in TP53INP1−/−-MEFs
(Fig. 6).
Discussion
This study is the first addressing the role of
TP53INP1 in the molecular mechanisms of gemcitabine
sensitivity.
TP53INP1 is considered to suppress cell
proliferation, while reducing gemcitabine sensitivity, since
TP53INP1−/−-MEF proliferation is faster and gemcitabine
sensitivity of INP1−/− is higher compared to the
wild-type MEFs. Flow cytometry analysis indicated no existing
difference between INP1+/+ and INP1−/− in the
cell-cycle-checkpoint. It is known that DNA replication processes
with disrupted DNA repair leads to unsuccessful cell proliferation.
Moreover, TP53INP1 is known to be a pro-apoptosis gene. An earlier
study demonstrated that TP53INP1 expression is induced by
gemcitabine treatment in a pancreatic cancer cell line, PANC-1
(15).
The gemcitabine action was expected to be stronger
in the INP1+/+ compared to INP1−/− cells, the
results, however, revealed the opposite. This phenomenon differed
from those delineated in previous studies on gemcitabine
sensitivity in pancreatic cancer, since the cells used were
immortalized MEF instead of pancreatic cancer cells. TP53INP1 has a
tumor suppressor gene character, while TP53INP1 expression is
decreased in cancer cells (20),
while being decreased or eradicated in the course of pancreatic
carcinogenesis (14). In this
study, the p21 expression was delineated to be suppressed and no
change was observed subsequent to gemcitabine treatment in
INP1−/− cells, thereby not contradicting the p21
suppression in INP1−/− cells treated with antioxidant
stresses (21). These phenomena
suggest that decreased or disrupted functions of the check points
engender a rapid cell growth without the arrest of DNA replication
at the G2/M phase. Apoptosis might be promoted due to the wrong DNA
synthesis, whereas these mechanisms might partially explain
gemcitabine sensitivity.
Regarding p53, results demonstrate p53-independent
regulation of TP53INP1 expression in addition to the p53-dependent,
confirming that p21 expression is independent of p53.
The INP1−/− cells grew more rapidly
compared to the INP1+/+ cells. Rb phosphorylation was
considered to be involved in this phenomenon. A preliminarily
analysis of the expression of Rb protein and its phosphorylation
was conducted, however, no phosphorylation of Rb was found in the
INP1+/+ and INP1−/− cells (data not shown).
When Rb is phosphorylated, p21 induces G2 arrest and inhibits DNA
replication (22). In the present
study, no difference was found between INP1+/+ and
INP1−/− cells in the cell-cycle-checkpoint. The activity
of TP53INP1, however, should be analyzed at each
cell-cycle-checkpoint, based on the information presented
above.
Notably, SMG-1, a phosphatidyl inositol 3-kinase
(PI3K), has recently been found to be involved in the
gemcitabine-induced expression mechanism of microRNA-155/BIC in
pancreatic PANC-1 cancer cells (23). As described above, TP53INP1 is
suppressed by microRNA-155/BIC in pancreatic carcinogenesis
(14), while microRNA-155 is
considered to be associated with gemcitabine sensitivity.
Consequently, the correlation among TP53INP1, microRNA-155 and
gemcitabine sensitivity requires to be further investigated.
Additional studies are required regarding the role
of TP53INP1 in the molecular mechanisms of gemcitabine sensitivity,
including that of micro-RNA.
Acknowledgements
This study was supported in part by
the Grant for Collaborative Research from the Kanazawa Medical
University (C2008-3) and by the Project Research Grant from the
High-Tech Research Center of Kanazawa Medical University
(H2010-11).
References
|
1.
|
Vincent A, Herman J, Schulick R, Hruban RH
and Goggins M: Pancreatic cancer. Lancet. 378:607–620. 2011.
|
|
2.
|
Hezel AF, Kimmelman AC, Stanger BZ,
Bardeesy N and Depinho RA: Genetics and biology of pancreatic
ductal adenocarcinoma. Genes Dev. 20:1218–1249. 2006.
|
|
3.
|
Di Marco M, Di Cicilia R, Macchini M,
Nobili E, Vecchiarelli S, Brandi G and Biasco G: Metastatic
pancreatic cancer: Is gemcitabine still the best standard
treatment? Oncol Rep. 23:1183–1192. 2010.
|
|
4.
|
Huang P, Chubb S, Hertel LW, Grindey GB
and Plunkett W: Action of 2′,2′-difluorodeoxycytidine on DNA
synthesis. Cancer Res. 51:6110–6117. 1991.
|
|
5.
|
Gandhi V, Mineishi S, Huang P, Yang Y,
Chubb S, Chapman AJ, Nowak BJ, Hertel LW and Plunkett W:
Difluorodeoxyguanosine: cytotoxicity, metabolism, and actions on
DNA synthesis in human leukemia cells. Semin Oncol. 22:61–67.
1995.
|
|
6.
|
Heinemann V, Xu YZ, Chubb S, Sen A, Hertel
LW, Grindey GB and Plunkett W: Inhibition of ribonucleotide
reduction in CCRF-CEM cells by 2′,2′-difluorodeoxycytidine. Mol
Pharmacol. 38:567–572. 1990.
|
|
7.
|
Keim V, Iovanna JL and Dagorn JC: The
acute phase reaction of the exocrine pancreas. Gene expression and
synthesis of pancreatitis-associated proteins. Digestion. 55:65–72.
1994.
|
|
8.
|
Xie MJ, Motoo Y, Iovanna JL, Su SB,
Ohtsubo K, Matsubara F and Sawabu N: Overexpression of
pancreatitis-associated protein (PAP) in human pancreatic ductal
adenocarcinoma. Dig Dis Sci. 48:459–464. 2003.
|
|
9.
|
Motoo Y, Satomura Y, Mouri I, Mouri H,
Ohtsubo K, Sakai J, Fujii T, Taga H, Yamaguchi Y, Watanabe H, et
al: Serum levels of pancreatitis-associated protein in digestive
diseases with special reference to gastrointestinal cancers. Dig
Dis Sci. 44:1142–1147. 1999.
|
|
10.
|
Su SB, Motoo Y, Iovanna JL, Xie MJ and
Sawabu N: Effect of camostat mesilate on the expression of
pancreatitis-associated protein (PAP), p8, and cytokines in rat
spontaneous chronic pancreatitis. Pancreas. 23:134–140. 2001.
|
|
11.
|
Nowak J, Tomasini R, Mattei MG, Azizi
Samir LA, Dagorn JC, Dusetti N, Iovanna JL and Pébusque MJ:
Assignment of tumor protein p53 induced nuclear protein 1
(TP53INP1) gene to human chromosome band 8q22 by in situ
hybridization. Cytogenet Genome Res. 97:140E2002.
|
|
12.
|
Tomasini R, Samir AA, Pebusque MJ, Calvo
EL, Totaro S, Dagorn JC, Dusetti NJ and Iovanna JL: P53-dependent
expression of the stress-induced protein (SIP). Eur J Cell Biol.
81:294–301. 2002.
|
|
13.
|
Okamura S, Arakawa H, Tanaka T, Nakanishi
H, Ng CC, Taya Y, Monden M and Nakamura Y: p53DINP1, a
p53-inducible gene, regulates p53-dependent apoptosis. Mol Cell.
8:85–94. 2001.
|
|
14.
|
Gironella M, Seux M, Xie MJ, Cano C,
Tomasini R, Gommeaux J, Garcia S, Nowak J, Yeung ML, Jeang KT, et
al: Tumor protein 53-induced nuclear protein 1 expression is
repressed by miR-155, and its restoration inhibits pancreatic tumor
development. Proc Natl Acad Sci USA. 104:16170–16175. 2007.
|
|
15.
|
Jiang PH, Motoo Y, Sawabu N and Minamoto
T: Effect of gemcitabine on the expression of apoptosis-related
genes in human pancreatic cancer cells. World J Gastroenterol.
12:1597–1602. 2006.
|
|
16.
|
Möller A, Sirma H, Hofmann TG, Rueffer S,
Klimczak E, Dröge W, Will H and Schmitz ML: PML is required for
homeodomain-interacting protein kinase 2 (HIPK2)-mediated p53
phosphorylation and cell cycle arrest but is dispensable for the
formation of HIPK domains. Cancer Res. 63:4310–4314. 2003.
|
|
17.
|
Yoshida K, Liu H and Miki Y: Protein
kinase C delta regulates Ser46 phosphorylation of p53 tumor
suppressor in the apoptotic response to DNA damage. J Biol Chem.
281:5734–5740. 2006.
|
|
18.
|
Gommeaux J, Cano C, Garcia S, Gironella M,
Pietri S, Culcasi M, Pébusque MJ, Malissen B, Dusetti N, Iovanna J
and Carrier A: Colitis and colitis-associated cancer are
exacerbated in mice deficient for tumor protein 53-induced nuclear
protein 1. Mol Cell Biol. 27:2215–2228. 2007.
|
|
19.
|
Harvey M, Sands AT, Weiss RS, Hegi ME,
Wiseman RW, Pantazis P, Giovanella BC, Tainsky MA, Bradley A and
Donehower LA: In vitro growth characteristics of embryo
fibro-blasts isolated from p53-deficient mice. Oncology.
8:2457–2467. 1993.
|
|
20.
|
Jiang PH, Motoo Y, Garcia S, Iovanna JL,
Pébusque MJ and Sawabu N: Down-expression of tumor protein
p53-induced nuclear protein 1 in human gastric cancer. World J
Gastroenterol. 12:691–696. 2006.
|
|
21.
|
Cano CE, Gommeaux J, Pietri S, Culcasi M,
Garcia S, Seux M, Barelier S, Vasseur S, Spoto RP, Pébusque MJ, et
al: Tumor protein 53-induced nuclear protein 1 is a major mediator
of p53 antioxidant function. Cancer Res. 69:219–226. 2009.
|
|
22.
|
Niculescu AB III, Chen X, Smeets M, Hengst
L, Prives C and Reed SI: Effects of p21Cip1/Waf1) at both the G1/S
and the G2/M cell cycle transitions: pRb is a critical determinant
in blocking DNA replication and in preventing endoreduplication.
Mol Cell Biol. 18:629–643. 1998.
|
|
23.
|
Xia QS, Ishigaki Y, Zhao X, Shimasaki T,
Nakajima H, Nakagawa H, Takegami T, Chen ZH and Motoo Y: Human
SMG-1 is involved in gemcitabine-induced primary microRNA-155/BIC
up-regulation in human pancreatic cancer PANC-1 cells. Pancreas.
40:55–60. 2011.
|