Introduction
Carbohydrate antigen 19-9 (CA19-9) and
carcinoembryonic antigen (CEA) have been well recognized as tumor
markers for colorectal cancer (1).
These markers are crucial in the routine clinical setting,
including diagnosis, predicting prognosis and monitoring the
effects of treatment. Numerous studies have demonstrated that
colorectal cancer patients with elevated levels of CEA and CA19-9
have a significantly poorer prognosis compared with those with
normal levels of these tumor markers (2,3).
Serial CEA measurements may detect recurrent colorectal cancer with
a sensitivity of 80% and a specificity of 70% and may provide a
lead time of 5 months. CA19-9 has been reported to exhibit a
sensitivity of 70–80% and a specificity of 80–90% (4). Elevated preoperative CEA values are
associated with more advanced disease and worse outcome following
surgical resection, regardless of the tumor stage and histological
grade (5–7).
Despite the widespread use of monitoring serum CEA
and CA19-9 levels during follow-up, their accuracy remains unclear.
Certain non-malignant conditions, such as ageing, chronic renal
failure, hypothyroidism, cigarette smoking, chronic obstructive
pulmonary disease and obesity may be associated with alterations in
serum CEA levels (8–12). The serum CA19-9 levels are also
frequently elevated in patients with various gastrointestinal
malignancies, such as pancreatic, colorectal, gastric and hepatic
carcinomas. In addition, the serum CA19-9 levels may be elevated in
certain non-malignant conditions (13).
According to previous studies, the serum
concentration of soluble tumor markers in obese populations is
lower compared with that in non-obese subjects (14,15).
The larger vascular volume of obese individuals exerts a dilutional
effect, a phenomenon known as hemodilution. However, the number of
available studies investigating the association between CEA, CA19-9
and body mass index (BMI) is limited in China. Therefore, the aim
of this study was to investigate the association of plasma volume
with CEA and CA19-9 concentration in colorectal cancer
patients.
Materials and methods
Patients
The collected records of 2,950 consecutive
colorectal cancer patients between August, 1994 and December, 2005
were retrospectively reviewed. Analyses were confined to patients
with BMI>16 kg/m2. The exclusion criteria were as
follows: i) patients with unregistered data on BMI, CEA and CA19-9;
ii) history of malignant disease or inflammatory bowel disease,
renal insufficiency requiring hemodialysis or advanced stage of
liver cirrhosis, cancer of mucinous or squamous histology, familial
adenomatous polyposis, or synchronous colon cancer. The remaining
300 patients were included in the present analysis.
This study was approved by the Ethics Committee of
Sun Yat-sen University (Guangzhou, China). Written informed consent
was obtained from all patients.
Clinical variables
Height and weight were objectively measured at
admission and preoperative BMI was calculated as weight in
kilograms divided by height in meters squared. In view of the
differences in the recommended BMI cut-off points for overweight
status and obesity between the Chinese and Western populations, the
following categories were used: lower range of normal weight
(BMI<18.5 kg/m2), normal weight (BMI=18.5–24.0
kg/m2) and overweight (BMI>24.0 kg/m2).
The baseline serum CEA and CA19-9 concentrations were measured by
enzyme immunoassay in a single laboratory at The Affiliated
Hospital of Sun Yat-sen University. The estimated body surface area
was calculated as follows: (body weight)0.425 ×
(height)0.72 × 0.007184. The estimated plasma volume (in
liters) was calculated as body surface area × 1.670. The CEA and
CA19-9 concentrations were measured in ng/ml. The CEA and CA19-9
mass (in micrograms), representing the total amount of CEA and
CA19-9 protein within the circulation, was calculated as serum CEA
and CA19-9 concentration × estimated plasma volume. The patients
were followed up for at least 5 years or until death. The follow-up
examinations included physical examination, serum carcinoembryonic
antigen levels, chest X-rays, abdominal ultrasonography, or
thoracoabdominal computed tomography performed at 6- or 12-month
intervals.
CEA and CA19-9 determination and patient
scoring
Values of CEA ≥7 ng/ml were defined as abnormal and
were scored as CEA+. Levels of CA19-9 ≥37 ng/ml were
defined as abnormal and were scored as CA19-9+. Patients
were divided into four groups according to the results of the two
markers. The CEA/CA19-9 respective scores of the groups were
CEA+/CA19-9−,
CEA+/CA19-9+,
CEA−/CA19-9− and
CEA−/CA19-9+. Survival was analyzed in terms
of CEA and CA19-9.
Statistical analysis
Pearson’s correlation coefficients were estimated to
evaluate the association of serum CEA and CA19-9 levels with the
clinical parameters. Due to the log-normal distribution, the serum
CEA and CA19-9 levels were log-transformed for analysis.
Correlation and regression analyses were performed to calculate the
values and formulas to evaluate the association between clinical
parameters and log-transformed serum levels. Multiple linear
regression analyses were performed to assess whether clinical
parameters significantly contributed to interpreting serum CEA and
CA19-9 levels. Only the variables that were statistically
significant (P<0.05) in the Pearson’s linear regression analysis
were included in the multiple linear regression model. A stepwise
method was used to select the explanatory variables based on
analysis of variance.
The Kaplan-Meier method was used to calculate the
cumulative survival rates and plot survival curves and the log-rank
test was used to identify statistical differences between the
curves. Survival time was calculated from the time of surgery to
the last contact or death. To minimize the interpretation bias,
overall survival analysis was performed. P<0.05 was considered
to indicate a statistically significant difference.
Results
Patients and tumor characteristics
We investigated a total of 300 patients who
underwent preoperative CEA and CA19-9 measurement and met our
inclusion criteria: i) BMI>16 kg/m2, ii) no history
of malignant disease, inflammatory bowel disease, renal
insufficiency requiring hemodialysis, advanced stage of liver
cirrhosis, cancer of mucinous or squamous histology, familial
adenomatous polyposis, or synchronous colon cancer, and iii)
complete clinical data. The mean age at surgery was 58.27 years.
The mean BMI and preoperative CEA and CA19-9 concentrations were
21.20 kg/m2 (range, 13.65–32.87 kg/m2), 26.89
ng/ml (range, 0–1362 ng/ml) and 26.89 ng/ml (range, 0–17245.03
ng/ml), respectively. The demographic and clinicopathological
characteristics of patients with different levels of CEA and CA19-9
are shown in Tables I and II. There was a statistically significant
difference in the analysis of blood transfusion, peritoneal
metastasis and TNM stage between the two groups. The groups were
also compared for gender, age, tumor size, tumor location, liver
metastasis and histological grade. In addition, the factors of
ascites and TNM stage exhibited significant differences in the
analysis of CA19-9.
 | Table IAnalysis of demographic and
clinicopathological characteristics according to serum
carcinoembryonic antigen (CEA) levels in patients with colorectal
cancer. |
Table I
Analysis of demographic and
clinicopathological characteristics according to serum
carcinoembryonic antigen (CEA) levels in patients with colorectal
cancer.
| Characteristics | CEA | P-value for
trend |
|---|
|
|---|
| <7 ng/ml | ≥7 ng/ml |
|---|
| Gender | | | 0.438 |
| Female | 94 (41.4) | 34 (46.6) | |
| Male | 133 (58.6) | 39 (53.4) | |
| Age (years) | | | 0.881 |
| <60 | 119 (52.4) | 39 (53.4) | |
| ≥60 | 108 (47.6) | 34 (46.6) | |
| Radical
operation | | | 0.223 |
| No | 33 (14.5) | 15 (20.5) | |
| Yes | 194 (85.5) | 58 (79.5) | |
| Blood
transfusion | | | 0.029 |
| No | 178 (78.4) | 48 (65.8) | |
| Yes | 49 (21.6) | 25 (34.2) | |
| Histological
type | | | 0.249 |
| Villous
adenocarcinoma | 17 (7.5) | 5 (6.8) | |
| Tubular
adenocarcinoma | 172 (75.8) | 60 (82.2) | |
| Mucinous
adenocarcinoma | 20 (8.8) | 7 (9.6) | |
| Other | 18 (7.9) | 1 (1.4) | |
| Ascites | | | 0.066 |
| No | 207 (91.2) | 61 (83.6) | |
| Yes | 20 (8.8) | 12 (16.4) | |
| Tumor size (cm) | | | 0.053 |
| ≤5 | 144 (63.4) | 37 (50.7) | |
| >5 | 83 (36.6) | 36 (49.3) | |
| Tumor location | | | 0.185 |
| Colon | 98 (43.2) | 38 (52.1) | |
| Rectum | 129 (56.8) | 35 (47.9) | |
| Peritoneal
metastasis | | | 0.011 |
| No | 224 (98.7) | 68 (93.2) | |
| Yes | 3 (1.3) | 5 (6.8) | |
| Liver metastasis | | | 0.10 |
| No | 216 (95.2) | 63 (86.3) | |
| Yes | 11 (4.8) | 10 (13.7) | |
| TNM stage | | | 0.000 |
| I | 40 (17.6) | 4 (5.5) | |
| II | 100 (44.1) | 25 (34.2) | |
| III | 76 (33.5) | 30 (41.1) | |
| IV | 11 (4.8) | 14 (19.2) | |
| Histological
differentiation | | | 0.085 |
| High | 19 (8.4) | 4 (5.5) | |
| Moderate | 188 (82.8) | 56 (76.7) | |
| Poor | 20 (8.8) | 13 (17.8) | |
| Table IIAnalysis of demographic and
clinicopathological characteristics according to serum carbohydrate
antigen 19-9 (CA19-9) levels in patients with colorectal
cancer. |
Table II
Analysis of demographic and
clinicopathological characteristics according to serum carbohydrate
antigen 19-9 (CA19-9) levels in patients with colorectal
cancer.
|
Characteristics | CA19-9 | P-value for
trend |
|---|
|
|---|
| <37 ng/ml | ≥37 ng/ml |
|---|
| Gender | | | 0.430 |
| Female | 103 (43.8) | 25 (38.5) | |
| Male | 132 (56.2) | 40 (61.5) | |
| Age (years) | | | 0.830 |
| <60 | 112 (47.7) | 30 (46.2) | |
| ≥60 | 123 (52.3) | 35 (53.8) | |
| Blood
transfusion | | | 0.509 |
| No | 175 (74.5) | 51 (78.5) | |
| Yes | 60 (25.5) | 14 (21.5) | |
| Ascites | | | 0.021 |
| No | 215 (91.5) | 53 (81.5) | |
| Yes | 20 (8.5) | 12 (18.5) | |
| Tumor size
(cm) | | | 0.357 |
| ≤5 | 145 (61.7) | 36 (55.4) | |
| >5 | 90 (38.3) | 29 (44.6) | |
| Tumor location | | | 0.119 |
| Colon | 101 (43) | 35 (53.8) | |
| Rectum | 134 (57) | 30 (46.2) | |
| Peritoneal
metastasis | | | 0.817 |
| No | 229 (97.4) | 63 (96.9) | |
| Yes | 6 (2.6) | 2 (3.1) | |
| Liver
metastasis | | | 0.178 |
| No | 221 (94) | 58 (89.2) | |
| Yes | 14 (6) | 7 (10.8) | |
| TNM stage | | | 0.007 |
| I | 42 (17.9) | 2 (3.1) | |
| II | 100 (42.6) | 25 (38.5) | |
| III | 76 (32.3) | 30 (46.2) | |
| IV | 17 (7.2) | 8 (12.3) | |
| Histological
differentiation | | | 0.290 |
| High | 20 (8.5) | 3 (4.6) | |
| Moderate | 192 (81.7) | 52 (80) | |
| Poor | 23 (9.8) | 10 (15.4) | |
Cut-off values and prognostic
significance of CEA and CA19-9
A higher BMI was shown to be significantly
associated with higher plasma volumes (Table III). Compared with the
normal-weight patients, the patients with BMI ≥24 had 10–15% higher
plasma volumes. The association of BMI with CEA and CA19-9 mass was
then investigated. The CEA and CA19-9 mass did not change
significantly with increasing BMI, except for CEA in stage I
(Table III). The proportion of
patients with overall abnormal CEA and CA19-9 levels at each
cut-off value was decreased with BMI (Table III). Moreover, there was no
statistically significant difference in the proportion of patients
with elevated CEA and CA19-9 levels by BMI category using different
cut-off points. In the analysis for the recurrence cohort, patients
with distant metastases (stage IV) were excluded. In addition, the
sensitivity, specificity, positive predictive value (PPV) and
negative predictive value (NPV) of preoperative CEA and CA19-9
measurements for tumor recurrence were calculated. The median
follow-up period was 59.8 months (range, 1–122 months; Table IV). At a cut-off value of 2.5
ng/ml for preoperative CEA, the sensitivities of the lower range of
normal weight (BMI<18.5 kg/m2), normal weight (BMI
18.5–24.0 kg/m2) and overweight were 33.9, 30.0 and
20.0, respectively (P=0.136). At serum concentrations >7.0
ng/ml, preoperative CEA concentrations were predicted with a
sensitivity of 23.0%, specificity of 83.3%, PPV of 60.0% and NPV of
51.2% in the obese group. In addition, the specificity, PPV and NPV
were not significantly different in the analysis of CA19-9
(Table V).
| Table IIIPlasma volume and carcinoembryonic
antigen (CEA) and carbohydrate antigen 19-9 (CA 19-9) mass
according to body mass index (BMI) category. |
Table III
Plasma volume and carcinoembryonic
antigen (CEA) and carbohydrate antigen 19-9 (CA 19-9) mass
according to body mass index (BMI) category.
| Stage | BMI category
(kg/m2) | P-value for
trend |
|---|
|
|---|
| <18.5 | 18.5≤BMI≤24.0 | >24 |
|---|
| Plasma volume,
liters (SD) |
| I | 2.43 (0.15) | 2.64 (0.23) | 2.78 (0.25) | 0.002 |
| II | 2.30 (0.26) | 2.59 (0.21) | 2.87 (0.21) | 0.000 |
| III | 2.41 (0.19) | 2.52 (0.19) | 2.78 (0.25) | 0.000 |
| IV | 2.45 (0.13) | 2.60 (0.18) | 2.83 (0.32) | 0.000 |
| CEA mass, μg
(IQR) |
| I | 4.2
(3.17–5.15) | 6.42
(4.60–10.69) | 6.07
(3.37–12.25) | 0.049 |
| II | 8.09
(4.96–13.00) | 7.31
(4.70–14.84) | 12.80
(5.00–21.24) | 0.513 |
| III | 13.13
(4.62–26.30) | 9.60
(3.98–19.31) | 6.56
(3.61–19.80) | 0.095 |
| IV | 21.58
(6.65–49.96) | 30.41
(9.12–76.14) | 35.27
(10.64–98.27) | 0.514 |
| CA19-9 mass, μg
(IQR) |
| I | 36.52
(26.96–57.34) | 42.69
(27.92–59.98) | 50.71
(16.06–80.35) | 0.722 |
| II | 60.45
(26.74–69.86) | 51.26
(29.21–79.42) | 69.55
(37.49–103.71) | 0.346 |
| III | 57.56
(34.06–112.95) | 60.72
(22.30–103.04) | 52.13
(30.72–125.08) | 0.243 |
| IV | 74.91
(62.13–76.68) | 71.06
(33.17–362.25) | 78.94
(64.05–101.18) | 0.528 |
| Table IVProportion of patients with elevated
carcinoembryonic antigen (CEA) and carbohydrate antigen 19-9
(CA19-9) concentration by three different cut-off points according
to body mass index (BMI). |
Table IV
Proportion of patients with elevated
carcinoembryonic antigen (CEA) and carbohydrate antigen 19-9
(CA19-9) concentration by three different cut-off points according
to body mass index (BMI).
| Cut-off values
(ng/ml) | BMI category
(kg/m2) | P-value for
trend |
|---|
|
|---|
| <18.5 | 18.5≤BMI≤24.0 | >24 |
|---|
| CEA cut-off value
(%) |
| >2.5 | 56 (93.3) | 170 (89.4) | 45 (90.0) | 0.525 |
| >5.0 | 40 (66.7) | 138 (72.6) | 37 (74.0) | 0.716 |
| >7.0 | 30 (50.0) | 96 (50.5) | 26 (52.0) | 0.191 |
| CA19-9 cut-off
value (%) |
| >13 | 52 (86.6) | 158 (83.1) | 45 (90.0) | 0.688 |
| >26 | 48 (80.0) | 145 (76.3) | 43 (86.0) | 0.504 |
| >37 | 41 (68.3) | 124 (65.2) | 38 (76.0) | 0.442 |
| Table VSensitivity, specificity, positive
predictive value and negative predictive value of high preoperative
serum carcinoembryonic antigen (CEA) and carbohydrate antigen 19-9
(CA19-9) for recurrence. |
Table V
Sensitivity, specificity, positive
predictive value and negative predictive value of high preoperative
serum carcinoembryonic antigen (CEA) and carbohydrate antigen 19-9
(CA19-9) for recurrence.
| Cut-off value
(ng/ml) | BMI category
(kg/m2) | P-value for
trend |
|---|
|
|---|
| <18.5 | 18.5≤BMI≤24.0 | >24 |
|---|
| CEA low >2.5
(%) |
| Sensitivity | 19/56 (33.9) | 51/170 (30.0) | 9/45 (20.0) | 0.136 |
| Specificity | 3/4 (75.0) | 16/20 (80.0) | 4/5 (80.0) | 0.865 |
| PPV | 19/20 (95.0) | 51/55 (92.7) | 9/10 (90.0) | 0.608 |
| NPV | 3/40 (7.5) | 16/135 (11.8) | 4/39 (10.2) | 0.688 |
| CEA high >7.0
(%) |
| Sensitivity | 10/30 (33.3) | 37/96 (38.5) | 6/26 (23.0) | 0.465 |
| Specificity | 20/30 (66.7) | 76/94 (80.8) | 20/24 (83.3) | 0.119 |
| PPV | 10/20 (50.0) | 31/55 (56.3) | 6/10 (60.0) | 0.567 |
| NPV | 20/40 (50.0) | 76/135 (56.2) | 20/39 (51.2) | 0.903 |
| CA 19-9 low >13
(%) |
| Sensitivity | 16/52 (30.7) | 45/158 (28.4) | 9/45 (20.0) | 0.247 |
| Specificity | 4/8 (50.0) | 22/32 (68.7) | 4/5 (80.0) | 0.236 |
| PPV | 16/20 (80.0) | 45/55 (81.8) | 9/10 (90.0) | 0.546 |
| NPV | 4/40 (10.0) | 22/135 (16.2) | 4/39 (10.2) | 0.964 |
| CA 19-9 low >37
(%) |
| Sensitivity | 12/41 (29.2) | 39/124 (31.4) | 8/38 (21.0) | 0.438 |
| Specificity | 11/19 (57.8) | 50/66 (75.7) | 10/12 (83.3) | 0.092 |
| PPV | 12/20 (60.0) | 39/55 (70.9) | 8/10 (80.0) | 0.235 |
| NPV | 11/40 (27.5) | 50/135 (37.0) | 10/39 (25.6) | 0.873 |
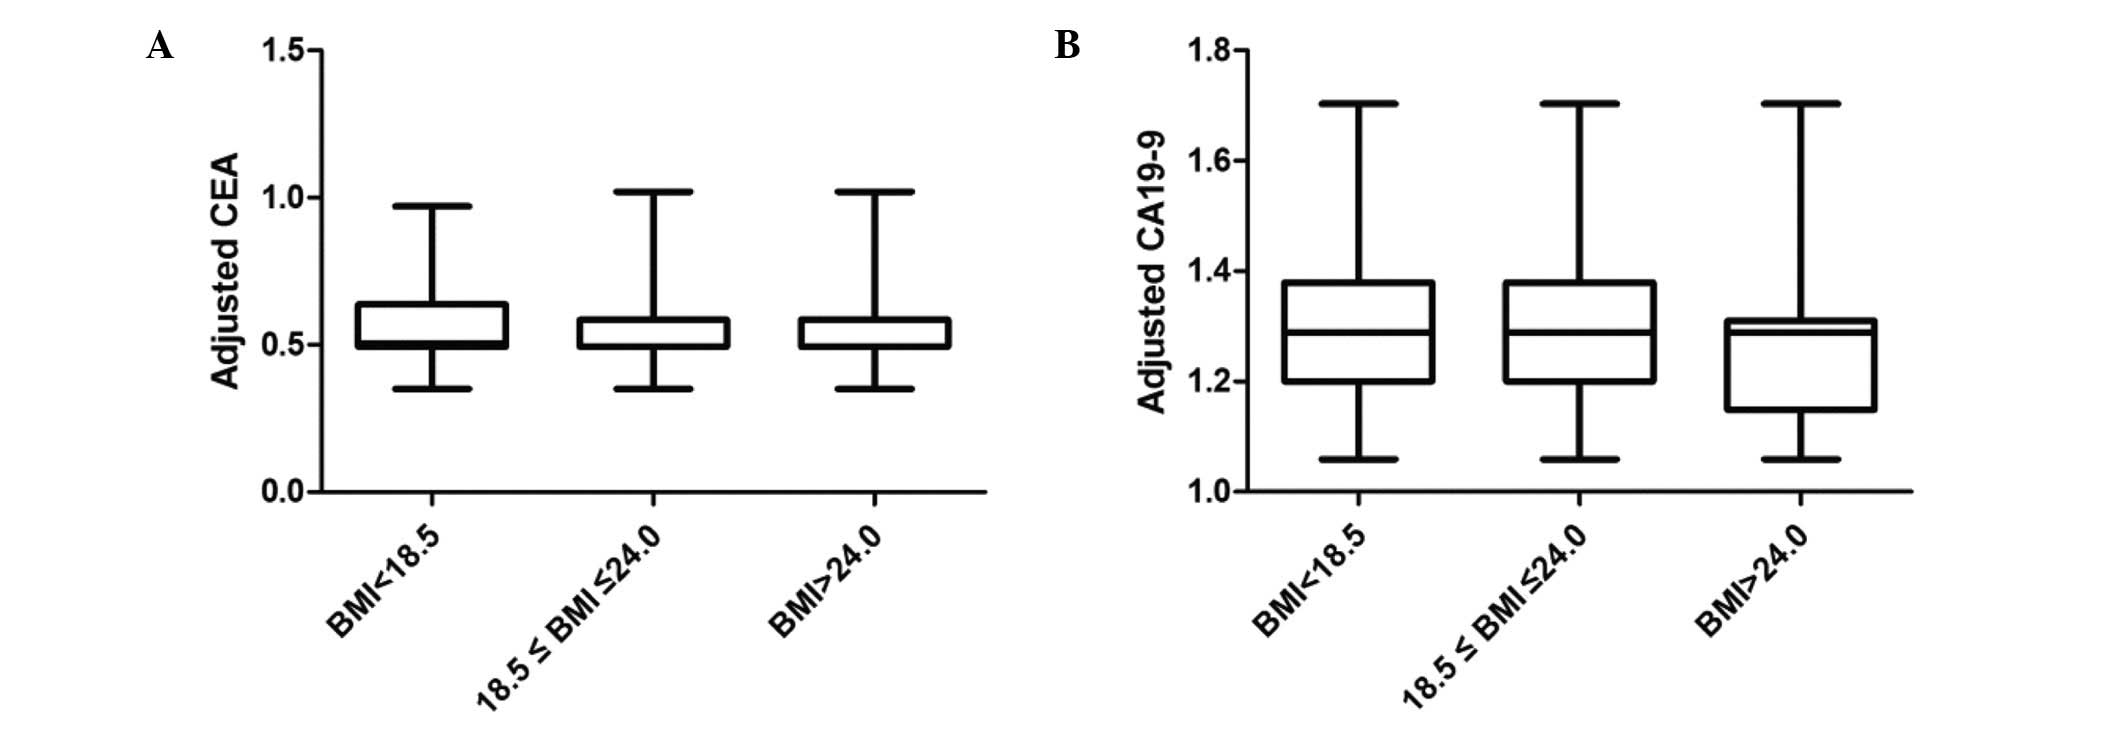
Clinical interpretation of the effect of
obesity on CEA and CA19-9 concentration
Following determination of the association of BMI
with CEA and CA19-9 concentration, we investigated the effect of
overweight and obesity on this association in order to estimate the
CEA and CA19-9 concentration in high-BMI patients corresponding to
a CEA of 7.0 ng/ml in normal-weight patients. We reconstructed the
multiple regression model including BMI categories. The following
formula was obtained upon statistical analysis:
loge[CEA]=0.208+0.241[liver
metastasis]+0.051[differentiation]+0.092[TNM];
loge[CA19-9]=0.969+0.233[gender]
+0.141[ascites]+0.09[TNM]. In this mathematical model, liver
metastasis and ascites were granted points from 0 to 1 (i.e., liver
metastasis positivity was granted 1 point); each differentiation
was granted a point from 1 to 3 (i.e., high differentiation was
granted 1 point and poor differentiation 3 points); each stage of
colon cancer was granted a point from 1 to 4 (i.e., stage I was
granted 1 point and stage IV 4 points). According to the results of
the mathematical model, the adjusted CEA, CA19-9 is shown in
Fig. 1.
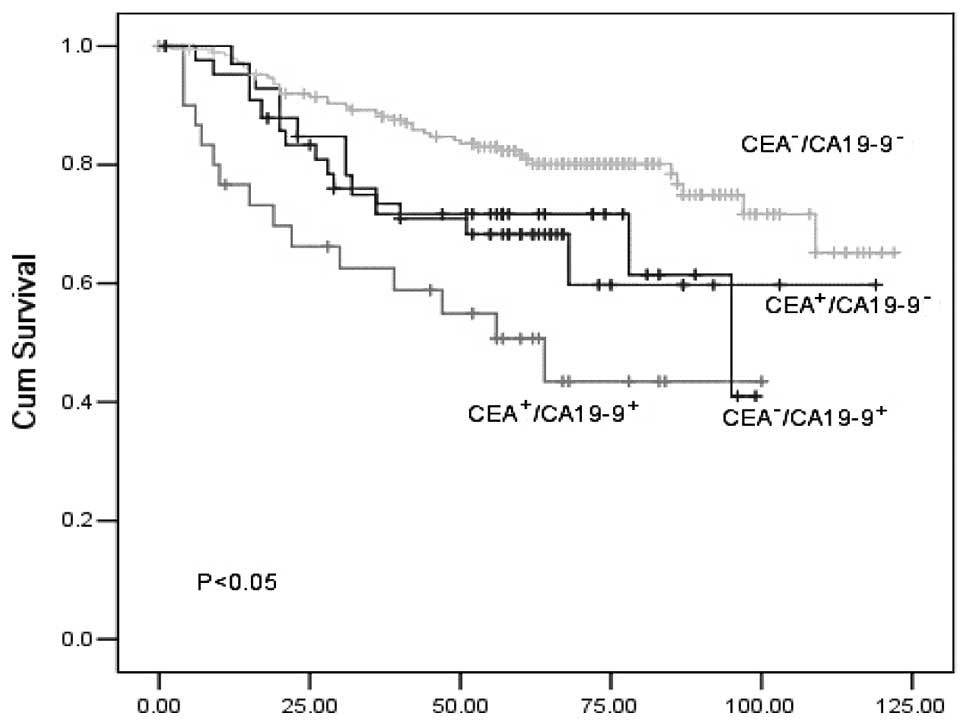
Comparison of survival time in different
antigen patient groups
A comparison of the survival curves of the four
groups (CEA+/CA19-9−,
CEA+/CA19-9+,
CEA−/CA19-9− and
CEA−/CA19-9+) is presented in Fig. 2. The mean survival time in the four
groups was 84.8, 58.2, 100.6 and 74.7 months, respectively. The
1-/3-year survival rates in each group were 76.0/59.8, 66.2/43.5,
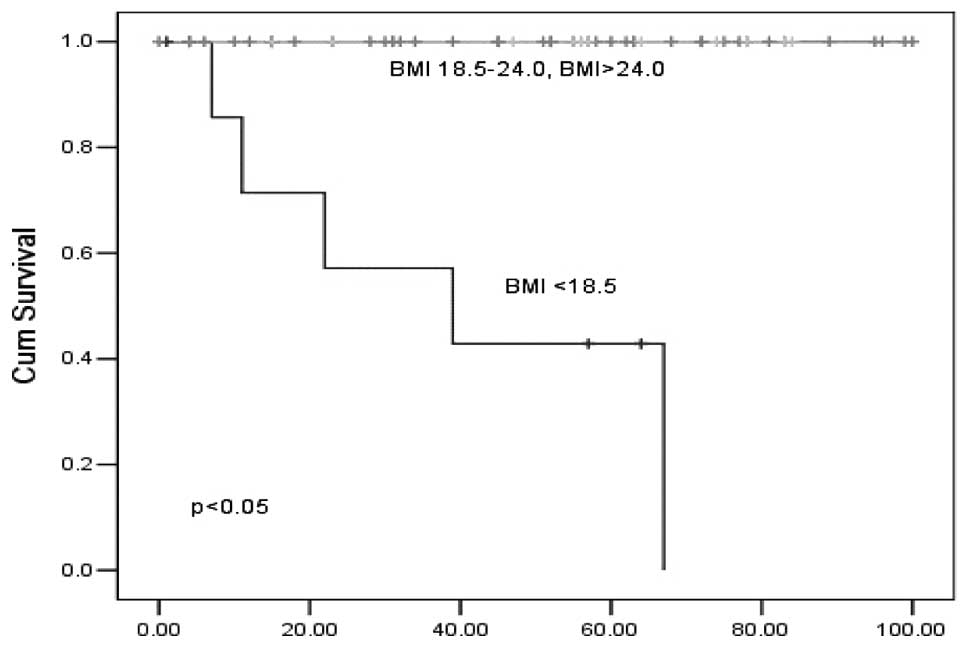
96.3/87.6 and 71.7/41.0, respectively (Fig. 2). The survival of patients with
BMI>18.5 who had high CA19-9 levels was significantly higher
compared with that observed in patients with BMI<18.5 (Fig. 3). There was no statistical
difference in the analysis of CEA and CA19-9 <37 ng/ml according
to the classification of BMI (data not shown). In addition, a
statistically significant difference was found in the analysis of
CA19-9 ≥37 ng/ml.
Discussion
The total amount of CEA and CA19-9 protein within
the circulation was defined as CEA and CA19-9 mass. It was
previously demonstrated that obese patients had higher plasma
volumes, but not CEA or CA19-9 mass. This phenomenon is consistent
with obesity-related hemodilution, stating that hemodilution may be
affected by higher BMIs, which may decrease the serum
concentrations of soluble tumor markers (16). Accordingly, our study demonstrated
that the serum concentration of tumor markers in obese individuals
was lower compared with normal-weight individuals. In our study,
patients in the obese group (BMI>24.0 kg/m2)
exhibited 20% lower serum CEA concentrations compared with
normal-weight patients (18.5–24.0 kg/m2), which was
consistent with the 5% decrease in the serum CEA concentration
(14). Compared with our study,
the previous investigation was not community-based and data were
collected from patients undergoing routine heath screening, in
which CEA values >5.0 ng/ml were excluded from the analysis.
The cut-off point is of great significance to the
results and the cut-off value varies among different institutions.
A lower optimum value was reported by a previous study that used 5
ng/ml as the cut-off point. In addition, a cut-off of 4.0 ng/ml may
provide an appropriate balance of specificity and sensitivity
according to the receiver operating characteristic curve analysis
(17). In view of previous
studies, it may be helpful to use multiple cut-off values to assess
the effect of BMI on the interpretation of CEA and CA19-9
measurements. Our study suggests that the sensitivity of the CEA
measurement was associated with BMI to a certain extent when the
cut-off point was changed.
The analyses presented in this study demonstrate
that patients with higher BMIs exhibited significantly lower
screening CEA and CA19-9 levels. Moreover, it has been hypothesized
that the levels of CEA and CA19-9 appear lower due to the dilution
effect of the increased plasma volume associated with the increased
BMI. Since the association between BMI and plasma volume was
non-linear, we developed a model of obesity-related CEA and CA19-9
dilution, which accurately predicted the CEA and CA19-9 levels
observed in our population, even after adjustment of the observed
values for degree of differentiation and TNM stage. This model was
used to estimate CEA values in overweight and obese patients. Our
model revealed, through the comparison of the concentration of
crude CA19-9 with that following adjustment, that the strength of
the association between CA19-9 concentration and BMI was increased
following adjustment. In addition, another finding was the lack of
a significant association between obesity and CEA concentration in
overweight and obese patients.
High preoperative serum CEA levels were associated
with tumor recurrence. For patients with preoperative serum CEA
levels >7.0 ng/ml and CA19-9 levels >37 ng/ml in the normal
BMI group, the sensitivity, specificity, PPV and NPV for tumor
recurrence were lower compared with those reported in a previous
study (18). In addition, compared
with the obese group, the sensitivity, specificity and PPV of
preoperative CEA and CA19-9 levels at each cut-off point was
reduced. The observed absolute differences were not modest and may
be attributed to the number of patients enrolled in our study. The
preoperative serum level of CA19-9 was a better predictor for
recurrence compared to CEA according to our study, which was
similar to previously reported findings (19). The serum levels of CEA and CA19-9
were associated with low survival rates. Our study demonstrated
that there was a significant difference in the 10-year patient
survival curves between serum CEA and CA19-9 levels. Furthermore,
significant differences were observed in serum
CEA+/CA19-9+ and
CEA−/CA19-9− patients, which was consistent
with previous findings (20).
A high BMI is a well-established prognostic factor
of poor survival. However, the results obtained from our study
demonstrated that the prognosis of patients with BMI<18.5 was
worse compared with the other groups. This discrepancy may be
explained as follows: i) increased mortality due to low BMI was
associated with the consequences of poor underlying nutritional
status; ii) the number of patients in need of blood transfusions in
the low BMI group was higher than that of the other groups. In
addition, blood transfusion has been described as exerting a
negative effect after hepatectomy for colorectal cancer (21).
The findings of our study suggest that colorectal
cancer may be less likely to be detected in obese individuals,
partly due to the effect of BMI on the hemodilution of CEA and
CA19-9. Therefore, the weight of the patients should be considered
when interpreting CEA and CA19-9 screening results. To minimize
this detection bias, it may be prudent to lower cut-offs for
overweight or obese patients. There were also certain limitations
to our study. First, weight and height were used to calculate
plasma volume, which may be replaced by more accurate methods, such
as algorithms using lean body mass and hematocrit used for
plasmapheresis (22). The
hemodilution due to the increased plasma volume may be associated
with the decreased serum CEA and CA19-9 concentration observed in
patients of higher BMIs. Second, our patient sample was somewhat
limited. Third, the association between BMI and sensitivity of CEA
and CA19-9 were not analyzed following surgery, since data on
individual weight alterations were not included.
Further studies are required to determine whether
these screening cut-off points exhibit similar sensitivity and
specificity for predicting cancer in patients of varying body size.
Since early detection of colorectal cancer is the goal of CEA and
CA19-9 measurement, sensitivity and specificity testing are
required prior to adopting new screening cut-off points.
In conclusion, this study indicates that the obesity
epidemic may have negatively affected the efficacy of colorectal
cancer screening methods and provides a theoretical framework for
elucidating the effect of BMI variations.
Acknowledgements
This study was supported by the Chinese National
Science Fund for Distinguished Young Scholars (No. 70825006) and
the National Science Fund for Young Scholars (No. 71201052).
References
|
1
|
Duffy MJ: Carcinoembryonic antigen as a
marker for colorectal cancer: is it clinically useful? Clin Chem.
47:624–630. 2001.PubMed/NCBI
|
|
2
|
Lee SH, Ahn BK, Baek SU and Chang HK: BRAF
mutation in multiple primary cancer with colorectal cancer and
stomach cancer. Gastroenterol Rep. 1:70–74. 2013. View Article : Google Scholar : PubMed/NCBI
|
|
3
|
Chen CC, Yang SH, Lin JK, et al: Is it
reasonable to add preoperative serum level of CEA and CA19-9 to
staging for colorectal cancer? J Surg Res. 124:169–174. 2005.
View Article : Google Scholar : PubMed/NCBI
|
|
4
|
Marrelli D, Caruso S, Pedrazzani C, et al:
CA19-9 serum levels in obstructive jaundice: clinical value in
benign and malignant conditions. Am J Surg. 198:333–339. 2009.
View Article : Google Scholar : PubMed/NCBI
|
|
5
|
Wanebo HJ, Rao B, Pinsky CM, et al:
Preoperative carcinoembryonic antigen level as a prognostic
indicator in colorectal cancer. N Engl J Med. 299:448–451. 1978.
View Article : Google Scholar : PubMed/NCBI
|
|
6
|
Staab HJ, Anderer FA, Stumpf E, et al:
Eighty-four potential second-look operations based on sequential
carcinoembryonic antigen determinations and clinical investigations
in patients with recurrent gastrointestinal cancer. Am J Surg.
149:198–204. 1985. View Article : Google Scholar
|
|
7
|
Ballesta AM, Molina R, Filella X, et al:
Carcinoembryonic antigen in staging and follow-up of patients with
solid tumors. Tumor Biol. 16:32–41. 1995. View Article : Google Scholar : PubMed/NCBI
|
|
8
|
Fukuda I, Yamakado M and Kiyose H:
Influence of smoking on serum carcinoembryonic antigen levels in
subjects who underwent multiphasic health testing and services. J
Med Syst. 22:89–93. 1998. View Article : Google Scholar
|
|
9
|
Amino N, Kuro R, Yabu Y, et al: Elevated
levels of circulating carcinoembryonic antigen in hypothyroidism. J
Clin Endocrinol Metab. 52:457–462. 1981. View Article : Google Scholar : PubMed/NCBI
|
|
10
|
Bulut I, Arbak P, Coskun A, et al:
Comparison of serum CA 19.9, CA 125 and CEA levels with severity of
chronic obstructive pulmonary disease. Med Princ Pract. 18:289–293.
2009. View Article : Google Scholar : PubMed/NCBI
|
|
11
|
Witherspoon LR, Shuler SE, Alyea K and
Husserl FE: Carcinoembryonic antigen: assay following heat compared
with perchloric acid extraction in patients with colon cancer,
non-neoplastic gastrointestinal diseases, or chronic renal failure.
J Nucl Med. 24:916–921. 1983.
|
|
12
|
Herbeth B and Bagrel A: A study of factors
influencing plasma CEA levels in an unselected population. Oncodev
Biol Med. 1:191–198. 1980.PubMed/NCBI
|
|
13
|
McLaughlin R, O’Hanlon D, Kerin M, et al:
Are elevated levels of the tumour marker CA19-9 of any clinical
significance? - an evaluation. Ir J Med Sci. 168:124–126. 1999.
View Article : Google Scholar : PubMed/NCBI
|
|
14
|
Chang IH, Ahn SH, Han JH, et al: The
clinical significance in healthy men of the association between
obesity related plasma hemodilution and tumor marker concentration.
J Urol. 181:567–573. 2009. View Article : Google Scholar : PubMed/NCBI
|
|
15
|
Banez LL, Hamilton RJ, Partin AW, et al:
Obesity-related plasma hemodilution and PSA concentration among men
with prostate cancer. JAMA. 298:2275–2280. 2007. View Article : Google Scholar : PubMed/NCBI
|
|
16
|
Vollmer RT and Humphrey PA: Tumor volume
in prostate cancer and serum prostate-specific antigen. Analysis
from a kinetic viewpoint. Am J Clin Pathol. 119:80–89.
2003.PubMed/NCBI
|
|
17
|
Korner H, Soreide K, Stokkeland PJ, et al:
Diagnostic accuracy of serum-carcinoembryonic antigen in recurrent
colorectal cancer: a receiver operating characteristic curve
analysis. Ann Surg Oncol. 14:417–423. 2007. View Article : Google Scholar
|
|
18
|
Park JS, Choi GS, Jang YS, et al:
Influence of obesity on the serum carcinoembryonic antigen value in
patients with colorectal cancer. Cancer Epidemiol Biomarkers Prev.
19:2461–2468. 2010. View Article : Google Scholar : PubMed/NCBI
|
|
19
|
Forones NM and Tanaka M: CEA and CA19-9 as
prognostic indexes in colorectal cancer. Hepatogastroenterology.
46:905–908. 1999.PubMed/NCBI
|
|
20
|
Sato T, Nishimura G, Nonomura A, et al:
Serological studies on CEA, CA 19-9, STn and SLX in colorectal
cancer. Hepatogastroenterology. 46:914–919. 1999.PubMed/NCBI
|
|
21
|
Gayowski TJ, Iwatsuki S, Madariaga JR, et
al: Experience in hepatic resection for metastatic colorectal
cancer: analysis of clinical and pathologic risk factors. Surgery.
116:703–711. 1994.PubMed/NCBI
|
|
22
|
Ohwaki K, Endo F, Muraishi O, et al:
Relationship between prostate-specific antigen and hematocrit: does
hemodilution lead to lower PSA concentrations in men with a higher
body mass index? Urology. 75:648–652. 2010. View Article : Google Scholar : PubMed/NCBI
|