Introduction
Serum iron levels have been reported to increase
following administration of various anticancer drugs, including
5-fluorouracil, actinomycin D, adriamycin and cyclophosphamide. We
previously demonstrated that a transient significant increase of
serum iron was a recurrent event during treatment with leucovorin
and fluorouracil plus oxaliplatin (FOLFOX) or leucovorin and
fluorouracil plus irinotecan (FOLFIRI) in patients with advanced
colorectal cancer (CRC), while there was no such effect of
molecular-targeted drugs on serum iron levels (1). We also observed that the median
survival time (MST) of patients with a greater increase of serum
iron was significantly superior to that of other patients, while
the multivariate analysis identified a small increase of serum iron
as an independent risk factor for overall survival (OS). Thus,
serum iron levels may represent a useful and convenient predictor
of the response to chemotherapy (2,3).
However, the mechanism underlying the increase of
serum iron during chemotherapy remains to be elucidated.
Accordingly, this study was performed to investigate the mechanism
underlying the increase of serum iron during chemotherapy through
measurement of hepcidin-25 as a key regulator of iron metabolism,
interleukin (IL)-6 as a stimulator of hepcidin-25 and soluble
transferrin receptor (sTfR) as a marker of erythroblasts.
Materials and methods
Patients
A total of 20 patients with unresectable advanced or
metastatic CRC were enrolled in this study between September, 2012
and July, 2013. Treatment was based on the Japanese Society for
Cancer of the Colon and Rectum guidelines (4) and all the patients received
chemotherapy with FOLFOX or FOLFIRI, with or without
molecular-targeted drugs (bevacizumab, cetuximab or panitumumab).
No patient received radiotherapy. Informed consent for measurement
of the serum iron levels was obtained from the patients and this
study was approved by the Tobu Chiiki Hospital Institutional Review
Board (12.09.10. no. 2).
Methods
The serum levels of iron, ferritin, hemoglobin (Hb),
aspartate aminotransferase (AST), alanine aminotransferase (ALT),
hepcidin-25, sTfR and several cytokines were measured prior to and
48 h after chemotherapy.
Measurement of hepcidin-25
The serum concentrations of hepcidin-25 were
determined by liquid chromatography tandem mass spectrometry
(5–7).
For calibration, synthetic hepcidin isoforms were
spiked in fetal bovine serum at final concentrations of 1, 2, 5,
10, 20, 50, 100, 200, 500 and 1000 ng/ml. A 50-μl aliquot of 4%
trichloroacetic acid solution containing 200 ng/ml
[13C18,15N3]-hepcidin-25
as the internal standard was added to an equal volume of serum or
calibration standard, mixed vigorously and centrifuged. A 20-μl
aliquot of the resulting supernatant was analyzed quantitatively by
liquid chromatography tandem mass spectrometry using the API-5500
QTRAP system (Applied Biosystems, Foster City, CA, USA) equipped
with Prominence chromatographic system (Shimadzu Corp., Kyoto,
Japan). Analytical chromatography of human hepcidin-20, -22 and -25
was performed on a PLRP-S column (5 μm, 300 Ǻ, 150 mm × 2.0 mm
i.d.; Polymer Laboratories, Ltd., Shropshire, UK). Mobile phase A
was 0.1% aqueous formic acid and mobile phase B was 0.1% formic
acid in acetonitrile. At a flow rate of 0.5 ml/min, mobile phase B
was commenced at 20% from 0–2 min, increased to 25% until 8 min,
increased to 90% until 10 min and returned to 20% until 12 min.
Instrument control and data processing were performed with Analyst™
software, version 1.5 (Applied Biosystems).
Measurement of sTfR
sTfR was determined by Quantikine IVD ELISA (R&D
Systems, Inc., Minneapolis, MN, USA).
Measurement of cytokines
The serum concentrations of IL-1, IL-2, IL-4, IL-5,
IL-6, IL-7, IL-8, IL-10, IL-12(p70), IL-13, IL-17, granulocyte
colony-stimulating factor (G-CSF), granulocyte/macrophage
colony-stimulating factor (GM-CSF), interferon (INF) γ, monocyte
chemotactic protein-1 (MCP-1), macrophage inflammatory protein-1β
(MIP-1β) and tumor necrosis factor α (TNFα) were measured by the
multiplex method with a human 17-plex panel (Bio-Rad, Hercules, CA,
USA), according to the manufacturer’s instructions. The detection
limit for each cytokine was 4 pg/ml.
Statistical analysis
The t-test was used for comparisons between two
groups and P<0.05 was considered to indicate a statistically
significant difference. Data are expressed as means ± standard
deviation.
Results
Patient characteristics
The characteristics of the patients are summarized
in Table I. The 20 patients had a
mean age of 70.8 years (range, 51–82 years) and included 14 men and
6 women. A total of 18 patients had colon cancer and 2 patients had
rectal cancer.
 | Table IPatient characteristics. |
Table I
Patient characteristics.
| Variables | Values |
|---|
| No. of patients | 20 |
| Age, years [mean,
(range)] | 70.8 (51–82) |
| Gender
(male/female) | 14/6 |
| Primary tumor site
(colon/rectum) | 18/2 |
| Histological type,
adenocarcinoma |
|
Well-differentiated | 2 |
| Moderately
differentiated | 14 |
| Poorly
differentiated | 3 |
| Signet ring cell
carcinoma | 1 |
Laboratory parameters before and after
chemotherapy
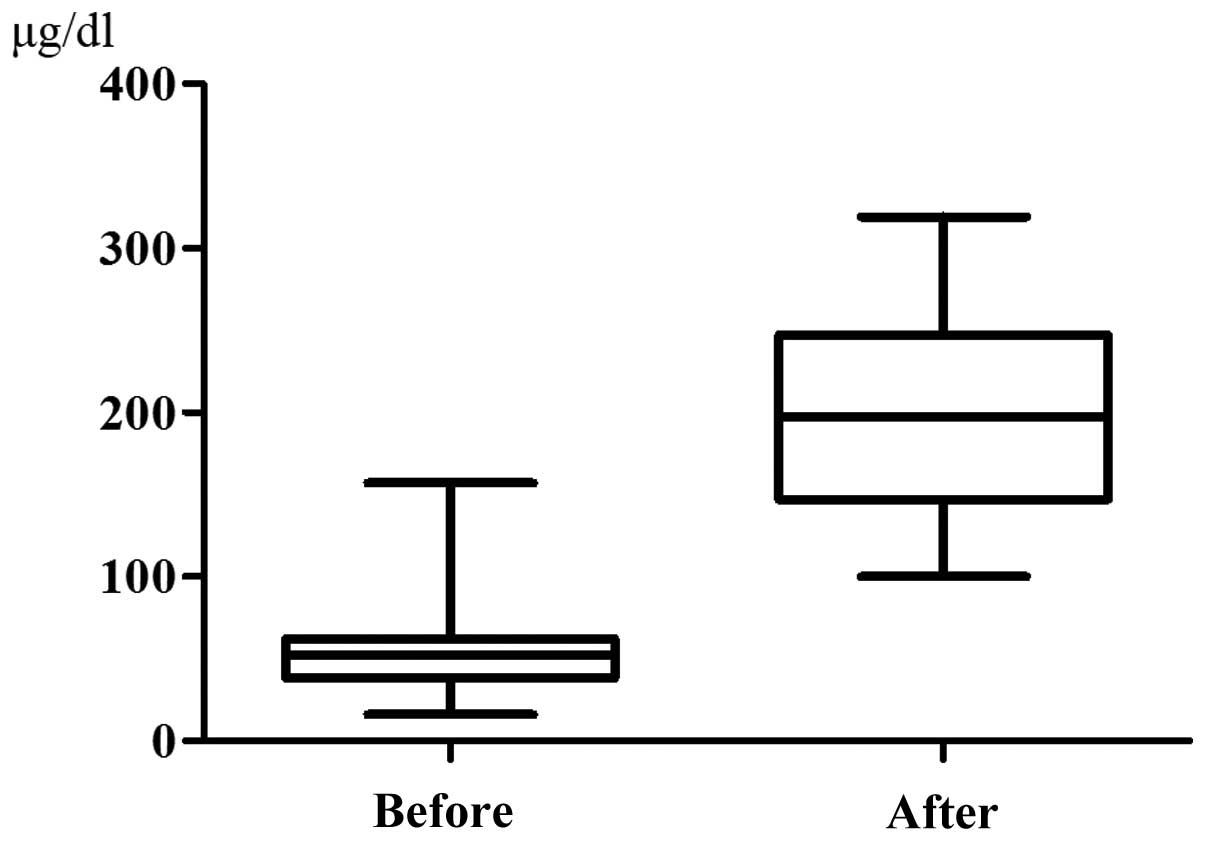
The serum iron level was 56.95±32.70 μg/dl prior to
chemotherapy and it increased significantly to 201.9±67.71 μg/dl at
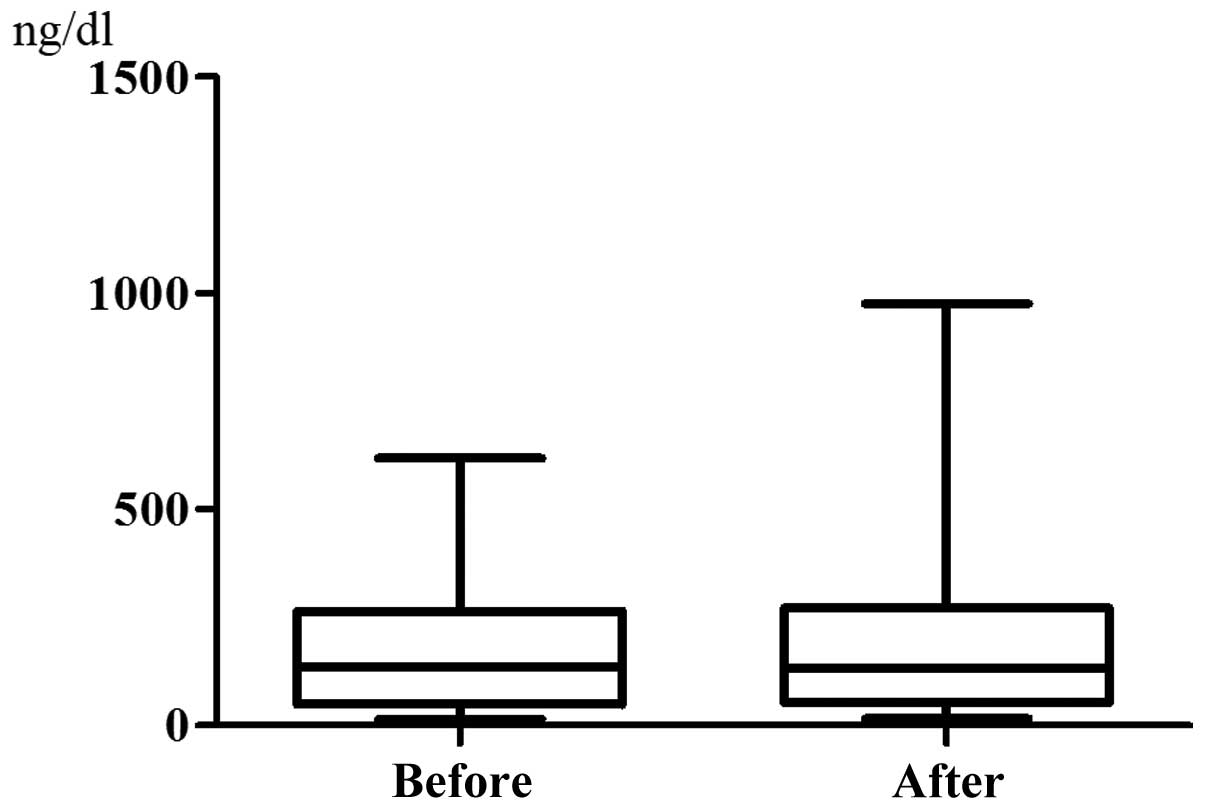
48 h after chemotherapy (P<0.0001, Fig. 1). By contrast, the serum ferritin
level did not change significantly, being 167.6±155.6 ng/dl before
chemotherapy and increasing to 202.6±229.0 ng/dl after chemotherapy
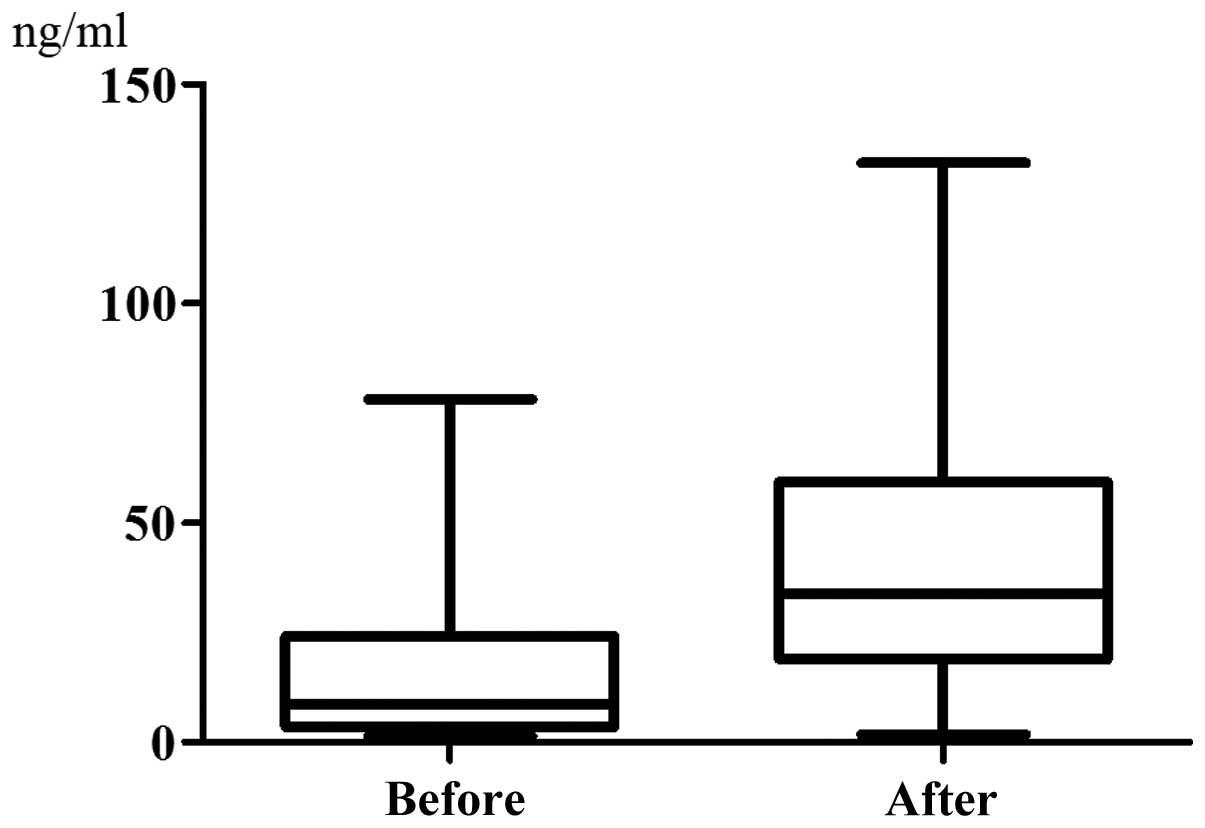
(P=0.0974, Fig. 2). The serum
hepcidin-25 level was 15.29±18.17 ng/ml prior to chemotherapy and
it increased significantly to 42.29±34.73 ng/ml at 48 h after
chemotherapy (P<0.0001, Fig.
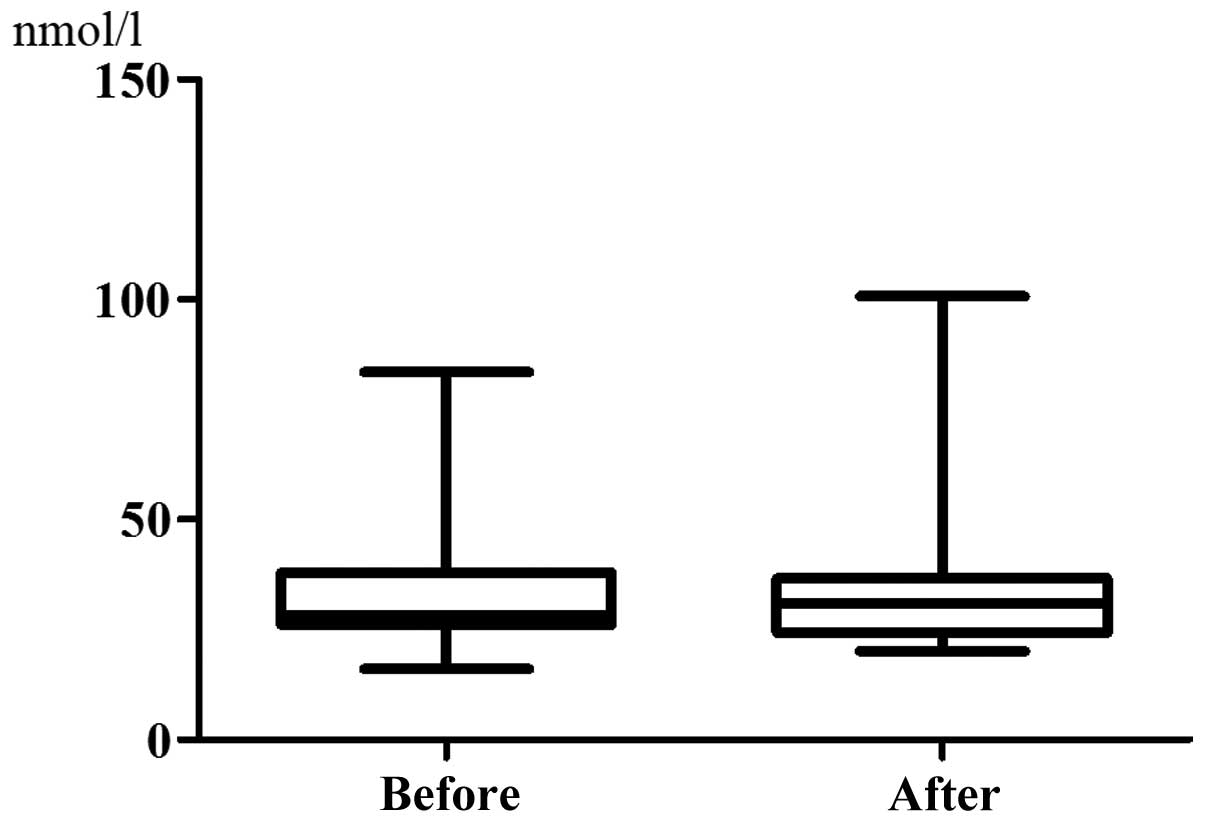
3). However, there was almost no difference between the sTfR
levels before chemotherapy (35.63±18.05 nmol/l) and those after
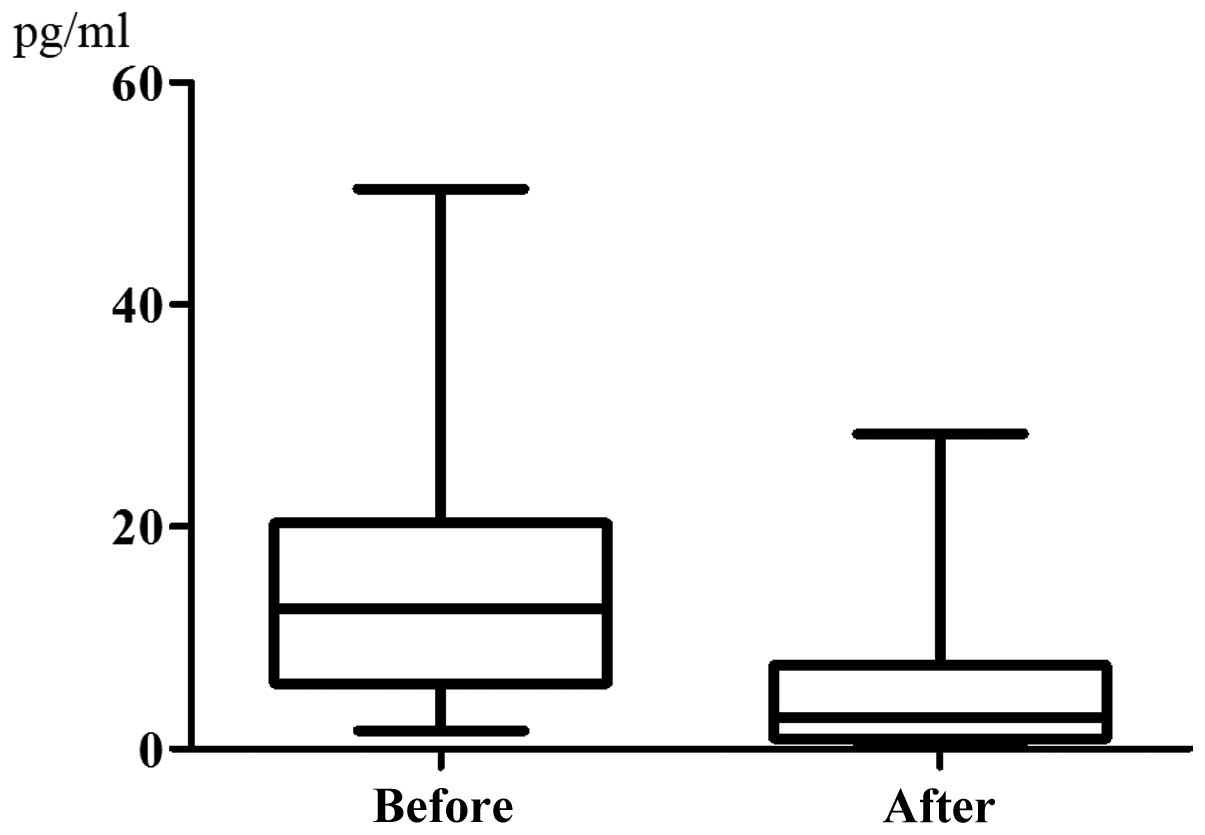
chemotherapy (35.40±18.39 nmol/l) (P=0.9133, Fig. 4). The serum IL-6 level was
14.51±11.39 pg/ml prior to chemotherapy and it exhibited a
significant decrease to 5.420±7.216 pg/ml following chemotherapy
(P=0.0057, Fig. 5). The data on
the other laboratory parameters [Hb, AST, ALT, IL-1, IL-2, IL-4,
IL-5, IL-7, IL-8, IL-10, IL-12(p70), IL-13, IL-17, G-CSF, GM-CSF,
INFγ, MCP-1, MIP-1β and TNFα] are summarized in Table II. The comparison between the
serum concentrations before and after chemotherapy revealed no
significant changes in any of these parameters up to 48 h after
chemotherapy.
| Table IILaboratory parameters before and 48 h
after chemotherapy. |
Table II
Laboratory parameters before and 48 h
after chemotherapy.
| Variables | Before | After | P-value |
|---|
| Hb (g/dl) | 11.85±1.438 | 11.4±14.97 | NS |
| AST (IU/l) | 28.15±15.49 | 30.65±14.56 | NS |
| ALT (IU/l) | 22.20±8.727 | 24.45±9.833 | NS |
| IL-1a | 1.832±1.140 | 1.765±1.107 | NS |
| IL-2a | 0.3670±0.9257 | 1.428±5.671 | NS |
| IL-4a | 3.452±1.419 | 3.447±1.310 | NS |
| IL-5a | 6.633±3.417 | 5.615±2.476 | NS |
| IL-7a | 17.08±7.171 | 16.01±8.012 | NS |
| IL-8a | 54.89±25.17 | 52.65±22.66 | NS |
| IL-10a | 6.201±6.335 | 5.396±5.081 | NS |
| IL-12a | 18.83±20.93 | 15.44±18.58 | NS |
| IL-13a | 7.911±3.344 | 6.536±2.899 | NS |
| IL-17a | 19.53±12.86 | 15.41±12.90 | NS |
| G-CSFa | 63.01±39.07 | 61.53±28.57 | NS |
| GM-CSFa | 9.619±20.84 | 5.303±1.363 | NS |
| INFγa | 220.3±99.13 | 215.4±78.49 | NS |
| MCP-1a | 48.77±41.34 | 34.05±34.64 | NS |
| MIP-1βa | 131.3±49.94 | 135.1±45.96 | NS |
| TNFαa | 35.68±24.49 | 37.27±26.91 | NS |
Discussion
Iron is essential for all human cells and it plays
an important role in numerous biological processes, including
electron and oxygen transport and DNA synthesis (8,9).
However, excess iron poses a threat to cells and tissues due to its
ability to catalyze the generation of various radicals (10). Therefore, serum iron levels are
strictly regulated in humans (11). In general, the daily loss of iron
through desquamation of epithelial cells from the intestine and the
skin (1–2 mg) represents <0.1% of the total iron stores (3–4 g)
in adults. The iron that is lost must be replaced from dietary
sources by absorption in the duodenum to maintain the iron balance.
If iron intake is excessive and overload occurs, the daily loss of
iron cannot increase substantially through physiological
mechanisms.
Most of the iron in the body is found in hemoglobin
within erythrocytes, accounting for ~2 g in total, while serum only
contains 3–4 mg of iron bound to transferrin, an iron carrier that
is the exclusive source of iron for erythropoiesis. The lifespan of
human erythrocytes is ~120 days, hence the oldest fraction of
erythrocytes is degraded by macrophages and their iron is returned
to transferrin on a daily basis. This recycling process generates a
daily load of 20–25 mg of iron, most of which is destined for
erythrocyte production in the bone marrow, where ~1 mg of iron/h is
consumed for erythropoiesis. Therefore, if the supply of iron from
macrophages is stopped, the iron in the serum will be consumed
after only 3–4 h. By contrast, if erythropoiesis is suppressed, the
serum iron levels will increase. The turnover of serum iron is
rapid. Approximately 1 g of iron is stored by hepatocytes and
macrophages in the liver and red pulp macrophages in the spleen.
Hepatocytes and macrophages store iron in the cytoplasm bound to
ferritin, so that it may be readily mobilized under conditions of
high iron demand.
Hepcidin is synthesized in the liver and is a key
peptide hormone that regulates iron homeostasis in humans (12–14).
There are three forms of hepcidin, hepcidin-20, -22 and -25.
Hepcidin-25 is the mature bioactive form; it is a 25-amino acid
peptide hormone that inhibits iron entry into the serum compartment
from the three main sources (dietary absorption from the duodenum,
release of recycled iron from macrophages and release of stored
iron from hepatocytes) by binding to ferroportin, a cellular iron
exporter and inducing its internalization (15). Therefore, a high circulating level
of hepcidin-25 decreases serum iron levels.
The synthesis of hepcidin-25 is activated by an iron
load, whereas it is suppressed by anemia, hypoxia and
erythropoiesis (16,17). Hepcidin-25 synthesis is also
induced by inflammatory cytokines, such as IL-6, in response to
infection and inflammation, thus suppressing iron utilization and
absorption and resulting in the anemia associated with inflammation
or chronic disease (18). Under
normal conditions, however, an increase of the serum iron level
upregulates hepcidin-25 expression, which is under feedback
regulation by serum iron concentrations and by the erythropoietic
requirement for iron.
In this study, the serum iron and hepcidin-25 levels
were significantly increased after chemotherapy, whereas those of
IL-6 were significantly decreased and there were no significant
changes in AST, ALT, Hb and sTfR levels. The lack of significant
changes in AST, ALT and Hb levels suggests that the increase of
serum iron was not due to the destruction of hepatocytes or
erythrocytes by chemotherapy. In addition, the sTfR level reflects
the number of erythroblasts; hence, the lack of a significant
change in sTfR suggests that erythroblasts were not affected by
chemotherapy. Vokurka et al (19) observed that an increase in hepcidin
was associated with irradiation-induced suppression of
erythropoiesis in mice. Continuing absorption of iron from the gut
and its release from macrophages are highly undesirable when
erythropoiesis is suppressed. In fact, an increase of hepcidin has
been observed in patients with severe anemia due to suppression of
hematopoiesis by irradiation; it appears that hemolysis and anemia
only decrease hepcidin levels when erythropoiesis is functional. If
erythropoiesis is arrested, even severe anemia does not lead to a
decrease in hepcidin, which, on the contrary, is significantly
increased. Suppression of erythropoiesis is observed in acute
leukemia, erythropoietin-deficiency anemia, aplastic anemia, pure
red cell aplasia and myelodysplastic syndrome. In these diseases,
the serum iron levels are high, despite the presence of anemia.
While attacking cancer cells, chemotherapy also suppresses bone
marrow function. Thus, the increase in hepcidin associated with
chemotherapy in this study may be similar to the increase of
hepcidin that occurs in patients with irradiation-induced
suppression of erythropoiesis.
We previously demonstrated that the MST of patients
with a marked increase of the serum iron levels was significantly
superior to that of patients with a small increase, whereas the
multivariate analysis identified a small increase of serum iron as
an independent risk factor for OS (2,3). The
present study suggested that an increase of serum iron results from
the suppression of erythropoiesis by chemotherapy, which may also
indicate suppression of tumor cell proliferation. Therefore, serum
iron levels may be a useful and convenient predictor of the
response to chemotherapy.
There were several limitations to this study. The
mechanism by which chemotherapy suppresses erythropoietic
consumption of iron within a very short time remains to be
elucidated. Fluorouracil, oxaliplatin and irinotecan are cytotoxic
chemotherapeutic agents. In a preliminary study conducted at our
hospital, the serum iron levels were found to increase during
chemotherapy with docetaxel for gastric cancer. In general,
cytotoxic agents disturb cell division and it requires some time
for antitumor activity to appear. However, the suppression of
erythropoiesis appeared to be very rapid in this study.
Accordingly, cytotoxic agents may directly suppress heme protein
synthesis in erythroblasts, or there may be other mechanisms
involved.
In conclusion, the increase of serum iron levels
during FOLFOX/FOLFIRI therapy may be attributed to the suppression
of erythropoiesis and, thus, the decrease in the consumption of
iron. Therefore, serum iron levels increase rapidly, leading to an
increase of hepcidin-25 which, in turn, leads to a decrease in IL-6
levels via negative feedback. Thus, the elevation of serum iron
levels during chemotherapy may be attributed to reduced iron
consumption due to the suppression of erythropoiesis.
Acknowledgements
The authors would like to thank Yasushi Shimonaka,
Product Research Department, Chugai Pharmaceutical Co., Ltd.,
Kamakura, Japan, for his cooperation with the measurement of
hepcidin.
References
|
1
|
Mashiko S, Nagaoka I, Kitajima M, et al:
Evaluation of serum iron levels during FOLFOX4 and FOLFIRI
therapies. Exp Ther Med. 1:507–511. 2010.PubMed/NCBI
|
|
2
|
Ochiai T, Nishimura K, Watanabe T, et al:
Serum iron levels as a new biomarker in chemotherapy with
leucovorin and fluorouracil plus oxaliplatin or leucovorin and
fluorouracil plus irinotecan, with or without molecularly-targeted
drugs. Mol Clin Oncol. 1:805–810. 2013.PubMed/NCBI
|
|
3
|
Ochiai T, Nishimura K, Watanabe T, et al:
Serum iron levels potential biomarker in FOLFOX/FOLFIRI with or
without molecularly targeted drug therapy. J Clin Oncol. 31(Suppl):
abs. e14651. 2013.
|
|
4
|
Watanabe T, Itabashi M, Shimada Y, et al:
Cancer of the colon and rectum (JSCCR) guidelines 2010 for the
treatment of colorectal cancer. Int J Clin Oncol. 17:1–29. 2012.
View Article : Google Scholar : PubMed/NCBI
|
|
5
|
Murphy AT, Witcher DR, Luan P and
Wroblewski VJ: Quantitation of hepcidin from human and mouse serum
using liquid chromatography tandem mass spectrometry. Blood.
110:1048–1054. 2007. View Article : Google Scholar : PubMed/NCBI
|
|
6
|
Murao N, Ishigai M, Yasuno H, Shimonaka Y
and Aso Y: Simple and sensitive quantification of bioactive
peptides in biological matrices using liquid
chromatography/selected reaction monitoring mass spectrometry
coupled with trichloroacetic acid clean-up. Rapid Commun Mass
Spectrom. 21:4033–4038. 2007. View
Article : Google Scholar
|
|
7
|
Kanda J, Mizumoto C, Kawabata H, et al:
Serum hepcidin level and erythropoietic activity after
hematopoietic stem cell transplantation. Haematologica.
93:1550–1554. 2008. View Article : Google Scholar : PubMed/NCBI
|
|
8
|
Ponka P: Cellular iron metabolism. Kidney
Int Suppl. 69:S2–S11. 1999. View Article : Google Scholar
|
|
9
|
Aisen P, Enns C and Wessling-Resnick M:
Chemistry and biology of eukaryotic iron metabolism. Int J Biochem
Cell Biol. 33:940–959. 2001. View Article : Google Scholar : PubMed/NCBI
|
|
10
|
Papanikolaou G and Pantopoulos K: Iron
metabolism and toxicity. Toxicol Appl Pharmacol. 202:199–211. 2005.
View Article : Google Scholar : PubMed/NCBI
|
|
11
|
Knutson M and Wessling-Resnick M: Iron
metabolism in the reticuloendothelial system. Crit Rev Biochem Mol
Biol. 38:61–88. 2003. View Article : Google Scholar
|
|
12
|
Krause A, Neitz S, Magert HJ, et al:
LEAP-1, a novel highly disulfide-bonded human peptide, exhibits
antimicrobial activity. FEBS Lett. 480:147–150. 2000. View Article : Google Scholar : PubMed/NCBI
|
|
13
|
Park CH, Valore EV, Waring AJ, et al:
Hepcidin, a urinary antimicrobial peptide synthesized in the liver.
J Biol Chem. 276:7806–7810. 2001. View Article : Google Scholar : PubMed/NCBI
|
|
14
|
Kemna EH, Tjalsma H, Willems HL and
Swinkels DW: Hepcidin: from discovery to differential diagnosis.
Haematologica. 93:90–97. 2008. View Article : Google Scholar : PubMed/NCBI
|
|
15
|
Jordan JB, Poppe L, Haniu M, et al:
Hepcidin revisited, disulfide connectivity, dynamics, and
structure. J Biol Chem. 284:24155–24167. 2009. View Article : Google Scholar : PubMed/NCBI
|
|
16
|
Pigeon C, Ilyin G, Courselaud B, et al: A
new mouse liver-specific gene, encoding a protein homologous to
human antimicrobial peptide hepcidin, is overexpressed during iron
overload. J Biol Chem. 276:7811–7819. 2001. View Article : Google Scholar
|
|
17
|
Nicolas G, Chauvet C, Viatte L, et al: The
gene encoding the iron regulatory peptide hepcidin is regulated by
anemia, hypoxia, and inflammation. J Clin Invest. 110:1037–1044.
2002. View Article : Google Scholar : PubMed/NCBI
|
|
18
|
Nemeth E, Valore EV, Territo M, Schiller
G, Lichtenstein A and Ganz T: Hepcidin, a putative mediator of
anemia of inflammation, is a type II acute-phase protein. Blood.
101:2461–2463. 2003. View Article : Google Scholar : PubMed/NCBI
|
|
19
|
Vokurka M, Krijt J, Sulc K and Necas E:
Hepcidin mRNA levels in mouse liver respond to inhibition of
erythropoiesis. Physiol Res. 55:667–674. 2006.PubMed/NCBI
|